1-1 Final December 2008 1.0 Overview of Purpose and Need 1.1 Introduction This report describes the purpose and need for transportation investments in the Regional Connector Project Study Area (PSA). The Regional Connector will provide opportunities for seamless, potentially transfer-free transit service for the Los Angeles County Metropolitan Transportation Authority (Metro) Blue Line, Metro Gold Line, and Metro Expo Line passengers traveling through downtown Los Angeles. The Regional Connector will extend from the Metro Blue Line at its present terminus at 7 th St./Metro Center to Union Station, possibly via the Little Tokyo/Arts District Station on the Metro Gold Line Eastside Extension, currently under construction. Once the connection between 7 th St./Metro Center and Union Station is improved, Metro Blue Line light rail passengers from Long Beach will be able to more easily continue to Pasadena. The new connection will also provide more convenient transfers between three Metro LRT lines, dozens of bus lines, and regional commuter rail service together at Union Station. When the Metro Expo Line to Culver City opens in 2010, its riders will also be able to use the Regional Connector and Gold Line Extension to reach East Los Angeles. In addition to providing more seamless service from Pasadena to Long Beach and from Culver City to the Eastside, the Regional Connector will provide increased transit coverage of the eight downtown districts: Civic Center, Bunker Hill, Historic Core, Little Tokyo, Toy District, Jewelry District, Financial Core, Fashion District, and Central City East (Figure 1-1). This Alternatives Analysis (AA) study identifies and evaluates the potential alignments, modes, configurations, and station locations under consideration for the Regional Connector Transit Corridor. The alternatives developed as part of the AA process will be further screened in order to narrow down the preferred alternatives. A final AA Study will provide decision makers the information needed to approve further study as part of a Draft Environmental Impact Statement/Draft Environmental Impact Report (DEIS/DEIR). As a part of the AA study, the Corridor Definition and the Purpose and Need Statement establish the rationale for transportation investments in the Regional Connector PSA. This study builds on past studies as described in Section 1.3 below.
Transcript
1-1 Final December 2008
1.0 Overview of Purpose and Need
1.1 Introduction This report describes the purpose and need for transportation investments in the Regional Connector Project Study Area (PSA). The Regional Connector will provide opportunities for seamless, potentially transfer-free transit service for the Los Angeles County Metropolitan Transportation Authority (Metro) Blue Line, Metro Gold Line, and Metro Expo Line passengers traveling through downtown Los Angeles. The Regional Connector will extend from the Metro Blue Line at its present terminus at 7th St./Metro Center to Union Station, possibly via the Little Tokyo/Arts District Station on the Metro Gold Line Eastside Extension, currently under construction. Once the connection between 7th St./Metro Center and Union Station is improved, Metro Blue Line light rail passengers from Long Beach will be able to more easily continue to Pasadena. The new connection will also provide more convenient transfers between three Metro LRT lines, dozens of bus lines, and regional commuter rail service together at Union Station. When the Metro Expo Line to Culver City opens in 2010, its riders will also be able to use the Regional Connector and Gold Line Extension to reach East Los Angeles. In addition to providing more seamless service from Pasadena to Long Beach and from Culver City to the Eastside, the Regional Connector will provide increased transit coverage of the eight downtown districts: Civic Center, Bunker Hill, Historic Core, Little Tokyo, Toy District, Jewelry District, Financial Core, Fashion District, and Central City East (Figure 1-1).
This Alternatives Analysis (AA) study identifies and evaluates the potential alignments, modes, configurations, and station locations under consideration for the Regional Connector Transit Corridor. The alternatives developed as part of the AA process will be further screened in order to narrow down the preferred alternatives. A final AA Study will provide decision makers the information needed to approve further study as part of a Draft Environmental Impact Statement/Draft Environmental Impact Report (DEIS/DEIR).
As a part of the AA study, the Corridor Definition and the Purpose and Need Statement establish the rationale for transportation investments in the Regional Connector PSA. This study builds on past studies as described in Section 1.3 below.
1-2 Final December 2008
Figure 1-1 Downtown Community Districts within the Study Area
1-3 Final December 2008
1.2 History and Background 1.2.1 Location The Regional Connector PSA is located in the downtown area of the City of Los Angeles. The PSA is bounded by the Harbor Freeway (SR-110) on the west, the Santa Ana Freeway (US-101) on the north, Alameda St. on the east, and 7th and 9th Sts. on the south (See Figure 1-2 for a map of the PSA). The PSA is within the central business district of Los Angeles, comprising a dense urban core with an active Financial District lined with skyscrapers of 40 stories or more, a reviving Historic Core and a thriving cultural and civic center. Due to the built-out nature of the PSA, all streets and roadways within the PSA are potential candidates for the Regional Connector route. To the northeast of the PSA lies the Metro Gold Line extending from Union station south to 1st St. and Alameda, then heading east on 1st St. with one station just north of 1st St. and east of Alameda. To the southwest of the PSA lies the Metro Blue Line terminus at 7th St. and Figueroa. Proposed alignments for the Metro Regional Connector to connect the Metro Gold Line with the Metro Blue Line are provided in Appendix A. Despite the Regional Connector’s small PSA, the project will improve the operation of the entire Metro Rail system and benefit all areas of the county within its reach. There is also the potential for the Regional Connector to consolidate duplicative bus lines into a single high-capacity link between 7th St./Metro Center and Union Station, thus imparting operational benefits to the countywide bus network as well.
1.2.2 Study Area History Rail transit in Los Angeles dates to 1872, when Southern Pacific began construction on a passenger rail line from downtown to San Pedro, with the intent of eventually monopolizing the regional transportation system. By the 1920’s, the Southern Pacific and Pacific Electric systems had nearly 800 cars in service and hundreds of miles of tracks. Los Angeles Railway also operated a local streetcar system serving the downtown core and the nearby neighborhoods, which carried the bulk of Los Angeles’ urban ridership. Notable busy lines included the Aiso St. service to Boyle Heights, the Temple and 2nd St. cable cars on Bunker Hill, and the Angels Flight funicular railway. Pacific Electric’s Hollywood, Glendale, and San Fernando Valley trains entered the ¼ mile long Belmont Tunnel at the tail end of their trips to the Subway Terminal Building at 4th and Hill Sts. downtown.
Despite the extensive track and power infrastructure, Los Angeles’ rail transportation system would last only four more decades. Americans traded streetcars for private automobiles with record speed and moved to neighborhoods beyond the railroads’ reach. Rail transit’s final zenith came during World War II, when fuel, metal, and rubber rationing briefly forced millions of Americans back onto streetcars to get to their jobs. But with the end of the war came a period of economic and industrial prosperity and the pent-up demand for new automobiles could finally be met. With few rail riders remaining, and new diesel bus technology offering a cheap substitute for streetcar service, cash-strapped transit operators nationwide began canceling routes and removing tracks. Los Angeles’ system closed entirely, with the last train making its trip from downtown to Long Beach in 1963. Freed by the heightened mobility that private cars offered, people began working in increasingly suburbanized settings, and the old downtown core plunged into decline for several decades.
1-4 Final December 2008
In recent years, with traffic congestion mounting, the mobility that permitted dispersed job and housing patterns has become increasingly constrained. Longer commute times, ever-climbing gas prices and increased concern about greenhouse gas emissions and climate change have prompted many Los Angeles residents to seek a return to the transit-friendly urban form of decades past. Downtown Los Angeles has seen a recent surge in development, and many residents are rediscovering the forgotten urban core. During the mid-1980’s, the Los Angeles County Transportation Commission and Southern California Rapid Transit District began piecing together the rail rights-of-way abandoned decades earlier, with the intent of bringing rail transit back to Los Angeles. Today, the Metro Rail system consists of 73 track miles, and downtown Los Angeles is once again served by a radial network of rail transit lines. In addition, the Southern California Regional Rail Authority has gradually purchased right-of-way and opened its 512-mile commuter rail system over the course of the past two decades. The Metro Red Line subway has assisted in the resurgence of the downtown area by improving its accessibility and facilitating movement between its various districts.
1.3 Past Studies Pasadena – Los Angeles Light Rail Transit Project EIR 1988-1993
The concept of a light rail link through the downtown core from 7th St./Metro Center to Union Station originated from the EIR for the Pasadena-Los Angeles Light Rail Transit Project. This project involved extending the Long Beach-Los Angeles Light Rail Transit facility (Metro Blue Line) from downtown Los Angeles through Pasadena. For the downtown portion of the alignment, over seven different alternatives were analyzed and presented to the community (see maps in Attachment 2). After environmental clearance and public approval, the Pasadena-Los Angeles Light Rail Transit Project (Metro Gold Line) was built to Union Station using the “No Subway” option. The connection to the Long Beach Blue Line occurs via a transfer at Union Station to the Metro Red Line, which serves both 7th St./Metro Center and Union Station. It was specifically indicated in the study that a light rail connection can be made between the two stations in the future.
Blue Line Connection Preliminary Planning Study
In 1993, Metro completed a preliminary planning study to analyze alternatives for connecting the Long Beach Blue Line, already in operation, to the Pasadena Blue Line (later renamed as the Metro Gold Line), not yet under construction. Though the Metro Gold Line provides a viable service as a standalone route from downtown Los Angeles to Pasadena, Metro officials perceived significant benefits to connecting it with other light rail routes. The Blue Line Connection Preliminary Planning Study was developed prior to the development of the Metro Gold Line Eastside Extension and the Metro Expo Line. Therefore, its PSA is larger than the one currently identified for the Regional Connector Transit Corridor Study. At the time of this study, rail service to East Los Angeles was being considered as an extension to the Metro Red Line, a heavy rail transit (HRT) subway with a different alignment and different station locations than the light rail alternative currently in construction in 2008. The Metro Board of Directors ultimately chose to proceed with the light rail Metro Gold Line Eastside Extension, which is under construction and planned for operation in 2009. The Blue Line Connection Preliminary Planning Study identified a potential capacity problem for the Metro Red Line subway, as it would be the
1-5 Final December 2008
sole rail connection between Union Station and the 7th St./Metro Center Station. Over 14 different alternatives were identified and analyzed in the study.
Los Angeles Eastside Corridor Final Supplemental EIR/EIS 2002
In February 2002, Metro approved the Metro Gold Line Eastside Extension using light rail technology in lieu of the HRT subway Red Line Eastside Extension. This six-mile, eight-station extension (the original Metro Red Line Extension was to be only 3.1 miles with four stations) primarily traverses Alameda St., 1st St., Indiana St., and 3rd St. En route to East Los Angeles, it connects Union Station to the eastern edge of downtown via a new bridge over the US-101 freeway from Union Station to Alameda St. and Temple St., a structure that was also considered in previous studies. The project is at grade in the PSA on the eastern side of Alameda St. from Temple St. to 1st St. An at-grade station at 1st and Alameda Sts. is sited on the northeast corner of the intersection so as to minimize traffic impacts.
Regional Light Rail Connector Study 2004
Based on new alignment opportunities created by the approval and construction of the Metro Gold Line Eastside Extension, Metro initiated an engineering study to identify potential alignment, station and configuration alternatives for a new light rail connection between the Metro Blue and Gold Lines. The new alternatives extended from the Metro Gold Line Eastside Extension in the vicinity of the Little Tokyo/Arts District Station at 1st and Alameda Sts. to the 7th St./Metro Center Station. Over 41 alternatives were developed during the process and initial screening reduced the number of alternatives to 16. There was not a final recommendation for further reductions in alternatives. The screening of alternatives was based on alternative characteristics, service area, cost, complexity of engineering and other similar criteria. There was no public input process performed as part of this study. This report includes several of the alternatives identified in the 2004 study. However, some of the 2004 alternatives are no longer feasible due to changed conditions along the proposed alignments.
1-6 Final December 2008
Figure 1-2 Project Study Area
1-7 Final December 2008
1.4 Study Area Demographics Data described in this section were obtained from the Southern California Association of Governments (SCAG, 2005) and the U.S. Census Bureau (2000), and represent demographic conditions at the time of data-gathering. The Regional Connector PSA is currently undergoing significant changes in housing and demographics. Within the last 3-4 years, new market-rate condominium towers have been completed, historic buildings are being converted to loft housing, and new entertainment centers are being approved, bringing renewed interest in downtown. While this development has been a positive resurgence for the PSA, it has also raised issues of the impacts of gentrification as well as the preservation of cultural centers and affordable housing and office units.
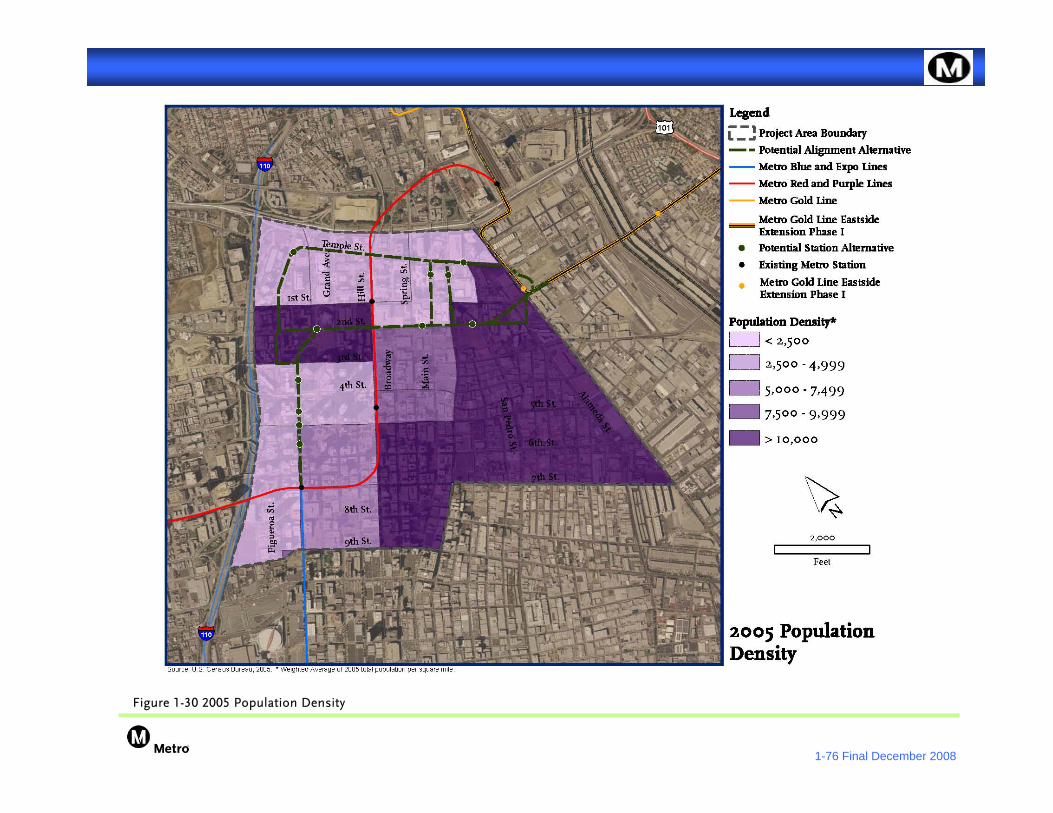
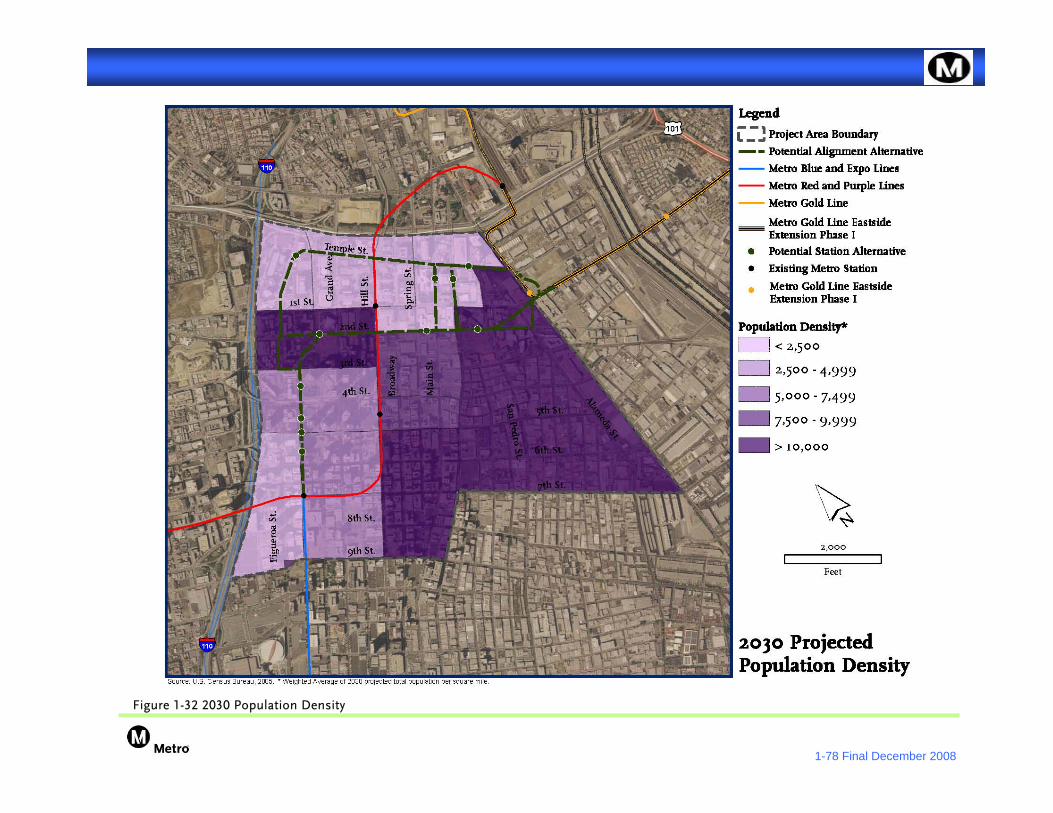
The Regional Connector PSA covers 1.6 square miles, or 0.03 percent of the 4,752 square miles of Los Angeles County. In 2005, the total population of the Regional Connector PSA was 17,795, which was only 0.18 percent of the L.A. County population of over ten million. Despite its small size, the Regional Connector PSA sustained 3.62 percent of the County’s employment, or 168,328 jobs, in 2005. The average population density within the PSA was 11,685 people per square mile, significantly higher than the 2,107 people per square mile population density found in L.A. County in 2005. Employment density in the PSA was 110,529 employees per square mile, which was also significantly higher than the County employment density of 977. Table 1-1 summarizes the PSA and L.A. County population and employment information for 2005. Population and employment growth are discussed further with respect to transit dependency in Sections 1.7.4 and 1.7.5.
Table 1-1 Population and Employment
Demographics PSA L.A. County Percent of County Population 17,795 10,010,315 0.18% Population Density 11,685 2107 NA Total Employment 168,328 4,644,010 3.62% Employment Density 110,529 977 NA Source: SCAG, 2005
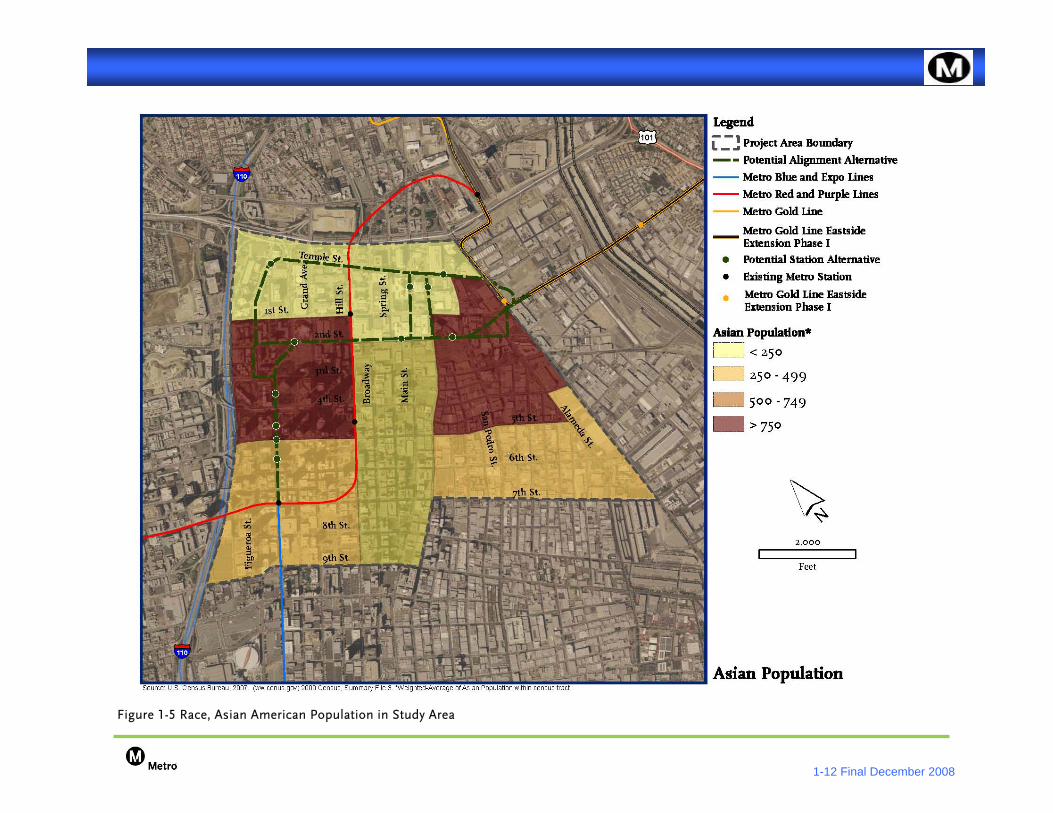
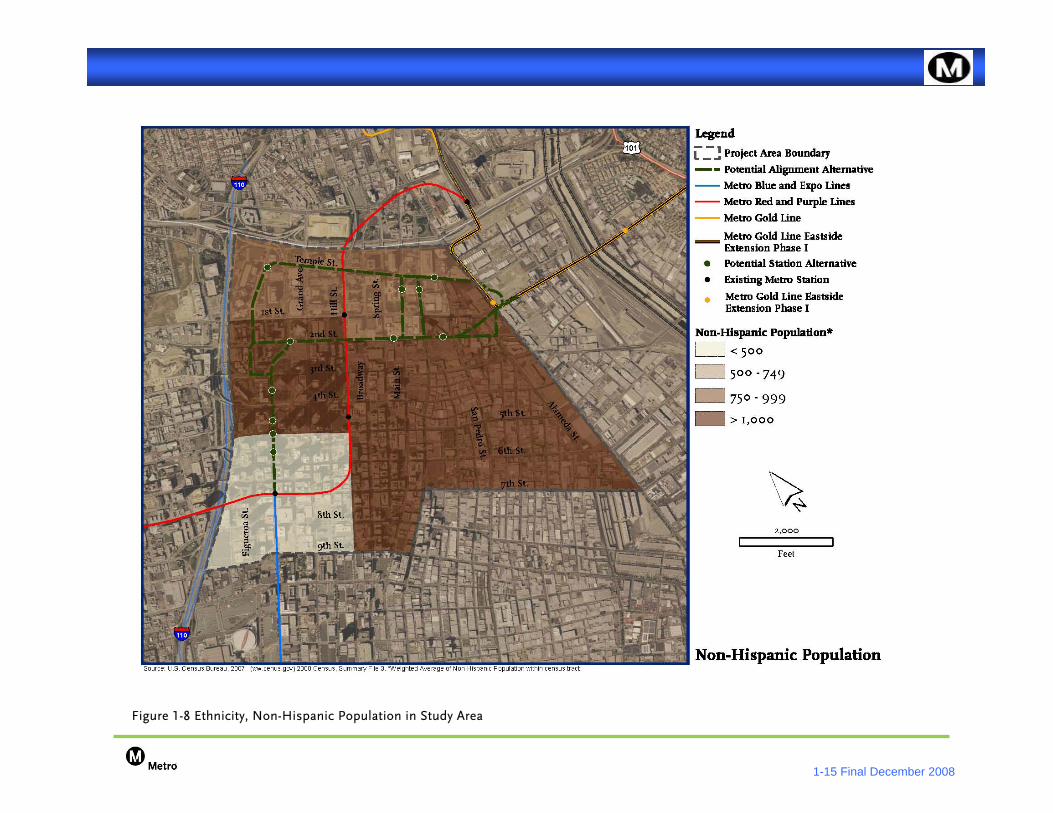
According to 2000 Census Data, the PSA had higher proportions of Asian and Black residents as compared to L.A. County. Black residents composed 30.6 percent of the PSA as compared with only 9.6 percent of the County, residing primarily east of Hill St. and south of 1st St. Asian residents, who live primarily between 1st St. and 5th St., compose 23.5 percent of the PSA as compared with 11.9 percent of the County. The PSA has significantly lower compositions of White and Hispanic populations when compared to the County. Table 1-2 shows the racial and ethnic breakdown of the PSA. Figures 1-3 through 1-8 illustrate the population’s racial and ethnic distribution throughout the PSA.
1-8 Final December 2008
Table 1-2 Racial and Ethnic Composition
Demographics PSA Total LA County
Number % Number %
Race Total Population 17,795 100% 9,519,338 100% White 4,968 27.9% 4,622,759 48.6% Black/African American 5,441 30.6% 916,907 9.6% American Indian 180 1.0% 68,471 0.7% Asian 4,187 23.5% 1,134,263 11.9% Pacfiic Islander/Hawaiian 9 0.1% 27,221 0.3% Some other race 2,139 12.0% 2,262,925 23.8% Two or more races 917 5.2% 486,792 5.1% Ethnicity Total Population of PSA 17,795 100% 9,519,338 100% Hispanic or Latino (regardless of race) 4,258 23.9% 4,242,213 44.6% Source: U.S. Census Bureau, 2000
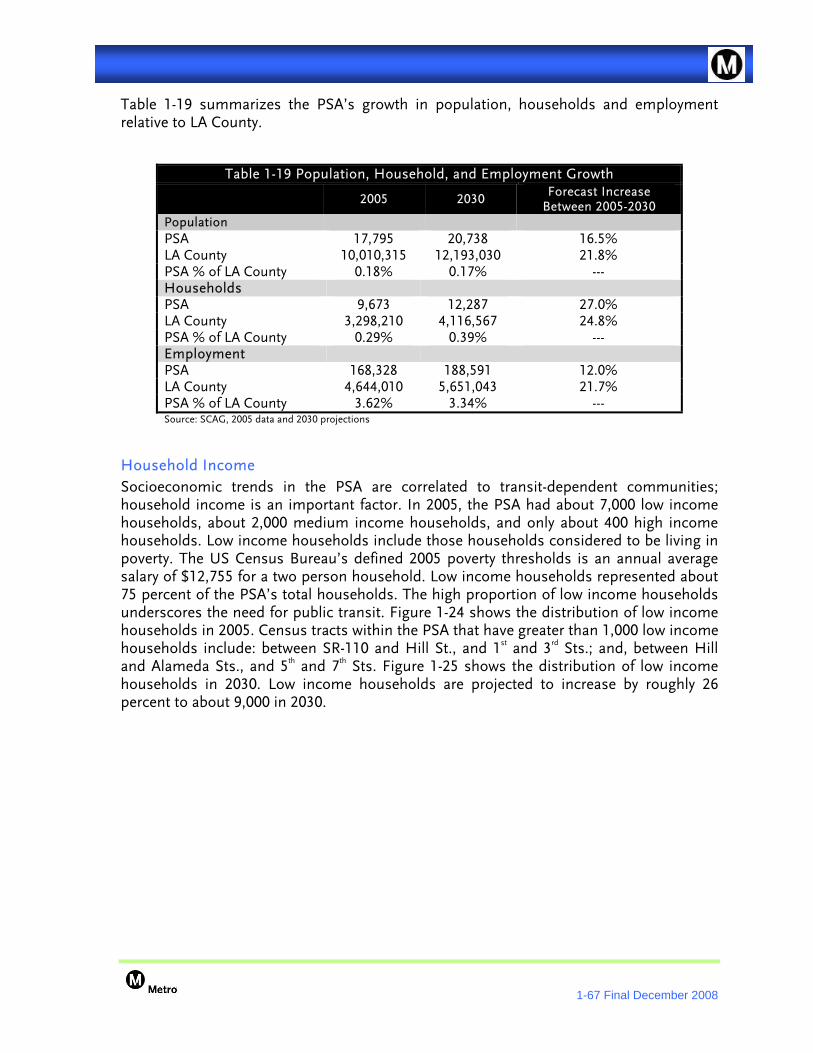
Residences in the area have been categorized as single-family homes, multi-family homes, or group quarter residences, which include military barracks, dormitories, and institutional housing. Data for the number of low, medium, and high-income households in the PSA were available for single-family and multi-family residences only, of which there were 9,673 households in 2005 with a median household income of approximately $45,000. Group quarters added an additional 5,466 residences. Based on these 2005 data, the PSA is primarily composed of low-income households, with a moderate medium-income household population, as shown in Table 1-3. As mentioned above, recent development and gentrification of the PSA continue to bring about demographic changes that may not be reflected in data from 2005.
Table 1-3 Study Area Income Status
Demographics PSA Percent Total Residences 15,136 N/A Total Households 9,673 100% Low Income Households 7,244 75% Medium Income Households 2,009 21% High Income Households 417 4% SCAG, 2005
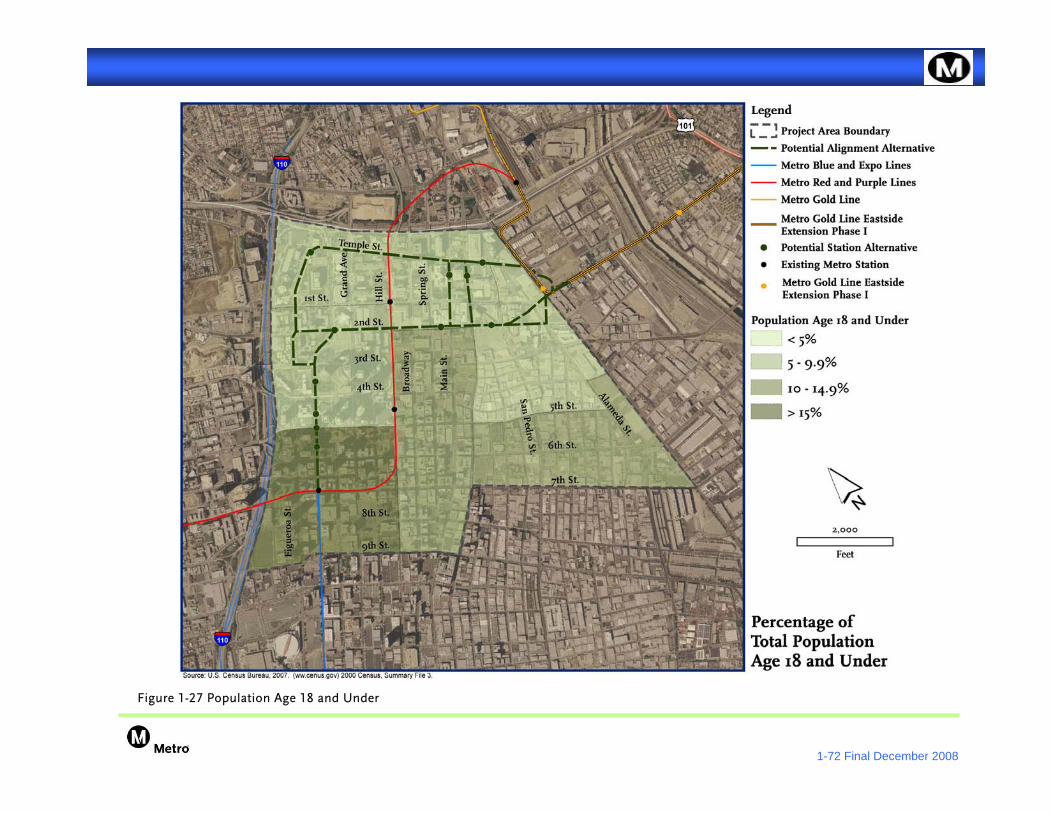
In 2005, only 5.5 percent of young people in L.A. County lived within the PSA, as shown in Table 1-4. Comparatively, 29.4 percent of the population of L.A. County in 2005 was age 18 and under.
The PSA also demonstrates a higher percentage of elderly residents (19.7%) when compared to L.A. County (9.7%). The young and the elderly have a higher propensity for using public transportation since these groups are less likely to have driver’s licenses or access to private automobiles. Although the PSA has a lower total proportion of these groups when compared to L.A. County, the Regional Connector is expected to improve
1-9 Final December 2008
transit connectivity and accessibility for members of these groups living outside the PSA who would wish to commute into it. This effect is especially pronounced when the potential benefits to all neighborhoods served by the Metro Rail system are considered.
Table 1-4 Population Age
AGE PSA % L.A. County % 18 and under 976 5.5% 2,798,604 29.4%
65 and over 3,497 19.7% 926,670 9.7% Source: U.S. Census Bureau, 2000; SCAG, 2005
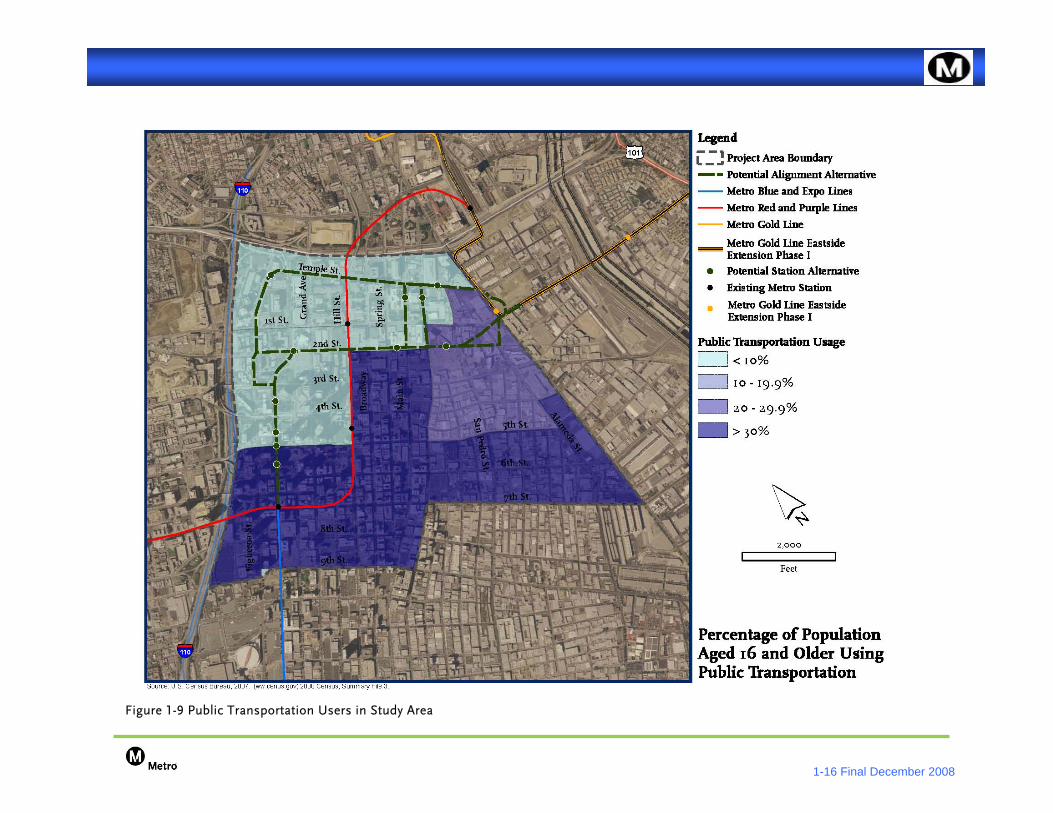
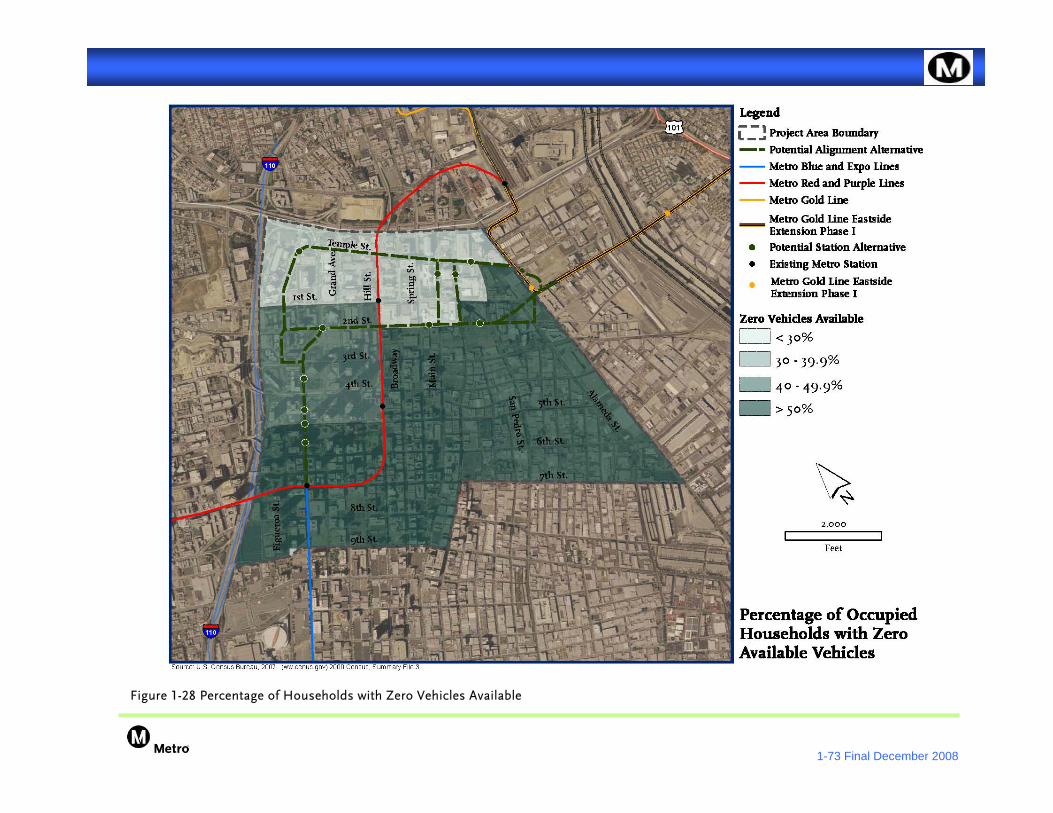
The PSA demonstrates a higher rate of transit use than other areas of Los Angeles County, with 23 percent of residents age 16 and older who work in the PSA utilizing public transportation as compared to seven percent within the entire County. The number of public transportation users within the PSA is actually higher than the 1,025 public transportation utilizing residents of the PSA, as total users are composed both of the population from within the PSA and from the larger Los Angeles County region who travel to downtown Los Angeles for employment and other activities. Figure 1-9 shows the distribution of public transportation users within the PSA. The areas correspond fairly closely to the areas in which there are high percentages of households with zero vehicle availability, as shown in Figure 1-10. A much higher number of households within the PSA lack vehicle access (69%) when compared to L.A. County (12%).
1-10 Final December 2008
Figure 1-3 Race, White Population in Study Area
1-11 Final December 2008
Figure 1-4 Race, Black/African-American Population in Study Area
1-12 Final December 2008
Figure 1-5 Race, Asian American Population in Study Area
1-13 Final December 2008
Figure 1-6 Race, Population Identified as “Other Race” in Study Area
1-14 Final December 2008
Figure 1-7 Ethnicity, Hispanic Population in Study Area
1-15 Final December 2008
Figure 1-8 Ethnicity, Non-Hispanic Population in Study Area
1-16 Final December 2008
Figure 1-9 Public Transportation Users in Study Area
1-17 Final December 2008
Figure 1-10 Zero-Car Households in Study Area
1-18 Final December 2008
1.5 Transportation Facilities and Services 1.5.1 Regional Transit Context Downtown Los Angeles has the highest concentration of transit service of any area in Los Angeles County. At present, ten transit operators provide service along 112 bus routes and three rail lines (four when the Metro Expo Line opens in 2010) within the Regional Connector PSA. There is also heavy pedestrian activity throughout the PSA. Figure 1-11 illustrates transportation facilities within the PSA.
Figure 1-11 Transit in the Study Area
1-19 Final December 2008
1.5.2 Transportation Facilities and Services in the Study Area 1.5.2.1 Metro Rail
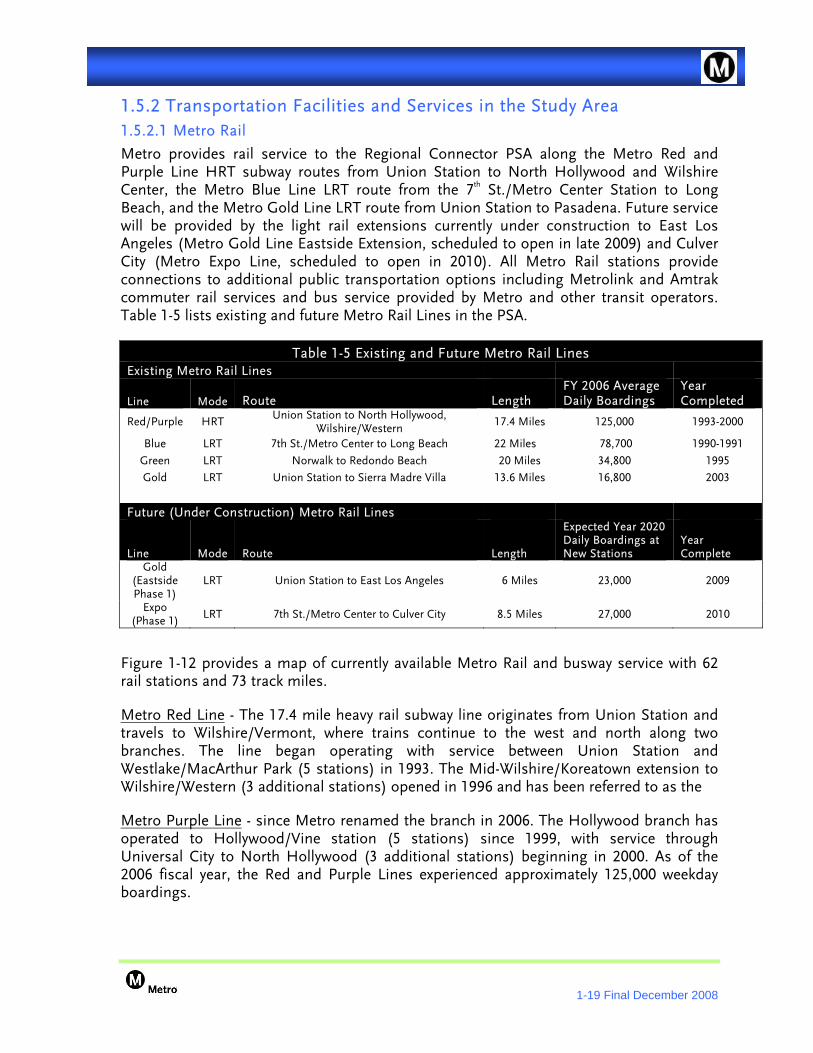
Metro provides rail service to the Regional Connector PSA along the Metro Red and Purple Line HRT subway routes from Union Station to North Hollywood and Wilshire Center, the Metro Blue Line LRT route from the 7th St./Metro Center Station to Long Beach, and the Metro Gold Line LRT route from Union Station to Pasadena. Future service will be provided by the light rail extensions currently under construction to East Los Angeles (Metro Gold Line Eastside Extension, scheduled to open in late 2009) and Culver City (Metro Expo Line, scheduled to open in 2010). All Metro Rail stations provide connections to additional public transportation options including Metrolink and Amtrak commuter rail services and bus service provided by Metro and other transit operators. Table 1-5 lists existing and future Metro Rail Lines in the PSA.
Table 1-5 Existing and Future Metro Rail Lines Existing Metro Rail Lines
Line Mode Route Length FY 2006 Average Daily Boardings
Year Completed
Red/Purple HRT Union Station to North Hollywood, Wilshire/Western
17.4 Miles 125,000 1993-2000
Blue LRT 7th St./Metro Center to Long Beach 22 Miles 78,700 1990-1991
Green LRT Norwalk to Redondo Beach 20 Miles 34,800 1995
Gold LRT Union Station to Sierra Madre Villa 13.6 Miles 16,800 2003
Future (Under Construction) Metro Rail Lines
Line Mode Route Length
Expected Year 2020 Daily Boardings at New Stations
Year Complete
Gold (Eastside Phase 1)
LRT Union Station to East Los Angeles 6 Miles 23,000 2009
Expo (Phase 1) LRT 7th St./Metro Center to Culver City 8.5 Miles 27,000 2010
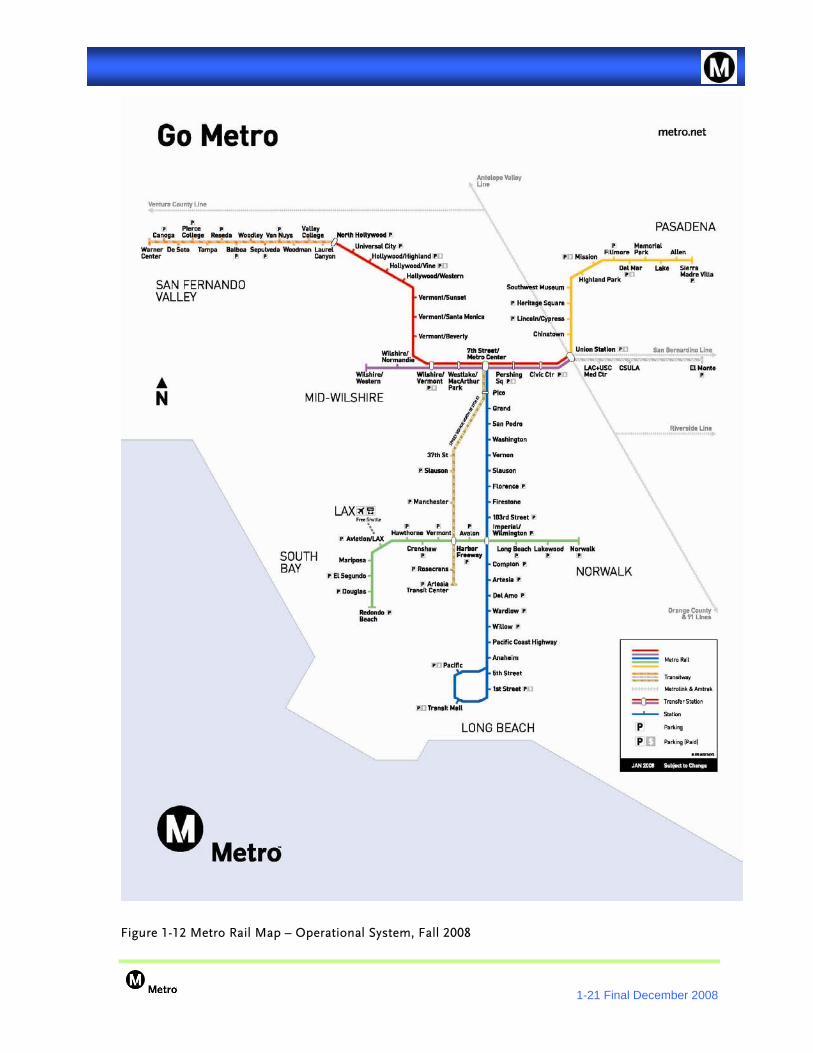
Figure 1-12 provides a map of currently available Metro Rail and busway service with 62 rail stations and 73 track miles.
Metro Red Line - The 17.4 mile heavy rail subway line originates from Union Station and travels to Wilshire/Vermont, where trains continue to the west and north along two branches. The line began operating with service between Union Station and Westlake/MacArthur Park (5 stations) in 1993. The Mid-Wilshire/Koreatown extension to Wilshire/Western (3 additional stations) opened in 1996 and has been referred to as the
Metro Purple Line - since Metro renamed the branch in 2006. The Hollywood branch has operated to Hollywood/Vine station (5 stations) since 1999, with service through Universal City to North Hollywood (3 additional stations) beginning in 2000. As of the 2006 fiscal year, the Red and Purple Lines experienced approximately 125,000 weekday boardings.
1-20 Final December 2008
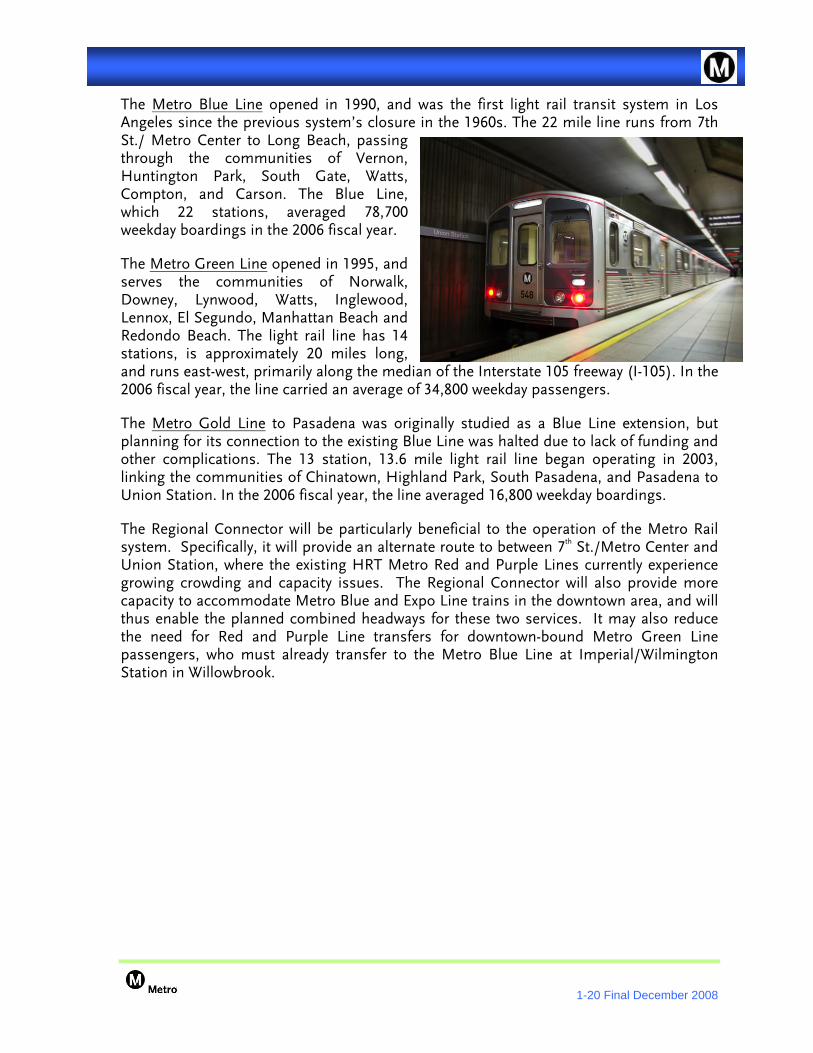
The Metro Blue Line opened in 1990, and was the first light rail transit system in Los Angeles since the previous system’s closure in the 1960s. The 22 mile line runs from 7th St./ Metro Center to Long Beach, passing through the communities of Vernon, Huntington Park, South Gate, Watts, Compton, and Carson. The Blue Line, which 22 stations, averaged 78,700 weekday boardings in the 2006 fiscal year.
The Metro Green Line opened in 1995, and serves the communities of Norwalk, Downey, Lynwood, Watts, Inglewood, Lennox, El Segundo, Manhattan Beach and Redondo Beach. The light rail line has 14 stations, is approximately 20 miles long, and runs east-west, primarily along the median of the Interstate 105 freeway (I-105). In the 2006 fiscal year, the line carried an average of 34,800 weekday passengers.
The Metro Gold Line to Pasadena was originally studied as a Blue Line extension, but planning for its connection to the existing Blue Line was halted due to lack of funding and other complications. The 13 station, 13.6 mile light rail line began operating in 2003, linking the communities of Chinatown, Highland Park, South Pasadena, and Pasadena to Union Station. In the 2006 fiscal year, the line averaged 16,800 weekday boardings.
The Regional Connector will be particularly beneficial to the operation of the Metro Rail system. Specifically, it will provide an alternate route to between 7th St./Metro Center and Union Station, where the existing HRT Metro Red and Purple Lines currently experience growing crowding and capacity issues. The Regional Connector will also provide more capacity to accommodate Metro Blue and Expo Line trains in the downtown area, and will thus enable the planned combined headways for these two services. It may also reduce the need for Red and Purple Line transfers for downtown-bound Metro Green Line passengers, who must already transfer to the Metro Blue Line at Imperial/Wilmington Station in Willowbrook.
1-21 Final December 2008
Figure 1-12 Metro Rail Map – Operational System, Fall 2008
1-22 Final December 2008
Metro Gold Line Eastside Extension - The first phase is expected to open in 2009 making stops in Little Tokyo, Boyle Heights, and East Los Angeles. The six-mile line will feature eight new stations and connect with the existing Metro Gold Line to Pasadena without requiring riders to transfer. Metro estimates that there will be 23,000 boardings each weekday on the Eastside Extension by 2020.
The Metro Expo Line is expected to open in 2010 as the first phase mid-city segment of the Exposition Light Rail line. The 8.5 mile line will run primarily at-grade and serve 11 stations from 7th St./Metro Center in downtown Los Angeles to the intersection of Washington Blvd. and National Blvd. in Culver City. Average weekday boardings are expected to reach 27,000 by 20201.
Should the Regional Connector be constructed as a light rail link, it would allow five-minute headways on the East Los Angeles to Culver City route as well as the Pasadena to Long Beach route. Combined, there would be trains every 2 ½ minutes in each direction along the Regional Connector.
There are four Metro Rail stations located within the Regional Connector PSA. The HRT Metro Red and Purple Line stations are Civic Center (Hill St. between Temple and 1st Sts.), Pershing Square (Hill St. between 4th and 5th Sts.), and 7th St./Metro Center (7th St. between Figueroa and Hope Sts., and Flower St. between Wilshire Blvd. and 8th St.). 7th St./Metro Center serves as a transfer point to the LRT Metro Blue Line as well. The LRT Little Tokyo/Arts District Station (Alameda St. between Temple and 1st Sts.) is scheduled to open in 2009 as part of the Metro Gold Line Eastside Extension.
1.5.2.2 Metro Bus
Because downtown Los Angeles is a regional employment hub, there are numerous bus operators serving the area. These operators are:
Antelope Valley Transit Authority (AVTA)
City of Gardena (Gardena Municipal Bus Lines)
City of Santa Clarita Transit
City of Santa Monica (Big Blue Bus)
1 www.buildexpo.org
1-23 Final December 2008
Foothill Transit
City of Los Angeles Department of Transportation (LADOT)
Los Angeles County Metropolitan Transportation Authority (Metro)
City of Montebello (Montebello Bus Lines)
Orange County Transportation Authority (OCTA)
City of Torrance (Torrance Transit)
With the exception of Metro, LADOT, Montebello Bus Lines, and Gardena Municipal Bus Lines, these transit operators run mostly peak-hour, peak-direction commuter bus service in and out of the PSA. LADOT provides both long-distance freeway commute service as well as frequent Downtown Area Short Hop (DASH) service along short, mostly circular shuttle routes within the downtown area.
The majority of transit service in the PSA, as well as the Los Angeles region, is provided by Metro, which operates a number of short and long-distance radial lines, as well as limited owl service, cross-town service, express service, and a regional heavy rail subway and light rail network. The combined number of transit vehicle boardings and alightings in the PSA on Metro buses alone totals 185,000 on a typical weekday. The 91,823 weekday boardings account for 7.75% of the 1,184,720 bus boardings systemwide. Metro’s transit services vary considerably in speed and capacity. The agency’s most basic routes provide line-haul service to and from downtown along arterial streets. Heavily-traveled routes often have overlaid limited-stop or Metro Rapid service, and six additional Metro Rapid lines are scheduled to open by June 2008. Of these future routes, lines 730 (Pico Blvd.) and 753 (Central Ave.) will serve the PSA. The Regional Connector will offer the opportunity to consolidate some bus service to the new high-capacity route, thus reducing operating expenses.
Rapid service includes traffic signal priority, short headways, and infrequent stops, which increase corridor average bus speeds by about 3-4 mph over local service, which typically operates in the 9-12 mph range. Metro currently provides Rapid service into the Regional Connector PSA from major intersections along Beverly Blvd. (peak hours only), Wilshire Blvd., Whittier Blvd., South Broadway, and Hawthorne Blvd. Additionally, Metro Rapid Express rush hour service to downtown commenced in June 2007 with the opening of line 940 (Hawthorne Blvd. Rapid Express). Rapid Express service is essentially the same as Rapid service, but serves only 1/3 of the Rapid route’s stops, providing a slight increase in speed.
In addition to public transit services, several high-rise office tenants within the Regional Connector PSA offer shuttle bus service to Union Station for their employees. The majority of the publicly-provided commuter services originating east of downtown use the El Monte Busway, high capacity bus-carpool lanes constructed in 1976, which parallels the San Bernardino Freeway (I-10). Similarly, the commuter buses coming from points south and southeast of downtown primarily use the Harbor Transitway, completed in 1996. The
1-24 Final December 2008
Regional Connector will potentially be more attractive than these transitway services because it will connect light rail lines with stations centrally located in dense neighborhoods and business districts, as opposed to freeway medians.
1.5.2.3 Commuter Rail
Commuter rail service to downtown Los Angeles is provided primarily by Metrolink and Amtrak, with connections to Metro Rail service at Union Station, located 1/10 mile outside of the PSA (see Figure 1-12 above). Most passengers arriving at Union Station on Metrolink are bound for the central business district and presently use the Metro Red Line, DASH buses, or employer-provided shuttles to complete their trips. Conceivably, some passengers might instead use the Regional Connector if it reduces trip times and its stations are closer to their destinations than the existing Red Line and DASH stops.
Metrolink has operated under the Southern California Regional Rail Authority (SCRRA) since 1992, serving the counties of Los Angeles, Orange, Riverside, San Bernardino, San Diego, and Ventura. Metrolink provides 512 miles of service (including tracks shared with Amtrak) to 55 stations on seven routes. Average weekday ridership on Metrolink trains from October through December 2007 was over 42,000 daily boardings, with the majority of trips (56.4%) beginning or ending at Union Station.
Amtrak is an inter-city passenger rail system serving Los Angeles’ Union Station with regional Southern California, statewide, and nationwide service. Amtrak’s Pacific Surfliner line carries passengers from San Luis Obispo in the north to San Diego in the south. It shares tracks with the Metrolink Ventura and Orange County lines from Oxnard to San Clemente Pier.
1.6 Performance of the Travel System The Southern California region is faced with multiple mobility challenges that hinder the region’s ability to effectively meet additional travel demand. One of the most pressing issues is population growth. Los Angeles County alone is expected to increase by 2.2 million people, nearly twice the population of the city of San Diego, to a total of 12.2 million people by the year 2030. The expected population growth in the region will lead to increased travel demand.
If unaddressed, these challenges could hamper future population growth, economic development, commuter safety, existing infrastructure, goods movement, air quality, and environmental conditions. If no action is taken to improve transportation mobility, SCAG estimates that daily person hours of delay would increase from 2.2 million hours under the 2000 Base Year to 5.4 million hours under the 2030 Baseline.
To define and address mobility issues, SCAG developed regional performance indicators that help in understanding the problem, setting goals for improvement, and measuring progress towards the goals. The following section describes regional performance indicators and baseline estimates of performance. Improving transit connections in the downtown Los Angeles area is one way to help reduce regional travel demand. Providing alternatives to the automobile will help to offset increased commuter patterns associated with residential population growth within Los Angeles County.
1-25 Final December 2008
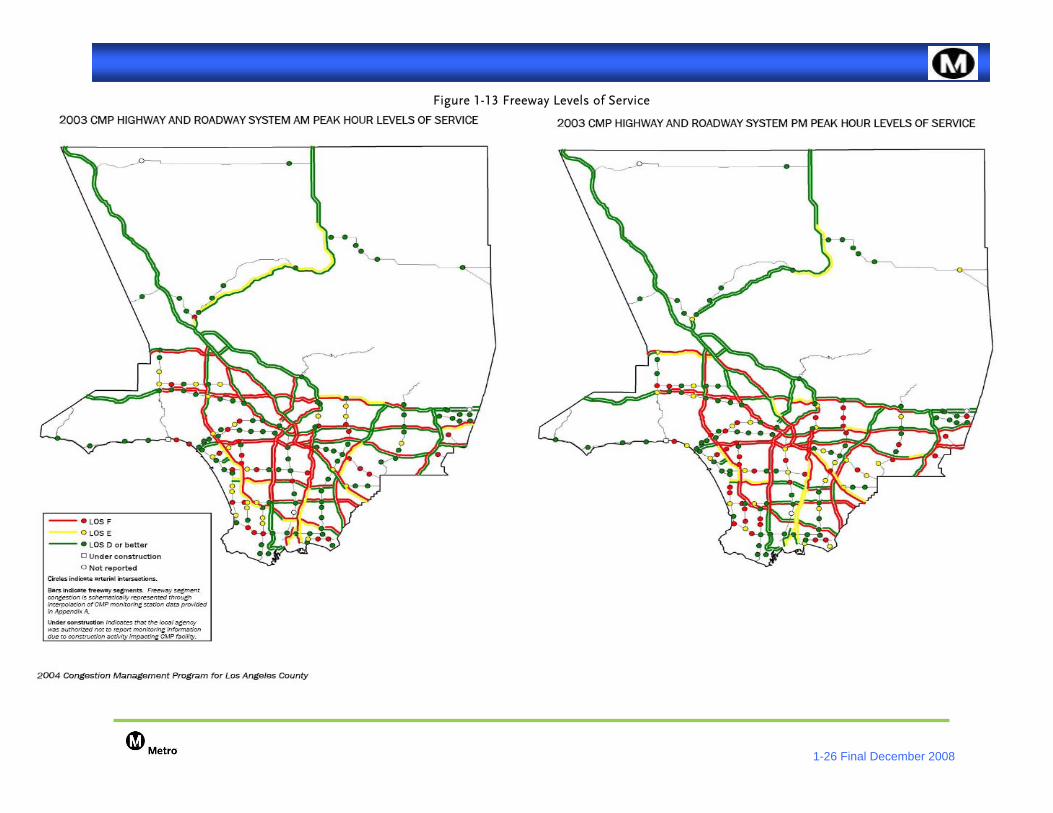
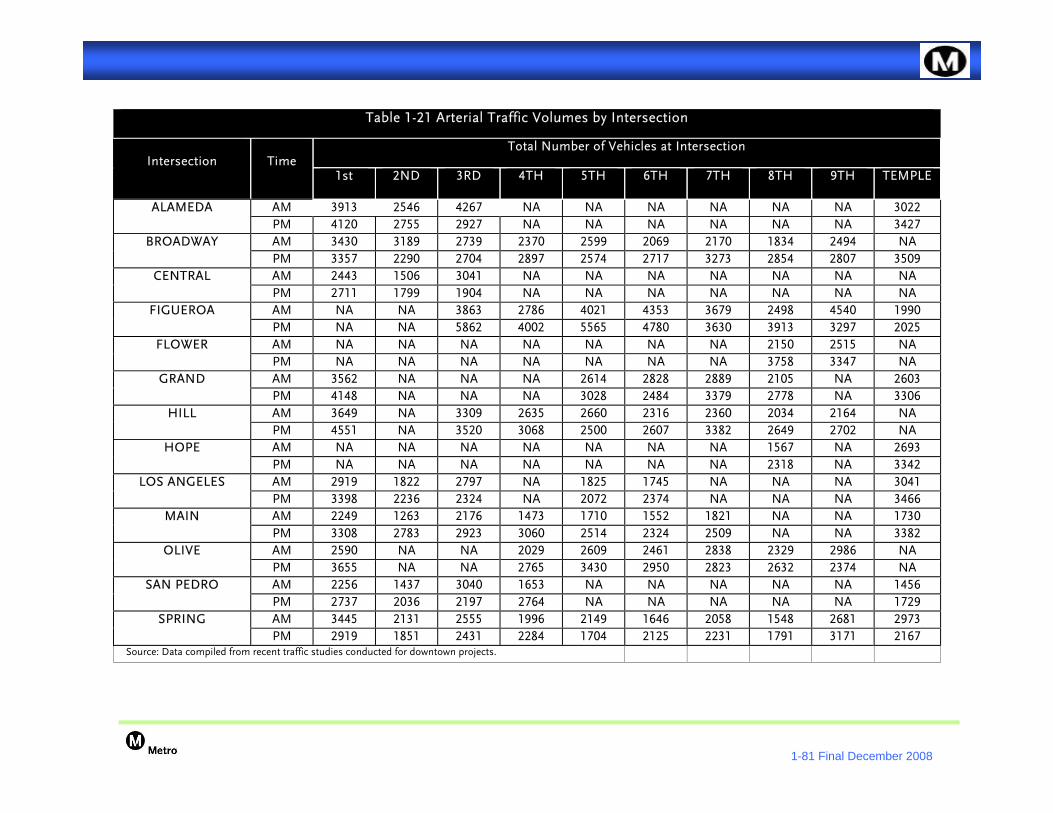
1.6.1 Traffic Volumes and Operating Conditions This section presents the traffic operating conditions at key roadway segments and intersections within the Regional Connector PSA. The locations of the intersections being studied were determined based on the alternative alignments and the potential effects each may have on the adjacent transportation network. The implementation of any alternative that has grade crossings or street-running segments is expected to affect traffic operations as well as change current traffic flow patterns. Existing daily, AM peak and PM peak traffic volumes were obtained from data provided by LADOT. An existing conditions level of service (LOS) analysis was performed for the key roadway segments using daily traffic volumes and the key intersections using AM and PM peak hour turning movement data. Freeways within the PSA already operate at LOS F during peak hours, and this trend is expected to persist through the year 2030. Nearly all areas of Los Angeles County experience freeway congestion during peak hours. However, the congestion in the PSA is among the worst and it occurs during both the morning and evening rush hour periods, as illustrated in the following maps.
1-26 Final December 2008
Figure 1-13 Freeway Levels of Service
1-27 Final December 2008
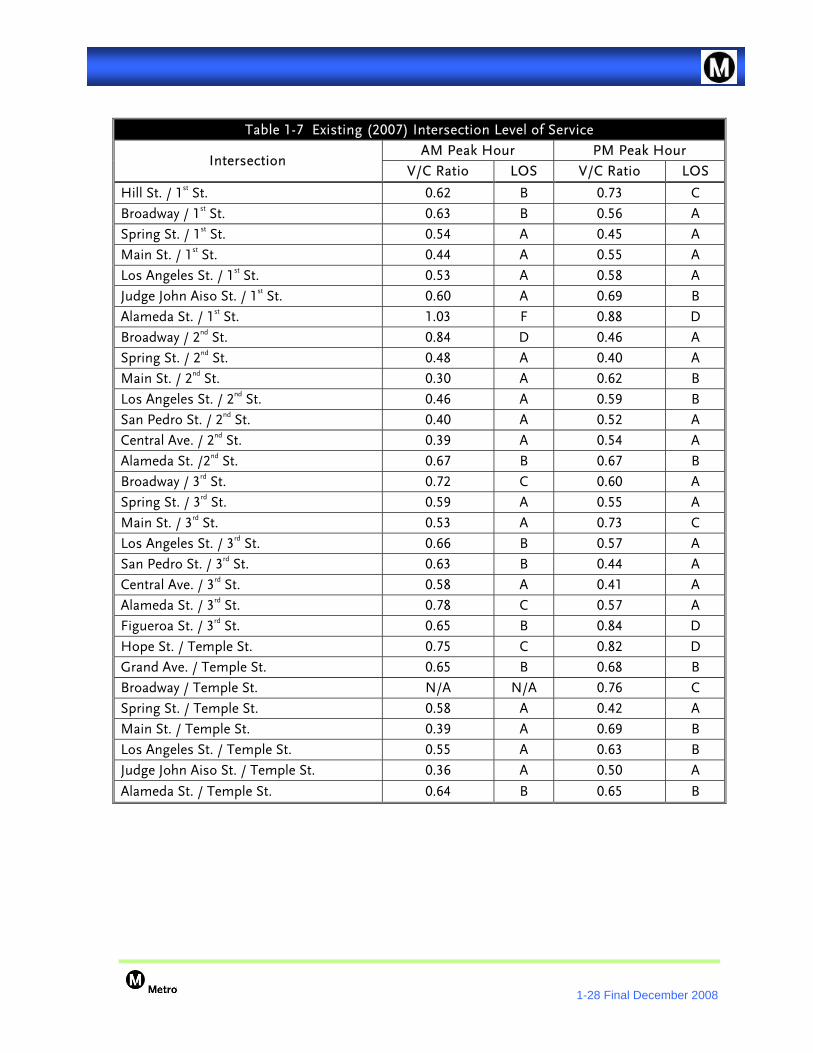
The roadway segment analysis was performed using a Volume-to-Capacity (V/C) ratio of the average daily traffic (ADT). Existing volumes were obtained from LADOT and the capacity was based on the roadway’s general plan facility type classification. For intersections, the AM and PM peak hour volumes were analyzed using the Intersection Capacity Utilization (ICU) methodology, which determines a v/c ratio based on the critical intersection approach movements and a corresponding level of service. The LOS is a qualitative measure used to describe traffic flow conditions, ranging from excellent flow (LOS A) to overloaded, stop-and-go conditions (LOS F). Level of service definitions and corresponding V/C ranges are presented below.
The tables below summarize the existing operating conditions for the key intersections and roadway segments in the PSA. All the key study intersections currently operate at LOS D or better during both the AM and PM peak hours. The only exception is the intersection of Alameda and 1st Sts., which currently operates at LOS F in the AM peak hour. Most of the key roadway segments currently operate at LOS D or better except for three locations which operate at LOS E. Two of these locations are on 2nd St. and the third location is on Alameda St.
Table 1-6 Level of Service Definitions
Level of Service
Volume/Capacity Ratio
Definition
A 0.000 - 0.600 EXCELLENT. No vehicle waits longer than one red light and no approach phase is fully used.
B 0.601 - 0.700 VERY GOOD. An occasional approach phase is fully utilized; many drivers begin to feel somewhat restricted within groups of vehicles.
C 0.701 - 0.800 GOOD. Occasionally drivers may have to wait through more than one red light; backups may develop behind turning vehicles.
D 0.801 - 0.900 FAIR. Delays may be substantial during portions of the rush hours, but enough lower volume periods occur to permit clearing of developing lines, preventing excessive backups.
E 0.901 - 1.000 POOR. Represents the most vehicles intersection approaches can accommodate; may be long lines of waiting vehicles through several signal cycles.
F >1.000 FAILURE. Backups from nearby locations or on cross streets may restrict or prevent movement of vehicles out of the intersection approaches. Tremendous delays with continuously increasing queue lengths.
Source: Transportation Research Board, Transportation Research Circular No. 212, Interim Materials on Highway Capacity, 1980
1-28 Final December 2008
Table 1-7 Existing (2007) Intersection Level of Service
Primary Street Cross Street Facility Type Number of lanes
Capacity ADT V/C
Ratio LOS
Flower St. 3rd St. Secondary 4 28,000 11,177 0.399 A 5th St. Secondary 6 45,000 19,920 0.443 A
6th St. Secondary 4 30,000 17,386 0.580 A Wilshire Bl. Secondary 4 30,000 19,434 0.648 B 7th St. Secondary 4 30,000 18,908 0.630 B
2nd St. Alameda St. Secondary 3 21,000 8,176 0.389 A Central Ave. Secondary 2 14,000 10,452 0.747 C Los Angeles St. Secondary 3 21,000 16,244 0.774 C Main St. Secondary 3 21,000 19,630 0.935 E San Pedro St. Secondary 2 14,000 13,371 0.955 E Spring St. Secondary 4 28,000 14,394 0.514 A
Los Angeles St. 1st St. Secondary 4 28,000 18,559 0.663 B 2nd St. Secondary 4 28,000 17,156 0.613 B Temple St. Secondary 5 35,000 22,036 0.630 B
Main St. 1st St. 1-Way Major Class II 3 25,500 12,079 0.474 A 2nd St. 1-Way Major Class II 3 25,500 13,711 0.538 A Temple St. Major Class II 4 34,000 25,626 0.754 C
Temple St. Judge John Aiso St. Major Class II 4 32,000 17,114 0.535 A Los Angeles St. Major Class II 4 32,000 16,809 0.525 A Main St. Major Class II 4 32,000 17,032 0.532 A
1st St. Alameda St. Secondary 4 28,000 21,538 0.769 C Central Ave. Secondary 4 28,000 23,081 0.824 D Los Angeles St. Secondary 6 42,000 22,099 0.526 A Main St. Secondary 6 42,000 23,908 0.569 A Spring St. Secondary 6 42,000 20,205 0.481 A
3rd St. Flower St. Secondary 4 30,000 19,133 0.638 B Spring St. Secondary 3 22,500 17,564 0.781 C Los Angeles St. Secondary 3 22,500 17,965 0.798 C Main St. Secondary 3 22,500 16,151 0.718 C
Alameda St. 1st St. Major Class II 4 32,000 30,514 0.954 E 2nd St. Major Class II 4 32,000 27,881 0.871 D
1-30 Final December 2008
In order to estimate the impacts of the proposed alternatives on the downtown roadway system, future traffic volumes were developed for the year 2030. The travel demand model was used to identify the annual growth rate at key intersections and roadway segments between the model base year and the 2030 forecast year. At most of the key locations, the model’s annual growth rate was found to be around one percent or less. Consequently, a conservative annual growth rate of one percent was used to forecast the existing (2007) traffic volumes over 23 years to the year 2030 horizon. However, at several locations where the model growth rate substantially exceeded one percent, the greater rates from the model were utilized. This occurred along Flower St., where an annual growth rate of 1.4 percent was used, and in the southbound direction on Alameda St., where an annual growth rate of 1.75 percent was used.
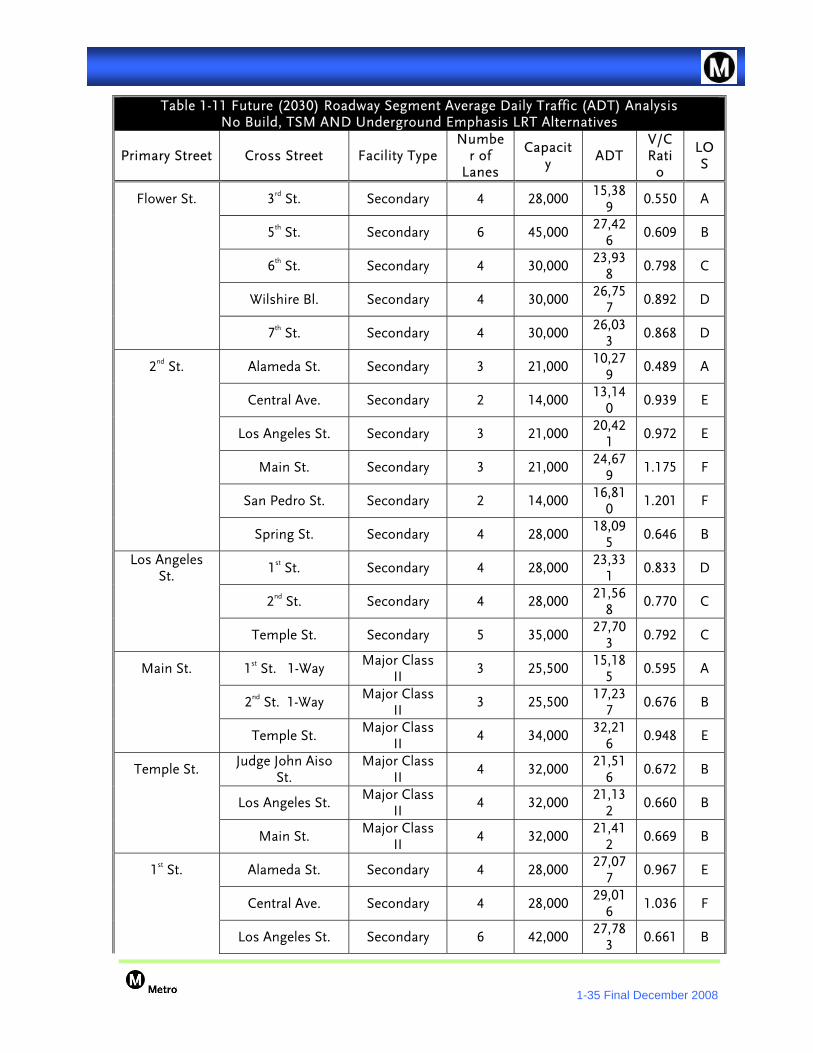
Based on the future daily and peak hour traffic volumes that were developed, the future level of service at each key intersection and roadway segment location was calculated for the No Build, TSM and, build alternatives. In general, the difference in future traffic volumes between the No Build and TSM alternatives is minimal, and for purposes of this analysis, it is assumed that they will remain the same. For each build alternative, the traffic impacts were compared to the No Build and TSM alternatives. Vehicular circulation through the downtown area will be affected by the proposed project, but the level of impact will depend on the alternative alignment being evaluated, as noted in the following sections.
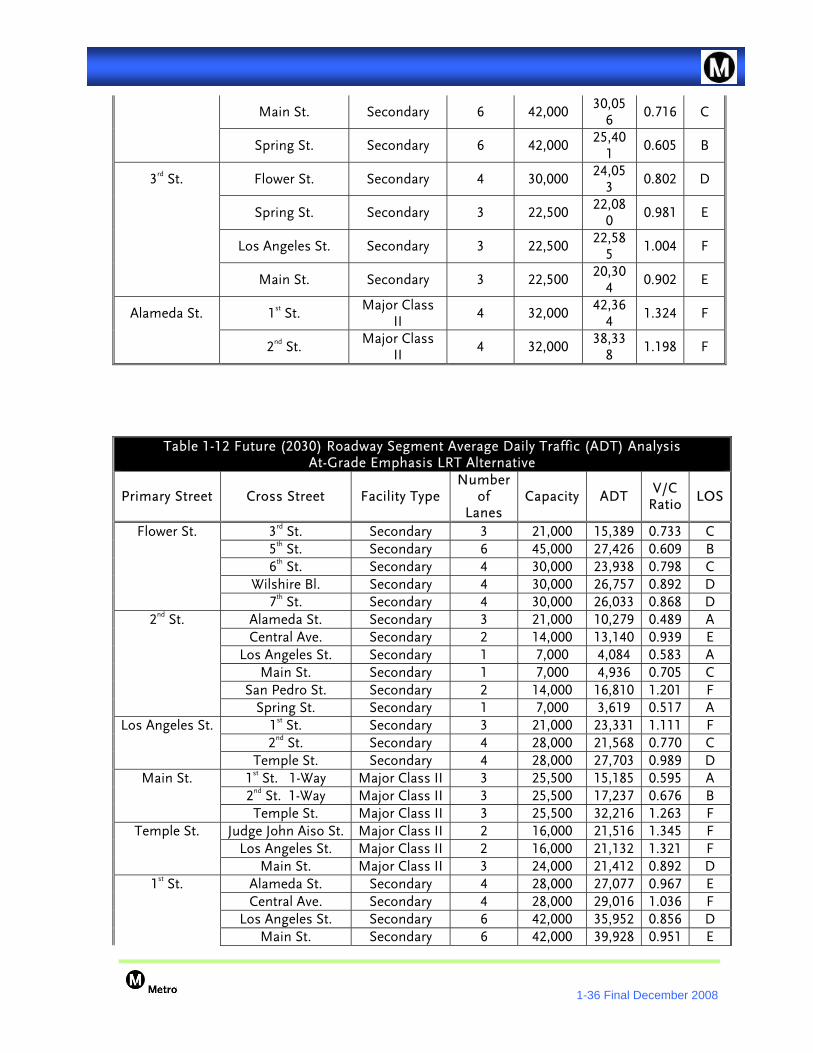
At-Grade Emphasis LRT Alternative For the at-grade segments of the At-Grade Emphasis LRT Alternative, the two LRT tracks will typically occupy a 26-foot wide surface right-of-way bordered by mountable curbs. It is expected that this width will increase to 39 feet at center platform station locations. Vehicular and pedestrian crossings would be limited to traffic signal-controlled intersections, with the signal phasing modified to provide adequate green time for the LRT vehicles to safely cross. For safety reasons, no uncontrolled mid-block vehicular crossings of the tracks would be permitted. Access to existing parking structures, parking lots, loading docks and commercial frontage will be affected by the at-grade LRT facilities. Left-turn parking access and egress is presently allowed at many downtown sites. However, the at-grade LRT facilities will eliminate uncontrolled mid-block left-turns, and thus modify existing approach and departure traffic patterns.
The proposed At-Grade Emphasis LRT alignment travels at grade along 2nd St., and it is assumed that this street would be dedicated as a transit-only roadway between the tunnel and Los Angeles St. This segment of 2nd St. would be closed to through traffic and provide only emergency vehicle access and local access to adjacent properties. As a result of this proposed change in street circulation, through traffic currently using 2nd St. would be diverted to parallel roadways such as 1st and 3rd Sts. East of Los Angeles St.; 2nd St. would maintain its current physical features and operating characteristics. The one-way transit couplet near City Hall along Main and Los Angeles Sts. between 2nd and Temple Sts. would consist of a single LRT track along each roadway. Both Main and Los Angeles Sts. are wide enough to accommodate a single track and maintain acceptable vehicular operations. The curb-to-curb width of Temple St., between Main and Alameda Sts., is 62 to 71 feet, leaving one lane of traffic in each direction with potentially mountable curbs for
1-31 Final December 2008
use by emergency vehicles. Traffic operations along this segment of Temple St. will be affected by the lane reduction.
To minimize conflicts between rail, vehicular, and pedestrian traffic, and to minimize delays at the intersection of Temple and Alameda Sts., a vehicular underpass and a pedestrian overpass are proposed along Alameda Str. to route the through traffic beneath the rail tracks and Temple St. traffic. Temple St. and the rail tracks would remain at grade and the existing at-grade segment of Alameda St. would be lowered to pass under Temple St. Through traffic traveling north and south on Alameda St. would operate unimpeded without being stopped or delayed at the intersection. Through traffic traveling east and west on Temple St. would continue to operate at grade with a signal to control the movements between the vehicular and rail modes of transportation. In addition, a one-lane southbound at-grade frontage road would be provided along Alameda St. to maintain access to the businesses and properties on the west side of the street.
Underground Emphasis LRT Alternative The Underground Emphasis LRT Alternative alignment does not affect surface traffic except at the intersection of Alameda and 1st Sts., where the LRT alignment operates in an at-grade configuration. Consequently, vehicular circulation patterns along downtown streets adjacent to most of the alignment will continue to operate at current traffic flow patterns. The future roadway levels of service for this alternative will be the same as the No Build and TSM alternatives except at the intersection of Alameda and 1st St., where a vehicular underpass and pedestrian overpass are proposed to separate the heavy traffic volumes along Alameda St. from rail traffic to minimize delays. The proposed underpass would result in uninterrupted flow along Alameda St. in the north and south directions between 2nd and Temple Sts. Through traffic traveling east and west on 1st St. would continue to operate at grade with a signal to control the movements between the vehicular and rail modes of transportation. In addition, at-grade frontage roads would be provided along on both sides of Alameda St. south of the intersection, and on the southbound side of the street north of the intersection to maintain access to adjacent businesses and properties. A full northbound frontage road is infeasible because of the location of the rail tracks and the Metro Gold Line Eastside Extension’s Little Tokyo/Arts District Station on the east side of Alameda St.
The results of the future LOS analysis at the key intersections and roadway segments for the No Build, TSM and build alternatives are presented in the following tables. During the AM peak hour, five intersections operate at LOS E or F for the No Build, TSM and Underground Emphasis LRT Alternatives, while this number increases to seven the At-Grade Emphasis LRT Alternative. Similarly, during the PM peak hour, five intersections operate at LOS E or F for the No Build and TSM Alternatives, versus only four for the Underground Emphasis LRT Alternative and 13 for the At-Grade Emphasis LRT Alternative. The roadway segment analysis provides similar results, with 12 segments operating at LOS E or F for the No Build, TSM and Underground Emphasis LRT Alternatives, and 14 for the At-Grade Emphasis LRT Alternative. It should be noted that the No Build, TSM and Underground Emphasis LRT Alternatives have six of the 12 locations operating at LOS F while the At-Grade Emphasis LRT Alternative has 11 of the 14 locations operating at LOS F.
1-32 Final December 2008
Table 1-9 Future (2030) Intersection Level of Service AM Peak Hour
Intersection No Build TSM Couplet A Couplet B
Underground
V/C LOS V/C LOS V/C LOS
V/C LOS
V/C LOS
Hill St. / 1st St. 0.76
C 0.76
C 0.76
C 0.76
C 0.76 C
Broadway / 1st St. 0.78
C 0.78
C 0.87
D 0.87
D 0.78 C
Spring St. / 1st St. 0.67
B 0.67
B 0.81
D 0.81
D 0.67 B
Main St. / 1st St. 0.54
A 0.54
A 0.69
B 0.69
B 0.54 A
Los Angeles St. / 1st St. 0.66
B 0.66
B 0.71
C 0.71
C 0.66 B
Judge John Aiso St. / 1st St. 0.74
C 0.74
C 0.80
C 0.80
C 0.74 C
Alameda St. / 1st St. 1.36
F 1.36
F 1.36
F 1.36
F 0.96 E
Broadway / 2nd St. 1.05
F 1.05
F 0.82
D 0.82
D 1.05 F
Spring St. / 2nd St. 0.59
A 0.59
A 0.54
A 0.54
A 0.59 A
Main St. / 2nd St. 0.36
A 0.36
A 0.53
A 0.53
A 0.36 A
Los Angeles St. / 2nd St. 0.57
A 0.57
A 0.71
C 0.71
C 0.57 A
San Pedro St. / 2nd St. 0.50
A 0.50
A 0.38
A 0.38
A 0.50 A
Central Ave. / 2nd St. 0.48
A 0.48
A 0.48
A 0.48
A 0.48 A
Alameda St. / 2nd St. 0.91
E 0.91
E 0.91
E 0.91
E 0.91 E
Broadway / 3rd St. 0.90
D 0.90
D 1.20
F 1.20
F 0.90 D
Spring St. / 3rd St. 0.73
C 0.73
C 0.83
D 0.83
D 0.73 C
Main St. / 3rd St. 0.66
B 0.66
B 0.81
D 0.81
D 0.66 B
Los Angeles St. / 3rd St. 0.82
D 0.82
D 0.90
D 0.90
D 0.82 D
San Pedro St. / 3rd St. 0.78
C 0.78
C 0.84
D 0.84
D 0.78 C
Central Ave. / 3rd St. 0.72
C 0.72
C 0.72
C 0.72
C 0.72 C
Alameda St. / 3rd St. 1.04
F 1.04
F 1.04
F 1.04
F 1.04 F
Figueroa St. / 3rd St. 0.8 C 0.8 C 0.8 C 0.8 C 0.80 C
1-33 Final December 2008
0 0 0 0
Hope St. / Temple St. 0.98
E 0.98
E 0.98
E 0.98
E 0.98 E
Grand Ave. / Temple St. 0.76
C 0.76
C 0.76
C 0.76
C 0.76 C
Broadway / Temple St. N/A
N/A N/A
N/A N/A
N/A
N/A
N/A
N/A N/A
Spring St. / Temple St. 0.67
B 0.67
B 0.67
B 0.67
B 0.67 B
Main St. / Temple St. 0.44
A 0.44
A 0.50
A 0.50
A 0.44 A
Los Angeles St. / Temple St. 0.68
B 0.68
B 1.00
E 1.00
E 0.68 B
Judge John Aiso St. / Temple St.
0.44
A 0.44
A 0.86
D 0.86
D 0.44 A
Alameda St. / Temple St. 0.79
C 0.79
C 1.12
F 1.12
F 0.79 C
LOS E Intersections 2 2 3 3 3
LOS F Intersections 3 3 4 4 2
Table 1-10 Future (2030) Intersection Level of Service PM Peak Hour
Intersection No Build TSM Couplet A Couplet B
Underground
V/C LOS V/C
LOS V/C
LOS V/C
LOS V/C LOS
Hill St. / 1st St. 0.91
E 0.91
E 0.91
E 0.91
E 0.91 E
Broadway / 1st St. 0.70
B 0.70
B 0.78
C 0.78
C 0.70 B
Spring St. / 1st St. 0.56
A 0.56
A 0.62
B 0.62
B 0.56 A
Main St. / 1st St. 0.67
B 0.67
B 0.91
E 0.91
E 0.67 B
Los Angeles St. / 1st St. 0.71
C 0.71
C 0.88
D 0.88
D 0.71 C
Judge John Aiso St. / 1st St. 0.85
D 0.85
D 1.06
F 1.06
F 0.85 D
Alameda St. / 1st St. 1.10
F 1.10
F 1.10
F 1.10
F 0.87 D
Broadway / 2nd St. 0.57
A 0.57
A 0.54
A 0.54
A 0.57 A
Spring St. / 2nd St. 0.49
A 0.49
A 0.44
A 0.44
A 0.49 A
Main St. / 2nd St. 0.77
C 0.77
C 0.85
D 0.85
D 0.77 C
1-34 Final December 2008
Los Angeles St. / 2nd St. 0.73
C 0.73
C 0.82
D 0.82
D 0.73 C
San Pedro St. / 2nd St. 0.75
C 0.75
C 0.59
A 0.59
A 0.75 C
Central Ave. / 2nd St. 0.67
B 0.67
B 0.67
B 0.67
B 0.67 B
Alameda St. / 2nd St. 0.89
D 0.89
D 0.89
D 0.89
D 0.89 D
Broadway / 3rd St. 0.74
C 0.74
C 0.92
E 0.92
E 0.74 C
Spring St. / 3rd St. 0.67
B 0.67
B 0.82
D 0.82
D 0.67 B
Main St. / 3rd St. 0.90
D 0.90
D 1.04
F 1.04
F 0.90 D
Los Angeles St. / 3rd St. 0.70
B 0.70
B 0.74
C 0.74
C 0.70 B
San Pedro St. / 3rd St. 0.54
A 0.54
A 0.62
B 0.62
B 0.54 A
Central Ave. / 3rd St. 0.51
A 0.51
A 0.51
A 0.51
A 0.51 A
Alameda St. / 3rd St. 0.70
B 0.70
B 0.70
B 0.70
B 0.70 B
Figueroa St. / 3rd St. 1.22
F 1.22
F 1.22
F 1.22
F 1.22 F
Hope St. / Temple St. 0.96
E 0.96
E 0.96
E 0.96
E 0.96 E
Grand Ave. / Temple St. 0.87
D 0.87
D 0.87
D 0.87
D 0.87 D
Broadway / Temple St. 0.92
E 0.92
E 0.92
E 0.92
E 0.92 E
Spring St. / Temple St. 0.51
A 0.51
A 0.51
A 0.51
A 0.51 A
Main St. / Temple St. 0.85
D 0.85
D 1.00
E 1.00
E 0.85 D
Los Angeles St. / Temple St. 0.77
C 0.77
C 1.34
F 1.34
F 0.77 C
Judge John Aiso St. / Temple St.
0.61
B 0.61
B 0.93
E 0.93
E 0.61 B
Alameda St. / Temple St. 0.80
C 0.80
C 1.04
F 1.04
F 0.80 C
LOS E Intersections 3 3 7 7 3
LOS F Intersections 2 2 6 6 1
Roadway Segments with LOS E = 6 Roadway Segments with LOS F = 6 Total of LOS E & F =12
1-35 Final December 2008
Table 1-11 Future (2030) Roadway Segment Average Daily Traffic (ADT) Analysis No Build, TSM AND Underground Emphasis LRT Alternatives
Primary Street Cross Street Facility Type Numbe
r of Lanes
Capacity
ADT V/C Rati
o
LOS
Flower St. 3rd St. Secondary 4 28,000 15,38
9 0.550 A
5th St. Secondary 6 45,000 27,42
6 0.609 B
6th St. Secondary 4 30,000 23,93
8 0.798 C
Wilshire Bl. Secondary 4 30,000 26,75
7 0.892 D
7th St. Secondary 4 30,000 26,03
3 0.868 D
2nd St. Alameda St. Secondary 3 21,000 10,27
9 0.489 A
Central Ave. Secondary 2 14,000 13,14
0 0.939 E
Los Angeles St. Secondary 3 21,000 20,42
1 0.972 E
Main St. Secondary 3 21,000 24,67
9 1.175 F
San Pedro St. Secondary 2 14,000 16,81
0 1.201 F
Spring St. Secondary 4 28,000 18,09
5 0.646 B
Los Angeles St.
1st St. Secondary 4 28,000 23,33
1 0.833 D
2nd St. Secondary 4 28,000 21,56
8 0.770 C
Temple St. Secondary 5 35,000 27,70
3 0.792 C
Main St. 1st St. 1-Way Major Class
II 3 25,500
15,185
0.595 A
2nd St. 1-Way Major Class
II 3 25,500
17,237
0.676 B
Temple St. Major Class
II 4 34,000
32,216
0.948 E
Temple St. Judge John Aiso
St. Major Class
II 4 32,000
21,516
0.672 B
Los Angeles St. Major Class
II 4 32,000
21,132
0.660 B
Main St. Major Class
II 4 32,000
21,412
0.669 B
1st St. Alameda St. Secondary 4 28,000 27,07
7 0.967 E
Central Ave. Secondary 4 28,000 29,01
6 1.036 F
Los Angeles St. Secondary 6 42,000 27,78
3 0.661 B
1-36 Final December 2008
Main St. Secondary 6 42,000 30,05
6 0.716 C
Spring St. Secondary 6 42,000 25,40
1 0.605 B
3rd St. Flower St. Secondary 4 30,000 24,05
3 0.802 D
Spring St. Secondary 3 22,500 22,08
0 0.981 E
Los Angeles St. Secondary 3 22,500 22,58
5 1.004 F
Main St. Secondary 3 22,500 20,30
4 0.902 E
Alameda St. 1st St. Major Class
II 4 32,000
42,364
1.324 F
2nd St. Major Class
II 4 32,000
38,338
1.198 F
Table 1-12 Future (2030) Roadway Segment Average Daily Traffic (ADT) Analysis At-Grade Emphasis LRT Alternative
Primary Street Cross Street Facility Type Number
of Lanes
Capacity ADT V/C
Ratio LOS
Flower St. 3rd St. Secondary 3 21,000 15,389 0.733 C 5th St. Secondary 6 45,000 27,426 0.609 B 6th St. Secondary 4 30,000 23,938 0.798 C Wilshire Bl. Secondary 4 30,000 26,757 0.892 D 7th St. Secondary 4 30,000 26,033 0.868 D
2nd St. Alameda St. Secondary 3 21,000 10,279 0.489 A Central Ave. Secondary 2 14,000 13,140 0.939 E Los Angeles St. Secondary 1 7,000 4,084 0.583 A Main St. Secondary 1 7,000 4,936 0.705 C San Pedro St. Secondary 2 14,000 16,810 1.201 F Spring St. Secondary 1 7,000 3,619 0.517 A
Los Angeles St. 1st St. Secondary 3 21,000 23,331 1.111 F 2nd St. Secondary 4 28,000 21,568 0.770 C Temple St. Secondary 4 28,000 27,703 0.989 D
Main St. 1st St. 1-Way Major Class II 3 25,500 15,185 0.595 A 2nd St. 1-Way Major Class II 3 25,500 17,237 0.676 B Temple St. Major Class II 3 25,500 32,216 1.263 F
Temple St. Judge John Aiso St. Major Class II 2 16,000 21,516 1.345 F Los Angeles St. Major Class II 2 16,000 21,132 1.321 F Main St. Major Class II 3 24,000 21,412 0.892 D
1st St. Alameda St. Secondary 4 28,000 27,077 0.967 E Central Ave. Secondary 4 28,000 29,016 1.036 F Los Angeles St. Secondary 6 42,000 35,952 0.856 D Main St. Secondary 6 42,000 39,928 0.951 E
1-37 Final December 2008
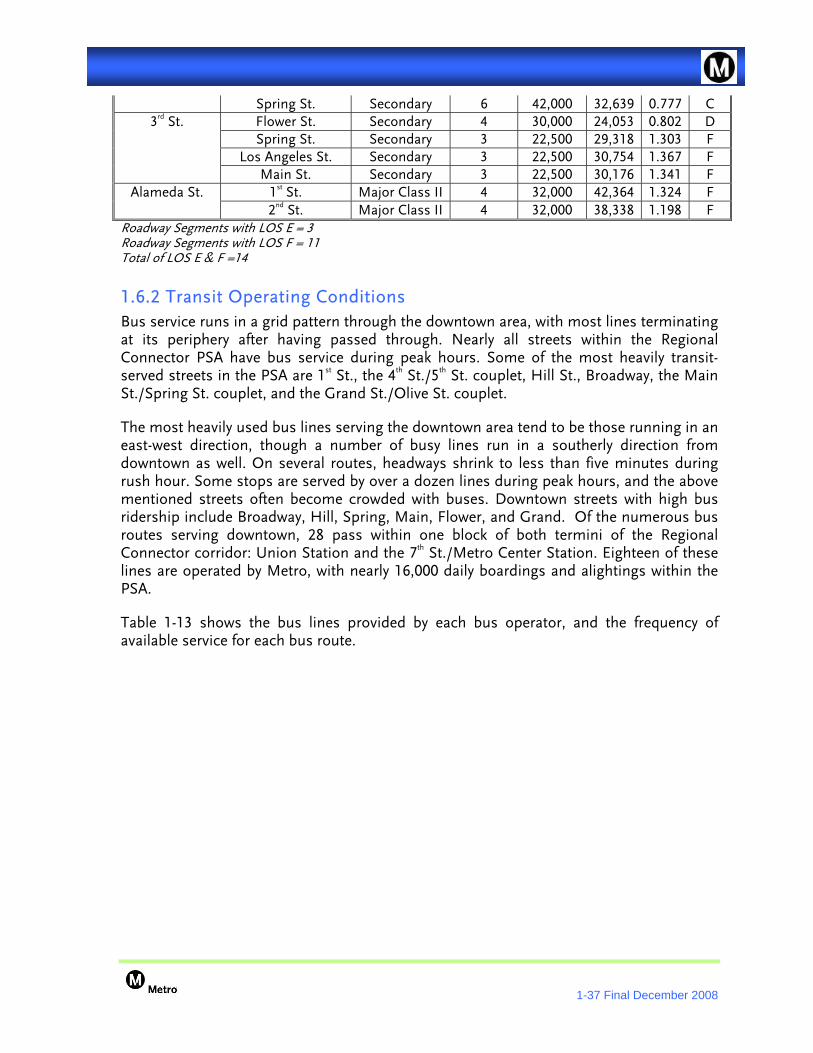
Roadway Segments with LOS E = 3 Roadway Segments with LOS F = 11 Total of LOS E & F =14 1.6.2 Transit Operating Conditions Bus service runs in a grid pattern through the downtown area, with most lines terminating at its periphery after having passed through. Nearly all streets within the Regional Connector PSA have bus service during peak hours. Some of the most heavily transit-served streets in the PSA are 1st St., the 4th St./5th St. couplet, Hill St., Broadway, the Main St./Spring St. couplet, and the Grand St./Olive St. couplet.
The most heavily used bus lines serving the downtown area tend to be those running in an east-west direction, though a number of busy lines run in a southerly direction from downtown as well. On several routes, headways shrink to less than five minutes during rush hour. Some stops are served by over a dozen lines during peak hours, and the above mentioned streets often become crowded with buses. Downtown streets with high bus ridership include Broadway, Hill, Spring, Main, Flower, and Grand. Of the numerous bus routes serving downtown, 28 pass within one block of both termini of the Regional Connector corridor: Union Station and the 7th St./Metro Center Station. Eighteen of these lines are operated by Metro, with nearly 16,000 daily boardings and alightings within the PSA.
Table 1-13 shows the bus lines provided by each bus operator, and the frequency of available service for each bus route.
Spring St. Secondary 6 42,000 32,639 0.777 C 3rd St. Flower St. Secondary 4 30,000 24,053 0.802 D
Spring St. Secondary 3 22,500 29,318 1.303 F Los Angeles St. Secondary 3 22,500 30,754 1.367 F Main St. Secondary 3 22,500 30,176 1.341 F
Alameda St. 1st St. Major Class II 4 32,000 42,364 1.324 F 2nd St. Major Class II 4 32,000 38,338 1.198 F
1-38 Final December 2008
Table 1-13 Bus Transit Routes and Frequency of Bus Service in Project Study Area
Operator Line Mode Weekday Hours
of Operation Peak Hour Frequency Route Description
AVTA 785 Freeway Express Bus
4AM-6AM, 3PM-6PM 20 mins Palmdale/Lancaster
BBB 10 Express Freeway Express Bus 6AM-8PM 15 mins Santa Monica
Gardena 1 Freeway Express Bus 5AM-12AM 15 mins Gardena/Lawndale
Foothill 481 Freeway Express Bus
6AM-9AM, 3PM-6PM 20 mins El Monte/Wilshire Center
Foothill 493 Freeway Express Bus
5AM-8AM, 2PM-8PM 10 mins Pomona/Phillips Ranch
Foothill 497 Freeway Express Bus
5AM-8AM, 2PM-7PM 12 mins Chino
Foothill 498 Freeway Express Bus
5AM-8AM, 2PM-7PM 7 mins Covina/Azusa
Foothill 499 Freeway Express Bus
5AM-8AM, 2PM-7PM 12 mins San Dimas
Foothill 699 Freeway Express Bus
4AM-8AM. 2PM-7PM 9-12 mins Montclair
Foothill Silver Streak Freeway Express Bus 24 Hours 10 mins Montclair
LADOT CE 409 Freeway Express Bus
6AM-9AM, 4PM-6PM 15 mins Sylmar/Sunland/Tujunga/Montrose/Glendale
LADOT CE 413 Freeway Express Bus
7AM-9AM, 4PM-6PM 25 mins Van Nuys/North Hollywood/Burbank
LADOT CE 419 Freeway Express Bus
7AM-9AM, 4PM-7PM 15 mins Chatsworth/Northridge/Granada Hills/Mission Hills
LADOT CE 422 Freeway Express Bus
5AM-9AM, 4PM-8PM 8 mins
Hollywood/San Fernando Valley/Agoura Hills/Thousand Oaks
LADOT CE 423 Freeway Express Bus
7AM-9AM, 4PM-7PM 15 mins
Encino/Woodland Hills/Agoura Hills/Thousand Oaks/Newbury Park
LADOT CE 430 Freeway Express Bus
6AM-7AM, 5PM-6PM 30-50 mins Brentwood/Pacific Palisades
LADOT CE 431 Freeway Express Bus
7AM-9AM, 5PM-6PM 30 mins Westwood/Rancho Park/Palms
LADOT CE 437 Freeway Express Bus
7AM-9AM, 4PM-6PM 15-30 mins Venice/Marina del Rey/Culver City
1-39 Final December 2008
Operator Line Mode Weekday Hours
of Operation Peak Hour Frequency Route Description
LADOT CE 438 Freeway Express Bus
7AM-9AM, 4PM-6PM 15 mins
Redondo Beach/Hermosa Beach/Manhattan Beach/El Segundo
LADOT CE 448 Freeway Express Bus
7AM-9AM, 4PM-6PM 15 mins
Rancho Palos Verdes/Torrance/Lomita/Wilmington Harbor City
LADOT CE 534 Freeway Express Bus
7AM-8AM, 4PM-5PM 30 mins Century City/Westwood
LADOT DASH A Circulator Bus 7AM-7PM 7 mins Little Tokyo/City West LADOT DASH B Circulator Bus 6AM-7PM 8 mins Chinatown/Financial District LADOT DASH C Circulator Bus 7AM-7PM 7 mins Financial District/South Park LADOT DASH D Circulator Bus 6AM-7PM 5 mins Union Station/South Park LADOT DASH E Circulator Bus 7AM-7PM 5 mins City West/Fashion District LADOT DASH F Circulator Bus 7AM-7PM 10 mins Financial District/Exposition LADOT DASH CH Circulator Bus 6AM-6PM 6 mins City Hall Shuttle LADOT DASH DD Circulator Bus Weekend Only 20 mins Downtown Discovery
LADOT DASH MBH Circulator Bus 7AM-9AM, 3PM-6PM 10 mins Metrolink/Bunker Hill
Metro 2/302 Local/Limited Stop Bus 24 Hours 5 mins Pacific Palisades via Sunset Bl.
Metro 4 Local Bus 24 Hours 7 mins Santa Monica via Santa Monica Bl. Metro 10 Local Bus 5AM-12AM 7 mins West Hollywood via Temple St. and Melrose Av. Metro 14/37 Local Bus 24 Hours 10 mins Beverly Hills via Beverly Bl./West LA via Adams Bl.
Metro 16/316 Local/Limited Stop Bus 4AM-1AM 3 mins Century City via 3rd St.
Metro 18 Local Bus 24 Hours 3 mins Wilshire Center - Montebello via 6th St. and Whittier Bl. Metro 20 Local Bus 24 Hours 4 mins Santa Monica via Wilshire Bl.
Metro 26/51/52/352 Local/Limited Stop Bus 24 Hours 4 mins Hollywood - Compton - Artesia Blue Line via Avalon Bl.
Metro 28 Local Bus 5AM-1AM 8 mins Century City via Olympic Blvd.
Metro 30/31/330 Local/Limited Stop Bus 24 Hours 4 mins Pico-Rimpau - Monterey Park via Pico Bl and E 1st St.
Metro 33/333 Local/Limited Stop Bus 24 Hours 2 mins Santa Monica via Venice Bl.
Metro 38 Local Bus 24 Hours 8 mins Fairfax and Washington via Jefferson Bl.
Metro 40 Local Bus 24 Hours 6 mins South Bay Galleria via Hawthorne Bl., Crenshaw Bl., and MLK Bl.
Metro 42/42A Local Bus 5AM-12AM 12 mins LAX via MLK Bl., Stocker St., and La Tijera Bl.
1-40 Final December 2008
Operator Line Mode Weekday Hours
of Operation Peak Hour Frequency Route Description
Metro 45 Local Bus 24 Hours 6 mins Montecito Heights - Rosewood via Broadway and Mercury Av.
Metro 48 Local Bus 5AM-11PM 7 mins Avalon Green Line via Main St. and S. San Pedro St.
Metro 53/350 Local/Limited Stop Bus 24 Hours 5 mins Carson via Central Av.
Metro 55/355 Local/Limited Stop Bus 24 Hours 4 mins Imperial Blue/Green Line via Compton Av.
Metro 60 Local Bus 24 Hours 6 mins Artesia Blue Line via Long Beach Bl. Metro 62 Local Bus 5AM-11PM 15 mins Hawaiian Gardens via Telegraph Rd.
Metro 66/366 Local/Limited Stop Bus 4AM-1AM 2 mins Wilshire Center - Montebello via 8th St. and Olympic Bl.
Metro 68/84 Local Bus 24 Hours 8 mins West LA - Montebello via Washington Bl. and Cesar Chavez Av.
Metro 70/71/370 Local/Limited Stop Bus 24 Hours 5-9 mins El Monte via Garvey Av.
Metro 76/376 Local/Limited Stop Bus 24 Hours 10 mins Arcadia via Valley Bl., Huntington Dr. and Las Tunas Dr.
Metro 78/79/378 Local/Limited Stop Bus 5AM-1AM 10 mins Arcadia via Huntington Dr. and Las Tunas Dr.
Metro 81/381 Local/Limited Stop Bus 5AM-1AM 5 mins Eagle Rock - Exposition Park via Figueroa St.
Metro 83 Local Bus 24 Hours 10 mins Eagle Rock via York Av. Metro 90/91 Local Bus 5AM-12AM 10 mins Sunland via Foothill Bl., Cañada Bl., and Glendale Av. Metro 92 Local Bus 24 Hours 12 mins Burbank via Glendale
Metro 94/394 Local/Limited Stop Bus 5AM-1AM 5 mins Sylmar via San Fernando Rd. and Spring St.
Metro 96 Local Bus 5AM-8PM 20 mins Sherman Oaks via Griffith Park Dr. and Riverside Dr.
Metro 439 Freeway Express Bus 5AM-9PM 40-60 mins Aviation Green Line via Culver City
Metro 442 Freeway Express Bus
6AM-8AM, 4PM-6PM 30 mins
Hawthorne via Harbor Transitway, Manchester Bl., and La Brea Av.
Metro 444 Freeway Express Bus 5AM-8PM 10-20 mins
Rancho Palos Verdes via Harbor Transitway and Hawthorne Bl.
Metro 445 Freeway Express Bus 5AM-7PM 30 mins San Pedro via Harbor Transitway, 1st St., and Pacific Av.
Metro 446/447 Freeway Express Bus 5AM-12AM 15 mins
San Pedro via Harbor Transitway, Avalon Bl., and Pacific Av.
1-41 Final December 2008
Operator Line Mode Weekday Hours
of Operation Peak Hour Frequency Route Description
Metro 450X Freeway Express Bus
6AM-9AM, 4PM-6PM 15 mins South Bay Express via Harbor Transitway
Metro 460 Freeway Express Bus 5AM-12AM 30 mins Disneyland via Harbor Transitway, I-105, and I-5
Metro 484 Freeway Express Bus 5AM-12AM 5 mins Pomona via El Monte Busway and Valley Bl.
Metro 485 Freeway Express Bus 5AM-12AM 20 mins Altadena via El Monte Busway, Oak Knoll Av., and Lake Av.
Metro 487 Freeway Express Bus 6AM-9PM 30 mins Sierra Madre Villa Gold Line via El Monte Busway
Metro 489 Freeway Express Bus
6AM-8AM, 3PM-5PM 12 mins Temple City via El Monte Busway and Rosemead Bl.
Metro 490 Freeway Express Bus 5AM-11PM 10 mins Pomona via El Monte Busway and Ramona Bl.
Metro 704 Rapid Bus 6AM-8PM 8 mins Santa Monica Bl. Rapid
Metro 714 Rapid Bus 6AM-9AM, 3PM-6PM 15 mins Beverly Bl. Rapid
Metro 720 Rapid Bus 4AM-1AM 4 mins Wilshire Bl. - Whittier Bl. Rapid Metro 728 Rapid Bus 5AM-8PM 8 mins Olympic Bl. Rapid Metro 740 Rapid Bus 5AM-8PM 10 mins Hawthorne Bl. Rapid Metro 745 Rapid Bus 5AM-8PM 5 mins South Broadway Rapid Metro 760 Rapid Bus 5AM-8PM 8 mins Long Beach Bl. Rapid Metro 770 Rapid Bus 6AM-6PM 12 mins Garvey Av. - Cesar Chavez Av. Rapid
Metro 940 Rapid Express Bus 6AM-8AM, 4PM-6PM 30 mins Hawthorne Bl. Rapid Express
Metro Blue Line Light Rail 5AM-12AM 5 mins Long Beach via South Los Angeles, Willowbrook, and Compton
Metro Red Line Heavy Rail 5AM-12AM 5 mins Wilshire Center and North Hollywood Montebello 40 Local Bus 5AM-10PM 8 mins Montebello and Whittier via Beverly Bl. Montebello 50 Local Bus 5AM-12AM 30 mins Whittier and La Mirada via Washington Bl.
Montebello 341 Limited Stop Bus 7AM-9AM, 4PM-6PM 30 mins Montebello and Whittier via Beverly Bl.
Montebello 342 Limited Stop Bus 7AM, 5PM One Trip Montebello and Whittier via Beverly Bl.
Montebello 343 Limited Stop Bus 7AM-8AM, 5PM-6PM 30 mins Montebello and Whittier via Beverly Bl.
OCTA 701 Freeway Express Bus
5AM-6AM, 4PM-5PM 20 mins Huntington Beach
1-42 Final December 2008
Operator Line Mode Weekday Hours
of Operation Peak Hour Frequency Route Description
OCTA 721 Freeway Express Bus
6AM-9AM, 3PM-6PM 30 mins Fullerton
Santa Clarita 799 Freeway Express Bus
5AM-7AM, 3PM-7PM 20 mins Valencia/Santa Clarita
Torrance 1 Freeway Express Bus
6AM-9AM, 4PM-10PM 30 mins Torrance via Harbor Transitway and Artesia Transit Center
Torrance 2 Freeway Express Bus 7AM-7PM 60 mins Torrance via Harbor Transitway
Source: Antelope Valley Transit Authority, City of Santa Monica, Foothill Transit, City of Los Angeles Department of Transportation, Los Angeles County Metropolitan Transportation Authority, Montebello Bus Lines, Orange County Transportation Authority, Santa Clarita Transit, Torrance Transit, 2007-2008
1-43 Final December 2008
The four busiest Metro bus lines serving the downtown area all originate in West Los Angeles or Santa Monica. The lines with the highest number of boardings within the Regional Connector PSA all service areas east and south of downtown. This establishes the Westside, the Eastside, and South Los Angeles as primary destinations for current bus passengers traveling in and out of the Regional Connector PSA. Other heavily used Metro bus lines run to destinations directly east and south of the downtown area (Table 1-14). Table 1-14 Metro Transit Ridership, Fiscal Year 2007
Line Direction Average Daily
Boardings within PSA Average Daily
Alightings within PSA Line Ridership
2/302 East 335 1825 25440
West 1779 609
4/304 East 238 1402 35170
West 1220 361
10 East 786 1624 15659
West 1736 979
14/37 North 909 882 20370
South 791 874
16/316 East 359 4594 30561
West 4302 333
18 East 2506 4847 27163
West 4001 2603
20 East 586 1627 20897
West 1630 323
26/51/52/352 East 3214 3177 29036
West 2314 2818
28/328 North 2148 2075 31916
South 1263 1721
30/31/330 East 2548 2514 28238
West 2435 1915
33/333 East 268 1072 26199
West 1051 290
38/71 East 532 527 10510
West 546 734
40 North 511 1790 20645
South 2033 465
42/42A North 296 819 4982
South 807 223
45/46 North 1394 2041 21558
South 2537 1377
53/350 North 763 2503 14668
South 2590 684
55/355 North 69 821 12571
South 919 88
60 North 2678 5526 30509
South 5985 2913
62 East 732 168 4354
1-44 Final December 2008
Line Direction Average Daily
Boardings within PSA Average Daily
Alightings within PSA Line Ridership
West 298 875
66/366 East 2221 2692 27336
West 2450 2374
68/368 North 1512 1121 23393
South 1293 1393
70/370 East 1200 169 15569
West 130 1081
76/376 East 1011 139 11106
West 97 877
78/79/378 East 1277 153 11868
West 128 1254
81/381 North 1763 1037 20006
South 1379 2387
90 North 1035 124 7387
South 69 1009
92 North 897 127 8864
South 79 955
94/394 North 1910 250 13287
South 127 1571
96 North 288 55 3407
South 55 342
439 North 15 112 946
South 126 20
442 North 2 59 249
South 54 7
444 North 22 295 3132
South 263 79
445 North 13 230 1243
South 197 38
446/447 North 19 242 4373
South 270 55
450X Clockwise 166 168 619
460 East 445 27 3630
West 11 437
484 East 1375 45 8914
West 18 1290
485 North 423 17 3683
South 8 572
487 East 392 25 2985
West 18 394
489 North 114 5 584
South 8 245
490 East 625 16 5568
West 6 763
714 East 5 163 1860
1-45 Final December 2008
Line Direction Average Daily
Boardings within PSA Average Daily
Alightings within PSA Line Ridership
West 156 15
720 East 2020 2896 46351
West 3360 2388
740 North 104 1040 9182
South 1227 130
745 North 210 2135 8632
South 2121 239
TOTAL 91823 93276 654620
TOTAL BOARDINGS AND ALIGHTINGS IN PSA 185099
Source: Los Angeles County Metropolitan Transportation Authority, 2007
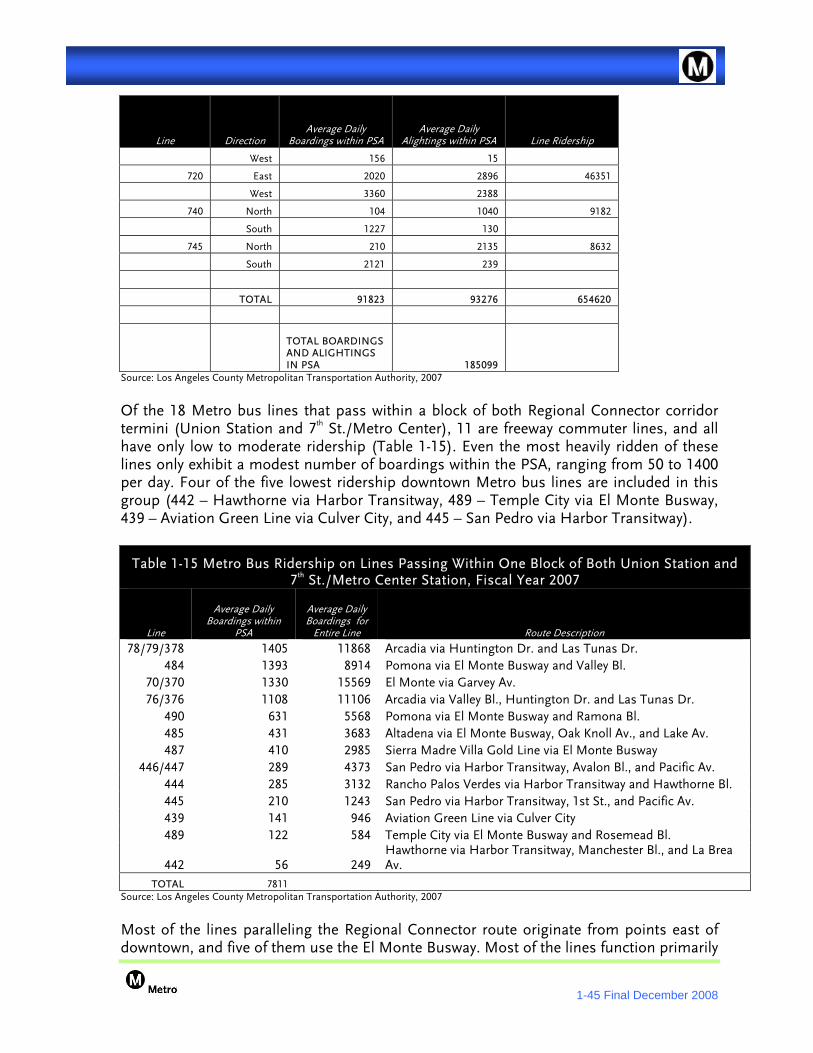
Of the 18 Metro bus lines that pass within a block of both Regional Connector corridor termini (Union Station and 7th St./Metro Center), 11 are freeway commuter lines, and all have only low to moderate ridership (Table 1-15). Even the most heavily ridden of these lines only exhibit a modest number of boardings within the PSA, ranging from 50 to 1400 per day. Four of the five lowest ridership downtown Metro bus lines are included in this group (442 – Hawthorne via Harbor Transitway, 489 – Temple City via El Monte Busway, 439 – Aviation Green Line via Culver City, and 445 – San Pedro via Harbor Transitway).
Table 1-15 Metro Bus Ridership on Lines Passing Within One Block of Both Union Station and 7th St./Metro Center Station, Fiscal Year 2007
Line
Average Daily Boardings within
PSA
Average Daily Boardings for
Entire Line Route Description
78/79/378 1405 11868 Arcadia via Huntington Dr. and Las Tunas Dr. 484 1393 8914 Pomona via El Monte Busway and Valley Bl.
70/370 1330 15569 El Monte via Garvey Av. 76/376 1108 11106 Arcadia via Valley Bl., Huntington Dr. and Las Tunas Dr.
490 631 5568 Pomona via El Monte Busway and Ramona Bl. 485 431 3683 Altadena via El Monte Busway, Oak Knoll Av., and Lake Av. 487 410 2985 Sierra Madre Villa Gold Line via El Monte Busway
446/447 289 4373 San Pedro via Harbor Transitway, Avalon Bl., and Pacific Av. 444 285 3132 Rancho Palos Verdes via Harbor Transitway and Hawthorne Bl. 445 210 1243 San Pedro via Harbor Transitway, 1st St., and Pacific Av. 439 141 946 Aviation Green Line via Culver City 489 122 584 Temple City via El Monte Busway and Rosemead Bl.
442 56 249 Hawthorne via Harbor Transitway, Manchester Bl., and La Brea Av.
TOTAL 7811 Source: Los Angeles County Metropolitan Transportation Authority, 2007
Most of the lines paralleling the Regional Connector route originate from points east of downtown, and five of them use the El Monte Busway. Most of the lines function primarily
1-46 Final December 2008
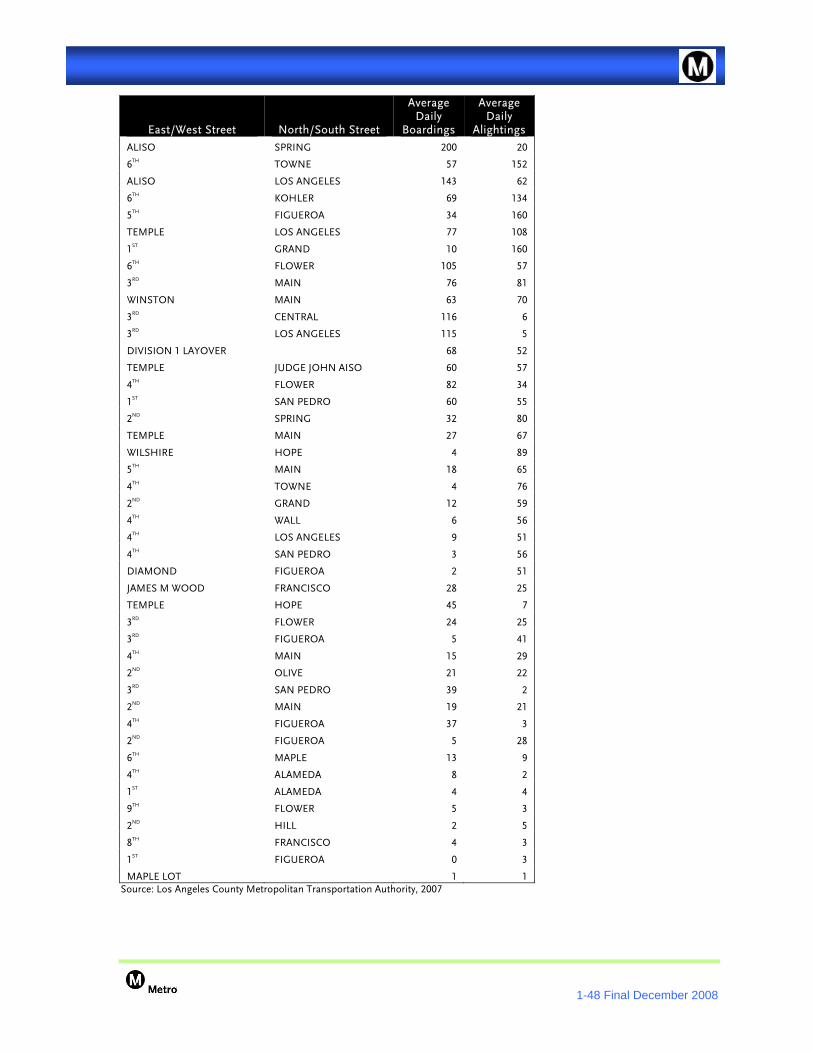
as peak hour commuter buses, and low ridership may be attributable to their lack of midday, night, and weekend service. Metro operates 125 bus stops within the Regional Connector PSA. The five busiest Metro bus stops, each with 3,800-7,200 daily boardings, are located along Hill St. and Broadway between 5th and 7th Sts. (Table 1-16). All of these stops are within ¼ mile of the existing Pershing Square station. If the Regional Connector stops near Broadway, Hill, and Spring Sts., it will enable transfers to the busiest north/south corridors in the area. Most of the other busy Metro bus stops are located in the Financial Core and Civic Center areas, both of which will be served by the Regional Connector. Additionally, other transit operators have bus stops within the PSA, though their ridership data is not reflected in these figures. Table 1-16 Average Daily Boardings and Alightings at Metro Bus Stops Within the Project Study Area, Fiscal Year 2007
East/West Street North/South Street
Average Daily
Boardings
Average Daily
Alightings
6TH BROADWAY 6,523 7,438
7TH BROADWAY 7,187 5,493
5TH BROADWAY 6,172 4,516
7TH HILL 3,804 4,425
5TH HILL 3,891 3,586
9TH BROADWAY 2,657 3,875
1ST HILL 2,242 3,078
5TH SPRING 2,801 2,275
5TH GRAND 2,028 2,574
6TH HILL 1,192 3,315
7TH FLOWER 3,075 1,244
7TH SPRING 2,101 2,117
6TH HOPE 1,613 2,502
1ST BROADWAY 1,973 2,141
8TH BROADWAY 2,365 1,623
7TH MAIN 1,932 2,038
8TH HILL 1,949 1,834
3RD BROADWAY 2,158 1,456
7TH OLIVE 2,175 1,138
4TH BROADWAY 1,420 1,311
5TH OLIVE 1,897 507
7TH SAN PEDRO 1,134 1,085
3RD HILL 885 1,311
TEMPLE BROADWAY 1,171 1,024
5TH LOS ANGELES 1,270 910
TEMPLE HILL 904 1,136
7TH GRAND 949 1,074
8TH HILL 853 1,170
TEMPLE SPRING 925 1,027
8TH SPRING 963 904
9TH MAIN 812 1,047
6TH MAIN 612 1,047
7TH HOPE 338 1,303
1-47 Final December 2008
East/West Street North/South Street
Average Daily
Boardings
Average Daily
Alightings
7TH ALAMEDA 740 853
1ST SPRING 808 769
6TH SPRING 773 736
6TH CENTRAL 786 703
7TH MAPLE 768 718
7TH FIGUEROA 335 1,104
7TH CENTRAL 690 713
6TH LOS ANGELES 480 822
5TH FLOWER 915 288
4TH HILL 643 434
5TH WALL 798 255
4TH SPRING 360 641
9TH HILL 341 615
7TH LOS ANGELES 521 413
8TH OLIVE 599 299
6TH GRAND 184 708
6TH SAN PEDRO 273 539
9TH OLIVE 319 479
6TH WALL 253 528
3RD GRAND 173 603
WILSHIRE FLOWER 381 361
9TH GRAND 293 396
6TH ALAMEDA 344 339
5TH SAN PEDRO 492 188
TEMPLE GRAND 107 522
GENERAL THADDEUS OLIVE 395 224
8TH FLOWER 361 256
1ST HOPE 344 265
8TH GRAND 335 272
1ST MAIN 248 356
3RD SPRING 291 298
WILSHIRE FIGUEROA 251 284
6TH GLADYS 112 361
8TH MAIN 141 306
1ST CENTRAL 199 234
7TH TOWNE 157 208
7TH CERES 58 292
1ST JUDGE JOHN AISO 190 148
9TH HOPE 136 198
7TH GLADYS 258 66
5TH CENTRAL 198 121
1ST OLIVE 269 39
8TH FIGUEROA 151 122
5TH TOWNE 212 60
1ST LOS ANGELES 85 167
9TH FIGUEROA 111 134
TEMPLE FIGUEROA 79 160
7TH FRANCISCO 99 129
1-48 Final December 2008
East/West Street North/South Street
Average Daily
Boardings
Average Daily
Alightings
ALISO SPRING 200 20
6TH TOWNE 57 152
ALISO LOS ANGELES 143 62
6TH KOHLER 69 134
5TH FIGUEROA 34 160
TEMPLE LOS ANGELES 77 108
1ST GRAND 10 160
6TH FLOWER 105 57
3RD MAIN 76 81
WINSTON MAIN 63 70
3RD CENTRAL 116 6
3RD LOS ANGELES 115 5
DIVISION 1 LAYOVER 68 52
TEMPLE JUDGE JOHN AISO 60 57
4TH FLOWER 82 34
1ST SAN PEDRO 60 55
2ND SPRING 32 80
TEMPLE MAIN 27 67
WILSHIRE HOPE 4 89
5TH MAIN 18 65
4TH TOWNE 4 76
2ND GRAND 12 59
4TH WALL 6 56
4TH LOS ANGELES 9 51
4TH SAN PEDRO 3 56
DIAMOND FIGUEROA 2 51
JAMES M WOOD FRANCISCO 28 25
TEMPLE HOPE 45 7
3RD FLOWER 24 25
3RD FIGUEROA 5 41
4TH MAIN 15 29
2ND OLIVE 21 22
3RD SAN PEDRO 39 2
2ND MAIN 19 21
4TH FIGUEROA 37 3
2ND FIGUEROA 5 28
6TH MAPLE 13 9
4TH ALAMEDA 8 2
1ST ALAMEDA 4 4
9TH FLOWER 5 3
2ND HILL 2 5
8TH FRANCISCO 4 3
1ST FIGUEROA 0 3
MAPLE LOT 1 1 Source: Los Angeles County Metropolitan Transportation Authority, 2007
1-49 Final December 2008
1.6.3 Regional Objectives SCAG is responsible for regional transportation planning for six counties within Southern California: Imperial, Los Angeles, Orange, Riverside, San Bernardino, and Ventura. In 2004, SCAG released Destination 2030, the Regional Transportation Plan (RTP) and a more updated version for 2008 entitled Making the Connections, was recently released in May 2008. The documents provide basic policy and program framework to improve the transportation system and integrate it with the best possible growth patterns for the region through 2030.
Destination 2030 is a performance based plan with the following goals: maximize mobility and accessibility, ensure safety and reliability, preserve our transportation system, maximize productivity of our system, protect the environment, and encourage land-use and growth patterns that complement our transportation system. SCAG developed performance indicators and measures to quantify the goals and evaluate progress towards achieving the goals. Table 1-17 lists the performance indicators, associated measures, and final projected outcomes. The outcomes are estimated for the Plan as a whole for 2030, and not for individual projects.
If no action is taken, the performance indicators in the region would worsen. SCAG estimates that daily vehicle miles in the region will increase from 361.5 million under the 2000 Base Year to 488.8 million under the 2030 Baseline. The average travel speed would reduce from 35.2 mph to 31.9 mph during this time period. Daily person hours of delay would increase from 2.2 million hours under the 2000 Base Year to 5.4 million hours under the 2030 Baseline. The average daily delay per capita would increase from 8.0 minutes under the 2000 Base Year to 14.2 minutes under the 2030 Baseline. The percentage of peak period evening work trips completed within 45 minutes for autos and transit would decrease from 88 percent and 33 percent under 2000 conditions to 83 percent and 29 percent under 2030 Baseline, respectively. The home to work travel times would increase from 21.6 minutes to 25.9 minutes.
The Regional Connector would contribute to alleviating the mobility problem in the region and to achieving the Destination 2030 goals. It would do this by extending the reach and connectivity of all but one of Metro’s operational and under-construction light rail lines, broadening the range of downtown destinations reachable with one transfer from the Metro Red and Metro Purple Lines, alleviating congestion on the downtown bus network, and increasing the availability of direct service to multiple destinations in Los Angeles County for passengers arriving on intercity services at Union Station. The proposed project offers a public transit connection that would improve mobility and accessibility in the region and provide commuters with a simplified and reliable transportation option. The area from which Regional Connector ridership is expected to be drawn includes several freeways and major intersections that have significant traffic congestion and long delays. The improved convenience of the Regional Connector would encourage use of a public transit alternative that would reduce daily vehicle trips, miles traveled, and congestion on the region’s roadways. The Regional Connector would augment public transportation service originating in areas with high population densities and households dependent on public transit; this would increase potential ridership, thereby increasing the project benefits and making it more cost-effective. In addition, the Regional
1-50 Final December 2008
Connector’s service area covers the county’s most highly-concentrated employment area and a major cultural, entertainment, and tourist destination.
Table 1-17 Performance Indicators, Measures, and Outcomes of Destination 2030 Goals
Performance Indicator
Performance Measure Plan 2030
Base Year 2000
Baseline 2030
Mobility Average Daily Speed (Miles per Hour) 35.2 35.9 31.9Average Daily Delay (Daily Person Hours in millions) 3.2 2.2 5.4
Accessibility Percent PM peak period work trips within 45 minutes of home
Productivity Roadway capacity – vehicles per hour/lane (Lost Lane Miles)
AM peak PM peak
377 302
332 266
N/A
Sustainability Total cost per capita to sustain current system performance
Plan 2030 estimates an additional cost of $20 per capita per year over base year
Preservation Maintenance cost per capita to preserve system at base year conditions (base year 2002, constant 2002 dollars)
~$80 ~$63 (2002) N/A
Environmental Emissions generated by travel (over Baseline 2030)
CO PM10 Exhaust PM10
Plan 2030 estimates: 6-8% reduction 6-8% reduction 8-11% reduction
Environmental Justice
Benefit vs. Burden by quintiles – Auto Percentage of Tax Paid and Time Savings (Quintile 1=lowest income, Quintile 5=highest income)
1 2 3 4 5
Plan 2030 estimates:
Expenditure Time Savings9%
13% 18% 24% 37%
6%14% 21% 29% 30%
Benefit vs. Burden by quintiles – Local Transit Percentage of Tax Paid and Time Savings (Quintile 1=lowest income, Quintile 5=highest income)
1 2 3 4 5
Plan 2030 estimates:Expenditure Time Savings
9% 13% 18% 24% 37%
23%30% 23% 16% 8%
Source: SCAG Destination 2030, 2004
1-51 Final December 2008
1.7 Project Purpose The purpose of this project is to improve the region’s public transit service and mobility by linking the light rail services of the Metro Gold Line, Metro Gold Line Eastside Extension, Metro Blue Line, and Metro Expo Line, thereby providing direct access to one of the region’s major employment centers. The Regional Connector will serve communities locally and across the region, allowing greater mobility and accessibility while accommodating a resurgent downtown Los Angeles. New stations will provide greater coverage of the downtown area, thus enhancing the convenience of the existing rail and bus system. Since the completion of studies on the Metro Blue Line to Pasadena performed in 1993 and 1994, the Metro Rail system has grown substantially, with rail lines in operation or under construction extending over 70 miles within Los Angeles County. Currently, the Metro Red and Metro Purple subway lines serve as an interim connection between the Metro Blue Line at 7th St./Metro Center and the Metro Gold Line at Union Station, but the transfers involved are time-consuming, contribute to crowding on the subway platforms and trains, and may dissuade passengers from riding.
1.8 Major Themes Supporting Transit Needs in the Study Area In evaluating the mobility problem and travel conditions within the Regional Connector PSA, several themes emerge which reinforce the need for transportation improvements. The following lists these themes, while subsequent sections address each in greater detail.
Need for Transit Improvements Based on Current and Future Transit Conditions
Transit Usage within the PSA
Significant Transit Dependent Populations
Regional Population and Employment Growth
Population and Employment Densities
Travel Demand Justifies Need for Transit Services
Local Land Use Policies and Guidelines that Support Transit
1.8.1 Need for Transit Improvements Based on Current and Future Transit Conditions
According to Metro’s 2004 Metro Rail Onboard Survey, 42% of Metro Gold Line riders indicated that they rode two trains on their one-way trips, and 7% rode three trains. Additionally, Sierra Madre Villa – 7th St./Metro Center and Lake – 7th St./Metro Center were among the most popular station pairs on the Metro Rail system according to this study (Table 1-18). Since Union Station is the only rail-to-rail transfer point on the Metro Gold Line, these results suggest that a large portion of Metro Gold Line riders are transferring to the Metro Red Line to complete their trips.
1-52 Final December 2008
Table 1-18 Train/Bus Use per Trip
All Lines Blue Red Green Gold
1 Train 53% 47% 60% 56% 49%
2 Trains 38% 44% 34% 31% 42%
3 Trains 7% 8% 4% 10% 7%
4 Trains 2% 1% 2% 2% 1%
1 Bus/Train 22% 16% 26% 20% 24%
2 Bus/Train 34% 34% 41% 26% 38%
3 Bus/Train 25% 28% 21% 29% 21%
4+ Bus/Train 19% 21% 13% 24% 17%
Source: 2004 Metro Rail Onboard Survey
Upon completion of the Metro Gold Line Eastside Extension, passengers bound for the PSA will generate significant additional Metro Red and Purple Line transfers at Union Station, as well as new bus and Metrolink transfers. Metro Red and Purple Line trains typically layover at Union Station with their doors open for several minutes before departing, so platform crowding should not be a significant issue on the subway platform because patrons will be able to board waiting trains immediately upon entering the station.
Crowding in the passageways and rail platforms may, however, become a significant issue at 7th St./Metro Center Station. Once in operation, Metro Expo Line trains from Culver City will share the existing Metro Blue Line terminal platforms, where trains already operate on five minute headways during peak hours. This could create rail congestion and rush hour delays at 7th St./Metro Center Station, where existing facilities to reverse light rail trains consist of scissors crossovers (diamond-shaped crossovers that allow trains to switch from one track to the other, but block all other train movements while doing so) at either end of the station. The Metro Blue Line boarding area consists of two side platforms, but typically only one of the platforms is used, and this currently contributes to passenger crowding at the station. Metro Red and Purple Line passengers wishing to use the Flower St. escalators must also share the crowded passageways leading to the Metro Blue Line platform.
The number of PSA-bound Metro Expo Line passengers transferring to the Metro Red and Purple Lines is likely to be relatively low, since the 7th St./Metro Center terminus is located within the Financial Core in the PSA. Nonetheless, Metro Expo Line passengers would add to the crowds on the existing Metro Blue Line platform, and transfers to the Metro Red and Purple Lines also contribute to crowding on the lower platform. In such crowded conditions, the ability to quickly evacuate the station in an emergency could be compromised.
The Regional Connector would eliminate many transfers and alleviate crowding at 7th St./Metro Center Station. In addition, it will reduce the number of transfers from the Metro Gold Line to the Metro Red and Purple Lines at Union Station by providing new
1-53 Final December 2008
single-vehicle LRT service through the downtown area. This will shorten walking distances and trip times for all rail passengers bound for the Bunker Hill area.
Many of the passengers traveling to the Financial District from East Los Angeles or Pasadena would likely stay on the Metro Gold Line trains and continue along the Regional Connector instead of transferring to the Metro Red Line at Union Station. However, the 2004 study indicates that relatively few Metro Gold Line riders currently continue beyond 7th St./Metro Center Station toward Long Beach on the Metro Blue Line. This could be due either to the inconvenience of making two transfers, or a potential lack of travel demand between Pasadena and Long Beach.
If one of the Regional Connector light rail alternatives is constructed, it would experience very frequent train traffic. However, the Regional Connector would eliminate the need to quickly turn trains at 7th St./Metro Center Station. Downtown-bound Metro Blue Line and Metro Expo Line trains will merge onto a single set of tracks at Washington Blvd. and Flower St. and travel along the existing Flower St. right-of-way to 7th St./Metro Center Station. Trains would then continue along the Regional Connector to Little Tokyo where the lines would again split, with Metro Blue Line trains continuing to Pasadena and Metro Expo Line trains traveling to East Los Angeles. If Long Beach-Pasadena service and East Los Angeles-Culver City service each operate with 5-minute peak hour headways, the Regional Connector tracks would see trains every 2 ½ minutes in each direction. This means that any at-grade intersections would see trains approximately every 75 seconds, or one to two trains per signal cycle.
Operationally, the Regional Connector would allow for more efficient train maintenance. Currently, there are no light rail tracks linking the Metro Gold Line and Metro Blue Line maintenance facilities. Because the Metro Gold Line has only a light-duty maintenance yard, trains must be loaded onto trucks and driven to the Metro Blue Line yard in Long Beach when they require major services. The Regional Connector would allow Metro Gold Line trains to simply deadhead to Long Beach along the service tracks, eliminating the need for costly trucking.
In addition, connecting the light rail lines as a single network enables vehicles to be stored and operated on multiple lines. Currently, storage surplus on one LRT network is not available to the other network. The Regional Connector also makes possible a centralized vehicle maintenance and storage facility serving the entire network.
1.8.2 Transit Usage As the largest center for employment in Los Angeles County and the region, the Regional Connector PSA provides a unique opportunity for residents to live near work, and offers many transit options. While a Regional Connector light rail alternative will not extend rail transit service into previously un-served regions of the county, it will broaden coverage within the downtown area and speed rail trips through the area by eliminating transfers. Both of these improvements incur time savings, because new stations mean shorter walking distances for many current passengers, and fewer transfers mean less time spent waiting for trains and buses.
1-54 Final December 2008
The ridership benefits of increasing trip speeds have been demonstrated in Los Angeles by the Metro Rapid program. The 2002 Demonstration Program Final Report noted that the implementation of the rapid bus service led to 23-29% improvements in trip speeds, an increase from 9mph to 12mph. While this difference may seem small, ridership on the Wilshire/Whittier corridor increased by 42% as a result. The other demonstration corridor, Ventura Blvd., experienced a ridership increase of 27%. The Regional Connector could hope to also see formidable increases in ridership among Blue and Gold Line passengers. The transfer between the Red/Purple and Blue Lines at 7th St./Metro Center can currently take one to five minutes during peak hours, 3-to-10 minutes during off-peak hours, and five to eight minutes on weekends. The transfer between the Red/Purple and Gold Lines at Union Station takes three to eight minutes during peak hours, five minutes during off-peak hours, and five minutes on weekends. By eliminating these transfers, the Regional Connector could shave five to 13 minutes off of passengers’ rush hour trips, eight minutes during off-peak times, and eight minutes on weekends, assuming that its operation speed is similar to that of the Red Line.
1.8.3 Regional Population and Employment Growth The greater Los Angeles metropolitan region features fairly dense populations throughout much of the area, which are expected to grow by the year 2030. Figures 1-14 and 1-15 show the regional population densities in 2005 and 2030, respectively. In 2005, areas of highest population density were found in Central Los Angeles, Hollywood, Southgate, East Los Angeles, and the Westside. Population densities will increase throughout the region and particularly in the high population areas. Additional high population areas will be found in the South Bay and the Eastside, particularly along the Interstate 10 corridor.
Areas of high population have workers that generally need to travel to employment centers throughout the region. Figures 1-16 and 1-17 show the regional employment densities in 2005 and 2030, respectively. In 2005, the highest area of employment density overlapped the PSA in Central Los Angeles. Areas of moderate employment density included Westwood, Santa Monica, Hollywood, Culver City, Pasadena, the Southbay and East Los Angeles. Employment densities are expected to increase in census tracks around these employment centers. The improvement of transit services in downtown Los Angeles will help bring workers from areas of higher population and lower employment to the PSA where the highest concentration of employment opportunities are located. The Regional Connector will also improve access to areas of moderate employment density by eliminating potential transfers for commuters to those locations.
Current transit usage in the region is the highest in Central Los Angeles, with additional areas of moderate transit usage in the Westside, Hollywood, Pasadena, the Southbay, and Pasadena, as shown in Figure 1-18. Transit usage is projected to increase in these areas by 2030, as shown in Figure 1-19. The highest transit usage areas are found along the existing Metro Red and Metro Purple Line corridor, as well as in the Westside area where there are many students who are reliant on public transportation. Additional transit opportunities created by the Regional Connector for commuters on the Metro Blue and Gold lines are expected to increase the number transit trips along the corridors of these two lines. Additionally, the Regional Connector will alleviate congestion on the already
1-55 Final December 2008
heavily-used Metro Red and Purple Lines by eliminating the need for Metro Blue and Gold line commuters to transfer.
1-56 Final December 2008
Figure 1-14 2005 Regional Population Density
1-57 Final December 2008
Figure 1-15 2030 Regional Population Density
1-58 Final December 2008
Figure 1-16 2005 Regional Employment Density
1-59 Final December 2008
Figure 1-17 2030 Regional Employment Density
1-60 Final December 2008
Figure 1-18 2006 Regional Transit Usage
1-61 Final December 2008
Figure 1-19 2030 Regional Transit Usage
1-62 Final December 2008
1.8.4 Significant Transit Dependent Populations in Study Area The PSA can be characterized as more transit dependent than L.A. County as a whole because of its dense population, proportionately low income levels, number of households with zero vehicles, and public transportation users. A significant portion of L.A. County’s transit riders live and work within the PSA, a trend that is projected to continue through 2030. Additionally, improvements in transit service would help to mitigate impacts associated with the increased concentration of transit dependent communities in and around the Regional Connector PSA.
Population, Households, and Employment According to SCAG projections the total population of the 1.6 square mile PSA in 2005 was about 18,000. Census tracts with the largest populations, greater than 2000 people, are found within the PSA east of Main St. between 1st St. and 7th St. and east of San Pedro St. between Temple St. and 1st St. The PSA accounted for roughly 0.18 percent of the total County population of about 10.0 million and is expected to represent a similar proportion of the County population in 2030, although slightly less growth is expected in the PSA, which will have a projected population of roughly 21,000 people in 2030. Significant population growth is expected in two areas of the PSA: between SR-110 and Hill St., and 1st and 3rd Sts., which will increase from 1,500-1,999 people to over 2,000 people; and, between Hill St. and east of Main St. between 7th and 9th Sts., which will increase from 1,000-1,499 people to 1,500-1,999 people. Projected population is based on fairly conservative estimates made by SCAG projections, however several residential and multi-use development projects are currently under construction or in planning which suggest that the downtown Los Angeles population may grow even higher than projected. Figures 1-20 and 1-21 show the distribution of existing and projected total population within the PSA. Several planned high-rise residential projects in the PSA contribute to the high level of expected growth. These include the Park Fifth condominium project at 5th and Hill Sts., the Block 8 condominium and rental project under construction between 2nd, 3rd, San Pedro, and Los Angeles Sts., and the 8th & Grand condominium and retail project.
Total households are also projected to increase 27.0 percent from about 9,600 in 2005 to 12,200 in 2030, which is higher than the 24.8 percent projected in LA County.
The PSA also supports a significant employment base, with employment of over 168,000 individuals in 2005. This is expected to increase to over 188,000 in 2030. Current and projected employment within the PSA is between three and four percent of total LA County employment. Figure 1-22 shows the distribution of employment in the PSA in 2005. At that time, total employment in a majority of the census tracts within the PSA was over 5,000, with areas of highest concentration (greater than 12,500 jobs) in three locations: between SR-110 and Flower, 7th, and 9th Sts.; between SR-110 and Hill St., and US-101 and 1st St.; and part of the area between Hill and Alameda St. between US-101 and 2nd St. A large employment base indicates that a significant number of workers commute within, into, and out of the PSA. Figure 1-23 shows the projected distribution of employment in 2030.
1-63 Final December 2008
Figure 1-20 2005 Population in Study Area
1-64 Final December 2008
Figure 1-21 2030 Population in Study Area
1-65 Final December 2008
Figure 1-22 2005 Employment in Study Area
1-66 Final December 2008
Figure 1-23 2030 Employment in Study Area
1-67 Final December 2008
Table 1-19 summarizes the PSA’s growth in population, households and employment relative to LA County.
Table 1-19 Population, Household, and Employment Growth
2005 2030 Forecast Increase Between 2005-2030
Population PSA 17,795 20,738 16.5% LA County 10,010,315 12,193,030 21.8% PSA % of LA County 0.18% 0.17% --- Households PSA 9,673 12,287 27.0% LA County 3,298,210 4,116,567 24.8% PSA % of LA County 0.29% 0.39% --- Employment PSA 168,328 188,591 12.0% LA County 4,644,010 5,651,043 21.7% PSA % of LA County 3.62% 3.34% --- Source: SCAG, 2005 data and 2030 projections
Household Income Socioeconomic trends in the PSA are correlated to transit-dependent communities; household income is an important factor. In 2005, the PSA had about 7,000 low income households, about 2,000 medium income households, and only about 400 high income households. Low income households include those households considered to be living in poverty. The US Census Bureau’s defined 2005 poverty thresholds is an annual average salary of $12,755 for a two person household. Low income households represented about 75 percent of the PSA’s total households. The high proportion of low income households underscores the need for public transit. Figure 1-24 shows the distribution of low income households in 2005. Census tracts within the PSA that have greater than 1,000 low income households include: between SR-110 and Hill St., and 1st and 3rd Sts.; and, between Hill and Alameda Sts., and 5th and 7th Sts. Figure 1-25 shows the distribution of low income households in 2030. Low income households are projected to increase by roughly 26 percent to about 9,000 in 2030.
1-68 Final December 2008
Figure 1-24 2005 Low Income Households
1-69 Final December 2008
Figure 1-25 2030 Low Income Households
1-70 Final December 2008
Age Distribution Many of the PSA's residents are elderly, with 19.7 percent age 65 years and over. The PSA has a small youth population, with only 5.5 percent age 18 years and younger. Figure 1-26 shows the distribution of residents age 65 and over in the PSA. The senior population is highest west of Hill St. and south of 1st St. Figure 1-27 shows the distribution of residents age 18 and under in the PSA. The youth population is found primarily in the southern part of the PSA, south of 5th St. Young and elderly residents within the PSA are more likely to depend on public transit because of inability to drive or lack of private vehicle accessibility.
Public Transportation Ridership and Vehicle Accessibility Many of the households in the PSA, approximately 69 percent, have no car and rely on public transit for commuting needs. Figure 1-28 shows the distribution of households with no available vehicles. Additionally, there is a high volume of transit ridership in the PSA, including 23 percent of employed residents age 16 and over, as well as a large number of commuters from outside the PSA who utilize transit to get to employment and other opportunities within the PSA. Figure 1-29 shows the percentage of the PSA employed population age 16 and over who relied on public transportation in 2005. Some of the PSA’s transit-dependent population will live within convenient walking distance of the Regional Connector (one-quarter to one-half mile), while other will be able to easily access the Regional Connector with a bus or rail transfer. When comparing vehicle accessibility and public ridership patterns in the Regional Connector PSA, the trends suggest that even households in the PSA with one or more cars have a higher propensity to use public transportation than similar households elsewhere in L.A. County.
Table 1-20 summarizes the transit dependency characteristics in the PSA relative to LA County.
Table 1-20 Transit Dependent Demographic Information
PSA LA County PSA % of LA
County Population 17,795 10,010,315 0.18% Under 18 years 976 2,798,604 0.03% Over 65 years 3,497 926,670 0.38% Households 9673 3,298,210 0.29% No vehicle households 8586 671,214 1.28% Use public transportation 1025 254,091 0.40% Low income households 7,244 1,481,896 0.49% Total employment 168,328 4,644,010 3.62% Source: SCAG, 2005 data and 2030 projections
1-71 Final December 2008
Figure 1-26 Population1 Age 65 and Over
1-72 Final December 2008
Figure 1-27 Population Age 18 and Under
1-73 Final December 2008
Figure 1-28 Percentage of Households with Zero Vehicles Available
1-74 Final December 2008
Figure 1-29 Population Age 16 and Over Who Use Public Transportation
1-75Final December 2008
1.8.5 Population and Employment Densities Providing public transportation to densely populated areas can increase ridership by making transit more accessible to a larger population. The PSA is approximately 1.5 square miles. It is largely built out and has uneven population densities ranging from less than 5,000 persons per square mile to over 20,000 persons per square mile, as shown in Figure 1-30. The average population density in 2005 was approximately 11,700 people per square mile, significantly denser than the average population density of roughly 2,100 people per square mile in LA County. The areas of highest population density are found in two locations within the PSA: between 1st and 3rd Sts., and SR-110 and Hill St.; and south of 5th St., east of Hill St.
Employment densities in the PSA range from less than 50,000 employed per square mile to over 200,000 employed per square mile, with an average employment density in 2005 of about 110,500 employees per square mile. By comparison, average employment density in L.A. County is less than 1,000 employees per square mile. The highest employment density exists in the PSA between US-101 and 3rd St., and SR-110 and Hill St. Figure 1-31 shows the distribution of employment densities in 2005.
Population and employment densities are projected to increase in the PSA in 2030. Average population density is projected to grow to roughly 13,600 persons per square mile, and average employment density is expected to be nearly 124,000 employees per square mile. Figures 1-32 and 1-33 show projected 2030 population and employment densities, which can be compared to Figures 1-34 and 1-35, respectively. The areas of high population and employment density represent excellent public transit ridership opportunities. Quarter-mile radii around the potential Regional Connector alignments and stops capture very high employment and population density areas.
1-76 Final December 2008
Figure 1-30 2005 Population Density
1-77 Final December 2008
Figure 1-31 2005 Employment Density
1-78 Final December 2008
Figure 1-32 2030 Population Density
1-79 Final December 2008
Figure 1-33 2030 Employment Density
1-80Final December 2008
1.8.6 Travel Demand Justifies the Need for Transit Services Table 1-21 presents traffic volumes within the PSA, illustrating the high volume of vehicles on the arterial network. These high volumes in concert with high pedestrian traffic result in blockages at many intersections within the PSA. The result is a strong and growing demand for a high capacity transit alternative.
1-81 Final December 2008
Table 1-21 Arterial Traffic Volumes by Intersection
Intersection
Time
Total Number of Vehicles at Intersection
1st 2ND 3RD 4TH 5TH 6TH 7TH 8TH 9TH TEMPLE
ALAMEDA AM 3913 2546 4267 NA NA NA NA NA NA 3022 PM 4120 2755 2927 NA NA NA NA NA NA 3427
Source: Data compiled from recent traffic studies conducted for downtown projects.
1-82 Final December 2008
1.8.7 Local Land Use Policies and Guidelines that Support Transit Recognizing the significant limitations on construction or expansion of roadways within the PSA, there is increased focus on encouraging the use of public transit rather than physical roadway improvements. County of Los Angeles General Plan Goals and Policies that Support Transit:
Goal C-1: An accessible circulation system that ensures the mobility of people and goods throughout the County.
Policy C1.1: Expand the availability of transportation options throughout the County
Policy C1.2: Encourage a range of transportation services at both the regional and local levels, especially for transit dependent populations.
Policy C1.3: Secure an affordable countywide transportation system for all users. Policy C1.4: Maintain transportation right-of-way corridors for future
transportation.
Goal C-2 An efficient circulation system that effectively utilizes and expands multi-modal transportation options.
Policy C2.1: Support the linking of regional transportation systems. Policy C2.2: Expand transportation options throughout the County.
Downtown Design Guidelines The Community Redevelopment Agency/Los Angeles (CRA/LA) has drafted design guidelines for all new developments within the PSA. These guidelines provide incentives for residential development by complementing or modifying code requirements such as density limits. With the overall goal of creating a livable downtown, guidelines focus on providing the following:
A broad range of housing types
Accessible transportation with emphasis on walking, biking, and transit other than autos
Shops and services within walking distance to housing
Safe, visually-pleasing and walkable streets
Parks and other gathering places near to shops and services
Public recreational open space within walking distance to home
The Guidelines set forth specific standards for design and construction, including use of sustainable materials and practices, preserving historic and culturally significant buildings, and supporting environmental and aesthetic resources. The guidelines
1-83 Final December 2008
ultimately call for developers to consider pedestrians and not cars in their design process. The objective is to create a cohesive transition along blocks while creating inviting and open spaces that encourage pedestrian traffic.
Little Tokyo Planning & Design Guidelines
As a result of recent resurgence and popularity in the Little Tokyo district in downtown Los Angeles, a set of design guidelines was created with the intent of encouraging individual expression and continuity of the surrounding environment through building and street design, at the same time enhancing elements and aesthetics that are significant to the Japanese American Community. In addition to the preservation of existing physical and cultural spaces, the guidelines identify specific standards for new developments and streetscapes in order to maintain continuity throughout. Street dedication requirements, such as those in place for new development east of Alameda between Temple and 1st St., promote pedestrian and transit friendly design which maintain cohesiveness through the corridor while maintaining the cultural integrity.
CommuteSmart® Metro provides services through CommuteSmart® to help people find alternatives to a single-person car commute through carpooling, vanpooling, park-and-ride and transit info. CommuteSmart also assists employers to set up rideshare programs, incentives for commuting, and ongoing assessments and training.
1.9 Potential Transit Markets Potential transit markets are two-fold for the Regional Connector. They are the activity centers and major destinations that include public and private uses, density of population and employment and major travel patterns that traverse the PSA. In addition, for the Regional Connector, the potential transit markets include travel patterns through the PSA as the Regional Connector provides a regional connection between over 50 miles of LRT service from Pasadena to Long Beach, from Culver City to the Eastside and everywhere in between. The purpose of this analysis is to determine the potential ridership generated by people moving within the PSA and through the PSA to get from the homes to jobs, services, entertainment and vice versa. Some of the PSA’s key advantages are the easy bus connections provided by the dense transit network, convenient regional and intercity rail interface, and the location of activities and services within walking and biking distance of each other.
1.9.1 Activity Centers and Destinations Several activity centers exist within the PSA. These include Educational, Recreational, Business/Industrial and Commercial centers. Figure 1-34 illustrates activity centers within the PSA.
Downtown Los Angeles is considered a major destination for employment, services, entertainment and the arts, and increasingly, residential living. According to the
1-84 Final December 2008
Downtown Los Angeles Business Improvement District, the downtown residential population will increase by more than 10,000 from 2006 to 2009. There are eight districts located within the Regional Connector PSA: Bunker Hill, Civic Center, Little Tokyo, the Toy District, the Financial Core, the Historic Core, the Jewelry District and Central City East.
Bunker Hill
The Bunker Hill District is located generally between First St. on the north, Hill St. on the east, Third St. on the south, and Figueroa St. on the west. Major downtown destinations located within Bunker Hill include the Walt Disney Concert Hall, Museum of Contemporary Art (MOCA) and several high-rise office towers, senior and market rate housing, hotels and commercial/retail centers. Bunker Hill offers over 3,200 residential units mainly in mid- and high-rise buildings. Large development projects planned for this area include Civic Park and the Grand Avenue Development Project, which will transform this area into a regional arts, entertainment, and residential destination. The Grand Avenue Development is a $3 billion project that includes 3.6 million square feet of development with 449,000 square feet of retail. It is currently planned for 2600 housing units, almost doubling the existing number of units in the area
Civic Center Bordering Bunker Hill to the northeast is Civic Center, which serves as a hub for city, county, state, and federal government with the second largest concentration of civic buildings in the country. The Cathedral of Our Lady of the Angels, completed in 2002, the Ahmanson Theater, Mark Taper Forum, and the Dorothy Chandler Pavillion are other major destinations in this district. Civic Center is undergoing active redevelopment as the new headquarters for the state Department of Transportation (Caltrans) District 7 has recently been completed, development of the new Los Angeles Police Department Headquarters is underway, and construction of a U.S. Federal Courthouse is soon to begin.
Little Tokyo East of Civic Center is Little Tokyo, which serves as the center of the largest Japanese-American community in the continental United States. The Japanese American National Museum and Geffen Museum of Contemporary Art are located here, along with a lively shopping district. The popularity of Little Tokyo is evidenced by the active residential development underway, with recently completed and current projects adding more than 2,000 residential units. Significant developments in the early planning stages include a 4.5 acre site adjacent to the Little Tokyo Arts District Station of the Metro Gold Line. Early concepts from developers identified high density combination of office and housing with a strong connections to the Metro Gold Line. Toy District The Toy District is a 12-block shopping area with over 500 retail businesses located south of Little Tokyo and north of Central City East. Development here is centered on mixed-use. The proposed Medallion building, one of several projects currently under construction, will provide 192 residential lofts and over 200,000 square feet of retail space.
1-85 Final December 2008
Financial Core The Financial Core District is located south of Bunker Hill and is dominated by high-rise office buildings. The Central Library is located here, and has been recently restored and expanded. Other landmarks in this district include the Millennium Biltmore Hotel and Pershing Square. The proposed 2.7 million square foot, four-phase Metropolis mixed-use development is located in the southwestern end of the Financial District. Phase I of this project, which will begin construction in 2008, will provide 360 residential units. Park Fifth is another major planned 76 story high rise development across from Pershing Square and will include over 700 condos and a 200 room hotel. Historic Core To the east of the Financial Core is the Historic Core District, containing a large concentration of historic and architecturally significant buildings, including the Bradbury Building. The Grand Central Market and the Broadway Historic Theater District are destinations in this district. Development here is focused on conversion of old neglected buildings into lofts and apartments. The Historic Core experiences high volume retail sales on Broadway, which is a largely sidewalk-oriented retail district. Due to the shortage of parking in the area, the retail district is reliant on transit to bring patrons to the neighborhood.
Jewelry District The largest Jewelry District in the U.S. and second largest in the world is located southwest of the Historic Core, comprising 5,000 businesses with billions of dollars in revenue. Development in this area includes the proposed construction of 875 condominium units at 8th and Grand. Like the Historic Core, parking is in short supply and the district attracts a high volume of retail sales. However, the sales are mostly jewelry transactions occurring indoors.
Central City East Central City East is located south of the Toy District and consists primarily of commercial uses, including wholesale buildings and warehouses. The Flower Market, produce, fish and food processing industries as well as import/export businesses employ nearly 20,000 people in this area. Housing in this district consists mainly of the 6,500 single room occupancy hotel units. This area is also important in providing social services, including alcohol treatment, mental health services, and job training.
Other important downtown development projects outside of the PSA include the LA Live project, under construction since 2005, which will create a 4-million square foot complex of retail, restaurants, office, theater, hotel, parking, and residential space at the Staples Center. Regional Activity Centers and Destinations Due to the connectivity provided by the Regional Connector, light rail service is enhanced throughout the region thereby attracting new ridership on existing lines. Key regional activity centers that will attract riders to ride seamlessly through the PSA to get destinations that, today, require more than one transfer, include:
1-86 Final December 2008
University of Southern California via Metro Expo Line
Los Angeles Trade Technical College via Metro Blue Line
Downtown Long Beach via Metro Blue Line
Downtown Culver City via Metro Expo Line
Crenshaw District via Metro Expo Line
Downtown Pasadena via Metro Gold Line
Old Town Pasadena via Metro Gold Line
South Pasadena via Metro Gold Line
Chinatown via Metro Gold Line
City of Compton via Metro Blue Line
Highland Park via Metro Gold Line
Boyle Heights via Metro Gold Line Eastside Extension
Arts District via Metro Gold Line Eastside Extension
East Los Angeles Civic Center via Metro Gold Line Eastside Extension
East Los Angeles College via Metro Gold Line Eastside Extension
Los Angeles Coliseum via Metro Expo Line
Los Angeles County Museum of Natural History via Metro Expo Line
Watts via Metro Blue Line
1-87 Final December 2008
Figure 1-34 Activity Centers within Study Area
1-88 Final December 2008
1.9.2 Local Redevelopment Plans and Transit Improvements Many of the communities in the PSA are focusing on redevelopment projects to meet increasing residential and commercial demands. Several large commercial centers or mixed use developments have been identified within the PSA. These centers are typically ideal locations for public transit services due to the potential to capture a large share of patrons and alleviate traffic congestion to and from the areas. The following identifies some of the current Community Redevelopment Agency of the City of Los Angeles (CRA/LA) projects in the PSA.
2nd St. Connection – This project, financed mostly by Metro and Surface Transportation Program-Local funds, will complete Upper 2nd St. between Grand Ave. and Olive St. Construction on the connection is currently underway.
Bunker Hill Design for Development – This proposal would amend the 1971 Design for Development (DFD) and increase the maximum floor area ratio in the Bunker Hill Redevelopment Area from 5.0 to 6.0.This would allow 20% more square footage that the current DFD. The proposal is currently in the Environmental Impact Report (EIR) phase.
Grand Avenue Project – The project consists of a full-scale redesign of Grand Ave. as well as the addition of a 16-acre park in the Civic Center and 3.9 million square feet of retail, hotel, and office space.
Parcel Y-1 Development – Under this plan, the existing Angels’ Knoll park would be developed into a third California Plaza office tower, potentially with retail and residential space. The project is currently in the DFD and EIR phase.
Los Angeles Sports and Entertainment District/L.A. Live! – This project seeks to create a major sports and entertainment destination just south of the financial district, surrounding the existing Convention Center and Staples Center. Additional auditoriums and theaters, as well as retail and office space will be added by 2009. Condominium and rental apartment buildings are presently under construction. This redevelopment project is located one block south of the PSA, within a quarter mile of the Pico on the Metro Blue and Expo LRT lines. The LRT alternatives would directly connect the Pasadena Gold Line and Eastside lines to the complex.
Colburn School Phase II – The new expansion to the performing arts school was completed in Fall 2007, and consists of a new dormitory, rehearsal hall, 12-story tower, library, teaching space, and performance lab. The project is located on the southeast corner of 2nd St. and Grand Ave.
Park Fifth – An EIR is currently being prepared for a new high-rise residential building on 5th St. between Hill and Olive Sts., proposed as the tallest U.S. residential structure west of Chicago. The project will contain market-rate condominium units, a five-star hotel, and ground floor commercial space.
1-89 Final December 2008
8th & Grand – This is a condominium project with ground floor restaurants and retail located on 8th St. between Grand Ave. and Olive St. The project was approved by the CRA/LA Board and the City Council in 2006.
Mangrove Site – CRA/LA issued a request for proposals which closed in late 2007 for the parcel adjoining the future Metro Gold Line Little Tokyo/Arts District Station at 1st and Alameda Sts. CRA/LA hopes to pursue a mixed-use project on the site with market rate and affordable residential units, commercial space, and public parking. The site is located across Alameda St. from the PSA.
Block 8 Mixed Use – This parcel in Little Tokyo is located between 2nd, 3rd, San Pedro, and Los Angeles Sts. The proposed development will include affordable rental units, market-rate condominium and rental units, commercial space, and open space. The site plan includes a mid-block walkway between San Pedro and Los Angeles Sts and is currently under construction.
Metropolis Project – Located on the southwest corner of 8th and Francisco Sts., this recently-approved development will add 2.8 million square feet of new condominium, office, hotel, and retail space.
Little Tokyo Central Avenue Art Park – This project involves redeveloping the closed section of Central Ave. between Temple and 1st Sts. into a landscaped community park and underground parking facility linking the existing Museum of Contemporary Art, The Japanese American National Museum, and Go For Broke monument.
The Medallion – This project seeks to replace a surface parking lot with market-rate apartments and commercial space on a site located between Main, Los Angeles, 3rd, and 4th Sts. Construction on Phase 1 of the project has begun, and Phase 2 relies on the demolition of the existing Downtown Women’s Center (see next project).
Downtown Women’s Center Relocation/Expansion – This project will remove the existing Downtown Women’s Center on San Pedro St. between 4th and 5th Sts. in order to make way for the Medallion project. The city will renovate its Renaissance Building as the new Women’s Center, and will provide an additional 75 permanent housing units and eight day rest beds for homeless women. CRA/LA is currently reviewing development plans for the relocation/expansion project.
Residential Hotels Rehabilitation Program – Under this plan, CRA/LA will acquire approximately 30 single-room occupancy hotels, lease them to non-profit housing operators, and preserve the units as low-income housing. CRA/LA cites public ownership as a means of cleaning up crime-ridden slum hotel areas within the PSA.
Additionally, CRA/LA is preparing development plans for the Central Industrial area, located in the southeast portion of the PSA. The City of Los Angeles does not have any Specific Plan areas within the PSA, however there are three in the downtown area that border the PSA:
1-90 Final December 2008
Alameda District (North of the PSA) covers Union Station and the surrounding parcels.
Los Angeles Sports and Entertainment District (South of the PSA) includes the L.A. Live development, Staples Center, the Convention Center, and surrounding parcels slated for high-density development.
Central City West (West of the PSA) covers the area immediately west of the 110 freeway.
1.9.3 Air Quality and Environmental Sustainability Los Angeles is one of the most congested metropolitan regions in the nation and has been designated as a federal non-attainment area for air quality. The growing concern over global climate change and poor air quality is a predominant concern for Southern California. The use of fossil fuels for transportation generates large amounts of carbon dioxide emissions, which continue to disrupt progress toward improved air quality. Vehicle related emissions account for over one-third, 39%, of all air pollutants in Los Angeles County.2 Investments in public transportation and clean energy are viable solutions to improving the situation.
During the 1990s, Los Angeles County saw a significant increase in transit use. In 2002, SCAG reported that Los Angeles ranked 7th in the nation in public transit usage.3 These changes are due in large part to investments in the regional public transportation system. Investments in public transportation can contribute to alleviating the air quality challenges faced by the region and mitigating the negative effects suffered by Southern California residents. The Regional Connector will contribute to improved mobility and air quality, by increasing the speed and convenience of the rail system, thereby providing a more viable alternative to the automobile and reducing automobile related emissions shared by the region.
1.9.4 Travel Demand and Patterns Historic growth patterns have developed a multi-centered region with many of these transportation corridors converging at the PSA. The transportation network includes 9,000 lane-miles of freeway, more than 42,000 lane-miles of arterials, and several large public transit service providers.4 Yet growth of the transportation system has not kept pace with population growth and increases in transportation demand. As the population in the region doubled from 1960 to 2000, highway miles increased by less than 30 percent.5 The congestion caused by insufficient transportation lanes affects both personal travel and goods movement. The majority of the congestion is from travel on the highways and local arterial network regardless of transportation mode. If the current trend persists, travel delays are expected to rise to 5.4 million person hours by 2030, more than double currently experienced delays, which will deeply affect highway productivity.6
2 SCAG 2006 State of the Region Report Executive Summary 3 SCAG 2002 State of the Region Score Card 4 SCAG 2004 RTP Chapter 2 5 SCAG 2004 RTP Executive Summary 6 SCAG 2004 Draft RTP PEIR
1-91 Final December 2008
Expanding the public transportation system will provide more choices for commuters and potentially reduce travel demand and patterns on major highway and arterial systems.
The Regional Connector PSA is at the central core of activity for Los Angeles County. The PSA is ranked very high as a destination zone for districts outside of the PSA. For instance, for work trips produced in the greater Eastside Area, over 50,000 daily trips or approximately 25% of external trip destinations, are made to the Central Los Angeles. The Central Business District (CBD) is one of the top attractors of trips from the Westside PSA. In 2006, the CBD and Central LA attracted more than 53,000 daily person trips from the PSA with 11,000 using transit. For passengers riding on the Metro Gold Line from Pasadena to Union Station, over 73% transfer to the existing Metro Red Line for continued service. Figures 1-35 and 1-36 illustrate travel patterns to and from the PSA.
1.9.5 Summary of Travel Markets The PSA is located in the crossroads of the region’s transportation system because of historic growth patterns. It contains the largest concentration of jobs. Providing access to and through the PSA is a vital strategy for meeting the economic, mobility and air quality goals of the region. The PSA offers large transit markets to increase potential ridership on a public transit system. Balanced local land use and transportation policies can reduce auto travel and support more pedestrian, mixed-use and transit-oriented developments throughout the region. Public transit provides an alternative means of personal mobility, increases capacity when needed and contributes to the quality of life in metropolitan communities. Transit facilities, services and centers are best when they are customer-friendly, community-oriented and well designed. A network of transit-based centers and corridors, supported by in-fill development, maximizes the use of existing infrastructure, supports transit ridership, reduces automobile air pollution and preserves natural areas. These improvements will help maintain the greater Eastside’s economic vitality and quality of life.
Areas with large and growing populations typically represent a large potential transit market because of high travel demands and already congested roads and freeways. As described in Section 1.8.4, the PSA population is projected to increase by almost 25 percent by 2030, especially with the recent boom in new housing developments within the downtown area. High population densities can increase potential ridership on public transit. Increasing employment in the PSA also provides a potential travel market. Employment is expected to increase by about 15 percent by 2030. Dense employment areas within the PSA are a potential transit market because public transit can be used to commute to work in order to avoid the peak hour traffic times.
1-92 Final December 2008
Figure 1-35 Transit Trips to the PSA
Year 2006 Home Based Work Transit Trips From Outside Districts to the Regional Connector Study Area
1-93 Final December 2008
Figure 1-36 Transit Trips from the PSA
Year 2006 Home Based Work Transit Trips From the Regional Connector Study Area to Outside Districts
1-94 Final December 2008
1.10 Goals and Objectives The purpose of the Regional Connector Transit Corridor is to improve the connections within the existing light rail system and eliminate transfers. The project also seeks to expand rail coverage within the downtown area. A set of goals was created at the outset of the project to identify each alternative’s potential to meet these objectives. These goals are:
Goal 1 - Improve Mobility and Accessibility both Locally and Regionally Develop an efficient and sustainable level of mobility within Los Angeles County to accommodate planned growth and a livable environment. Goal 2 - Provide a Cost Effective Transportation System Develop a project that provides sufficient regional benefits to justify the investment. Goal 3 - Provide a Safe and Secure Alternative Transportation System Develop a project that is safe for riders, pedestrians and drivers while meeting the region’s need for security. Goal 4 - Achieve a Financially Feasible Project Develop a project that maximizes opportunity for funding and financing that is financially sustainable. Goal 5 – Support Public Involvement and Community Preservation Incorporate the public in the planning process and balance the benefits and impacts while preserving communities in the area, such as Little Tokyo, the Arts District, Bunker Hill, Civic Center and the Historic District. Goal 6 - Support Efforts to Improve Environmental Quality Develop a project that minimizes environmental impacts. Goal 7 – Support Community Planning Efforts Support the progression of the regional center area as an integrated destination and a dynamic and livable area accommodating projected growth in a sustainable manner.
These goals and objectives were generated during the early scoping process to reflect input from public agencies, community groups, and individual stakeholders. They address major considerations regarding the maximizing of transportation benefits, integration of the project with local land use enhancements, and building a system that is compatible with the dense downtown environment.
1-95 Final December 2008
1.11 Role of This Alternatives Analysis Study The AA study is intended to provide a more in-depth review of the most promising alternatives identified during prior screening processes. The report describes how eight alternatives were identified from an initial 32 conceptual alternatives for screening. The report then summarizes the evaluation leading to the selection of two promising alternatives for final screening and refinement.
To determine which of the two promising alternatives would best accomplish these goals, the report compares each alternative’s transportation benefits and impacts, environmental effects, financial feasibility, and level of community support. The report concludes with a comparative summary of each screened alternative’s performance under these criteria and recommends a shorter list of preferred alternatives for further study in a subsequent DEIS/DEIR phase.