Reference number ISO/TR 10064-6:2009(E) TECHNICAL REPORT ISO/TR 10064-6 First edition 2009-02-15 Code of inspection practice — Part 6: Bevel gear measurement methods Code pratique de réception — Partie 6: Méthodes de mesure des engrenages coniques No reproduction or networking permitted without license from IHS --`,,```,,,,````-`-`,,`,,`,`,,`---
Code of inspection practice — Part 6: Bevel gear measurement methods
Code pratique de réception —
Partie 6: Méthodes de mesure des engrenages coniques
Copyright International Organization for Standardization Provided by IHS under license with ISO
Not for ResaleNo reproduction or networking permitted without license from IHS
--`,,```,,,,````-`-`,,`,,`,`,,`---
ISO/TR 10064-6:2009(E)
PDF disclaimer This PDF file may contain embedded typefaces. In accordance with Adobe's licensing policy, this file may be printed or viewed but shall not be edited unless the typefaces which are embedded are licensed to and installed on the computer performing the editing. In downloading this file, parties accept therein the responsibility of not infringing Adobe's licensing policy. The ISO Central Secretariat accepts no liability in this area.
Adobe is a trademark of Adobe Systems Incorporated.
Details of the software products used to create this PDF file can be found in the General Info relative to the file; the PDF-creation parameters were optimized for printing. Every care has been taken to ensure that the file is suitable for use by ISO member bodies. In the unlikely event that a problem relating to it is found, please inform the Central Secretariat at the address given below.
ISO (the International Organization for Standardization) is a worldwide federation of national standards bodies (ISO member bodies). The work of preparing International Standards is normally carried out through ISO technical committees. Each member body interested in a subject for which a technical committee has been established has the right to be represented on that committee. International organizations, governmental and non-governmental, in liaison with ISO, also take part in the work. ISO collaborates closely with the International Electrotechnical Commission (IEC) on all matters of electrotechnical standardization.
International Standards are drafted in accordance with the rules given in the ISO/IEC Directives, Part 2.
The main task of technical committees is to prepare International Standards. Draft International Standards adopted by the technical committees are circulated to the member bodies for voting. Publication as an International Standard requires approval by at least 75 % of the member bodies casting a vote.
In exceptional circumstances, when a technical committee has collected data of a different kind from that which is normally published as an International Standard (“state of the art”, for example), it may decide by a simple majority vote of its participating members to publish a Technical Report. A Technical Report is entirely informative in nature and does not have to be reviewed until the data it provides are considered to be no longer valid or useful.
Attention is drawn to the possibility that some of the elements of this document may be the subject of patent rights. ISO shall not be held responsible for identifying any or all such patent rights.
ISO/TR 10064-6 was prepared by Technical Committee ISO/TC 60, Gears.
ISO/TR 10064 consists of the following parts, under the general title Code of inspection practice:
⎯ Part 1: Inspection of corresponding flanks of gear teeth
⎯ Part 2: Inspection related to radial composite deviations, runout, tooth thickness and backlash
⎯ Part 3: Recommendations relative to gear blanks, shaft centre distance and parallelism of axes
⎯ Part 4: Recommendations relative to surface texture and tooth contact pattern checking
⎯ Part 5: Recommendations relative to evaluation of gear measuring instruments
⎯ Part 6: Bevel gear measurement methods
Copyright International Organization for Standardization Provided by IHS under license with ISO
Not for ResaleNo reproduction or networking permitted without license from IHS
This part of ISO/TR 10064 provides information on measuring methods and practices of unassembled bevel and hypoid gears and gear pairs.
Tolerances are provided in Clause 5 of ISO 17485:2006, for calculating the maximum values allowed by the specific tolerance grade.
Measuring methods and practices are included in order to promote uniform inspection procedures (see Clause 5). These methods permit the manufacturer and purchaser to conduct measuring procedures which are accurate and repeatable to a degree compatible with the specified tolerance grade of ISO 17485.
See Clause 6 of ISO 17485:2006 for required and optional measuring methods.
This part of ISO/TR 10064 applies to bevel gear components as defined in ISO 17485. It does not apply to enclosed gear unit assemblies, including speed reducers or increasers, gear motors, shaft mounted reducers, high speed units, or other enclosed gear units which are manufactured for a given power, speed, ratio or application.
The use of the accuracy grades for the determination of gear performance requires extensive experience with specific applications. Therefore, users are cautioned against the direct application of tolerance values to a projected performance of unassembled gears when they are assembled.
Tolerance values for gears outside the limits stated in ISO 17485 are established by determining the specific application requirements. This possibly requires setting a tolerance smaller than that calculated by the formulae in ISO 17485.
2 Normative references
The following referenced documents are indispensable for the application of this document. For dated references, only the edition cited applies. For undated references, the latest edition of the referenced document (including any amendments) applies.
ISO 1122-1, Vocabulary of gear terms — Part 1: Definitions related to geometry
ISO 17485:2006, Bevel gears — ISO system of accuracy
ISO 23509, Bevel and hypoid gear geometry
Copyright International Organization for Standardization Provided by IHS under license with ISO
Not for ResaleNo reproduction or networking permitted without license from IHS
For the purposes of this document, the terms and definitions given in ISO 17485 and the following terms, definitions and symbols apply.
NOTE 1 Some of the terms, definitions and symbols contained in this Technical Report may differ from those used in other documents. Users of this Technical Report can be assured that they are using the terms, definitions and symbols in the manner indicated herein.
NOTE 2 The general wording “gear” or “bevel gear”, depending on the context, can refer to the “wheel” or the “pinion”.
NOTE 3 For other geometric, measurement and tolerance terms and definitions related to gearing, see ISO 1122-1 and ISO 23509.
3.1 Terms and definitions
3.1.1 toe portion of the bevel gear tooth surface at the inner end
3.1.2 heel portion of the bevel gear tooth surface at the outer end
3.1.3 tip upper edge of the gear tooth surface
3.1.4 root lower edge of the gear tooth surface
3.1.5 topland surface of the top of the gear tooth
3.1.6 wheel gear with the larger number of teeth
3.1.7 pinion gear with the smaller number of teeth
Copyright International Organization for Standardization Provided by IHS under license with ISO
Not for ResaleNo reproduction or networking permitted without license from IHS
1 toe 2 left side 3 heel 4 outer end of tooth 5 tip 6 root 7 right side 8 inner end of tooth 9 topland
Figure 1 — Nomenclature of bevel and hypoid gear teeth
3.2 Symbols
The symbols used in this document are listed alphabetically by term in Table 1 and alphabetically by symbol in Table 2. However, the names of several symbols have been rearranged such that the principal characteristics are grouped together.
Copyright International Organization for Standardization Provided by IHS under license with ISO
Not for ResaleNo reproduction or networking permitted without license from IHS
These methods provide the manufacturer and purchaser with recommendations for verifying the conformity of a manufactured product with the standard, as well as information relative to the interpretation of measurement data.
Some design and application considerations may warrant measuring or documentation not normally available in standard manufacturing processes.
NOTE No particular method of measurement or documentation is considered mandatory unless specifically agreed upon between manufacturer and purchaser. When applications require measurements beyond those recommended in this Technical Report, special measurement methods are negotiated prior to manufacturing the gear.
4.2 Manufacturing documentation
The manufacturing of gearing to the standard may or may not include specific measurements. When applications warrant, detailed specific measurements, data analysis and additional considerations may be necessary to establish acceptance criteria for a gear. The specific methods of measurement, documentation of accuracy grade and other geometric tolerances of a gear are normally considered items which are to be mutually agreed upon between manufacturer and purchaser.
NOTE Specifying an accuracy grade or measurement criteria that requires closer tolerances than required by the application can increase the cost unnecessarily.
4.3 Process control
Process control is defined as the method by which gear dimensional accuracy is maintained through control of each individual step of the manufacturing process. Upon completion of all manufacturing operations, a specific gear has been given an inherent level of dimensional accuracy; this level of accuracy was established during the manufacturing process and it is totally independent of any final inspection.
Process control includes elements such as manufacturing planning, maintenance of machine tools, cutting tool selection and maintenance, heat treatment control and quality assurance programmes, as needed, to achieve and maintain the necessary gear quality. When properly applied, gears manufactured by specific control techniques will be found to be of very uniform quality. Therefore, little or no final inspection may be necessary for a gear, particularly in some classification levels, assurance of the necessary accuracy having been built-in through careful manufacturing control at each step.
NOTE It is possible for documentation to be deemed unnecessary for products manufactured under process control when inspection records are not specified in the purchase contract.
With proper application of process control, relatively few measurements may be made on any one gear. For example, tooth size may be evaluated by a measurement on only two or three sections of a given gear. It is assumed that these measurements are representative of all the teeth on the gear. Gears made in mass production quantities may be inspected at various steps in their manufacturing process on a statistical basis. Thus, it is possible that a specific gear can pass through the entire production process without ever having been measured. However, based on appropriate confidence in the applied process control, the manufacturer of that gear shall be able to verify that its quality is equal to those gears that were measured.
4.4 Measurement methods
Gear geometry may be measured by a number of alternate methods as specified in Table 3 of ISO 17485:2006. The selection of the particular method depends on the magnitude of the tolerance, the size of the gear, the production quantities, equipment available, accuracy of gear blanks and measurement costs.
The manufacturer or the purchaser may wish to measure one or more of the geometric features of a gear to verify its accuracy grade. However, a gear which is specified to an accuracy grade must meet all the individual tolerance requirements applicable to the particular accuracy grade and size as noted in Tables 3 and 4 of ISO 17485:2006. Unless otherwise specified, all measurements are taken and evaluated at the tolerance diameter, dT.
Copyright International Organization for Standardization Provided by IHS under license with ISO
Not for ResaleNo reproduction or networking permitted without license from IHS
Normally the tolerances apply to both sides of the teeth unless only one side is specified as the loaded side. In some cases, the loaded side may be specified to a higher accuracy than the non-loaded or minimum-loaded side; if applicable, this information is to be specified on the gear engineering drawing.
4.5 Additional considerations
4.5.1 General aspects
When specifying the quality of a gear, there are additional or special considerations that must be reviewed. These considerations may include items such as:
⎯ backlash allowances in tooth thickness;
⎯ matching gears as sets;
⎯ reference gears for composite measurement;
⎯ replacement gearing;
⎯ modified accuracy grade;
⎯ mounting distance and backlash markings on wheel and pinion;
⎯ record of tooth contact patterns by photographs or transfer tapes.
The listed items and other special considerations are to be reviewed and agreed upon by the manufacturer and purchaser.
4.5.2 Backlash
An individual gear does not have backlash. Backlash is only present when one gear mates with another. The backlash of a gear set is based on the tooth thickness of each member in mesh, as well as the mounting distances at which the gears are assembled. The functional backlash is additionally dependent on the runout of the gears, the actual variation of tooth thicknesses and tooth geometries.
The methods of determining the backlash required for individual applications are beyond the scope of this Technical Report (for additional information, see ISO 23509). See also 5.9.3.
4.5.3 Matching gears as sets
Matched sets can be provided, usually at extra cost, and are required in many applications. In such a case, the purchaser must agree on the details of the additional specifications concerning how the matching is to be performed and verified. Applications requiring high accuracy gearing may necessitate the matching, or modifying, of pinion and gear profiles and spiral angles such that the matched set is satisfactory for the application.
NOTE ISO 17485 provides tolerances for unassembled gears only. The inspection of gearing mated in an assembly for a specific application is beyond the scope of this Technical Report. The matching process for such gears sold as pairs assumes greater importance than the individual absolute measurements.
4.5.4 Reference gears for composite action tests
When a composite check is specified, a reference gear becomes necessary. The design, accuracy grade validation procedure and cost of a reference gear must be negotiated between the manufacturer and purchaser. A specific reference gear is required for each different production gear design.
Copyright International Organization for Standardization Provided by IHS under license with ISO
Not for ResaleNo reproduction or networking permitted without license from IHS
The tolerances, methods and definitions specified in ISO 17485 prevail unless contractual agreements between the manufacturer and purchaser contain specific exceptions. See ISO/TR 10064-5 for discussion on measurement uncertainty.
The overall accuracy grade of a gear is determined by the largest accuracy grade number measured for any tolerance parameter specified for the gear by ISO 17485.
5 Measuring methods and practices
5.1 Guidelines for measurement of gear characteristics
This clause describes the recommended methods and practices used for the measurement of bevel gears. The practices and measurement methods included are recognized and accepted throughout the gear industry as being reliable.
These methods can provide measurements of the particular accuracy grade when correctly applied. Unless otherwise specified, all measurements are taken and evaluated at the tolerance diameter, dT, as specified in ISO 17485:2006, 3.1.8. Experienced personnel, using calibrated instruments in a suitable environment, are required.
Bevel gear practice is different from spur and helical gear practice regarding the measurement of tooth shape. Formerly the method was to inspect the tooth shape with contact pattern testing. The measurement of geometrical tooth shape or flank form is now possible. There are two different measuring methods. The grid point method uses a series of discrete points distributed along the tooth flank with the graphic output representing the topography of the tooth surface in three dimensions. The tooth trace method involves traces along the tooth flank both parallel and perpendicular to the pitch angle, similar to helix and profile measurement on spur and helical gears. Both of these methods may also output numerical data suitable for non-subjective pass/fail decisions and statistical methods for process control, which were not possible with contact pattern testing.
Guidelines for measurement options are as follows.
a) Individual gears:
⎯ single pitch and total cumulative pitch deviation;
⎯ runout;
⎯ measured by tooth thickness: gear tooth calipers, CMM (coordinate measuring machine) or CNC (computer numerically controlled) gear measuring instrument;
⎯ measured by flank form: grid point or tooth trace method.
b) Matched gear pairs (normally lapped):
⎯ measurements described in a) as individual gears;
⎯ tooth contact pattern;
⎯ backlash check;
⎯ composite single flank.
c) Individual gears matched to reference mating gears:
⎯ measurements described in a) as individual gears;
⎯ tooth contact pattern;
Copyright International Organization for Standardization Provided by IHS under license with ISO
Not for ResaleNo reproduction or networking permitted without license from IHS
⎯ double-flank composite testing, modules less than 1 only.
NOTE No particular method of measurement or documentation is considered mandatory unless specifically agreed upon between manufacturer and purchaser. When applications require measurements beyond those recommended in ISO 17485, special methods are negotiated prior to the manufacture of the gear.
5.2 Measuring practices
When measurement of bevel gears is specified, it may be done with a number of alternate methods.
5.2.1 Statistical sampling
Production quantities, available equipment, labour and measurement costs may influence the choice toward statistical sampling methods. If measurement by statistical sampling is chosen, the particular sampling plan shall be negotiated between manufacturer and purchaser. For further information, see ANSI/ASQ Z1.4.
NOTE Statistical sampling involves careful planning for the specific method of measurement (what is to be measured and on which equipment), how the measurement results are to be recorded, how many samples are to be taken (measurement frequency) and how the resulting data is to be analysed.
5.2.2 First piece measurement
On small quantities of parts, first piece measurement with process control for subsequent parts may be applied to reduce measurement costs and assure a given level of dimensional accuracy.
5.2.3 Measurement data references
5.2.3.1 Reference surfaces
To facilitate the machining, measurement and assembly of a gear, the radial and axial reference surfaces need to be clearly indicated on the manufacturing drawings (see Figure 2). This includes the mounting distance (MD), which is the distance between the axial reference surface and the crossing point of hypoid gears. In the case of bevel gears, this is the intersection point of the axes.
5.2.3.2 Datum axis of rotation
The bevel gear datum axis of rotation is defined by the centres of its datum surfaces. It is the axis to which the gear tooth details, such as pitch and flank measurements, are defined.
Ideally the surfaces used to determine the datum axis of rotation for measurement, the surfaces used to locate the gear for manufacturing and the functional surfaces that define the gear axis of rotation in its final assembly should all be the same. In practice, this is often not the case. When the manufacturing, measurement and functional datum surfaces or centres are different, the datum axis of rotation should be established so as to ensure that the geometry of the gear is adequately represented during measurement.
The datum axis of rotation for a gear with a bore shall be the datum axis of rotation established relative to the bore. The datum axis of rotation for a gear with a shaft shall be the datum axis of rotation established by the bearing support surfaces of the shaft. In addition to the datum axis of rotation, an axial feature, from which the mounting distance is dimensioned, should also be defined.
Care shall be taken to assure that the mounting of the part for measurement has minimum deviation with the instrument’s axis of rotation. Computer-controlled measuring instruments, such as CNC and CMM, can be programmed to mathematically correct the errors resulting from an off-axis mounting condition.
Copyright International Organization for Standardization Provided by IHS under license with ISO
Not for ResaleNo reproduction or networking permitted without license from IHS
1 crossing point 2 centreline of mating gear 3 pitch cone 4 apex end 5 face cone 6 radial reference surface 7 axial reference surface 8 datum axis of rotation 9 mounting distance 10 bore diameter (reference surface)
Figure 2 — Example reference surfaces
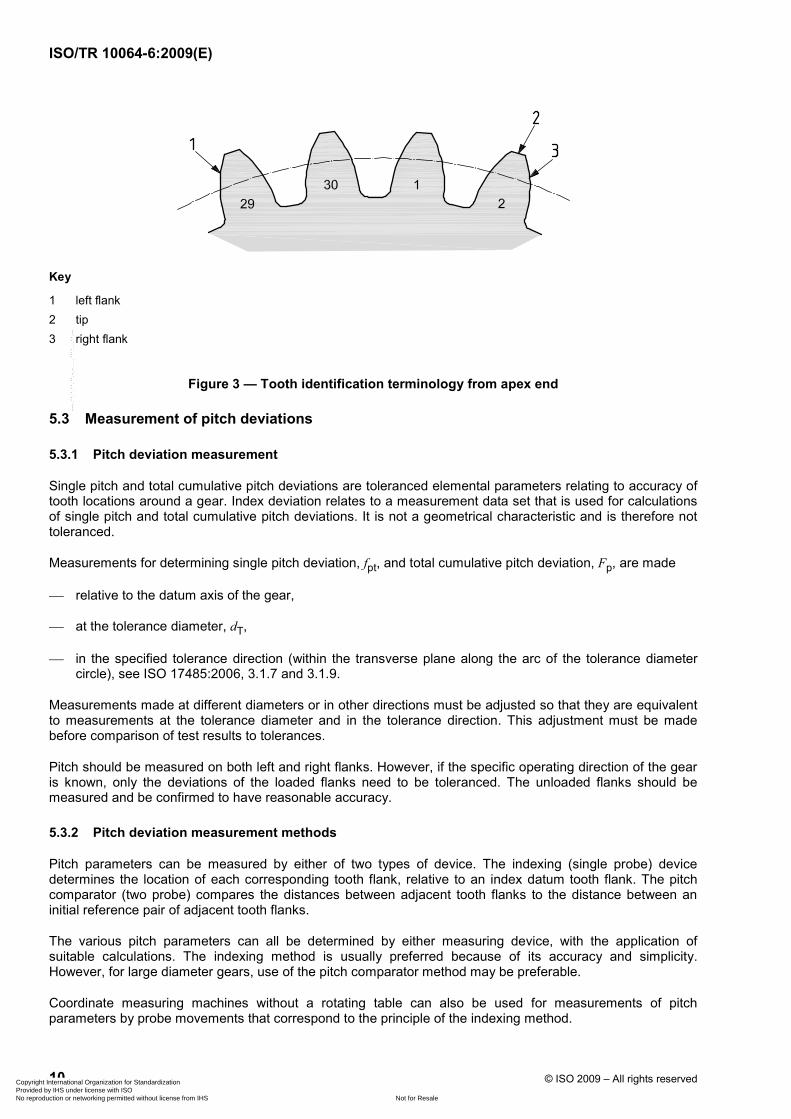
5.2.3.3 Reference identification of tooth data
When viewing the gear from the apex end (see Figure 2), the teeth shall be numbered for identification in a clockwise direction from a datum tooth (k = 1, 2, 3 ... etc.). The terms right or left flank are the surfaces bounding a tooth when this tooth is viewed with its tip above its root (see Figure 3).
5.2.3.4 Hand of spiral
A right-hand spiral bevel gear is one in which the outer half of a tooth is inclined in the clockwise direction from the axial plane through the midpoint of the tooth as viewed by an observer looking at the face of the gear.
A left-hand spiral bevel gear is one in which the outer half of a tooth is inclined in the anticlockwise (counterclockwise) direction from the axial plane through the midpoint of the tooth as viewed by an observer looking at the face of the gear.
Copyright International Organization for Standardization Provided by IHS under license with ISO
Not for ResaleNo reproduction or networking permitted without license from IHS
Figure 3 — Tooth identification terminology from apex end
5.3 Measurement of pitch deviations
5.3.1 Pitch deviation measurement
Single pitch and total cumulative pitch deviations are toleranced elemental parameters relating to accuracy of tooth locations around a gear. Index deviation relates to a measurement data set that is used for calculations of single pitch and total cumulative pitch deviations. It is not a geometrical characteristic and is therefore not toleranced.
Measurements for determining single pitch deviation, fpt, and total cumulative pitch deviation, Fp, are made
⎯ relative to the datum axis of the gear,
⎯ at the tolerance diameter, dT,
⎯ in the specified tolerance direction (within the transverse plane along the arc of the tolerance diameter circle), see ISO 17485:2006, 3.1.7 and 3.1.9.
Measurements made at different diameters or in other directions must be adjusted so that they are equivalent to measurements at the tolerance diameter and in the tolerance direction. This adjustment must be made before comparison of test results to tolerances.
Pitch should be measured on both left and right flanks. However, if the specific operating direction of the gear is known, only the deviations of the loaded flanks need to be toleranced. The unloaded flanks should be measured and be confirmed to have reasonable accuracy.
5.3.2 Pitch deviation measurement methods
Pitch parameters can be measured by either of two types of device. The indexing (single probe) device determines the location of each corresponding tooth flank, relative to an index datum tooth flank. The pitch comparator (two probe) compares the distances between adjacent tooth flanks to the distance between an initial reference pair of adjacent tooth flanks.
The various pitch parameters can all be determined by either measuring device, with the application of suitable calculations. The indexing method is usually preferred because of its accuracy and simplicity. However, for large diameter gears, use of the pitch comparator method may be preferable.
Coordinate measuring machines without a rotating table can also be used for measurements of pitch parameters by probe movements that correspond to the principle of the indexing method.
Copyright International Organization for Standardization Provided by IHS under license with ISO
Not for ResaleNo reproduction or networking permitted without license from IHS
The indexing (single probe) device uses an angular indexing apparatus such as an index plate, circle divider, optical or electronic encoder, or polygon and auto collimator to precisely rotate the gear by an angular increment equal to its pitch, or 360°/z (see Figure 4). The degree of its precision must be consistent with the quality grade and diameter of the gear.
The single probe should be oriented to contact the tooth flanks at the tolerance diameter, dT, and to gather measurement values in the specified measurement direction. The single probe is adjusted to indicate zero while the device is contacting the randomly selected initial tooth flank. As the gear is incrementally rotated around its datum axis, the single probe moves in and out on a precision slide and stop, measuring each successive tooth flank position relative to the indexing mechanism. This process is repeated until every tooth has been measured.
1
2
3
- F x
4
+ Fx
Key
1 index mechanism 2 tolerance diameter, dT 3 index deviation readings, Fx 4 dash lines representing theoretical location of flank
Figure 4 — Schematic diagram of single-probe device
It is common practice to complete this series of measurements by taking a final measurement on the initial reference tooth flank, thereby closing the circle. Ideally, this would produce a second measurement value of zero for the first tooth flank, as was set at the beginning of the process. Excessive deviation of this second measurement value from zero indicates a problem with the measurement.
Copyright International Organization for Standardization Provided by IHS under license with ISO
Not for ResaleNo reproduction or networking permitted without license from IHS
If the indicator always reads plus material as a plus reading and the gear is indexed anticlockwise (teeth are numbered clockwise), then the right-flank measurement values provided by the indexing (single probe) pitch measurement device can be used directly as the plus and minus values of index deviation for each tooth of the gear (see Figure 4). Left-flank single-probe measurement values must be multiplied by −1 to produce plus and minus index deviation values. Other pitch parameters may then be calculated from that data.
If a graphical recorder is used, data gathered by the single-probe measurement device will appear in the form shown in Figure 5. This figure shows the measurement value of the initial measured tooth flank set to zero, thereby establishing it as the reference. The measured values shown for all other corresponding tooth flanks then represent the positional deviations of those teeth from the initial reference tooth.
Key
X tooth number Y index deviation, Fx
fpt single pitch deviation Fp total cumulative pitch deviation
Figure 5 — Pitch data from single-probe device
5.3.3.3 Calculation of single pitch deviation
Subtractions of each successive pair of index deviation values produces the plus and minus values of single pitch deviation, fpt, for each adjacent pair of tooth flanks of the gear. See 5.2 for specified tooth-numbering and flank-naming conventions.
The number 1 single pitch deviation value is equal to the index deviation value of the last tooth subtracted from the index deviation value of the first tooth. The number 2 single pitch deviation value is equal to the index deviation value of the first tooth subtracted from the index deviation value of the second tooth. Since the index deviation value of the first tooth is set to zero, the number 2 single pitch deviation value is equal to the index deviation value of the second tooth. The number 3 single pitch deviation value is equal to the index deviation value of the second tooth subtracted from the index deviation value of the third tooth and so on.
If a graphical recorder is used, data gathered by the single-probe measurement device will appear in the form shown in Figure 5. Plus and minus single pitch deviation values, fpt, are shown as the differences between adjacent index deviation values.
Copyright International Organization for Standardization Provided by IHS under license with ISO
Not for ResaleNo reproduction or networking permitted without license from IHS
5.3.3.4 Calculation of total cumulative pitch deviation
The total cumulative pitch deviation, Fp, is equal to the difference between the most positive and the most negative index deviation value for the complete gear, which is always a positive value (see Figure 5).
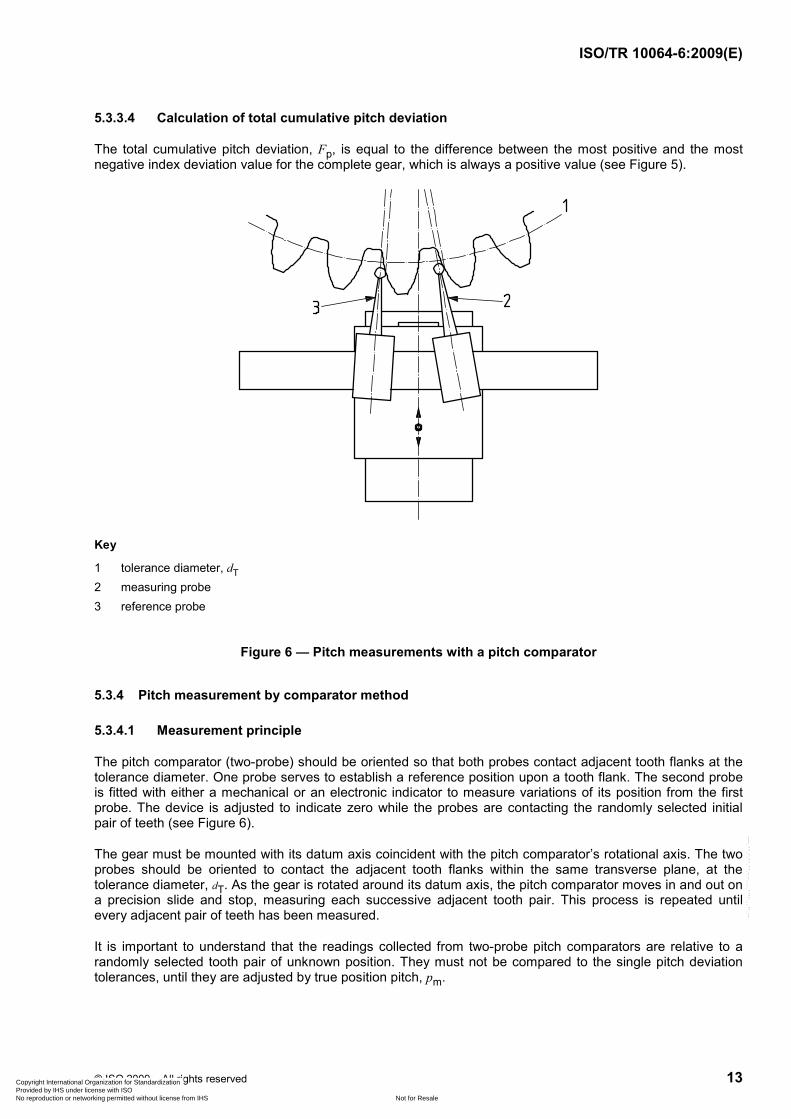
Figure 6 — Pitch measurements with a pitch comparator
5.3.4 Pitch measurement by comparator method
5.3.4.1 Measurement principle
The pitch comparator (two-probe) should be oriented so that both probes contact adjacent tooth flanks at the tolerance diameter. One probe serves to establish a reference position upon a tooth flank. The second probe is fitted with either a mechanical or an electronic indicator to measure variations of its position from the first probe. The device is adjusted to indicate zero while the probes are contacting the randomly selected initial pair of teeth (see Figure 6).
The gear must be mounted with its datum axis coincident with the pitch comparator’s rotational axis. The two probes should be oriented to contact the adjacent tooth flanks within the same transverse plane, at the tolerance diameter, dT. As the gear is rotated around its datum axis, the pitch comparator moves in and out on a precision slide and stop, measuring each successive adjacent tooth pair. This process is repeated until every adjacent pair of teeth has been measured.
It is important to understand that the readings collected from two-probe pitch comparators are relative to a randomly selected tooth pair of unknown position. They must not be compared to the single pitch deviation tolerances, until they are adjusted by true position pitch, pm.
Copyright International Organization for Standardization Provided by IHS under license with ISO
Not for ResaleNo reproduction or networking permitted without license from IHS
The true position pitch, pm, is the measurement value for any perfectly spaced tooth pair, with the given setup of the pitch comparator. It is equal to the average value found by summing all the adjacent tooth pair measurements then dividing the result by the number of tooth pairs (i.e., the number of teeth).
If a graphical recorder is used, data gathered by the pitch comparator method will appear in the form shown in Figure 7. This figure shows the measurement value of the initial pair of teeth (1–2) set to zero. Also shown is the true position pitch, pm, as the calculated mean of pitch comparator measurement values.
5.3.4.3 Calculation of single pitch deviation
Subtractions of the true position pitch, pm, from each adjacent tooth pair measurement produces the plus and minus values of single pitch deviation, fpt, for each tooth pair of the gear. See 5.2 for specified tooth-numbering, pitch-numbering and flank-naming conventions.
If a graphical recorder is used, data gathered by the pitch comparator method will appear in the form shown in Figure 7. Single pitch deviation values, fpt, are shown as the deviations of individual pitch comparator measurement values from the true position pitch, pm.
5.3.4.4 Calculation of index deviation
The plus and minus index deviation values for each tooth flank of the gear can be produced by successive summation of the single pitch deviation values. See 5.2 for specified tooth-numbering and flank-naming conventions.
In all cases, the number one (first) tooth shall be the datum tooth and its index deviation value set to zero accordingly.
The index deviation value of the second tooth is equal to the index deviation value of the first tooth plus the number two single pitch deviation value. Since the index deviation value of the first tooth is set to zero, the index deviation value of the second tooth is equal to the number two single pitch deviation value. The index deviation value of the third tooth is equal to the index deviation value of the second tooth plus the number three single pitch deviation value and so on.
Key
X pairs of adjacent teeth Y pitch comparator readings
Figure 7 — Single pitch deviation, two-probe device
Copyright International Organization for Standardization Provided by IHS under license with ISO
Not for ResaleNo reproduction or networking permitted without license from IHS
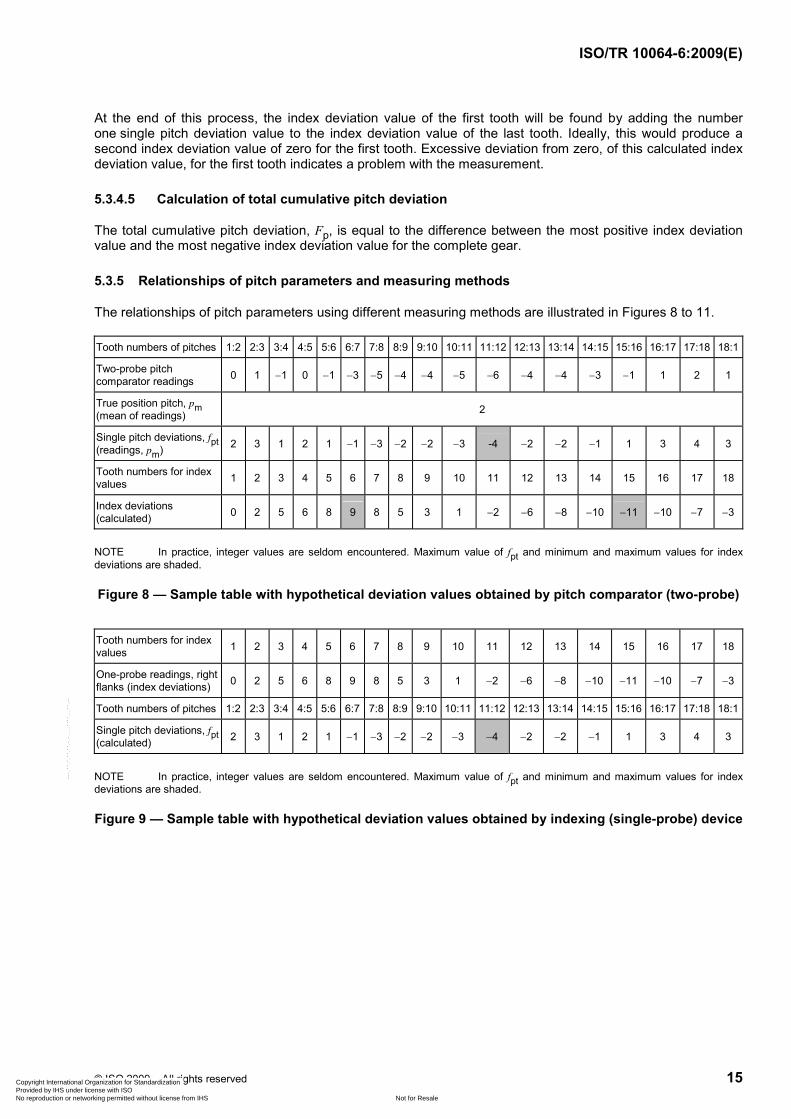
At the end of this process, the index deviation value of the first tooth will be found by adding the number one single pitch deviation value to the index deviation value of the last tooth. Ideally, this would produce a second index deviation value of zero for the first tooth. Excessive deviation from zero, of this calculated index deviation value, for the first tooth indicates a problem with the measurement.
5.3.4.5 Calculation of total cumulative pitch deviation
The total cumulative pitch deviation, Fp, is equal to the difference between the most positive index deviation value and the most negative index deviation value for the complete gear.
5.3.5 Relationships of pitch parameters and measuring methods
The relationships of pitch parameters using different measuring methods are illustrated in Figures 8 to 11.
Figure 10 — Sample graphical representation of single pitch deviations, fpt
Key
X flank number
Figure 11 — Sample graphical representation of index deviations
5.4 Measurement of bevel gear runout
5.4.1 Runout of bevel gear teeth
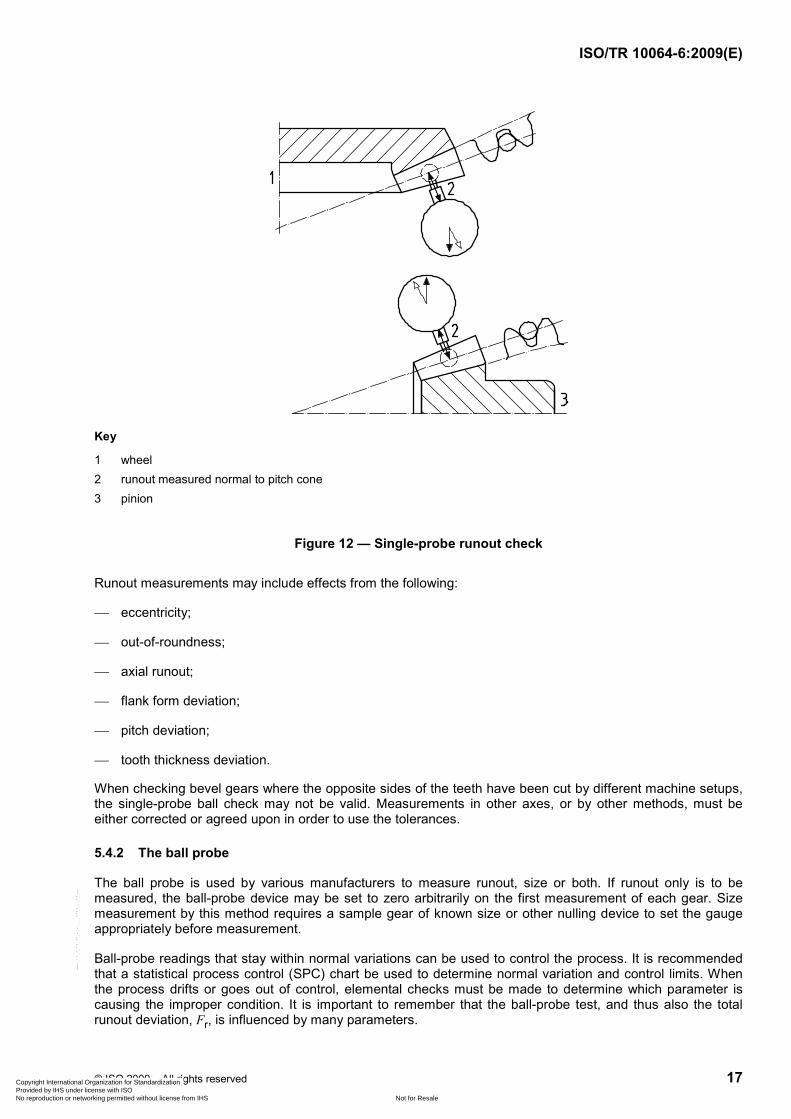
Runout of bevel gear teeth, Fr, is measured by a specified probe, such as a ball or cone, which should be selected for size so that tooth flank contact occurs near the tolerance diameter on both flanks of a slot. For bevel gears, runout is measured in a direction perpendicular to the pitch cone.
Copyright International Organization for Standardization Provided by IHS under license with ISO
Not for ResaleNo reproduction or networking permitted without license from IHS
1 wheel 2 runout measured normal to pitch cone 3 pinion
Figure 12 — Single-probe runout check
Runout measurements may include effects from the following:
⎯ eccentricity;
⎯ out-of-roundness;
⎯ axial runout;
⎯ flank form deviation;
⎯ pitch deviation;
⎯ tooth thickness deviation.
When checking bevel gears where the opposite sides of the teeth have been cut by different machine setups, the single-probe ball check may not be valid. Measurements in other axes, or by other methods, must be either corrected or agreed upon in order to use the tolerances.
5.4.2 The ball probe
The ball probe is used by various manufacturers to measure runout, size or both. If runout only is to be measured, the ball-probe device may be set to zero arbitrarily on the first measurement of each gear. Size measurement by this method requires a sample gear of known size or other nulling device to set the gauge appropriately before measurement.
Ball-probe readings that stay within normal variations can be used to control the process. It is recommended that a statistical process control (SPC) chart be used to determine normal variation and control limits. When the process drifts or goes out of control, elemental checks must be made to determine which parameter is causing the improper condition. It is important to remember that the ball-probe test, and thus also the total runout deviation, Fr, is influenced by many parameters.
Copyright International Organization for Standardization Provided by IHS under license with ISO
Not for ResaleNo reproduction or networking permitted without license from IHS
Before using the ball-probe test in production, the gauge reproducibility and repeatability must be studied to determine if the gauge is capable of providing meaningful information.
The recommended method is to sequentially measure all teeth (see ISO 17485):
⎯ the high-to-low is taken as total runout deviation, Fr;
⎯ the average of all readings is used to determine the size.
5.5 Flank form measurement
5.5.1 Introduction
Bevel pinion and wheel tooth flank shape may be defined mathematically and subsequently measured by a CMM or CNC gear measuring instrument, with associated special software. The generally accepted procedure for bevel gear measurement is to mathematically define the theoretical flank form, calculate the deviation between each theoretical point and corresponding measured point and output the results.
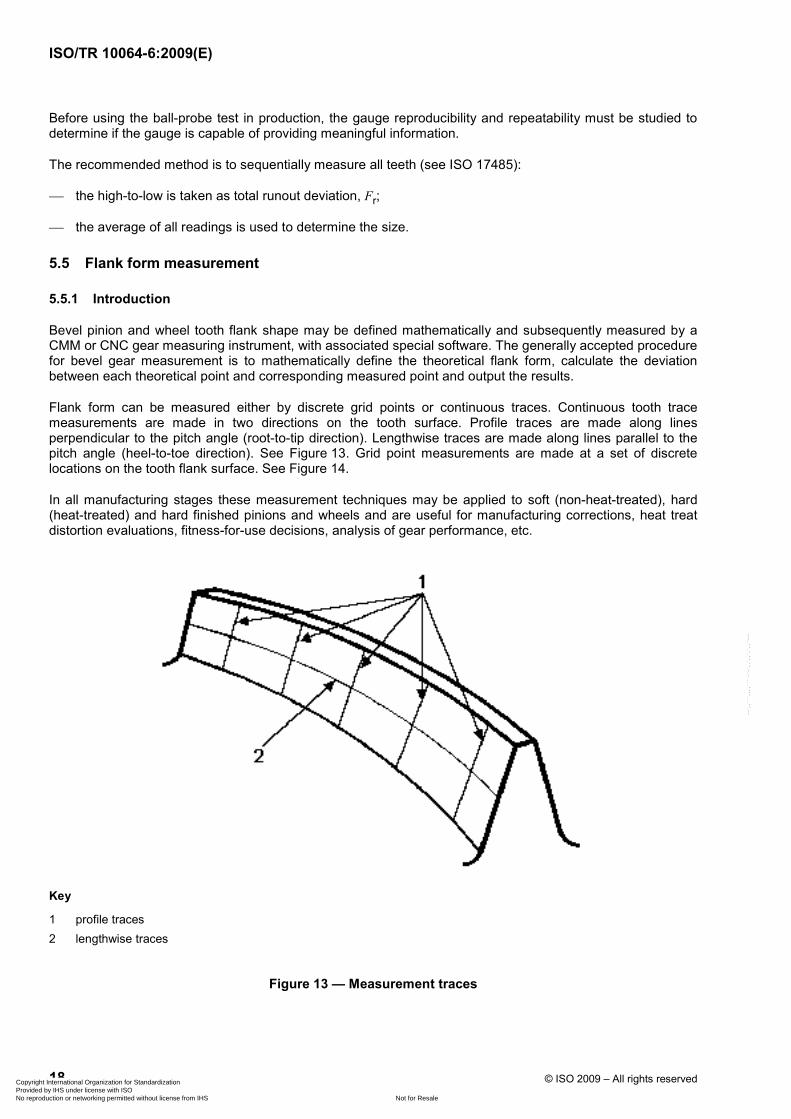
Flank form can be measured either by discrete grid points or continuous traces. Continuous tooth trace measurements are made in two directions on the tooth surface. Profile traces are made along lines perpendicular to the pitch angle (root-to-tip direction). Lengthwise traces are made along lines parallel to the pitch angle (heel-to-toe direction). See Figure 13. Grid point measurements are made at a set of discrete locations on the tooth flank surface. See Figure 14.
In all manufacturing stages these measurement techniques may be applied to soft (non-heat-treated), hard (heat-treated) and hard finished pinions and wheels and are useful for manufacturing corrections, heat treat distortion evaluations, fitness-for-use decisions, analysis of gear performance, etc.
Key
1 profile traces 2 lengthwise traces
Figure 13 — Measurement traces
Copyright International Organization for Standardization Provided by IHS under license with ISO
Not for ResaleNo reproduction or networking permitted without license from IHS
When the specified coordinates are determined by mathematical calculation, they define points on theoretical tooth surfaces. These surfaces might be those produced by the motions from an errorless production machine including any possible modifications. Alternatively, the theoretical tooth surfaces might be those for a perfectly conjugate wheel and pinion. By either choice, advanced mathematical techniques are required to define this shape. Special computer programs are available for all common bevel gear tooth forms (spiral and hypoid, continuously or singly indexed, Zerol and straight); for specific details important to any given application, consult the manufacturer and software developer.
5.5.2.2 Determination of tooth flank grid points
The location of any discrete point on the surface of the tooth flank is to be measured with respect to appropriate reference data, such as mounting distance and bearing surfaces or mounting diameters. The measured location is then compared to the specified coordinate and the deviation is calculated in a direction normal to the flank surface.
NOTE The 3D metrology of free-form surfaces needs to include consideration of the normal to the probed surface at the point of contact. If the inspected surface (tooth flank) is different from the specified (theoretical) in the region of the probed points, measurement errors can arise from incorrect probe compensation. This problem can lead to over or under estimation of measurement uncertainty.
For practical reasons, the grid is defined on an axial plane of the bevel gear. Then each grid point is projected by rotation around the gear axis onto the theoretical tooth flank where 3D coordinates are calculated, see Figure 15. The number of grid points must be sufficient to provide an accurate sample of the tooth flank without taking excessive measurement time and the location of the points must comprise as large an area as possible without being too close to the topland, fillet radius or end faces.
Figure 15 — Three-dimensional coordinates
The following grid point system is used, unless manufacturer and purchaser agree on another appropriate system.
⎯ Measurements for classification or process control typically use a grid of 5 × 9 points (5 places root-to-tip, 9 places toe-to-heel).
⎯ Profound analyses, such as contact pattern evaluations of measured tooth flanks, require a higher point density up to 39 × 39; many more points generally do not lead to better results.
⎯ Odd point numbers are used for both lines and columns to get a clear midpoint of the grid. This point should be in the vicinity of the tolerance diameter, dT.
Copyright International Organization for Standardization Provided by IHS under license with ISO
Not for ResaleNo reproduction or networking permitted without license from IHS
⎯ In an axial plane, particularly the outline of a pinion tooth is often not a quadrangle; in such cases a quadrangular grid is not sufficient to cover the whole flank. Therefore, it is recommended to use an adjusted polygon for the outline of the grid.
⎯ The distance of each outer grid point from its next edge of the tooth flank should be as small as possible to get an overall result. A recommended value for this distance is half the ball diameter of the probe. This is especially true if modified motions of the production machine are used to improve the tooth flanks. In that case, the flank surfaces may change towards the flank edges more than usually and therefore need to be checked carefully.
Special consideration must be given for gears which have a large chamfer at the top corner of the toe or heel; it may be preferential to increase the distance from the toe or heel, rather than increase the distance from the topland if there are no other choices.
5.5.2.3 Output and analysis of the grid point measurement system
Compared to a numerical output, even the simplified graphical output provides a better overview of the course of deviations across the tooth flank. An example of a three-dimensional graph is given in Figure 16. Commonly, the theoretical tooth flank is shown as a plane quadrangle and the point by point deviations are illustrated by the length of lines in an appropriate scale vertical to the quadrangular plane.
Key
1 root 2 tip 3 heel 4 toe
a Convex. b Concave.
Figure 16 — Example of three-dimensional graphical output
Copyright International Organization for Standardization Provided by IHS under license with ISO
Not for ResaleNo reproduction or networking permitted without license from IHS
However, the numerical output is also important especially if this information is transferred as a data file into special software with which correction data for the production machine can be evaluated. The reduction of all numerical data into a mean spiral angle deviation and a pressure angle deviation is not as meaningful for bevel gears as it is for spur and helical gears because of the complexity of spiral bevel tooth surfaces.
5.5.3 Tooth trace measurement of bevel pinion and wheel tooth flank geometry
5.5.3.1 Determination of reference tooth flank
The tooth surface reference flank geometry, developed on the basis of an errorless production machine including any possible modifications, is used as the reference wheel tooth flank. The pinion tooth surface conjugate with the reference wheel tooth flank is used as the reference pinion tooth flank. Therefore, both reference tooth flanks are conjugate with each other, similarly to spur and helical gears.
5.5.3.2 Tooth traces
A tooth flank is typically measured with profile traces (root-to-tip) and lengthwise traces (tooth lead), as shown in Figure 13, similar to the common practice for spur and helical gears. The number of traces should be sufficient to provide an accurate sample of the tooth without taking excessive measurement time. This can be accomplished with three to five profile traces and one lead trace. Additional profile measurements can be made when a more detailed analysis is required.
5.5.3.3 Output and analysis of tooth trace measurement
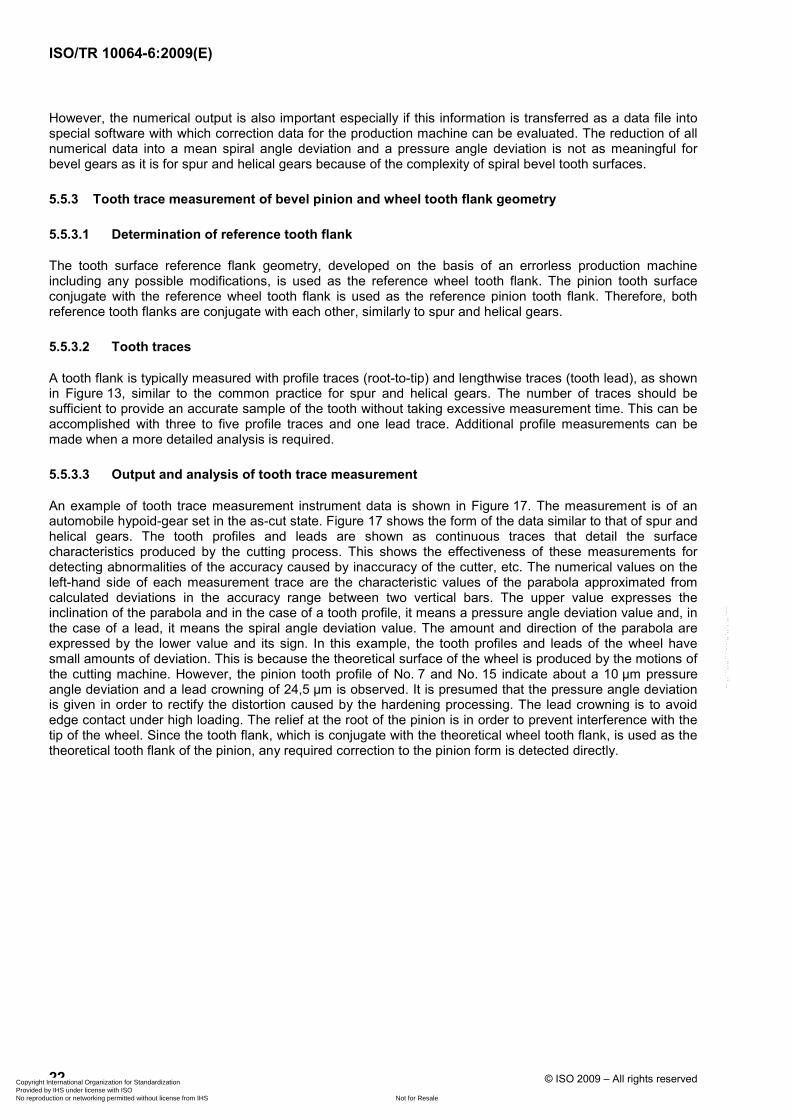
An example of tooth trace measurement instrument data is shown in Figure 17. The measurement is of an automobile hypoid-gear set in the as-cut state. Figure 17 shows the form of the data similar to that of spur and helical gears. The tooth profiles and leads are shown as continuous traces that detail the surface characteristics produced by the cutting process. This shows the effectiveness of these measurements for detecting abnormalities of the accuracy caused by inaccuracy of the cutter, etc. The numerical values on the left-hand side of each measurement trace are the characteristic values of the parabola approximated from calculated deviations in the accuracy range between two vertical bars. The upper value expresses the inclination of the parabola and in the case of a tooth profile, it means a pressure angle deviation value and, in the case of a lead, it means the spiral angle deviation value. The amount and direction of the parabola are expressed by the lower value and its sign. In this example, the tooth profiles and leads of the wheel have small amounts of deviation. This is because the theoretical surface of the wheel is produced by the motions of the cutting machine. However, the pinion tooth profile of No. 7 and No. 15 indicate about a 10 µm pressure angle deviation and a lead crowning of 24,5 µm is observed. It is presumed that the pressure angle deviation is given in order to rectify the distortion caused by the hardening processing. The lead crowning is to avoid edge contact under high loading. The relief at the root of the pinion is in order to prevent interference with the tip of the wheel. Since the tooth flank, which is conjugate with the theoretical wheel tooth flank, is used as the theoretical tooth flank of the pinion, any required correction to the pinion form is detected directly.
Copyright International Organization for Standardization Provided by IHS under license with ISO
Not for ResaleNo reproduction or networking permitted without license from IHS
1 profile No. 2 profile traces 3 root 4 tip 5 lengthwise trace 6 toe 7 heel
Figure 17 — Traces of hypoid pinion and wheel after cutting
Figure 18 shows the measurement data of the gear set that was finished by lapping after case hardening. The dash-dot line drawn on the wheel tooth profile plot No. 21 is provided as a reference profile before lapping. In the central part, about 10 µm of the material has been removed by lapping. The plus material in the root and at the tip are the portions without lapping. This is because the tooth of the partner pinion is not in contact in these areas. The plus material at the heel of the pinion lead is also a result of the same mechanism. The values of wheel and pinion pressure angle deviations for tooth profiles No. 9, No. 21 and No. 25 are almost the same, which means that the gear pair has fairly good conjugate action. As for the lead direction, the wheel has a 4,4 µm hollow (minus material) and the pinion has a 13,3 µm crown.
The data shown in Figure 19 is developed from that of Figure 18. The relative deviations shown in Figure 19 a) are obtained by adding the deviation values of the corresponding measurement points of the pinion and the wheel. That the pressure angle deviation is small (maximum of 2,1 µm) at No. 9 to No. 25 means fairly good conjugate action of the pair. The relative amount of lead crowning is 8,9 µm. The high central part of the relative facewidth means that the teeth contact in the central part. The contour map of deviations on the whole tooth flank, obtained by the help of a computer from the relative tooth profile and lead data, is shown in Figure 19 b). The deviation interval between adjoining contour lines is 2 µm. Figure 19 c) shows tooth bearing. The slash lines in the domain of tooth bearing are the simultaneous contact lines. The
Copyright International Organization for Standardization Provided by IHS under license with ISO
Not for ResaleNo reproduction or networking permitted without license from IHS
bent line in the figure is the locus of contact points. The motion graph, Figure 19 d), is obtained by converting the deviation values on the locus of contact into rotation angle deviations. The portion of the central motion graph above the adjacent motion graph plots generates the waveform of the transmission error.
a) Wheel b) Pinion
Key
1 profile No. 2 profile traces 3 root 4 tip 5 lengthwise trace 6 toe 7 heel
Figure 18 — Tooth profiles of lapped hypoid set
Copyright International Organization for Standardization Provided by IHS under license with ISO
Not for ResaleNo reproduction or networking permitted without license from IHS
Figure 19 — Relative tooth deviation and tooth contact analysis
5.6 Contact pattern checking
5.6.1 Methods
Tooth contact pattern checking is a method of inspection of either assembled gears or gears mounted on a gear roll testing machine. This is a functional test, for which ISO 17485 does not provide specified tolerancing. It provides an indication of correct tooth shape both up and down the tooth profile and lengthwise on the tooth. It evaluates that portion of the gear tooth surface which actually makes contact with its mate. With this technique, the areas that contact can be observed by coating the teeth with a marking compound and running the gears for a few seconds under light load.
The tooth profiles of bevel and hypoid gears may be inspected by observing the contact pattern obtained by running a gear with a specified mate (reference or sample gear) at a specified mounting distance. The teeth are lightly coated with a marking compound and are run under a light load for a few seconds. When the active profiles of the teeth are examined, the areas where contact was made can be seen. The tooth contact is an indication of correct tooth shape, both up and down the tooth profile and lengthwise on the tooth.
Bevel gears, when running in their mountings, are subject to deflections. These values vary according to the size of the gear, rigidity of the mountings, accuracy of the machining of the mountings and gears, and magnitude and character of the load. As a result, the contact pattern must be related to the particular application.
Copyright International Organization for Standardization Provided by IHS under license with ISO
Not for ResaleNo reproduction or networking permitted without license from IHS
A typical test machine, see Figure 20, is to be capable of supporting the bevel pinion and wheel with the following requirements:
⎯ to support the bevel pinion and wheel in relation to each other to simulate the actual or theoretical position in the application;
⎯ to permit rolling the bevel pinion and wheel together at a controlled r/min and brake load;
⎯ to be capable of adjusting the relative positions of the gears in relation to wheel cone (G), pinion cone (H) and offset (V). This is necessary to allow a V and H evaluation.
NOTE This is also referred to as an E, P and G test, where E is equivalent to V, P is equivalent to H and G.
Key
1 toe 2 heel 3 toe contact 4 heel contact
V vertical movement G wheel axial H pinion axial
Figure 20 — Schematic diagram of a typical test machine and tooth contact pattern V and H movements
Accuracy must be maintained to allow for meaningful results. The test machine must be calibrated on a regular basis to assure that the setup does, in fact, duplicate the theoretical mounting positions of the bevel gear pair.
5.6.3 Procedure
The use and evaluation of tooth contact patterns is a common method for the control of bevel gear tooth flank form. It is also possible to do computer simulations of contact pattern, including V and H movements, using flank form measurement data. The mechanical procedure is as follows.
1) Mount the bevel pinion and wheel in a roll test machine in a manner that accurately simulates the theoretical position in the application. Ensure the pinion and wheel teeth are free of oil or other foreign material.
Copyright International Organization for Standardization Provided by IHS under license with ISO
Not for ResaleNo reproduction or networking permitted without license from IHS
2) Verify that the two mating gears have the proper backlash.
3) Coat (paint) the flanks of the bevel pinion, or wheel, or both, with an approved gear marking compound (similar to jeweller’s rouge). Be careful not to apply too much: this would give a false indication of the tooth shape. (See ISO/TR 10064-4:1998, Clause 9.)
4) Roll the bevel pinion and wheel together with the required brake load for a long enough time to allow the contact pattern to develop (typically 5 s to 30 s). The compound will be wiped off any area of metal-to-metal contact.
5) Visually inspect the contact pattern to evaluate the length, width, shape and position. Generally, there will be a reference pattern for comparison. Make a permanent record of the results if appropriate, see 5.6.7.
5.6.4 Interpreting results
The tooth contact pattern method of measuring bevel gears is subjective; proper evaluation and judgements of acceptance require an experienced person.
Tooth contact for bevel and hypoid gears can be evaluated on bevel gear testing machines, which should be provided with axial adjustments for both the wheel and pinion and usually with a vertical offset adjustment for raising or lowering the axis of one member vertically with respect to the other for the testing of hypoid gears. In addition, the axial adjustment of the pinion is used to simulate the same effect on the tooth contact as a change in pressure angle; the axial adjustment of the wheel is used to control backlash and the vertical offset of the axes to simulate the same effect on the tooth contact as a change in spiral angle. With these adjustments, it is possible to obtain the equivalent position of the tooth contact necessary for proper operation of the gears in the actual mountings and to measure the changes which must be applied to the cutting machines for locating the tooth bearing correctly.
The sketches in Figure 21 illustrate tooth bearing patterns on the pinion tooth. A left-hand pinion is used throughout. The patterns are representative of those on a right-hand pinion or a straight bevel pinion, as well.
5.6.5 Runout by contact pattern check
Deviations in runout of the teeth may be observed by running the gears in a suitable test machine. The runout is characterized by periodic variation in sound during each revolution and by tooth bearing (contact pattern) shifting progressively around the gear from heel to toe and from toe to heel. This test also includes the effects of tooth-element deviations. There are no specified limits for this check. Runout is observed by visually checking contact pattern variation; actual runout amount is preferably determined by one of the other methods. See Figure 22.
5.6.6 V and H check
5.6.6.1 Checking method
V and H is a method for checking the amount and direction of the vertical and axial displacements of the pinion from its standard position, to obtain a tooth contact in the middle of the tooth profile, at the extreme toe and at the extreme heel of the tooth. Interpretation of the data obtained from this check provides an indication of the actual tooth flank shape and provides a practical way of checking the amount of relative vertical displacement from the specified mounting position which the gears can withstand without causing load concentrations at the ends of the teeth. It is also the method used for determining the size and shape of the pattern.
Copyright International Organization for Standardization Provided by IHS under license with ISO
Not for ResaleNo reproduction or networking permitted without license from IHS
The readings for all dials on the testing machine may be considered as zero readings when the gears are mounted in their specified mounting positions. All horizontal and vertical movements are measured from these zero positions and the directions defined in Figure 20. The algebraic signs for the vertical movement, V, depend on the hand of spiral of the wheel. Movements which increase or lead to positive hypoid offset are positive and vice versa, see ISO 23509.
1) “Heel” and “toe” measurement (lengthwise crown): The test machine operator adjusts the vertical, V, and the horizontal, H, in controlled increments to move the contact pattern along the tooth lengthwise surface, from the normal central position toward the heel. This is to be done in a manner which maintains a central contact on the profile (top and bottom) while the pattern blends to the heel end of the tooth. The teeth should be painted with additional gear marking compound after each movement. The operator records the V and H values for this final heel position. Next, the operator is to move the contact pattern to the toe with the method described above and is, again, to record the V and H values.
2) Profile adjustment of the tooth (profile crown): Adjust the pinion cone, H, in the plus direction until the contact pattern just blends to the tip (top) of the wheel tooth. Record the V and H values. Then adjust the pinion cone, H, in the minus direction until the contact pattern just blends to the tip of the pinion tooth. Again, record the V and H values.
In cases where the bevel gear mesh falls into the category referred to as “small cutter geometry” (rc0 is close to Rm × sin βm), it is not possible to adjust the pattern to the heel and toe as described above. Instead, it is recommended that a V-only measurement be applied to move the pattern to the heel and toe. That is, adjust the pattern to the heel and toe without concern for the profile position and record the V-only value when the pattern just blends to the ends of the tooth. V and H measurements will still be required to control the bias characteristics of the tooth, but the pattern will only move approximately half way to the heel and toe, see 5.6.6.4. With the combination of the V-only and V and H measurements, the tooth can be evaluated for lengthwise sensitivity and profile curvature.
5.6.6.3 Example of V and H method
In the example in Table 3, columns 2, 3 and 4, entitled “Reading at toe”, “Reading at heel” and “Total movement”, constitute the V and H check. It is occasionally very desirable to determine the vertical and horizontal settings necessary to place the tooth bearing in the centre of the tooth profile at the extreme toe and extreme heel. The total movement between the toe and heel readings is obtained by subtracting the heel reading from the toe readings algebraically. To obtain the average readings between the toe and heel readings, add the values algebraically and divide by two. See also Figure 20.
5.6.6.4 Bias measurements
The term “bias” refers to the length-wise “twisting” of the tooth flank form. The amount of bias is calculated by dividing the total vertical movement by the total horizontal movement. If the value is greater than the cotangent of mean spiral angle of the pinion, βm, it is called bias in; if the value is less, then it is bias out. In practice, a value of greater than or less than one is often used to determine bias. Bias choices are typically made from experience and, whenever possible, with data from actual loaded testing of the bevel gear set. Generally, “bias in” is specified for the contact pattern to improve the actual contact ratio of the rolling mesh. In most cases, “bias out” is avoided because it tends to reduce the actual contact ratio and may increase noise.
5.6.7 Record of tooth contact patterns
Frequently the tooth contact pattern must be recorded on a hard copy to provide a permanent record. Such a record may be provided with a tape transfer or a photograph. Tape transfers offer the advantage of a one-to-one scale factor that allows readings of contact pattern size and length.
Copyright International Organization for Standardization Provided by IHS under license with ISO
Not for ResaleNo reproduction or networking permitted without license from IHS
Movement Reading at toe Reading at heel Total movementa Average readingb)
Vertical, V (E) +0,25 −0,46 0,71 −0,11
Horizontal, H (P) −0,36 +0,51 0,87 +0,08
Wheel cone, G Adjust to maintain sufficient backlash
a Total vertical movement ( ) ( )0,25 0,46 0,71= + − − =
Total horizontal movement ( ) ( )0,36 0,51 0,87= − − + =
The algebraic signs of these totals are ignored since the magnitude of these quantities is the item of interest.
b Average vertical setting ( ) ( )0,25 0,460,11
2+ + −
= = −
Average horizontal setting ( ) ( )0,36 0,510,08
2− + +
= = +
When obtaining the average readings, both the magnitude and the direction (sign) are important. The average reading is used to place the tooth bearing in the centre of the tooth and to observe its appearance, or to compare it with the average reading for a master set of gears for the same job.
After successfully obtaining the desired contact pattern, place a piece of transparent mending tape over the entire tooth that has the contact pattern and apply a small amount of pressure (not too much; often, a cotton swab is used to gently wipe the tape across the tooth surface). Finally, carefully remove the tape, without smearing the contact pattern impression and place on a pattern tape record sheet.
For a photographic record, use an instant camera with a close-up lens attachment and a special light source. Retain the photographs in an organized fashion to allow future reference.
5.7 Single-flank composite inspection
Single-flank composite inspection involves rolling gears together at their proper mounting distance with backlash and with only one set of flanks in contact. The gears are mounted together in a special test rolling machine with a fixed mounting distance and with encoders or other devices to measure rotational motion. It is also possible to mount the gears in an actual gear box and measure the rotational motion with portable encoders.
The data from the encoders is processed in a special instrument that shows the accuracy or smoothness of rotational motion resulting from the meshing of the gears (transmission errors). This data permits measurement of profile conjugacy and can be directly related to single pitch deviation, total cumulative pitch deviation and runout. See Annex B and Annex D of ISO 17485:2006 for more information regarding single-flank composite inspection.
5.8 Double-flank composite testing
5.8.1 Method
Double-flank inspection involves rolling gears together in tight (zero backlash) mesh. As this operation does not simulate correct gear mounting distances, Annex C of ISO 17485:2006 provides double-flank tolerances only for bevel gears of less than one module. The gears are mounted together in a test rolling fixture with a variable mounting distance, which allows movement of the pinion in a direction at right angles to the pinion axis. The variations in mounting distance, which occur as the gears are rotated together in tight mesh, are either recorded on a chart or require the reading of a dial indicator.
Gear deviations evaluated by this method are tooth-to-tooth composite deviation and total composite deviation. Radial runout can also be evaluated in certain cases.
Copyright International Organization for Standardization Provided by IHS under license with ISO
Not for ResaleNo reproduction or networking permitted without license from IHS
The tooth-to-tooth composite deviation and total composite deviation can be evaluated by meshing with a reference gear which has smaller deviations than those expected in the gears to be measured.
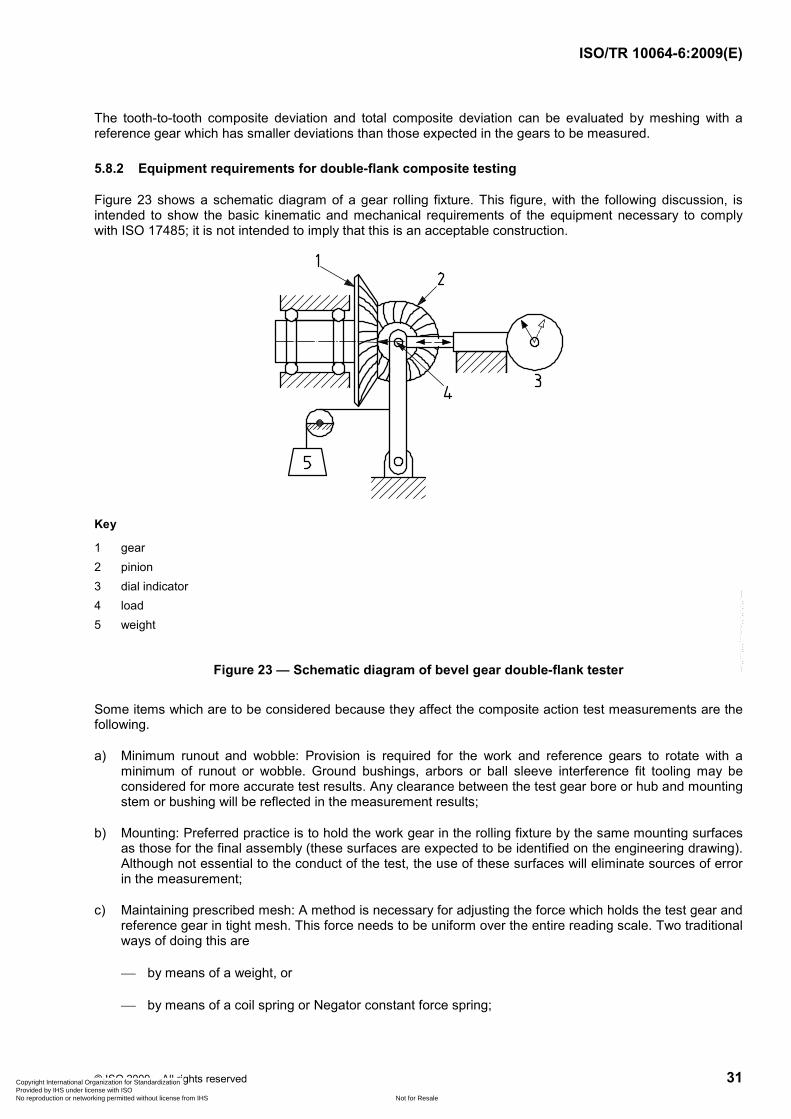
5.8.2 Equipment requirements for double-flank composite testing
Figure 23 shows a schematic diagram of a gear rolling fixture. This figure, with the following discussion, is intended to show the basic kinematic and mechanical requirements of the equipment necessary to comply with ISO 17485; it is not intended to imply that this is an acceptable construction.
Key
1 gear 2 pinion 3 dial indicator 4 load 5 weight
Figure 23 — Schematic diagram of bevel gear double-flank tester
Some items which are to be considered because they affect the composite action test measurements are the following.
a) Minimum runout and wobble: Provision is required for the work and reference gears to rotate with a minimum of runout or wobble. Ground bushings, arbors or ball sleeve interference fit tooling may be considered for more accurate test results. Any clearance between the test gear bore or hub and mounting stem or bushing will be reflected in the measurement results;
b) Mounting: Preferred practice is to hold the work gear in the rolling fixture by the same mounting surfaces as those for the final assembly (these surfaces are expected to be identified on the engineering drawing). Although not essential to the conduct of the test, the use of these surfaces will eliminate sources of error in the measurement;
c) Maintaining prescribed mesh: A method is necessary for adjusting the force which holds the test gear and reference gear in tight mesh. This force needs to be uniform over the entire reading scale. Two traditional ways of doing this are
⎯ by means of a weight, or
⎯ by means of a coil spring or Negator constant force spring;
Copyright International Organization for Standardization Provided by IHS under license with ISO
Not for ResaleNo reproduction or networking permitted without license from IHS
d) Changes in mounting distances: A provision is required for accurately indicating the changes in the mounting distance that occur during testing. This may be done by means of a dial indicator or a recording device. If a recorder is employed, it is desirable to have a definite relationship between the position on the chart and a circumferential position on either the work gear or reference gear. An accurate method is essential for calibrating the dial indicator or recording equipment over the working range;
e) Other considerations: Additional features which contribute to the ease of operation and accuracy of the results are:
⎯ adjustment method for quickly and accurately setting different mounting distances on the fixture;
⎯ a driving method to turn the gears at low speed in preference to turning them by hand; this reduces the chance that small deviations will be undetected if the gear is driven too fast and reduces handling of the master reference gear;
⎯ means for protecting the equipment from contaminants and accidental damage;
⎯ a solid base and controlled environment for measurement of gears of high accuracy.
5.8.3 Reference gears
Reference gears used for composite inspection may be one of two types of known quality:
⎯ a reference gear designed and manufactured specifically to measure the composite deviation of a work gear;
⎯ a selected mating gear of known accuracy, which must be verified by complete measurement.
5.8.4 Method of conducting double-flank composite inspection
The following procedure is to be applied when using the composite deviation test.
a) The gear to be measured and the reference gear are to be mounted on the gear rolling fixture. If mounting surfaces are specified, these are to be used. Set the checking load in accordance with 5.8.2.
b) The work gear is then rotated through at least one revolution in double-flank contact with the reference gear.
c) The work gear is to be accepted or rejected on the basis of the method given in 5.8. The interpretation of the loaded chart is given in Figure 24.
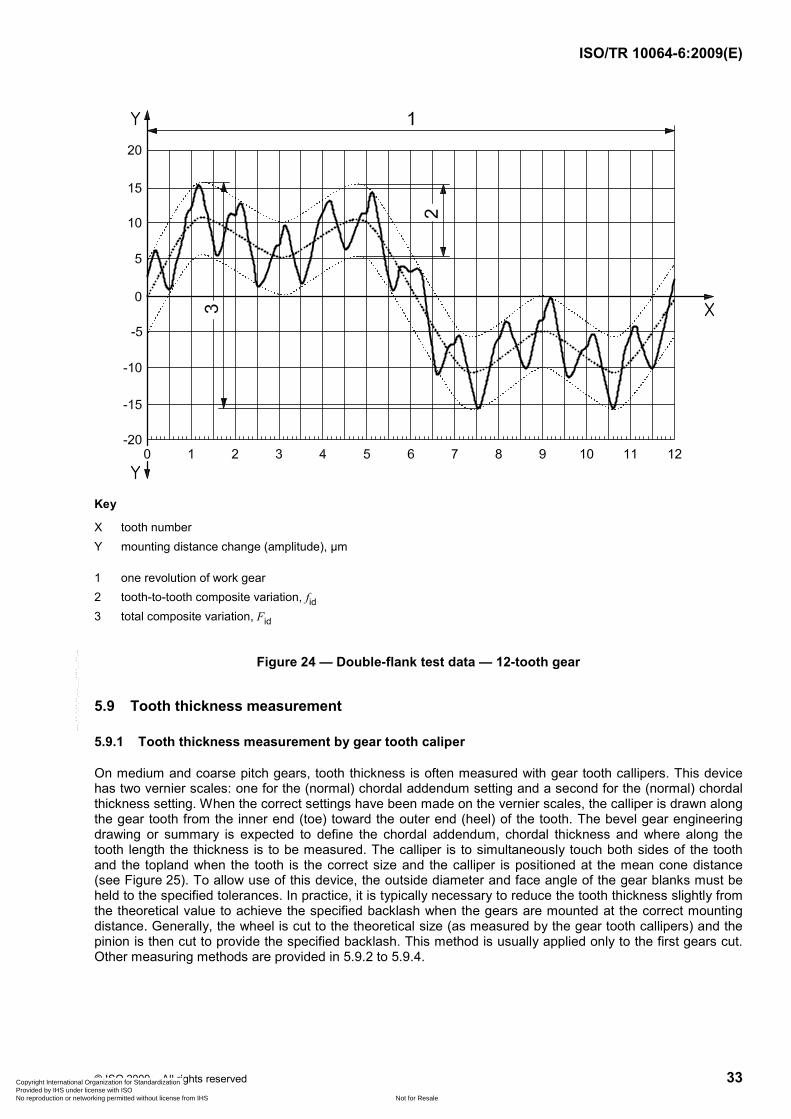
d) Total composite deviation, Fid, is the total change in mounting distance during one revolution of the work gear during a double-flank composite action test.
e) Tooth-to-tooth composite deviation, fid, is the mounting distance change within the smallest envelope that includes all the (360˚/z) changes in amplitude. This envelope is determined by establishing a mean waveform of the trace and moving it in the plus and minus amplitude directions to enclose all peaks; see Figure 24. The mean waveform can be established manually or by signal processing using a polynomial fit.
Annex D of ISO 17485:2006 gives additional information on the interpretation of composite data.
Copyright International Organization for Standardization Provided by IHS under license with ISO
Not for ResaleNo reproduction or networking permitted without license from IHS
X tooth number Y mounting distance change (amplitude), µm
1 one revolution of work gear 2 tooth-to-tooth composite variation, fid 3 total composite variation, Fid
Figure 24 — Double-flank test data — 12-tooth gear
5.9 Tooth thickness measurement
5.9.1 Tooth thickness measurement by gear tooth caliper
On medium and coarse pitch gears, tooth thickness is often measured with gear tooth callipers. This device has two vernier scales: one for the (normal) chordal addendum setting and a second for the (normal) chordal thickness setting. When the correct settings have been made on the vernier scales, the calliper is drawn along the gear tooth from the inner end (toe) toward the outer end (heel) of the tooth. The bevel gear engineering drawing or summary is expected to define the chordal addendum, chordal thickness and where along the tooth length the thickness is to be measured. The calliper is to simultaneously touch both sides of the tooth and the topland when the tooth is the correct size and the calliper is positioned at the mean cone distance (see Figure 25). To allow use of this device, the outside diameter and face angle of the gear blanks must be held to the specified tolerances. In practice, it is typically necessary to reduce the tooth thickness slightly from the theoretical value to achieve the specified backlash when the gears are mounted at the correct mounting distance. Generally, the wheel is cut to the theoretical size (as measured by the gear tooth callipers) and the pinion is then cut to provide the specified backlash. This method is usually applied only to the first gears cut. Other measuring methods are provided in 5.9.2 to 5.9.4.
Copyright International Organization for Standardization Provided by IHS under license with ISO
Not for ResaleNo reproduction or networking permitted without license from IHS
Figure 25 — Measurement of tooth thickness by means of a gear tooth calliper
5.9.2 Tooth thickness measurement by CNC and CMM
Some CNC and CMM instruments are available with special software for the measurement of bevel gear tooth forms. These software packages also have the capability to check tooth thickness. Measure at the midpoint of the grid, unless otherwise specified. See Figure 14.
5.9.3 Tooth thickness measurement by backlash
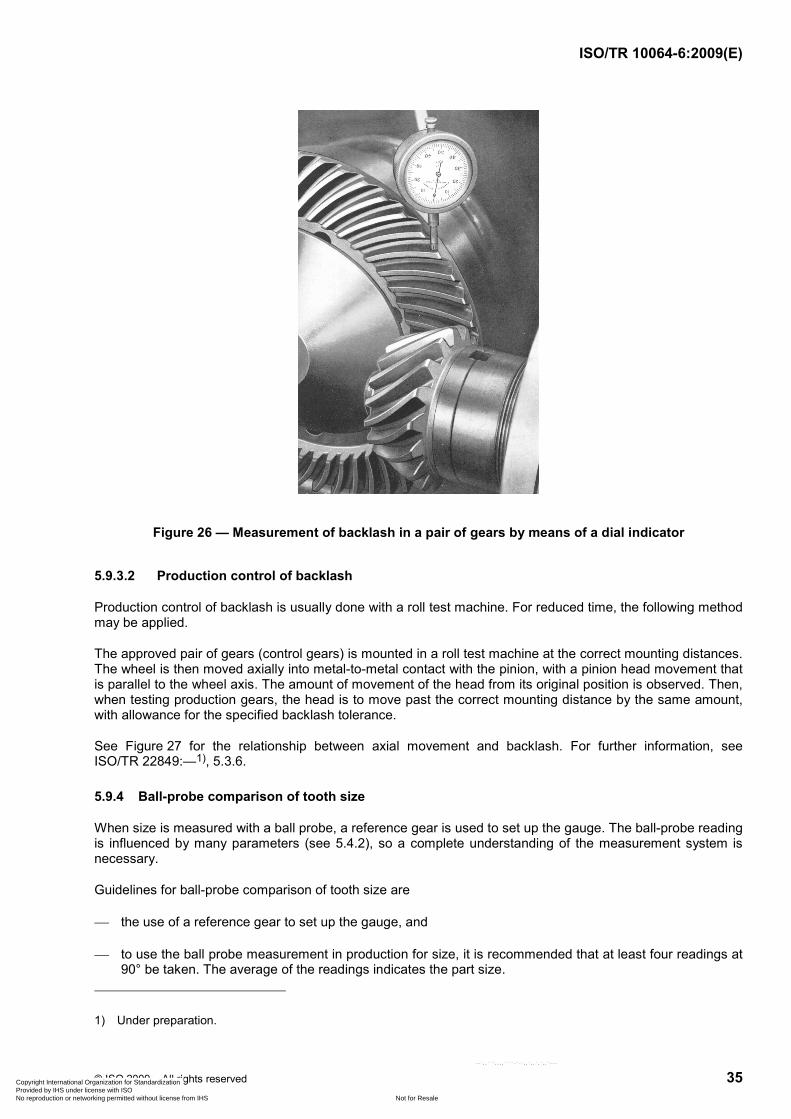
Traditionally, tooth thickness of manufactured bevel gears has been primarily controlled by backlash measurement in a roll test machine. Most bevel gear sets require a specific amount of backlash with tolerance. The backlash measurement is to be taken with the bevel pinion and wheel located at the correct mounting distances. See Figure 26. Also, see 4.5.2.
5.9.3.1 Measuring normal backlash
The bevel pinion and wheel are to be located at the correct mounting distances; depending on the circumstances, this may be in a roll test machine or in an assembled position. A dial indicator is positioned with the indicator axis normal to the bevel wheel tooth flank at the extreme heel position (Figure 26). The pinion is restrained from rotational motion and the wheel is rocked back and forth until the sides of the wheel tooth slot touch the sides of the pinion tooth. The backlash is read from the indicator and the measurement procedure is normally repeated three or four times at equally spaced increments around the wheel. The lowest reading is normally recorded as the backlash value for the particular bevel pinion and gear set.
Copyright International Organization for Standardization Provided by IHS under license with ISO
Not for ResaleNo reproduction or networking permitted without license from IHS
Figure 26 — Measurement of backlash in a pair of gears by means of a dial indicator
5.9.3.2 Production control of backlash
Production control of backlash is usually done with a roll test machine. For reduced time, the following method may be applied.
The approved pair of gears (control gears) is mounted in a roll test machine at the correct mounting distances. The wheel is then moved axially into metal-to-metal contact with the pinion, with a pinion head movement that is parallel to the wheel axis. The amount of movement of the head from its original position is observed. Then, when testing production gears, the head is to move past the correct mounting distance by the same amount, with allowance for the specified backlash tolerance.
See Figure 27 for the relationship between axial movement and backlash. For further information, see ISO/TR 22849:—1), 5.3.6.
5.9.4 Ball-probe comparison of tooth size
When size is measured with a ball probe, a reference gear is used to set up the gauge. The ball-probe reading is influenced by many parameters (see 5.4.2), so a complete understanding of the measurement system is necessary.
Guidelines for ball-probe comparison of tooth size are
⎯ the use of a reference gear to set up the gauge, and
⎯ to use the ball probe measurement in production for size, it is recommended that at least four readings at 90° be taken. The average of the readings indicates the part size.
1) Under preparation.
Copyright International Organization for Standardization Provided by IHS under license with ISO
Not for ResaleNo reproduction or networking permitted without license from IHS
Figure 27 — Axial movement per 0,025 mm change in backlash
5.10 Manufacturing applications
Bevel gear CMM measurements are commonly applied to assist with applications to the manufacturing process. The following are examples of these:
⎯ identification of master gears and master pinions for consistent control of the tooth geometry;
⎯ calculation of machine setting corrections to assist with routine adjustments to the machining process;
⎯ illustration of heat treat effects to allow comparison of tooth geometry before heat treat, after heat treat and with comparison to a manufacturing target.
6 Recommended datum surface tolerances
ISO/TR 22849 1) provides recommended tolerances for gear blanks. These tolerances may be required by the purchaser in some cases; if so, inclusion of gear blank tolerances is to be agreed upon by the manufacturer and purchaser.
Copyright International Organization for Standardization Provided by IHS under license with ISO
Not for ResaleNo reproduction or networking permitted without license from IHS


![Measuring Sensors Calibration in Worm Gear Rolling Testers · 2020. 8. 13. · standards for evaluation and instrumentation of gear measurement ISO 18653:2003 [17] and ISO/TR 10064-5:2005](https://static.documents.pub/doc/80x56/610fdf786e92d5446b2b0a03/measuring-sensors-calibration-in-worm-gear-rolling-testers-2020-8-13-standards.jpg)


