1- "105- IEPC-95-160 AXISYMMETRIC PIC-DSMC SIMULATIONS OF SPT PLUMES DAVID Y. OH* DANIEL HASTINGS' Abstract A computational model of a Stationary Plasma Thruster (SPT) plume has been constructing using a quasi-neutral Particle-in-Cell/Direct Simulation Monte Carlo (PIC-DSMC) model. This model is based on theoretical work showing that the plume consists of a quasi-neutral plasma with collisionless electrons in which the magnetic field can be neglected. The resulting axisymmetric simulation and its underlying assumptions are described in detail, and comparisons are made between the computational model and existing experimental measurements of the ion current density in the plume region. The comparison highlights weaknesses in both the model and the data. The simulated and experimental results agree well when two extra current sources are included in the computational model. These sources represent a lack of Xe" in the simulation and the presence of external current sources in the experimental tests. Although further work is needed, the results suggest that the simulation is accurately modeling the physics of the plume region and that it can give predictions of backflow currents under operational conditions. Further work is planned to include Xe" in future simulations. Nomenclature A = Thruster Exit Area ra = Insulator Ring Width B = Magnetic Field Strength tgloba = Global Time Count E = Electric Field t 1 o = Local Time Count E, = Radial Electric Field v 1 = Velocity Perpendicular to B field E, = Axial Electric Field v, = Axial Ion Velocity W,,, = Ion Macroparticle Weight u = Velocity W,,,,u = Neutral Macroparticle Weight z = Axial Position Te = Electron Temperature p = Random Number Between 0 and 1 T, = Ion Temperature d = Debye Length Z, = Ionization Number ,, = Electron-Neutral Mean Free Path ao = Speed of Sound .e = Electron-Electron Mean Free Path c, = Relative Speed between Collision Partners ,i = Electron-Ion Mean Free Path e = Elementary Charge = 1.6 x 10 " 19 C = 8.85 x 10¹² F/m Elementay Charge = 1.6 x C = Electrical Potential k = Boltzman's Constant = 1.38 x 10⁻²³ J/K Tj = Ionization Fraction m, = Electron mass = 9.11 x 10 31 kg. p, = Electron Gyro Radius m, = Xe ion mass = 2.18 x 10-" kg. p, = Ion Gyro Radius rmi = Anode Propellant Mass Flow Rate a = Collision Cross Section n, = Electron Number Density c = Charge Exchange Collision Cross Section S= Ion Number Density = Mean Electron-Self Collision Cross Section 1 n = Neutral Number Density , = Mean Ion-Electron Collision Cross Section n = Reference Electron Number Density 0 = Spitzr ogarito p = Pressure r = Radial Position ' Massachusetts Institute of Technology, 77 Massachusetts Avenue, Cambridge, MA 02139, USA I
Transcript
1- "105-IEPC-95-160
AXISYMMETRIC PIC-DSMC SIMULATIONS OF SPT PLUMES
DAVID Y. OH*DANIEL HASTINGS'
AbstractA computational model of a Stationary Plasma Thruster (SPT) plume has been constructing using a
quasi-neutral Particle-in-Cell/Direct Simulation Monte Carlo (PIC-DSMC) model. This model is basedon theoretical work showing that the plume consists of a quasi-neutral plasma with collisionlesselectrons in which the magnetic field can be neglected. The resulting axisymmetric simulation and itsunderlying assumptions are described in detail, and comparisons are made between the computationalmodel and existing experimental measurements of the ion current density in the plume region. Thecomparison highlights weaknesses in both the model and the data. The simulated and experimentalresults agree well when two extra current sources are included in the computational model. Thesesources represent a lack of Xe" in the simulation and the presence of external current sources in theexperimental tests. Although further work is needed, the results suggest that the simulation isaccurately modeling the physics of the plume region and that it can give predictions of backflowcurrents under operational conditions. Further work is planned to include Xe" in future simulations.
NomenclatureA = Thruster Exit Area ra = Insulator Ring WidthB = Magnetic Field Strength tgloba = Global Time CountE = Electric Field t1o = Local Time CountE, = Radial Electric Field v1 = Velocity Perpendicular to B fieldE, = Axial Electric Field v, = Axial Ion VelocityW,,, = Ion Macroparticle Weight u = VelocityW,,,,u = Neutral Macroparticle Weight z = Axial PositionTe = Electron Temperature p = Random Number Between 0 and 1T, = Ion Temperature d = Debye LengthZ, = Ionization Number ,, = Electron-Neutral Mean Free Pathao = Speed of Sound .e = Electron-Electron Mean Free Path
c, = Relative Speed between Collision Partners ,i = Electron-Ion Mean Free Pathe = Elementary Charge = 1.6 x 10"1 9 C = 8.85 x 10¹² F/mElementay Charge = 1.6 x C = Electrical Potential
k = Boltzman's Constant = 1.38 x 10⁻²³ J/K Tj = Ionization Fractionm, = Electron mass = 9.11 x 10³ 1 kg. p, = Electron Gyro Radiusm, = Xe ion mass = 2.18 x 10-" kg. p, = Ion Gyro Radiusrmi = Anode Propellant Mass Flow Rate a = Collision Cross Sectionn, = Electron Number Density c = Charge Exchange Collision Cross Section
S= Ion Number Density = Mean Electron-Self Collision Cross Section
1 n = Neutral Number Density , = Mean Ion-Electron Collision Cross Section
n = Reference Electron Number Density 0 = Spitzr ogaritop = Pressurer = Radial Position
' Massachusetts Institute of Technology, 77 Massachusetts Avenue, Cambridge, MA 02139, USA
I
- 1106- I
IIntroduction
When compared to chemical propulsion systems, electric propulsion offers substantial fuel savingsfor stationkeeping applications. One system which has shown particular promise is the StationaryPlasma Thruster (SPT), also referred to as the Hall Thruster. These devices have a near optimumspecific impulse for stationkeeping and one model, the SPT-100, is being actively marketed byRussian companies. Western designers have expressed concern that the SPT's plasma plume mayerode and contaminate sensitive surfaces, cause parasitic current losses, and interfere withcommunications signals. These concerns must be addressed before SPT's can be used for commercialapplications.
A critical step in addressing these issues is defining and modeling the characteristics of an SPTplume. Although much experimental work has been conducted on SPT thrusters,'' only limitedefforts have been made to model the processes occurring in the plume region.6 In addition, theexperiments to date have been conducted in vacuum tanks, and may not accurately simulate on-orbitconditions. More detailed and realistic models are needed to fully characterize the plume region and tounderstand the relationship between ground based experimental data and actual operational conditions.
One issue of major concern to spacecraft designers is the effect of charge exchange (CEX)collisions on ions in the plume region. A CEX collision occurs when a "slow" neutral and a "fast" ionexchange an electron to create a fast neutral and a slow ion. The resulting slow ion can be acceleratedback towards the spacecraft, creating backflow and impingement problems. This paper describes adetailed computational model of an SPT's plume region. The model uses a combination of particle-in-cell (PIC) and direct simulation Monte Carlo (DSMC) methods to model CEX collision and track ionsand neutrals in the plume region. The model runs quickly, compares favorably to experimental dataand can be used to model the plume on meter length scales. This paper describes the model in detail,presents results for an SPT-100 operating in an axisymmetric geometry, and compares the results toexisting experimental data. The paper also presents simulations of the SPT-100 operating underconditions which have not been studied in ground based tests. This paper concentrates on modeling ofthe SPT-100 because this is most extensively studied thruster at this time. The model can be modifiedand applied to other Hall thrusters as they are developed.
Section 1 presents the theoretical basis for our computational model. Section 2 describes the PIC-DSMC algorithm in detail and describes some of the tests used to verify the model. Section 3 presentssimulated results and compares them to existing experimental data. Section 4 presents conclusions anddiscusses plans for future work.
Section 1: Basic Theory and Fundamental ParametersThe SPT-100 thruster has been studied extensively in ground tests and many of its basic
characteristics are well documented. Table 1 summarizes some relevant results.
Inner Insulator Diameter' 56 mm The characteristics of the plume regioncan be estimated from Table 1 based on
Outer Insulator Diameter' 100 mm some simple assumptions. ThePropellant Xe approximate ion and neutral densities at the
Propellant Flow Rate' 5.0-5.2 mg./sec. exit are given by
Fraction of Propellant Directed -10% n 77lh/v Ato Cathode' no_ = (- ,)rh/aA (1)Electron Temperature5 (T) 2-4 eVElectron Temp 24 eV Substituting values from Table I gives exitAxial Ion Velocity' (v,) -16000 m/s densities of n, = 2.4 x 10¹⁷ m-3 and n, =Fraction of Propellant Ionized > 95% 9.3 x 10¹⁷ m 3. The plasma and neutralin Discharge Chamber' (l) densities downstream of the thruster can
Table 1: SPT-100 Basic Characteristics be estimated by assuming that the densityfalls as (ra/z)2, and results of this
I
calculation are given in Table 2. The resulting plasma densities are consistent with existingexperimental data.5 No experimental measurements are presently available for the neutral density.
Once the ion and neutral density are known, a variety of fundamental parameters can be calculated.Table 2 lists many of these parameters. The methods used to obtains these values and theirimplications for the computation model are discussed in the rest of this section.
I Radial Position Debye Length0.2 m 1.0 m The characteristic length over which charges are
n/n, 2.88 x 10's m -3 1.15 x 10¹⁴ m 3 neutralized in a plasma is given by the Debye length
"o 1.12 x 10¹⁶m-3 4.49 x 10¹⁴ m 3 d = EokTe/ne 2
B -1 G -0.01 G The Debye lengths shown in Table 2 are based on anXd 0.03 cm 0.14 cm electron temperature of 4 eV. These relatively smallp 6.7 cm 670 cm values indicate that the Debye length is small with
p 230 m >20000 m respect to features of interest in the plume region.Pi > m Even at z = 4 m, the Debye length is only 0.55 cm. ItX,, 85 m 340 m can therefore be assumed that the plume is quasi-, 130 m 3200 m neutral everywhere except in a thin sheath region near
" solid surfaces. We use this assumption to simplify our., 270 m 6700 m PIC model and avoid the direct solution of Poisson's
Table 2: Estimates of Fundamental equation. The details of our method are discussed inParameters in the Plume Region Section 2.
Gyro RadiusA magnetic field is present in an SPT's anode region to capture electrons and encourage impact
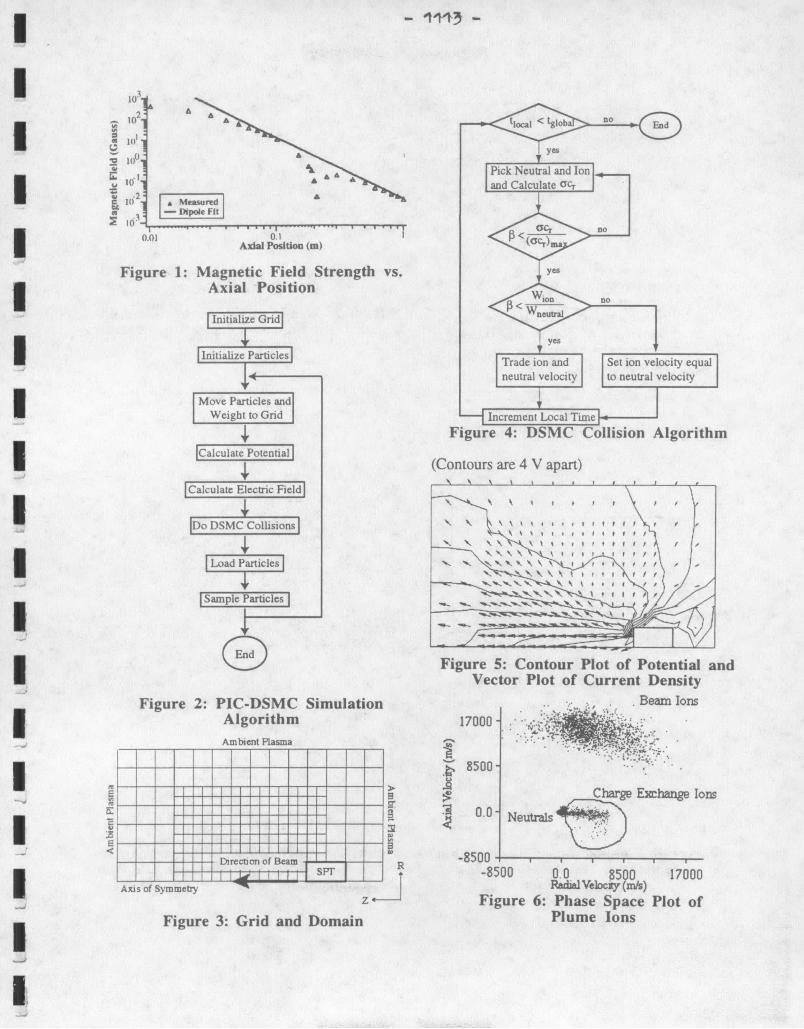
ionization of the Xe propellant. The extent to which this magnetic field "leaks" into the plume regionhas been measured experimentally, and is shown in Figure 1. The importance of the magnetic field inthe plume region is measured by the gyro radius, which is given by
P,/e = mi,evi / eB
The results shown in Table 2 demonstrate that the plume ions are effectively unmagnetized. Inaddition, although electrons are strongly magnetized inside the discharge chamber, the electron gyroradius becomes quite large 20 cm from the thruster and extremely large 1 m away. As a result, themagnetic field can be ignored at distances > 25 cm from the thruster exit. We note also that recentexperimental work suggests that plume characteristics are only indirectly affected by the magnetic field.The ion distribution appears to be determined well inside the thruster, and varying the strength of themagnetic field has no measurable influence on plume. 4 Since our simulation begins at the thruster exit,we choose to neglect the magnetic field throughout the plume region.
Mean Free PathThe importance of collisions is measured by the mean free path, which is given by the well known
relationshipA = l/(no') (2)
In an SPT plume, electrons can collide with three different species: ions, neutrals, and other electrons.Each species has its own collision cross section and mean free path. The total electron-Xe (neutral)collision cross section has been determined experimentally. For electrons with an average velocity of 4eV, the cross section is -2.6 x 10⁻¹⁹ m2.8 The resulting X,,'s are given in Table 2. These values arelarge with respect to the plume, indicating that if the electrons are unmagnetized, electron-neutralcollisions can be neglected.
The electron-electron and electron-ion collision cross sections are based on coulomb interactionsand can be calculated from theory. Banks has derived the average electron-ion cross section for T/m,>> T/m,.9 The result, in cgs units, is
I
- -1TCB -I
r (Z,e)2 lnA
2 (kT) 2 ,
Table 2 gives the resulting X,, with T, = 4 eV. These values are also extremely large when compared tofeatures of interest.
The mean self collision cross section for singly ionized species is given by' 0
,, (5.85 x10-'0o)n A / T, 2 2
For an electron temperature of 4 eV, this gives a = 2.7 x 10⁻¹ m2, which results in the ,,'s listed inTable 2. These values are also much larger than features of interest in the plume. Therefore, in theabsence of a magnetic field, electrons are effectively collisionless in the plume region.
One additional process of interest is charge exchange collisions. The cross section for CEX forsingly ionized Xenon is given by"
crEX = (k In c, + k) 2 . 10 m2 (3)where k, = -0.8821, k, = 15.1262 and c, is in m/s. Although the resulting mean free path is large, theresulting backflow is non-negligible and is included in our computational model.
In summary, the results shown in Table 2 indicate that the bulk of the SPT-100 plume consists of aquasi-neutral, unmagnetized plasma in which the electrons are effectively collisionless. In addition,although there is a small magnetized region in front of the thruster (z < 0.25 m), experimental worksuggests that the overall plume structure may be insensitive to changes in the strength of the magneticfield. We therefore choose to neglect the magnetic field throughout the plume region. Chargeexchange collisions are also of importance in the plume region. Although the CEX mean free path islong, the resulting backflow is non-negligible and should be included in any plume model.
Section 2: Computational ModelIn order to model the SPT-100 plume, we constructed a PIC-DSMC simulation of the plume
region. Our model is a combination of the PIC and DSMC methods as described by Birdsall2 andBird13 respectively. Since these methods are well known individually, only features specific to thismodel will be described in detail. A flowchart of our basic method is shown in Figure 2.
The plume simulation moves both ions and neutrals by integrating the particle equations of motionusing the leapfrog method. In axisymmetric coordinates, the equations of motion (without collisions)are
i:-r6 = qE, / m, r +2r = 0 = = qE / m,
The electric field is determined by differentiating the potential. In conventional PIC schemes, thepotential is obtained by solving Poisson's equation. In a quasi-neutral plasma, however, the potentialcan be obtained by inverting the electron momentum equation. For collisionless, unmagnetizedelectrons, the momentum equation is
m,n,(u V)u = en,E - Vp
At low drift velocities, the first (inertial) term can be neglected. We also assume that the electrons areisothermal, resulting in the familiar Boltzman relationship.
n, = n, exp(e0 / kT,) (4)
The potential is obtained using the following procedure. The ion density is determined by weightingmacroparticles to the nodes of an embedded grid. The weighting functions for an axisymmetricgeometry were worked out by Ruytan, and are given by "'
I Where S is the weighting factor and subscripts refer to grid coordinates. Since the plume is quasi-neutral, the electron density can be set equal to the ion density. Equation (4) can then inverted toobtain the potential, thus avoiding the direct solution of Poisson's equation. The result is a fastmethod which is free of many of the restrictions present on conventional PIC codes. Because theplasma is assumed to be quasi-neutral, the Debye length does not limit the size of the grid cells.Instead, grid cell sizes are limited by geometry and the need to resolve potential gradients. Similarly,time steps are limited by energy conservation and the need to ensure that particles move a smalldistance relative to the width of local potential gradients. In practice, we insure that the fastest beamions in the simulation move no more than one grid cell in each time step.
CEX collisions are modeled between move steps using a modified DSMC method which is outlinedin Figure 4. A conventional selection-rejection scheme is used to determine collision pairs and thelocal time counter method is used to determine collision frequencies. When a collision takes placebetween two particles with equal weights, the ion and neutral particle velocities are exchanged, thuscreating a "slow" ion and a "fast" neutral. If the simulated neutrals have a larger macroparticle weightthan the simulated ions, an additional Monte Carlo selection is made to determine whether the neutralvelocity should be modified. This ensures that the total energy and momentum in the simulation arestatistically conserved over many collisions. In the limit as the weights become equal, our schemebecomes a conventional DSMC method. In the other limit, as the neutral weight becomes infinitelylarge, our scheme approaches the conditions simulated in a PIC-MCC method. We use equal weightswhen simulating an SPT-100 operating in vacuum and unequal weights when simulating ground tests.In all cases, all members of one species (either ions or neutrals) have the same macroparticle weight.The same grid is used for both the PIC and DSMC parts of the simulation.
The accuracy of our DSMC algorithm was tested by simulating a collimated beam of ions entering astationary neutral gas and comparing the results to theory. The simulated collision frequency wasshown to be accurate as long as more than twenty macro particles (ten from each species) were presentin the cell. The results shown in this paper are all produced with at least forty macro particles (twentyfrom each species) present in each cell.
Particles are loaded into the simulation at each time step to simulate the exit flow from an SPT-100.The number of ions and neutrals introduced in each time step is determined using equation (1) andassumes that the flow is 95% ionized. The ion distribution is determined from an empirical modeldeveloped from experimental measurements of the ion current density 4 mm from the thruster exit. 5
These measurements give the magnitude and direction of the ion current as a function of radial positionat an unspecified propellant flow rate. We found that the measured current density can be described bythe following functions
a = 1730 - 2.30 x 10⁵ r + .06x 107 r2 -2.05 x 10r+ .45 x 109 r4 (5)
Sj= -1210+ 8.40 x10⁴ r- 1.78 x 10⁶ r2 + 1.18 x 10⁷ r (6)
Where a is the divergence angle in degrees, j is the current density in mA/cm 2 and r is the radialposition in meters. A model for the ion distribution is derived by assuming that ions leave the thrusterwith a drift velocity of 16000 m/s in the r/z plane. Variations in current density then correspond tovariations in number density. Equation (6) can be normalized by the integrated beam current to give
Equation (7) gives the probability that an ion crossing the exit plane has a radial position less than r.The following procedure can therefore be used to load plume ions. A random number P is chosenbetween 0 and 1. Equation (7) is then inverted computationally to give the particle's radial position.Equation (5) can then used to determine the particle's divergence angle. The divergence angle, in turn,can be used to calculate the axial and radial drift velocities. Finally, thermal components are added inthe axial and radial direction based on temperatures of 3.4 eV and 8000 K respectively. The axialtemperature matches measurements made by Manzella, 3 and the radial velocity is a reasonable guess.The particle's tangential velocity is determined independently by assuming a drift velocity of 250 m/sand a temperature of 800 K. These values also match measurements made by Manzella 3.
I
Because the cathode can not be directly included in an axisymmetric geometry, the propellant whichnormally flows through the cathode was assumed to flow through the anode as unionized propellant.The neutral distribution has not been measured in the plume region, so we assume that the neutralshave a temperature of 1000 K and are choked at the thruster exit In order to verify the accuracy of ourmodel, the kinetic and potential energy in the simulation were tracked and it was shown that energywas properly conserved in steady state. The final simulation was written in C and runs were carriedout on a Digital Equipment Alpha 200 Workstation with 64 megabytes of RAM. Run times weretypically between 2 and 4 hours.
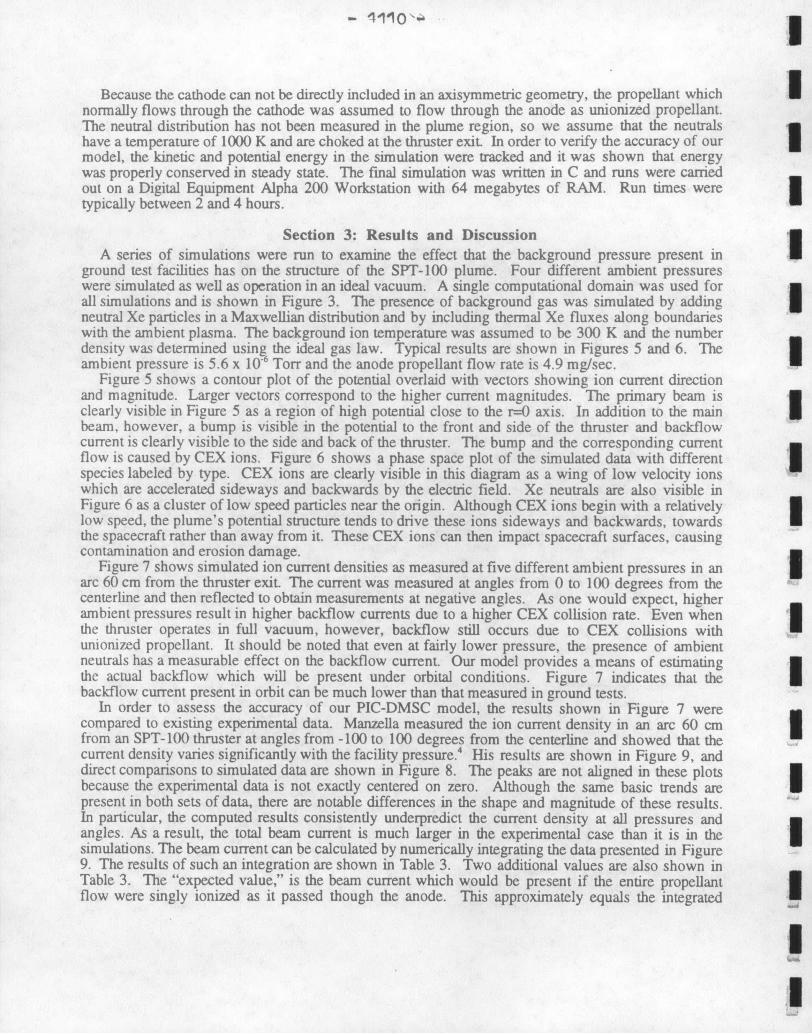
Section 3: Results and DiscussionA series of simulations were run to examine the effect that the background pressure present in
ground test facilities has on the structure of the SPT-100 plume. Four different ambient pressureswere simulated as well as operation in an ideal vacuum. A single computational domain was used forall simulations and is shown in Figure 3. The presence of background gas was simulated by addingneutral Xe particles in a Maxwellian distribution and by including thermal Xe fluxes along boundarieswith the ambient plasma. The background ion temperature was assumed to be 300 K and the numberdensity was determined using the ideal gas law. Typical results are shown in Figures 5 and 6. Theambient pressure is 5.6 x 10⁶ Torr and the anode propellant flow rate is 4.9 mg/sec.
Figure 5 shows a contour plot of the potential overlaid with vectors showing ion current directionand magnitude. Larger vectors correspond to the higher current magnitudes. The primary beam isclearly visible in Figure 5 as a region of high potential close to the r=0 axis. In addition to the mainbeam, however, a bump is visible in the potential to the front and side of the thruster and backflowcurrent is clearly visible to the side and back of the thruster. The bump and the corresponding currentflow is caused by CEX ions. Figure 6 shows a phase space plot of the simulated data with differentspecies labeled by type. CEX ions are clearly visible in this diagram as a wing of low velocity ionswhich are accelerated sideways and backwards by the electric field. Xe neutrals are also visible inFigure 6 as a cluster of low speed particles near the origin. Although CEX ions begin with a relativelylow speed, the plume's potential structure tends to drive these ions sideways and backwards, towardsthe spacecraft rather than away from it. These CEX ions can then impact spacecraft surfaces, causingcontamination and erosion damage.
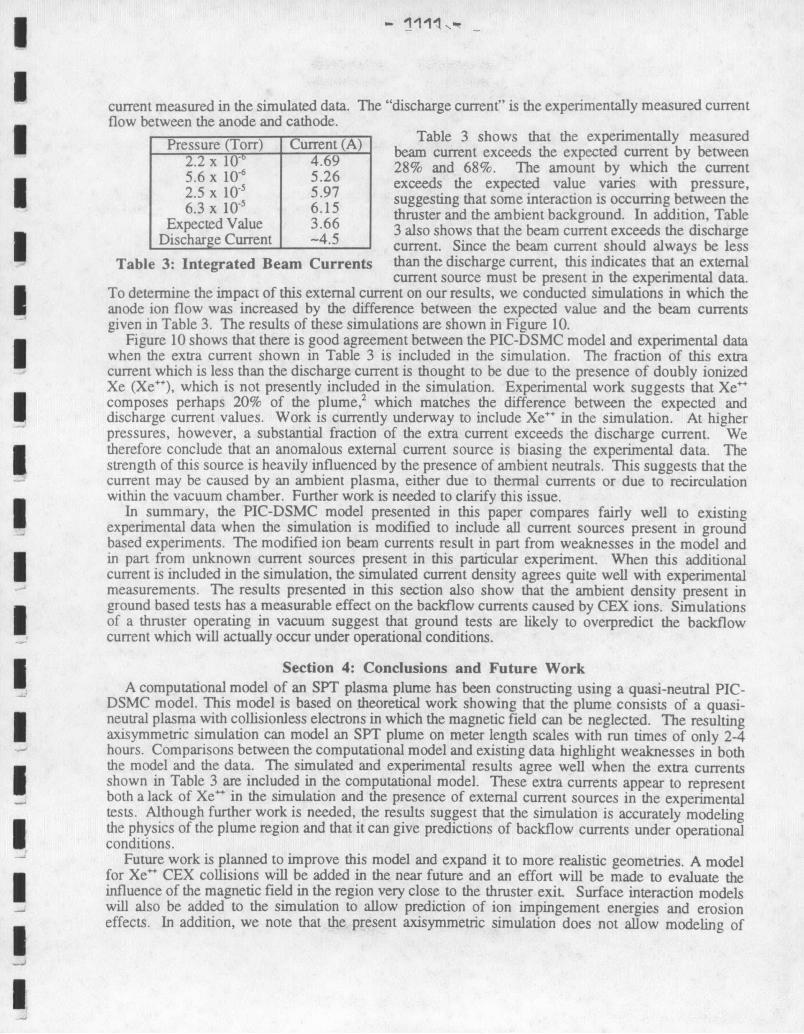
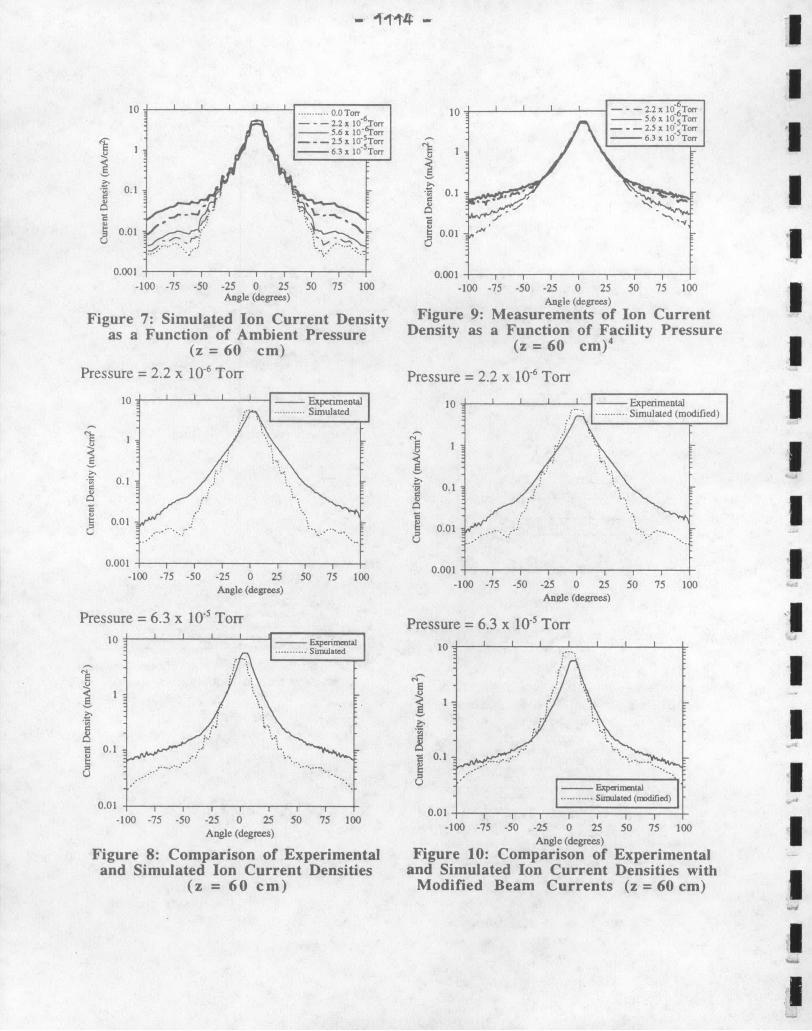
Figure 7 shows simulated ion current densities as measured at five different ambient pressures in anarc 60 cm from the thruster exit. The current was measured at angles from 0 to 100 degrees from thecenterline and then reflected to obtain measurements at negative angles. As one would expect, higherambient pressures result in higher backflow currents due to a higher CEX collision rate. Even whenthe thruster operates in full vacuum, however, backflow still occurs due to CEX collisions withunionized propellant. It should be noted that even at fairly lower pressure, the presence of ambientneutrals has a measurable effect on the backflow current. Our model provides a means of estimatingthe actual backflow which will be present under orbital conditions. Figure 7 indicates that thebackflow current present in orbit can be much lower than that measured in ground tests.
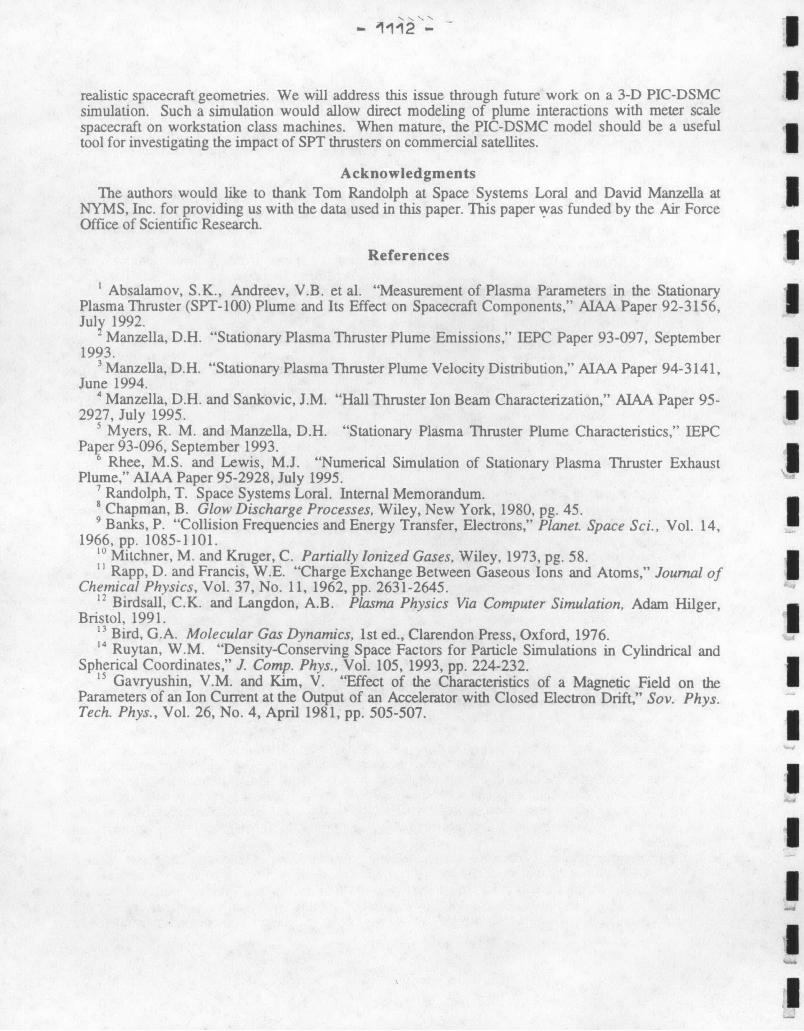
In order to assess the accuracy of our PIC-DMSC model, the results shown in Figure 7 werecompared to existing experimental data. Manzella measured the ion current density in an arc 60 cmfrom an SPT-100 thruster at angles from -100 to 100 degrees from the centerline and showed that thecurrent density varies significantly with the facility pressure.4 His results are shown in Figure 9, anddirect comparisons to simulated data are shown in Figure 8. The peaks are not aligned in these plotsbecause the experimental data is not exactly centered on zero. Although the same basic trends arepresent in both sets of data, there are notable differences in the shape and magnitude of these results.In particular, the computed results consistently underpredict the current density at all pressures andangles. As a result, the total beam current is much larger in the experimental case than it is in thesimulations. The beam current can be calculated by numerically integrating the data presented in Figure9. The results of such an integration are shown in Table 3. Two additional values are also shown inTable 3. The "expected value," is the beam current which would be present if the entire propellantflow were singly ionized as it passed though the anode. This approximately equals the integrated
I - 111.' _
current measured in the simulated data. The "discharge current" is the experimentally measured currentflow between the anode and cathode.
orr) Crret (A Table 3 shows that the experimentally measuredPressure ( ) Current (A) beam current exceeds the expected current by between
2.2 x 10- 4.69 28% and 68%. The amount by which the current5.6 x 10"6 5.26 exceeds the expected value varies with pressure,2.5 x 10' 6.97 suggesting that some interaction is occurring between the6.3 x 10p 6.15 thruster and the ambient background. In addition, Table
Expected Value 3.66 3 also shows that the beam current exceeds the dischargeDischarge Current -4.5 current. Since the beam current should always be less
Table 3: Integrated Beam Currents than the discharge current, this indicates that an externalcurrent source must be present in the experimental data.
To determine the impact of this external current on our results, we conducted simulations in which theanode ion flow was increased by the difference between the expected value and the beam currentsgiven in Table 3. The results of these simulations are shown in Figure 10.
Figure 10 shows that there is good agreement between the PIC-DSMC model and experimental datawhen the extra current shown in Table 3 is included in the simulation. The fraction of this extracurrent which is less than the discharge current is thought to be due to the presence of doubly ionizedXe (Xe"), which is not presently included in the simulation. Experimental work suggests that Xe"composes perhaps 20% of the plume, 2 which matches the difference between the expected anddischarge current values. Work is currently underway to include Xe" in the simulation. At higherpressures, however, a substantial fraction of the extra current exceeds the discharge current. Wetherefore conclude that an anomalous external current source is biasing the experimental data. Thestrength of this source is heavily influenced by the presence of ambient neutrals. This suggests that thecurrent may be caused by an ambient plasma, either due to thermal currents or due to recirculationwithin the vacuum chamber. Further work is needed to clarify this issue.
In summary, the PIC-DSMC model presented in this paper compares fairly well to existingexperimental data when the simulation is modified to include all current sources present in groundbased experiments. The modified ion beam currents result in part from weaknesses in the model andin part from unknown current sources present in this particular experiment. When this additionalcurrent is included in the simulation, the simulated current density agrees quite well with experimentalmeasurements. The results presented in this section also show that the ambient density present inground based tests has a measurable effect on the backflow currents caused by CEX ions. Simulationsof a thruster operating in vacuum suggest that ground tests are likely to overpredict the backflowcurrent which will actually occur under operational conditions.
Section 4: Conclusions and Future WorkA computational model of an SPT plasma plume has been constructing using a quasi-neutral PIC-
DSMC model. This model is based on theoretical work showing that the plume consists of a quasi-neutral plasma with collisionless electrons in which the magnetic field can be neglected. The resultingaxisymmetric simulation can model an SPT plume on meter length scales with run times of only 2-4hours. Comparisons between the computational model and existing data highlight weaknesses in boththe model and the data. The simulated and experimental results agree well when the extra currentsshown in Table 3 are included in the computational model. These extra currents appear to representboth a lack of Xe" in the simulation and the presence of external current sources in the experimentaltests. Although further work is needed, the results suggest that the simulation is accurately modelingthe physics of the plume region and that it can give predictions of backflow currents under operationalconditions.
Future work is planned to improve this model and expand it to more realistic geometries. A modelfor Xe" CEX collisions will be added in the near future and an effort will be made to evaluate theinfluence of the magnetic field in the region very close to the thruster exit. Surface interaction modelswill also be added to the simulation to allow prediction of ion impingement energies and erosioneffects. In addition, we note that the present axisymmetric simulation does not allow modeling of
I
1112 - 1realistic spacecraft geometries. We will address this issue through future work on a 3-D PIC-DSMCsimulation. Such a simulation would allow direct modeling of plume interactions with meter scalespacecraft on workstation class machines. When mature, the PIC-DSMC model should be a usefultool for investigating the impact of SPT thrusters on commercial satellites.
AcknowledgmentsThe authors would like to thank Tom Randolph at Space Systems Loral and David Manzella at
NYMS, Inc. for providing us with the data used in this paper. This paper was funded by the Air ForceOffice of Scientific Research.
References I' Absalamov, S.K., Andreev, V.B. et al. "Measurement of Plasma Parameters in the Stationary
Plasma Thruster (SPT-100) Plume and Its Effect on Spacecraft Components," AIAA Paper 92-3156,July 1992.
4 Manzella, D.H. and Sankovic, J.M. "Hall Thruster Ion Beam Characterization," AIAA Paper 95-2927, July 1995.
' Myers, R. M. and Manzella, D.H. "Stationary Plasma Thruster Plume Characteristics," IEPCPaper 93-096, September 1993.
SRhee, M.S. and Lewis, M.J. "Numerical Simulation of Stationary Plasma Thruster ExhaustPlume," AIAA Paper 95-2928, July 1995.
7Randolph, T. Space Systems Loral. Internal Memorandum.SChapman, B. Glow Discharge Processes, Wiley, New York, 1980, pg. 45.9 Banks, P. "Collision Frequencies and Energy Transfer, Electrons," Planet. Space Sci., Vol. 14,
1966, pp. 1085-1101.10 Mitchner, M. and Kruger, C. Partially Ionized Gases, Wiley, 1973, pg. 58.' Rapp, D. and Francis, W.E. "Charge Exchange Between Gaseous Ions and Atoms," Journal of
Chemical Physics, Vol. 37, No. 11, 1962, pp. 2631-2645.12 Birdsall, C.K. and Langdon, A.B. Plasma Physics Via Computer Simulation, Adam Hilger,Bristol, 1991.
"3 Bird, G.A. Molecular Gas Dynamics, 1st ed., Clarendon Press, Oxford, 1976.14 Ruytan, W.M. "Density-Conserving Space Factors for Particle Simulations in Cylindrical and
Spherical Coordinates," J. Comp. Phys., Vol. 105, 1993, pp. 224-232.15 Gavryushin, V.M. and Kim, V. "Effect of the Characteristics of a Magnetic Field on the
Parameters of an Ion Current at the Output of an Accelerator with Closed Electron Drift," Sov. Phys.Tech. Phys., Vol. 26, No. 4, April 1981, pp. 505-507.
I
o 102 A tocal < tglob no E1 1 A A -o
u 1 P ic k N e ut ra l a nd Io n
St 10 and Calculate OrI 12 MeasuredS- Ipole Fit
0.01 0.1 < C o
Axial Position (m) (cm
Figure 1: Magnetic Field Strength vs. yesAxial Position
Gdon no
|Initialize Grid n
yes
Initialize Particles[-In-itialize PTrade ion and Set ion velocity equalneutral velocity to neutral velocity
Move Particles andWeight to Grid Increment Local Time
Figure 7: Simulated Ion Current Density Figure 9: Measurements of Ion Currentas a Function of Ambient Pressure Density as a Function of Facility Pressure
(z = 60 cm) (z = 60 cm)4
Pressure = 2.2 x 10⁻⁶ Torr Pressure = 2.2 x 10⁻⁶ Torr
10 - I 1 I - Expenmental 10 I I- Experimental........... Simulated .......... Simulated (modified)