31
ECONOMICS GAS MARKET INTEGRATION: GLOBAL TRENDS AND IMPLICATIONS FOR THE EAS REGION by Yanrui Wu Business School University of Western Australia DISCUSSION PAPER 11.20
| Date post: | 02-May-2018 |
| Category: |
Documents |
| Upload: | vuongduong |
| View: | 218 times |
| Download: | 1 times |
ECONOMICS
GAS MARKET INTEGRATION: GLOBAL TRENDS AND IMPLICATIONS FOR THE
EAS REGION
by
Yanrui Wu
Business School University of Western Australia
DISCUSSION PAPER 11.20

GAS MARKET INTEGRATION:
GLOBAL TRENDS AND IMPLICATIONS FOR THE
EAS REGION
Yanrui WU
UWA Business School University of Western Australia
November 2011
DISCUSSION PAPER 11.20
Abstract: East Asia is already the main destination of the world’s commercial liquefied natural gas (LNG). However, the gas markets in the EAS area are either underdeveloped or fragmented. The objectives of this study are twofold, namely, i) to present a review of the trends in global gas market integration and ii) to draw implications and make recommendations for gas market development in the EAS area. To achieve the goal of an integrated gas market in the EAS region, governments in member economies must work together to implement a plan. Specifically, four recommendations are made to the EAS states: adopt a formal program to promote and nurture the development of gas markets in member states and phased sectoral reforms in relatively mature markets; set targets to gradually harmonise regulatory and technical standards in the gas sector; coordinate better to promote their “gas” causes; and boost cross-border connectivity and trading within the area and eventually achieve regional gas market integration.
Keywords: Gas market integration, Energy market, EAS region.
JEL Classification: Q40, Q48
Yanrui Wu is Professor of Economics, Business School, UWA. This paper is part of the outcomes of the project on Energy Market Integration in the East Asia Summit Region conducted by Economic Research Institute for ASEAN and East Asia (ERIA). I am grateful for the financial support provided by ERIA. I thank Philip Andrews-Speed, Fukunari Kimura (project leader), Xunpeng Shi (project coordinator), Jianping Zhang, two anonymous project team members and participants of two workshops at ERIA for helpful comments and suggestions. Email: [email protected].

1
1. Introduction
Natural gas as a source of cleaner fuels is important in many economies and will
increasingly be so important globally. However, many gas markets in the world are
either under-developed or fragmented. As trade in gas led by LNG trade increases,
market integration as occurred in other sectors has been promoted in various regions of
the world. The objective of this document is to review trends in the world’s major gas
markets, examine the status of market integration and draw policy implications for gas
market integration in the East Asia Summit (EAS) area. The rest of the paper begins
with a brief review of global gas markets, in particular gas consumption and trade in the
EAS area. This is followed by an examination of gas market integration in the United
States (US) and European Union (EU) which are the world’s two largest gas consumers.
Subsequently gas market development in individual EAS member economies is
explored. Finally implications and recommendations for gas market integration in the
EAS area are discussed.
2. Global Gas Markets
The latest statistics show that in 2010 global gas production of 3193 billion cubic
metres (bcm) and consumption of 3169 bcm were almost balanced with a small surplus.
Europe and North America account for the lion’s share of total consumption though the
shares of the Asia Pacific and Middle East regions are increasing over time (Figure 1).
Among the regions, Europe, North America and the Asia Pacific are the net importing
regions. In 2010, about 30.8% (975 bcm) of the total volume of natural gas consumed
were traded through either pipelines (21.4%) or LNG trade (9.4%).1 As gas resource
distribution is geographically unbalanced, the top five traders accounted for about a half
of the market share. Specifically, the top five exporters (Russia, Norway, Qatar, Canada
and Algeria) provided more than a half of the traded gas. The top importers were in
1 LNG is often measured in terms of millions of tons (MTs). 1 MT of LNG is equivalent to 1.38 bcm of natural gas (EIA, 2003).

2
turn the US, Japan, Germany, Italy and the UK which also purchased about 50% of the
gas traded internationally (Table 1).
Figure 1. World Gas Consumption by Region, 2010
Note: Data are drawn from BP (2011a).
Table 1. Major Gas Traders, 2010
World top importers World top exporters
Countries Volume (bcm) Countries Volume (bcm)
US 105.5 Russia 199.9
Japan 93.5 Norway 100.6
Germany 92.8 Qatar 94.9
Italy 75.3 Canada 92.4
UK 53.6 Algeria 55.8
EAS importers EAS exporters
Countries Volume (bcm) Countries Volume (bcm)
South Korea 44.4 Indonesia 41.2
China 16.4 Malaysia 32.0
India 12.2 Australia 25.4
Thailand 8.8 Brunei 8.8
Singapore 8.4 Myanmar 8.8
Note: Data are drawn from BP (2011a).

3
As both the US and Germany also exported natural gas, Japan was effectively the
world’s largest net gas importer in 2010.2 Apart from Japan, other important gas
importers in the EAS area include South Korea, China and India.3 In 2010, the largest
gas exporters in the EAS area were Indonesia, Malaysia and Australia (Table 1). In
absolute terms, EAS importers and exporters (with the exception of Japan) are not yet
compatible with the top players in the world. But this situation may change in the
coming decades. China’s and India’s gas imports will continue to grow and become
key buyers in the global markets. Australia has the potential to become one of the
world’s largest gas exporters.
In the past decade (2001-2010), global demand for natural gas has increased
steadily with an average rate of growth of 2.8% per annum (BP, 2011a). The share of
natural gas in primary energy consumption was about 24% in 2010.4 By 2030 world
primary energy consumption is projected to increase by 39% with an annual rate of
growth of 1.7% (BP, 2011b). More than half (57%) of the projected growth
in energy consumption will originate from power generation. The shares of gas and
non-fossil fuels are expected to gain at the expense of coal and oil. Among the fossil
fuels, natural gas consumption is projected to grow fastest, with an annual rate of 2.1%
(Table 2). This growth rate projection is slightly higher than the average annual rate of
1.8% during 2008-2035 forecasted by IEA (2011). Non-OECD economies would
contribute 80% of the increase in gas consumption (BP, 2011b). By 2030 natural gas,
oil and coal could converge to market shares of approximately 26% each in primary
energy consumption, with the remaining 22% being equally divided among the major
non-fossil fuels, namely, nuclear, hydro and renewables (BP, 2011b). Similar
projections are also reported by IEA (2011) in which the predicted shares of coal, oil
and natural gas in primary energy consumption are 22%, 27% and 25%, respectively.
The driving forces for the growth in natural gas consumption are the increased use for
electricity generation (with a growth rate of 2.6% per annum) and industrial activities
(2.0% per annum) (Table 2). Part of this consumption growth would be met by
2 In 2010 gas exports from the US and Germany were 32 bcm and 15 bcm, respectively (BP, 2011a). 3 It is noted that Taiwan’s gas imports in 2010 amounted to 14.9 bcm and was hence effectively the fourth largest importers in East Asia (BP, 2011a). 4 This figure is estimated using information from BP (2011b).

4
increased LNG supply, which is projected to expand at the rate of 4.4% per annum
during 2010-2030. If this growth target is reached, the LNG share in global gas supply
would increase from 9% in 2010 to 15% in 2030 (BP, 2011b).
Table 2. Projected Average Growth Rates (%)
Categories BP IEA
2010-2030 2008-2035
Primary energy consumption 1.7 1.2
Hydro 2.0 2.1
Renewables 8.2 2.6
Nuclear 2.9 1.9
Coal 1.2 0.4
Oil 0.9 0.4
Gas 2.1 1.8
OECD 1.0 0.9
Non-OECD 3.0 2.6
Non-OECD Asia 4.6 4.9
China 7.6 7.7
India 4.7 6.5
Power 2.6 1.9
Industrial use 2.0
LNG 4.4
OECD 5.2
Non-OECD 8.2
Note: Data are drawn from BP (2011b) and IEA (2011).
The largest increase in gas consumption would be from the EAS region. Demand is
expected to grow at the annual rate of 4.6% during 2010-2030 in Asia excluding Japan
(BP, 2011b). Growth in gas consumption would be particularly fast in the two
emerging giants, namely China (7.6% per annum) and India (4.7% per annum). Natural
gas consumption would amount to 9% of China’s primary energy consumption in 2030.
In 2010, 4% of Chinese energy consumption was natural gas. Growth would also be
strong in ASEAN. This is confirmed by IEEJ (2009) which predicts that ASEAN as a
group would enjoy a rate of annual growth of 4.5% during 2010-2020 and 5.5% during
2020-2030.
The growth in demand for LNG is projected to be around 8.2% per annum in Asia
excluding Japan. More than 74% of the increased LNG demand would be from China
5
and India (BP, 2011b). Australia is expected to overtake Qatar to become the world’s
largest LNG exporter around 2020. In the aftermath of the Fukushima nuclear power
plant accident in Japan, many countries’ policy makers will revisit their nuclear energy
programs. This could lead to even more consumption of natural gas in electricity
generation in the coming decades.
3. Market Integration Initiatives
For decades, gas markets or pipeline gas markets mainly exist locally or regionally.
Trade in gas has been limited due to geographic distance. As the oil price increases and
the world’s environmental condition deteriorates, natural gas as a cleaner energy
becomes more affordable and increasingly a tradable good. Market integration, both
sub-regionally and globally, then emerges as a goal to be pursued in many parts of the
world. The economic rationale for market integration is well documented in the
literature (Williamson, 1996 and Majone, 1996). Specifically, there are several factors
which are driving gas market integration in the world. The first factor is the increasing
demand for gas consumption due to rising world energy prices and hence increasing
affordability to consumers. As a result, numerous local or national gas markets have
emerged in the world. In the midst of global economic integration, policy makers in the
world economies are keen to promote the link and integration between various gas
markets as it has occurred in other economic areas such as the manufacturing sectors
and telecommunications. Second, the expansion of LNG trade has made it possible for
the emergence of a global gas market where gas can be sold at spot prices or with long
term contracts. In 2010, LNG accounted for 30.5% of total gas traded (BP, 2011a).
Third, market integration is promoted as a measure to provide the security of gas supply
and hence the stability of gas prices.
Various initiatives towards gas market integration have been proposed or
implemented so far. In particular the two major gas-consuming regions, namely, the
United States (US) and European Union (EU), are leading the world in the promotion of
market liberalization and integration. In the United States, gas market regulation began
6
in 1938 when the Natural Gas Act was enacted to guide interstate gas transmission and
sales. However, it was in 1978 when the Natural Gas Policy Act was promulgated that
gas market liberalization began. The implementation of the Natural Gas Policy Act
helped create a single national natural gas market, equalize supply with demand and let
market forces establish the wellhead price of natural gas. In 1985, the Federal Energy
Regulatory Commission (FERC) issued Order No. 436 which changed how interstate
pipelines were regulated and provided pipeline customers more flexibility in purchasing
natural gas and making transportation arrangements. The era of open access began (and
hence Order No. 436 is also called the Open Access Order). Later, under FERC Order
No. 636 (1992), interstate pipeline services were further restructured. Under FERC
Order No. 436, pipeline unbundling was voluntary. Order No. 636 made unbundling
mandatory. That is, interstate pipelines are required to 'unbundle' their services;
essentially separating the sales of natural gas from its transportation.
Due to production deregulation and open access to the interstate gas pipelines,
active spot markets for wholesale natural gas throughout the pipeline network emerged
rapidly. Through these markets, a large number of gas consumers buy gas directly from
a large number of gas sellers on a short-term basis. The spot market share over total gas
consumption in the US increased dramatically from 5% in 1983 to 70% in 1987
(Sutherland, 1993). Cuddington and Wang (2006) provide empirical evidence of
market integration in the East and Central regions during the 1990s. These authors also
argue that limited physical connectivity between the West and other regions made it
impossible to create a single national market at that time. To deepen the reforms, the
open access order was strengthened by the circulation of two more documents, Order
No. 637 and Order No. 639 in 2000. After almost three decades of deregulation, gas
market in the US is now the world’s largest and most integrated single market. This is
confirmed by empirical findings (Siliverstovs et al., 2005 and Mohammadi, 2011).
The history of gas market liberalization and integration within the European Union
(EU) is much shorter than that in the US. As part of the EU economic integration
drives, gas market liberalization and integration programs were initiated in the late
1990s. The implementation process began with the introduction of the European Gas
Directive in 1998, which was further strengthened by the release of the EU Acceleration
Directive in 2003 (EC, 1998 and 2003). These initiatives have brought fundamental
7
changes in the natural gas sector across many European countries. As such, the natural
gas industries have transformed from vertically integrated monopolies to more
competitive structures (Haase, 2008; Harmsen and Jepma, 2011). However, among EU
members, the progress of liberalization is very different. For example, gas market
liberalization in the UK started much earlier than in other EU members, and has become
the best practice model in the EU. In 1986 the British government privatized the then
publicly-owned, vertically integrated gas transporter and supplier in the UK, namely
British Gas. At the same time the gas sector was deregulated to allow for competition
in the wholesale and contract markets for large consumers while retailing and pipelines
were still monopolized. Competition was eventually introduced into the retailing sector
(residential and small consumers). Further deregulation led to the break-up of British
Gas into several separated entities in the 1990s. Though limited, the initial reform was
very successful. According to Juris (1998), during 1986-1995 residential and industrial
gas prices fell by 24% and 47% in real terms, respectively, and gas consumption
increased by 38% in the UK. Through several reviews and subsequent regulatory
interventions and adjustments, deregulation in the UK gas sector has created one of the
most liberalized markets in the world. There is now genuine competition at all levels of
the gas supply chain in the UK although many more amendments to the Gas Code can
be anticipated in the future (Heather, 2010). Natural gas has recently overtaken oil to
become the largest source of primary energy in the UK with a share of 39.16% in 2009
in comparison with those of oil (37.41%) and coal (14.93%) according to Heather
(2010).
However, gas market deregulation was initiated much later in continental Europe
than in the UK. Only in the last decade has market liberalization and regional
integration been accelerated in some economies.5 The reform progress in others is slow,
but is catching up quickly, for example in Germany, Luxemburg and Sweden. Haase
(2008) introduced a scoring method to rank the EU states in terms of gas industry
regulatory function and competencies. The former covers issues such as market
opening, network access conditions and unbundling. The latter refers to competencies,
capacities and degree of autonomy of the regulators. The combined score gives a
5 These members include Denmark, Spain, the Netherlands, Italy, Belgium, Austria, Ireland and France (Haase, 2008).
8
measure of regulatory comprehensiveness in an economy. According to Haase (2008),
the UK was ranked number one in 2005 followed in turn by Demark, Spain, the
Netherlands and Italy with France, Sweden, Germany and Luxembourg in turn at the
bottom of the ranking list. Since 2005, many countries have moved forward in gas
market liberalization. For example, the German Energy Law (Energiewirtschaftsgesetz)
was introduced in 2005 with the aim to speed up gas market reforms in Germany
(Growitsch et al., 2009).
The experience of the world’s two largest gas consumers, US and EU, shows that
gas market integration undergoes a common trajectory, which consists of several steps
including the creation of intra-country regional markets, formation of a integrated
national market, deregulation and international integration. The implementation of this
last step involves the standardization of the gas sector, harmonization of members’
regulatory systems and removal of cross-border trade barriers. EAS members can learn
from the experience and lessons in the US and EU and develop a plan for gas market
integration in coming decades.
4. Gas Markets in the EAS Region
According to the stage of market and regulatory development, we can broadly
devide the natural gas markets in the EAS area into three groups: the mature markets,
the developing markets and the fledgling markets (Table 3). Relatively more advanced
gas markets or the “mature markets” exist in some EAS countries, namely, Australia,
Japan, New Zealand and Singapore. A gas market is yet to be created (and hence the
term “fledgling markets”) in other countries including Brunei, Cambodia, Laos,
Myanmar, the Philippines and Vietnam. Those which stand between the “mature” and
“fledgling” market categories are classified as the “developing markets” and include
China, India, Indonesia, Malaysia, South Korea and Thailand.

9
4.1. Mature Markets
The “mature markets” refer to economies with relatively well-developed gas
infrastructure, a large share of natural gas over total energy consumption and a
liberalised or partially deregulated domestic gas sector. Among the sixteen EAS
members, Australia, Japan, New Zealand and Singapore fall in this category. These
economies set the best practice standards within the EAS area and are also in the
process of catching up with international best practice.
Table 3. Gas Consumption in EAS Economies
Market classification
Country Consumption
(billion cubic meters) Shares of gas over primary energy consumption (%)
Mature markets Australia 28.73 21
Japan 94.10 17
New Zealand 3.82 19
Singapore 6.85 25 Developing markets
China 84.39 4
India 40.07 6
Indonesia 42.99 25
Malaysia 44.25 51
South Korea 35.32 14
Thailand 36.89 29 Fledgling markets
Brunei 3.41 79
Cambodia 0.00 0
Laos 0.00 0
Myanmar 2.03 13
Philippines 3.54 8
Vietnam 7.11 18
Notes: Unless stated otherwise, the statistics are based on 2008 data reported in APEC (2011). The shares are gas consumption over primary energy consumption. Indian data are drawn from Corbeau (2010). Data for Myanmar are 2005 figures reported in IEEJ (2009).
In Australia, natural gas accounts for about 21% of primary energy consumption
currently (Table 3). This figure is projected to increase to 33% by 2030 (Syed et al.,
2010). About 50% of Australian natural gas is exported in the form of LNG. Due to
geographic constraints, the gas market in Australia now comprises of three separate
regional markets, namely Western Australia, South-eastern Australia and the Northern
Territories. Gas market reform for third party access is still ongoing, though substantial
progress has been made since the enactment of the National Third Party Access Code

10
for Natural Gas Pipeline Systems in 1997. The reform involved the breakup of
government-owned vertically integrated gas utilities into separate transmission and
distribution businesses. Some of them have since been privatized. This process of
reform has been strengthened by the decree of the National Gas Law (NGL) in 2008 and
its Amendment in 2009. The gas law and its amendment aim to ensure the functioning
of a single gas market regulator and to send the right signals for efficient infrastructure
investment in the country.
In Japan, natural gas amounts to 17% of primary energy consumption in 2008
(Table 3). Gas supply is almost sourced entirely through imported LNG from
Indonesia, Australia, Qatar, UAE, Russia, Malaysia, Brunei and Oman (Takahashi,
2004). For this reason, Japan accounted for 31% of the world’s traded LNG in 2010
(BP, 2011a). Traditionally Japanese imported LNG has been over-priced to ensure
stable supply (APEC, 2011). To reduce costs and hence prices, regulatory reforms were
initiated in 1995 through the enactment of the Gas Utility Industry Law and its
Amendments in 1999, 2004 and 2007. The reform measures provide guidance for
price-setting, new entries and open access. Now Japanese gas and electric utilities are
under tremendous pressure to reduce costs and lower prices even though the reform has
not covered all sections of the gas market.
New Zealand has so far been self-sufficient in natural gas supplies. Natural gas has
a share of 19% in the country’s primary energy consumption (Table 3). Gas sector
reform began with the enactment of the Gas Act in 1992, which was subsequently
amended in 1993, 1997 and 2000 (Coull and Bamford, 2010). Currently the gas sector
is “co-regulated” by the government and the Gas Industry Company (GIC), an industry
body established under the Gas Act 1992 (APEC, 2011). The government has never
rejected a GIC recommendation on the basis of policy grounds (IEA, 2010b). It is
argued that the “co-regulated” system can combine the benefits of industry self-
governance with government oversight to ensure delivery of public policy objectives.
In Singapore, the 2001 Gas Act sets the legal basis for the separation of the
contestable component of the gas industry (that is, gas retail and gas import) from the
monopolistic component (that is, gas transportation). Since 2008, the Gas Network
Code (GNC) has specified the GNC’s rules which govern the activities of gas
transportation, providing open and non-discriminatory access to Singapore’s onshore

11
gas pipeline network (APEC, 2011). In 2008, over 80% of Singapore’s electricity was
generated using natural gas, which was imported from Malaysia and Indonesia through
four cross-border pipelines (Wong and Reinbott 2010). Currently, four companies hold
gas import licences. There are also two domestic gas pipelines which are not
interconnected yet. Singapore is also expected to receive LNG in 2013. For this
purpose, new imports of pipeline gas are subjected to the approval by the Energy
Market Authority of Singapore, a regulatory body responsible for the gas industry.
4.2. Developing Markets
In 2010 China’s domestic production of natural gas amounted to 94.5 BCMs and
imports of LNG exceeded 9 MTs.6 For the first time, China also imported natural gas of
4.4 BCMs from central Asia via the cross-border gas pipelines. Thus the rate of China’s
dependency on gas imports was about 15% in 2010. China’s reform in the late 1990s
has sought to separate business from regulatory roles in state-owned enterprises (SOEs).
While the major oil and gas companies are partially privatized, the state is still the
majority share-holder of those companies.7 On 30 August 2007, China released its
National Gas Utilization Policy, which was intended to ease natural gas supply and
demand, and optimise the structure of natural gas utilisation. China is still in the
process of constructing a national gas grid. Over the next 10 years (2010-2020), more
than 25 000 kilometres of pipeline are expected to be commissioned to form a gas trunk
line network ‘running through east–west and north–south and connecting overseas’
(APEC, 2011). In the currently fragmented markets, gas has been under-priced and
hence is heavily subsidized by governments. Reform in the gas sector has been
discussed and experimented with at a very slow pace. The latest speculation is that
China may raise domestic gas prices in August 2011 (Liang, 2011). Interconnectivity
and unbundling are still at the stage of being debated. For example, it is reported that
China Gas Association proposed a so-called “X+1+X” model which implies
competitive suppliers and distributors with a monopolized grid system. The
6 The information is drawn from China Petroleum Enterprise Association (2011). 7 China’s whole and retail gas market is dominated by three SOEs, namely, China’s National Petroleum Corporation (CNPC), China’s National Petroleum and Chemical Corporation (SINOPEC) and China’s National Overseas and Offshore Corporation (CNOOC).

12
implementation of the reforms likely still has a long way to go, as a national pipeline
network is expected to be completed in 2020.
India’s natural gas market is still at the early stage of development. Both the
regulatory framework and gas distribution infrastructure are underdeveloped. SOEs
such as Oil and Natural Gas Corporations (ONGC), Oil India Ltd (OIL) and Gas
Authority of India Ltd (GAIL) dominate the sector in particular the upstream
businesses. Gas pricing follows a two track-system, namely the administrative price
mechanism (APM) and market mechanism (non-APM). Gas produced by the SOEs is
charged at the APM price while private companies and joint ventures receive the non-
APM price (Corbeau, 2010). The non-APM price can be two or three times as high as
the APM price. Until 2006, gas produced by ONGC and OIL and distributed by GAIL
has been sold at the APM prices. In 2007, APM gas has a domestic gas market share of
75% (Jain and Sen 2011). The heavy subsidies in the form of price gaps are absorbed
by the SOEs and federal government. In 2006 the Petroleum and Natural Gas
Regulatory Board (PNGRB) was created and subsequently the PNGRB Act was
promulgated. In 2008, with the construction of the 1400 km “East-West” pipeline, the
private company Reliance Gas Transportation Infrastructure Limited (RGTIL) entered
the pipeline business. Thus the Indian gas sector has moved from pure state ownership
to a mixed structure of state and private ownership. In the 2010/2011 financial year, a
major pricing reform is to increase APM gas prices to the market level (set by the
private company, Reliance Industries Limited). The government subsidizes the end-
users directly. These initiatives lay the foundation for further reforms and hence the
introduction of competition into the gas market.
Indonesia is a major gas exporter in the EAS region, with 55% of gas produced
being exported in 2008. Of the exported gas, Japan has a share of 70%. Gas accounts
for 25% of primary energy consumption in the country. The enactment of the Oil and
Gas Law (Law No. 21/2001) requires that the state-owned oil company, Pertamina,
relinquishes its governmental roles to the new regulatory bodies BP MIGAS and BPH
MIGAS, and the termination of Pertamina’s monopoly in upstream oil and gas activities

13
(APEC, 2011).8 Currently, the transport of natural gas in Indonesia is separated from
supply, which lays the foundation for further reform of the gas sector.
In Malaysia, natural gas accounts for about 51% of Malaysia’s primary energy
consumption. The country is the world second largest LNG exporter. The gas sector is
in general highly regulated and dominated by the state-owned company, Petronas and
gas prices are set by the government. Companies need a Petronas licence to operate in
the upstream industry. In terms of deregulation, Malaysia is lagging behind its
neighbouring countries Singapore and Indonesia.
South Korean natural gas amounted to 14% of primary energy consumption in
2008. Although reform was envisaged in the 1999 Basic Plan for Restructuring the Gas
Industry and the 2001 Implementation Plan, little progress has been made so far. In the
aftermath of the Asian financial crisis, Kogas was partially privatized (43%) in 1999.
Kogas still monopolizes Korea’s natural gas industry including the gas import, storage,
transportation and wholesale businesses.
In Thailand, the Petroleum Authority of Thailand (PTT) is the single buyer,
transporter and reseller of natural gas, which amounts to 29% primary energy
consumption in the country in 2008 (Table 3). One-third of natural gas consumption
relies on imports, mainly through pipeline gas from Myanmar (with LNG imports
expected in 2011). As for the reform of the gas sector, though a Power Development
Plan was launched in 2010, unbundling the PTT is still a long way off.
4.3. Fledgling Markets
Six EAS members fall into the “fledgling markets” category. These members are
the relatively less developed ASEAN members. In Laos, biomass is still the main
source of energy with other fuels having a small market share and being imported
mainly from Thailand. Thus gas market and infrastructure is yet to be developed. The
government is still struggling to increase the level of electrification of households,
which is currently at about 70%. Cambodia also relies on biomass as the main source of
energy. The first significant oil and gas discovery in Cambodia was announced by
8 BP MIGAS (Badan Pelaksanaan Minyak dan Gas) is responsible for granting licences and managing contracts. BPH MIGAS (Badan Pengatur Minyak dan Gas) has regulatory responsibilities for trading, distribution and retailing.

14
Chevron in 2005 (World Bank, 2007). However commercial production has not started
yet. In Myanmar, although biomass accounts for over 60% of total energy
consumption, a small gas market exists and provides about 13% of the country’s total
fuel demand (Table 3). The country also started exporting pipeline gas to Thailand in
1998. It is now the fifth largest gas exporter in the EAS region. Gas exploration and
production is open to foreign companies. The state-owned company, Myanmar Oil and
Gas Enterprise (MOGE), however dominates the domestic gas sector.
Brunei Darussalam (Brunei for short) is a net energy exporter. More than 90% of
Brunei’s LNG was exported to Japan in 2009. Domestically natural gas accounts for
about 80% of primary energy consumption. However, the gas market in Brunei is
mainly vertically integrated. That is, the government or its agencies are responsible for
supply, transmission and distribution. Deregulation has so far not been on the agenda of
government policies.
In the Philippines, 40% of the country’s energy is imported. Gas has a share of 8%
of primary energy consumption in 2008 (Table 3). In general, gas market and
infrastructure development in the Philippines is still at the early stage. Currently gas
production is enough to meet the country’s domestic requirements. In the future the
Philippines is expected to import pipeline gas via the proposed Trans-ASEAN Gas
Pipeline (TAGT) network.
Gas accounts for 18% of primary energy consumption in Viet Nam (Table 3). The
gas industry is dominated by the state-owned company, Viet Nam Oil and Gas Group
(PVN), through its arm, The Gas Corporation, which was incorporated in August 2006.
The government has an unbundling plan for electricity (2005-2022). But the gas sector
is yet on the government’s agenda for liberalization.
4.4. Gas Trade between EAS Members
Within the EAS area, members have been actively engaged in natural gas trade
either via pipelines or in the form of LNG (Table 4). While some members (Indonesia,
Malaysia, Australia, Brunei and Myanmar) are net gas exporters, others (Japan, South
Korea, China, India, Thailand and Singapore) are net importers. As shown in Table 4,
EAS exporters, mainly export within the region (89% of total exports) while major EAS
importers, such as Japan, South Korea and China, also buy from non-EAS countries
15
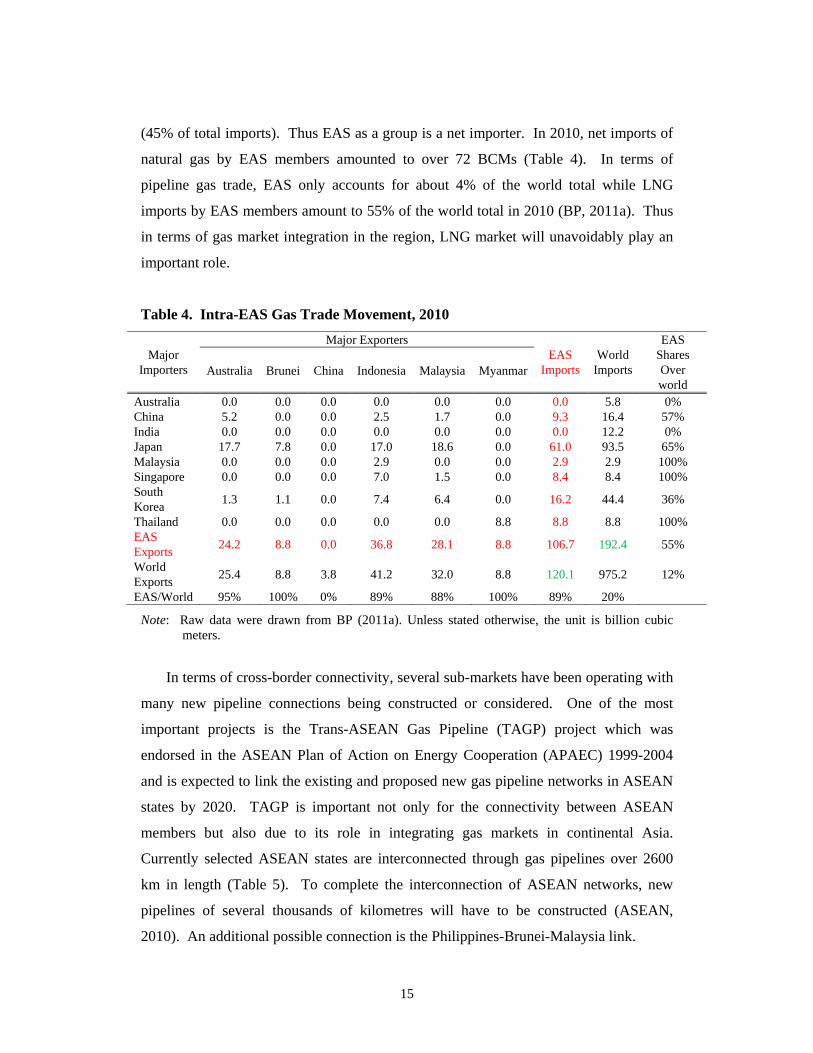
(45% of total imports). Thus EAS as a group is a net importer. In 2010, net imports of
natural gas by EAS members amounted to over 72 BCMs (Table 4). In terms of
pipeline gas trade, EAS only accounts for about 4% of the world total while LNG
imports by EAS members amount to 55% of the world total in 2010 (BP, 2011a). Thus
in terms of gas market integration in the region, LNG market will unavoidably play an
important role.
Table 4. Intra-EAS Gas Trade Movement, 2010
Major Importers
Major Exporters EAS
Imports World
Imports
EAS Shares Over world
Australia Brunei China Indonesia Malaysia Myanmar
Australia 0.0 0.0 0.0 0.0 0.0 0.0 0.0 5.8 0% China 5.2 0.0 0.0 2.5 1.7 0.0 9.3 16.4 57% India 0.0 0.0 0.0 0.0 0.0 0.0 0.0 12.2 0% Japan 17.7 7.8 0.0 17.0 18.6 0.0 61.0 93.5 65% Malaysia 0.0 0.0 0.0 2.9 0.0 0.0 2.9 2.9 100% Singapore 0.0 0.0 0.0 7.0 1.5 0.0 8.4 8.4 100% South Korea
1.3 1.1 0.0 7.4 6.4 0.0 16.2 44.4 36%
Thailand 0.0 0.0 0.0 0.0 0.0 8.8 8.8 8.8 100% EAS Exports
24.2 8.8 0.0 36.8 28.1 8.8 106.7 192.4 55%
World Exports
25.4 8.8 3.8 41.2 32.0 8.8 120.1 975.2 12%
EAS/World 95% 100% 0% 89% 88% 100% 89% 20%
Note: Raw data were drawn from BP (2011a). Unless stated otherwise, the unit is billion cubic meters.
In terms of cross-border connectivity, several sub-markets have been operating with
many new pipeline connections being constructed or considered. One of the most
important projects is the Trans-ASEAN Gas Pipeline (TAGP) project which was
endorsed in the ASEAN Plan of Action on Energy Cooperation (APAEC) 1999-2004
and is expected to link the existing and proposed new gas pipeline networks in ASEAN
states by 2020. TAGP is important not only for the connectivity between ASEAN
members but also due to its role in integrating gas markets in continental Asia.
Currently selected ASEAN states are interconnected through gas pipelines over 2600
km in length (Table 5). To complete the interconnection of ASEAN networks, new
pipelines of several thousands of kilometres will have to be constructed (ASEAN,
2010). An additional possible connection is the Philippines-Brunei-Malaysia link.

16
Table 5. Cross-border Gas Pipelines in East Asia
Pipeline names Length (km) Completion Year Malaysia-Singapore via Johore Straits
5 1991
Yadana, Myanmar-Ratchaburi, Thailand
470 1999
Yetagun, Myanmar-Ratchaburi, Thailand
340 2000
West Natuna, Indonesia-Singapore
660 2001
West Natuna, Indonesia-Duyong, Malaysia
100 2001
South Sumatra, Indonesia-Singapore
470 2003
Malaysia-Thailand JDA 270 2005 Malaysia-Singapore 4 2006 Malaysia-Vietnam via PM3-Ca Mau pipeline
325 2007
China-Myanmar 870 2013
Source: Author’s own compilation using information from ASEAN (2010).
5. Policy Implications
The review in the preceding section demonstrates the existence of highly
heterogeneous gas markets and regulatory regimes in the EAS region. In some member
economies, a gas market is yet to be developed. Overall natural gas as a source of
primary energy consumption still plays a relatively small role in the EAS area,
particularly in large EAS members such as China and India (Table 3). There is no
doubt that gas consumption will increase in many EAS member states in the near future.
A critical question is whether supply can meet demand in the long run and hence,
whether it is wise to invest in infrastructure. While the EAS group is a net importer of
natural gas, the global gas resource base is vast. According to the International Energy
Agency (IEA, 2011), recoverable conventional gas resource is equivalent to more than
120 years of current consumption level in the world while total gas resources could
sustain today’s production for over 250 years. Among EAS members, China and India
have the potential to become important suppliers of unconventional gas in the future.
Given the abundance of global gas supply, gas markets in the EAS area are expected to

17
expand in the coming decades. Thus, development in natural gas infrastructure and
regulations in the EAS region have long-term implications.
As the gas market expands, regional market integration will become important. To
achieve the goal of an integrated gas market in the EAS region, governments in member
economies must work together to implement a plan which will lead to the harmonisation
of regulatory standards and hence integration of gas markets while different national
characteristics are also taken into account. These characteristics include national gas
market size, existing networks, import infrastructure and market structure. Specifically,
the work plan should aim to achieve several objectives, namely, to 1) promote the
development of gas markets in individual EAS member economies, 2) harmonize
regulatory standards in natural gas sectors within the region, 3) strengthen the
coordination between multiple institutions and eventually, 4) achieve the goal of cross-
border integration within the EAS area. Each of the four objectives is in turn detailed as
follows though this is not necessarily the order of implementation of these tasks in
practice.
5.1. Development of Gas Markets in EAS Member Economies
As shown in the preceding section, natural gas markets across individual EAS
member economies are very diverse in terms of their level of development. To achieve
the goal of gas market integration within the EAS region, gas market development in
member economies should be promoted first. While recognizing differences in the
stage of economic development, members should be encouraged to develop internal gas
markets following the best practice within the region and hence the process of catch-up
can be shortened significantly. Issues involved include:
o The optimum gas market structure with regard to individual members’
economic and environmental conditions;
o Specific policies in infrastructure development such as the construction of
pipelines;
o Country-specific pricing policies;
o Internal market integration;
o Introduction of competition through deregulation; and
o Timetable for gas sector reforms.

18
5.2. Harmonization of Regulatory Standards
To prepare for regional market integration, the gas regulatory and technical
standards within the EAS area should be harmonized through multilateral agreements.
The harmonized standards will define best practice in the gas sector within the EAS
area. Emerging and new markets can adopt those standards at an earlier stage so that
the process of catch-up with best practice later can be significantly shortened.
Specifically, the gas industry regulatory and technical standards cover
o Metering and quality standards;
o Legal and tax issues;
o Trading systems;
o Standard contract forms;
o Pricing mechanism; and
o Other general regulatory issues.
5.3. Coordination between Multiple Institutions
Within the EAS area, multiple institutions exist and share the same objective of
promoting gas or energy market integration. Examples include the APEC Energy
Working Group formed in 1990, ASEAN Plan of Action for Energy Cooperation
established in 1997, EAS’s Energy Cooperation Task Force (ECTF) initiated in 2007
and ASEAN plus three (APT) Natural Gas Forum, started in July 2010. The ASEAN
Plan of Action for Energy Cooperation, overseen by the ASEAN Centre for Energy
(ACE), has made some progress in constructing the ASEAN Power Grid (APG) and
Trans-ASEAN Gas Pipeline (TAGP) (Table 5). In 2010, the Ministers of APT
countries commended a regional dialogue on natural gas, namely APT Natural Gas
Forum, acknowledging the Forum’s contribution in facilitating a robust information
exchange and closer cooperation in the areas of gas trade, market development, research
and development, and technical cooperation across the region. The Ministers supported
the initiatives proposed by the APT Natural Gas Forum 2010 (i) to develop a
compendium of natural gas policies, development, projects and plans of the APT
countries, and (ii) to initiate preparatory activities for conducting a study on natural gas
market in the APT region. They further noted that APT countries will continue to chart
the appropriate direction for the natural gas industry in the region.

19
The Energy Cooperation Task Force (ECTF) was set up by the EAS group in 2007.
Energy market integration (EMI) in the EAS area is one of the three program streams
undertaken by ECTF (Shi and Kimura, 2010). A series of workshops have been
conducted under this scheme (Bannister et al., 2008, ERIA 2010 and 2011). There are
considerable overlaps in the missions of these institutions. Coordination between these
institutions could lead to more efficient use of public resources and a unified voice for
the promotion of gas market integration in the region.
5.4. Cross-border Integration within the EAS Area
The eventual goal of the coordinated efforts in the EAS gas sectors is to achieve
market integration. This can be realized through several steps. The first step will be the
interconnection of gas pipelines in subregions within the EAS area. These sub-regional
markets include ASEAN, China-Myanmar, India-Myanmar and The Greater Mekong
Sub-region (GMS involving two Chinese provinces, Thailand, Viet Nam, the Laos,
Cambodia and Myanmar). In addition, there are also current or potential connections
with non-EAS pipeline networks such as the China-Turkmenistan, China-Russia and
India-Iran pipelines. These connections will essentially become part of an integrated
EAS market. The next step is to integrate sub-regional markets. Interconnection may
be possible for land-bound economies such as ASEAN, China, India and Korea.
In addition, the LNG market is an integral part of the gas market in the EAS area
and can play a key role in the integration of gas markets. In 2010, LNG imports by and
exports from EAS members accounted for about 60% and 32% of the world’s total
trade, respectively (BP, 2011a).9 With more LNG terminals being constructed in China,
India and Thailand, demand for LNG in the EAS area is set to increase significantly.
This trend will not only supplement cross-border trade in pipeline gas, but also has
implications for gas pricing in the region. Traditionally the price of natural gas is tied
with the price of oil. This is still the case in Asia, however, the gas pricing mechanism
has changed in other parts of the world. In the US, due to gas to gas competition, the
gas price is determined by the domestic gas market price, and imported gas is also
linked to the domestic gas price (Fukushima, 2009). A similar market-oriented pricing
9 The import share of 60% in 2010 includes LNG imports of 14.9 bcm by Taiwan, officially a non-EAS member.
20
mechanism is also emerging in Europe. With expanded capacities in terms of both
pipelines and LNG terminals, a gas to gas competing market may appear in the EAS
area.
6. Conclusions and Recommendations
This study briefly reviewed the status and trend of global gas market integration.
Global awareness of climate change, rising affordability and improved technology have
made natural gas, both conventional and unconventional, the preferred fossil fuel in the
coming decades. While the US and EU are leading the world in gas consumption, trade
and market liberalization, the rest of the world, in particular the EAS area, is catching
up rapidly. Among the sixteen EAS members, there is considerable heterogeneity in
terms of gas usage, trade participation and sectoral reforms. With abundant supplies
both in the region and globally, natural gas consumption is to grow rapidly in the EAS
area. Thus gas market integration becomes attractive and indispensable in the coming
decades. To make this possible, it is recommended that the EAS states should adopt a
formal program to promote and eventually achieve gas market integration within the
region. Specifically, four recommendations are made:
Recommendation One: Through multilateral agreements, EAS states should
adopt a formal program to promote and nurture the development of gas markets
in member states and phased sectoral reforms in relatively mature markets.
ERIA’s EMI workshop series is the first step to achieve this goal.
Recommendation Two: Through multilateral agreements, EAS states should set
targets to gradually harmonise regulatory and technical standards in the gas
sector. A set of mutually agreed and harmonised standards, or the EAS Best
Practice (EBP) standards, can be implemented initially in the relatively more
developed markets and then extended to other markets over time.
Recommendation Three: Several institutions in the EAS areas should coordinate
better to promote their “gas” causes. For example, the “gas” sections of these
21
institutions could be merged to form an EAS Gas Agency (EGA) so that a
unified voice could be heard in the EAS region.
Recommendation Four: EAS states should develop a formal program to boost
cross-border connectivity and trading within the area and eventually achieve
regional gas market integration. This goal could be achieved through the
evolution of the current schemes such as TAGP and GMS or new initiatives
such as the establishment of regional gas storage or gas exchanges.

22
References
APEC (2011), APEC Energy Overview 2010, APEC Energy Working Group, Asia-Pacific Economic Cooperation.
ASEAN (2010), ASEAN Plan of Action on Energy Cooperation (APAEC) 2010-2015, Association of Southeast Asian Nations (www.asean.org).
Bannister, H., G. McDonell, S. Thorncraft, X. Hu, B. Whitlock and C. Malik (2008), Energy Market Integration in the East Asia Summit Region, REPSF II Project No. 07/005, ASEAN website (www.asean.org).
BP (2011a), BP Statistical Review of World Energy 2011, June, BP.
BP (2011b), BP Energy Outlook 2030, January, BP.
China Petroleum Enterprise Association (2011), Bluebook of China’s Oil and Gas Industry Development and Outlook, March, Beijing.
Corbeau, A.S. (2010), ‘Natural Gas in India’, Working Paper, International Energy Agency.
Coull, David and Angela Bamford (2010), ‘New Zealand’, in The International Comparative Legal Guide to Gas Regulation 2010, chapter 22, 172-78, London: Global Legal Group.
Cuddington, John T. and Zhongmin Wang (2006), ‘Assessing the Degree of Spot Market Integration for U.S. Natural Gas: Evidence from Daily Price Data’, Journal of Regulatory Economics, 29, 195–210.
EC (1998), Directive 98/30/EC of the European Parliament and of the Council of 22 June 1998 concerning common rules for the internal market in natural gas, European Commission, Brussels.
EC (2003), Directive 2003/55/EC of the European Parliament and the Council of 26 June 2003 concerning common rules for the internal market in natural gas and repealing, European Commission, Brussels.
EIA (2003), The Global Liquefied Natural Gas Market: Status & Outlook, Energy Information Administration, U.S. Department of Energy, Washington, DC 20585.
ERIA (2010), Energy Market Integration in the East Asia Summit Region: Review of Initiatives and Estimation of Benefits, ERIA Research Project Report 2009, No.13, Economic Research Institute for ASEAN and East Asia.
ERIA (2011), Energy Market Integration in the East Asia Summit Region workshop, June 20-21, Economic Research Institute for ASEAN and East Asia.
Fukushima, Ryo (2009), ‘LNG Market Integration from the Asian Perspective’, IGU Magazine, 218-31.
Growitsch, Christian, Rabindra Nepal and Marcus Stronzik (2009), ‘Natural Gas Market Integration in Germany’, unpublished manuscript, Department of Energy Markets and Energy Regulation, Rhöndorfer Strasse, 53604, Bad Honnef, Germany.

23
Haase, Nadine (2008), ‘European Gas Market Liberalization: Are Regulatory Regimes Moving Towards Convergence?’, Working Paper NG 24, Oxford Institute for Energy Studies.
Harmsen, Rudolph and Catrinus Jepma (2011), “North West European Gas Market: Integrated Already”, European Energy Review, January 27 (online access: www.europeanenergyreview.eu).
Heather, Patrick (2010), ‘The Evolution and Functioning of the Traded Gas Market in Britain’, Working Paper NG44, Oxford Institute for Energy Studies, Oxford University.
IEA (2010b), Oil & Gas Security 2010: Emergence Response of IEA Countries New Zealand, International Energy Agency.
IEA (2011), World Energy Outlook 2011: Are We Entering a Golden Age of Gas? special report, International Energy Agency.
IEEJ (2009), The 2nd ASEAN Energy Demand Outlook, Prepared by The Energy Data and Modeling Center, The Institute of Energy Economics, Japan, The ASEAN Center for Energy and The National ESSPA Project Teams, March.
Jain, Anil and Anupama Sen (2011), ‘Natural Gas in India: An Analysis of Policy’, Working Paper NG 50, Oxford Institute for Energy Studies.
Juris, Andrej (1998), ‘Natural Gas Markets in the UK: Competition, Industry Structure, and Market Power of the Incumbent’, Public Policy for the Private Sector Note No.138, March, The World Bank.
Liang, Qinxie (2011), ‘The Best Time for Gas Price Reforms’, Economic References Daily, April 25.
Majone, G. (1996), ‘Regulation and its Modes’, in Regulating Europe edited by G. Majone, chapter 1, 9-27, London: Routledge.
Mohammadi, Hassan (2011), ‘Market Integration and Price Transmission in the U.S. Natural Gas Market: From the Wellhead to End Use Markets’, Energy Economics 33, 227–235.
Shi, Xunpeng and Fukunari Kimura (2010), ‘Review Report’, in Energy Market Integration in the East Asia Summit Region: Review of Initiatives and Estimation of Benefits, ERIA Research Project Report 2009, No.13, Economic Research Institute for ASEAN and East Asia.
Siliverstovs, Boriss, Guillaume L’Hegaret, Anne Neumann and Christian von Hirschhausen (2005), ‘International Market Integration for Natural Gas? A Cointegration Analysis of Prices in Europe, North America and Japan’, Energy Economics 27, 603-615.
Sutherland, R.J. (1993), ‘Natural Gas Contracts in an Emerging Competitive Market’, Energy Policy 21(12), 1191–1204.
Syed, Arif, Jane Melanie, Sally Thorpe and Kate Penney (2010), ‘ABARE Research Report 10.02’, March, Australian Bureau of Agricultural and Resource Economics (ABARE), Canberra (abare.gov.au).

24
Takahashi, Haruki (2004), ‘Advancement of the Gas Industry in Japan’, Member Economy Report for GASEX2004, The Japan Gas Association.
Williamson, O.E. (1996), The Mechanisms of Governance, Oxford: Oxford University Press.
Wong, Kelvin and Daniel Reinbott (2010), ‘Singapore’, in The International Comparative Legal Guide to Gas Regulation 2010, chapter 31, 251-59, London: Global Legal Group.
World Bank (2007), ‘Cambodia Oil & GAs Briefing Notes #1: Introduction to Oil and Gas’, March, the World Bank (www.worldbank.org).

25
ECONOMICS DISCUSSION PAPERS
2009
DP NUMBER
AUTHORS TITLE
09.01 Le, A.T. ENTRY INTO UNIVERSITY: ARE THE CHILDREN OF IMMIGRANTS DISADVANTAGED?
09.02 Wu, Y. CHINA’S CAPITAL STOCK SERIES BY REGION AND SECTOR
09.03 Chen, M.H. UNDERSTANDING WORLD COMMODITY PRICES RETURNS, VOLATILITY AND DIVERSIFACATION
09.04 Velagic, R. UWA DISCUSSION PAPERS IN ECONOMICS: THE FIRST 650
09.05 McLure, M. ROYALTIES FOR REGIONS: ACCOUNTABILITY AND SUSTAINABILITY
09.06 Chen, A. and Groenewold, N. REDUCING REGIONAL DISPARITIES IN CHINA: AN EVALUATION OF ALTERNATIVE POLICIES
09.07 Groenewold, N. and Hagger, A. THE REGIONAL ECONOMIC EFFECTS OF IMMIGRATION: SIMULATION RESULTS FROM A SMALL CGE MODEL.
09.08 Clements, K. and Chen, D. AFFLUENCE AND FOOD: SIMPLE WAY TO INFER INCOMES
09.09 Clements, K. and Maesepp, M. A SELF-REFLECTIVE INVERSE DEMAND SYSTEM
09.10 Jones, C. MEASURING WESTERN AUSTRALIAN HOUSE PRICES: METHODS AND IMPLICATIONS
09.11 Siddique, M.A.B. WESTERN AUSTRALIA-JAPAN MINING CO-OPERATION: AN HISTORICAL OVERVIEW
09.12 Weber, E.J. PRE-INDUSTRIAL BIMETALLISM: THE INDEX COIN HYPTHESIS
09.13 McLure, M. PARETO AND PIGOU ON OPHELIMITY, UTILITY AND WELFARE: IMPLICATIONS FOR PUBLIC FINANCE
09.14 Weber, E.J. WILFRED EDWARD GRAHAM SALTER: THE MERITS OF A CLASSICAL ECONOMIC EDUCATION
09.15 Tyers, R. and Huang, L. COMBATING CHINA’S EXPORT CONTRACTION: FISCAL EXPANSION OR ACCELERATED INDUSTRIAL REFORM
09.16 Zweifel, P., Plaff, D. and
Kühn, J.
IS REGULATING THE SOLVENCY OF BANKS COUNTER-PRODUCTIVE?
09.17 Clements, K. THE PHD CONFERENCE REACHES ADULTHOOD
09.18 McLure, M. THIRTY YEARS OF ECONOMICS: UWA AND THE WA BRANCH OF THE ECONOMIC SOCIETY FROM 1963 TO 1992
09.19 Harris, R.G. and Robertson, P. TRADE, WAGES AND SKILL ACCUMULATION IN THE EMERGING GIANTS
09.20 Peng, J., Cui, J., Qin, F. and
Groenewold, N.
STOCK PRICES AND THE MACRO ECONOMY IN CHINA
09.21 Chen, A. and Groenewold, N. REGIONAL EQUALITY AND NATIONAL DEVELOPMENT IN CHINA: IS THERE A TRADE-OFF?

26
ECONOMICS DISCUSSION PAPERS
2010
DP NUMBER
AUTHORS TITLE
10.01 Hendry, D.F. RESEARCH AND THE ACADEMIC: A TALE OF TWO CULTURES
10.02 McLure, M., Turkington, D. and Weber, E.J. A CONVERSATION WITH ARNOLD ZELLNER
10.03 Butler, D.J., Burbank, V.K. and
Chisholm, J.S.
THE FRAMES BEHIND THE GAMES: PLAYER’S PERCEPTIONS OF PRISONER’S DILEMMA, CHICKEN, DICTATOR, AND ULTIMATUM GAMES
10.04 Harris, R.G., Robertson, P.E. and Xu, J.Y. THE INTERNATIONAL EFFECTS OF CHINA’S GROWTH, TRADE AND EDUCATION BOOMS
10.05 Clements, K.W., Mongey, S. and Si, J. THE DYNAMICS OF NEW RESOURCE PROJECTS A PROGRESS REPORT
10.06 Costello, G., Fraser, P. and Groenewold, N. HOUSE PRICES, NON-FUNDAMENTAL COMPONENTS AND INTERSTATE SPILLOVERS: THE AUSTRALIAN EXPERIENCE
10.07 Clements, K. REPORT OF THE 2009 PHD CONFERENCE IN ECONOMICS AND BUSINESS
10.08 Robertson, P.E. INVESTMENT LED GROWTH IN INDIA: HINDU FACT OR MYTHOLOGY?
10.09 Fu, D., Wu, Y. and Tang, Y. THE EFFECTS OF OWNERSHIP STRUCTURE AND INDUSTRY CHARACTERISTICS ON EXPORT PERFORMANCE
10.10 Wu, Y. INNOVATION AND ECONOMIC GROWTH IN CHINA
10.11 Stephens, B.J. THE DETERMINANTS OF LABOUR FORCE STATUS AMONG INDIGENOUS AUSTRALIANS
10.12 Davies, M. FINANCING THE BURRA BURRA MINES, SOUTH AUSTRALIA: LIQUIDITY PROBLEMS AND RESOLUTIONS
10.13 Tyers, R. and Zhang, Y. APPRECIATING THE RENMINBI
10.14 Clements, K.W., Lan, Y. and Seah, S.P. THE BIG MAC INDEX TWO DECADES ON AN EVALUATION OF BURGERNOMICS
10.15 Robertson, P.E. and Xu, J.Y. IN CHINA’S WAKE: HAS ASIA GAINED FROM CHINA’S GROWTH?
10.16 Clements, K.W. and Izan, H.Y. THE PAY PARITY MATRIX: A TOOL FOR ANALYSING THE STRUCTURE OF PAY
10.17 Gao, G. WORLD FOOD DEMAND
10.18 Wu, Y. INDIGENOUS INNOVATION IN CHINA: IMPLICATIONS FOR SUSTAINABLE GROWTH
10.19 Robertson, P.E. DECIPHERING THE HINDU GROWTH EPIC
10.20 Stevens, G. RESERVE BANK OF AUSTRALIA-THE ROLE OF FINANCE
10.21 Widmer, P.K., Zweifel, P. and Farsi, M. ACCOUNTING FOR HETEROGENEITY IN THE MEASUREMENT OF HOSPITAL PERFORMANCE

27
10.22 McLure, M. ASSESSMENTS OF A. C. PIGOU’S FELLOWSHIP THESES
10.23 Poon, A.R. THE ECONOMICS OF NONLINEAR PRICING: EVIDENCE FROM AIRFARES AND GROCERY PRICES
10.24 Halperin, D. FORECASTING METALS RETURNS: A BAYESIAN DECISION THEORETIC APPROACH
10.25 Clements, K.W. and Si. J. THE INVESTMENT PROJECT PIPELINE: COST ESCALATION, LEAD-TIME, SUCCESS, FAILURE AND SPEED
10.26 Chen, A., Groenewold, N. and Hagger, A.J. THE REGIONAL ECONOMIC EFFECTS OF A REDUCTION IN CARBON EMISSIONS
10.27 Siddique, A., Selvanathan, E.A. and Selvanathan, S.
REMITTANCES AND ECONOMIC GROWTH: EMPIRICAL EVIDENCE FROM BANGLADESH, INDIA AND SRI LANKA

28
ECONOMICS DISCUSSION PAPERS
2011 DP NUMBER
AUTHORS TITLE
11.01 Robertson, P.E. DEEP IMPACT: CHINA AND THE WORLD ECONOMY
11.02 Kang, C. and Lee, S.H. BEING KNOWLEDGEABLE OR SOCIABLE? DIFFERENCES IN RELATIVE IMPORTANCE OF COGNITIVE AND NON-COGNITIVE SKILLS
11.03 Turkington, D. DIFFERENT CONCEPTS OF MATRIX CALCULUS
11.04 Golley, J. and Tyers, R. CONTRASTING GIANTS: DEMOGRAPHIC CHANGE AND ECONOMIC PERFORMANCE IN CHINA AND INDIA
11.05 Collins, J., Baer, B. and Weber, E.J. ECONOMIC GROWTH AND EVOLUTION: PARENTAL PREFERENCE FOR QUALITY AND QUANTITY OF OFFSPRING
11.06 Turkington, D. ON THE DIFFERENTIATION OF THE LOG LIKELIHOOD FUNCTION USING MATRIX CALCULUS
11.07 Groenewold, N. and Paterson, J.E.H. STOCK PRICES AND EXCHANGE RATES IN AUSTRALIA: ARE COMMODITY PRICES THE MISSING LINK?
11.08 Chen, A. and Groenewold, N. REDUCING REGIONAL DISPARITIES IN CHINA: IS INVESTMENT ALLOCATION POLICY EFFECTIVE?
11.09 Williams, A., Birch, E. and Hancock, P. THE IMPACT OF ON-LINE LECTURE RECORDINGS ON STUDENT PERFORMANCE
11.10 Pawley, J. and Weber, E.J. INVESTMENT AND TECHNICAL PROGRESS IN THE G7 COUNTRIES AND AUSTRALIA
11.11 Tyers, R. AN ELEMENTAL MACROECONOMIC MODEL FOR APPLIED ANALYSIS AT UNDERGRADUATE LEVEL
11.12 Clements, K.W. and Gao, G. QUALITY, QUANTITY, SPENDING AND PRICES
11.13 Tyers, R. and Zhang, Y. JAPAN’S ECONOMIC RECOVERY: INSIGHTS FROM MULTI-REGION DYNAMICS
11.14 McLure, M. A. C. PIGOU’S REJECTION OF PARETO’S LAW
11.15 Kristoffersen, I. THE SUBJECTIVE WELLBEING SCALE: HOW REASONABLE IS THE CARDINALITY ASSUMPTION?
11.16 Clements, K.W., Izan, H.Y. and Lan, Y. VOLATILITY AND STOCK PRICE INDEXES
11.17 Parkinson, M. SHANN MEMORIAL LECTURE 2011: SUSTAINABLE WELLBEING – AN ECONOMIC FUTURE FOR AUSTRALIA
11.18 Chen, A. and Groenewold, N. THE NATIONAL AND REGIONAL EFFECTS OF FISCAL DECENTRALISATION IN CHINA
11.19 Tyers, R. and Corbett, J. JAPAN’S ECONOMIC SLOWDOWN AND ITS GLOBAL IMPLICATIONS: A REVIEW OF THE ECONOMIC MODELLING
11.20 Wu, Y. GAS MARKET INTEGRATION: GLOBAL TRENDS AND IMPLICATIONS FOR THE EAS REGION

29
11.21 Fu, D., Wu, Y. and Tang, Y. DOES INNOVATION MATTER FOR CHINESE HIGH-TECH EXPORTS? A FIRM-LEVEL ANALYSIS
11.22 Fu, D. and Wu, Y. EXPORT WAGE PREMIUM IN CHINA’S MANUFACTURING SECTOR: A FIRM LEVEL ANALYSIS
11.23 Li, B. and Zhang, J. SUBSIDIES IN AN ECONOMY WITH ENDOGENOUS CYCLES OVER NEOCLASSICAL INVESTMENT AND NEO-SCHUMPETERIAN INNOVATION REGIMES
11.24 Krey, B., Widmer, P.K. and Zweifel, P. EFFICIENT PROVISION OF ELECTRICITY FOR THE UNITED STATES AND SWITZERLAND
11.25 Wu, Y. ENERGY INTENSITY AND ITS DETERMINANTS IN CHINA’S REGIONAL ECONOMIES


