23
Necto Training Module 12 : InfoGraphics Basic to Medium Usage
| Date post: | 15-Aug-2015 |
| Category: |
Technology |
| Upload: | jacques-botbol |
| View: | 93 times |
| Download: | 0 times |

Necto Training Module 12 : InfoGraphics Basic to Medium Usage

Lesson Objectives
By the end of this lesson you will be able to: Work with Infographics as a user – Basic Add infographics to a Workboard -
Intermediate Be able to re use an Info graphic -
Advanced
Work with Infographics as a user – Basic

Locations and functionalities
Where you will use Infographics? The Workboard work area. You will
have pre-defined Workboards – with IGs in them for your day-to-day use.
What can you do? Visual analysis. Slice. Drill through to detailed views. Drill through to another Workboard. Start a discussion. Add a comment.

Visual Analysis
Summary:Looking at the state\filling of an image\text\figure enables you to analyze your data quickly and efficiently:
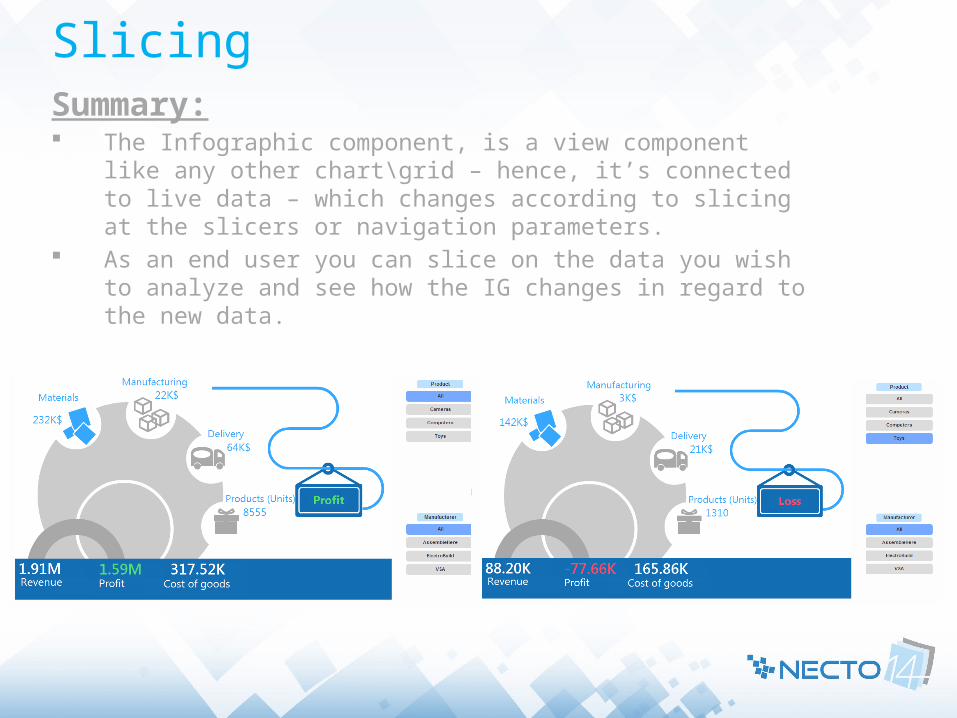
SlicingSummary: The Infographic component, is a view component like
any other chart\grid – hence, it’s connected to live data – which changes according to slicing at the slicers or navigation parameters.
As an end user you can slice on the data you wish to analyze and see how the IG changes in regard to the new data.
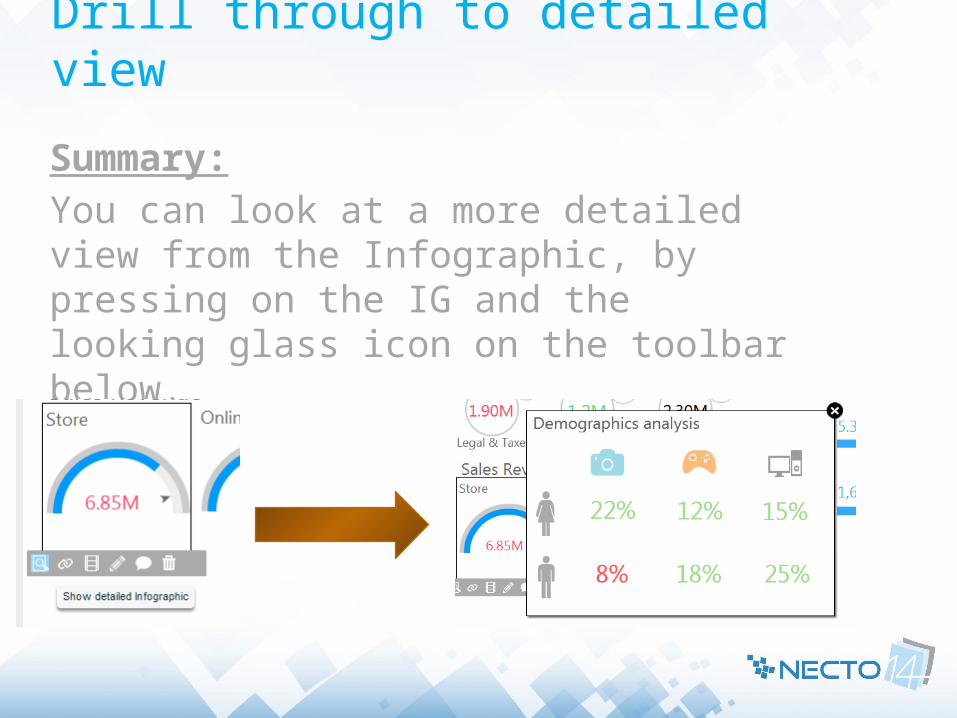
Drill through to detailed view
Summary:You can look at a more detailed view from the Infographic, by pressing on the IG and the looking glass icon on the toolbar below.
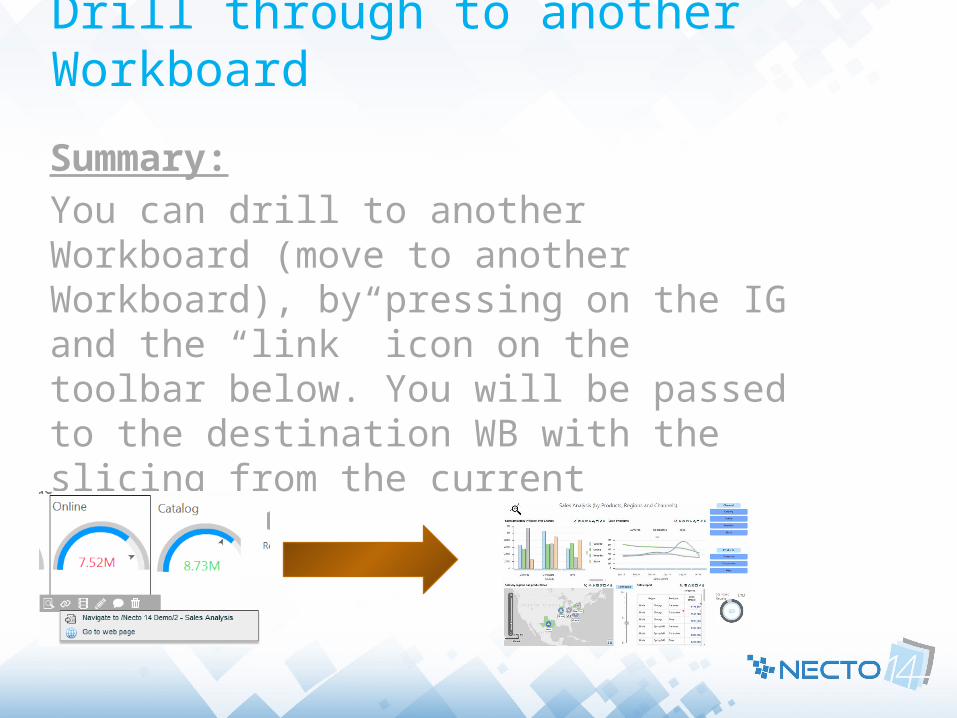
Drill through to another Workboard
Summary:You can drill to another Workboard (move to another Workboard), by pressing on the IG and the “link” icon on the toolbar below. You will be passed to the destination WB with the slicing from the current Workboard.
Start a discussion
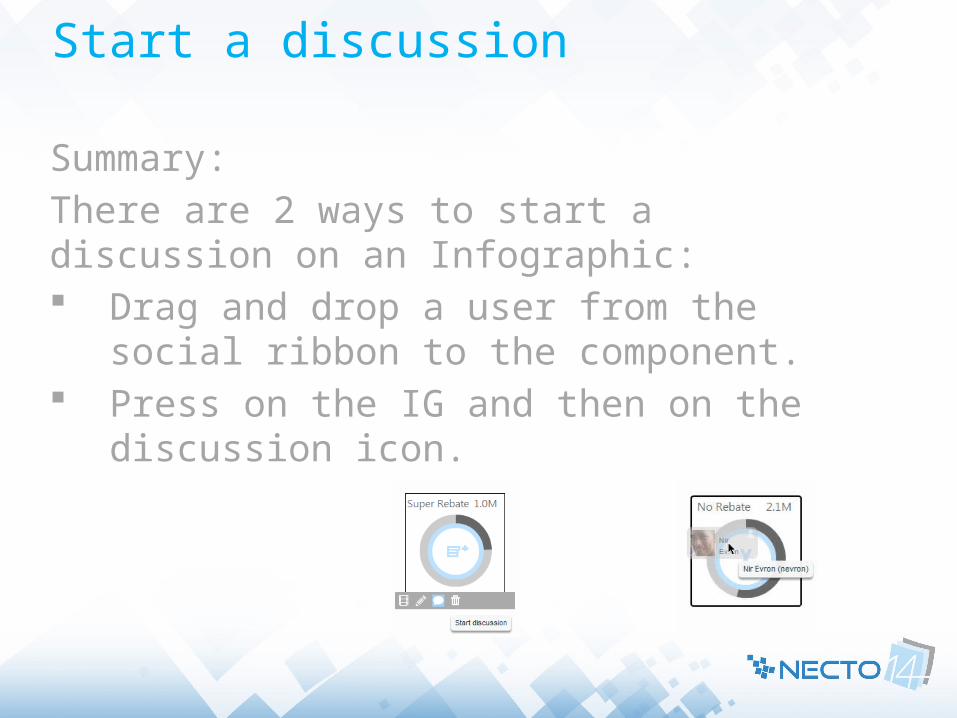
Summary:There are 2 ways to start a discussion on an Infographic: Drag and drop a user from the social
ribbon to the component. Press on the IG and then on the
discussion icon.
Add infographics to a Workboard - Intermediate
Add an IG component to the WB
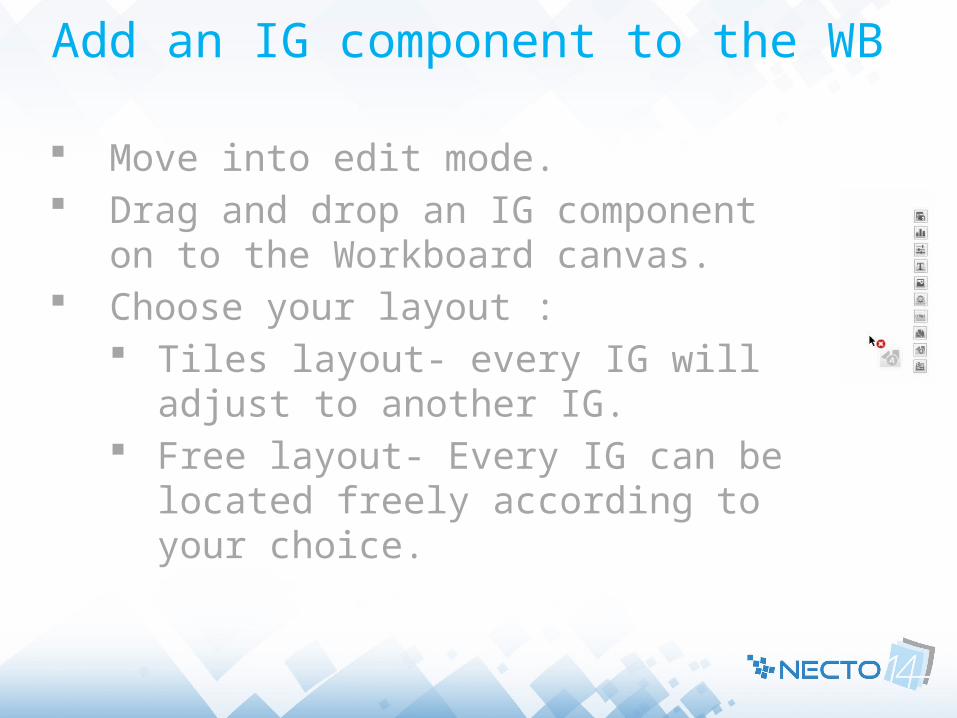
Move into edit mode. Drag and drop an IG component on
to the Workboard canvas. Choose your layout :
Tiles layout- every IG will adjust to another IG.
Free layout- Every IG can be located freely according to your choice.
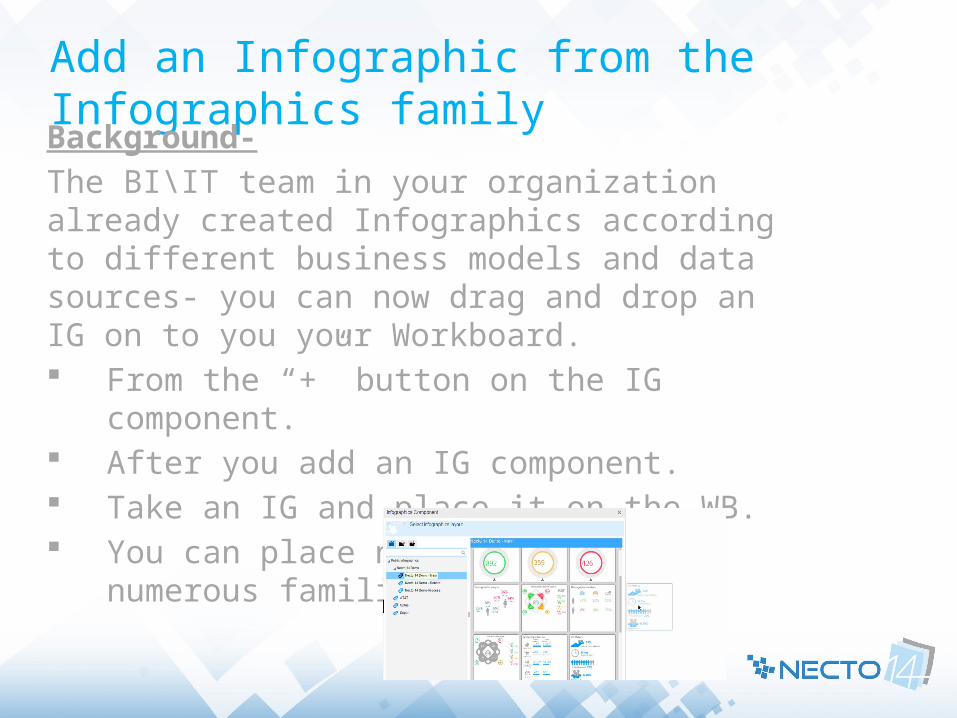
Add an Infographic from the Infographics familyBackground-The BI\IT team in your organization already created Infographics according to different business models and data sources- you can now drag and drop an IG on to you your Workboard. From the “+” button on the IG component. After you add an IG component. Take an IG and place it on the WB. You can place numerous IGs from
numerous families.
Be able to re use an Info graphic - Advanced
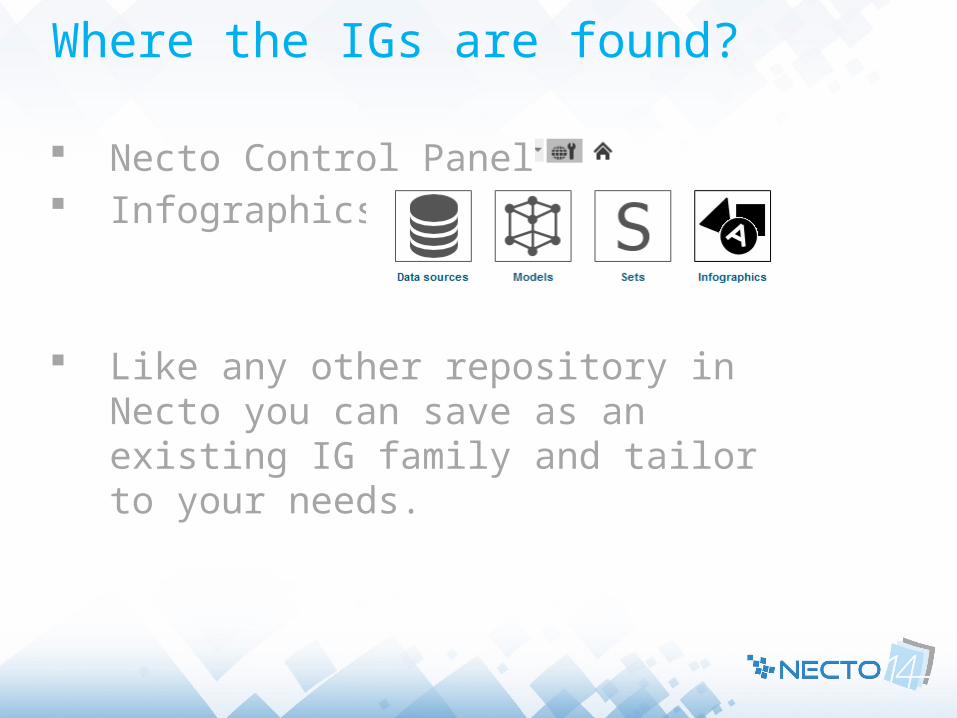
Where the IGs are found?
Necto Control Panel Infographics
Like any other repository in Necto you can save as an existing IG family and tailor to your needs.

Connect to your own data sourceBackground:Every IG family is connected to a data source (OLAP cube or a Necto model). As an advance user you might need to take the pre-existing IG which already suits your needs and connect it to your own data/different data.If and when you need to change an existing IG and connect it to a different data source: Open an IG family from the left task pane. Go to the properties on the right side. Infographic family properties. The last property is “data source”- press on it and change
your data source. You need to save and reload the IG.Another way to do the above is to create a new IG family and choose “based on existing family”.

Re-adjust the data rules on the IG
Summary:Every entity on the IG (Text, Image or Shape) is usually connected to a certain data rule. Example 1- If your sales drop from 90% - color the
text in red. Example 2- Fill the image according to your
performance. By pressing on the entity you want to edit and then
working with the exact property and his data link you can edit the existing rule to be your own (note: sometimes – there are no rules and you can create a new one).
General: In every property at the IG designer where you see
these icon you are able to connect the property to data and control it.

Data link UI
Format
Choose the data (Parameter, Measure, Cell, MDX)
Enable/Disable
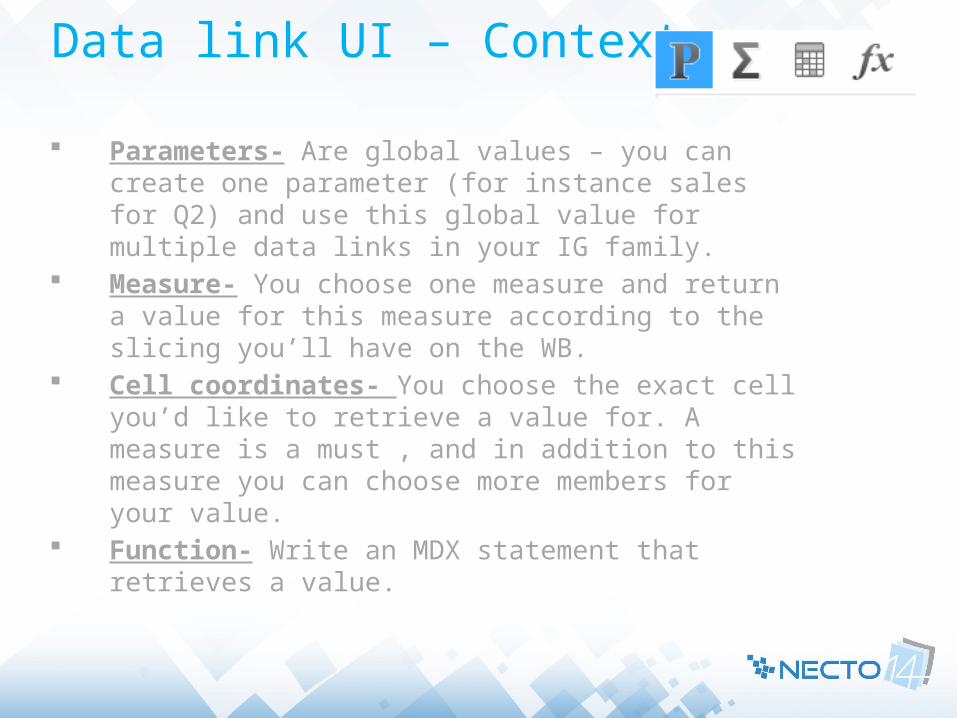
Data link UI – Context
Parameters- Are global values – you can create one parameter (for instance sales for Q2) and use this global value for multiple data links in your IG family.
Measure- You choose one measure and return a value for this measure according to the slicing you’ll have on the WB.
Cell coordinates- You choose the exact cell you’d like to retrieve a value for. A measure is a must , and in addition to this measure you can choose more members for your value.
Function- Write an MDX statement that retrieves a value.

Data link UI – The Value UI
The period to work with, choosing Auto will take the actual slicing on the Workboard this is recommended
What’s the data dimension that will be used, if you choose Auto the first data dimension in the slicers will be used, this is not recommended
What’s the value that will be returned?

Add actions
Summary:Users can move from IGs to other Workboards. Necto will pass the slicers from the origin WB to the destination WB (the WB you move to) like any other drill through in Necto.Where to define:At the Infographic properties – define a property called “Actions”.

Set “Detailed View”
Summary:A detailed view is a property at the IG level – for every IG you can set another IG which will serve as a breakdown or a drill through of what you see in the actual IG.Example:

AnimationsCan be set at the :Family Level- Only switch between IGs via animation. IG level-
Members selection- the IG will be sliced according to the selected members.
Members expression- An MDX set – which returns a list of members.
Workboard- For the end user , to change animation- he’ll be able to create animation between views (IGs, Members selection & Members expression).

Thank youAny Questions?


