594 Chapter 12 NEL 12.1 12.1 Foundations of Quantum Theory One of the major areas of research at the end of the nineteenth century was the spectral analysis of light emitted by hot solids and gases. In the study of blackbody radiation there was discrepancy between theory and experimental data that scientists could not rec- oncile. Many theories were put forward to explain and predict the details of the observed spectra, but none was adequate. Blackbody Radiation If a piece of steel is placed into the flame of a welding torch, the steel begins to glow: first dull red, then a brighter orange–red, then yellow, and finally white. At high tempera- tures (above 2000 K), the hot steel emits most of the visible colours of the spectrum as well as infrared radiation. If heated sufficiently, the steel can produce ultraviolet emis- sions as well. It has been found that this behaviour is similar for all incandescent solids, regardless of their composition. Thus, as the temperature increases, the spectrum of the emitted electromagnetic radiation shifts to higher frequencies (Figure 1). It has also been determined that the relative brightness of the different colours radiated by an incandescent solid depends mainly on the temperature of the material. The actual spectrum of wavelengths emitted by a hot object at various temperatures is shown in Figure 2. The curves illustrate two key points: • At a given temperature, a spectrum of different wavelengths is emitted, of varying intensity, but there is a definite intensity maximum at one particular wavelength. • As the temperature increases, the intensity maximum shifts to a shorter wave- length (higher frequency). The curves in Figure 2 represent the radiation from an object that approximates an ideal emitter or absorber of radiation. Such an object would absorb all wavelengths of light striking it, reflecting none. It would, therefore, appear black under reflected radi- ation and hence is called a blackbody. The detailed analysis of radiation absorption and emission shows that an object that absorbs all incoming radiation, of whatever wavelength, is likewise the most efficient possible emitter of radiation. The radiation emitted by a black- body is called blackbody radiation. Scientists in the 1890s were trying to explain the dependence of blackbody radiation on temperature. According to Maxwell’s electromagnetic theory, the radiation origi- nates from the oscillation of electric charges in the molecules or atoms of the material (a) Figure 1 A hot filament and the spectra emitted for increasing temperatures, (a) to (b) to (c). As the tempera- ture increases, the spectrum spreads into the violet region. (b) (c) blackbody an object that com- pletely absorbs any radiation falling upon it blackbody radiation radiation that would be emitted from an ideal blackbody
Transcript
594 Chapter 12 NEL
12.112.1 Foundations of Quantum TheoryOne of the major areas of research at the end of the nineteenth century was the spectralanalysis of light emitted by hot solids and gases. In the study of blackbody radiationthere was discrepancy between theory and experimental data that scientists could not rec-oncile. Many theories were put forward to explain and predict the details of the observedspectra, but none was adequate.
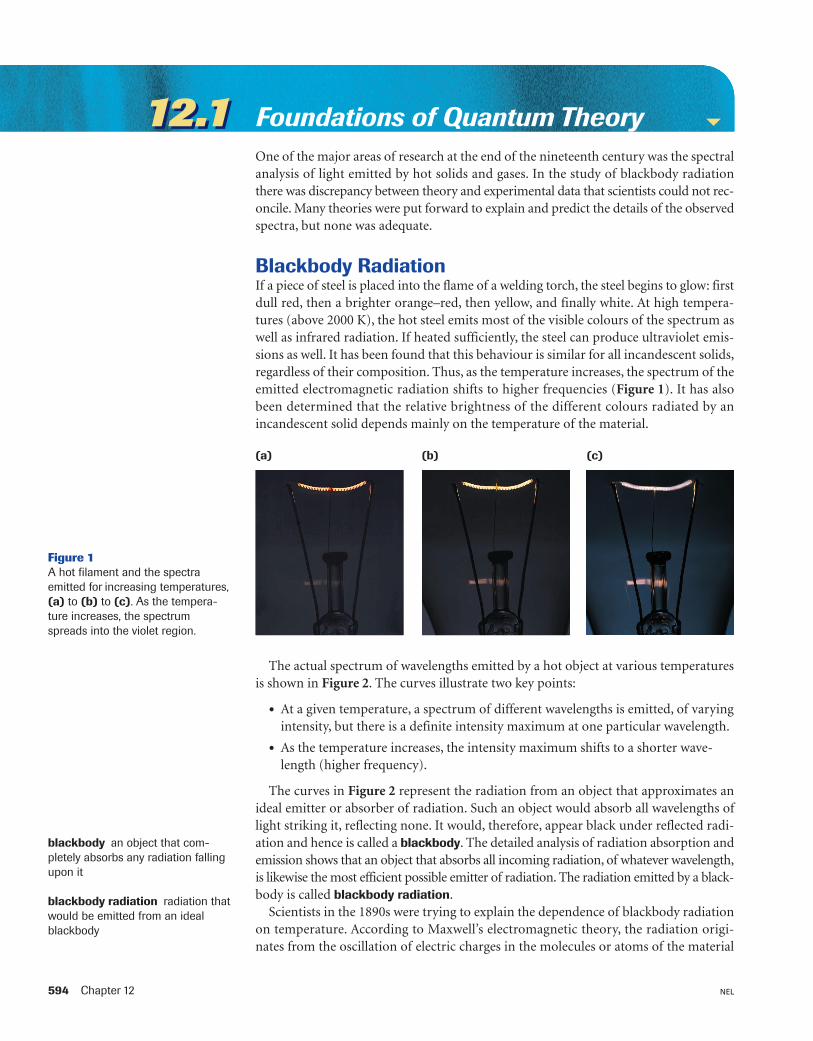
Blackbody RadiationIf a piece of steel is placed into the flame of a welding torch, the steel begins to glow: firstdull red, then a brighter orange–red, then yellow, and finally white. At high tempera-tures (above 2000 K), the hot steel emits most of the visible colours of the spectrum aswell as infrared radiation. If heated sufficiently, the steel can produce ultraviolet emis-sions as well. It has been found that this behaviour is similar for all incandescent solids,regardless of their composition. Thus, as the temperature increases, the spectrum of theemitted electromagnetic radiation shifts to higher frequencies (Figure 1). It has alsobeen determined that the relative brightness of the different colours radiated by anincandescent solid depends mainly on the temperature of the material.
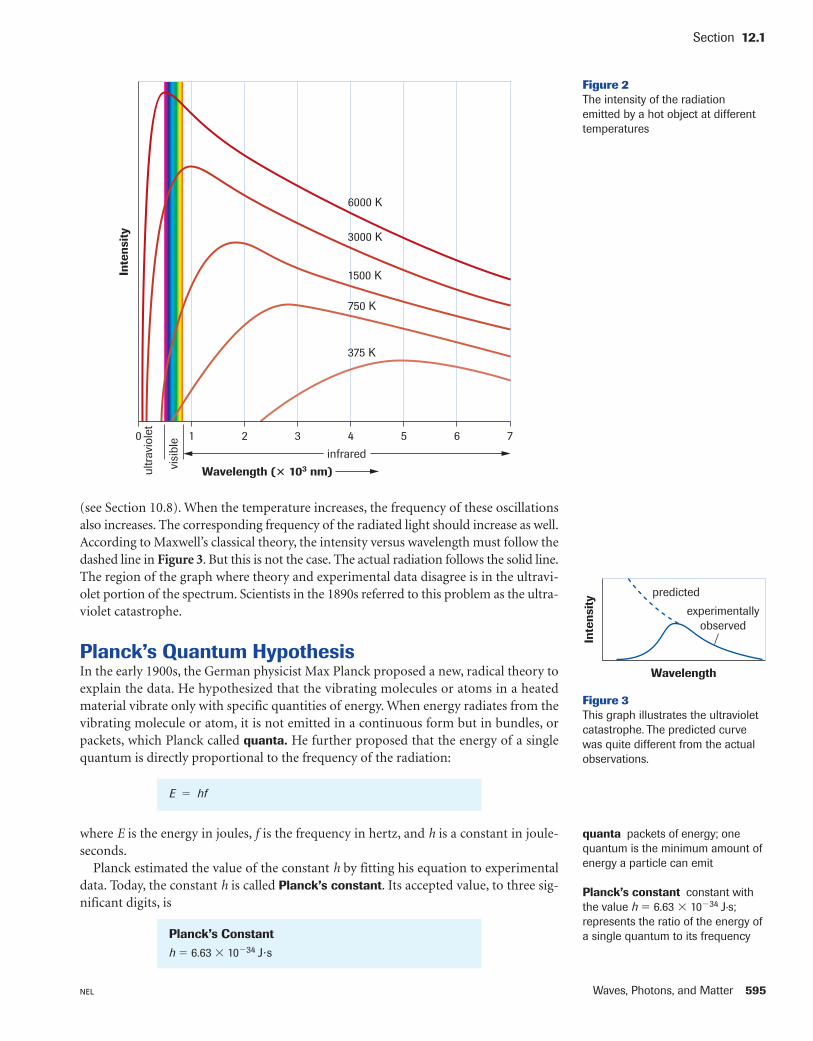
The actual spectrum of wavelengths emitted by a hot object at various temperaturesis shown in Figure 2. The curves illustrate two key points:
• At a given temperature, a spectrum of different wavelengths is emitted, of varyingintensity, but there is a definite intensity maximum at one particular wavelength.
• As the temperature increases, the intensity maximum shifts to a shorter wave-length (higher frequency).
The curves in Figure 2 represent the radiation from an object that approximates anideal emitter or absorber of radiation. Such an object would absorb all wavelengths oflight striking it, reflecting none. It would, therefore, appear black under reflected radi-ation and hence is called a blackbody. The detailed analysis of radiation absorption andemission shows that an object that absorbs all incoming radiation, of whatever wavelength,is likewise the most efficient possible emitter of radiation. The radiation emitted by a black-body is called blackbody radiation.
Scientists in the 1890s were trying to explain the dependence of blackbody radiationon temperature. According to Maxwell’s electromagnetic theory, the radiation origi-nates from the oscillation of electric charges in the molecules or atoms of the material
(a)
Figure 1A hot filament and the spectraemitted for increasing temperatures,(a) to (b) to (c). As the tempera-ture increases, the spectrumspreads into the violet region.
(b) (c)
blackbody an object that com-pletely absorbs any radiation fallingupon it
blackbody radiation radiation thatwould be emitted from an idealblackbody
Waves, Photons, and Matter 595NEL
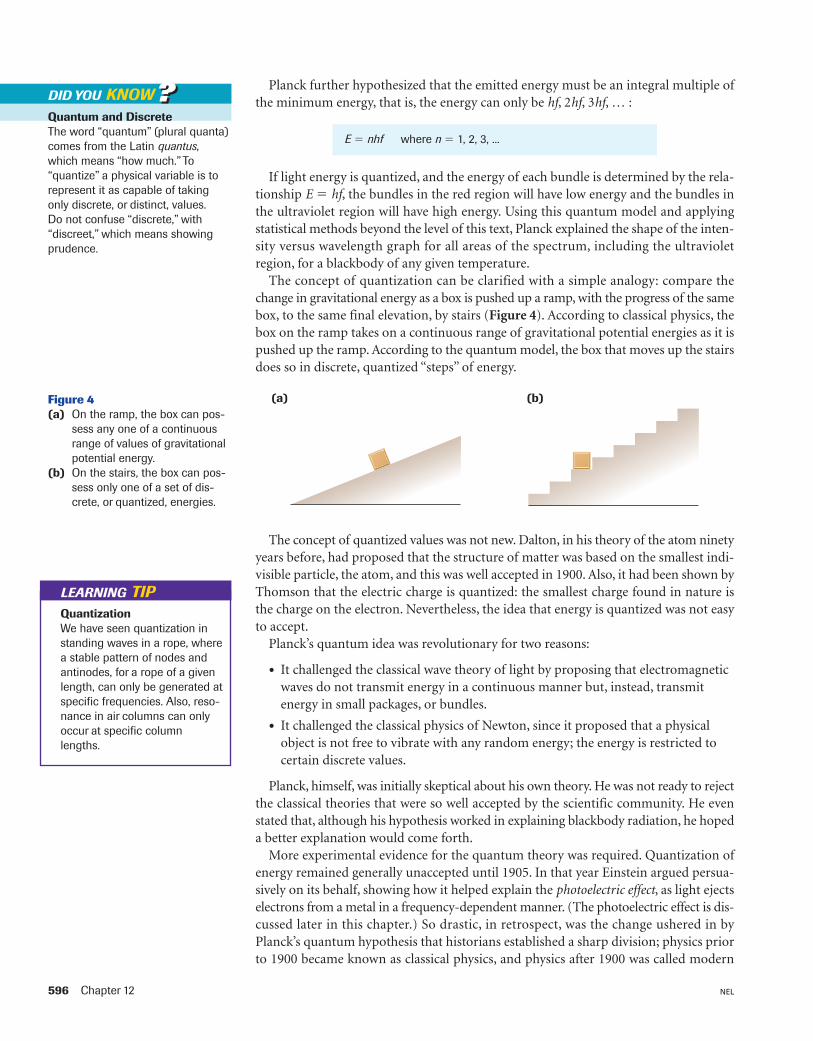
(see Section 10.8). When the temperature increases, the frequency of these oscillationsalso increases. The corresponding frequency of the radiated light should increase as well.According to Maxwell’s classical theory, the intensity versus wavelength must follow thedashed line in Figure 3. But this is not the case. The actual radiation follows the solid line.The region of the graph where theory and experimental data disagree is in the ultravi-olet portion of the spectrum. Scientists in the 1890s referred to this problem as the ultra-violet catastrophe.
Planck’s Quantum HypothesisIn the early 1900s, the German physicist Max Planck proposed a new, radical theory toexplain the data. He hypothesized that the vibrating molecules or atoms in a heatedmaterial vibrate only with specific quantities of energy. When energy radiates from thevibrating molecule or atom, it is not emitted in a continuous form but in bundles, orpackets, which Planck called quanta. He further proposed that the energy of a singlequantum is directly proportional to the frequency of the radiation:
Section 12.1
0 1 2
6000 K
3000 K
1500 K
750 K
375 K
3 4 5 6 7
infrared
visi
ble
Inte
nsit
y
Wavelength (� 103 nm)ultr
avio
let
Figure 2The intensity of the radiationemitted by a hot object at differenttemperatures
quanta packets of energy; onequantum is the minimum amount ofenergy a particle can emit
Planck’s constant constant withthe value h � 6.63 � 10�34 J·s; represents the ratio of the energy ofa single quantum to its frequency
Inte
nsit
y
Wavelength
experimentallyobserved
predicted
Figure 3This graph illustrates the ultravioletcatastrophe. The predicted curvewas quite different from the actualobservations.
E � hf
where E is the energy in joules, f is the frequency in hertz, and h is a constant in joule-seconds.
Planck estimated the value of the constant h by fitting his equation to experimentaldata. Today, the constant h is called Planck’s constant. Its accepted value, to three sig-nificant digits, is
Planck’s Constanth � 6.63 � 10�34 J�s
596 Chapter 12 NEL
Planck further hypothesized that the emitted energy must be an integral multiple ofthe minimum energy, that is, the energy can only be hf, 2hf, 3hf, … :
E � nhf where n � 1, 2, 3, ...
If light energy is quantized, and the energy of each bundle is determined by the rela-tionship E � hf, the bundles in the red region will have low energy and the bundles inthe ultraviolet region will have high energy. Using this quantum model and applyingstatistical methods beyond the level of this text, Planck explained the shape of the inten-sity versus wavelength graph for all areas of the spectrum, including the ultravioletregion, for a blackbody of any given temperature.
The concept of quantization can be clarified with a simple analogy: compare thechange in gravitational energy as a box is pushed up a ramp, with the progress of the samebox, to the same final elevation, by stairs (Figure 4). According to classical physics, thebox on the ramp takes on a continuous range of gravitational potential energies as it ispushed up the ramp. According to the quantum model, the box that moves up the stairsdoes so in discrete, quantized “steps” of energy.
The concept of quantized values was not new. Dalton, in his theory of the atom ninetyyears before, had proposed that the structure of matter was based on the smallest indi-visible particle, the atom, and this was well accepted in 1900. Also, it had been shown byThomson that the electric charge is quantized: the smallest charge found in nature isthe charge on the electron. Nevertheless, the idea that energy is quantized was not easyto accept.
Planck’s quantum idea was revolutionary for two reasons:
• It challenged the classical wave theory of light by proposing that electromagneticwaves do not transmit energy in a continuous manner but, instead, transmitenergy in small packages, or bundles.
• It challenged the classical physics of Newton, since it proposed that a physicalobject is not free to vibrate with any random energy; the energy is restricted tocertain discrete values.
Planck, himself, was initially skeptical about his own theory. He was not ready to rejectthe classical theories that were so well accepted by the scientific community. He evenstated that, although his hypothesis worked in explaining blackbody radiation, he hopeda better explanation would come forth.
More experimental evidence for the quantum theory was required. Quantization ofenergy remained generally unaccepted until 1905. In that year Einstein argued persua-sively on its behalf, showing how it helped explain the photoelectric effect, as light ejectselectrons from a metal in a frequency-dependent manner. (The photoelectric effect is dis-cussed later in this chapter.) So drastic, in retrospect, was the change ushered in byPlanck’s quantum hypothesis that historians established a sharp division; physics priorto 1900 became known as classical physics, and physics after 1900 was called modern
Quantum and DiscreteThe word “quantum” (plural quanta)comes from the Latin quantus,which means “how much.” To“quantize” a physical variable is torepresent it as capable of takingonly discrete, or distinct, values. Do not confuse “discrete,” with “discreet,” which means showingprudence.
DID YOU KNOW ??
(a)Figure 4(a) On the ramp, the box can pos-
sess any one of a continuousrange of values of gravitationalpotential energy.
(b) On the stairs, the box can pos-sess only one of a set of dis-crete, or quantized, energies.
(b)
QuantizationWe have seen quantization instanding waves in a rope, wherea stable pattern of nodes andantinodes, for a rope of a givenlength, can only be generated atspecific frequencies. Also, reso-nance in air columns can onlyoccur at specific columnlengths.
LEARNING TIP
Waves, Photons, and Matter 597NEL
physics. Since Planck’s work was so important historically, Planck’s honour and respectin the scientific community were second only to Einstein’s in the first half of the 20th cen-tury (Figure 5).
Section 12.1
Figure 5Max Karl Planck (1858–1947)worked at the University of Berlin.His initial influential work on black-body radiation dates from 1889. In1918, Planck’s discovery of energyquanta was recognized with theNobel Prize in physics. Stimulatedby Planck’s work, Einstein becamean early proponent of the quantumtheory. The celebrated Max PlanckSociety in Germany runs researchinstitutes similar to those maintainedby the National Research Council inCanada.
Electron VoltsIt is more common to use electronvolts in quantum mechanics. Recallthat �E � q �V ; to convert joulesto electron volts, use the relation-ship 1 eV � 1.60 � 10�19 J.
LEARNING TIP
Answers
2. (a) 1.32 eV
(b) 1.8 eV
(c) 2.86 eV
(d) 5.0 � 103 eV
Calculate the energy in joules and electron volts of
(a) a quantum of blue light with a frequency of 6.67 � 1014 Hz
(b) a quantum of red light with a wavelength of 635 nm
Solution(a) f � 6.67 � 1014 Hz
h � 6.63 � 10�34 J�s
E � hf
� (6.63 � 10�34 J�s)(6.67 � 1014 Hz)
E � 4.42 � 10�19 J
1.60 � 10�19 J � 1 eV
� 2.76 eV
The energy is 4.42 � 10�19 J, or 2.76 eV.
(b) λ � 635 nm � 6.35 � 10�7 m
h � 6.63 � 10�34 J�s
E � hf
But v � f λ or c � f λ, and f � �λc
�, where c is the speed of light � 3.00 � 108 m/s.
E � �hλc�
�
E � 3.13 � 10�19 J
1.60 � 10�19 J � 1 eV
� 1.96 eV
The energy is 3.13 � 10�19 J, or 1.96 eV.
3.13 � 10�19 J��1.60 � 10�19 J/eV
(6.63 � 10�34 J�s)(3.00 � 108 m/s)����
6.35 � 10�7 m
4.42 � 10�19 J��1.60 � 10�19 J/eV
SAMPLE problem 1
PracticeUnderstanding Concepts
1. Explain which of the following quantities are discrete: time, money, matter,energy, length, scores in hockey games.
2. Determine the energy, in electron volts, for quanta of electromagnetic radiationwith the following characteristics:(a) wavelength � 941 nm (infrared radiation)(b) frequency � 4.4 � 1014 Hz (red light)(c) wavelength � 435 nm (violet light)(d) frequency � 1.2 � 1018 Hz (X rays)
598 Chapter 12 NEL
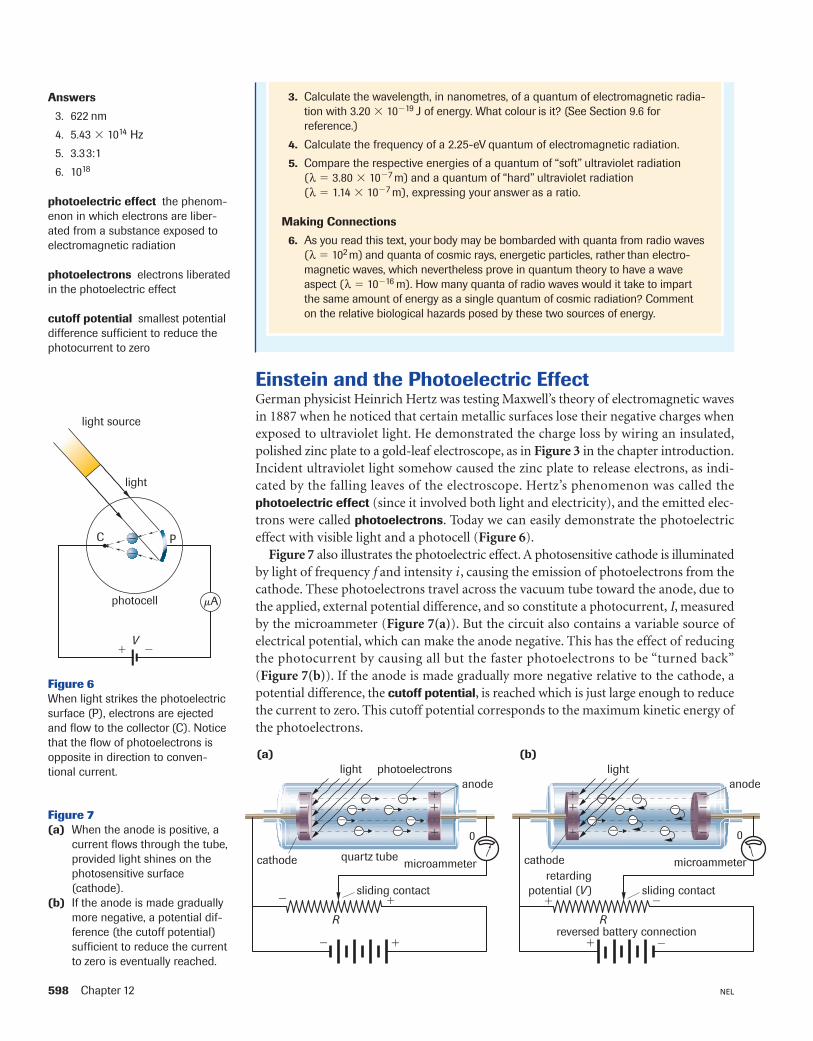
Einstein and the Photoelectric EffectGerman physicist Heinrich Hertz was testing Maxwell’s theory of electromagnetic wavesin 1887 when he noticed that certain metallic surfaces lose their negative charges whenexposed to ultraviolet light. He demonstrated the charge loss by wiring an insulated,polished zinc plate to a gold-leaf electroscope, as in Figure 3 in the chapter introduction.Incident ultraviolet light somehow caused the zinc plate to release electrons, as indi-cated by the falling leaves of the electroscope. Hertz’s phenomenon was called the photoelectric effect (since it involved both light and electricity), and the emitted elec-trons were called photoelectrons. Today we can easily demonstrate the photoelectriceffect with visible light and a photocell (Figure 6).
Figure 7 also illustrates the photoelectric effect. A photosensitive cathode is illuminatedby light of frequency f and intensity i , causing the emission of photoelectrons from thecathode. These photoelectrons travel across the vacuum tube toward the anode, due tothe applied, external potential difference, and so constitute a photocurrent, I, measuredby the microammeter (Figure 7(a)). But the circuit also contains a variable source ofelectrical potential, which can make the anode negative. This has the effect of reducingthe photocurrent by causing all but the faster photoelectrons to be “turned back”(Figure 7(b)). If the anode is made gradually more negative relative to the cathode, apotential difference, the cutoff potential, is reached which is just large enough to reducethe current to zero. This cutoff potential corresponds to the maximum kinetic energy ofthe photoelectrons.
mA
�
�
V
photocell
� �
PC
light
light source
Figure 6When light strikes the photoelectricsurface (P), electrons are ejectedand flow to the collector (C). Noticethat the flow of photoelectrons isopposite in direction to conven-tional current.
photoelectric effect the phenom-enon in which electrons are liber-ated from a substance exposed toelectromagnetic radiation
photoelectrons electrons liberatedin the photoelectric effect
cutoff potential smallest potentialdifference sufficient to reduce thephotocurrent to zero
� ���
� ���
� �
��
���
�
quartz tube
0
microammeter
sliding contact
R
light
�
�
�
�
photoelectronsanode
cathode
0
microammeter
sliding contactretarding
potential (V )
reversed battery connectionR
light
�
�
�
�
anode
cathode
����
����
����
����
����
����
����
����
(a) (b)
Figure 7(a) When the anode is positive, a
current flows through the tube,provided light shines on thephotosensitive surface(cathode).
(b) If the anode is made graduallymore negative, a potential dif-ference (the cutoff potential)sufficient to reduce the currentto zero is eventually reached.
3. Calculate the wavelength, in nanometres, of a quantum of electromagnetic radia-tion with 3.20 � 10�19 J of energy. What colour is it? (See Section 9.6 forreference.)
4. Calculate the frequency of a 2.25-eV quantum of electromagnetic radiation.
5. Compare the respective energies of a quantum of “soft” ultraviolet radiation (λ � 3.80 � 10�7 m) and a quantum of “hard” ultraviolet radiation (λ � 1.14 � 10�7 m), expressing your answer as a ratio.
Making Connections
6. As you read this text, your body may be bombarded with quanta from radio waves(λ � 102m) and quanta of cosmic rays, energetic particles, rather than electro-magnetic waves, which nevertheless prove in quantum theory to have a waveaspect (λ � 10�16 m). How many quanta of radio waves would it take to impartthe same amount of energy as a single quantum of cosmic radiation? Commenton the relative biological hazards posed by these two sources of energy.
Answers
3. 622 nm
4. 5.43 � 1014 Hz
5. 3.33:1
6. 1018
Waves, Photons, and Matter 599NEL
Many scientists repeated Hertz’s experiment with similar apparatus. Their results notonly gave some support to Planck’s theories but also provided the basis for Einstein’sanalysis of the photoelectric effect. You can explore the effect by performing Lab Exercise 12.1.1 in the Lab Activities section at the end of this chapter.
Here are some of the more significant findings:
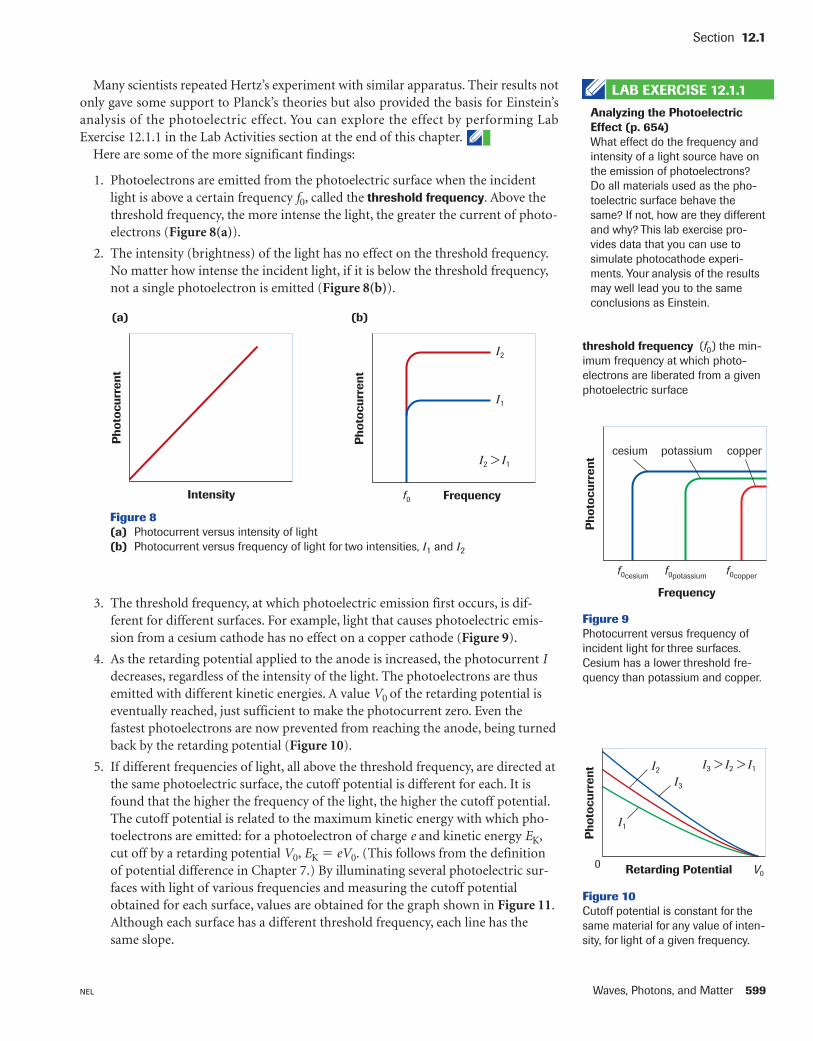
1. Photoelectrons are emitted from the photoelectric surface when the incidentlight is above a certain frequency f0, called the threshold frequency. Above thethreshold frequency, the more intense the light, the greater the current of photo-electrons (Figure 8(a)).
2. The intensity (brightness) of the light has no effect on the threshold frequency.No matter how intense the incident light, if it is below the threshold frequency,not a single photoelectron is emitted (Figure 8(b)).
3. The threshold frequency, at which photoelectric emission first occurs, is dif-ferent for different surfaces. For example, light that causes photoelectric emis-sion from a cesium cathode has no effect on a copper cathode (Figure 9).
4. As the retarding potential applied to the anode is increased, the photocurrent Idecreases, regardless of the intensity of the light. The photoelectrons are thusemitted with different kinetic energies. A value V0 of the retarding potential iseventually reached, just sufficient to make the photocurrent zero. Even thefastest photoelectrons are now prevented from reaching the anode, being turnedback by the retarding potential (Figure 10).
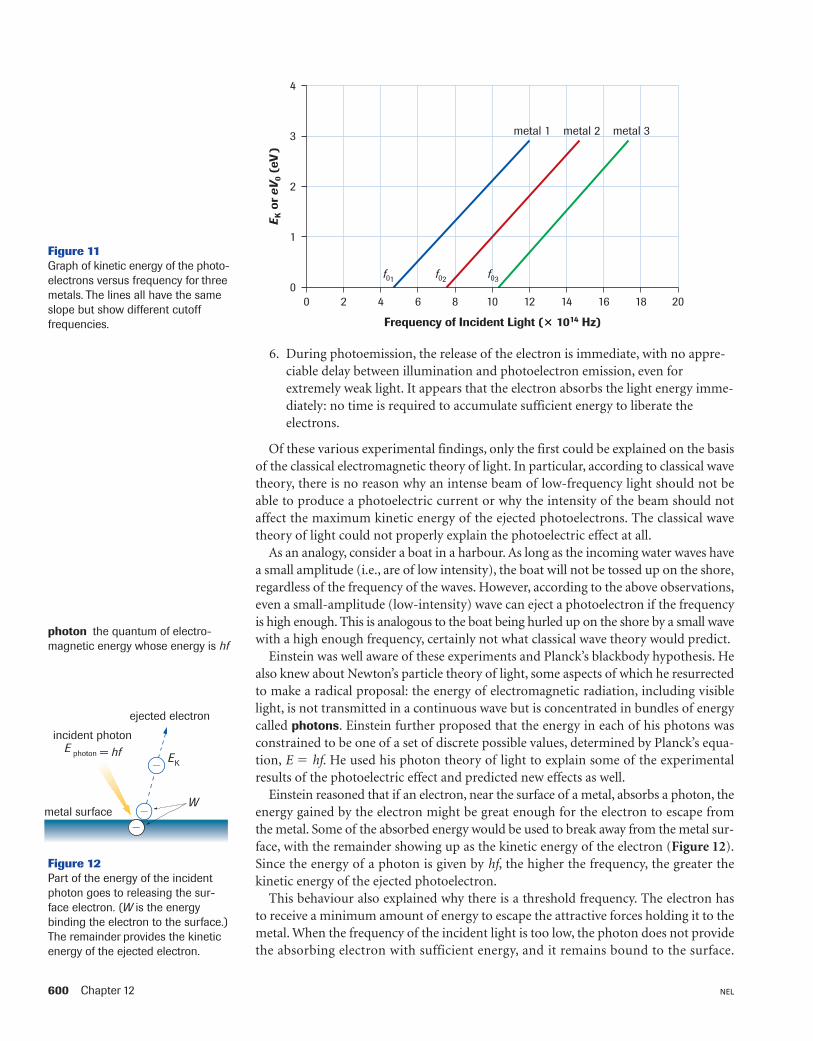
5. If different frequencies of light, all above the threshold frequency, are directed atthe same photoelectric surface, the cutoff potential is different for each. It isfound that the higher the frequency of the light, the higher the cutoff potential.The cutoff potential is related to the maximum kinetic energy with which pho-toelectrons are emitted: for a photoelectron of charge e and kinetic energy EK,cut off by a retarding potential V0, EK � eV0. (This follows from the definitionof potential difference in Chapter 7.) By illuminating several photoelectric sur-faces with light of various frequencies and measuring the cutoff potentialobtained for each surface, values are obtained for the graph shown in Figure 11.Although each surface has a different threshold frequency, each line has thesame slope.
Section 12.1
����
����
����
����
Analyzing the PhotoelectricEffect (p. 654)What effect do the frequency andintensity of a light source have onthe emission of photoelectrons?Do all materials used as the pho-toelectric surface behave thesame? If not, how are they differentand why? This lab exercise pro-vides data that you can use tosimulate photocathode experi-ments. Your analysis of the resultsmay well lead you to the sameconclusions as Einstein.
LAB EXERCISE 12.1.1
Pho
tocu
rren
t
Intensity
(a)
Figure 8(a) Photocurrent versus intensity of light (b) Photocurrent versus frequency of light for two intensities, I1 and I2
I2
I2 > I1
I1
f0
Pho
tocu
rren
t
Frequency
(b)
threshold frequency (f0) the min-imum frequency at which photo-electrons are liberated from a givenphotoelectric surface
Pho
tocu
rren
tFrequency
cesium
f0cesium f0potassium f0copper
copperpotassium
Figure 9Photocurrent versus frequency ofincident light for three surfaces.Cesium has a lower threshold fre-quency than potassium and copper.
Pho
tocu
rren
t
Retarding Potential V00
I2 I3 > I2 > I1
I3
I1
Figure 10Cutoff potential is constant for thesame material for any value of inten-sity, for light of a given frequency.
600 Chapter 12 NEL
6. During photoemission, the release of the electron is immediate, with no appre-ciable delay between illumination and photoelectron emission, even forextremely weak light. It appears that the electron absorbs the light energy imme-diately: no time is required to accumulate sufficient energy to liberate the electrons.
Of these various experimental findings, only the first could be explained on the basisof the classical electromagnetic theory of light. In particular, according to classical wavetheory, there is no reason why an intense beam of low-frequency light should not beable to produce a photoelectric current or why the intensity of the beam should notaffect the maximum kinetic energy of the ejected photoelectrons. The classical wavetheory of light could not properly explain the photoelectric effect at all.
As an analogy, consider a boat in a harbour. As long as the incoming water waves havea small amplitude (i.e., are of low intensity), the boat will not be tossed up on the shore,regardless of the frequency of the waves. However, according to the above observations,even a small-amplitude (low-intensity) wave can eject a photoelectron if the frequencyis high enough. This is analogous to the boat being hurled up on the shore by a small wavewith a high enough frequency, certainly not what classical wave theory would predict.
Einstein was well aware of these experiments and Planck’s blackbody hypothesis. Healso knew about Newton’s particle theory of light, some aspects of which he resurrectedto make a radical proposal: the energy of electromagnetic radiation, including visiblelight, is not transmitted in a continuous wave but is concentrated in bundles of energycalled photons. Einstein further proposed that the energy in each of his photons wasconstrained to be one of a set of discrete possible values, determined by Planck’s equa-tion, E � hf. He used his photon theory of light to explain some of the experimentalresults of the photoelectric effect and predicted new effects as well.
Einstein reasoned that if an electron, near the surface of a metal, absorbs a photon, theenergy gained by the electron might be great enough for the electron to escape fromthe metal. Some of the absorbed energy would be used to break away from the metal sur-face, with the remainder showing up as the kinetic energy of the electron (Figure 12).Since the energy of a photon is given by hf, the higher the frequency, the greater thekinetic energy of the ejected photoelectron.
This behaviour also explained why there is a threshold frequency. The electron hasto receive a minimum amount of energy to escape the attractive forces holding it to themetal. When the frequency of the incident light is too low, the photon does not providethe absorbing electron with sufficient energy, and it remains bound to the surface.
0 2 4 6 8 10 1412 16
metal 1 metal 2 metal 3
f03f02f01
18 20
Frequency of Incident Light (� 1014 Hz)
E K o
r eV
0 (e
V)
3
4
2
1
0
Figure 11Graph of kinetic energy of the photo-electrons versus frequency for threemetals. The lines all have the sameslope but show different cutofffrequencies.
photon the quantum of electro-magnetic energy whose energy is hf
�
�
�
ejected electron
incident photon
metal surfaceW
EK
E photon = hf
Figure 12Part of the energy of the incidentphoton goes to releasing the sur-face electron. (W is the energybinding the electron to the surface.)The remainder provides the kineticenergy of the ejected electron.
The intensity (brightness) of the light is only a measure of the rate at which the photonsstrike the surface, not of the energy per photon. This helps explain why the kinetic energyof the emitted photoelectrons and the threshold frequency are independent of the inten-sity of the incident light.
To summarize: when a photon hits a photoelectric surface, a surface electron absorbsits energy. Some of the energy is needed to release the electron, while the remainderbecomes the kinetic energy of the ejected photoelectron. This is what one would expectbased on the conservation of energy. Einstein described this mathematically as follows:
Ephoton � W � EK
where Ephoton is the energy of the incident photon, W is the energy with which the elec-tron is bound to the photoelectric surface, and EK is the kinetic energy of the ejectedphotoelectron.
Rearranging the equation, we obtain
EK � Ephoton � W
Upon rewriting Ephoton in terms of the frequency of the incident photon, we have Einstein’sphotoelectric equation:
Section 12.1
work function the energy withwhich an electron is bound to aphotoelectric surface
EK � hf � W
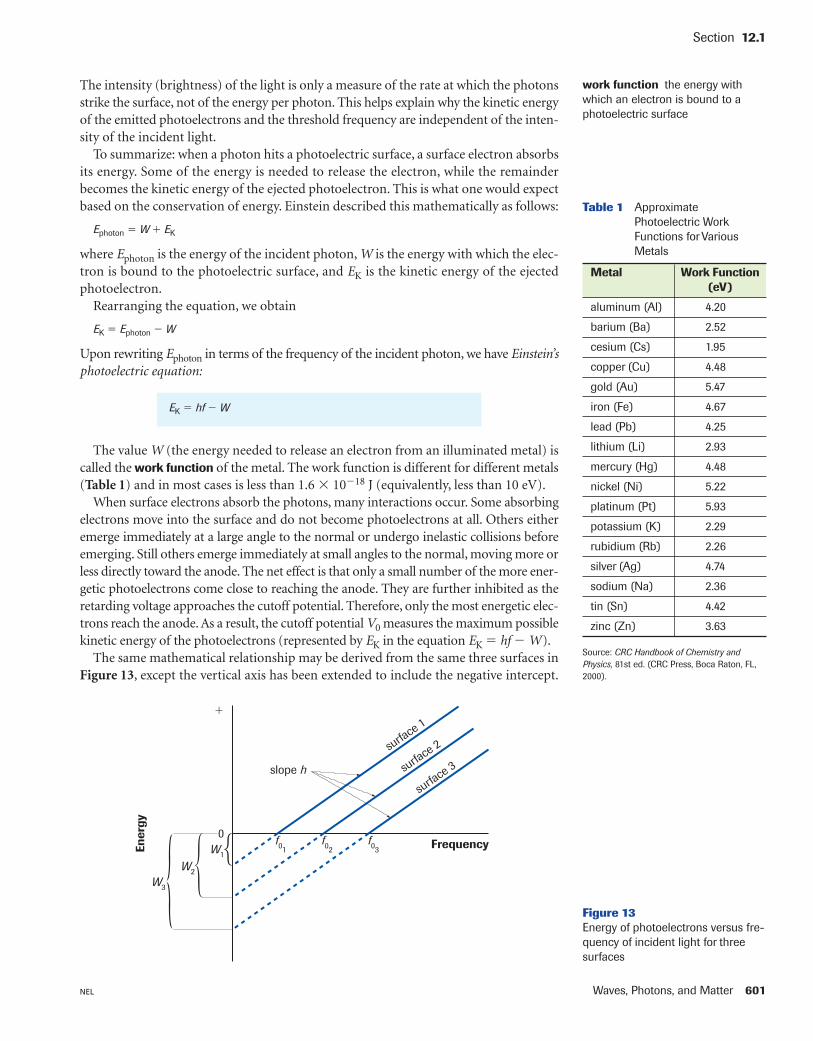
The value W (the energy needed to release an electron from an illuminated metal) iscalled the work function of the metal. The work function is different for different metals(Table 1) and in most cases is less than 1.6 � 10�18 J (equivalently, less than 10 eV).
When surface electrons absorb the photons, many interactions occur. Some absorbingelectrons move into the surface and do not become photoelectrons at all. Others eitheremerge immediately at a large angle to the normal or undergo inelastic collisions beforeemerging. Still others emerge immediately at small angles to the normal, moving more orless directly toward the anode. The net effect is that only a small number of the more ener-getic photoelectrons come close to reaching the anode. They are further inhibited as theretarding voltage approaches the cutoff potential. Therefore, only the most energetic elec-trons reach the anode. As a result, the cutoff potential V0 measures the maximum possiblekinetic energy of the photoelectrons (represented by EK in the equation EK � hf � W).
The same mathematical relationship may be derived from the same three surfaces inFigure 13, except the vertical axis has been extended to include the negative intercept.
Table 1 ApproximatePhotoelectric WorkFunctions for VariousMetals
Figure 13Energy of photoelectrons versus fre-quency of incident light for threesurfaces
Waves, Photons, and Matter 601NEL
602 Chapter 12 NEL
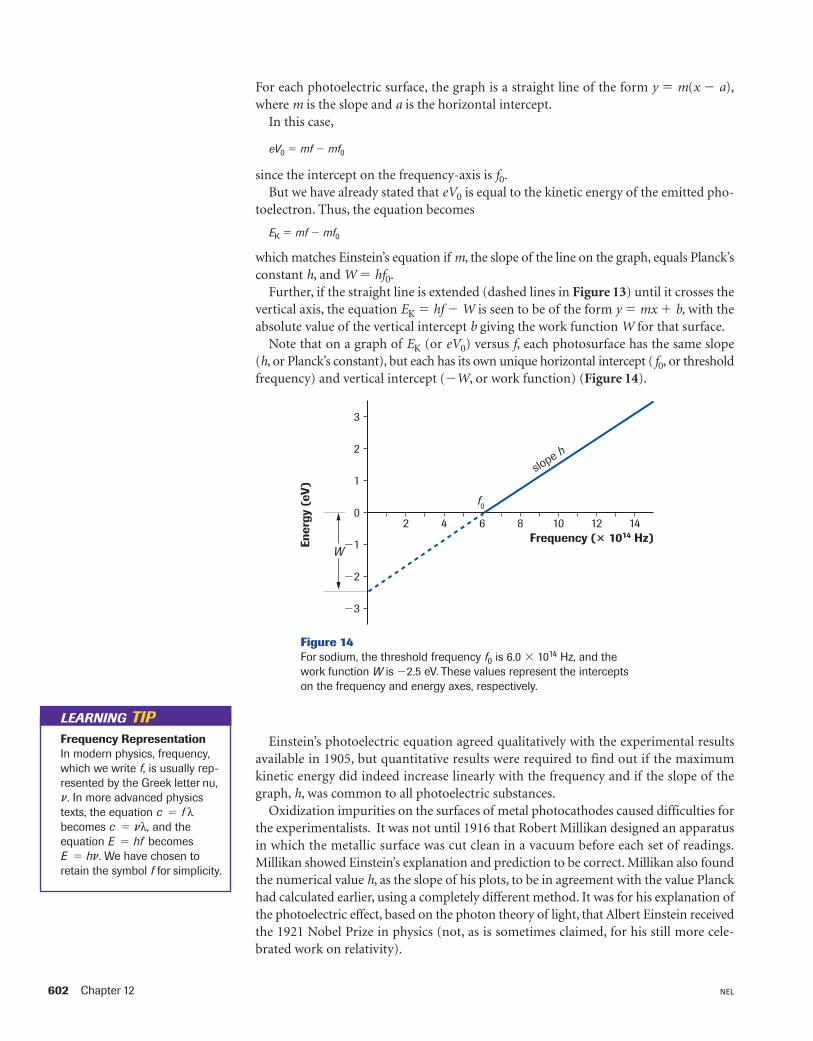
For each photoelectric surface, the graph is a straight line of the form y � m(x � a),where m is the slope and a is the horizontal intercept.
In this case,
eV0 � mf � mf0
since the intercept on the frequency-axis is f0.But we have already stated that eV0 is equal to the kinetic energy of the emitted pho-
toelectron. Thus, the equation becomes
EK � mf � mf0
which matches Einstein’s equation if m, the slope of the line on the graph, equals Planck’sconstant h, and W � hf0.
Further, if the straight line is extended (dashed lines in Figure 13) until it crosses thevertical axis, the equation EK � hf � W is seen to be of the form y � mx � b, with theabsolute value of the vertical intercept b giving the work function W for that surface.
Note that on a graph of EK (or eV0) versus f, each photosurface has the same slope (h, or Planck’s constant), but each has its own unique horizontal intercept ( f0, or thresholdfrequency) and vertical intercept (�W, or work function) (Figure 14).
Einstein’s photoelectric equation agreed qualitatively with the experimental resultsavailable in 1905, but quantitative results were required to find out if the maximumkinetic energy did indeed increase linearly with the frequency and if the slope of thegraph, h, was common to all photoelectric substances.
Oxidization impurities on the surfaces of metal photocathodes caused difficulties forthe experimentalists. It was not until 1916 that Robert Millikan designed an apparatusin which the metallic surface was cut clean in a vacuum before each set of readings.Millikan showed Einstein’s explanation and prediction to be correct. Millikan also foundthe numerical value h, as the slope of his plots, to be in agreement with the value Planckhad calculated earlier, using a completely different method. It was for his explanation ofthe photoelectric effect, based on the photon theory of light, that Albert Einstein receivedthe 1921 Nobel Prize in physics (not, as is sometimes claimed, for his still more cele-brated work on relativity).
Frequency (� 1014 Hz)
3
2
1
0
�1
�2
�3
Ener
gy (
eV)
2 4 6 8 10 12 14
W
f0
slope h
Figure 14For sodium, the threshold frequency f0 is 6.0 � 1014 Hz, and thework function W is �2.5 eV. These values represent the interceptson the frequency and energy axes, respectively.
Frequency RepresentationIn modern physics, frequency,which we write f, is usually rep-resented by the Greek letter nu,n. In more advanced physicstexts, the equation c � f λbecomes c � nλ, and theequation E � hf becomes E � hn. We have chosen toretain the symbol f for simplicity.
LEARNING TIP
Section 12.1
Waves, Photons, and Matter 603NEL
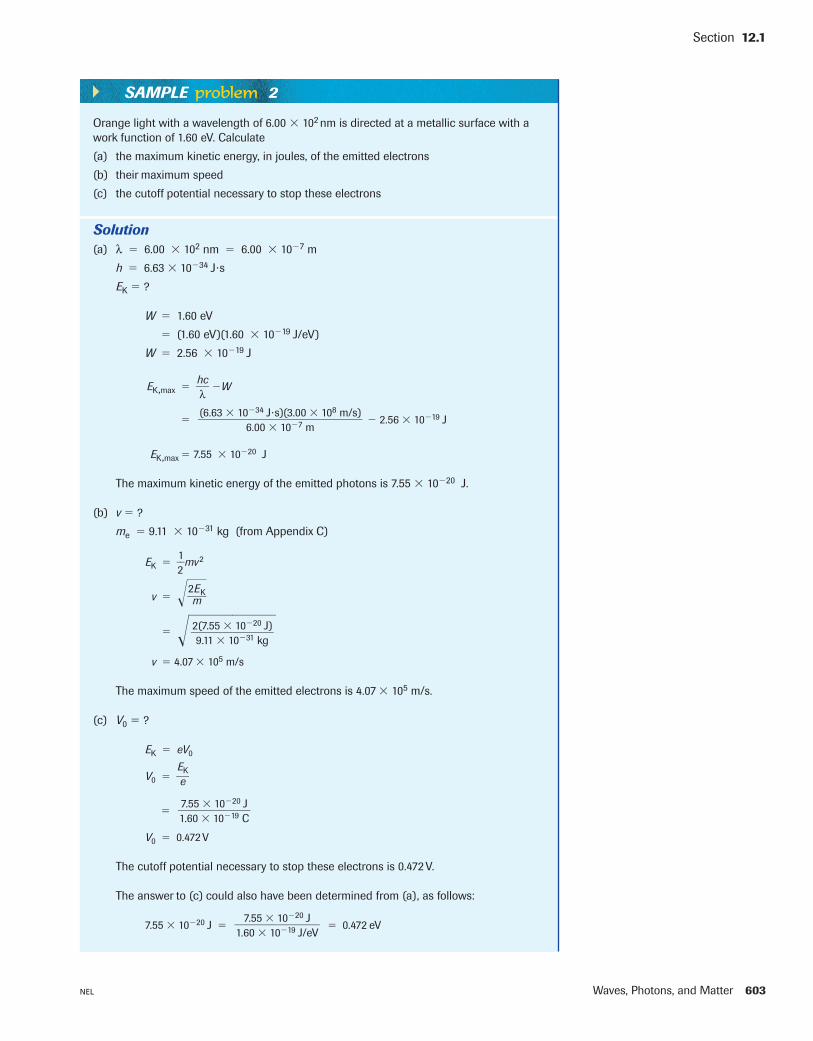
Orange light with a wavelength of 6.00 � 102 nm is directed at a metallic surface with awork function of 1.60 eV. Calculate
(a) the maximum kinetic energy, in joules, of the emitted electrons
(b) their maximum speed
(c) the cutoff potential necessary to stop these electrons
Solution(a) λ � 6.00 � 102 nm � 6.00 � 10�7 m
h � 6.63 � 10�34 J�s
EK � ?
W � 1.60 eV
� (1.60 eV)(1.60 � 10�19 J/eV)
W � 2.56 � 10�19 J
EK,max � �hλc� �W
� � 2.56 � 10�19 J
EK,max � 7.55 � 10�20 J
The maximum kinetic energy of the emitted photons is 7.55 � 10�20 J.
(b) v � ?
me � 9.11 � 10�31 kg (from Appendix C)
EK � �12
�mv2
v � ��2mEK��
� ���v � 4.07 � 105 m/s
The maximum speed of the emitted electrons is 4.07 � 105 m/s.
(c) V0 � ?
EK � eV0
V0 � �EeK�
�
V0 � 0.472 V
The cutoff potential necessary to stop these electrons is 0.472 V.
The answer to (c) could also have been determined from (a), as follows:
Photodiodes and Digital CamerasIn addition to its theoretical role in confirming the photon view of light, the photo-electric effect has many practical applications, for the most part in semiconductorsknown as photodiodes. The absorption of a photon liberates an electron, which changesthe conductivity of the photodiode material. Burglar alarms, garage doors, and auto-matic door openers often incorporate photodiodes. When a beam of light is interrupted,the drop in current in the circuit activates a switch, triggering an alarm or starting amotor. An infrared beam is sometimes used because of its invisibility. Remote controlsfor some televisions and video machines work in much the same way. Many smokedetectors use the photoelectric effect: the particles of smoke interrupt the flow of lightand alter the electric current. Photocell sensors in cameras measure the level of light,adjusting the shutter speed or the aperture for the correct exposure. Photocells are usedin a host of other devices, such as outdoor security lights and automatic street lights.
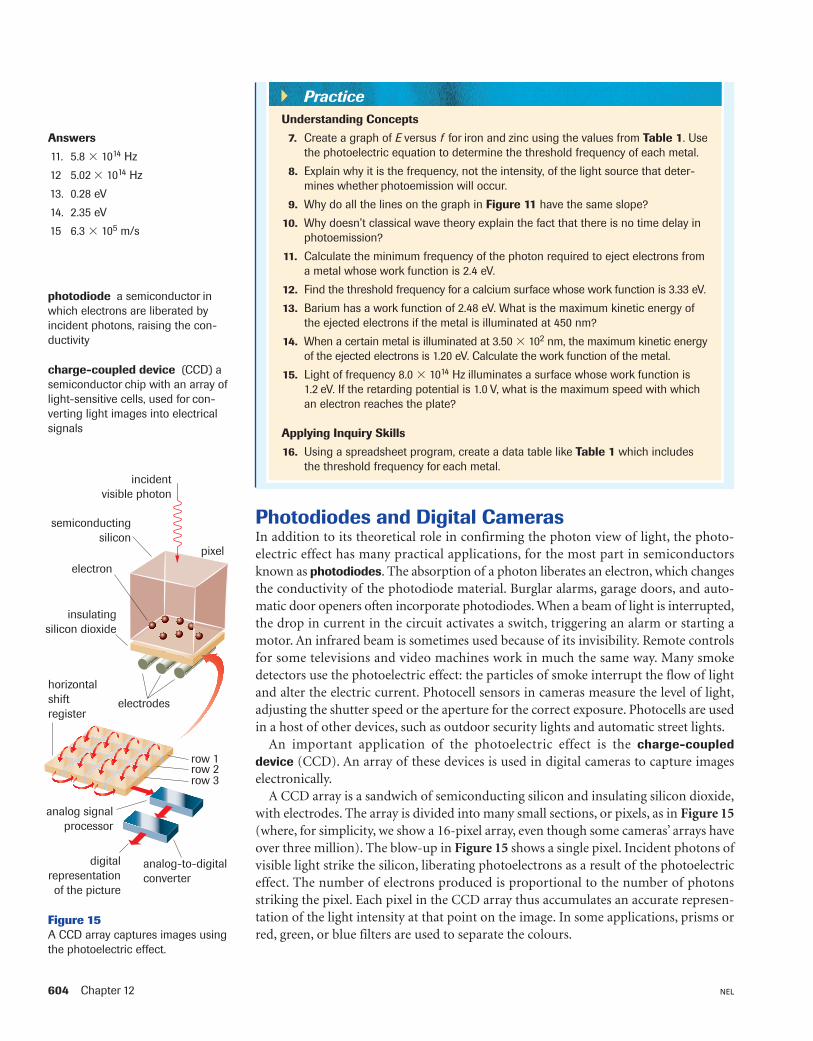
An important application of the photoelectric effect is the charge-coupled device (CCD). An array of these devices is used in digital cameras to capture images electronically.
A CCD array is a sandwich of semiconducting silicon and insulating silicon dioxide,with electrodes. The array is divided into many small sections, or pixels, as in Figure 15(where, for simplicity, we show a 16-pixel array, even though some cameras’ arrays haveover three million). The blow-up in Figure 15 shows a single pixel. Incident photons ofvisible light strike the silicon, liberating photoelectrons as a result of the photoelectriceffect. The number of electrons produced is proportional to the number of photonsstriking the pixel. Each pixel in the CCD array thus accumulates an accurate represen-tation of the light intensity at that point on the image. In some applications, prisms orred, green, or blue filters are used to separate the colours.
photodiode a semiconductor inwhich electrons are liberated byincident photons, raising the con-ductivity
charge-coupled device (CCD) asemiconductor chip with an array oflight-sensitive cells, used for con-verting light images into electricalsignals
7. Create a graph of E versus f for iron and zinc using the values from Table 1. Usethe photoelectric equation to determine the threshold frequency of each metal.
8. Explain why it is the frequency, not the intensity, of the light source that deter-mines whether photoemission will occur.
9. Why do all the lines on the graph in Figure 11 have the same slope?
10. Why doesn’t classical wave theory explain the fact that there is no time delay inphotoemission?
11. Calculate the minimum frequency of the photon required to eject electrons froma metal whose work function is 2.4 eV.
12. Find the threshold frequency for a calcium surface whose work function is 3.33 eV.
13. Barium has a work function of 2.48 eV. What is the maximum kinetic energy ofthe ejected electrons if the metal is illuminated at 450 nm?
14. When a certain metal is illuminated at 3.50 � 102 nm, the maximum kinetic energyof the ejected electrons is 1.20 eV. Calculate the work function of the metal.
15. Light of frequency 8.0 � 1014 Hz illuminates a surface whose work function is 1.2 eV. If the retarding potential is 1.0 V, what is the maximum speed with whichan electron reaches the plate?
Applying Inquiry Skills
16. Using a spreadsheet program, create a data table like Table 1 which includesthe threshold frequency for each metal.
Answers
11. 5.8 � 1014 Hz
12 5.02 � 1014 Hz
13. 0.28 eV
14. 2.35 eV
15 6.3 � 105 m/s
Waves, Photons, and Matter 605NEL
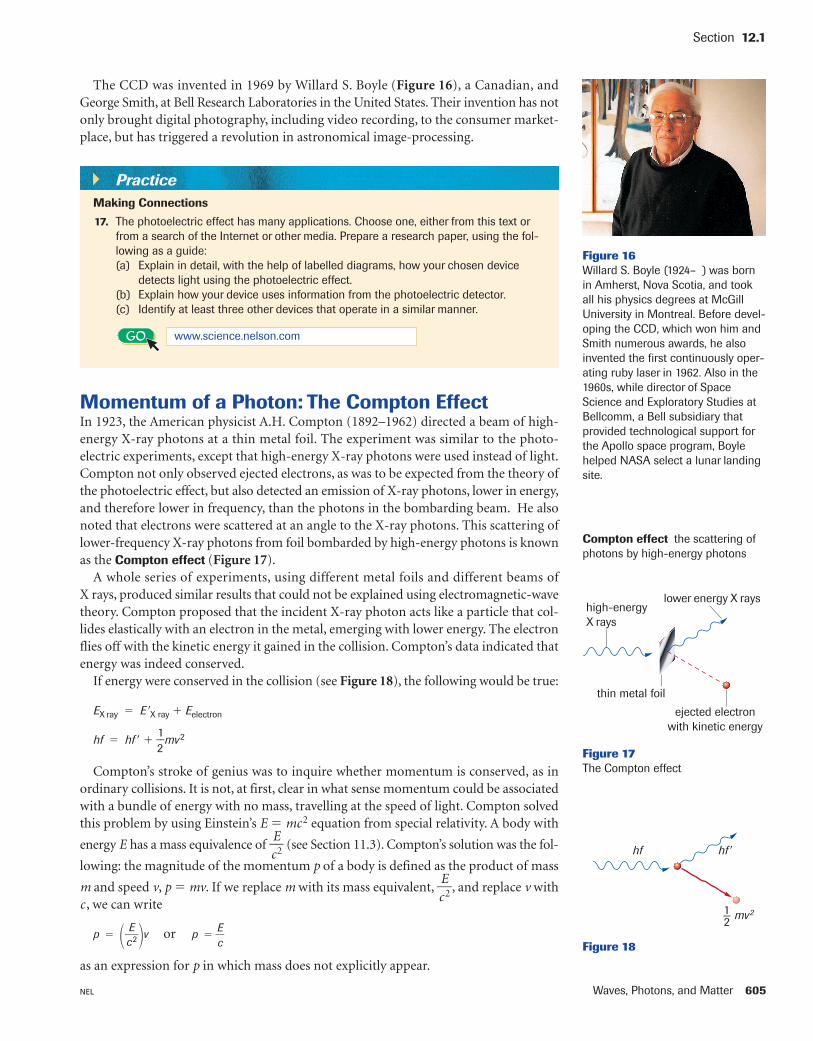
The CCD was invented in 1969 by Willard S. Boyle (Figure 16), a Canadian, andGeorge Smith, at Bell Research Laboratories in the United States. Their invention has notonly brought digital photography, including video recording, to the consumer market-place, but has triggered a revolution in astronomical image-processing.
Section 12.1
PracticeMaking Connections
17. The photoelectric effect has many applications. Choose one, either from this text orfrom a search of the Internet or other media. Prepare a research paper, using the fol-lowing as a guide:(a) Explain in detail, with the help of labelled diagrams, how your chosen device
detects light using the photoelectric effect.(b) Explain how your device uses information from the photoelectric detector.(c) Identify at least three other devices that operate in a similar manner.
GO www.science.nelson.com
Compton effect the scattering ofphotons by high-energy photons
thin metal foil
ejected electronwith kinetic energy
lower energy X rayshigh-energyX rays
Figure 17The Compton effect
hf �hf
12— mv2
Figure 18
Momentum of a Photon: The Compton EffectIn 1923, the American physicist A.H. Compton (1892–1962) directed a beam of high-energy X-ray photons at a thin metal foil. The experiment was similar to the photo-electric experiments, except that high-energy X-ray photons were used instead of light.Compton not only observed ejected electrons, as was to be expected from the theory ofthe photoelectric effect, but also detected an emission of X-ray photons, lower in energy,and therefore lower in frequency, than the photons in the bombarding beam. He alsonoted that electrons were scattered at an angle to the X-ray photons. This scattering oflower-frequency X-ray photons from foil bombarded by high-energy photons is knownas the Compton effect (Figure 17).
A whole series of experiments, using different metal foils and different beams ofX rays, produced similar results that could not be explained using electromagnetic-wavetheory. Compton proposed that the incident X-ray photon acts like a particle that col-lides elastically with an electron in the metal, emerging with lower energy. The electronflies off with the kinetic energy it gained in the collision. Compton’s data indicated thatenergy was indeed conserved.
If energy were conserved in the collision (see Figure 18), the following would be true:
EX ray � E �X ray � Eelectron
hf � hf � � �12
�mv2
Compton’s stroke of genius was to inquire whether momentum is conserved, as inordinary collisions. It is not, at first, clear in what sense momentum could be associatedwith a bundle of energy with no mass, travelling at the speed of light. Compton solvedthis problem by using Einstein’s E � mc2 equation from special relativity. A body with
energy E has a mass equivalence of �cE2� (see Section 11.3). Compton’s solution was the fol-
lowing: the magnitude of the momentum p of a body is defined as the product of mass
m and speed v, p � mv. If we replace m with its mass equivalent, �cE2�, and replace v with
c , we can write
p � ��cE2��v or p � �
Ec
�
as an expression for p in which mass does not explicitly appear.
Figure 16Willard S. Boyle (1924– ) was bornin Amherst, Nova Scotia, and tookall his physics degrees at McGillUniversity in Montreal. Before devel-oping the CCD, which won him andSmith numerous awards, he alsoinvented the first continuously oper-ating ruby laser in 1962. Also in the1960s, while director of SpaceScience and Exploratory Studies atBellcomm, a Bell subsidiary thatprovided technological support forthe Apollo space program, Boylehelped NASA select a lunar landingsite.
606 Chapter 12 NEL
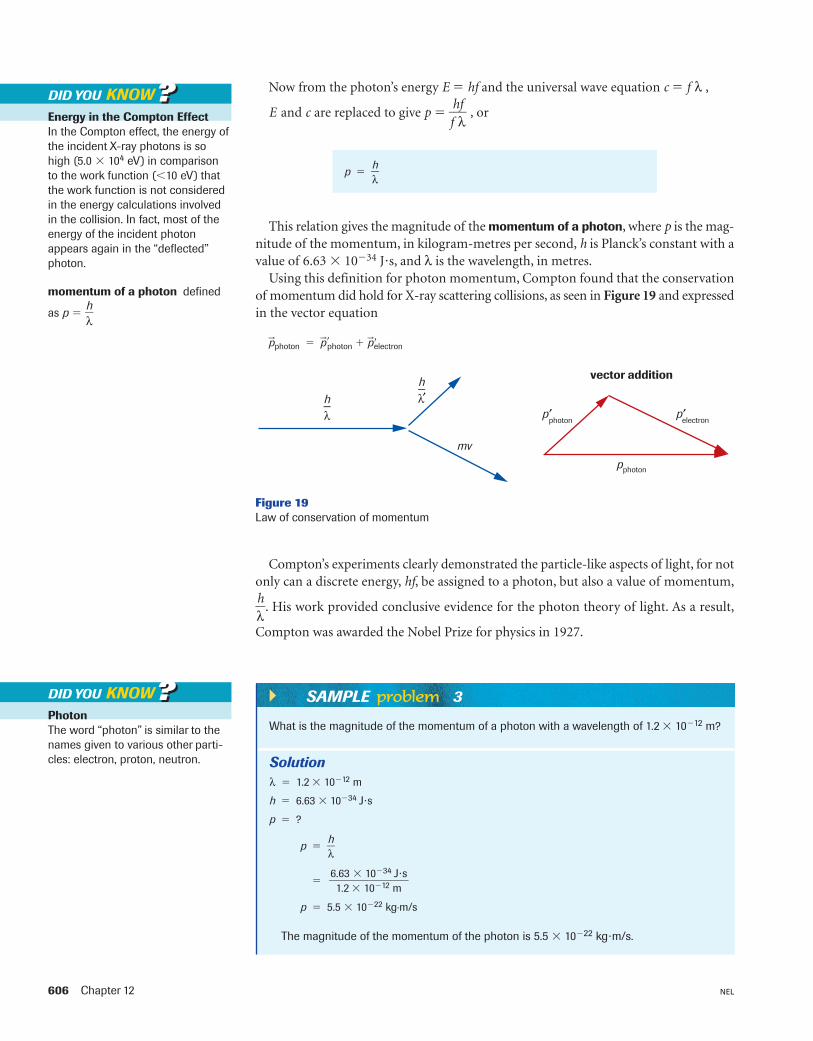
Now from the photon’s energy E � hf and the universal wave equation c � f λ ,
E and c are replaced to give p � �fhλf� , or
Photon The word “photon” is similar to thenames given to various other parti-cles: electron, proton, neutron.
DID YOU KNOW ??
Energy in the Compton EffectIn the Compton effect, the energy ofthe incident X-ray photons is sohigh (5.0 � 104 eV) in comparisonto the work function (10 eV) thatthe work function is not consideredin the energy calculations involvedin the collision. In fact, most of theenergy of the incident photonappears again in the “deflected”photon.
DID YOU KNOW ??
p � �λh
�
momentum of a photon defined
as p � �λh
�
What is the magnitude of the momentum of a photon with a wavelength of 1.2 � 10�12 m?
Solutionλ � 1.2 � 10�12 m
h � 6.63 � 10�34 J�s
p � ?
p � �λh
�
�
p � 5.5 � 10�22 kg·m/s
The magnitude of the momentum of the photon is 5.5 � 10�22 kg�m/s.
6.63 � 10�34 J�s��
1.2 � 10�12 m
SAMPLE problem 3
This relation gives the magnitude of the momentum of a photon, where p is the mag-nitude of the momentum, in kilogram-metres per second, h is Planck’s constant with avalue of 6.63 � 10�34 J�s, and λ is the wavelength, in metres.
Using this definition for photon momentum, Compton found that the conservationof momentum did hold for X-ray scattering collisions, as seen in Figure 19 and expressedin the vector equation
p��photon � p���photon � p���electron
Compton’s experiments clearly demonstrated the particle-like aspects of light, for notonly can a discrete energy, hf, be assigned to a photon, but also a value of momentum,
�λh
�. His work provided conclusive evidence for the photon theory of light. As a result,
Compton was awarded the Nobel Prize for physics in 1927.
h—λ
h—
mv
pphoton
vector addition
λ′p′
photonp′
electron
Figure 19Law of conservation of momentum
Waves, Photons, and Matter 607NEL
Interactions of Photons with MatterIf an intense beam of light is directed at the surface of an absorbing material, the energyof the photons is mostly absorbed by that surface. As a result, the surface heats up. Butthe Compton effect shows that photons transfer momentum as well. The sum of theimpacts on the surface of all of the photons per unit of time results in pressure on thesurface. This pressure is not normally discernible. (We do not feel the pressure of lightwhen we walk out into sunlight or stand under a strong lamp.) Today, however, using verysensitive equipment, we can actually measure the pressure of light on a surface and
confirm that the relationship p � �λh
� is a valid expression for the momentum of an indi-vidual photon.
We have seen, with both the photoelectric effect and the Compton effect, that whena photon comes into contact with matter, there is an interaction. Five main interactionsare possible:
1. The most common interaction is simple reflection, as when photons of visiblelight undergo perfectly elastic collisions with a mirror.
2. In the case of the photoelectric effect, a photon may liberate an electron, beingabsorbed in the process.
3. In the Compton effect, the photon emerges with less energy and momentum,having ejected a photoelectron. After its interaction with matter, the photon stilltravels at the speed of light but is less energetic, having a lower frequency.
4. A photon may interact with an individual atom, elevating an electron to ahigher energy level within the atom. In this case, the photon completely disap-pears. All of its energy is transferred to the atom, causing the atom to be in anenergized, or “excited,” state. (We will examine the details of this interactionlater in this chapter.)
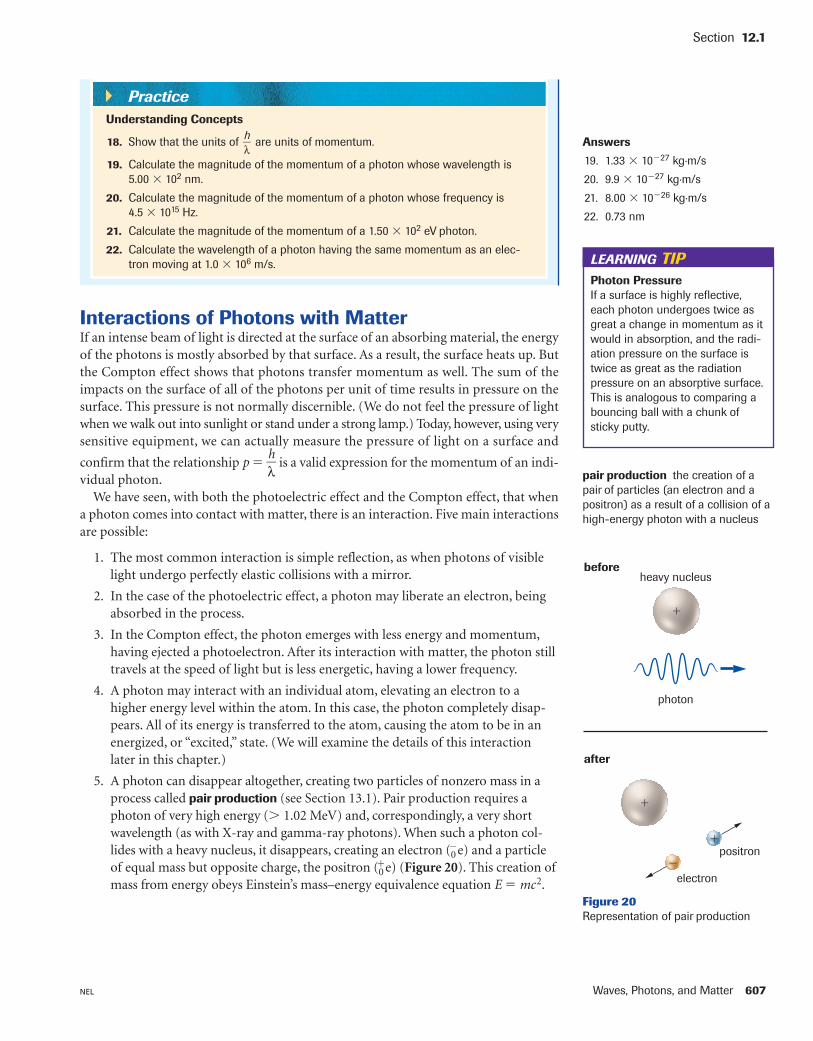
5. A photon can disappear altogether, creating two particles of nonzero mass in aprocess called pair production (see Section 13.1). Pair production requires aphoton of very high energy ( 1.02 MeV) and, correspondingly, a very shortwavelength (as with X-ray and gamma-ray photons). When such a photon col-lides with a heavy nucleus, it disappears, creating an electron (0
�e) and a particleof equal mass but opposite charge, the positron (0
�e) (Figure 20). This creation ofmass from energy obeys Einstein’s mass–energy equivalence equation E � mc2.
Section 12.1
Answers
19. 1.33 � 10�27 kg·m/s
20. 9.9 � 10�27 kg·m/s
21. 8.00 � 10�26 kg·m/s
22. 0.73 nm
Photon PressureIf a surface is highly reflective,each photon undergoes twice asgreat a change in momentum as itwould in absorption, and the radi-ation pressure on the surface istwice as great as the radiationpressure on an absorptive surface.This is analogous to comparing abouncing ball with a chunk ofsticky putty.
LEARNING TIP
pair production the creation of a pair of particles (an electron and apositron) as a result of a collision of ahigh-energy photon with a nucleus
�
�
photon
electron
positron
heavy nucleusbefore
after
�
�
Figure 20Representation of pair production
PracticeUnderstanding Concepts
18. Show that the units of �λh
� are units of momentum.
19. Calculate the magnitude of the momentum of a photon whose wavelength is5.00 � 102 nm.
20. Calculate the magnitude of the momentum of a photon whose frequency is4.5 � 1015 Hz.
21. Calculate the magnitude of the momentum of a 1.50 � 102 eV photon.
22. Calculate the wavelength of a photon having the same momentum as an elec-tron moving at 1.0 � 106 m/s.
608 Chapter 12 NEL
Section 12.1 QuestionsUnderstanding Concepts
1. List the historical discoveries and interpretations that led tothe confirmation of the photon theory of light.
2. Use Planck’s quantum theory to suggest a reason why nophotoelectrons are released from a surface until light ofsufficiently high frequency is incident on the surface.
3. List at least five devices in your home that operate usingthe photoelectric effect.
4. State which physical quantities are represented by thesymbols in the photoelectric equation EK � hf � W.
5. Compare and contrast the photoelectric effect and theCompton effect.
6. Describe five interactions between photons and matter.
7. The average temperature in the visible incandescent layersof the Sun is about 6000 K. An incandescent light has atemperature of 2500 K.(a) Why do artificial sources of light not provide proper
illumination when exposing a colour film designed tobe used in sunlight?
(b) Why does a xenon flash (operating at about 6000 K)provide proper illumination for the same daylight film?
8. Calculate the energy of an ultraviolet photon, of wavelength122 nm, in both joules and electron volts.
• A blackbody of a given temperature emits electromagnetic radiation over a con-tinuous spectrum of frequencies, with a definite intensity maximum at one par-ticular frequency. As the temperature increases, the intensity maximum shifts toprogressively higher frequencies.
• Planck proposed that molecules or atoms of a radiating blackbody are con-strained to vibrate at discrete energy levels, which he called quanta. The energy ofa single quantum is directly proportional to the frequency of the emitted radia-tion, according to the relationship E � hf, where h is Planck’s constant.
• Photoelectrons are ejected from a photoelectric surface when the incident light isabove a certain frequency f0, called the threshold frequency. The intensity(brightness) of the incoming light has no effect on the threshold frequency. Thethreshold frequency is different for different surfaces.
• The cutoff potential is the potential difference at which even the most energeticphotoelectrons are prevented from reaching the anode. For the same surface thecutoff potential is different for each frequency, and the higher the frequency ofthe light, the higher the cutoff potential.
• The energy of light is transmitted in bundles of energy called photons, whoseenergy has a discrete, fixed amount, determined by Planck’s equation, E � hf.
• When a photon hits a photoelectric surface, a surface electron absorbs its energy.Some of the absorbed energy releases the electron, and the remainder becomes itskinetic energy of the liberated electron, according to the photoelectric equationEK � hf � W.
• In the Compton effect, high-energy photons strike a surface, ejecting electronswith kinetic energy and lower-energy photons. Photons have momentum whose
magnitude is given by p � �λh
�.
• Interactions between photons and matter can be classified into reflection, thephotoelectric effect, the Compton effect, changes in electron energy levels withinatoms, and pair production.
Foundations of Quantum TheorySUMMARY
Waves, Photons, and Matter 609NEL
Section 12.1
9. The relationship E � �1.24
λ� 103�, where E is the energy of
a photon in electron volts and λ is its wavelength in nano-
metres, is a handy form of the equation E � �hλc�. The
relationship is quite useful in quantum-mechanics calcula-tions, since many measurements with subatomic particlesand photons involve electron volts and nanometres.
Substitute in E � �hλc�, and make any necessary unit
conversions, to show that E � �1.24
λ� 103� is valid for
nanometres and electron volts.
10. How does the pair of curves in Figure 8(b) show that themaximum speed of the photoelectrons is independent ofthe intensity of the light directed at the photoelectric surface?
11. Locate sodium and copper in Table 1. Does it take moreenergy to remove a photoelectron from sodium or fromcopper? Which has the higher threshold frequency, potas-sium or barium? Explain your answers.
12. Find the minimum frequency of the light required to ejectphotoelectrons from a metallic surface whose work func-tion is 7.2 � 10�19 J.
13. What wavelength of light is required for ejecting photoelec-trons from a tungsten surface (W � 4.52 eV) if the max-imum kinetic energy of the electrons is 1.68 eV?
14. When light of wavelength of 482 nm falls onto a certainmetallic surface, a retarding potential of 1.2 V proves justsufficient to make the current passing through the photo-tube fall to zero. Calculate the work function of the metal.
15. (a) Calculate the frequency of a photon whose wavelengthis 2.0 � 10�7 m.
(b) Calculate the energy of the same photon, in bothjoules and electron volts.
(c) Calculate the momentum of the same photon.
16. (a) Calculate the momentum of a photon of wavelength2.50 � 10�9 m.
(b) Calculate the speed of an electron having the samemomentum as the photon in (a). (me � 9.11 � 10�31 kg).
(c) Calculate the kinetic energy of the electron. How doesit compare with the energy of the photon?
17. Calculate, in electron volts, the energies of the photonsemitted by radio stations of frequencies 5.70 � 102 kHz and102 MHz.
Applying Inquiry Skills
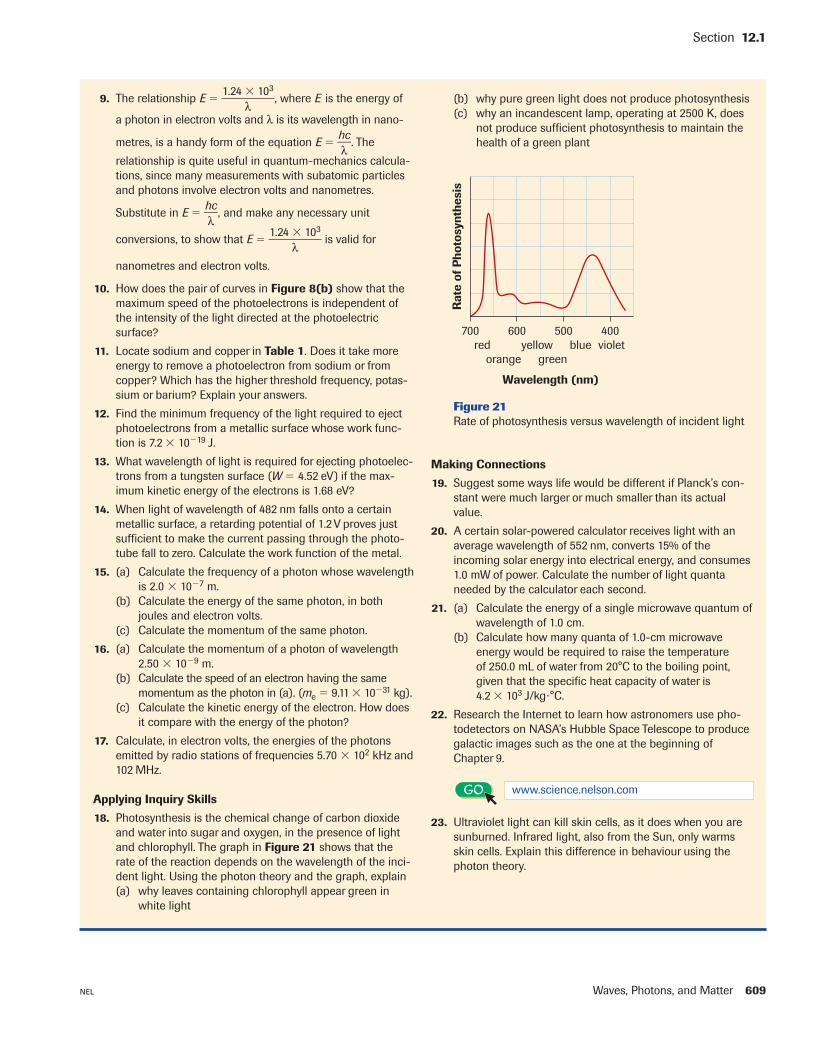
18. Photosynthesis is the chemical change of carbon dioxideand water into sugar and oxygen, in the presence of lightand chlorophyll. The graph in Figure 21 shows that therate of the reaction depends on the wavelength of the inci-dent light. Using the photon theory and the graph, explain (a) why leaves containing chlorophyll appear green in
white light
(b) why pure green light does not produce photosynthesis(c) why an incandescent lamp, operating at 2500 K, does
not produce sufficient photosynthesis to maintain thehealth of a green plant
Making Connections
19. Suggest some ways life would be different if Planck’s con-stant were much larger or much smaller than its actualvalue.
20. A certain solar-powered calculator receives light with anaverage wavelength of 552 nm, converts 15% of theincoming solar energy into electrical energy, and consumes1.0 mW of power. Calculate the number of light quantaneeded by the calculator each second.
21. (a) Calculate the energy of a single microwave quantum ofwavelength of 1.0 cm.
(b) Calculate how many quanta of 1.0-cm microwaveenergy would be required to raise the temperature of 250.0 mL of water from 20°C to the boiling point,given that the specific heat capacity of water is 4.2 � 103 J/kg�°C.
22. Research the Internet to learn how astronomers use pho-todetectors on NASA’s Hubble Space Telescope to producegalactic images such as the one at the beginning ofChapter 9.
23. Ultraviolet light can kill skin cells, as it does when you aresunburned. Infrared light, also from the Sun, only warmsskin cells. Explain this difference in behaviour using thephoton theory.
Rat
e of
Pho
tosy
nthe
sis
700 400500600red violetblueyellow
greenorange
Wavelength (nm)
Figure 21Rate of photosynthesis versus wavelength of incident light