14 Capital Budgeting CHAPTER LEARNING OBJECTIVES After completing this chapter, you should be able to answer the following questions: 1 Why do most capital budgeting methods focus on cash flows? 2 What is measured by the payback period? 3 How are the net present value and profitability index of a project measured? 4 How is the internal rate of return on a project computed? What does it measure? 5 How do taxation and depreciation methods affect cash flows? 6 What are the underlying assumptions and limitations of each capital project evaluation method? 7 How do managers rank investment projects? 8 How is risk considered in capital budgeting analysis? 9 How and why should management conduct a postinvestment audit of a capital project? 10 (Appendix 1) How are present values calculated? 11 (Appendix 2) What are the advantages and disadvantages of the accounting rate of return method?
Transcript
14
Capital Budgeting
CH
AP
TE
R
L E A R N I N G O B J E C T I V E S
After completing this chapter, you should be able to answer the following questions:
1
Why do most capital budgeting methods focus on cash flows?2
What is measured by the payback period?3
How are the net present value and profitability index of a project measured?4
How is the internal rate of return on a project computed? What does it measure?5
How do taxation and depreciation methods affect cash flows?6
What are the underlying assumptions and limitations of each capital project evaluation method?7
How do managers rank investment projects?8
How is risk considered in capital budgeting analysis?9
How and why should management conduct a postinvestment audit of a capital project?10
(Appendix 1) How are present values calculated?11
(Appendix 2) What are the advantages and disadvantages of the accounting rate of return method?
A m a z o n . c o mINTRODUCING
n a few short years, Amazon.com has evolved from anidea to the best-known firm on the Internet. The firm’s
president, Jeff Bezos, commands the attention of Wall Streetand the financial press. On the morning of September 28,1999, Amazon.com planned to make an “announcementsignificantly affecting the world of e-commerce.” The follow-ing day, Mr. Bezos stepped up to a podium in the SheratonHotel in New York.
“Sixteen months ago Amazon.com was a place whereyou could find books,” Bezos began, hands folded behindhis back as he paced the stage. “Tomorrow Amazon.comwill be a place where you can find anything.” With that, heintroduced the latest installment of the Amazon potboiler:the serialization story of one company’s ambitious plan totake over the world—the e-commerce world that is.
Throughout 1999, Amazon.com has been on the move.On average it has announced a major initiative every sixweeks. In February it bought 46% of Drugstore.com. InMarch it launched online auctions—two days after rivaleBay announced a secondary stock offering. In May thecompany took a 35% piece of HomeGrocer.com. In June,54% of Pets.com. In July, 49% of Gear.com. That same
month Amazon opened two new online shops: toys andelectronics. October’s announcement was Z-shops (an on-line mall) and All Product Search (a product browser).
Forget about Amazon.com as the Wal-Mart of theWeb. Bezos is aiming for something even bigger. So big,in fact, that it hasn’t been invented yet. “I get asked a lot,Are you trying to be the Wal-Mart of the Web?” says Bezos.“The truth is, we’re not trying to be the Anything of theWeb. We’re genetically pioneers. Everybody here wants todo something completely new. I wake up every morningtrying to make sure I can confound journalists and punditswho try to encapsulate us in an eight-second sound bite.”
In Bezos’ vision, Amazon.com will be the center ofthe e-commerce universe. Books, pet food, tennis shoes,banjos; whatever e-shoppers want, they can buy it, or locateit, on Amazon.com. Picture Amazon as an octopus, its ten-tacles reaching out all over the Web. The potential payoff ishuge. Investors certainly think so. After Amazon announcedZ-shops and All Product Search, its stock rose 23%, to $80a share. “This is so big, so important, that you have to beinvested in it,” says Morris Mark, a portfolio manager whoadded to his Amazon stake after the announcement.
Amazon.com’s future will be determined by the success of the investments it ismaking today. Although the risks may be large, the potential payoff is propor-tionate. Choosing the assets in which an organization will invest is one of the mostimportant business decisions of managers. In almost every organization, invest-ments must be made in some short-term working capital assets, such as merchan-dise inventory, supplies, and raw material. Organizations must also invest in cap-ital assets that are used to generate future revenues; cost savings; or distribution,service, or production capabilities. A capital asset can be a tangible fixed asset(such as a piece of machinery or a building) or an intangible asset (such as a cap-ital lease or a patent).
The acquisition of capital assets is often part of the solution to many of theissues discussed in this text. For example, the improvement of quality may dependon the acquisition of new technology and investment in training programs. Reengi-neering of business processes often involves investment in higher technology; andmergers and acquisitions involve decisions to invest in other companies. These ex-amples illustrate capital asset decisions.
Financial managers, assisted by cost accountants, are responsible for capitalbudgeting. Capital budgeting is “a process for evaluating proposed long-rangeprojects or courses of future activity for the purpose of allocating limited resources.”1
1 Institute of Management Accountants (formerly National Association of Accountants), Statements on Management Account-ing Number 2: Management Accounting Terminology (Montvale, N.J.: NAA, June 1, 1983), p. 14.
The process includes planning for and preparing the capital budget as well as re-viewing past investments to assess and enhance the effectiveness of the process.The capital budget presents planned annual expenditures for capital projects forthe near term (tomorrow to 5 years from now) and summary information for thelong term (6 to 10 years). The capital budget is a key instrument in implementingorganizational strategies.
Capital budgeting involves comparing and evaluating alternative projects withina budgetary framework. A variety of criteria are applied by managers and accoun-tants to evaluate the feasibility of alternative projects. Although financial criteria areused to assess virtually all projects, today more firms are also using nonfinancialcriteria. The nonfinancial criteria are critical to the assessment of activities that havefinancial benefits that are difficult to quantify. For example, high-technology invest-ments and investments in research and development (R&D) are often difficult toevaluate using only financial criteria. One firm in the biotechnology industry usesnine criteria to evaluate the feasibility of R&D projects. These criteria are presentedin Exhibit 14–1.
By evaluating potential capital projects using a portfolio of criteria, managers canbe confident that all possible costs and contributions of projects have been con-sidered. Additionally, the multiple criteria allow for a balanced evaluation of short-and long-term benefits, the fit with existing technology, and the roles of projectsin both marketing and cost management. For this biotechnology company, the useof multiple criteria ensures that projects will be considered from the perspectivesof strategy, marketing, cost management, quality, and technical feasibility.
Note that one of the criteria in Exhibit 14–1 is financial rate of return on in-vestment. Providing information about the financial returns of potential capitalprojects is one of the important tasks of cost accountants. This chapter discussesa variety of techniques that are used in businesses to evaluate the potential finan-cial costs and contributions of proposed capital projects. Several of these techniquesare based on an analysis of the amounts and timing of project cash flows.
Part 3 Planning and Controlling602
1. Potential for proprietary position.2. Balance between short-term and long-term projects and payoffs.3. Potential for collaborations and outside funding.4. Financial rate of return on investment.5. Need to establish competency in an area.6. Potential for spin-off projects.7. Strategic fit with the corporation’s planned and existing technology, manufacturing
capabilities, marketing and distribution systems.8. Impact on long-term corporate positioning.9. Probability of technical success.
SOURCE: Suresh Kalahnanam and Suzanne K. Schmidt, “Analyzing Capital Investments in New Products,” Manage-ment Accounting (January 1996), pp. 31–36. Reprinted from Management Accounting. Copyright by Institute of Man-agement Accountants, Montvale, N.J.
E X H I B I T 1 4 – 1
Project Evaluation Criteria—R&DProjects
USE OF CASH FLOWS IN CAPITAL BUDGETING
Capital budgeting investment decisions can be made using a variety of techniquesincluding payback period, net present value, profitability index, internal rate of re-turn, and accounting rate of return. All but the last of these methods focus on theamounts and timing of cash flows (receipts or disbursements of cash). Cash re-ceipts include the revenues from a capital project that have been earned and col-lected, savings generated by the project’s reductions in existing operating costs,and any cash inflow from selling the asset at the end of its useful life. Cash dis-
Why do most capital budgetingmethods focus on cash flows?
cash flow
1
bursements include asset acquisition expenditures, additional working capital in-vestments, and costs for project-related direct materials, direct labor, and overhead.
Any investment made by an organization is expected to earn some type of re-turn, such as interest, cash dividends, or operating income. Because interest anddividends are received in cash, accrual-based operating income must be convertedto a cash basis for comparison purposes. Remember that accrual accounting rec-ognizes revenues when earned, not when cash is received, and recognizes ex-penses when incurred regardless of whether a liability is created or cash is paid.Converting accounting income to cash flow information puts all investment returnson an equivalent basis.
Interest cost is a cash outflow associated with debt financing and is not partof the project selection process. The funding of projects is a financing, not an in-vestment, decision. A financing decision is a judgment regarding the method ofraising capital to fund an investment. Financing is based on the entity’s ability toissue and service debt and equity securities. On the other hand, an investmentdecision is a judgment about which assets to acquire to achieve an entity’s statedobjectives. Cash flows generated by the two types of decisions should not be com-bined. Company management must justify the acquisition and use of an asset priorto justifying the method of financing that asset.
Including receipts and disbursements caused by financing with other projectcash flows conceals a project’s true profitability because financing costs relate tothe total entity. The assignment of financing costs to a specific project is often ar-bitrary, which causes problems in comparing projects that are to be acquired withdifferent financing sources. In addition, including financing effects in an investmentdecision creates a problem in assigning responsibility. Investment decisions are typ-ically made by divisional managers, or by top management after receiving inputfrom divisional managers. Financing decisions are typically made by an organiza-tion’s treasurer in conjunction with top management.
Cash flows from a capital project are received and paid at different points intime over the project’s life. Some cash flows occur at the beginning of a period,some during the period, and some at the end. To simplify capital budgeting analy-sis, most analysts assume that all cash flows occur at a specific, single point intime—either at the beginning or end of the time period in which they actuallyoccur. The following example illustrates how cash flows are treated in capitalbudgeting situations.
Chapter 14 Capital Budgeting 603
financing decision
investment decision
CASH FLOWS ILLUSTRATED
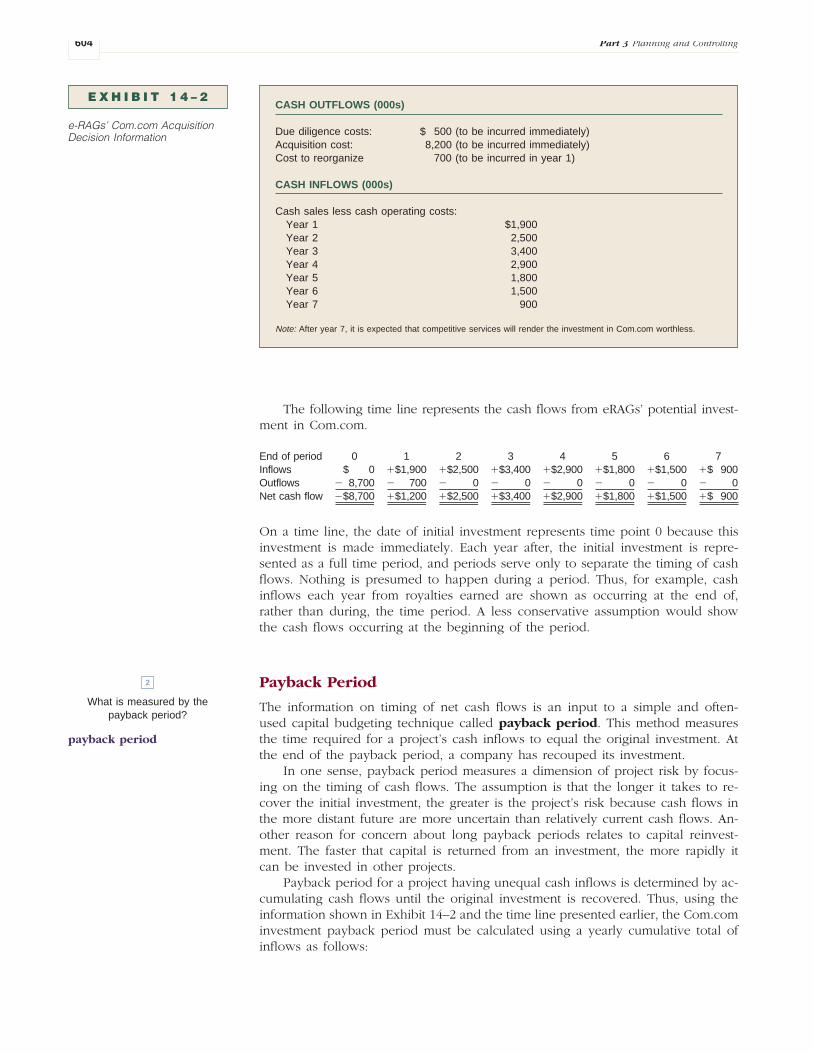
Assume that a variety of capital projects are being considered by eRAGs, a smallcompany selling electronic versions of books and magazines on the Internet. Oneinvestment being considered by eRAGs is the acquisition of an Internet company,Com.com, that markets electronic advertising to other firms selling Internet prod-ucts and services.
eRAGs’ expected acquisition costs and expected cash income and expenses as-sociated with the acquisition appear in Exhibit 14–2. This detailed information canbe simplified to a net cash flow for each year. For eRAGs, the project generates anet negative flow in the first year and net positive cash flows thereafter. This cashflow information for eRAGs can be illustrated through the use of a time line.
Time Lines
A time line visually illustrates the points in time when cash flows are expectedto be received or paid, making it a helpful tool for analyzing cash flows of a cap-ital investment proposal. Cash inflows are shown as positive amounts on a timeline and cash outflows are shown as negative amounts.
time line
The following time line represents the cash flows from eRAGs’ potential invest-ment in Com.com.
On a time line, the date of initial investment represents time point 0 because thisinvestment is made immediately. Each year after, the initial investment is repre-sented as a full time period, and periods serve only to separate the timing of cashflows. Nothing is presumed to happen during a period. Thus, for example, cashinflows each year from royalties earned are shown as occurring at the end of,rather than during, the time period. A less conservative assumption would showthe cash flows occurring at the beginning of the period.
Payback Period
The information on timing of net cash flows is an input to a simple and often-used capital budgeting technique called payback period. This method measuresthe time required for a project’s cash inflows to equal the original investment. Atthe end of the payback period, a company has recouped its investment.
In one sense, payback period measures a dimension of project risk by focus-ing on the timing of cash flows. The assumption is that the longer it takes to re-cover the initial investment, the greater is the project’s risk because cash flows inthe more distant future are more uncertain than relatively current cash flows. An-other reason for concern about long payback periods relates to capital reinvest-ment. The faster that capital is returned from an investment, the more rapidly itcan be invested in other projects.
Payback period for a project having unequal cash inflows is determined by ac-cumulating cash flows until the original investment is recovered. Thus, using theinformation shown in Exhibit 14–2 and the time line presented earlier, the Com.cominvestment payback period must be calculated using a yearly cumulative total ofinflows as follows:
Part 3 Planning and Controlling604
CASH OUTFLOWS (000s)
Due diligence costs: $ 500 (to be incurred immediately)Acquisition cost: 8,200 (to be incurred immediately)Cost to reorganize 700 (to be incurred in year 1)
At the end of the third year, all but $1,600 of the initial investment of $8,700has been recovered. The $2,900 inflow in the fourth year is assumed to occurevenly throughout the year. Therefore, it should take approximately 0.55 ($1,600� $2,900) of the fourth year to cover the rest of the original investment, givinga payback period for this project of 3.55 years (or slightly less than 3 years and7 months).
When the cash flows from a project are equal each period (an annuity), thepayback period is determined as follows:
Payback Period � Investment � Annuity
Assume for a moment that an investment being considered by eRAGs requiresan initial investment of $10,000 and is expected to generate equal annual cashflows of $4,000 in each of the next 5 years. In this case, the payback period wouldbe equal to the $10,000 net investment cost divided by $4,000 or 2.5 years (2 yearsand 6 months).
Company management typically sets a maximum acceptable payback periodas one of the financial evaluation criteria for capital projects. If eRAGs has set fouryears as the longest acceptable payback period, this project would be acceptableunder that criterion. As indicated in the accompanying News Note, companies havea bias of investing in projects with a quick payoff. The News Note also highlightsthe government’s role in funding longer term investments.
Chapter 14 Capital Budgeting 605
annuity
Dear Uncle Sam: Please Send Money
N E W S N O T EG E N E R A L B U S I N E S S
It may sound strange to hear a Silicon Valley executivecredit the birth of such industries as the Internet and lo-cal-area networks to the prescience of the U.S. govern-ment. But in many cases it is the government that hasprovided the seeds, and industry that has provided thewater and light, to cultivate the technological innovationsthat are improving the nation’s economy and quality oflife. Unfortunately, from 1987 to 1995, federal investmentin basic research sank by 2.6% per year. As a fractionof gross domestic product, the federal investment in re-search and development is about half of what it was 30years ago.
Meanwhile, the information technology sector alonehas more than doubled its annual R&D investment overthe last 10 years to a current level of $30 billion. In this
searing-hot competitive environment, however, most ofthese expenditures must be allocated to short-term prod-uct development. It isn’t feasible for the private sector toassume responsibility for long-term, high-risk researchwhen shareholders require solid quarterly returns on investment.
A newly released study by the Council on Competi-tiveness confirms these findings and highlights both thelong-term returns from, and the dangers of being com-placent about, the U.S. investment in R&D. For every dol-lar spent on basic research, we can expect a 50 centsper year increase in national output.
SOURCE: Adapted from Eric A. Benhamou, “R&D Needs Washington’s Support,”The Wall Street Journal (June 17, 1999), p. A26.
Most companies use payback period as only one way of financially judging aninvestment project. After being found acceptable in terms of payback period, aproject is subjected to evaluation by other financial capital budgeting techniques.A second evaluation is usually performed because the payback period method ig-nores three things: inflows occurring after the payback period has been reached,the company’s desired rate of return, and the time value of money. These issuesare incorporated into the decision process using discounted future cash flows.
Part 3 Planning and Controlling606
DISCOUNTING FUTURE CASH FLOWS
Money has a time value associated with it; this value is created because interest ispaid or received on money.2 For example, the receipt of $1 today has greater valuethan the same sum received one year from today because money held today canbe invested to generate a return that will cause it to accumulate to more than $1over time. This phenomenon encourages the use of discounted cash flow tech-niques in most capital budgeting situations to account for the time value of money.
Discounting future cash flows means reducing them to present value amountsby removing the portion of the future values representing interest. This “imputed”amount of interest is based on two considerations: the length of time until the cashflow is received or paid and the rate of interest assumed. After discounting, all fu-ture values associated with a project are stated in a common base of current dol-lars, also known as their present values. Cash receipts and disbursements occur-ring at the beginning of a project (time 0) are already stated in their present valuesand are not discounted.
Information on capital projects involves the use of estimates; therefore, havingthe best possible estimates of all cash flows (such as initial project investment) isextremely important. Care should be taken also to include all potential future in-flows and outflows. To appropriately discount cash flows, managers must estimatethe rate of return on capital required by the company in addition to the project’scost and cash flow estimates. This rate of return is called the discount rate and isused to determine the imputed interest portion of future cash receipts and expen-ditures. The discount rate should equal or exceed the company’s cost of capital(COC), which is the weighted average cost of the various sources of funds (debtand stock) that comprise a firm’s financial structure.3 For example, if a companyhas a COC of 10 percent, it costs an average of 10 percent of each capital dollarannually to finance investment projects. To determine whether a capital project isa worthwhile investment, this company should generally use a minimum rate of10 percent to discount its projects’ future cash flows.
A distinction must be made between cash flows representing a return of cap-ital and those representing a return on capital. A return of capital is the recoveryof the original investment or the return of principal, whereas a return on capitalis income and equals the discount rate multiplied by the investment amount. Forexample, $1 invested in a project that yields a 10 percent rate of return will growto a sum of $1.10 in one year. Of the $1.10, $1 represents the return of capitaland $0.10 represents the return on capital. The return on capital is computed foreach period of the investment life. For a company to be better off by making aninvestment, a project must produce cash inflows that exceed the investment madeand the cost of capital. To determine whether a project meets a company’s desiredrate of return, one of several discounted cash flow methods can be used.
2 The time value of money and present value computations are covered in Appendix 1 of this chapter. These concepts are es-sential to understanding the rest of this chapter; be certain they are clear before continuing.3 All examples in this chapter use an assumed discount rate or cost of capital. The computations required to find a company’scost of capital rate are discussed in any principles of finance text.
discounting
present value
discount rate
cost of capital
return of capitalreturn on capital
Chapter 14 Capital Budgeting 607
DISCOUNTED CASH FLOW METHODS
Three discounted cash flow techniques are the net present value method, the prof-itability index, and the internal rate of return. Each of these methods is definedand illustrated in the following subsections.
Net Present Value Method
The net present value method determines whether the rate of return on a proj-ect is equal to, higher than, or lower than the desired rate of return. Each cashflow from the project is discounted to its present value using the rate specified bythe company as the desired rate of return. The total present value of all cash out-flows of an investment project subtracted from the total present value of all cashinflows yields the net present value (NPV) of the project. Exhibit 14–3 presentsnet present value calculations, assuming the use of a 12 percent discount rate. Thecash flow data are taken from Exhibit 14–2.
The factors used to compute the net present value are obtained from the pres-ent value tables provided in Appendix A at the end of the text. Each period’s cashflow is multiplied by a factor obtained from Table 1 (PV of $1) for 12 percent andthe appropriate number of periods designated for the cash flow. Table 2 in Ap-pendix A is used to discount annuities rather than single cash flows and its use isdemonstrated in later problems.
The net present value of the Com.com investment is $815,000. The NPV rep-resents the net cash benefit or net cash cost to a company acquiring and using theproposed asset. If the NPV is zero, the actual rate of return on the project is equalto the required rate of return. If the NPV is positive, the actual rate is greater thanthe required rate. If the NPV is negative, the actual rate is less than the requiredrate of return. Note that the exact rate of return is not indicated under the NPVmethod, but its relationship to the desired rate can be determined. If all estimatesabout the investment are correct, the Com.com investment being considered byeRAGs will provide a rate of return greater than 12 percent.
Had eRAGs chosen any rate other than 12 percent and used that rate in con-junction with the same facts, a different net present value would have resulted. Forexample, if eRAGs set 15 percent as the discount rate, a NPV of $8,000 would haveresulted for the project (see Exhibit 14–4). Net present values at other selected dis-count rates are given in Exhibit 14–4. The computations for these values are madein a manner similar to those at 12 and 15 percent. (To indicate your understandingof the NPV method, you may want to prove these computations.)
How are the net present valueand profitability index of a
project measured?
net present value method
net present value
3
DISCOUNT RATE � 12%
a � b � cCash Flow Time Amount Discount Factor Present Value
Initial investment t0 $(8,700) 1.0000 $(8,700)Year 1 net cash flow t1 1,200 0.8929 1,071Year 2 net cash flow t2 2,500 0.7972 1,993Year 3 net cash flow t3 3,400 0.7118 2,420Year 4 net cash flow t4 2,900 0.6355 1,843Year 5 net cash flow t5 1,800 0.5674 1,021Year 6 net cash flow t6 1,500 0.5066 760Year 7 net cash flow t7 900 0.4524 407
Net Present Value $ 815
E X H I B I T 1 4 – 3
Net Present Value Calculationfor Com.com Investment
The table in Exhibit 14–4 indicates that the NPV is not a single, unique amount,but is a function of several factors. First, changing the discount rate while holdingthe amounts and timing of cash flows constant affects the NPV. Increasing the dis-count rate causes the NPV to decrease; decreasing the discount rate causes NPV toincrease. Second, changes in estimated amounts and/or timing of cash inflows andoutflows affect the net present value of a project. Effects of cash flow changes onthe NPV depend on the changes themselves. For example, decreasing the estimateof cash outflows causes NPV to increase; reducing the stream of cash inflows causesNPV to decrease. When amounts and timing of cash flows change in conjunctionwith one another, the effects of the changes are determinable only by calculation.
The net present value method, although not providing the actual rate of returnon a project, provides information on how that rate compares with the desiredrate. This information allows managers to eliminate from consideration any projectproducing a negative NPV because it would have an unacceptable rate of return.The NPV method can also be used to select the best project when choosing amonginvestments that can perform the same task or achieve the same objective.
The net present value method should not, however, be used to compare in-dependent projects requiring different levels of initial investment. Such a compar-ison favors projects having higher net present values over those with lower netpresent values without regard to the capital invested in the project. As a simpleexample of this fact, assume that eRAGs could spend $200,000 on Investment Aor $40,000 on Investment B. Investment A’s and B’s net present values are $4,000and $2,000, respectively. If only NPVs were compared, the company would concludethat Investment A was a “better” investment because it has a larger NPV. However,Investment A provides an NPV of only 2 percent ($4,000 � $200,000) on the in-vestment, whereas Investment B provides a 5 percent ($2,000 � $40,000) NPV.Logically, organizations should invest in projects that produce the highest return perinvestment dollar. Comparisons of projects requiring different levels of investmentare made using a variation of the NPV method known as the profitability index.
Profitability Index
The profitability index (PI) is a ratio comparing the present value of a project’snet cash inflows to the project’s net investment. The PI is calculated as
PI � Present Value of Net Cash Flows � Net Investment
Part 3 Planning and Controlling608
DISCOUNT RATE � 15%
a � b � cCash Flow Time Amount Discount Factor Present Value
Initial investment t0 $(8,700) 1.0000 $(8,700)Year 1 net cash flow t1 1,200 0.8696 1,044Year 2 net cash flow t2 2,500 0.7561 1,890Year 3 net cash flow t3 3,400 0.6575 2,235Year 4 net cash flow t4 2,900 0.5718 1,658Year 5 net cash flow t5 1,800 0.4972 895Year 6 net cash flow t6 1,500 0.4323 648Year 7 net cash flow t7 900 0.3759 338
Net Present Value $ 8
Net present value with 5% discount rate: $3,202Net present value with 10% discount rate: $1,419Net present value with 20% discount rate: $(1,121)
E X H I B I T 1 4 – 4
Net Present Value Calculationfor Com.com Investment
profitability index
The present value of net cash flows equals the PV of future cash inflows minusthe PV of future cash outflows. The PV of net cash inflows represents an outputmeasure of the project’s worth, whereas the net investment represents an inputmeasure of the project’s cost. By relating these two measures, the profitability in-dex gauges the efficiency of the firm’s use of capital. The higher the index, themore efficient is the capital investment.
The following information illustrates the calculation and use of a profitabilityindex. eRAGs is considering two investments: a training program for employeescosting $720,000 and a series of Internet servers costing $425,000. Corporate man-agers have computed the present values of the investments by discounting all fu-ture expected cash flows at a rate of 12 percent. Present values of the expectednet cash inflows are $900,000 for the training program and $580,000 for the servers.Dividing the PV of the net cash inflows by initial cost gives the profitability indexfor each investment. Subtracting asset cost from the present value of the net cashinflows provides the NPV. Results of these computations are shown below.
PV of ProfitabilityInflows Cost Index NPV
Training program $900,000 $720,000 1.25 $180,000Server package 580,000 425,000 1.36 155,000
Although the training program’s net present value is higher, the profitability indexindicates that the server package is a more efficient use of corporate capital.4 Thehigher PI reflects a higher rate of return on the server package than on the train-ing program. The higher a project’s PI, the more profitable is that project per in-vestment dollar.
If a capital project investment is made to provide a return on capital, the prof-itability index should be equal to or greater than 1.00, the equivalent of an NPVequal to or greater than 0. Like the net present value method, the profitability in-dex does not indicate the project’s expected rate of return. However, another dis-counted cash flow method, the internal rate of return, provides the expected rateof return to be earned on an investment.
Internal Rate of Return
A project’s internal rate of return (IRR) is the discount rate that causes the pres-ent value of the net cash inflows to equal the present value of the net cash out-flows. It is the project’s expected rate of return. If the IRR is used to determinethe NPV of a project, the NPV is zero. By examining Exhibits 14–3 and 14–4, it isapparent that eRAGs investment in Com.com would generate an IRR very close to 15percent because a discount rate of 15 percent resulted in an NPV very close to $0.
The following formula can be used to determine net present value:
NPV � �Investment � PV of Cash Inflows � PV of Cash Outflows otherthan the investment
Capital project information should include the amounts of the investment, cash in-flows, and cash outflows. Thus, the only missing data in the preceding formula arethe present value factors. These factors can be calculated and then be found inthe present value tables. The interest rate with which the factors are associated is
Chapter 14 Capital Budgeting 609
4 Two conditions must exist for the profitability index to provide better information than the net present value method. First,the decision to accept one project must require that the other project be rejected. The second condition is that availability offunds for capital acquisitions is limited.
How is the internal rate of returnon a project computed? What
does it measure?
internal rate of return
4
the internal rate of return. The internal rate of return is most easily computed forprojects having equal annual net cash flows. When an annuity exists, the NPV for-mula can be restated as follows:
The investment and annual cash flow amounts are known from the expected dataand net present value is known to be zero at the IRR. The IRR and its presentvalue factor are unknown. To determine the internal rate of return, substitute knownamounts into the formula, rearrange terms, and solve for the unknown (the PVfactor):
NPV � �Net Investment � (Annuity � PV Factor)
0 � �Net Investment � (Annuity � PV Factor)
Net Investment � (Annuity � PV Factor)
Net Investment � Annuity � PV Factor
The solution yields a present value factor for the number of annuity periods cor-responding to the project’s life at an interest rate equal to the internal rate of re-turn. Finding this factor in the PV of an annuity table and reading the interest rateat the top of the column in which the factor is found provides the internal rate ofreturn.
To illustrate an IRR computation for a project with a simple annuity, informa-tion in Exhibit 14–5 pertaining to eRAGs’ potential investment in a quality controlsystem is used. The quality control system would be installed immediately andwould generate cost savings over the five-year life of the system. The system hasno expected salvage value.
The NPV equation is solved for the present value factor.
NPV � �Net Investment � (Annuity � PV Factor)
$0 � �$99,560 � ($29,000 � PV Factor)
$99,560 � ($29,000 � PV Factor)
$99,560 � $29,000 � PV Factor
3.43 � PV Factor
The PV of an ordinary annuity table (Table 2, Appendix A) is examined tofind the internal rate of return. A present value factor is a function of time and thediscount rate. In the table, find the row representing the project’s life (in this case,five periods). Look across the table in that row for the PV factor found upon solv-ing the equation. In row 5, a factor of 3.4331 appears under the column headed 14percent. Thus, the internal rate of return for this machine is very near 14 percent.Using interpolation, a computer program, or a programmable calculator the exact
Part 3 Planning and Controlling610
Cash Flow
Cost of software and hardware (t0) �$85,000Installation cost (t0) � 14,560Operating savings (t1–t5) � 29,000
E X H I B I T 1 4 – 5
Information Pertaining to QualityControl System
IRR can be found.5 A computer program indicates the IRR of the quality controlsystem is 13.9997 percent.
Exhibit 14–6 plots the net present values that result from discounting the qual-ity control system cash flows at various rates of return. For example, the NPV at4 percent is $28,407 and the NPV at 15 percent is �$2,041. (These computationsare not provided here, but can be performed by discounting the $29,000 annualcash flows and subtracting $99,560 of investment cost.)
The internal rate of return is located on the graph’s horizontal axis at the pointwhere the NPV equals zero (13.9997 percent). Note that the graph reflects an in-verse relationship between rates of return and NPVs. Higher rates yield lower pres-ent values because, at the higher rates, fewer dollars need to be currently investedto obtain the same future value.
Manually finding the IRR of a project that produces unequal annual cash flowsis more complex and requires an iterative trial-and-error process. An initial esti-mate is made of a rate believed to be close to the IRR and the NPV is computed.If the resulting NPV is negative, a lower rate is estimated (because of the inverserelationship mentioned above) and the NPV is computed again. If the NPV is pos-itive, a higher rate is tried. This process is continued until the net present valueequals zero, at which time the internal rate of return has been found.
The project’s internal rate of return is then compared with management’spreestablished hurdle rate, which is the rate of return specified as the lowest ac-ceptable return on investment. Like the discount rate mentioned earlier, this rateshould generally be at least equal to the cost of capital. In fact, the hurdle rate iscommonly the discount rate used in computing net present value amounts. If aproject’s IRR is equal to or greater than the hurdle rate, the project is consideredviable from a financial perspective. As indicated in the following passage, hurdlerates are no longer simply an American concept.
Faced with higher capital costs, Japanese managers are beginning to embracesuch previously little-known Western concepts as “hurdle rates” and “required ratesof return.” That’s a big switch for executives who once concerned themselves onlywith market share. Said Tsunehiko Ishibashi, general manager of finance forMitsubishi Kasei, a major petrochemical company: “As a result of the higher costof capital, the profitability standards for new investments must be raised.” 6
Chapter 14 Capital Budgeting 611
5 Interpolation is the process of finding a term between two other terms in a series.6 John J. Curran, “Japan Tries to Cool Money Mania,” Fortune (January 28, 1991), p. 66.
E X H I B I T 1 4 – 6
NPV by Various Discount Rates
NP
V
Interest Rate Percentage
�$10,000
$0
$10,000
$20,000
$30,000
$40,000
$50,000
1 2 3 4 5 6 7 8 9 10 11 12 13 14 15 16
hurdle rate
The higher the internal rate of return, the more financially attractive is the in-vestment proposal. In choosing among alternative investments, however, managerscannot look solely at the internal rates of return on projects. The rates do not re-flect the dollars involved. An investor would normally rather have a 10 percent re-turn on $1,000 than a 100 percent return on $10!
Using the internal rate of return has three drawbacks. First, when uneven cashflows exist, the iterative process is inconvenient. Second, unless present value ta-bles are available that provide factors for fractional interest rates, finding the pre-cise IRR on a project is difficult. These two problems can be eliminated with theuse of a computer or a programmable calculator. The last problem is that it is pos-sible to find several rates of return that will make the net present value of the cashflows equal zero. This phenomenon usually occurs when there are net cash inflowsin some years and net cash outflows in other years of the investment project’s life(other than time 0).
In performing discounted cash flow analyses, accrual-based accounting informa-tion sometimes needs to be converted to cash flow data. One accrual that deservesspecial attention is depreciation. Although depreciation is not a cash flow item, it hascash flow implications because of its deductibility for income tax purposes.
Part 3 Planning and Controlling612
The internal rate of return on aninvestment must clear the com-pany’s designated hurdle rate.That hurdle rate will be raised asthe company’s cost of debt andequity capital increases.
THE EFFECT OF DEPRECIATION ON AFTER-TAX CASH FLOWS
Income taxes are an integral part of the business environment and decision-makingprocess in our society. Tax planning is a central part of management planning andhas a large impact on overall business profitability. Managers typically make deci-sions only after examining how company taxes will be affected by those decisions.In evaluating capital projects, managers should use after-tax cash flows to determineproject acceptability.
Note that depreciation expense is not a cash flow item. Although no funds arepaid or received for it, depreciation on capital assets, similar to interest on debt,affects cash flows by reducing a company’s tax obligation. Thus, depreciation pro-vides a tax shield against the payment of taxes. The tax shield produces a taxbenefit equal to the amount of taxes saved (the depreciation amount multipliedby the tax rate). The concepts of tax shield and tax benefit are shown on the fol-lowing income statements. The tax rate is assumed to be 40 percent.
How do taxation anddepreciation methods affect
cash flows?
tax shieldtax benefit
5
No Depreciation Deduction Depreciation DeductionIncome Statement Income Statement
Sales $250,000 Sales $250,000Cost of goods sold (175,000) Cost of goods sold (175,000)Gross margin $ 75,000 Gross margin $ 75,000Expenses other than Expenses other than
depreciation (37,500) depreciation (37,500)Depreciation expense 0 Depreciation expense (37,500)Income before taxes $ 37,500 Income before tax $ 0Tax expense (40%) (15,000) Tax expense (40%) 0Net income $ 22,500 Net income $ 0
The tax shield is the depreciation expense amount of $37,500. The tax benefit is thedifference between $15,000 of tax expense on the first income statement and $0 oftax expense on the second income statement. The tax benefit is also equal to the40 percent tax rate multiplied by the depreciation tax shield of $37,500, or $15,000.Because taxes are reduced by $15,000, the pattern of cash flows is improved.
It is the depreciation for purposes of computing income taxes rather than theamount used for financial accounting purposes that is relevant in discounted cashflow analysis. Income tax laws regarding depreciation deductions are subject to re-vision. In making their analyses of capital investments, managers should use themost current tax regulations for depreciation. Different depreciation methods mayhave significant impacts on after-tax cash flows. For a continuously profitable busi-ness, an accelerated method of depreciation, such as the modified accelerated costrecovery system (MACRS), allowed for U.S. tax computations, will produce highertax benefits in the early years of asset life than will the straight-line method. Thesehigher tax benefits will translate into a higher net present value over the life ofthe investment project.
Changes in the availability of depreciation methods or in the length of an asset’sdepreciable life may dramatically affect projected after-tax cash flows and also affectthe net present value, profitability index, and internal rate of return expected fromthe capital investment. Because capital projects are analyzed and evaluated beforeinvestments are made, managers should be aware of the inherent risk of tax lawchanges. Original assumptions made about the depreciation method or asset lifemay not be valid by the time an investment is actually made and an asset is placedinto service. However, once purchased and placed into service, an asset can gen-erally be depreciated using the method and tax life allowed when the asset wasplaced into service regardless of the tax law changes occurring after that time.
Changes may also occur in the tax rate structure. Rate changes may be relativelyunpredictable. For example, the maximum federal corporate tax rate for many yearswas 46 percent; the Tax Reform Act of 1986 lowered this rate to 34 percent, andthe present top marginal U.S. tax rate is 35 percent.7 A tax rate reduction lowers thetax benefit provided by depreciation because the impact on cash flow is lessened.Tax law changes (such as asset tax-life changes) can cause the expected outcomesof the capital investment analysis to vary from the project’s actual outcomes.8
To illustrate such variations, assume that eRAGs is considering investing in anew Internet site. The site will require an investment of $540,000 in computer hard-ware and software. Assume these assets have a 10-year economic life and wouldproduce expected net annual cash income of $110,000. Assume the company’s after-tax cost of capital is 11 percent. Further assume that corporate assets are depreciatedon a straight-line basis for tax purposes.9
Chapter 14 Capital Budgeting 613
7 Surtaxes that apply to corporations may drive the top marginal rate above 35 percent for certain income brackets.8 Additionally, managers should be careful to consider effects of both applicable foreign and state tax laws.9 To simplify the presentation, the authors have elected to ignore a tax rule requirement called the half-year (or mid-quarter)convention that applies to personal assets and a mid-month convention that applies to most real estate improvements. Under taxlaw, only a partial year’s depreciation may be taken in the year an asset is placed into service. The slight difference that such atax limitation would make on the amounts presented is immaterial for purposes of illustrating these capital budgeting concepts.
In late 2000, prior to making the Internet site investment, eRAGs’ cost ac-countant, Jill Flowers, calculated the project’s net present value. The results of hercalculations are shown in Exhibit 14–7 under Situation A. Note that depreciationis added to income after tax to obtain the amount of after-tax cash flow. Eventhough depreciation is deductible for tax purposes, it is still a noncash expense.The present value amounts are obtained by multiplying the after-tax cash flows bythe appropriate PV of an annuity factor from Table 2 in Appendix A at the end ofthe text.
The NPV evaluation technique indicated the acceptability of the capital in-vestment. At the time of Ms. Flowers’ analysis, eRAGs’ tax rate was 30 percent andthe tax laws allowed a 10-year depreciable life on this property.
Part 3 Planning and Controlling614
ASSUMED FACTS
Initial investment $540,000Expected annual before-tax cash flows 110,000Straight-line depreciation (10 years) 54,000Expected economic life 10 years
Situation A: Tax rate of 30% (actual rate in effect)Situation B: Tax rate of 25%Situation C: Tax rate of 40%
Because Ms. Flowers was concerned about proposed changes in the U.S. taxrate, she also analyzed the project assuming that tax rates changed. Exhibit 14–7shows the different after-tax cash flows and net present values that result if thesame project is subjected to either a 25 percent (Situation B) or 40 percent (Situ-ation C) tax rate.
This example demonstrates the expected NPV change when a different tax rateis used. If the tax rate changes to either 25 or 40 percent, the NPV changes. A de-crease in the tax rate makes the Internet site a more acceptable investment, basedon its net present value, and an increase in the tax rate has the opposite effect.
Understanding how depreciation and taxes affect the various capital budget-ing techniques will allow managers to make the most informed decisions aboutcapital investments.10 Well-informed managers are more likely to have confidencein capital investments made by the company if they can justify the substantial re-source commitment required. That justification is partially achieved by consideringwhether a capital project fits into strategic plans. To be confident of their conclu-sions, managers must also comprehend the assumptions and limitations of eachcapital budgeting method.
Chapter 14 Capital Budgeting 615
10 These examples have all considered the investment project as a purchase. If a leasing option exists, the classification of thelease as operating or capital will affect the amounts deductible for tax purposes. A good illustration of this is provided in “TheLease vs. Purchase Decision,” by Ralph L. Benke, Jr., and Charles P. Baril in Management Accounting (March 1990), pp. 42–46.
ASSUMPTIONS AND LIMITATIONS OF METHODS
As summarized in Exhibit 14–8, each financial capital budget evaluation methodhas its own underlying assumptions and limitations. To maximize benefits of thecapital budgeting process, managers should understand the similarities and differ-ences of the various methods and use several techniques to evaluate a project.
All of the methods have two similar limitations. First, except to the extent thatpayback indicates the promptness of the investment recovery, none of the meth-ods provides a mechanism to include management preferences with regard to thetiming of cash flows. This limitation can be partially overcome by discounting cashflows occurring further in the future at higher rates than those in earlier years, as-suming that early cash flows are preferred. Second, all the methods use single, de-terministic measures of cash flow amounts rather than probabilities. This limitationcan be minimized through the use of probability estimates of cash flows. Such es-timates can be input into a computer program to determine a distribution of an-swers for each method under various conditions of uncertainty.
What are the underlyingassumptions and limitations ofeach capital project evaluation
method?
6
THE INVESTMENT DECISION
Management must identify the best asset(s) for the firm to acquire to fulfill thecompany’s goals and objectives. Making such an identification requires answers tothe following four subhead questions.
Is the Activity Worthy of an Investment?
A company acquires assets when they have value in relation to specific activitiesin which the company is engaged. For example, Amazon.com invests heavily inproduct and service development because that is the primary path to new rev-enues (the activity). Before making decisions to acquire assets, company manage-ment must be certain that the activity for which the assets will be needed is wor-thy of an investment.
An activity’s worth is measured by cost-benefit analysis. For most capital bud-geting decisions, costs and benefits can be measured in monetary terms. If the dol-lars of benefits exceed the dollars of costs, then the activity is potentially worth-while. In some cases, though, benefits provided by capital projects are difficult toquantify. However, difficulty in quantification is no reason to exclude benefits fromcapital budgeting analyses. In most instances, surrogate quantifiable measures canbe obtained for qualitative benefits. For example, benefits from investments in daycare centers for employees’ children may be estimable based on the reduction inemployee time off and turnover. At a minimum, managers should attempt to sub-jectively include such benefits in the analytical process.
In other circumstances, management may know in advance that the monetarybenefits of the capital project will not exceed the costs, but the project is essentialfor other reasons. For example, a company may consider renovating the employeeworkplace with new carpet, furniture, paint, and artwork. The renovation would
Part 3 Planning and Controlling616
ASSUMPTIONS LIMITATIONS
Payback Method
� Speed of investment recovery is the key consideration.� Timing and size of cash flows are accurately predicted.� Risk (uncertainty) is lower for a shorter payback project.
� Cash flows after payback are ignored.� Cash flows and project life in basic method are treated as
deterministic without explicit consideration of probabilities.� Time value of money is ignored.� Cash flow pattern preferences are not explicitly recognized.
Net Present Value
� Discount rate used is valid.� Timing and size of cash flows are accurately predicted.� Life of project is accurately predicted.� If the shorter lived of two projects is selected, the proceeds
of that project will continue to earn the discount rate ofreturn through the theoretical completion of the longer livedproject.
� Cash flows and project life in basic method are treated asdeterministic without explicit consideration of probabilities.
� Alternative project rates of return are not known.� Cash flow pattern preferences are not explicitly recognized.� IRR on project is not reflected.
Profitability Index
� Same as NPV.� Size of PV of net inflows relative to size of present value of
investment measures efficient use of capital.
� Same as NPV.� A relative answer is given but dollars of NPV are not
reflected.
Internal Rate of Return
� Hurdle rate used is valid.� Timing and size of cash flows are accurately predicted.� Life of project is accurately predicted.� If the shorter lived of two projects is selected, the proceeds
of that project will continue to earn the IRR through thetheoretical completion of the longer lived project.
� The IRR rather than dollar size is used to rank projects forfunding.
� Dollars of NPV are not reflected.� Cash flows and project life in basic method are treated as
deterministic without explicit consideration of probabilities.� Cash flow pattern preferences are not explicitly recognized.� Multiple rates of return can be calculated on the same
project.
E X H I B I T 1 4 – 8
Assumptions and Limitations ofCapital Budgeting Methods
Accounting Rate of Return
(Presented in Appendix 2 of this chapter)
� Effect on company accounting earnings relative to averageinvestment is key consideration.
� Size and timing of increase in company earnings,investment cost, project life, and salvage value can beaccurately predicted.
� Cash flows are not considered.� Time value of money is not considered.� Earnings, investment, and project life are treated as
deterministic without explicit consideration of probabilities.
not make employee work any easier or safer, but would make it more comfort-able. Such a project may be deemed “worthy” regardless of the results of a cost-benefit analysis. Companies may also invest in unprofitable products to maintainmarket share of a product group, and, therefore, protect the market position ofprofitable products. One of the most difficult investments to evaluate is technol-ogy, which is addressed in the accompanying News Note.
Which Assets Can Be Used for the Activity?
The determination of available and suitable assets to conduct the intended activ-ity is closely related to the evaluation of the activity’s worth. Management musthave an idea of how much the needed assets will cost to determine whether theactivity should be pursued. As shown in Exhibit 14–9, management should gatherthe following specific monetary and nonmonetary information for each asset tomake this determination: initial cost, estimated life and salvage value, raw mate-rial and labor requirements, operating costs (both fixed and variable), output ca-pability, service availability and costs, maintenance expectations, and revenues tobe generated (if any). As mentioned in the previous section, information used ina capital project analysis may include surrogate, indirect measures. Managementmust have both quantitative and qualitative information on each asset and recog-nize that some projects are simply more crucial to the firm’s future than others.This point is illustrated in the News Note below.
Of the Available Assets for Each Activity, Which Is the Best Investment?
Using all available information, management should select the best asset from thecandidates and exclude all others from consideration. In most instances, a com-pany has a standing committee to discuss, evaluate, and approve capital projects. Injudging capital project acceptability, this committee should recognize that two typesof capital budgeting decisions must be made: screening and preference decisions.
Chapter 14 Capital Budgeting 617
Technology: What’s It Worth?
N E W S N O T EG E N E R A L B U S I N E S S
Remember the promises of expert systems, the paper-less office, and other hype that technology created? Istechnology all sizzle and no substance, or can technologyre-gain its credibility? One of the ways of re-establishingconfidence is by managing technology investments andby having realistic measurements that are meaningful toyour business.
Evaluating the benefits of technology is not easy for tworeasons. We know that information itself is useless unlessit assists in making better decisions that could not havebeen made without the use of that information. What makesinvestment in technology difficult to measure is that havingall the information available before making a decision guar-antees only information overload, not the right decision. Aswell, the value of technology depends on what the busi-ness goals are that it is supporting, and to what degreetechnology is instrumental in achieving these goals.
You can’t measure the value of information by exam-ining the size of the disk storage, the number of PCs inthe organization, the boxes of reports printed, or on-linequeries processed, because none of these items is valu-able until they are used in the business. More moneyspent on technology does not guarantee more value tothe business: it is how technology is used that matters,not how much it costs. Expensive technology that onlyautomates the existing manual processes will not addvalue to the business unless it provides additional ben-efits that do not exist in the manual environment.
SOURCE: Reprinted from an article, “Managing Technology Investments,” appear-ing in CMA Management Magazine (formerly CMA Magazine) by Catherine A.Bovie, July/August 1998 (pp. 15–18), with permission of CMA Canada.
A screening decision determines whether a capital project is desirable based onsome previously established minimum criterion or criteria. If the project does notmeet the minimum standard(s), it is excluded from further consideration. The sec-ond decision is a preference decision in which projects are ranked according totheir impact on the achievement of company objectives.
Deciding which asset is the best investment requires the use of one or severalof the evaluation techniques discussed previously. Some techniques may be usedto screen the projects as to acceptability; other techniques may be used to rankthe projects in order of preferability. Although different companies use differenttechniques for screening and ranking purposes, payback period is commonly usedonly for screening decisions. The reasons for this choice are that payback focusesonly on the short run and does not consider the time value of money. The re-maining techniques may be used to screen or rank capital projects.
Of the “Best Investments” for All Worthwhile Activities, in Which Ones Should the Company Invest?
Although many worthwhile investment activities exist, each company has limitedresources available and must allocate them in the most profitable manner. There-fore, after choosing the best asset for each activity, management must decide which
Part 3 Planning and Controlling618
E X H I B I T 1 4 – 9
Capital Investment Information
$
Necessary InformationAbout Capital
Investment Projects
January 2010
January 2000
Estimated Life andSalvage Value
36
Service Availabilityand Costs
MaintenanceExpectations
$
$50,000
Initial Cost
Operating Costs
Raw Materialand Labor
Requirements
OutputCapability
$
Revenues(if any)
screening decision
preference decision
activities and assets to fund. Investment activities may be classified as mutually ex-clusive, independent, or mutually inclusive.
Mutually exclusive projects fulfill the same function. One project will bechosen from such a group, causing all others to be excluded from further consid-eration because they would provide unneeded or redundant capability. A proposalunder consideration may be to replace a current asset with one that provides thesame basic capabilities. If the company keeps the old asset, it will not buy thenew one; if the new one is purchased, the old asset will be sold. Thus, the twoassets are mutually exclusive. For example, if a bakery decided to buy a new de-livery truck, it would no longer need its existing truck. The existing truck wouldbe sold to help finance the new truck.
Other investments may be independent projects because they have no spe-cific bearing on one another. For example, the acquisition of an office microcom-puter system is not related to the purchase of a factory machine. These project de-cisions are analyzed and accepted or rejected independently of one another.Although limited resources may preclude the acquisition of all acceptable projects,the projects themselves are not mutually exclusive.
Management may be considering certain investments that are all related to aprimary project, or mutually inclusive projects. In a mutually inclusive situation,if the primary project is chosen, all related projects are also selected. Alternatively,rejection of the primary project will dictate rejection of the others. For example,when a firm chooses to invest in new technology, investing in an employee train-ing program for the new technology may also be necessary.
Exhibit 14–10 shows a typical investment decision process in which a com-pany is determining the best way to provide transportation for its sales force. An-swers to the four questions asked in the subheadings to this section are providedfor the transportation decision.
To ensure that capital funds are invested in the best projects available, man-agers must carefully evaluate all projects and decide which ones represent the mosteffective and efficient use of resources—a difficult determination. The evaluation
Chapter 14 Capital Budgeting 619
Activity—Provide transportation for a sales force of 10 people.
1. Is the activity worthy of an investment?Yes; this decision is based on an analysis of the cost of providing transportation inrelationship to the dollars of gross margin to be generated by the sales force.
2. Which assets can be used for the activity?Available: Bus passes, bicycles, motorcycles, automobiles (purchased), automobiles(leased), automobiles (currently owned), small airplanes.Infeasible: Bus passes, bicycles, and motorcycles are rejected as infeasible because ofinconvenience and inability to carry a reasonable quantity of merchandise; airplanes arerejected as infeasible because of inconvenience and lack of proximity of landing sites tocustomers.Feasible: Various types of automobiles to be purchased (assume asset options Athrough G); various types of leasing arrangements (assume availability of leases 1through 5); current fleet.Gather all relevant quantitative and qualitative information on all feasible assets (assetsA–G; leases 1–5; current fleet).
3. Which asset is the best investment?Compare all relevant information and choose the best asset candidate from the purchasegroup (assume Asset D) and the lease group (assume Lease 2).
4. Which investment should the company make?Compare the best asset candidate from the purchase group (Asset D) and the leasegroup (Lease 2); this represents a mutually exclusive, multiple-candidate project decision.The best candidate is found to be type D assets. Compare the type D assets to currentfleet; this is a mutually exclusive, replacement project. The best investment is to sell theold fleet and purchase a new fleet of 10 type D automobiles.
E X H I B I T 1 4 – 1 0
Typical Investment DecisionProcess
mutually exclusive project
independent project
mutually inclusive project
process should consider activity priorities, cash flows, and risk of all projects. Proj-ects should then be ranked in order of their acceptability. Ranking may be requiredfor both independent projects and mutually exclusive projects. Ranking mutu-ally exclusive projects is required to select the best project from the set of alter-natives. Ranking independent projects is required to efficiently allocate scarce cap-ital to competing uses.
Part 3 Planning and Controlling620
RANKING MULTIPLE CAPITAL PROJECTS
When managers are faced with an accept/reject decision for a single asset, all time-value-of-money evaluation techniques will normally point to the same decision alter-native. A project is acceptable under the NPV method when it has a nonnegativenet present value. Acceptability of a capital asset is also indicated by a profitabilityindex (PI) of 1.00 or more. Because the PI is an adaptation of the NPV method, thesetwo evaluation techniques will always provide the same accept/reject decision.
To be acceptable using the IRR model, a capital acquisition must have an in-ternal rate of return equal to or greater than the specified hurdle rate. The IRRmethod gives the same accept/reject decision as the NPV and PI methods if thehurdle rate and the discount rate used are the same.
More often, however, managers are faced with choosing among multiple proj-ects. Multiple project decisions require that a selection ranking be made. This sec-tion of the chapter considers the use of the net present value, profitability index,and internal rate of return techniques for ranking mutually exclusive projects. Pay-back period also can be used to rank multiple projects. However, it does not pro-vide as much useful information as NPV, PI, and IRR, because cash flows beyondthe payback period are ignored.
Managers can use results from the evaluation techniques to rank projects indescending order of acceptability. For the NPV and PI methods, rankings are based,respectively, on magnitude of NPV and PI index. Although based on the same fig-ures, the NPV and PI methods will not always provide the same order of rankingbecause the former is a dollar measure and the latter is a percentage. When theinternal rate of return is used, rankings of multiple projects are based on expectedrate of return. Rankings provided by the IRR method will not always be in thesame order as those given by the NPV or PI methods.
Conflicting results arise because of differing underlying reinvestment assump-tions of the three methods. The reinvestment assumption presumes cash flowsreleased during a project’s life are reinvested until the end of the project’s life. TheNPV and PI techniques assume that released cash flows are reinvested at the dis-count rate which, at minimum, should be the cost of capital (COC). The IRR methodassumes reinvestment of released cash flows can be made at the expected inter-nal rate of return, which may be substantially higher than the COC. If it is, the IRRmethod may provide a misleading indication of project success because additionalprojects may not be found that have such a high return.
Three situations are discussed in the following subsections to illustrate con-flicting rankings of multiple projects. In each situation the weighted average costof capital is the discount rate used to compute NPV as well as the hurdle rateagainst which to measure IRR.
eRAGs has gathered the following information pertaining to two potential projects.One project under consideration is the purchase of software that would improve theefficiency of processing customer orders. The other investment being contemplated
How do managers rankinvestment projects?
7
reinvestment assumption
is a customer service training program for the sales staff. Data on these projectsare as follows:
Software Training Program
Investment $390,000 $80,000Annual after-tax cash flows $ 64,000 $14,000Asset life 10 years 10 yearsCost of capital 9% 9%
Note that in this example an assumed COC of 9 percent is used as the discount rate.The time lines, NPV, and PI computations appear in Exhibit 14–11 for both projects.The amounts on the time lines are shown in thousands of dollars. The IRR is ap-proximated from the present value of an annuity table (Table 2, Appendix A), andthe actual rate can be found using a computer or programmable calculator.
The net present value model indicates that the better investment for eRAGs isthe software with a NPV of $11,843. However, in applying the profitability indexor internal rate of return models, the training program would be selected becauseit has a higher PI and a higher IRR. Because these projects do not serve the samepurpose, company management would most likely evaluate the selection based onpriority needs rather than results of specific capital project evaluations. In the ab-sence of a need to ration capital, eRAGs may invest in both projects.
Chapter 14 Capital Budgeting 621
SOFTWARE (000s)
End of period 0 1 2 3 4 5 6 7 8 9 10Inflows �64 �64 �64 �64 �64 �64 �64 �64 �64 �64Outflows (390)
Cash Flow Time Amount Discount Factor Present Value
The IRR is approximately 11.73%; calculator computations verify this finding.
E X H I B I T 1 4 – 1 1
Multiple Projects; ConflictingRankings
Multiple Projects—Unequal Lives, Constant but Unequal Cash Flows, Unequal Investments
The second illustration of conflicting rankings again compares the software andtraining programs but with a new set of assumptions. The cost of capital is still as-sumed to be 9 percent. The facts now reflect different lives and different invest-ment and annual cash flows.
Software Training Program
Investment $800,000 $591,500Annual after-tax cash flows 210,000 110,000Asset life 5 years 8 years
The time lines for the two investments are as follows:
Software (000s)
End of period 0 1 2 3 4 5Inflows �210 �210 �210 �210 �210Outflow (800)
Training Program (000s)
End of period 0 1 2 3 4 5 6 7 8Inflows �110 �110 �110 �110 �110 �110 �110 �110Outflow (591.5)
The net present value, profitability index, and internal rate of return are calculatedfor each investment, and the calculated results are shown in Exhibit 14–12. If thenet present value or profitability index method is used, the training program wouldbe selected by eRAGs. If the internal rate of return method is used to choose be-tween the two projects, the software appears to be the better investment.
Part 3 Planning and Controlling622
SOFTWARE
Cash Flow Time Amount Discount Factor Present Value
The IRR is approximately 9.78%; calculator computations verify this finding.
E X H I B I T 1 4 – 1 2
Multiple Projects; ConflictingRankings
Rankings using the internal rate of return are misleading because of the rein-vestment assumption. The IRR method assumes that the cash inflows of $210,000each year from the software investment will be reinvested at a rate of 9.81 percent;the $110,000 of cash flows from the training program are assumed to be reinvestedat 9.78 percent. The NPV method, however, assumes reinvestment of the cash flowsat the cost of capital of 9 percent, which is a more reasonable rate of return. TheNPV computations show the training program to be the better investment.
A formal method is available for choosing the better investment. For eRAGs’management to select the better investment, the difference in the annual cash flowsbetween the software and training program investments must first be determined.The cash flow differences are then evaluated as if they resulted from a separateinvestment opportunity. Because the software package requires a higher invest-ment than the training program, the software package is used as the comparisonbase. The investment opportunity resulting from the cash flow differences is re-ferred to here as project difference. If project difference provides a positive net pres-ent value, the software investment is ranked higher than the training program. Thishigher ranking is assigned because the additional investment required for the soft-ware is more than compensated for by the additional cash flows. If project differ-ence shows a negative net present value, the training program is the better invest-ment. The NPV of project difference is negative as shown in Exhibit 14–13 usingpresent value factors from Table 2, Appendix A.
eRAGs’ management is interested in two additional projects: a joint venture to de-velop a new Web site that would market classic comic books and a marketing re-search study for a large traditional retailer. The research study is somewhat uniquein that no payment would be received from the large retailer until the completionof the project. The company’s cost of capital and discount rate are 9 percent. This
Chapter 14 Capital Budgeting 623
NET CASH FLOWS
End of Training ProjectPeriod Software Program Difference
Using the same approach as presented in Exhibit 14–13, the following schedulecomputes a net present value for a project difference between the projects:
Period Joint Venture Research Study Project Difference
Because the NPV of project difference is negative, the research study is the pre-ferred investment.
Exhibit 14–14 presents the net present value, profitability index, and internalrate of return computations for these projects. The investment in the joint venturehas the higher IRR, but the research study has a higher NPV and PI. The best se-lection depends on assumptions made about the future reinvestment rate appliedto each of the $360,000 cash flows from the joint venture.
The point of indifference between the two projects occurs when the $360,000annuity can be discounted at a certain rate (the Fisher rate) to equal $2,400,000discounted for five years at that same rate. That rate is 14.43 percent and is cal-culated by solving for a discount rate that causes the net present values of the twoprojects to be equal. If worked manually, repeated trials are used; however, a com-puter or programmable calculator can be used to find this rate quickly.
For reinvestment rates above 14.43 percent, the joint venture generates a highernet present value. For reinvestment rates below 14.43 percent, the research studyis the superior investment.
The preceding situations demonstrate that different capital budgeting evalua-tion methods often provide different rankings of projects. Because of this possi-bility, managers should select one primary evaluation method for capital projects.The critical question is whether higher cash flows or a higher rate of return ispreferable. The answer is that higher present cash flows are always preferable tohigher rates of return.
The net present value method is considered theoretically superior to the in-ternal rate of return in evaluating capital projects for two reasons. First, the rein-vestment assumption of the IRR method is less realistic than that of the NPV method.Second, when a project has both positive and negative net annual cash flows
Part 3 Planning and Controlling624
Fisher rate
during its life, there is the arithmetic possibility that projects will have multiple in-ternal rates of return.
In addition, the net present value technique measures project results in dol-lars rather than rates, and dollar results are the objective of investment. To illus-trate the problem that could occur by relying solely on the internal rate of returnmethod, consider the following question: As discussed earlier, would a managerrather receive a 100 percent return on a $1 investment or a 10 percent return ona $100 investment? The answer indicates the fallacy of focusing only on rates ofreturn.
Although useful as a measure of evaluation under some circumstances, the prof-itability index is subject to the same concern as presented in the previous paragraph.Because monetary results are the objective of investments and the PI is expressedas a rate rather than as dollars, it can, if used by itself, lead to incorrect decisions.Taken together with other tools, however, the profitability index is a measure of cap-ital efficiency and can assist decision makers in their financial investment analyses.
Chapter 14 Capital Budgeting 625
JOINT VENTUREDISCOUNT RATE � 9%
Cash Flow Time Amount Discount Factor Present Value
The IRR is approximately 19.14%; calculator computations verify this finding.
E X H I B I T 1 4 – 1 4
Comparison of InvestmentProjects
RANKING PROJECTS UNDER CAPITAL RATIONING
Managers rank capital projects to select those projects providing the greatest returnon company investment. A company often finds that it has the opportunity to investin more acceptable projects than it has money. In fact, most companies operateunder some measure of capital rationing, which means that there is an upperdollar constraint on the amount of capital available to commit to capital asset acqui-sition.11 When capital rationing exists, the selection of investment projects must fall
capital rationing
11 Many publicly traded companies have the luxury of being able to obtain additional capital through new issuances of debtor stock. This possibility may limit the degree to which they are subject to capital rationing but does not eliminate it. Non-publicly traded companies operate under much more strict rationing of capital resources.
within the capital budget limit. In these circumstances, the NPV model may notproduce rankings that maximize the value added to the firm, because it does notconsider differences in investment amount.
Capital rationing is illustrated by the following situation. Assume that eRAGshas a capital budget of $7,500,000 and is considering the various investment pro-jects listed in Exhibit 14–15. By all quantitative measures except NPV, Project 1should be eliminated if the firm has only $7,500,000 available in the capital bud-get. Its NPV is larger than only Project 2, but deletion of Project 2 will not permitinclusion of any other project. The firm would need $8.1 million to complete allsix projects and only $7.5 million is available. Because it does not help to elimi-nate Project 2, the project that would otherwise produce the smallest companyNPV and return based on either the PI or IRR technique (Project 1) should be elim-inated. Relatively speaking, Project 2 is of much less interest than Projects 3, 4, 5,and 6. Project 2 does meet minimum quantitative standards though.
Based on PIs, the attractiveness of the projects, in descending order, is 6, 4,2, 5, and 3. Based on IRRs, the preferences would be 5, 3, 6, 4, and 2. Based onNPVs, the ranking would be 6, 5, 4, 3, and 2.
Although managers should select one primary evaluation technique, the eRAGsexample shows that capital project evaluation should not be performed using onlyone method. Each evaluation tool should be used in conjunction with others, notto the exclusion of others. Each method provides valuable information. Even thenondiscounting technique of payback period can be helpful to management by in-dicating the quickness of return of investment.
In making their preference decisions, many company managers set rankingcategories for projects such as those shown in Exhibit 14–16. Projects are firstscreened and placed into an appropriate category. Monetary resources are allocatedto projects in a top-to-bottom fashion. Within each category, projects are usuallyranked using net present value and profitability index techniques. Management’sgoal should be to select those projects that, within budget constraints, will max-imize net present value to the firm. Selecting projects based solely on their in-ternal rate of return rankings without consideration of the net present values maybe incorrect.12
Regardless of the capital budgeting evaluation techniques used, managers mustremember that the results provided are based on estimates of future events. Thefact that estimates are involved indicates that a risk is associated with the decision.All project estimates should be carefully understood and analyzed using soundjudgment. Capital project proposals are being “sold” by their sponsors using dif-ferent reasons under different conditions.
12 If the set of projects is very large, the selection of projects may require the use of integer programming techniques, whichare outside the scope of this text.
Chapter 14 Capital Budgeting 627
CATEGORY 1—REQUIRED BY LEGISLATION
This category would include such items as pollution control equipment that has been mandatedby law. Most companies can ill afford the fines or penalties that can be assessed for lack ofinstallation; however, these capital acquisitions may not meet the company’s minimumestablished economic criteria.
CATEGORY 2—ESSENTIAL TO OPERATIONS
This category would include capital assets without which the primary functions of theorganization could not continue. This category could include new purchases of capital assetsor replacements of broken or no longer usable assets. For example, the purchase of a kilnfor a ceramics manufacturer would fall into this category.
CATEGORY 3—NONESSENTIAL BUT INCOME GENERATING
This category would include capital assets that would improve operations of the organizationby providing cost savings or supplements to revenue. Robots in an automobile manufacturerwould be included in this group.
CATEGORY 4—OPTIONAL IMPROVEMENTS
Items in this category would be those that do not provide any cost savings or revenueincreases but would make operations run more smoothly or improve working conditions. Thepurchase of computer hardware or software that is faster than that currently being used andthe installation of a microwave oven in the employees’ lounge would be included here.
CATEGORY 5—MISCELLANEOUS
This category exists for “pet projects” that might be requested. Such acquisitions may be morefor the benefit of a single individual and not the organization as a whole. Such projects maynot even be related to organizational objectives. The installation of new carpeting in amanager’s office could be an example of this group of investments. Items in this categorywill normally be chosen only when the organization has substantial, unencumbered resourcesat its disposal.
E X H I B I T 1 4 – 1 6
Ranking Categories for CapitalProjects
COMPENSATING FOR RISK IN CAPITAL PROJECT EVALUATION
When choosing among multiple projects, managers must consider the risk or un-certainty associated with each project. In accounting, risk reflects uncertainty aboutdifferences between the expected and actual future returns from an investment.For example, the purchase of a $100,000, 10 percent treasury note would providea virtually risk-free return of $10,000 annually because treasury notes are backedby the full faith and credit of the U.S. government. If the same $100,000 wereused to purchase stock, the returns could range from �100 percent (losing theentire investment) to an abnormally high return. The potential for extreme vari-ability makes the stock purchase a much more risky investment than the treasurynote.
For Internet companies, one of the key variables to success is getting on-lineshoppers to access the companies’ sites. One of the important variables influencingshopper traffic is advertising. For Internet companies, advertising is a capital invest-ment—and a risky one. This is illustrated in the News Note on page 628.
Managers considering a capital investment should understand and compensatefor the degree of risk involved in that investment. A manager may use three ap-proaches to compensate for risk: the judgmental method, the risk-adjusted discountrate method, and sensitivity analysis. These methods do not eliminate risk, but theydo help managers understand and evaluate risk in the decision-making process.
How is risk considered in capitalbudgeting analysis?
risk
8
http://www.yr.comhttp://www.covad.com
Judgmental Method
The judgmental method of risk adjustment allows the decision makers to use logicand reasoning to decide whether a project provides an acceptable rate of return inrelation to its risk. The decision maker is presented with all available informationfor each project, including the payback period, NPV, PI, and IRR. After reviewingthe information, the decision maker chooses from among acceptable projects basedon personal judgment of the risk-to-return relationship. The judgmental approachprovides no formal process for adjusting data for the risk element.
Risk-Adjusted Discount Rate Method
A more formal method of taking risk into account requires making adjustments tothe discount or hurdle rate. Under the risk-adjusted discount rate method, thedecision maker increases (decreases) the rate used for discounting future cash in-flows (outflows) to compensate for increased risk. As the discount rate is increased(decreased), the present values of the cash flows are reduced (increased). There-fore, larger cash inflows are required to “cover” the investment and provide an ac-ceptable rate of return. Changes in the discount rate should be reflective of thedegree of cash flow variability and timing, other investment opportunities, and cor-porate objectives. If the internal rate of return is being used for project evaluation,the risk-adjusted discount rate method would increase the hurdle rate against whichthe IRR is compared for higher risk projects.
Assume that the management of eRAGs is considering developing a new In-ternet service. The company would operate the service for 10 years and then sellit at the end of those 10 years. Estimates of the development cost and annual cashflows for the service are as follows:
Initial development cost $1,500,000After-tax net cash flows
Years 1–5 200,000Years 6–10 300,000Year 10 (sale) 600,000
Part 3 Planning and Controlling628
Advertising—How Much Is Enough?
N E W S N O T E G E N E R A L B U S I N E S S
Dustin Grosse is sitting on the edge of his seat in a con-ference room at the ad agency Young & Rubicam in SanFrancisco. Grosse is the brand manager for Covad, a Sil-icon Valley company that sells high-speed access to theInternet, and he is about to review Y&R’s final cuts of twotelevision commercials. They will be the centerpiece of a$40 million, yearlong, coast-to-coast marketing campaigndesigned to trumpet little-known Covad as a broadbandleader. A lot is at stake, especially when you considerthat Covad’s sales for the past 12 months totaled justover $20 million, or half its marketing budget.
Most net firms have wielded wacky, even dark humorto set themselves apart. Outpost.com showed gerbilsshooting out from a cannon, while one Beyond.com adfeatures a buck-naked man working at home via the Net.Covad flirted with off-the-wall stuff, but Bob Roblin, Covad’s
executive vice president, believes milder comedy will ap-peal more to a mainstream audience.
If Roblin is right, the upside for Covad could be enor-mous. Beyond reaching consumers and businesses, Co-vad’s campaign must make a big splash with Internetservice providers. Covad is a wholesaler, with no directretail relationship with its customers. If the campaignstimulates a groundswell of demand for Covad DSL, moreISPs will be driven to seek a partnership with the accessprovider which will boost the top line, thus achieving theultimate, measurable goal of all the advertising.
eRAGs management uses its 9 percent cost of capital as the discount rate in eval-uating capital projects under the NPV method. However, Pierre Stellar, a boardmember, feels that above-normal risk is created in this endeavor by two factors.First, revenues realized through service fees may differ from those planned. Sec-ond, the market value of the service in 10 years may vary substantially from theestimate of $600,000.
Mr. Stellar wants to compensate for these risk factors by using a 15 percentdiscount rate rather than the 9 percent cost of capital rate. Determination of theamount of adjustment to make to the discount rate (from 9 to 15 percent, for ex-ample) is most commonly an arbitrary one. Thus, even though a formal process isused to compensate for risk, the process still involves a degree of judgment onthe part of the project evaluators. Exhibit 14–17 presents the NPV computationsusing both discount rates. When the discount rate is adjusted upward, the NPV ofthe project is lowered and, in this case, shows the project to be unacceptable.
The same type of risk adjustment can be used for payback period or accountingrate of return (Appendix 2). If the payback method is being used, managers maychoose to shorten the maximum allowable payback period to compensate for in-creased risk. This adjustment assumes that cash flows occurring in the more dis-tant future are more risky than those occurring in the near future. If the account-ing rate of return (ARR) method is used, managers may increase the preestablishedacceptable rate against which the ARR is compared to compensate for risk. An-other way in which risk can be included in the decision process is through theuse of sensitivity analysis.
Sensitivity Analysis
Sensitivity analysis is a process of determining the amount of change that mustoccur in a variable before a different decision would be made. In a capital budget-ing situation, the variable under consideration could be the discount rate, annualnet cash flows, or project life. Sensitivity analysis looks at this question: What if avariable is different from that originally expected?
Except for the initial purchase price, all information used in capital budgetingis estimated. Use of estimates creates the possibility of introduction of errors, andsensitivity analysis identifies an “error range” for the various estimated values over
Chapter 14 Capital Budgeting 629
NPV USING 9% DISCOUNT RATE
Cash Flow Time Amount Discount Factor Present Value
which the project will still be acceptable. The following sections consider how sen-sitivity analysis relates to the discount rate, cash flows, and life of the asset.
RANGE OF THE DISCOUNT RATEA capital project providing a rate of return equal to or greater than the discountor hurdle rate is considered an acceptable investment. But returns from a projectare not certain because, for instance, the cost of capital may increase due to in-creases in interest rates on new issues of debt. Sensitivity analysis allows a com-pany to determine what increases may occur in the estimated cost of capital be-fore a project becomes unacceptable. The upper limit of increase in the discountrate is the project’s internal rate of return. At the IRR, a project’s net present valueis zero; therefore, the present value of the cash inflows equals the present valueof cash outflows. As long as the IRR for a project is equal to or above the cost ofcapital, the project will be acceptable.
To illustrate use of sensitivity analysis, eRAGs’s Internet site investment project(Situation A), analyzed earlier in Exhibit 14–7 using an 11 percent discount rate, isreconsidered:
After-tax cash flows for 10 yearsdiscounted at 11% (93,200 � 5.8892) $548,873
Initial investment (540,000)NPV $ 8,873
The project provides a positive net present value and is considered an acceptableinvestment candidate.
The eRAGs management team wants to know how high the discount rate canrise before the project would become unacceptable. To find the upper limit of thediscount rate, the present value factor for an annuity of 10 periods at the unknowninterest rate is computed as follows:
Cash flow � PV factor � Investment
$93,200 � PV factor � $540,000
PV factor � 5.7940
Using the PV factor, the IRR is found to be 11.39 percent. As long as eRAGs’ costof capital is less than or equal to 11.39 percent, this project will be acceptable. Asthe discount rate is increased toward the project’s IRR, the project becomes lessdesirable. These calculations assume that the cash flows and project life have beenproperly estimated.
RANGE OF THE CASH FLOWSAnother factor sensitive to changes in estimation is the investment’s projected cashflows. eRAGs’ data for the Internet site investment project from Exhibit 14–7 (Sit-uation A) are also used to illustrate how to determine the range of acceptable cashflows. Company management wants to know how small the net cash inflows canbe and still have the project remain desirable. This determination requires that thepresent value of the cash flows for 10 periods, discounted at 11 percent, be equalto or greater than the investment cost. The PV factor for 10 periods at 11 percentis 5.8892. The equation from the preceding section can be used to find the low-est acceptable annuity:
Cash flow � PV factor � Investment
Cash flow � 5.8892 � $540,000
Cash flow � $540,000 � 5.8892
Cash flow � $91,693
Part 3 Planning and Controlling630
As long as the net annual cash flow equals or exceeds $91,693, the Internet siteproject will be financially acceptable.
RANGE OF THE LIFE OF THE ASSETAsset life is related to many factors, some of which, like the quantity and timing ofmaintenance on equipment, are controllable. Other factors, such as technologicaladvances and actions of competitors, are noncontrollable. An error in the estimatedlife will change the number of periods from which cash flows are to be derived.These changes could affect the accept/reject decision for a project. The eRAGsInternet site example is used to demonstrate how to find the minimum length oftime the cash flows must be received from the project for it to be acceptable. Thesolution requires setting the present value of the cash flows discounted at 11 per-cent equal to the investment. This computation yields the PV factor for an unknownnumber of periods:
Cash flow � PV factor � Investment
$93,200 � PV factor � $540,000
PV factor � 5.7940
Review the present value of an annuity table in Appendix A under the 11 per-cent interest column to find the 5.7940 factor. The project life is approximately 9years and 9 months.13 If the project cash flows were to stop at any point before9 years and 9 months, the project would be unacceptable.
Sensitivity analysis does not reduce the uncertainty surrounding the estimateof each variable. It does, however, provide management with a sense of the tol-erance for estimation errors by providing upper and lower ranges for selected vari-ables. The above presentation simplistically focuses on single changes in each ofthe variables. If all factors change simultaneously, the above type of sensitivityanalysis is useless. More advanced treatments of sensitivity analysis, which allowfor simultaneous ranging of all variables, can be found under the topic of simula-tion in an advanced mathematical modeling text.
Chapter 14 Capital Budgeting 631
13 This solution was found by interpolating.
POSTINVESTMENT AUDIT
In a postinvestment audit of a capital project, information on actual project re-sults is gathered and compared to expected results. This process provides a feed-back or control feature to both the persons who submitted and those who ap-proved the original project information. Comparisons should be made using thesame technique or techniques used originally to determine project acceptance. Ac-tual data should be extrapolated to future periods where such information wouldbe appropriate. In cases where significant learning or training is necessary, start-up costs of the first year may not be appropriate indicators of future costs. Suchprojects should be given a chance to stabilize before making the project audit.
As the size of the capital expenditure increases, a postinvestment audit be-comes more crucial. Although an audit cannot change a past investment decision,it can pinpoint areas of project operations that are out of line with expectationsso that problems can be corrected before they get out of hand.
Secondarily, an audit can provide feedback on the accuracy of the original esti-mates for project cash flows. Sometimes, project sponsors may be biased in favorof their own projects and provide overly optimistic forecasts of future revenues orcost savings. Individuals providing unrealistic estimates should be required to explainall major variances. Knowing that postinvestment audits will be made may causeproject sponsors to provide realistic cash flow forecasts in their capital requests.
How and why shouldmanagement conduct a
postinvestment audit of a capitalproject?
postinvestment audit
9
Performing a postinvestment audit is not an easy task. The actual informationmay not be in the same form as were the original estimates, and some project ben-efits may be difficult to quantify. Project returns fluctuate considerably over time,so results gathered at a single point may not be representative of the project. But,regardless of the difficulties involved, postinvestment audits provide managementwith information that can help to make better capital investment decisions in thefuture.
Part 3 Planning and Controlling632
A m a z o n . c o mREVISITING
mazon.com is the bellwether of the big Internetretailers. Many Internet investors are looking at
Amazon.com to see the future of the battle between tradi-tional retail sales and Internet retailing.
There is a tremendous amount of wealth at stakealong with Amazon’s future. Although its sales are meagercompared to any of the nation’s major retailers, its marketvalue eclipses nearly all of them. For example, in 1999 itsmarket cap was twice as big as that of Sears, five timesbigger than Kmart’s, 17 times bigger than Barnes & Nobles.
How will the Amazon story end? Will it win the race?Conquer the world? Bezos himself isn’t sure. “I don’t wantto give the impression that our future success is assured.I believe the opposite. I believe our future success is not
assured,” he says, adding with a grin, “If you look at thehistory of pioneers, it’s not good.” He even seems fasci-nated by his own cliffhanger. Everywhere he goes, Bezoscarries a small digital camera. “I try to take at least onepicture a day so that I’ll have some hope 50 years fromnow of reconstructing my life.”
Right now, there seem to be two possible conclusionsto the Amazon story. Ending No. 1 goes like this: In tenyears Amazon becomes so huge, so omnipresent, that itwill be hard to imagine that it started out as a tiny book-seller way back in 1995. Ending No. 2, equally believable:Amazon is undone by its own ambitions and winds up asa footnote in the history of business. In the meantime,Amazon watchers await the next big move.
Capital budgeting is concerned with evaluating long-range projects involving theacquisition, operation, and disposition of one or more capital assets. Various cri-teria are employed to evaluate potential projects. Among the financial criteria usedare payback period, net present value (NPV), profitability index (PI), and internalrate of return (IRR).
The payback period is the length of time needed for a firm to recoup its in-vestment from the cash inflows of a project. If a project’s payback period is lessthan a preestablished maximum, the project is acceptable. This method ignores thetime value of money and all cash flows beyond the payback period.
Net present value, profitability index, and internal rate of return are discountedcash flow methods. As such, these methods require management to discount a proj-ect’s cash inflows and outflows using a desired rate of return. The minimum rateat which the discount rate should be set is the cost of capital. Managers may com-pensate for a project’s above-normal risk by using a discount rate that is higherthan the cost of capital.
Under the NPV method, the total present value of future cash flows is reducedby the current investment to derive the net present value. If the NPV is equal to
C H A P T E R S U M M A R Y
or greater than zero, the project provides a rate of return equal to or greater thanthe discount rate. A nonnegative NPV makes the project acceptable for investment.
The profitability index equals the present value of the net cash flows dividedby the investment cost. The profitability index is considered an indicator of thecompany’s efficiency in its use of capital. Revenue-producing projects should havea PI of 1.00 or more.
The internal rate of return method computes the rate of return expected onthe investment project. The IRR is equal to the discount rate at which the net pres-ent value of all cash flows equals zero. If the internal rate of return of a projectexceeds management’s desired hurdle rate, the project is acceptable.
Each capital project evaluation technique is based on certain assumptions and,therefore, has certain limitations. To compensate for these limitations, managerssubject capital projects to more than one evaluation technique.
Depreciation expense and changes in tax rates affect after-tax cash flows. Thetax rates and allowable depreciation methods estimated when the investment isanalyzed may not be the same as when the project is implemented. Such changescan cause a significant difference in the actual net present value and internal rateof return amounts from those originally estimated on the project.
Management should select investment projects that will help to achieve the or-ganization’s objectives and provide the maximum return on capital resources uti-lized. The company must determine whether the activities in which it wishes toengage are worthy of an investment and which assets can be used for those ac-tivities. Then, decisions must be made about the best investment to accept fromthose available. These decisions require that investment projects be ranked as totheir desirability in relationship to one another.
Often the NPV, PI, and IRR computations will produce the same rankings ofmultiple investment projects. In some situations, however, the NPV, PI, and IRRmethods produce different project rankings. The primary reason for differences isthe underlying assumption of each method regarding the reinvestment rate of cashflows released during the life of the project. The NPV and PI methods assume rein-vestment at the discount rate, whereas the IRR method assumes reinvestment atthe internal rate of return provided by the project. The assumption of the NPV andPI methods is more likely to be realized than that of the IRR method.
Capital rationing indicates that management has imposed a spending limit inthe capital budget. When capital rationing exists, the NPV model may provide thebest first-cut ranking of projects in which the returns to the firm will be maximized.Projects can also be listed in descending order of their PI and IRR rates of return.Only projects having an IRR in excess of the weighted average cost of capitalshould be considered and then only to the extent of the budget. In addition, man-agers need to consider legal requirements as well as the goals and objectives ofthe firm when ranking projects. Categorization of projects is a useful way to rankinvestments.
Different risks can be associated with each capital project. Risk is defined asuncertainty about the expected returns from an asset. Project risk can be assessedand included in decision making judgmentally, or more formally, by calculating arisk-adjusted discount/hurdle rate. Sensitivity analysis can also be employed to com-pensate for risk by calculating a range for each of the variables (discount rate, cashflows, and life of project) in a capital budgeting problem. Sensitivity analysis as-sists management in determining the effect on project outcome of a change in theestimate of one or more of the critical variables in deriving the accept/reject con-clusion about the project.
After a capital project is accepted and implemented, a postinvestment auditshould be undertaken to compare actual results with expected results. The auditwill help managers identify and correct any problems that may exist, evaluate theaccuracy of estimates used for the original investment decision, and help improvethe forecasts of future investment projects.
Chapter 14 Capital Budgeting 633
Part 3 Planning and Controlling634
Time Value of Money
The time value of money can be discussed in relationship to either its future orits present value. Future value (FV) refers to the amount to which a sum of moneyinvested at a specified interest rate will grow over a specified number of time pe-riods. Present value (PV) is the amount that future cash flows are worth currently,given a specified rate of interest.14 Thus, future and present values depend on threethings: (1) amount of the cash flow, (2) rate of interest, and (3) timing of the cashflow. Only present values are discussed in this appendix because they are mostrelevant to the types of management decisions discussed in this text.
Future and present values are related. A present value is a future value dis-counted back the same number of periods at the same rate of interest. The rateof return used in present value computations is called the discount rate.
In computing future and present values, simple or compound interest may beused. Simple interest means that interest is earned only on the original invest-ment or principal amount. Compound interest means that interest earned in priorperiods is added to the original investment so that, in each successive period, in-terest is earned on both principal and interest. The time between each interestcomputation is called the compounding period. The more often interest is com-pounded, the higher is the actual rate of interest being received relative to thestated rate. The following discussion is based on use of compound interest, be-cause most transactions use this method.
Interest rates are typically stated in annual terms. To compensate for more fre-quent compounding periods, the number of years is multiplied by the number ofcompounding periods per year and the annual interest rate is divided by the num-ber of compounding periods per year.
Present Value of a Single Cash FlowAssume that Charlotte Moore’s bank pays interest at 10 percent per year. Charlottewants to accumulate $30,000 in five years to attend graduate school and wants toknow what amount to invest now to achieve that goal. The formula to solve forthe present value is
PV �
where PV � present value of a future amountFV � future value of a current investment
i � interest rate per compounding periodn � number of compounding periods
Substituting known values into the formula gives the following:
PV �
PV �
PV � $18,634
$30,000�
1.61
$30,000��(1 � 0.10)5
FV�(1 � i)n
A P P E N D I X 1
How are present valuescalculated?
future value
simple interestcompound interest
compounding period
10
14 Interest can be earned or owed, received or paid. To simplify the discussion for definitional purposes, the topic of interestis viewed only from the inflow standpoint.
In capital budgeting analyses, many future value amounts need to be convertedto present values. Rather than using the formula [1 � (1 � i)n] to find PVs, a tableof factors for the present value of $1 (Table 1) for a variety of “i” and “n” valuesis provided in Appendix A at the end of the text for ease of computation. Suchfactors are also available in programmable calculators, making the use of tablesunnecessary.
Present Value of an AnnuityAn annuity is a cash flow (either positive or negative) that is repeated over con-secutive periods. For an ordinary annuity, the first cash flow occurs at the end ofeach period. In contrast, the cash flows for an annuity due occur at the beginningof each period.
To illustrate the computation of the present value of an annuity, considerthe following situation. Judy and Jerry Jamison are planning for their daughter’scollege education. Their daughter, Janice, will need $20,000 per year for thenext four years. The Jamison’s want to know how much to invest currently at8 percent so that Janice can withdraw $20,000 per year. The following diagrampresents the situation:
Time period t0 t1 t2 t3 t4
Future value $20,000 $20,000 $20,000 $20,000Present value ?
The present value of each single cash flow can be found using 8 percent factorsin Table 1 as follows:
PV of first receipt: $20,000 � 0.9259 $18,518PV of second receipt: $20,000 � 0.8573 17,146PV of third receipt: $20,000 � 0.7938 15,876PV of fourth receipt: $20,000 � 0.7350 14,700
Total present value of future cash flows $66,240
The present value factor for an ordinary annuity can also be determined byadding the present value factors for all periods having a future cash flow. Table 2in Appendix A provides present value of ordinary annuity factors for various in-terest rates and time periods. From this table, the factor of 3.3121 can be obtainedand multiplied by $20,000 to yield $66,242, or approximately the same result asabove. (The difference is caused by decimal-fraction rounding.)
Chapter 14 Capital Budgeting 635
ordinary annuityannuity due
Accounting Rate of Return
The accounting rate of return (ARR) measures the rate of earnings obtained onthe average capital investment over a project’s life. This evaluation method is consis-tent with the accounting model and uses profits shown on accrual-based financialstatements. It is the one evaluation technique that is not based on cash flows. Theformula to compute the accounting rate of return is
ARR � Average Annual Profits from Project � Average Investment in Project
Investment refers to project cost as well as any other costs needed for workingcapital items (such as inventory) for project support. Investment cost, salvage value,and working capital released at the end of the project’s life are summed and divided
A P P E N D I X 2
What are the advantages anddisadvantages of the accounting
rate of return method?
accounting rate of return
11
by 2 to obtain the average investment over the life of the project.15 The cost andworking capital needed represent the initial investment and the salvage value andworking capital released represent the ending investment.
The following information pertains to a new service line being considered byeRAGs. The information is used to illustrate after-tax calculation of the ARR.
Beginning investment:Initial cost of equipment and software $80,000Additional working capital needed for the service line 40,000
Return over life of project:Average increase in profits after taxes 20,000
Return at end of project:Salvage value of equipment and software in 10 years (end of life of project) 8,000Working capital released at the end of 10 years 40,000
Solving the formula for the accounting rate of return gives
ARR � $20,000 � [($120,000 � $48,000) � 2]
� $20,000 � $84,000
� 23.81%
The 23.81 percent ARR on this project can be compared with a preestablished hur-dle rate set by management. This hurdle rate may not be the same as the desireddiscount rate because the data used in calculating the accounting rate of return donot represent cash flow information. The ARR hurdle rate may be set higher thanthe discount rate because the discount rate automatically compensates for the timevalue of money. In addition, the 23.81 percent ARR for this project should be com-pared with ARRs on other projects under investment consideration by the RAGs tosee which projects have the higher accounting rates of return.
Part 3 Planning and Controlling636
15 Sometimes ARR is computed using initial cost rather than average investment as the denominator. Such a computation ig-nores the return of funds at the end of the project life and is less appropriate than the computation shown.
K E Y T E R M S
accounting rate of return (p. 635)annuity (p. 605)annuity due (p. 635)capital asset (p. 601)capital budgeting (p. 601)capital rationing (p. 625)cash flow (p. 602)compound interest (p. 634)compounding period (p. 634)cost of capital (p. 606)discount rate (p. 606)discounting (p. 606)financing decision (p. 603)Fisher rate (p. 624)future value (p. 634)hurdle rate (p. 611)independent project (p. 619)internal rate of return (p. 609)investment decision (p. 603)
judgmental method (of riskadjustment) (p. 628)
mutually exclusive project (p. 619)mutually inclusive project (p. 619)net present value (p. 607)net present value method (p. 607)ordinary annuity (p. 635)payback period (p. 604)postinvestment audit (p. 631)preference decision (p. 618)present value (p. 606)profitability index (p. 608)reinvestment assumption (p. 620)return of capital (p. 606)return on capital (p. 606)risk (p. 627)risk-adjusted discount rate method
tax shield (of depreciation) (p. 612)time line (p. 603)
Prepare a time line to illustrate all moments in time when cash flows are expected.The discount rate used should be the cost of capital.
Payback Period1. For projects with an equal annual cash flow:
Payback Period � Investment � Annuity
2. For projects with unequal annual cash flows:
Sum the annual cash flows until investment is reached to find payback period.
If payback period is equal to or less than a preestablished maximum number ofyears, the project is acceptable.
Net Present Value� Investment made currently (always valued at a factor of 1.000)� PV of future cash inflows or cost savings� PV of future cash outflows
� NPV
If NPV is equal to or greater than zero, the project is expected to return a rateequal to or greater than the discount rate and the project is acceptable.
Profitability Index� PV of future cash inflows or cost savings� PV of future cash outflows
� PV of net cash flows
PI �
If PI is 1.00 or greater, the project is expected to return a rate equal to or greaterthan the discount rate and the project is acceptable.
Internal Rate of Return1. For projects with equal annual cash flows:
PV Factor �
Find the PV factor (or the one closest to it) in the table on the row for thenumber of periods of the cash flows. The percentage at the top of the columnwhere this factor is found will approximate the IRR. (Note: For projects withequal annual cash flows, this factor is also equal to the payback period.)
Net Investment��
Annuity
PV of Net Cash Flows���PV of Net Investment
S O L U T I O N S T R A T E G I E S
2. For projects with unequal annual cash flows: Make an estimate of rate pro-vided by project; compute NPV. If NPV is positive (negative), try a higher(lower) rate until the NPV is zero.
Compare IRR to the discount or preestablished hurdle rate. If the IRR equals or isgreater than the hurdle rate, the project is acceptable.
Tax Benefit of Depreciation � Depreciation Amount � Tax Rate
Accounting Rate of Return
ARR � Average Annual Profits from Project � Average Investment in Project
Average Investment � (Beginning Investment � Recovery of Investment at End of Project Life) � 2
Compare calculated ARR to hurdle ARR. If the calculated ARR is equal to or greaterthan the hurdle ARR, the project is acceptable.
Basic Concepts of Capital Budgeting Techniques
Payback NPV PI IRR ARR
Uses time value of money? No Yes Yes Yes No
Specifies a rate of return? No No No Yes Yes
Uses cash flows? Yes Yes Yes Yes No
Considers returns during life of project? No Yes Yes Yes Yes
Uses discount rate in calculation? No Yes Yes No* No*
*Discount rate is not used in the calculation, but it may be used as the hurdle rate.
Part 3 Planning and Controlling638
Chesapeake Chandlery is considering the development of on-line sales of its boat-ing products. The necessary inventory and distribution capabilities are already inplace; however, the company would invest $800,000 to develop the necessary on-line storefront. The investment would have an expected economic life of six yearswith an expected salvage value of $25,000 at the end of its life.
At the end of the fourth year, the firm anticipates it would spend $80,000 for on-line advertising and updating of its Web site. This amount would be fully deductiblefor tax purposes in the year incurred. Management requires that investments of thistype be recouped in four years or less. The pretax increase in income is expectedto be $175,000 in each of the first four years and $132,000 in each of the next twoyears. The company’s discount rate is 10 percent; its tax rate is 30 percent; andthe investment would be depreciated for tax purposes using the straight-line methodwith no consideration of salvage value over a period of five years.
Required:a. Prepare a time line for displaying cash flows. Be certain to consider the effects
of taxes.b. Calculate the after-tax payback period.c. Calculate the after-tax net present value on the project.d. Discuss the appropriateness of making such an investment.
D E M O N S T R A T I O N P R O B L E M
Solution to Demonstration Problema. End of period 0 1 2 3 4 5 6
2($800,000 � 5) � 0.30 � $48,0003$80,000 � (1 � 0.30) � $56,0004$25,000 � (1 � 0.30) � $17,500Note that all proceeds received from the sale of the equipment are taxable because the entire cost of the equipmentwas depreciated. Expected salvage value is ignored in computing depreciation deductions for tax purposes.
The payback is complete in 5.31 years or in April in the last year. The portionof the sixth year (0.31) required to complete the payback is equal to $33,600� $109,900.
c. Cash Flow Time Amount Discount Factor Present Value
d. The project is unacceptable based on the payback period and fails to qualifybased on the NPV criterion as well. Accordingly, from strictly a financial per-spective, the project is not acceptable. However, nonquantitative factors mustbe considered. These factors may include effects on competitive position andability to adopt future technological advances.
Chapter 14 Capital Budgeting 639
1. What is a capital asset? How is it distinguished from other assets?2. Why do firms use multiple criteria when evaluating potential capital invest-
ments?3. Why do capital budgeting evaluation methods use cash flows rather than ac-
counting income?4. Why are cash flows related to financing not included in evaluating a capital
project?5. Why are time lines helpful in evaluating capital projects?6. What does the payback method measure? What are its major weaknesses?7. Why is the time value of money important in capital budgeting? Which eval-
uation methods use this concept? Which do not?8. Differentiate between a return of capital and a return on capital.
Q U E S T I O N S
9. What is measured by the net present value of a potential project? If the netpresent value of a project equals zero, is it an acceptable project? Explain.
10. Will the NPV amount determined in the capital budgeting process be the sameamount as that which actually occurs after a project is undertaken? Why orwhy not?
11. How is the profitability index related to the NPV method? What does the PImeasure?
12. Under what circumstance will the PI exceed 1? Discuss the rationale for youranswer.
13. What is measured by the internal rate of return? When is a project consideredacceptable using this method?
14. What is the relationship between NPV and IRR? Why does this relationshiphold true?
15. Depreciation does not represent a cash flow. Why, then, is it important in cap-ital budgeting evaluation techniques that use discounted cash flows?
16. What is the difference between the tax shield of depreciation and the tax ben-efit of depreciation?
17. What are four questions that managers should ask when choosing the invest-ment proposals to be funded?
18. How would managers rank projects using each of the following methods: netpresent value, profitability index, internal rate of return, payback period, andaccounting rate of return?
19. Why should managers use several techniques to rank capital projects? Whichtechnique should be used as the primary evaluator and why?
20. Why does capital rationing exist, and how do managers consider it when rank-ing capital projects?
21. How is risk defined in capital budgeting analysis? List several aspects of a proj-ect in which risk is involved and how risk can affect the net present value ofa project.
22. How is sensitivity analysis used in capital budgeting?23. Why are postinvestment audits performed? When should they be performed?24. (Appendix 1) What is meant by the term time value of money? Why is a pres-
ent value always less than the future value to which it relates?25. (Appendix 1) How does an annuity differ from a single cash flow?26. (Appendix 2) How is the accounting rate of return computed? How does this
rate differ from the discount rate and the internal rate of return?
Part 3 Planning and Controlling640
27. (Terminology) Match the numbered item on the right with the lettered item onthe left.a. Annuity 1. A measure of the time that willb. Cost of capital elapse until an initial investment isc. Financing decision recouped.d. Investment decision 2. A decision regarding what type ofe. Judgmental method capital will be used to fund anf. Mutually exclusive projects investment.g. Mutually inclusive projects 3. A cash flow that is repeated inh. Net present value consecutive periods.i. Payback period 4. Present value of cash inflows lessj. Present value present value of cash outflows.
5. A method of evaluating risk.6. A decision in which accepting one
project requires acceptance of another.
E X E R C I S E S
7. A future amount that has beendiscounted to the present.
8. A decision in which the acceptanceof one project implies the rejection ofothers.
9. A decision about which assets a firmwill acquire.
10. The discount rate often used ininvestment analysis.
28. (Terminology) Match the numbered item on the right with the lettered item onthe left.a. Capital asset 1. Effect of uncertainty.b. Compound interest 2. Recapture of the original investment.c. Discount rate 3. Sum plus its accumulated interest.d. Future value 4. Interest earned on interest.e. Hurdle rate 5. Discount rate that causes the NPVf. Internal rate of return to equal $0.g. Profitability index 6. Benchmark for evaluating theh. Return of capital internal rate of return on a project.i. Return on capital 7. Rate used to find the present valuej. Risk of a future amount.
8. Interest.9. Long-lived asset.
10. Derivation of NPV used to compareprojects of unequal size.
29. (Payback period) Cimarron Manufacturing is considering the purchase of newproduction technology. The new technology would require an initial invest-ment of $750,000 and have an expected life of 10 years. At the end of its life,the equipment would have no value. By installing the new equipment, thefirm’s annual labor and quality costs would decline by $150,000.a. Compute the payback period for this investment (ignore tax).b. Assume, now, that the annual cost savings would vary according to the
following schedule:
Annual Cost Savings
Years 1–5 $ 75,000Years 6–10 100,000
Compute the payback period under the revised circumstances (ignore tax).
30. (Payback) John’s Clothing Store is considering a new product line: umbrellasand rain gear. The new product line would require an investment of $20,000in equipment and fixtures and $40,000 in working capital. Store managers ex-pect the following pattern of net cash inflows from the new product line overthe life of the investment.
a. Compute the payback period for the proposed new product line. If John’srequires a four-year pretax payback on its investments, should the companyinvest in the new product line? Explain. (continued)
Chapter 14 Capital Budgeting 641
b. Should John’s use any other capital project evaluation methods before mak-ing an investment decision? Explain.
31. (NPV) Seattle Fish Processing Company is considering the installation of an au-tomated product handling system. The initial cost of such a system would be$400,000. This system would generate labor cost savings over its 10-year lifeas follows:
Annual LaborYears Cost Savings
1–2 $70,0003–5 85,0006–8 86,4009–10 62,000
The system will have no salvage at the end of its 10-year life, and the com-pany uses a discount rate of 12 percent. What is the pretax net present valueof this potential investment?
32. (NPV) Atlanta Industrial has been approached by one of its customers aboutproducing 400,000 special-purpose parts for a new farm implement product.The parts would be required at a rate of 50,000 per year for eight years. Toprovide these parts, Atlanta Industrial would need to acquire several new pro-duction machines. These machines would cost $500,000 in total. The customerhas offered to pay Atlanta Industrial $50 per unit for the parts. Managers at At-lanta Industrial have estimated that, in addition to the new machines, the com-pany would incur the following costs to produce each part:
Direct labor $ 8Direct material 10Variable overhead 4
Total $22
In addition, annual fixed out-of-pocket costs would be $40,000. The new ma-chinery would have no salvage value at the end of its eight-year life. The com-pany uses a discount rate of 8 percent to evaluate capital projects.a. Compute the net present value of the machine investment (ignore tax).b. Based on the NPV computed in part (a), is the machine a worthwhile in-
vestment? Explain.c. Aside from the NPV, what other factors should Atlanta Industrial’s man-
agers consider when making the investment decision?
33. (PI) Texas Flooring is interested in purchasing a computer and software thatwould allow its salespeople to demonstrate to customers how a finished carpetinstallation would appear. Managers have estimated the cost of the computer,software, and peripheral equipment to be $30,000. Based on this cost, the man-agers have determined that the net present value of the investment is $5,000.Compute the profitability index of the investment (ignore tax).
34. (PI) The Omaha Transit Authority (OTA) is considering adding a new busroute. To add the route, OTA would be required to purchase a new bus, whichwould have a life of 10 years and cost $250,000. If the new bus is purchased,OTA managers expect that net cash inflows from bus ridership would rise by$44,000 per year for the life of the bus. The OTA uses an 8 percent requiredrate of return for evaluating capital projects. No salvage value is expected fromthe bus at the end of its life.a. Compute the profitability index of the bus investment (ignore tax).b. Should the OTA buy the new bus?c. What is the minimum acceptable value for the profitability index for an
investment to be acceptable?
Part 3 Planning and Controlling642
35. (IRR) Island Paradise is considering adding a new dock to its marina facilitiesto accommodate larger yachts. The facilities would cost $140,000 and wouldgenerate $18,200 annually in new cash inflows. The expected life of the facil-ities would be eight years, and there would be no expected salvage value. Thefirm’s cost of capital and discount rate are 10 percent.a. Calculate the internal rate of return for the proposed improvement (round
to the nearest whole percent; ignore tax).b. Based on your answer to part (a), should the company build the dock?c. How much annual cash inflow would be required for the project to be
minimally acceptable?
36. (Multiple methods) Indiana Furniture Mart is considering buying a delivery truckat a cost of $52,000. Presently, the store relies on a delivery service to deliverits products to area customers. The truck is expected to last six years and havea $7,500 salvage value. Annual operating savings (in delivery costs) are ex-pected to be $14,000 for each of the first two years, $11,000 for each of thenext two years, and $9,000 for the last two years. The company’s cost of cap-ital is 10 percent and this rate was set as the discount rate.a. Calculate the payback period (ignore tax).b. Calculate the net present value (ignore tax).c. Calculate the profitability index (ignore tax).
37. (Multiple methods) Toys for Big Boys is considering purchasing a robot to ap-ply shrink wrap packaging to some of its products. The robot will cost$2,300,000 and will produce annual labor and quality cost savings of $300,000.The robot is expected to last 11 years and have no salvage value. For this proj-ect answer the following questions.a. What is the payback period (ignore tax)?b. If Toys for Big Boys’ discount rate is 10 percent, what is the net present
value (ignore tax)?c. Using a 10 percent discount rate, what is the profitability index (ignore tax)?d. What is the internal rate of return (to the nearest percent) (ignore tax)?
38. (Depreciation) Kansas System Solutions operates consulting offices in threeMidwest locations. The firm is presently considering an investment in a newmainframe computer and communication software. The computer would cost$1,000,000 and have an expected life of eight years. For tax purposes, the com-puter can be depreciated using the straight-line method over five years. Nosalvage value is recognized in computing depreciation expense and no salvageis expected at the end of the life of the equipment. The company’s cost ofcapital is 10 percent and its tax rate is 35 percent.a. Compute the present value of the depreciation tax benefit if the company
uses the straight-line depreciation method.b. Compute the present value of the depreciation tax benefit assuming the
company uses the double declining balance method of depreciation witha five-year life.
c. Why is the depreciation tax benefit computed in part (b) larger than thatcomputed in part (a)?
39. (Alternative depreciation methods; NPV) Chicago Hydraulic is considering aninvestment in computer-based production technology as part of a businessreengineering process. The necessary equipment, installation, and training willcost $40,000,000, have a life of eight years, and generate annual net before-tax cash flows from operations of $8,400,000. The technology will have novalue at the end of its eight-year estimated life. The company’s tax rate is 30percent, and its cost of capital is 8 percent.a. If Chicago Hydraulic uses straight-line depreciation for tax purposes, is the
project acceptable using the net present value method? (continued)
Chapter 14 Capital Budgeting 643
b. Assume the tax law allows the company to take accelerated annual de-preciation on this asset in the following manner:
Years 1–2 23 percent of costYears 3–8 9 percent of cost
What is the net present value of the project? Is it acceptable?c. Recompute parts (a) and (b), assuming the tax rate is increased to 50
percent.
40. (Tax effects of asset sale) Delta Mechanical Systems purchased a material con-veyor system three years ago. Now, the company is going to sell the system andacquire more advanced technology. Data relating to this equipment follow:
Market value now $15,000Original cost 24,000Book value now, for tax purposes 8,000Book value now, for financial accounting purposes 15,000Corporate tax rate 40%
a. How much depreciation has been claimed on the conveyor system for taxpurposes? For financial accounting purposes?
b. What will be the after-tax cash flow from the sale of this asset?c. What will be the after-tax cash flow from the sale of the asset if its mar-
ket value is only $6,000?
41. (Project ranking) Two independent potential capital projects are under evalu-ation by Bird & Company. Project 1 costs $400,000, will last 10 years, and willprovide an annual annuity of after-tax cash flows of $85,000. Project 2 will cost$600,000, last 10 years, and provide an annual annuity of $110,000 in annualafter-tax cash flows.a. At what discount rate would management be indifferent between these
two projects?b. What is this indifference rate called?c. If the firm’s cost of capital is 10 percent, which project would be ranked
higher?
42. (Uncertain annual cash flow) Jones and Associates, CPAs, is considering theinstallation of a new system for electronically filing tax returns. The initial costof the system would be $25,000. The expected life of the technology is fiveyears.a. Given that the company’s cost of capital is 12 percent, how much annual
increase in cash flows is necessary to minimally justify the investment?b. Based on your answer to part (a), what would be the payback period for
this investment?
43. (Uncertain project life) Jake’s Exercise Products Inc. is evaluating a potentialinvestment project that would have an initial cost of $400,000 and will return$150,000 annually for six years. The company’s cost of capital is 9 percent. As-sume that the company is fairly certain regarding the initial cost and the an-nual return of $150,000, but uncertain as to how many years the $150,000 cashflows will be realized. How many years must the project generate cash flowsof $150,000 to be minimally acceptable (ignore tax)?
44. (Uncertain cash flow; uncertain discount rate) Quixote Wind Systems manu-factures wind-powered electricity generators. The company is considering in-vesting in new technology to allow storage of wind-generated power in bat-teries. Initial cost of the technology is expected to be $1,200,000. The investmentis expected to increase after-tax cash flows by $204,000 for 12 years. The com-pany uses its 9 percent cost of capital rate to discount cash flows for purposesof capital budgeting.
Part 3 Planning and Controlling644
a. What is the lowest acceptable annual cash flow that would allow this proj-ect to be considered acceptable (ignore tax)?
b. Assume the company is uncertain as to its actual cost of capital. What isthe maximum the company’s cost of capital could be (rounded to the near-est whole percent) and still allow this project to be considered acceptable(ignore tax)?
45. (Appendix 1) You have just invested $13,000 in a bank account that guaran-tees to pay you 12 percent interest, compounded annually. At the end of fiveyears, how much money will have accumulated in your investment account(ignore tax)?
46. (Appendix 1) You have just purchased a new car. Assume you made a downpayment of $8,000 and financed the balance of the purchase cost on an in-stallment credit plan. According to the credit agreement, you agreed to pay$1,200 per month for a period of 36 months. If the credit agreement was basedon a monthly interest rate of 1 percent, what was the cost of the car?
47. (Appendix 1) Use the tables in Appendix A to determine the answers to thefollowing questions.a. Elijah Santos wishes to have $50,000 in six years. He can make an invest-
ment today that will earn 8 percent each year, compounded annually. Whatamount of investment should he make to achieve his goal (ignore tax)?
b. Frederick Frazier is going to receive $200,000 on his 50th birthday, 15 yearsfrom today. Frederick has the opportunity to invest money today in agovernment-backed security paying 8 percent, compounded semiannually.How much would he be willing to receive today instead of the $200,000in 15 years (ignore tax)?
c. Marshall Dillon has $60,000 today that he intends to use as a down pay-ment on a house. How much money did Marshall invest 10 years ago tohave $60,000 now, if his investment earned 11 percent compounded an-nually (ignore tax)?
d. Pat Sawhack is the host of a television game show that gives away thou-sands of dollars each day. One prize on the show is an annuity, paid tothe winner, in equal installments of $210,000 at the end of each year forthe next five years. If the winner has an investment opportunity to earn 8percent, semiannually, what present amount would the winner take in ex-change for the annuity (ignore tax)?
e. Ginger is going to be paid modeling fees for the next 10 years as follows:year 1, $30,000; year 2, $50,000; year 3, $60,000; years 4–8, $100,000; year9, $70,000; and year 10, $45,000. Ginger can invest her money at 8 per-cent, compounded annually. What is the present value of her future mod-eling fees (ignore tax)?
f. Your friend has just won the lottery. The lottery will pay her $200,000 peryear for the next five years. If this is the only asset owned by your friend,is she a millionaire (one who has a net worth of $1,000,000 or more)? Ex-plain (ignore tax).
48. (Appendix 2) Allison Aftercare operates a rehabilitation center for individualswith physical disabilities. The company is considering the purchase of a newpiece of equipment that costs $750,000, has a life of five years, and has nosalvage value. The company depreciates its assets on a straight-line basis. Theexpected annual cash flow on a before-tax basis for this piece of equipmentis $250,000. Allison requires that an investment be recouped in less than fiveyears and have an accounting rate of return (pretax) of at least 18 percent.a. Compute the payback period and the accounting rate of return for this
piece of equipment (ignore taxes).b. Is the equipment an acceptable investment for Allison? Explain.
Chapter 14 Capital Budgeting 645
49. (Appendix 2; comprehensive) Kopy Korner is evaluating the purchase of a state-of-the-art desktop publishing system that costs $50,000. The company’s con-troller has estimated that the system will generate $16,000 of annual cash re-ceipts for six years. At the end of that time, the system will have no salvagevalue. The controller also has estimated that cash operating costs will be $2,000annually. The company’s tax rate is expected to be 35 percent during the lifeof the asset, and the company uses straight-line depreciation.a. Determine the annual after-tax cash flows from the project.b. Determine the after-tax payback period for the project.c. Determine the after-tax accounting rate of return for the project. (Assume
tax and financial accounting depreciation are equal.)
50. (Comprehensive) Hollywood Games operates a video arcade in the Lincoln Mall.The owner of Hollywood Games, Joe Lynch, is considering acquiring a new“centerpiece” video machine. The cost of the new equipment would be $60,000.The equipment would have an expected life of five years and no salvage value.Straight-line depreciation would be used for both financial and tax purposes.
Mr. Lynch expects the new machine to generate an additional $25,000 peryear in net, pretax cash flows. The cost of capital and tax rate for Mr. Lynchare 10 and 28 percent, respectively.a. Determine the after-tax cash flows from the new machine.b. Determine the net present value of the machine.c. Determine the accounting income of the machine.d. Determine the accounting rate of return and the payback period on an
after-tax basis.
51. (Technology acquisition) In 1996 General Motors announced that it was prepar-ing to invest $850 million to update its metal-stamping operations. The newmetal-stamping operations would be more flexible and less labor intensive thancurrent equipment. GM’s Metal Fabricating Division expected to reduce em-ployment of hourly workers by 30,000 and salaried workers by 4,000.
Much of the new investment would be spent on modern transfer presses.Unlike some of GM’s older presses, such units accept different dies, or forms forshaping sheet metal. As Japanese automakers proved, such flexible machineryis much more efficient, because it allows an auto maker to alter its productionmix to match what’s selling and to compensate for breakdowns.
SOURCE: Adapted from Rebecca Blumenstein, “GM to Spend $850 Million to Update Its Sheet-Metal Stamping Oper-ations,” The Wall Street Journal (May 21, 1996), p. A12.
a. Assume that the only justification for upgrading the metal-stamping ma-chinery is the labor costs to be saved; also, assume the average pay of the34,000 workers to be displaced by the upgraded machinery is $25,000.Compute the payback period for the upgrade project (ignore tax).
b. The two major financial dimensions of the upgrade project mentioned inthe news article were the initial cost of $850 million and the labor costsavings. Prepare a brief oral report in which you identify other cost sav-ings and other costs of the upgrade project.
52. (Change in investment assumption) Lenin’s Linen provides laundered items tovarious commercial and service establishments in a large metropolitan city.Lenin’s is scheduled to acquire new cleaning equipment in mid-2001 that shouldprovide some operating efficiencies. The new equipment would enable Lenin’sto increase the volume of laundry it handles without any increase in labor costs.In addition, the estimated maintenance costs in terms of pounds of laundrywould be reduced slightly with the new equipment.
The new equipment was justified on the basis not only of reduced cost butalso of expected increase in demand starting in late 2001. However, since theoriginal forecast was prepared, several potential new customers have either
Part 3 Planning and Controlling646
http://www.gm.com
delayed or discontinued their own expansion plans in the market area that isserviced by Lenin’s. The most recent forecast indicates that no great increasein demand can be expected until late 2002 or early 2003.
Identify and explain the factors that Lenin’s should consider in decidingwhether to delay the investment in the new cleaning equipment. In the pre-sentation of your response, distinguish between those factors that tend to in-dicate that the investment should be made as scheduled versus those that tendto indicate that the investment should be delayed. (CMA adapted)
53. (Links between short- and long-term operations) Drug companies rely on their re-search activities as the primary source of future revenues and profits. The capi-tal budget is the principal tool used to allocate resources to research activities.
In 1996 Merck & Co., a giant in the drug industry, unveiled a list of itsproducts in early development stages. The products included drugs to treatmajor maladies such as arthritis and cancer. Analysts who were present at theunveiling were unimpressed. Some of the analysts commented that it was notMerck’s long-term prospects that were in question; rather, “its short-term pipelinecontains no clear breakthroughs. That poses potential problems for the bottomline, because the company’s core products—cardiovascular drugs—face in-creasing competition, and several new drugs have fallen short of expectations.”
SOURCE: Adapted from Robert Langreth, “Drug Pipeline at Merck Gets Weak Review,” The Wall Street Journal (May22, 1996), p. B6.
Prepare a written report in which you explain how short-term operationsand plans are linked to long-term operations and plans. This report should bedirected at an audience that is expected to have little knowledge of formalbusiness planning systems. The major point to be explained in your report iswhy stock analysts would meet Merck’s announcement of an aggressive R&Dprogram with apathy because success of current operations is marginal.
54. (Capital budget) Find the home page of the Institute of Management Accoun-tants (IMA). From the home page, locate articles addressing the processes ofbudgeting. Among these materials is a discussion of the master budget and itscomponent budgets including the capital budget. Read these materials andwrite a summary of how the capital budget affects, and is affected by, the otherbudgets that comprise the master budget.
55. (Application of discounting methods) Several of the capital budgeting techniquespresented in this chapter depend on discounted cash flow concepts. These con-cepts are applied in business in a variety of settings. Select a business that relieson discounted cash flow analysis, such as a bond investor, and prepare an oralreport on how the firm applies discounting methods to manage the business.
56. (Application of discounting methods) In the opening and closing vignettes, thepoint is made that Amazon.com has a huge market value relative to its actualcash flows. Using the concept of net present value, discuss what investors mustbe expecting about the future of Amazon.com to rationalize the extraordinaryrelationship between current market value of the company and current cashflows.
57. (Application of discounting methods) In recent years, the stock price averages,e.g., Dow Jones Industrial average, have shown sensitivity to changes in inter-est rates. Based on your understanding of the factors that determine stock price,and how future cash flows are discounted, prepare a brief oral report in whichyou explain why stock prices should be sensitive to changes in interest rates.
58. (Product life-cycle applications) Different accounting and finance tools can beused to control costs as the product life cycle advances through its stages. Withthis thought in mind, discuss whether capital budgeting as a cost control toolwould be relatively more important to an established firm or a .com firm.
Chapter 14 Capital Budgeting 647
http://www.merck.com
Part 3 Planning and Controlling648
59. (Time line; payback; NPV) Black Hills Souvenir Show is considering expand-ing its building so it can stock additional merchandise for travelers and tourists.Store manager Allison Crowe anticipates that building expansion costs wouldbe $90,000. Although Ms. Crowe would need to invest in additional inven-tory, her suppliers are willing to provide inventory on a consignment basis.Annual incremental fixed cash costs for the store expansion are expected tobe as follows:
Ms. Crowe estimates that annual cash inflows could be increased by $120,000from the additional merchandise sales. The firm’s contribution margin is typi-cally 20 percent of sales. Because of uncertainty about the future, Ms. Crowedoes not want to consider any cash flows after eight years. The firm uses a10 percent discount rate.a. Construct a time line for the investment.b. Determine the payback period (ignore tax).c. Calculate the net present value of the project (ignore tax).
60. (Time line; payback; NPV) Fred’s Freightline is considering the purchase of anew van to replace an existing truck. The van would cost $35,000 and wouldhave a life of seven years with no salvage value at that time. The truck couldbe sold currently for $4,000; alternatively, if it is kept, it will have a remain-ing life of seven years with no salvage value. By purchasing the van, Fred’swould anticipate operating cost savings as follows:
Fred’s cost of capital and capital project evaluation rate is 12 percent.a. Construct a time line for the purchase of the van.b. Determine the payback period (ignore tax).c. Calculate the net present value of the van (ignore tax).
61. (Payback; IRR) Ted’s Bookkeeping Service prepares tax returns for individualsand small businesses. The firm employs four professional people in the taxpractice. Currently, all tax returns are prepared on a manual basis. The firm’sowner, Ted Moore, is considering purchasing a computer system that wouldallow the firm to service all its existing clients with only three employees. Toevaluate the feasibility of the computerized system, Ted has gathered the fol-lowing information:
P R O B L E M S
Initial cost of the hardware and software $32,000Expected salvage value in 4 years $0Annual depreciation $8,000Annual operating costs $4,500Annual labor savings $25,000Expected life of the computer system 4 years
Ted has determined that he will invest in the computer system if its pretaxpayback period is less than 3.5 years and its pretax IRR exceeds 12 percent.a. Compute the payback period for this investment. Does the payback meet
Ted’s criterion? Explain.b. Compute the IRR for this project to the nearest percent. Based on the com-
puted IRR, is this project acceptable to Ted?
62. (NPV; PI) Houston Storage provides warehousing services for industrial firms.Usual items stored include records, inventory, and waste items. The companyis evaluating more efficient methods of moving inventory items into and outof storage areas. One vendor has proposed to sell Houston Storage a conveyorsystem that would offer high-speed routing of inventory items. The requiredequipment would have an initial cost of $2,500,000 including installation. Thevendor has indicated that the machinery would have an expected life of sevenyears, with an estimated salvage value of $200,000. Below are estimates of theannual labor savings as well as the additional costs associated with the oper-ation of the new equipment:
a. Assuming the company’s cost of capital is 9 percent, compute the NPV ofthe investment in the conveyor equipment (ignore tax).
b. Based on the NPV, should the company invest in the new machinery?c. Compute the profitability index for this potential investment (ignore tax).d. What other factors should the company consider in evaluating this invest-
ment?
63. (NPV; PI; payback; IRR) Custom Driveways provides custom paving of side-walks and driveways for residential and commercial customers. One of themost labor-intensive aspects of the paving operation is the preparation andmixing of materials. Joe Click, corporate engineer, has learned of a new com-puterized technology to mix (and monitor mixing of) materials. According toinformation received by Mr. Click, the cost of the required equipment wouldbe $280,000, and the equipment would have an expected life of seven years.If purchased, the new equipment would replace manually operated equipment.Data relating to the old and new mixing equipment follow:
OLD TECHNOLOGY
Original cost $25,000Present book value $15,000Annual cash operating costs $75,000Current market value $6,000Market value in 7 years $0Remaining useful life 7 years
NEW TECHNOLOGY
Cost $280,000Annual cash operating costs $15,000Market value in 7 years $0Useful life 7 years
Chapter 14 Capital Budgeting 649
a. Assume that the cost of capital in this company is 12 percent, which is therate to be used in a discounted cash flow analysis. Compute the net pres-ent value and profitability index of investing in the new machine. Ignoretaxes. Should the machine be purchased? Why or why not?
b. Compute the payback period for the investment in the new machine. Ignoretaxes.
c. Rounding to the nearest whole percentage, compute the internal rate ofreturn for the machine investment.
64. (NPV; taxes) The manager of Crain Street Cold Storage is considering the in-stallation of a new refrigerated storage room. She has learned that the instal-lation would require an initial cash outlay of $780,000. The installation wouldhave an expected life of 20 years with no salvage value. The installation wouldincrease annual labor and maintenance costs by $75,000. The firm’s cost ofcapital is estimated to be 11 percent, and its tax rate is 30 percent. The stor-age room is expected to generate net annual cash revenues (before tax, labor,and maintenance costs) of $172,000.a. Using straight-line depreciation, calculate the after-tax net present value of
the storage room.b. Based on your answer to part (a), is this investment financially acceptable?
Explain.c. What is the minimum amount by which net annual cash revenues must
increase to make this an acceptable investment?
65. (After-tax cash flows; payback; NPV; PI; IRR) Forrester Fashions is consideringthe purchase of computerized clothes designing software. The software is ex-pected to cost $160,000, have a useful life of five years, and have a zero sal-vage value at the end of its useful life. Assume tax regulations permit the fol-lowing depreciation patterns for this asset:
Year Percent Deductible
1 202 323 194 155 14
The company’s tax rate is 30 percent, and its cost of capital is 8 percent. Thesoftware is expected to generate the following cash savings and cash expenses:
a. Prepare a time line presenting the after-tax operating cash flows.b. Determine the following on an after-tax basis: payback period, net present
value, profitability index, and internal rate of return.
66. (NPV; project ranking; risk) Florida Financial Consultants is expanding opera-tions, and the firm’s president, Ms. Hillary Rose, is trying to make a decisionabout new office space. The following are Ms. Rose’s options:
Maple Commercial Plaza 5,000 square feet; cost, $800,000; useful life, 10 years;salvage, $400,000
If the Maple Commercial Plaza is purchased, the company will occupy all ofthe space. If High Tower is purchased, the extra space will be rented for$620,000 per year. If purchased, either building will be depreciated on a straight-line basis. For tax purposes, the buildings would be depreciated assuming a25-year life. By purchasing either building, the company will save $210,000 an-nually in rental payments. All other costs of the two purchases (such as landcost) are expected to be the same. The firm’s tax rate is 40 percent.a. Determine the before-tax net cash flows from each project for each year.b. Determine the after-tax cash flows from each project for each year.c. Determine the net present value for each project if the cost of capital for
Florida Financial Consultants is 11 percent. Which purchase is the betterinvestment based on the NPV method?
d. Ms. Rose is concerned about the ability to rent the excess space in HighTower for the 10-year period. To compute the NPV for that portion of theproject’s cash flows, she has decided to use a discount rate of 20 percentto compensate for risk. Compute the NPV and determine which invest-ment is more acceptable.
67. (NPV; PI; IRR; Fisher rate) Scrooge Investments, which has a cost of capital of12 percent, is evaluating two mutually exclusive projects (A and B), whichhave the following projections:
Project A Project B
Investment $96,000 $160,000After-tax cash flows $25,600 $30,400Asset life 6 years 10 years
a. Determine the net present value, profitability index, and internal rate ofreturn for Projects A and B.
b. Using the answers to part (a), which is the more acceptable project? Why?c. What is the Fisher rate for the two projects?
68. (Capital rationing) Following are the capital projects being considered by themanagement of UpTown Productions:
Annual After-Tax Number ofProject Cost Cash Flows Years
Assume that all projects have no salvage value and that the firm uses a dis-count rate of 10 percent. Company management has decided that only$25,000,000 can be spent in the current year for capital projects.a. Determine the net present value, profitability index, and internal rate of
return for each of the seven projects.b. Rank the seven projects according to each method used in part (a).c. Indicate how you would suggest to the management of Uptown Production
that the money be spent. What would be the total net present value of yourselected investments?
69. (Sensitivity analysis) A 50-room motel is for sale in Houston and is being con-sidered by the Lone Star Motel Chain as an investment. The current ownersindicate that the occupancy of the motel averages 80 percent each day of theyear that the motel is open. The motel is open 300 days per year. Each room
Chapter 14 Capital Budgeting 651
rents for $75 per day, and variable cash operating costs are $10 per day thatthe room is occupied. Fixed annual cash operating costs are $100,000.
An acquisition price of $2,000,000 is being offered by Lone Star. The chainplans on keeping the motel for 14 years and then disposing of it. Because themarket for motels is so difficult to predict, Lone Star estimates the salvage valueto be zero at the time of disposal. Depreciation will be taken on a straight-line basis for tax purposes. In making the following computations, assume thatthere will be no tax consequences of the sale in 14 years. The chain’s tax rateis estimated at 35 percent for all years.a. Determine the after-tax net present value of the motel to Lone Star, as-
suming a cost of capital rate of 13 percent.b. What is the highest level that the discount rate can be and still allow this
project to be considered acceptable by Lone Star? If this discount rate ex-ceeds the highest rate shown in the table (20 percent), simply state thisfact and provide supporting computations and reasons.
c. How small can the net after-tax cash flows be and still allow the project tobe considered acceptable by Lone Star, assuming a cost of capital rate of 13percent?
d. What is the shortest number of years for which the net after-tax cash flowscan be received and still have the project be considered acceptable?
e. Assume that the answer to part (c) is $217,425. If all costs remain as theyare currently stated and the motel continues to stay open 300 days peryear, approximately how many rooms would have to be rented each nightto achieve this level of cash flows?
70. (Postinvestment audit) Ten years ago, based on a before-tax NPV analysis,Johnson Wholesaling decided to add a new product line. The data used in theanalysis were as follows:
Discount rate 12%Life of product line 10 yearsAnnual sales increase:
Years 1–4 $125,000Years 5–8 $175,000Years 9–10 $100,000
Annual fixed cash costs $20,000Contribution margin ratio 40%Cost of production equipment $125,000Investment in working capital $10,000Salvage value $0
Because the product line was discontinued this year, corporate managers de-cided to conduct a postinvestment audit to assess the accuracy of their plan-ning process. Accordingly, the actual cash flows generated from the productline were estimated to be as follows:
Actual InvestmentProduction equipment $120,000Working capital 17,500Total $137,500
Actual RevenuesYears 1–4 $110,000Years 5–8 $200,000Years 9–10 $105,000
Actual Fixed Cash CostsYears 1–4 $15,000Years 5–8 $17,500Years 9–10 $25,000
Actual contribution margin ratio 35%Actual salvage value $5,000Actual cost of capital 12%
Part 3 Planning and Controlling652
a. Determine the projected NPV on the product line investment.b. Determine the NPV of the project based on the postinvestment audit.c. Identify the factors that are most responsible for the differences between
the projected NPV and the postinvestment audit NPV.
71. (Appendix 2; payback; NPV) Caldwell Department Stores is a growing businessthat is presently considering adding a new product line. The firm would berequired by the manufacturer to incur setup costs of $1,600,000 to handle thenew product line. Caldwell has estimated that the product line would have anexpected life of eight years. Following is a schedule of revenues and annualfixed operating expenses (including $200,000 of annual depreciation on the in-vestment) associated with the new product line. Variable costs are estimatedto average 65 percent of revenues. All revenues are collected as earned. Allexpenses shown, except for the included amount of straight-line depreciation,are paid in cash when incurred.
The company has a cost of capital of 13 percent. Management uses this ratein discounting cash flows for evaluating capital projects.a. Calculate the accounting rate of return (ignore tax).b. Calculate the payback period (ignore tax).c. Calculate the net present value (ignore tax).
72. (Comprehensive; Appendix 2) The management of Custom Metalworks is eval-uating a proposal to purchase a new turning lathe as a replacement for a lessefficient piece of similar equipment that would then be sold. The cost of thenew lathe including delivery and installation is $700,000. If the equipment ispurchased, Custom Metalworks will incur $20,000 of costs in removing the pres-ent equipment and revamping service facilities. The present equipment has abook value of $400,000 and a remaining useful life of 10 years. Due to newtechnical improvements that have made the equipment outmoded, it presentlyhas a resale value of only $160,000.
Management has provided you with the following comparative manufac-turing cost tabulation:
Present Equipment New Equipment
Annual production in units 400,000 500,000Cash revenue from each unit $1.20 $1.20Annual costs:
Labor $120,000 $100,000Depreciation (10% of asset book value or cost) 40,000 70,000Other cash operating costs 192,000 80,000
Management believes that if the equipment is not replaced now, the companymust wait seven years before replacement is justified. The company uses a 12percent discount or hurdle rate in evaluating capital projects and expects allcapital project investments to recoup their costs within five years.
Both pieces of equipment are expected to have a negligible salvage valueat the end of 10 years.
Chapter 14 Capital Budgeting 653
a. Determine the net present value of the new equipment (ignore tax).b. Determine the internal rate of return on the new equipment (ignore tax).c. Determine the payback period for the new equipment (ignore tax).d. Determine the accounting rate of return for the new equipment (ignore tax).e. Determine whether the company should keep the present equipment or
purchase the new lathe.
Part 3 Planning and Controlling654
73. (Investment financing) HMG Corporation is a for-profit health-care providerthat operates three hospitals. One of these hospitals, Metrohealth, plans to ac-quire new X-ray equipment. Management has already decided the equipmentwill be cost beneficial and will enhance the technology available in the out-patient diagnostic laboratory. Before Metrohealth prepares the requisition tocorporate headquarters for the purchase, Paul Monden, Metrohealth’s controller,has to prepare an analysis to compare financing alternatives.
The equipment is a Supraimage X-ray 400 machine priced at $1,000,000,including shipping and installation; it would be delivered January 2, 2001.Under the tax regulations, this machine qualifies as “qualified technologicalequipment” with a five-year recovery period. It will be depreciated over fiveyears for tax purposes using the double-declining balance method, with aswitch to the straight-line method at a point in time to maximize the de-preciation deduction. The machine will have no salvage value at the end offive years. The three financing alternatives Metrohealth is considering aredescribed next.1. Finance Internally: HMG Corporation would provide Metrohealth with the
funds to purchase the equipment. The supplier would be paid on the dayof delivery.
2. Finance with a Bank Loan: Metrohealth could obtain a bank loan to fi-nance 90 percent of the equipment cost at 10 percent annual interest, withfive annual payments of $237,420 each due at the end of each year, withthe first payment due on December 31, 2001. The loan amortization sched-ule is presented next.
Metrohealth would provide the remaining $100,000, which would bepaid on delivery.
3. Lease from a Lessor: The equipment could be leased from MedLeasing, withan initial payment of $50,000 due on equipment delivery and five annualpayments of $220,000 each, commencing on December 31, 2001. At theoption of the lessee, the equipment can be purchased at the fair marketvalue at lease termination (the lessor is currently estimating a 30 percentsalvage value).
The lease satisfies the requirements to be an operating lease for bothFASB and income tax purposes. This means that all lease payments aredeductible for tax purposes each year. Because of expected technologicalchanges in medical equipment, Metrohealth would not plan to purchasethe X-ray equipment at the end of the lease commitment.
C A S E S
Both HMG Corporation and Metrohealth have an effective income taxrate of 40 percent, an incremental borrowing rate of 10 percent, and anafter-tax corporate hurdle rate of 12 percent. Income taxes are paid at theend of the year.
a. Prepare a present value analysis as of January 1, 2001, of the expected after-tax cash flows for each of the three financing alternatives available to Metro-health to acquire the new X-ray equipment. As part of your present valueanalysis, (1) justify the discount rates you used and (2) identify the financ-ing alternative most advantageous to Metrohealth.
b. Discuss the qualitative factors Paul Monden should include for manage-ment consideration before a final decision is made regarding the financ-ing of this new equipment. (CMA adapted)
74. (NPV) Michigan Motor Company is considering a proposal to acquire new man-ufacturing equipment. The new equipment has the same capacity as the cur-rent equipment but will provide operating efficiencies in direct and indirect la-bor, direct material usage, indirect supplies, and power. Consequently, thesavings in operating costs are estimated to be $150,000 annually.
The new equipment will cost $300,000 and will be purchased at the be-ginning of the year when the project is started. The equipment dealer is cer-tain that the equipment will be operational during the second quarter of theyear it is installed. Therefore, 60 percent of the estimated annual savings canbe obtained in the first year. Michigan Motor will incur a one-time expense of$30,000 to transfer the production activities from the old equipment to the newequipment. No loss of sales will occur, however, because the plant is largeenough to install the new equipment without disrupting operations of the cur-rent equipment. The equipment dealer states that most companies use a 4-yearlife when depreciating this equipment.
The current equipment has been fully depreciated and is carried in the ac-counts at zero book value. Management has reviewed the condition of the cur-rent equipment and has concluded that it can be used an additional four years.Michigan Motor would receive $5,000 net of removal costs if it elected to buythe new equipment and dispose of its current equipment at this time.
Michigan Motor currently leases its manufacturing plant. The annual leasepayments are $60,000. The lease, which will have four years remaining whenthe equipment installation would begin, is not renewable. Michigan Motorwould be required to remove any equipment in the plant at the end of thelease. The cost of equipment removal is expected to equal the salvage valueof either the old or the new equipment at the time of removal.
The company uses the sum-of-the-years’-digits depreciation method fortax purposes. A full-year’s depreciation is taken in the first year an asset isput into use.
The company is subject to a 40 percent income tax rate and requires anafter-tax return of at least 12 percent on an investment.a. Calculate the annual incremental after-tax cash flows for Michigan Motor
Company’s proposal to acquire the new manufacturing equipment.b. Calculate the net present value of Michigan Motor’s proposal to acquire the
new manufacturing equipment using the cash flows calculated in part (a) andindicate what action Michigan Motor’s management should take. Assume allrecurring cash flows occur at the end of the year. (CMA adapted)
75. (Postinvestment audit) Smyth Brothers Inc. has formal policies and proceduresto screen and approve capital projects. Proposed capital projects are classifiedas one of the following types:1. Expansion requiring new plant and equipment2. Expansion by replacement of present equipment with more productive
equipment3. Replacement of old equipment with new equipment of similar quality
Chapter 14 Capital Budgeting 655
All expansion projects and replacement projects that will cost more than $50,000must be submitted to the top management capital investment committee forapproval. The investment committee evaluates proposed projects consideringthe costs and benefits outlined in the supporting proposal and the long-rangeeffects on the company.
The projected revenue and/or expense effects of the projects, once oper-ational, are included in the proposal. Once a project is accepted, the commit-tee approves an expenditure budget for the project from its inception until itbecomes operational. The expenditures required each year for the expansionsor replacements are also incorporated into Smyth Brothers’ annual budget pro-cedure. The budgeted revenue and/or cost effects of the projects, for the pe-riods in which they become operational, are incorporated into the five-yearforecast.
Smyth Brothers Inc. does not have a procedure for evaluating projects oncethey have been implemented and become operational. The vice president offinance has recommended that Smyth Brothers establish a postcompletion au-dit program to evaluate its capital expenditure projects.a. Discuss the benefits a company could derive from a postcompletion audit
program for capital expenditure projects.b. Discuss the practical difficulties in collecting and accumulating informa-
tion that would be used to evaluate a capital project once it becomesoperational. (CMA adapted)
Part 3 Planning and Controlling656
76. Traditionally, capital budgeting in health care has tended to focus on pro-jected financial returns from investments. To justify the commitment of capitalresources, a proposed investment must be shown to provide sufficient benefitsin the form of additional revenues or reduced expenses. A hospital, for exam-ple, might invest in an automated drug-dispensing system if forecasted savingsfrom reduced labor and supplies are greater than the initial outlay for the equip-ment. Present-value calculations are used to weigh immediate costs againsteventual benefits over the life of an investment.
This approach, however, discourages strategic investments in areas wherelong-term benefits are difficult to measure in financial terms, such as investingin healthcare technologies to improve quality of care or patient satisfaction. Up-grading diagnostic equipment, for example, may be seen as a way to enhancerevenues over the long term based on the rationale that patients and physiciansare drawn to healthcare organizations that demonstrate a commitment to pro-viding high-quality care. The problem with such an investment from a tradi-tional capital-budgeting perspective is that it is difficult to predict when this ben-efit will occur or how large it will be. Similarly, capital investments whoseobjectives are to attract physicians or boost an organization’s market share even-tually may increase revenues or reduce costs, but are hard to justify solely interms of short-term financial benefits.
SOURCE: Catherine E. Kleinmuntz and Don N. Kleinmuntz, “A Strategic Approach to Allocating Capital in HealthcareOrganizations,” Healthcare Financial Management (April 1999), p. 52.
a. Assume, as the article states, that health-care entities tend to not invest instrategic investments in areas where long-term benefits are difficult to meas-ure in financial terms. Should these firms invest in certain assets even ifthey cannot measure the outcomes financially? Explain.
b. As an accountant, how could you contribute to the quality of investmentanalysis of a health-care provider?
R E A L I T Y C H E C K
77. In February 1996, the German firm, Jos. L. Meyer GmbH was negotiating forthe right to build ships in the United States. The family-owned German ship-builder, which specializes in cruise ships, gas tankers and other complex, labor-intensive vessels would employ as many as 2,000 workers at the U.S. shipyardwhere wages and benefit rates would be significantly lower than in Germany.
Under the plan being negotiated, Meyer Werft (as the company is known)would invest $60 million in the Philadelphia yard and seek additional privateand public funding of about $300 million. The money would be used to encloseone of the yard’s huge drydocks and to fund worker retraining and facilityimprovements.
SOURCE: Adapted from Daniel Machalaba, “Germany’s Meyer Werft Seeks to Build Ships at Philadelphia’s Naval Yard,”The Wall Street Journal (February 16, 1996), p. A4.
a. For labor-intensive operations, such as shipbuilding, how would labor qual-ity considerations affect capital budgeting (and location) decisions of firmswith global operations?
b. In addition to labor rates, what other factors might be considered in globalfirms’ location decisions for new capital investment?
78. In the United States, companies generally respond to economic downturns byreducing spending on capital projects. A frequently observed strategy is todelay investment in new capital projects and products and to cut spendingon research and development activities, advertising, and customer-serviceactivities.a. In economic downturns how can companies cut costs and activities with-
out affecting quality or service?b. What are the likely effects of short-term cost-cutting strategies such as those
outlined above on long-term profitability and quality control?
79. Dial Corp., a one-time bus company that in 1996 sold everything from soapto nuts, said it would separate into consumer products and services concerns,splitting a company with about $3 billion in current stock market value.
The Phoenix-based company’s consumer businesses, with revenue in 1995of about $1.3 billion, would continue to operate under the Dial name. Its diverseairline-catering, convention, travel and money-order businesses, among others,would operate as a separate, as-yet-unnamed unit that in 1995 had revenueof about $2.2 billion.
Dial joined a host of U.S. companies that decided that the sum of the partsis worth more than the whole. Companies that announced or completed spin-offs include AT&T Corp., ITT Corp., Minnesota Mining & Manufacturing Co.,Dun & Bradstreet Corp., and Melville Corp. The stocks of companies that announcespin-offs outperform the overall stock market, according to a J.P. Morgan & Co.study.
SOURCE: Adapted from Steven Lipin, “Dial to Split into Two Companies,” The Wall Street Journal (February 16, 1996),p. A3.
a. The conglomerate form of business is perhaps the most difficult to man-age in terms of directing new capital investments. Spin-offs can be likenedto “undoing” a prior capital investment in a business. What ethical obliga-tion do managers of conglomerates have to stockholders in the event that ahigher stock price could be obtained if a business was spun off rather thanheld?
b. What obligation do managers have to employees who are affected byspin-offs?
80. Although they should be considered independently, often the investing andfinancing decisions are considered together.
It’s easy to understand the allure of auto leasing: Consumers make lowermonthly payments; dealers gain volume, move expensive inventory—and keepcustomers. So it’s not surprising to find that one of every three new cars on theroad today is leased.
The truth is, dealers have profited more from leasing than from selling. AnAtlanta-based leasing expert says, “On a sale a dealer makes about $1,200 to$1,500 in profit. On a lease, it might be $2,500 or $3,000.” That’s fine, he notes,“unless it’s done deceptively.”
SOURCE: Deanna Oxender Burgess, “Buy or Lease: The Eternal Question,” Journal of Accountancy (April 1999), p. 25.Reprinted with permission from the Journal of Accountancy. Copyright (2000) by American Institute of CPAs. Opinionsof the authors are their own and do not necessarily reflect policies of the AICPA.
Complex lease contracts combined with hidden costs complicate the de-cision to lease or buy. Only recently have key lease terms such as the cost ofthe car been disclosed to consumers. Laws in a handful of states, as well asFederal Reserve Board Regulation M, which became effective in October 1997,and leasing data available on the Internet are prompting dealers to make in-creased disclosures. Unfortunately, some fees, including the interest rate thedealer uses to calculate the lease payment, known in the industry as the moneyfactor, still remain unknown to the consumer.a. Discuss why some consumers might find leasing a car to be more ap-
pealing than purchasing one.b. Even if not required by law, is the practice of not disclosing lease infor-
mation ethical? Discuss.c. As an accountant, how could you aid a client in a car-buying situation?