26
2
Energy market overview
CPFL Energia – Highlights and Results
Summary
3
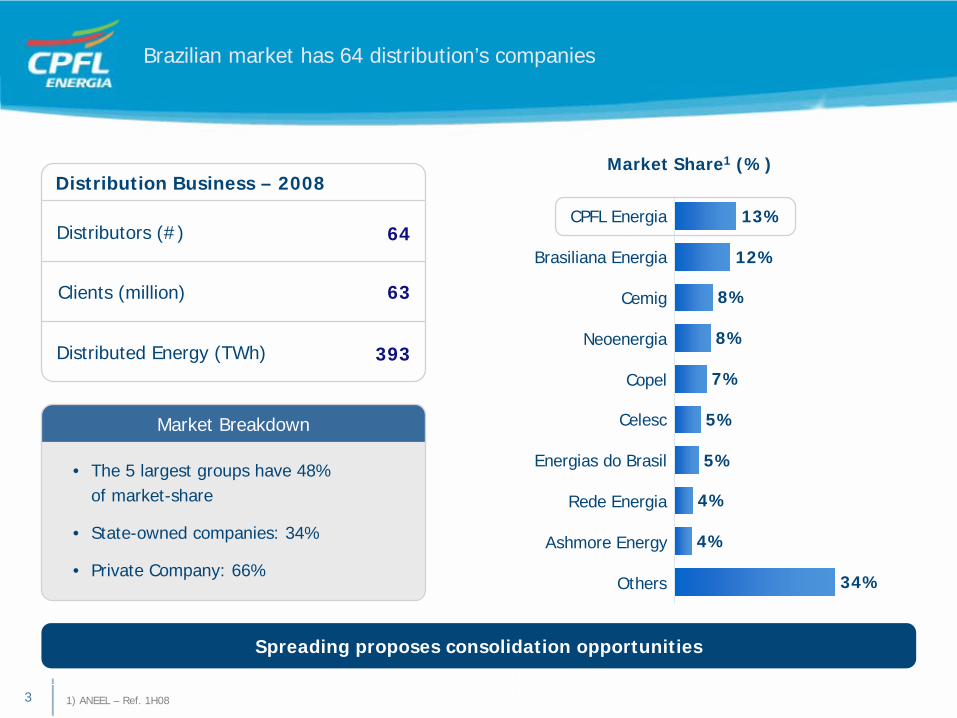
13%
12%
8%
8%
7%
5%
5%
4%
4%
34%
CPFL Energia
Brasiliana Energia
Cemig
Neoenergia
Copel
Celesc
Energias do Brasil
Rede Energia
Ashmore Energy
Others
Market Share1 (%)
1) ANEEL – Ref. 1H08
Brazilian market has 64 distribution’s companies
Distribution Business – 2008
Distributors (#) 64
63Clients (million)
Distributed Energy (TWh) 393
Market Breakdown
• The 5 largest groups have 48%of market-share
• State-owned companies: 34%
• Private Company: 66%
Spreading proposes consolidation opportunities
4
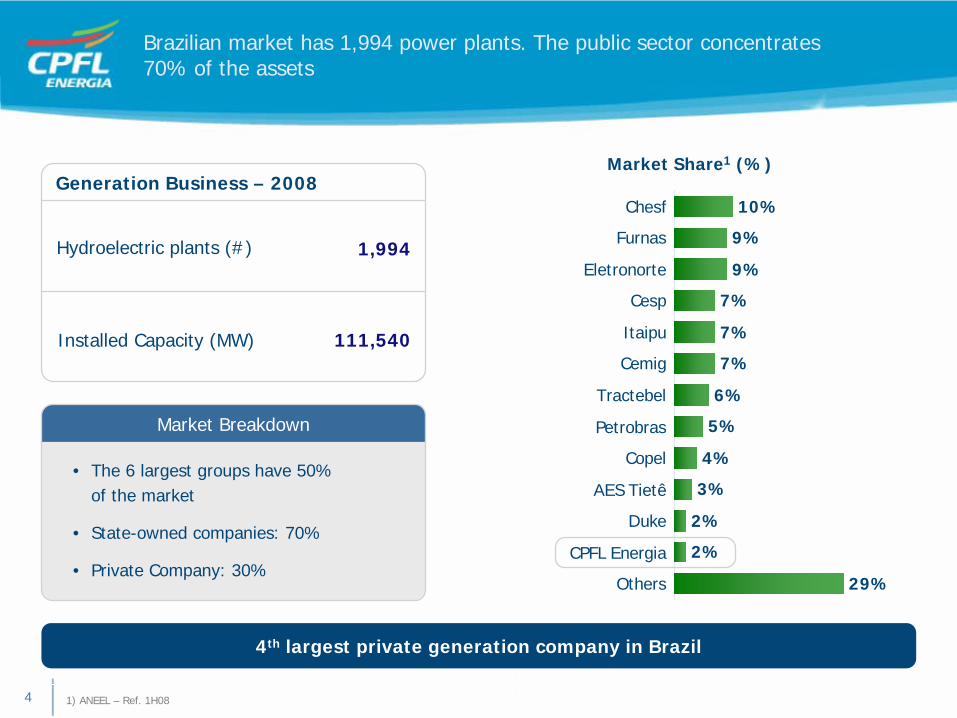
Market Share1 (%)
1) ANEEL – Ref. 1H08
Brazilian market has 1,994 power plants. The public sector concentrates 70% of the assets
Generation Business – 2008
Hydroelectric plants (#) 1,994
111,540Installed Capacity (MW)
Market Breakdown
• The 6 largest groups have 50% of the market
• State-owned companies: 70%
• Private Company: 30%
4th largest private generation company in Brazil
10%
9%
9%
7%
7%
7%
6%
5%
4%
3%
2%
2%
29%
Chesf
Furnas
Eletronorte
Cesp
Itaipu
Cemig
Tractebel
Petrobras
Copel
AES Tietê
Duke
CPFL Energia
Others
5
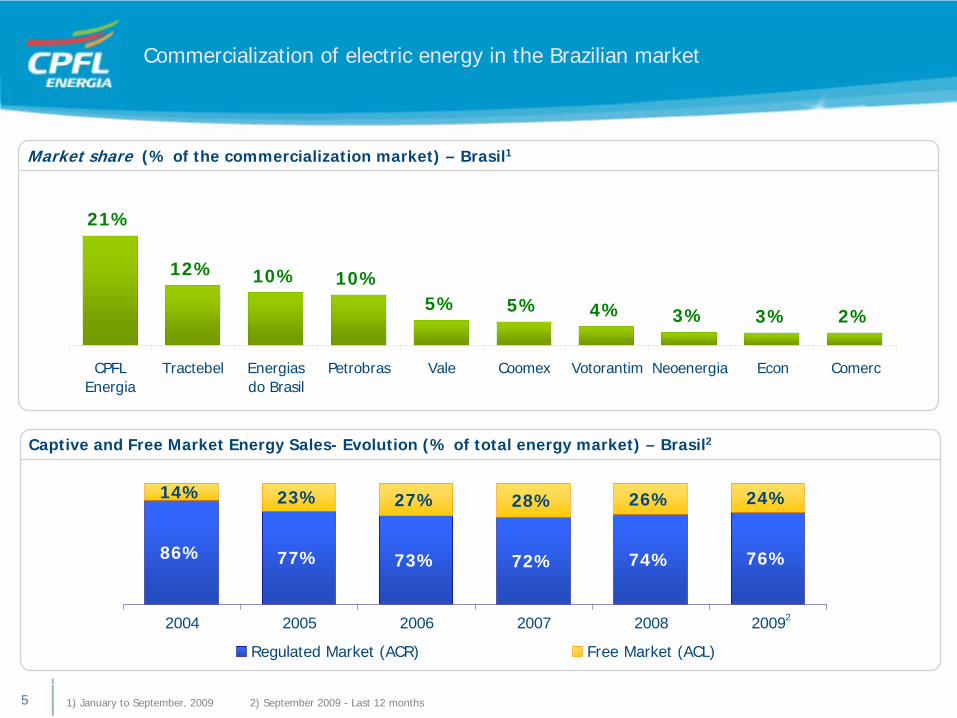
86% 77% 73% 72% 74% 76%
14% 23% 27% 28% 26% 24%
2004 2005 2006 2007 2008 2009
Regulated Market (ACR) Free Market (ACL)
2
Captive and Free Market Energy Sales- Evolution (% of total energy market) – Brasil2
Market share (% of the commercialization market) – Brasil1
21%
12% 10% 10%5% 5% 4% 3% 3% 2%
CPFLEnergia
Tractebel Energiasdo Brasil
Petrobras Vale Coomex Votorantim Neoenergia Econ Comerc
1) January to September, 2009 2) September 2009 - Last 12 months
Commercialization of electric energy in the Brazilian market
5
6
Energy market overview
CPFL Energia – Highlights and Results
Summary
7
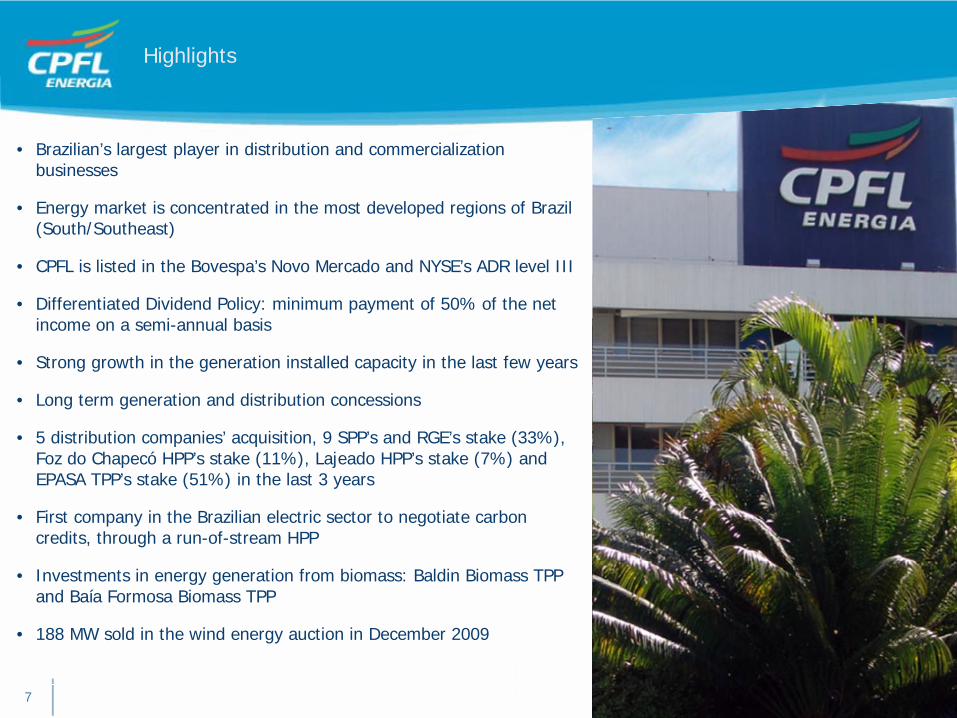
• Brazilian’s largest player in distribution and commercializationbusinesses
• Energy market is concentrated in the most developed regions of Brazil (South/Southeast)
• CPFL is listed in the Bovespa’s Novo Mercado and NYSE’s ADR level III
• Differentiated Dividend Policy: minimum payment of 50% of the net income on a semi-annual basis
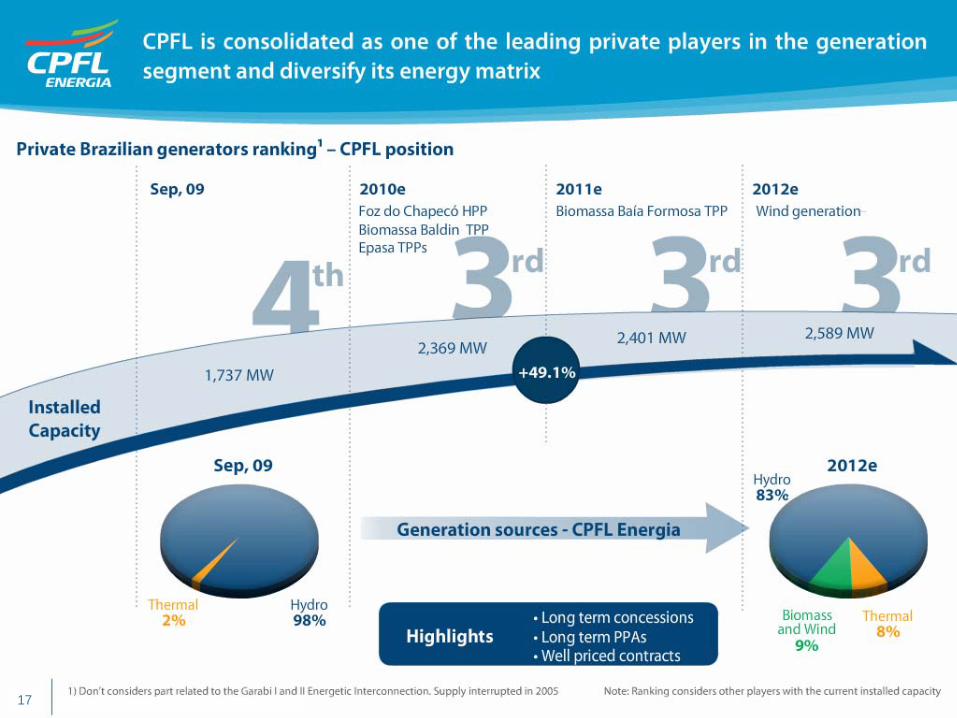
• Strong growth in the generation installed capacity in the last few years
• Long term generation and distribution concessions
• 5 distribution companies’ acquisition, 9 SPP’s and RGE’s stake (33%), Foz do Chapecó HPP’s stake (11%), Lajeado HPP’s stake (7%) and EPASA TPP’s stake (51%) in the last 3 years
• First company in the Brazilian electric sector to negotiate carbon credits, through a run-of-stream HPP
• Investments in energy generation from biomass: Baldin Biomass TPP and Baía Formosa Biomass TPP
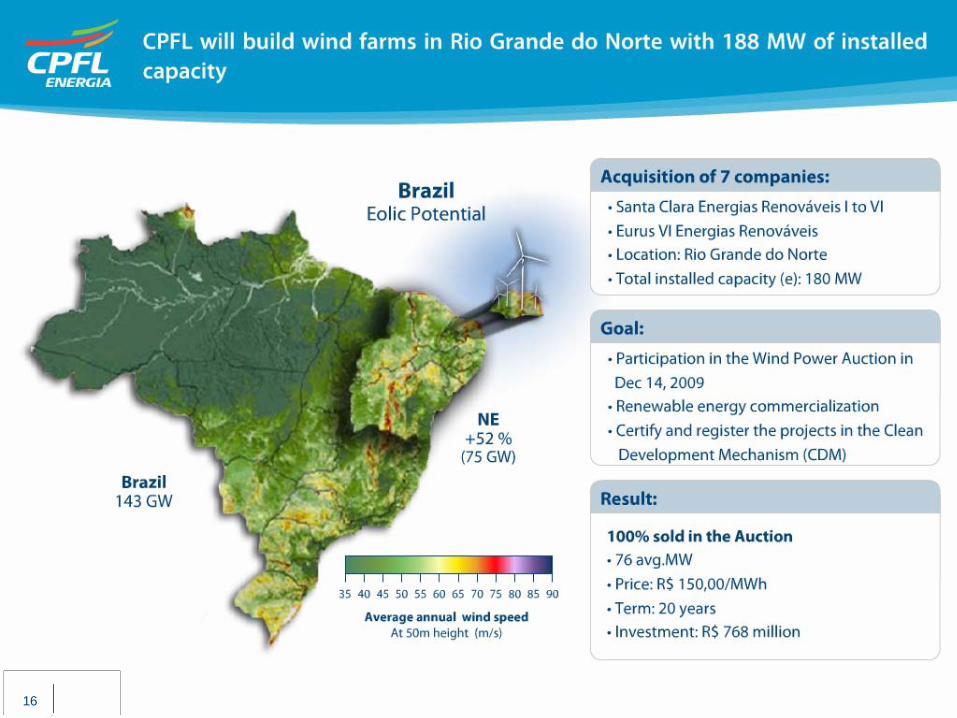
• 188 MW sold in the wind energy auction in December 2009
Highlights
88
9 1) TUSD + Captive (Excludes CCEE sales) - LTM
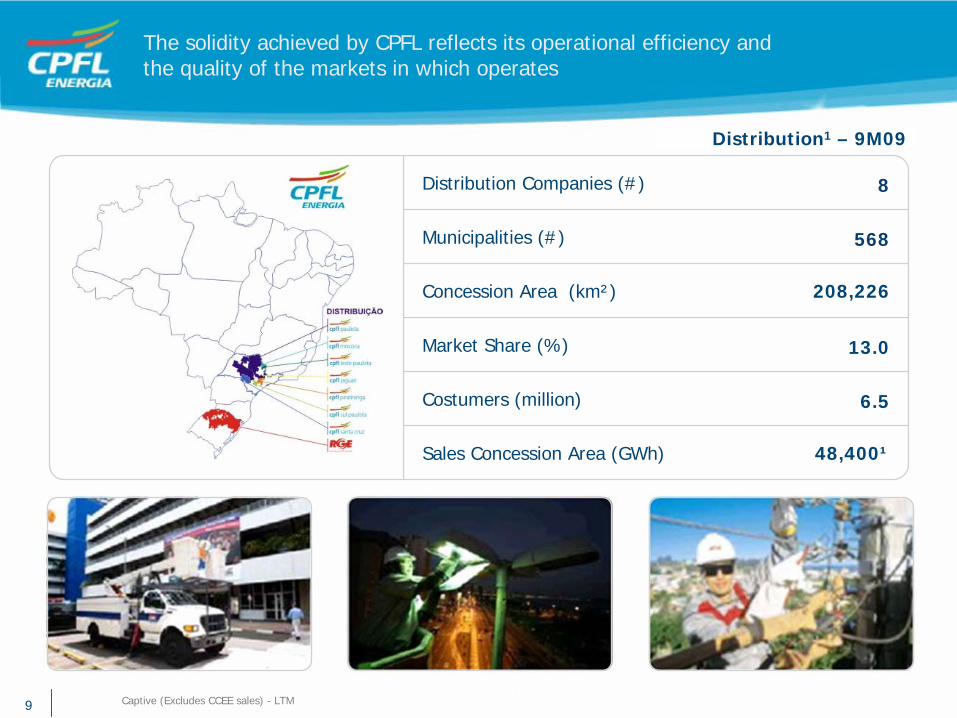
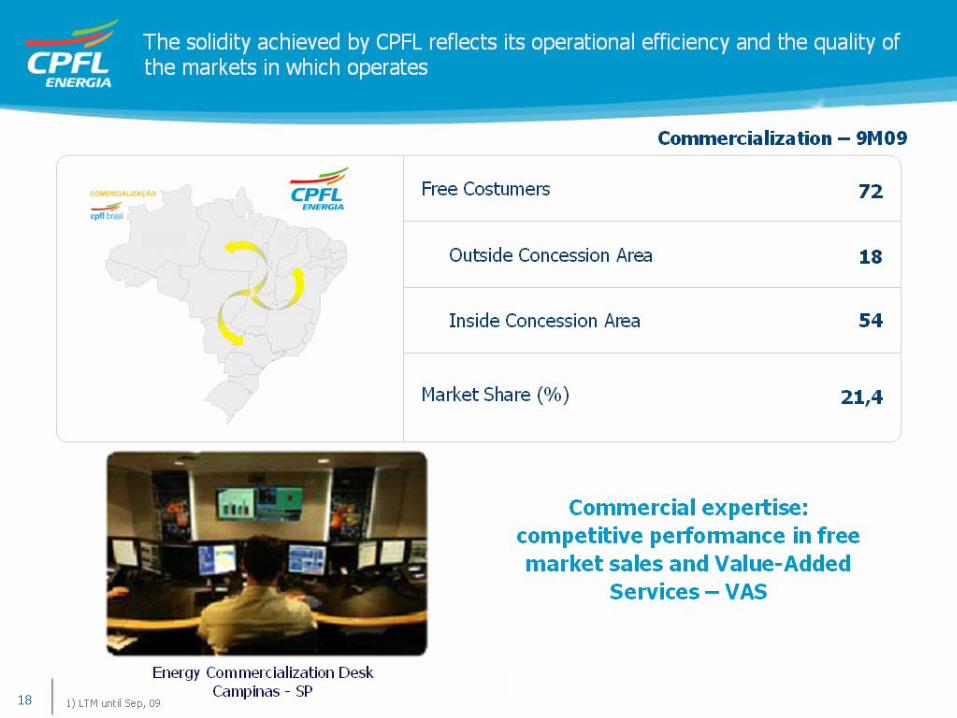
The solidity achieved by CPFL reflects its operational efficiency and the quality of the markets in which operates
Distribution1 – 9M09
48,400¹Sales Concession Area (GWh)
6.5Costumers (million)
13.0Market Share (%)
208,226Concession Area (km²)
568Municipalities (#)
8Distribution Companies (#)
9
10
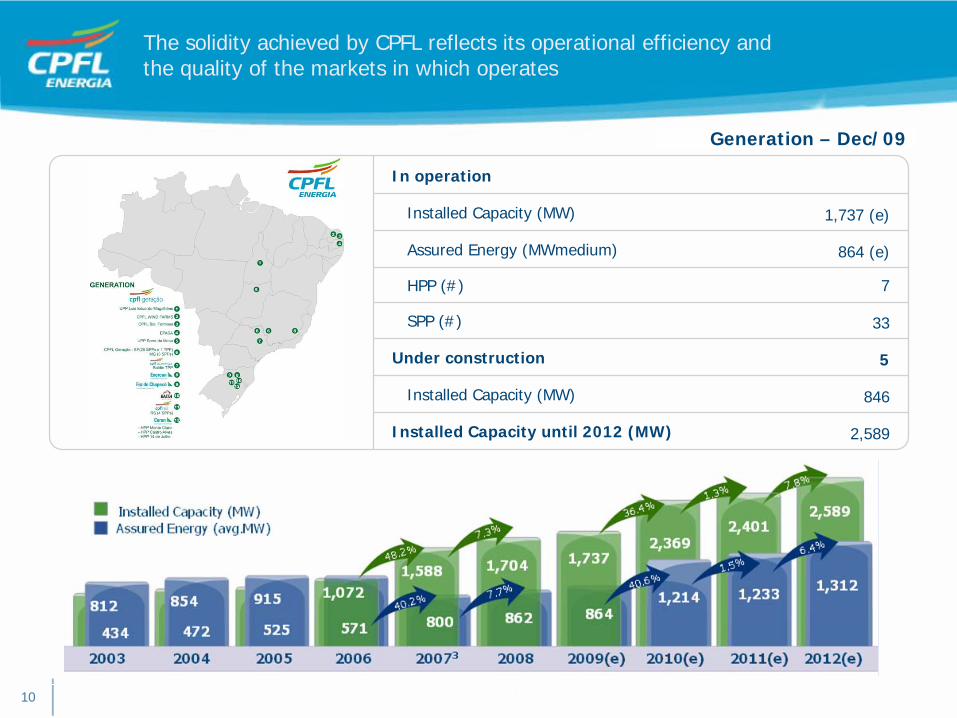
The solidity achieved by CPFL reflects its operational efficiency and the quality of the markets in which operates
2,589Installed Capacity until 2012 (MW)
846Installed Capacity (MW)
In operation
5Under construction
33SPP (#)
7HPP (#)
864 (e)Assured Energy (MWmedium)
1,737 (e)Installed Capacity (MW)
Generation – Dec/09
11
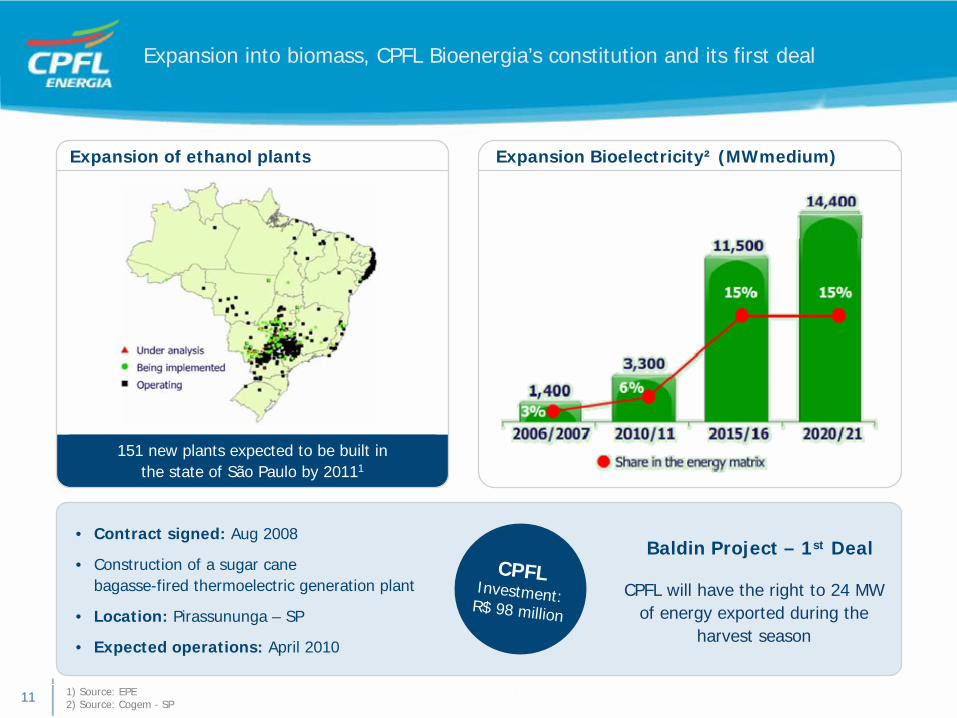
• Contract signed: Aug 2008
• Construction of a sugar cane bagasse-fired thermoelectric generation plant
• Location: Pirassununga – SP
• Expected operations: April 2010
CPFLInvestment:R$ 98 million
CPFL will have the right to 24 MW of energy exported during the
harvest season
Baldin Project – 1st Deal
1) Source: EPE2) Source: Cogem - SP
Expansion Bioelectricity² (MWmedium) Expansion of ethanol plants
Expansion into biomass, CPFL Bioenergia’s constitution and its first deal
151 new plants expected to be built inthe state of São Paulo by 20111

1212
1313
1414
1515
1616
1717
1818
1919
20
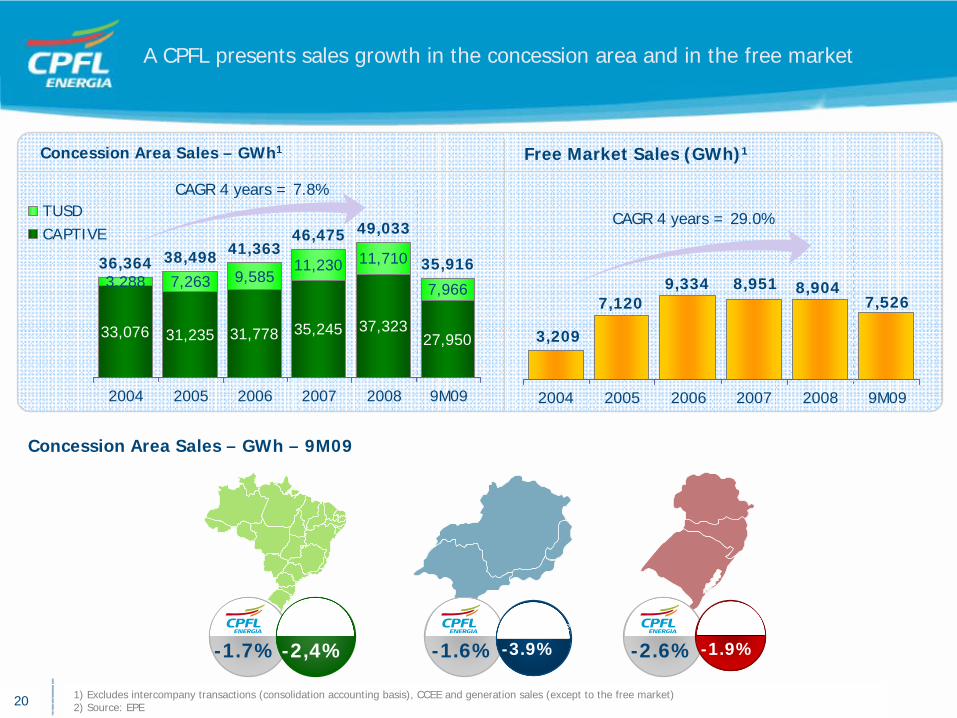
A CPFL presents sales growth in the concession area and in the free market
27,95033,076 31,235 37,32335,24531,778
7,966
11,7103,288
11,2309,5857,263
35,916
49,033
38,49836,364
46,47541,363
2004 2005 2006 2007 2008 9M09
TUSDCAPTIVE
7,5268,9048,9519,334
7,120
3,209
2004 2005 2006 2007 2008 9M09
Concession Area Sales – GWh1 Free Market Sales (GWh)1
CAGR 4 years = 7.8%
CAGR 4 years = 29.0%
1) Excludes intercompany transactions (consolidation accounting basis), CCEE and generation sales (except to the free market)2) Source: EPE
Concession Area Sales – GWh – 9M09
2020 1) Excludes intercompany transactions (consolidation accounting basis), CCEE and generation sales (except to the free market)2) Source: EPE
-1.7% -2,4%Brazil2
-1.6% -3.9%Southeast2
-2.6% -1.9%South2
21
279
861
1,276
1,6411,404
1,021
2004 2005 2006 2007 2008 9M09
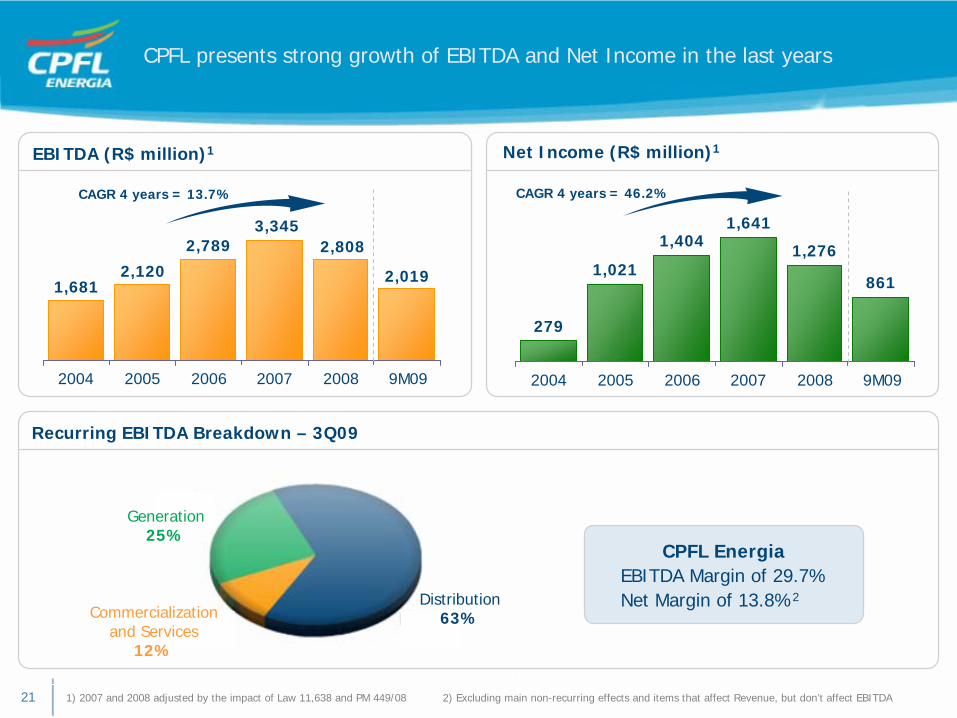
EBITDA (R$ million)1 Net Income (R$ million)1
2,019
2,8083,345
2,789
2,1201,681
2004 2005 2006 2007 2008 9M09
CAGR 4 years = 46.2%
Recurring EBITDA Breakdown – 3Q09
CAGR 4 years = 13.7%
1) 2007 and 2008 adjusted by the impact of Law 11,638 and PM 449/08 2) Excluding main non-recurring effects and items that affect Revenue, but don’t affect EBITDA
CPFL presents strong growth of EBITDA and Net Income in the last years
CPFL Energia EBITDA Margin of 29.7%Net Margin of 13.8%2
Commercializationand Services
12%
Distribution63%
Generation25%
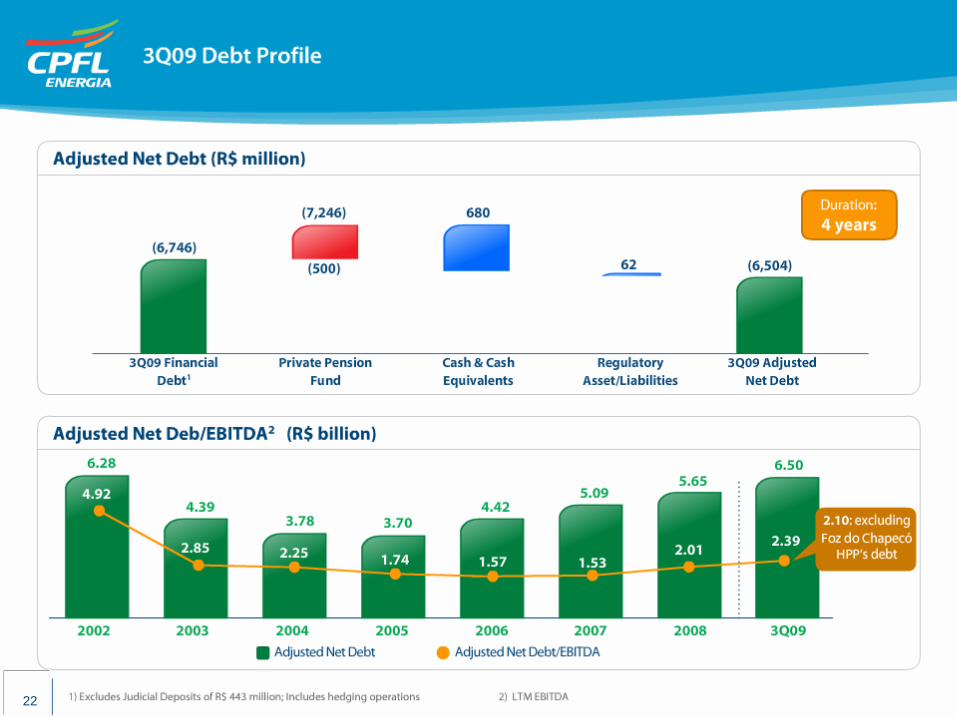
2222
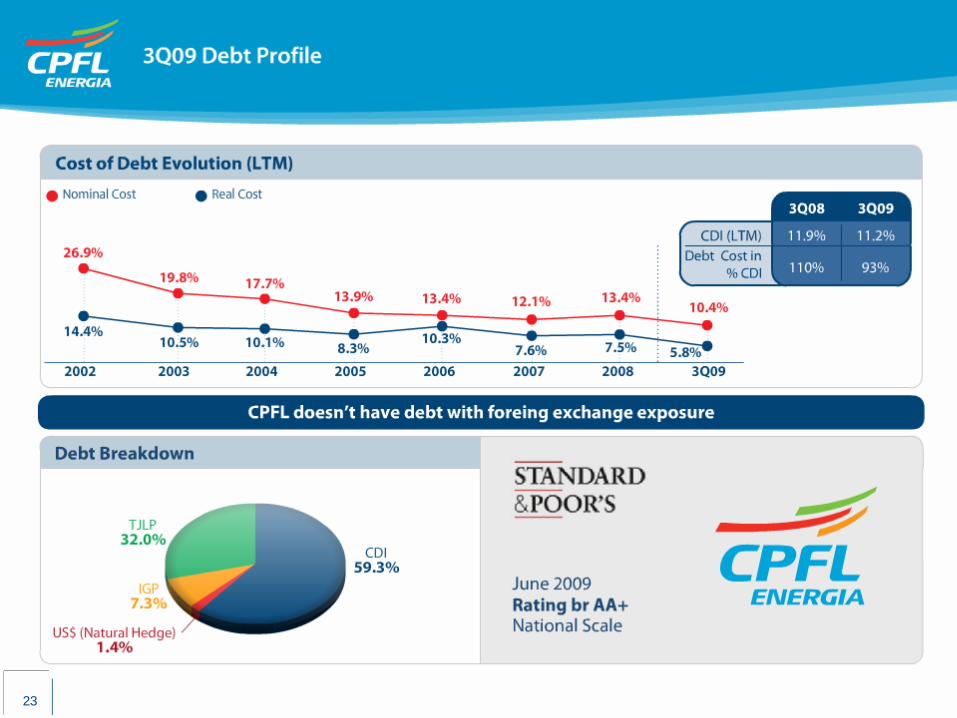
2323
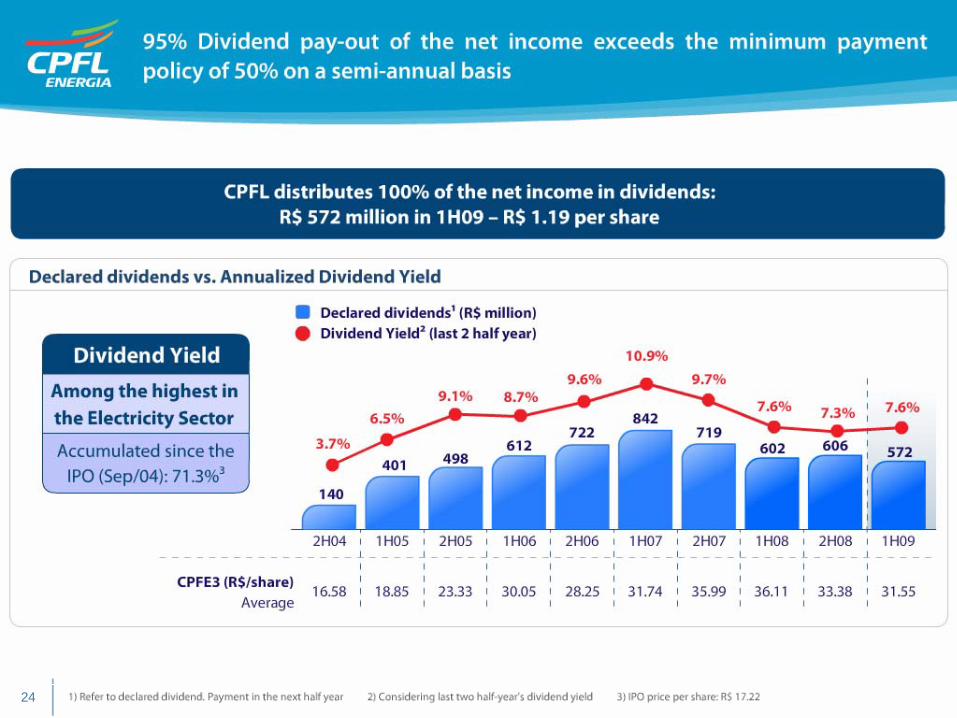
24
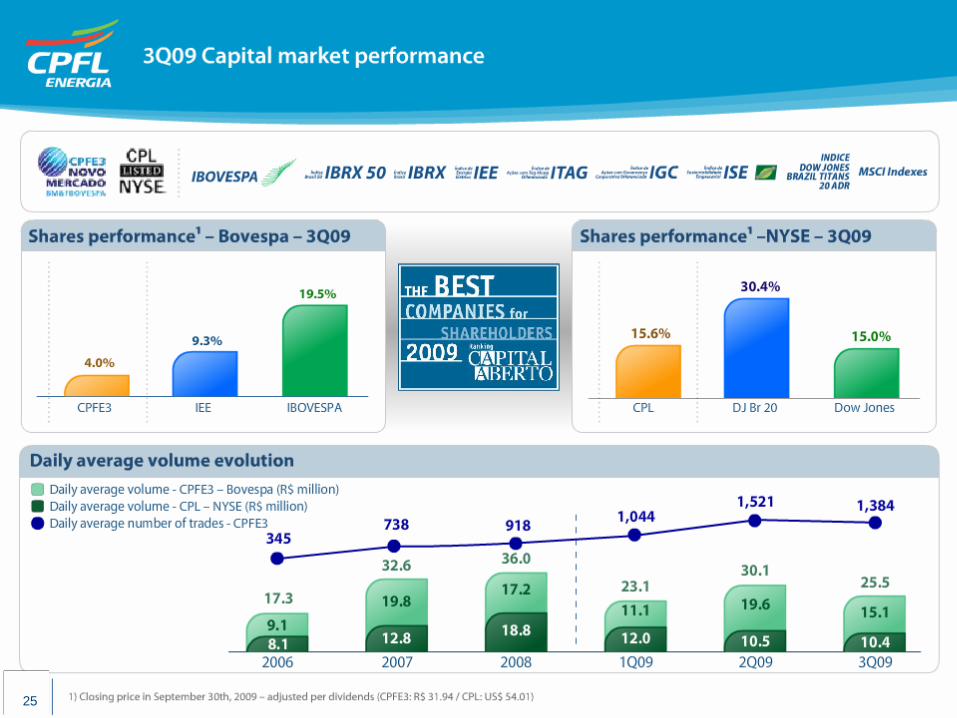
2525


