Abstract—Non-imaging sensors offer low power and longlasting solutions for perimeter, border crossing, and forwardoperating base protection. In this paper, we study the utilityof acoustic, seismic, and ultrasonic transducers for detectionand identification of people and animals. Various algorithmswill be developed for them, which are computationally lessintensive and amenable to implement on sensor network. Weidentify the physics-based phenomenology associated with thetargets and the features selected for classification are based onthe phenomenology. We fuse the results from various sensormodalities to achieve higher probability of correct classification.
Keywords: Personnel detection, sensor fusion, phe-nomenology, acoustic, seismic and ultrasonic.
I. INTRODUCTION
Personnel detection deals with the prevention, detection, andresponse to unauthorized persons from crossing an establishedperimeter [1]. It is required in a variety of military andcivilian situations. Personnel detection is an important aspectof intelligence, surveillance, and reconnaissance (ISR). It playsa vital role in perimeter and camp protection and in curtailingillegal border crossings by people from neighboring countries,to name few [2] [3]. All these applications involve deploymentof sensors for a prolonged time and often camouflaged to avoiddiscovery by others. Due to the low power requirement, thesensors used consist of non-imaging sensors such as acoustic,seismic, magnetic, E-field, passive infrared, ultrasonic, andradar. If imaging sensors are used, they are used to take asnapshot of the target to corroborate the findings by othermodalities. In this paper, we consider a subset of the sensorslisted above, namely, acoustic, seismic [4] [5] [8], and ultra-sonic sensors [6] [7]. It will be clear throughout the paper thatthese three sensors are adequate to detect and identify peopleand distinguish them from other targets such as animals.However, no single sensor is adequate for the job. Fusion of theoutputs or features from these sensors is the key for detectionand classification with high confidence.
Detection and classification of any target should be ap-proached via phenomenology of the target and sensor’s abilityto capture the phenomenology properly. This implies that thecharacteristics of the sensor should be adequate to capturethe phenomenon being observed. For example, using a micro-phone with 1 kHz bandwidth will not do justice to music with
20 kHz bandwidth. Selection of the features for classificationshould represent the phenomenon being observed.
The main focus of this paper is to develop algorithmsfor detection of people, by understanding the underlyingphenomenology of the signatures generated by humans andanimals, and the detection of these signatures using multiplesensor modalities. Furthermore we process the data obtainedby different non-imaging sensors to extract the phenomenol-ogy based features and apply algorithms to detect personnel.
This paper is organized as follows: Section II describes thedata collection. Sensors modalities and target phenomenologyare discussed in Section III. We also present various algorithmsused to detect people in Section III and fusion of the resultsfrom multiple modalities. The paper is concluded in SectionIV.
II. DATA COLLECTION
In order to develop algorithms based on real-world environ-ments, we went to the Southwest border and collected data atthree different locations, namely, (a) wash, a flash flood river-bed consisting of fine grain sand; (b) a trail, a trail formed bypeople walking through the thick of bushes and has the hardsurface; and (c) choke point, a valley between two hills knownto be trespassed by illegal aliens as shown in Figure 1. Weused suite of sensors consisting of acoustic, seismic, passiveinfrared (PIR), magnetic & E-field, ultrasonic, profiling, radarsensors to collect the data. Some of the sensors used are shownin Figure 2. Each sensor suite is placed along the path with aspacing of 40 to 60 meters apart. Some of the scenarios usedfor data collection include: (a) a single person walking withand without back pack, (b) two people walking, (c) multiplepeople walking, (d) one person leading an animal, (e) twopeople leading animals, and (f) three people leading animalswith and without payloads. A total of 26 scenarios with variouscombinations of people, animals, and payload are enacted andcollected the data at those three sites. The data are collectedover a period of four days; each day at a different site anddifferent environment. Sometimes there is wind, sometimesit is quiet. The experiments with animals always involvedpeople, hence, through out this paper animal detection usingseismic and acoustic data analysis for cadence imply animaland person leading it.
14th International Conference on Information FusionChicago, Illinois, USA, July 5-8, 2011
Report Documentation Page Form ApprovedOMB No. 0704-0188
Public reporting burden for the collection of information is estimated to average 1 hour per response, including the time for reviewing instructions, searching existing data sources, gathering andmaintaining the data needed, and completing and reviewing the collection of information. Send comments regarding this burden estimate or any other aspect of this collection of information,including suggestions for reducing this burden, to Washington Headquarters Services, Directorate for Information Operations and Reports, 1215 Jefferson Davis Highway, Suite 1204, ArlingtonVA 22202-4302. Respondents should be aware that notwithstanding any other provision of law, no person shall be subject to a penalty for failing to comply with a collection of information if itdoes not display a currently valid OMB control number.
1. REPORT DATE JUL 2011 2. REPORT TYPE
3. DATES COVERED 00-00-2011 to 00-00-2011
4. TITLE AND SUBTITLE Detection of people and animals using non-imaging sensors
5a. CONTRACT NUMBER
5b. GRANT NUMBER
5c. PROGRAM ELEMENT NUMBER
6. AUTHOR(S) 5d. PROJECT NUMBER
5e. TASK NUMBER
5f. WORK UNIT NUMBER
7. PERFORMING ORGANIZATION NAME(S) AND ADDRESS(ES) U.S. Army Research Laboratory,Adelphi,MD,20783-1197
8. PERFORMING ORGANIZATIONREPORT NUMBER
9. SPONSORING/MONITORING AGENCY NAME(S) AND ADDRESS(ES) 10. SPONSOR/MONITOR’S ACRONYM(S)
11. SPONSOR/MONITOR’S REPORT NUMBER(S)
12. DISTRIBUTION/AVAILABILITY STATEMENT Approved for public release; distribution unlimited
13. SUPPLEMENTARY NOTES Presented at the 14th International Conference on Information Fusion held in Chicago, IL on 5-8 July2011. Sponsored in part by Office of Naval Research and U.S. Army Research Laboratory.
14. ABSTRACT Non-imaging sensors offer low power and long lasting solutions for perimeter, border crossing, andforward operating base protection. In this paper, we study the utility of acoustic, seismic, and ultrasonictransducers for detection and identification of people and animals. Various algorithms will be developedfor them, which are computationally less intensive and amenable to implement on sensor network. Weidentify the physics-based phenomenology associated with the targets and the features selected forclassification are based on the phenomenology. We fuse the results from various sensor modalities toachieve higher probability of correct classification.
15. SUBJECT TERMS
16. SECURITY CLASSIFICATION OF: 17. LIMITATION OF ABSTRACT Same as
Report (SAR)
18. NUMBEROF PAGES
8
19a. NAME OFRESPONSIBLE PERSON
a. REPORT unclassified
b. ABSTRACT unclassified
c. THIS PAGE unclassified
Standard Form 298 (Rev. 8-98) Prescribed by ANSI Std Z39-18
trailwash
Figure 1. Different terrains: (a) Wash with fine grain of sand and (b) Trail
Acoustic Seismic
E-FieldUltrasonic
Figure 2. Acoustic, seismic, Ultrasonic and E-field sensors
III. SENSOR MODALITIES, TARGET PHENOMENOLOGY,AND ALGORITHM DEVELOPMENT
In this section, we consider three sensor modalities shown inFigure 2, namely, (a) acoustic, (b) seismic, and (c) ultrasonicsensors for detection and classification of targets. As men-tioned earlier, each sensor modality offers unique features thatother modalities cannot. We present the target phenomenologyassociated with these modalities and the techniques used toexploit it, while keeping in mind that the these algorithmsshould be low complexity and amenable to implement onunattended ground sensors (UGS).
Figure 3. Sample voice signal showing different words/consonants spoken
A. ACOUSTIC SENSOR DATA ANALYSIS
Humans depend heavily on hearing, next only to vision,to observe the targets and for better situational awareness.Humans also have the ability to perceive the targets withoutseeing by listening to the sounds the targets produce. In orderto detect the presence of humans, we rely on the followingphenomenological features extracted from:
• human voice and its characteristics• sounds generated due to footfalls and their cadence
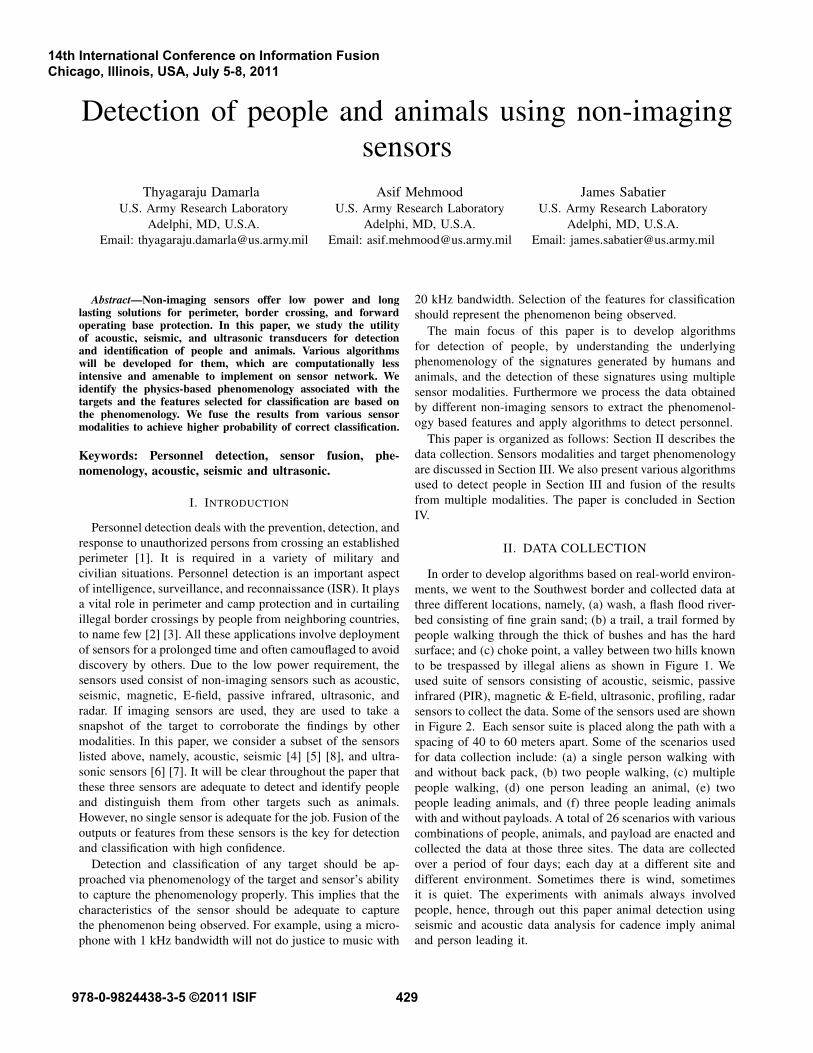
Human Voice: Humans generate sound by modulating thevocal cords and appropriately opening and closing the vocaltract [11]. In general, there are several frequencies associatedwith voice are called formants [11]. A small segment of aspeech signal is shown in Figure 3. One would notice fromFigure 3 that whenever a word is spoken a burst of highfrequency signal appears and some background noise occursduring other times. This high frequency signal, the formant andvaries from person to person and also depending on the wordspoken. In general, the frequency lies between 200 - 800 Hzfor the people we tested. Figure 4 shows the expanded versionof the first segment of the voice signal shown in Figure 3 andFigure 4 shows its Fourier transform. Clearly, one can seethe dominant frequency around 300 Hz. The objective of thesignal processing is to detect and determine this frequency.
1) Detection of Personnel using Formants and ModulationCharacteristics: As mentioned previously, the carrier fre-quency (formant) is amplitude modulated; its representationmay be given as
s(t) = (Ac +Am sinωmt ) cosωct (1)
where ωc = 2πfc and ωm represent the carrier and modulatingfrequencies and Ac and Am denote their magnitudes, respec-tively. The signal has three distinct frequency components,namely, fc, fc + fm and fc − fm. The spread of frequency(see Figure 4(b)) is then ±fm around the carrier. The algorithm
430
Figure 4. (a) Portion of voice signal in Figure 3, (b) its FFT
for detecting human voice consists of estimating the formant(carrier frequency) and the spread. If the spread is above somethreshold, we declare it as a human voice. Statistical analysisis performed on various speech signals in order to determinethe threshold value.
2) Personnel Detection using the Energy in Several Bandsof Voice Spectra: It is known [11] that the human voicespans 50 Hz - 20 kHz frequency range. However, most ofthe energy is concentrated in 4 to 5 bands, as can be seenin Figure 4(b). These bands are 50 - 250 Hz, 251 - 500 Hz,501 - 750 Hz, and 751 - 1000 Hz. The energy levels in thesebands are the features and are designated by the feature vectorX = {x1, x2, · · · , xn}, where xi is the energy in band ’i’, andn is the number of features. The feature vectors are used toclassify whether they belong to human voice or not using amultivariate Gaussian (MVG) classifier as described in [2].For the sake of continuity, we present a short description ofthe MVG classifier. We assume the energy levels in each bandare statistically independent and have the Gaussian distributiongiven by
p(xi) =1√
2π |Σi|exp
{−1
2(xi −Mi)
TΣ−1
i (xi −Mi)
}
(2)where Mi and Σi denote the mean and variance, respectively,and T denotes the transpose. Then the likelihood that a personis present or not is given by
p (X |Hj) = Πni=1 p(xi|Hj) p(Hj), j = {0, 1} (3)
where H1 and H0 are the hypothesis correspond to a personis present and not present, respectively. Then the posteriorprobability of human presence is given by
p (H1|X) =Πn
i=1 p(xi|H1) p(H1)
Πni=1 p(xi|H1) p(H1) + Πn
i=1 p(xi|H0) p(H0)(4)
Assuming the priors p(H0) = p(H1) = 0.5, we can computethe posterior probability of a human present given X . If itexceeds a particular threshold value, we declare that a humanis detected.
3) Personnel Detection using Cadence: Whenever a personor an animal walks, the footfalls make audible sounds. Onecan analyze the signatures of human and animal footfalls andclassify them into respective classes. It is estimated that thecadence of the humans walking lies between 1 to 2 Hz whilethe cadence of animals walking is around 2.5 - 3 Hz. Moreover,these footfalls are impulsive in nature and result in severalharmonics. Even if many people are walking in a file (on apath), they tend to synchronize their stride with others andwalk more or less at the same cadence. This gives a way toestimate the cadence and then classify it. Cadence estimationand classification is similar to the algorithm for seismic dataand is presented in the seismic data analysis section.
Detection of Formants
Detection of Footsteps
Energy in Spectral Bands
FUSION
Acoustic Data
Likelihood ofHuman
Figure 5. Acoustic data processing
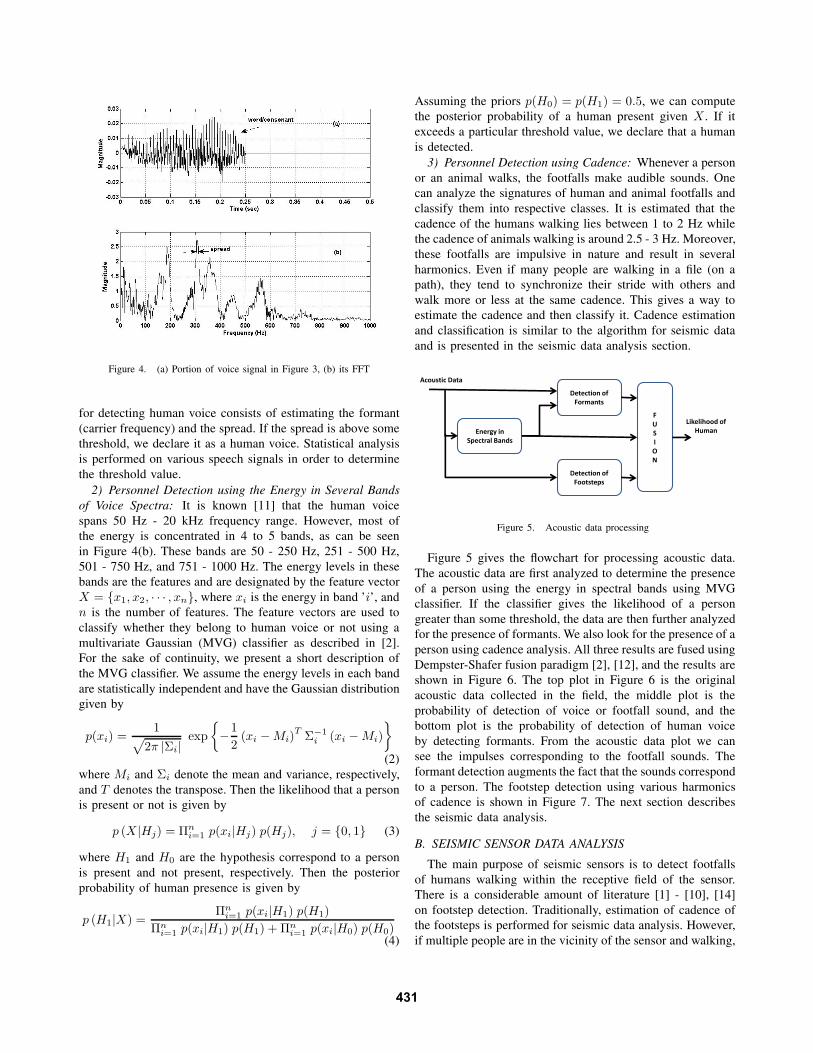
Figure 5 gives the flowchart for processing acoustic data.The acoustic data are first analyzed to determine the presenceof a person using the energy in spectral bands using MVGclassifier. If the classifier gives the likelihood of a persongreater than some threshold, the data are then further analyzedfor the presence of formants. We also look for the presence of aperson using cadence analysis. All three results are fused usingDempster-Shafer fusion paradigm [2], [12], and the results areshown in Figure 6. The top plot in Figure 6 is the originalacoustic data collected in the field, the middle plot is theprobability of detection of voice or footfall sound, and thebottom plot is the probability of detection of human voiceby detecting formants. From the acoustic data plot we cansee the impulses corresponding to the footfall sounds. Theformant detection augments the fact that the sounds correspondto a person. The footstep detection using various harmonicsof cadence is shown in Figure 7. The next section describesthe seismic data analysis.
B. SEISMIC SENSOR DATA ANALYSIS
The main purpose of seismic sensors is to detect footfallsof humans walking within the receptive field of the sensor.There is a considerable amount of literature [1] - [10], [14]on footstep detection. Traditionally, estimation of cadence ofthe footsteps is performed for seismic data analysis. However,if multiple people are in the vicinity of the sensor and walking,
431
0 50 100 150 200 250 300−0.05
0
0.05Acoustic Data
Mag
nitu
de
(a)
0 50 100 150 200 250 3000
0.5
1
Prob. of voice & footsound
Prob
abili
ty (b)
0 50 100 150 200 250 3000
0.5
1
Prob. of Formants
Time (secs)
Prob
abili
ty (c)
Figure 6. (a) Acoustic data of a person walking, (b) probability of voice/footsound using MVG classifier and (c) probability of formant detection
0 50 100 150 200 250 300−0.05
0
0.05
Mag
nitu
de
Acoustic Data
(a)
0 50 100 150 200 250 3000
0.2
0.4
0.6
0.8
1
Time (secs)
Prob
abili
ty
Prob. of human footfalls
(b)
Figure 7. (a) Acoustic data of a person walking and (b) Probability ofacoustic footstep detection
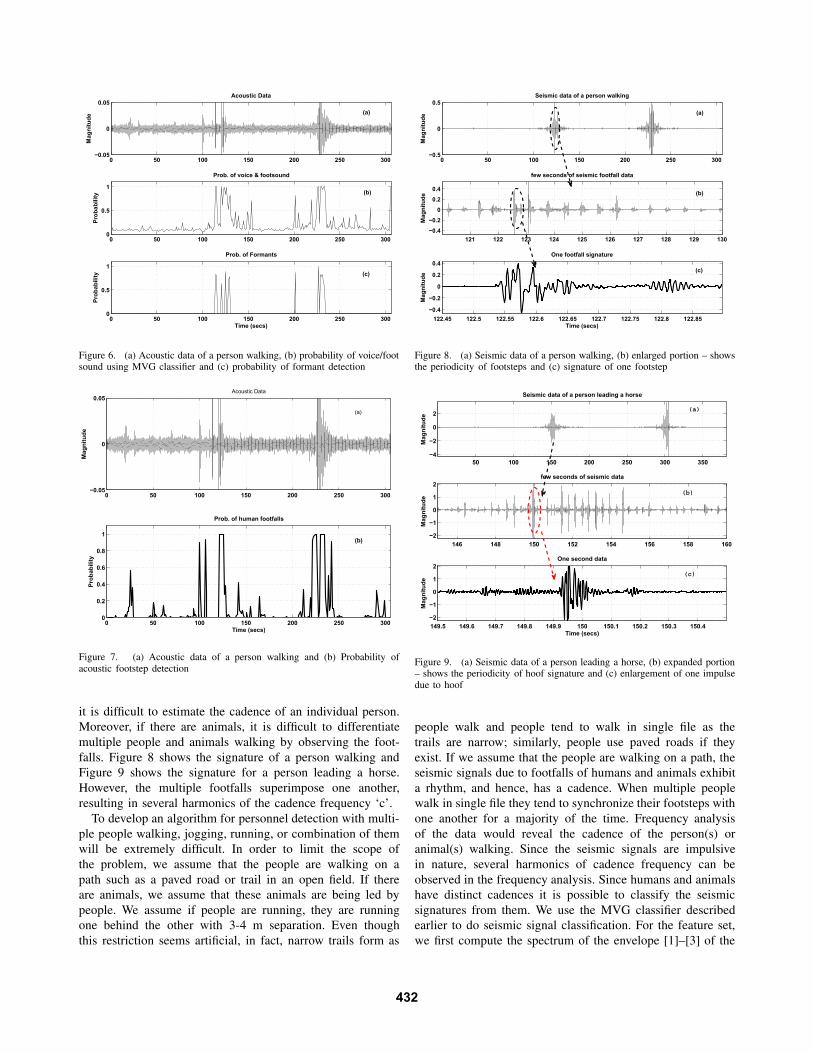
it is difficult to estimate the cadence of an individual person.Moreover, if there are animals, it is difficult to differentiatemultiple people and animals walking by observing the foot-falls. Figure 8 shows the signature of a person walking andFigure 9 shows the signature for a person leading a horse.However, the multiple footfalls superimpose one another,resulting in several harmonics of the cadence frequency ‘c’.
To develop an algorithm for personnel detection with multi-ple people walking, jogging, running, or combination of themwill be extremely difficult. In order to limit the scope ofthe problem, we assume that the people are walking on apath such as a paved road or trail in an open field. If thereare animals, we assume that these animals are being led bypeople. We assume if people are running, they are runningone behind the other with 3-4 m separation. Even thoughthis restriction seems artificial, in fact, narrow trails form as
Figure 9. (a) Seismic data of a person leading a horse, (b) expanded portion– shows the periodicity of hoof signature and (c) enlargement of one impulsedue to hoof
people walk and people tend to walk in single file as thetrails are narrow; similarly, people use paved roads if theyexist. If we assume that the people are walking on a path, theseismic signals due to footfalls of humans and animals exhibita rhythm, and hence, has a cadence. When multiple peoplewalk in single file they tend to synchronize their footsteps withone another for a majority of the time. Frequency analysisof the data would reveal the cadence of the person(s) oranimal(s) walking. Since the seismic signals are impulsivein nature, several harmonics of cadence frequency can beobserved in the frequency analysis. Since humans and animalshave distinct cadences it is possible to classify the seismicsignatures from them. We use the MVG classifier describedearlier to do seismic signal classification. For the feature set,we first compute the spectrum of the envelope [1]–[3] of the
432
seismic signal accumulated for a period of 6 seconds. Then,the feature set {x1, x2, · · · , xn} consists of amplitudes of thefrequency bins from 2 to 15 Hz [2]. Then, the MVG algorithmis used to estimate the posterior probability of human or animalfootsteps present. The results of the algorithm are shown inFigure 10.
80 90 100 110 120 130 140 150 1600.05
0
0.05Seismic data of a person walking
Mag
nitu
de
footfalls
80 90 100 110 120 130 140 150 160 170
0
0.2
0.4
0.6
0.8
1
Probability of detection
Time (secs)
Prob
abili
ty
mis detection
(a)
(b)
Figure 10. (s) Seismic data of a person walking and (b) probability ofdetection
The previously described classification works reasonablywell if humans and animals are walking. However, if a personis running, the cadence of the person running is approximatelythe same as the cadence of a horse walking. In order todetermine the presence of humans, it is necessary to determinewhether these footsteps belong to a human or an animal.Additional signal processing is done to determine whether theseismic signatures belong to humans or animals. Figures 11and 12 show some of the processing done on the signatures.Figure 11(a) shows the human footfalls and Figure 11(b) showthe envelope of the magnitudes of the footfalls. The span iscomputed as the time duration when the magnitudes of thefootfalls lie above some threshold. Similarly, Figure 12 showsthe information for horse led by a person. Here we assume thatthe horse hoof signatures dominate the footfalls of a personleading it. The threshold is estimated to be the mean of theabsolute values of the signatures. We use the magnitude ofthe signals along with the span of the signals above certainthreshold as the features to determine the presence of humansor animals. Table I shows the features of a person walkingand running and a horse walking. These features are used ina MVG classifier to classify the signatures.
1) Semantic Data Fusion: Seismic data are particularlysensitive to the soil conditions. Depending on the properties ofthe soil, the signals propagate at different velocities and thetransfer function of the soil affects the signal differently. Inorder to perform the classification properly, it is necessary touse appropriate training set depending on the type of soil. Thesemantic tree used for classification is shown in Figure 13.
2 4 6 8 10 12 14 16 18 20
0.1
0.05
0
0.05
0.1 Seismic Signature person walking
Time (Sec)
mag
nitu
de
2 4 6 8 10 12 14 16 18 20
0.02
0.04
0.06
0.08
0.1
0.12
0.14
magintude envelope
span
Time (Sec)
mag
nitu
de
threshold
(a)
(b)
Figure 11. (a) Seismic signals generated by a person walking, and (b) signalspan for a person walking
2 4 6 8 10 12 14 16 18 204
3
2
1
0
1
2
3m
agni
tude
Time (Sec)
Seismic Signature horse walking
2 4 6 8 10 12 14 16 18 20
0.5
1
1.5
2
2.5
3
3.5
4
mag
nitu
de
Time (Sec)
threshold
mag. envelope
span
(a)
(b)
Figure 12. Seismic signals generated by horse led by a person, and (b) signalspan
Table IDISTINGUISHING FEATURES FOR PEOPLE AND ANIMALS
The semantic tree has two branches, namely, (a) wash and(b) trail, corresponding to two different soil conditions. Thebranch corresponding to the trail is expanded where thedata are analyzed to determine the presence of personneland animals. The branch corresponding to the personnel isanalyzed to determine if the people are walking or running.Further analysis is done to determine if there is a single person
433
Wash Trail
Person Animal
walk run
Seismic data
Single person Many people
Figure 13. Semantic tree used for classification of seismic data
or multiple people are present.
C. ULTRASONIC SENSOR DATA ANALYSIS
In this section, we discuss the processing of the ultrasonicdata. The ultrasonic data are rich in information and embodythe Doppler signature of a moving human or an animal such asa horse [6]. Typical Doppler velocities that are proportional tothe Doppler frequencies from various body parts of a walkinghuman and from a walking horse are shown in Figures 14and 15, respectively . Ideally, the Doppler from the arm, legand torso of a person is different from that of animal legs. Asmentioned previously, it is important to know the number ofpeople and animals to perform classification. This is due tothe reason that information about the number of people andanimals has to be included in the training data set. Towards thisgoal, we processed the ultrasonic data to count the number oftargets in the vicinity using the energy content in various bandsof Doppler. Figure 16 shows the flowchart for the algorithmused in counting the number of targets. For processing theultrasonic data a 1 second interval of the data is considered ata time and the algorithm shown in Figure 16 is used to findthe energy in each band. Then a sliding window is used, whichslides approximately 0.1 second and next segment of data isobtained and processed. The algorithm results for several runsare shown in Figure 17. The scenarios used corresponds to (a)one man walking, (b) one man leading an animal, (c) twomen and one woman walking and, (d) four men and threewomen walking. In the last case, a count of only six targetsare realized using the algorithm. The reason is due to a largenumber of people, one is very close to the other, masking theDoppler returns from one.
1) Classification of targets using ultrasonic data: TheDoppler returns from animals are quite different comparedto those from humans. One distinction is that humans have
Time(s)
Vel
ocity
(m
/s)
0 2 4 6 8
−8
−6
−4
−2
0
2
4
6
8
−80
−60
−40
−20
0
20
Torso
legs
Figure 14. Micro Doppler from various body parts of a walking person.
Time(s)
Vel
ocity
(m
/s)
0 2 4 6 8 10−6
−4
−2
0
2
4
6
−80
−60
−40
−20
0
20
Torso
Legs
Figure 15. Micro Doppler from various body parts of a walking horse.
stronger returns from their torsos while animals have signifi-cantly weaker Doppler returns from their torsos, as is evidentfrom Figures 14 and 15. The total energy in various bandsfor the animal is different from that of the humans, as shownin Figure 17. In order to classify, 40 features are selected fromeach band Bi, i ∈ {1, 2, 3}
FB1 ={FB11 , FB1
2 , · · · , FB140
}
where FBi
k = 15
∑j+4j fj where j = (k − 1) ∗ 5 + 1 + Ci,
fj is the magnitude of the Fourier coefficient j, and Ci ={100, 300, 500} for the band Bi. Training data are generatedfor each point on Figure 17 that corresponds to people, animal,and everything else. There are three classes, namely, (a) hu-man, (b) animal, and (c) others. We developed a support vectormachine with a Gaussian kernel to perform classification. Thecorrect classification of 95% are achieved. When we used onlytwo classes, humans and everything else (that is, animal plusothers), we achieved a correct classification of 98%.
Figure 16. Flowchart showing the ultrasonic signal processing for countingnumber of targets
1 man
men
animal
woman
2 people
1 man & 1 animal
2 men & 1 woman4 men & 3 women
Figure 17. Target count using ultrasonic data analysis
D. COMPLETE IMPLEMENTATION OF PERSONNEL DE-TECTION ALGORITHM
The previous sections showed how each individual sensormodality data is processed to detect and classify personnel.We determined that in order to get better classification withfewer false alarms, it is necessary to know the number oftargets in the sensor receptive area as well as to use the righttraining data for classification depending on the type of site,for example, the wash, trail, etc. Figure 18 shows the treestructure used to detect personnel.
In the hierarchical structure, we first use the ultrasonic dataanalysis to determine the number of targets present in the
Ultrasonic Data Analysis
No. of targets Classification
Most likely Personnel Most likelyAnimals
Seismic Analysis Acoustic Analysis
Footstep detection Voice detection
Figure 18. Hierarchical structure used for personnel detection
0 50 100 150 200 250 3000
0.5
1Acoustic Detections
Prob
abili
ty (a)
0 50 100 150 200 250 3000
0.5
1Seismic Detections
Prob
abili
ty (b)
0 50 100 150 200 250 3000
0.5
1Fusion of Acoustic & Seismic
Time (secs)
Prob
abili
ty (c)
Figure 19. (a) Detection of human voice using acoustic sensor, (b) Detectionof footsteps by seismic sensor, and (c) Fusion of acoustic and seismicinformation
vicinity of the sensor field and then determine the likelihood ofpeople present. If it is determined that there is high likelihoodof people present, then we use both acoustic and seismic datato further corroborate the presence of people.
The acoustic and seismic sensors used for collection wereco-located while the ultrasonic sensor is located about 20meters away from the acoustic and seismic sensors. Moreoverthe ultrasonic sensor data is not time synchronized with theothers. As a result, we can not fuse the information from allthree. However, we can determine the presence of people andanimals using the ultrasonic data. Once, the presence of peopleis established, the acoustic and seismic data is fused and theresults are shown in Figure 19. Fusion is accomplished usingDempster-Shafer fusion [2], [12], [13] paradigm. The uncer-
435
tainty of each sensor is established based on the classificationof data used for training. The uncertainty for both acoustic andseismic data is found to be 30%. As a result the probability ofdetection values for either acoustic or seismic data does notexceed 0.7 as can be seen in Figure 19(a) and (b). However, thefusion of acoustic and seismic information resulted in higherprobability of detection Figure 19(c).
IV. CONCLUSIONS
In this paper, we presented several algorithms for personneldetection using acoustic, seismic, and ultrasonic data. Theacoustic data are analyzed for formants and footstep detection.The acoustic data are also used to estimate the cadence ofanimals walking and discriminate between animals and peoplewhen a human voice is not present. Seismic data are ana-lyzed for footstep detection and classification of humans andanimals. We used ultrasonic data for estimating the numberof targets present and for classification. We were able toachieve high percentage of correct classification using all threesensor modalities. The complete suite of algorithms with othermodalities is still being developed and will be evaluated forfalse alarms. Each algorithm tried to use the sensor’s particularphenomenology for the detection and classification of people.The algorithms presented are computationally efficient, con-sume less power and hence amenable for implementing onsensor networks such as networked UGS.
REFERENCES
[1] K. M. Houston and D. P. McGaffigan,“Spectrum Analysis Techniques forPersonnel Detection Using Seismic Sensors”, Proc. of SPIE, Vol. 5090,pp. 162-173, 2003.
[2] Raju Damarla and David Ufford, “Personnel detection using groundsensors”, Proc. of SPIE, Vol. 6562, 656205, 2007.
[3] Thyagaraju Damarla, James Sabatier, and Alex Ekimov, “Personneldetection at a border crossing”, Proc. of Military Sensing SymposiumNational, July 2010, Las Vegas.
[4] G. Succi, D. Clapp and R. Gambert, “Footstep, Detection and Tracking”,Proc. of SPIE, Vol. 4393, pp. 22-29, 2001.
[5] A. Sunderesan, A. Subramanian, P. K. Varshney and T. Damarla, “Acopula based semi-parametric approach for footstep detection usingseismic sensor networks”, Proc. of SPIE, Vol. 7710, 77100C, 2010.
[6] A. Mehmood, J. M. Sabatier, M. Bradley and A. Ekimov, “Extractionof the velocity of walking human’s body segments using ultrasonicDoppler”, The Journal of the Acoustical Society of America, pp. EL316-EL322, vol. 128, no.5, Oct. 2010.
[7] Alexander Ekimov and James M. Sabatier, “Passive ultrasonic methodfor human footstep detection”, Proc. of SPIE, Vol. 6562, 656203, 2007.
[8] James M. Sabatier and Alexander Ekimov, “Range limitation for seismicfootstep detection”, Proc. of SPIE, Vol. 6963, 69630V-1, 2008.
[9] R. E. Bland, “Acoustic and seismic signal processing for footstep detec-tion”, Master’s Thesis, Massachusetts Institute of Technology, Departmentof Electrical Engineering and Computer Science, 2006.
[10] S. G. Iyengar, P.K. Varshney and T. Damarla, “On the detection offootsteps based on acoustic and seismic sensing”, Conference Record ofthe Forty First Asilomar Conference on Signals, Systems and Computers,ACSSC 2007, pp. 2248-2252, 4-7 Nov. 2007.
[11] Encyclopedia of Acoustics, Vol. 4, Edited by Malcolm J. Crocker,Published by John Wiley & Sons, Inc. New York, NY., 1997.
[12] H. B. Mitchell, An Introduction to Multi-Sensor Data Fusion, Springer-Verlag, New York, 2007.
[13] D. L. Hall and S. A. H. McMullen, Mathematical Techniques inMultisensor Data Fusion, Artech House, Norwood, MA, USA, 2004.
[14] H. Park, A. Dibazar and T. Berger, “Cadence analysis of temporalgait patterns for seismic discrimination between human and quadrupedfootsteps”, IEEE Conference on Acoustics, Speech and Signal Processing,pp. 1749-1752, 2009.