124
Waging War on Complexity in Supply Chains February 13, 2015
| Date post: | 18-Jul-2015 |
| Category: |
Business |
| Upload: | wilson-perumal-and-company |
| View: | 318 times |
| Download: | 0 times |
Waging War on Complexity in Supply Chains
February 13, 2015

Wilson Perumal & Company, Inc. 2
Agenda
• Introductions
• Complexity
– Sources and impacts of complexity
– Accounting for complexity
– Complexity Costing Exercise
– Developing and using Complexity Value Stream Maps
– Utilizing Portfolio Optimization to root out complexity
– Case Study: Complexity in M&A
• LUNCH
• Operational Excellence (OE)
– Foundations of OE and the Operational Excellence Management System
– Achieving OE with an OEMS – Case Study: Koch Industries, Chevron & BP
• Operational Discipline (OD)
– Driving OE with a culture of Operational Discipline
– Case Study: Deepwater Horizon
• Summary/Closing

Wilson Perumal & Company, Inc. 3
Chris Seifert
• Expertise in manufacturing, operational excellence, and management system design and implementation
• Former Operations Leader, Owens Corning (increased plant productivity by 25% in just 9 months)
• Former Plant Manager and Manager of Business Strategy & Analysis, Georgia Pacific (Koch Industries)
• Top-ranked submarine officer, US Navy (ranked #1 of 9 submarine junior officers)
• MBA, Summa Cum Laude, University of Georgia; BS Business Administration, St. Louis University
Wilson Perumal & Company, Inc. 4
Scott Stallbaum
• Expertise in manufacturing, operational excellence, and management system design and implementation
• Former manufacturing & budgeting/planning leader and in the medical device industry
• Former new model launch program manager, manufacturing engineer and front line supervisor in the automotive industry
• MBA, Harvard Business School; BS Mechanical Engineering, Bucknell University
Wilson Perumal & Company, Inc. 5
Francisco Soto
• Experienced in the design and implementation of management systems for achieving operational excellence in highly complex environments
• Former strategy leader of a private healthcare provider, AMG Health
• Former supply chain innovation engineer, Pepsico
• MBA, University of Texas; BS Mechanical Engineering, University of Texas
Wilson Perumal & Company, Inc. 6
Ben Cormier
• Led the implementation of risk management to support operational excellence across onshore business, offshore business and joint venture.
• Advised in business decision throughout risk quantification. Developed key performance indicators to focus on continuous improvement in strengthening risk management and production targets to reduce risk profile and gain
• M.S., Ph.D. in Chemical Engineering, Texas A&M University, B.S. in Chemical Engineering, Virginia Tech University

Wilson Perumal & Company, Inc. 7
Agenda
• Introductions
• Complexity
– Sources and impacts of complexity
– Accounting for complexity
– Complexity Costing Exercise
– Developing and using Complexity Value Stream Maps
– Utilizing Portfolio Optimization to root out complexity
– Case Study: Complexity in M&A
• LUNCH
• Operational Excellence (OE)
– Foundations of OE and the Operational Excellence Management System
– Achieving OE with an OEMS – Case Study: Koch Industries, Chevron & BP
• Operational Discipline (OD)
– Driving OE with a culture of Operational Discipline
– Case Study: Deepwater Horizon
• Summary/Closing

Wilson Perumal & Company, Inc. 8
Complexity is stretching the capabilities of most companies…
8
New ChannelsNew GeographiesBroader Product Offerings
8
More Systems & Technology
Matrix organizations
More Regulation
More Complex Processes
X
X
X
XX
X
X

Wilson Perumal & Company, Inc. 9
… Surpassing the “complexity frontier”
VALUE(diminishing returns)
COST & RISK(exponential growth)
Level of complexity you can support
$
ComplexityFew companies are still here
Many companies are here
An increasing number of companies are here

Wilson Perumal & Company, Inc.
The world has changed!
Volume
Cost
Pre-Industrial Age
“Individual productivity”
Dominated by
variable costs
Volume
Industrial Age
“Economies of Scale”
Dominated by
fixed costs
Complexity
Post-Industrial Age
“Complexity”
Dominated by
complexity costs

Wilson Perumal & Company, Inc.
Complexity grows exponentially
Characteristics of Complex Systems
1. Non-linear reactions
2. Emerging properties
3. Feedback loops
4. Unknown interactions
These characteristics make Complex Systems almost impossible to predict
and control

Wilson Perumal & Company, Inc. 12
The result is severe profit concentration …
• Often the most profitable 20% to 30% of products generate more than 300% of the profits in a company, meaning…
• …the remaining 70% to 80% lose 200% of the profits
Products that
create profit
Products that
“lose” profit
0% 25% 50% 75% 100%
100%
300%
% Total Products
0%
% Total
Profits
Typical “Whale Curve”
Source: Sievanen, Suomala, and Paranko, Activity-Based Costing and Product Profitability (Tampere, Finland: Institute for Industrial Management, Tampere University of Technology)
Wilson Perumal & Company, Inc. 13
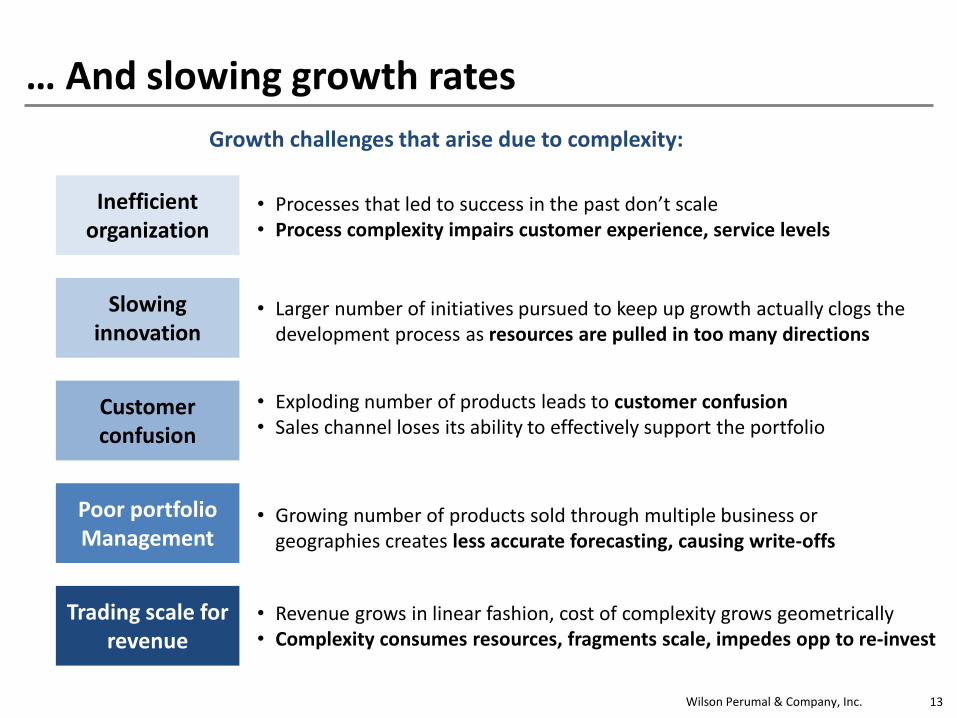
… And slowing growth rates
Slowing innovation
Trading scale for revenue
Poor portfolio Management
• Revenue grows in linear fashion, cost of complexity grows geometrically• Complexity consumes resources, fragments scale, impedes opp to re-invest
• Growing number of products sold through multiple business or geographies creates less accurate forecasting, causing write-offs
Customer confusion
• Exploding number of products leads to customer confusion• Sales channel loses its ability to effectively support the portfolio
• Larger number of initiatives pursued to keep up growth actually clogs the development process as resources are pulled in too many directions
Inefficient organization
• Processes that led to success in the past don’t scale• Process complexity impairs customer experience, service levels
Growth challenges that arise due to complexity:

Wilson Perumal & Company, Inc. 14
Complexity can be good or bad,but companies almost always have too much
The variety of and within the products (and services) you offer
The number of processes, steps, handoffs, etc.
The number of facilities, assets, functional entities, organizational units, systems, policies, etc.
• Bloated portfolio• Customer confusion• Strained processes
• Duplication• Rework• Work-arounds
• Bloated organization• Functional silos• Disarray• No clear picture
Product
Process
Organization
Type of complexity Description Impact of too much
Wilson Perumal & Company, Inc. 15
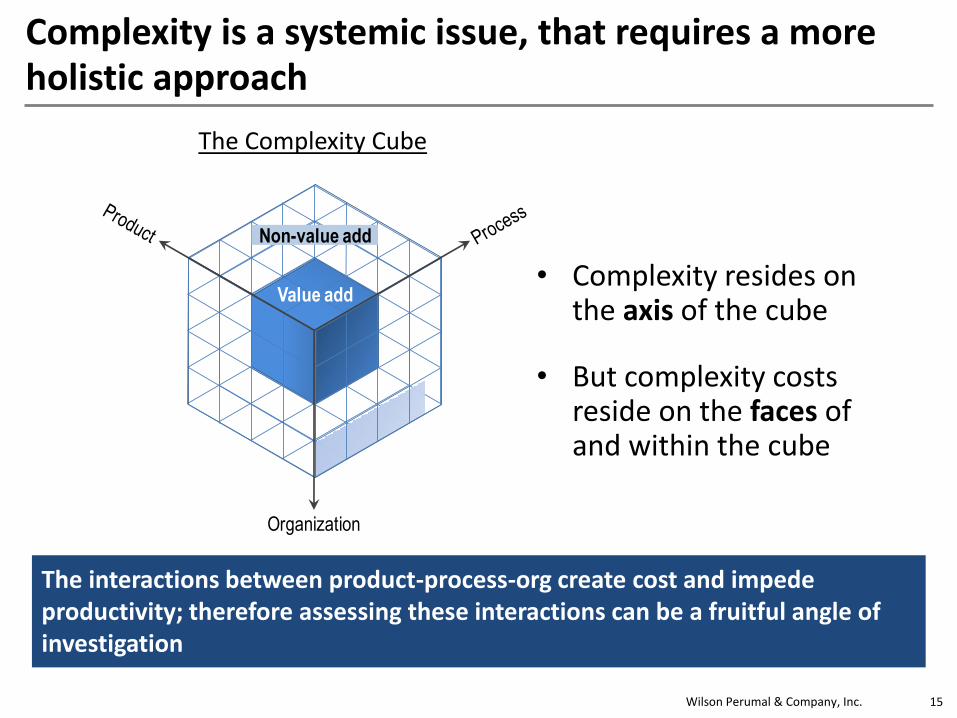
Complexity is a systemic issue, that requires a more holistic approach
Organization
Value add
Non-value add
• Complexity resides on the axis of the cube
• But complexity costs reside on the faces of and within the cube
The Complexity Cube
The interactions between product-process-org create cost and impede productivity; therefore assessing these interactions can be a fruitful angle of investigation
Wilson Perumal & Company, Inc. 16
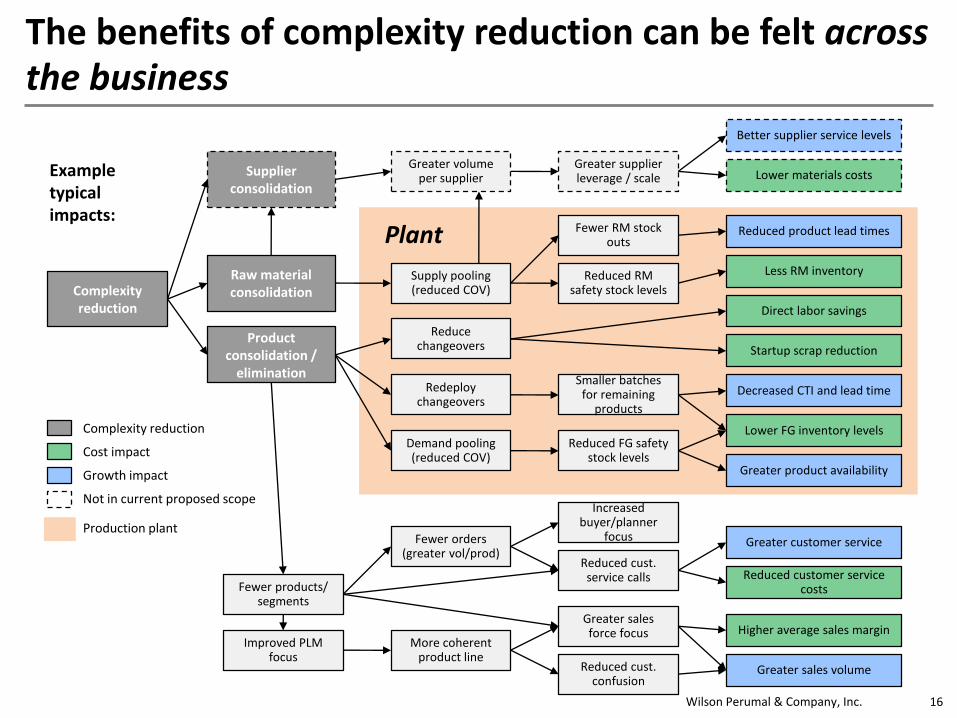
The benefits of complexity reduction can be felt across the business
Supply pooling (reduced COV)
Reduced RM safety stock levels
Raw material consolidation
Product consolidation /
elimination
Fewer RM stock outs
Less RM inventory
Reduced product lead times
Supplier consolidation
Greater supplier leverage / scale Lower materials costs
Greater volume per supplier
Better supplier service levels
Reduce changeovers
Direct labor savings
Startup scrap reduction
Redeploy changeovers
Smaller batches for remaining
products
Decreased CTI and lead time
Lower FG inventory levelsDemand pooling (reduced COV)
Reduced FG safety stock levels
Greater product availability
Greater sales force focus
Greater sales volume
More coherent product line
Fewer orders (greater vol/prod)
Increased buyer/planner
focus
Improved PLM focus
Reduced cust. confusion
Higher average sales margin
Reduced cust. service calls
Greater customer service
Reduced customer service costsFewer products/
segments
Complexity reduction
Plant
Complexity reduction
Growth impact
Cost impact
Not in current proposed scope
Production plant
Example typical impacts:

Wilson Perumal & Company, Inc.Source: WP&C approach
17
Portfolio optimization can be a powerful lever …
• How does SKU variety impact process performance, cost and inventory?
• How many SKUs can the process support?
• Where will benefits be realized?
• From where will costs be extracted post range optimisation?
• At what level of reduction are disproportionate benefits realized?
• What is the firm’s value proposition?
• How does the firm compete?
• Where does product line overlap (i.e., substitutability)?
• Where are there gaps or opportunities for growth?
• How do we compete in each region?
Strategy
Breakpoints
Integration framework
• Which products are profitable-GP vs OP?
• After complexity adjusted costing?
• After taking an incremental view?
An 80% view across all these lenses is better than a 100% view of one
WP&C’s 6-facet methodology

Wilson Perumal & Company, Inc. 18
.. But ultimately, mastering complexity requires a two-pronged approach
Product/service
rationalization
Brand elimination Material
consolidation
Vendor, dealer, distributor, supplier
consolidation
Geography or market
rationalization
System consolidation
Reduce amount of
complexity?
Operating model
redesign
Process flexibility
Dynamicmodeling
Lean processes
Or make complexity less
expensive?
QUESTION:
ANSWER: • Both• We do not live in a “plain vanilla” world (we need variety)• Customers demand good prices (we need cost-competitiveness)• But no real operation is lean enough to support infinite variety
Wilson Perumal & Company, Inc. 19
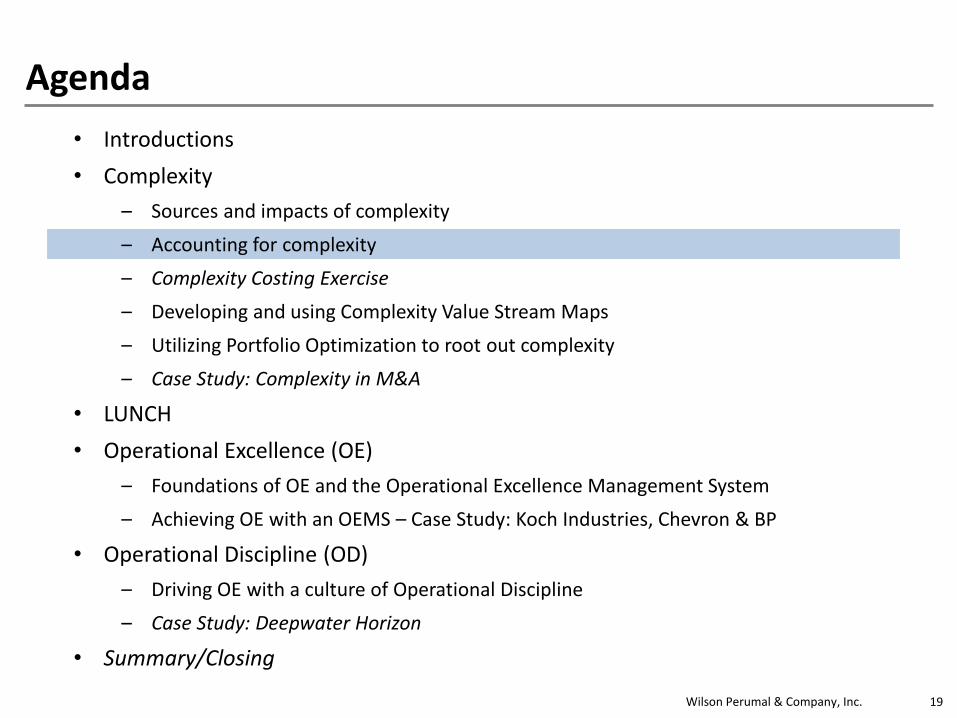
Agenda
• Introductions
• Complexity
– Sources and impacts of complexity
– Accounting for complexity
– Complexity Costing Exercise
– Developing and using Complexity Value Stream Maps
– Utilizing Portfolio Optimization to root out complexity
– Case Study: Complexity in M&A
• LUNCH
• Operational Excellence (OE)
– Foundations of OE and the Operational Excellence Management System
– Achieving OE with an OEMS – Case Study: Koch Industries, Chevron & BP
• Operational Discipline (OD)
– Driving OE with a culture of Operational Discipline
– Case Study: Deepwater Horizon
• Summary/Closing

Wilson Perumal & Company, Inc.
Which allocation to use?
Total cost
Volume
Unit cost
Total cost
Volume
Unit cost
By “Volume” By “Item”
Wilson Perumal & Company, Inc.
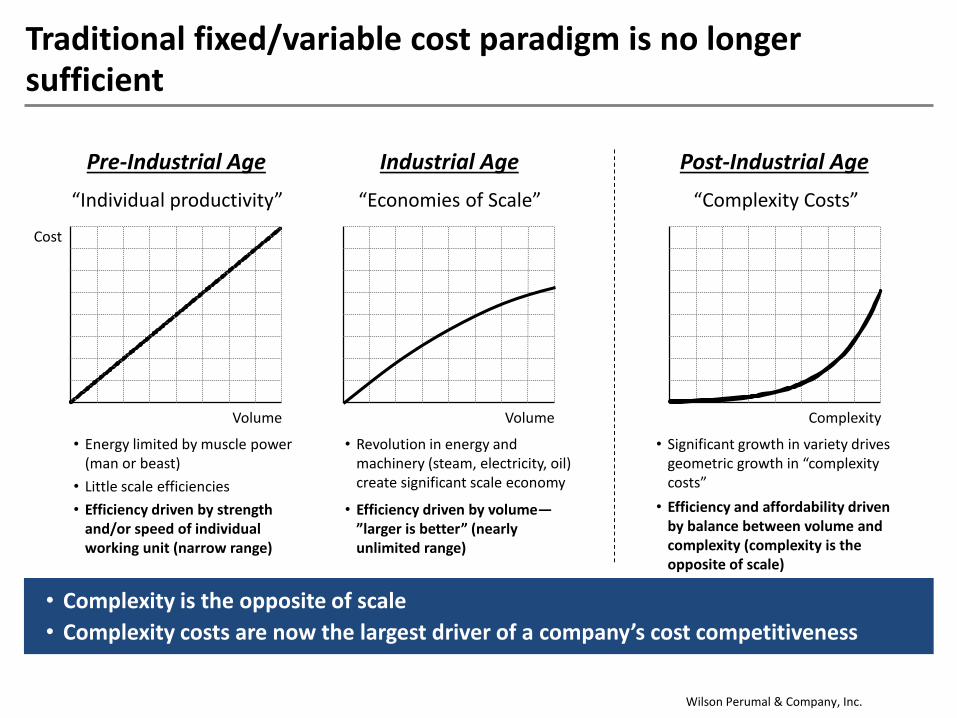
Traditional fixed/variable cost paradigm is no longer sufficient
“Individual productivity”
Volume
Cost
Pre-Industrial Age
• Energy limited by muscle power (man or beast)
• Little scale efficiencies
• Efficiency driven by strength and/or speed of individual working unit (narrow range)
“Economies of Scale”
Volume
Industrial Age
• Revolution in energy and machinery (steam, electricity, oil) create significant scale economy
• Efficiency driven by volume—”larger is better” (nearly unlimited range)
“Complexity Costs”
Complexity
Post-Industrial Age
• Significant growth in variety drives geometric growth in “complexity costs”
• Efficiency and affordability driven by balance between volume and complexity (complexity is the opposite of scale)
• Complexity is the opposite of scale
• Complexity costs are now the largest driver of a company’s cost competitiveness

Wilson Perumal & Company, Inc.
Most complexity costs follow the Square-root of Volume relationship
Most NVA costs fall in between “by volume” and “by unit” extremes
We see the SQRT relationship over and over
• Total cost rises with volume but not as much as in “by volume” approach
• Unit cost drops off with volume but not as much as in “by item” approach

Wilson Perumal & Company, Inc. 23
Cost allocation methods
Costing approach
By actual costs By allocation
By ‘volume’ By ‘SQRT vol.’ By ‘item’
• Best approach
• But not always practical (e.g., activity-based costing)
Cost allocated in proportion to either # units, revenue, cost, etc.
I.e., “Peanut butter spread”
• Costs divided equally between products, stores, regions, etc. regardless of volume
• In between “by volume” and “by item” methods
• Higher-vol. items receive greater aggregate cost
• Lower-vol. items receive greater unit cost
• Most NVA/complexity costs follow the “SQRT of volume” relationship
• Without this tool, most companies allocate these costs using the “by volume” method, leading to over-costing of high-volume items and under-costing of low-volume items
Wilson Perumal & Company, Inc. 24
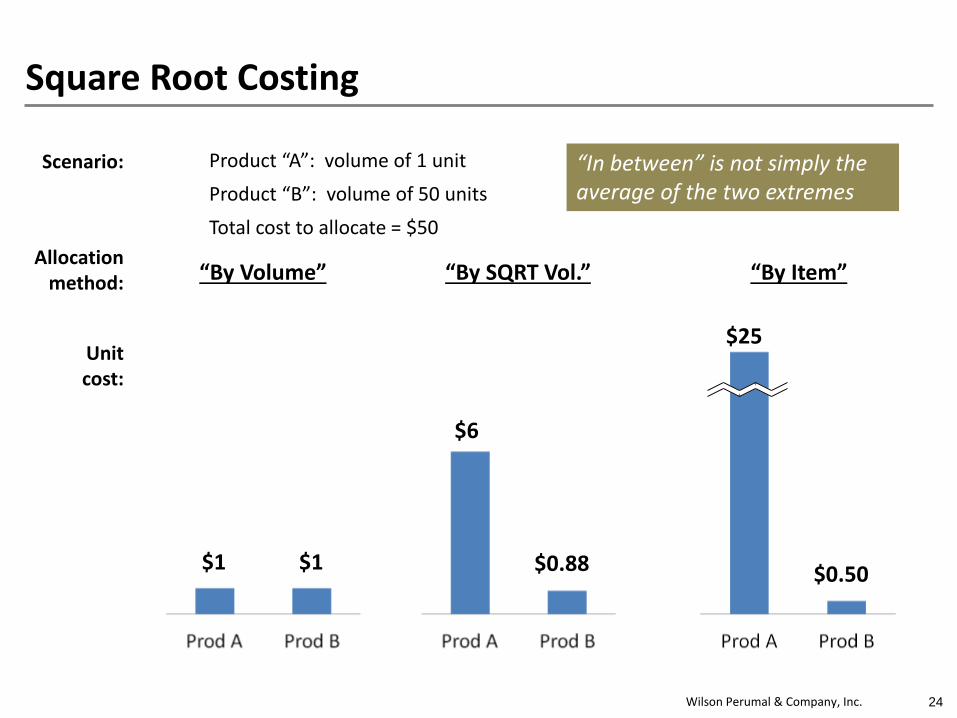
Square Root Costing
$1 $1
$6
$0.88
$25
$0.50
“By Volume” “By Item”“By SQRT Vol.”
Product “A”: volume of 1 unit
Product “B”: volume of 50 units
Total cost to allocate = $50
“In between” is not simply the average of the two extremes
Unitcost:
Allocationmethod:
Scenario:

Wilson Perumal & Company, Inc.
Square Root Costing involves reallocation of buckets of costs
Variable(α Vol.)
Fixed
Variable(α Vol.)
Fixed
SQRTcosts
Traditional Allocation
Categorization
“Square Root” Allocation
Categorization
• Unmasks cross-subsidization
• Corrects for under-costing small volume items/activities
• Corrects for over-estimating potential for fixed cost leverage

Wilson Perumal & Company, Inc.
Complexity-adjusted Profitability
9%
13%14%
26%
14%
5%
10%
19%
9%
14%
0%
10%
20%
30%
Budget Below Premium Premium Craft Average
% Operating Margin
Vol. (bbls): 12.5M 16.4M 44.3M 4.8M 78.0M
Comparison between Standard- and Complexity-Adjusted Profit
Typical standard costing
Complexity-adjusted costing

Wilson Perumal & Company, Inc. 27
Agenda
• Introductions
• Complexity
– Sources and impacts of complexity
– Accounting for complexity
– Complexity Costing Exercise
– Developing and using Complexity Value Stream Maps
– Utilizing Portfolio Optimization to root out complexity
– Case Study: Complexity in M&A
• LUNCH
• Operational Excellence (OE)
– Foundations of OE and the Operational Excellence Management System
– Achieving OE with an OEMS – Case Study: Koch Industries, Chevron & BP
• Operational Discipline (OD)
– Driving OE with a culture of Operational Discipline
– Case Study: Deepwater Horizon
• Summary/Closing

Wilson Perumal & Company, Inc. 28
Square Root Costing Methodology – Step #1
Step #1
Identify complexity-driven costs
COST CATEGORY AMOUNT
Direct Labor $175,000
Indirect Labor $50,000
Production Materials $250,000
Packaging Materials $30,000
Inventory Handling $25,000
Maintenance $75,000

Wilson Perumal & Company, Inc. 29
Square Root Costing Methodology – Step #2
Step #1
Identify complexity-driven costs
Step #2
Calculate the SQRT of volumesPRODUCT VOLUME
(units)SQRT
VOLUME
Product A 10,000 100
Product B 625 25
Product C 5,625 75
Product D 2,500 50
TOTAL: 18,750 250
Take the square root of each of the individual product volumes—these will be the “volumes” used
for SQRT allocations

Wilson Perumal & Company, Inc. 30
Square Root Costing Methodology – Step #3
Step #1
Identify complexity-driven costs
Step #2
Calculate the SQRT of volumes
Step #3
Determine SQRT allocations
PRODUCT VOLUME(units)
SQRT VOLUME
ALLOCATE BY SQRT
Product A 10,000 100 40%
Product B 625 25 10%
Product C 5,625 75 30%
Product D 2,500 50 20%
TOTAL: 18,750 250
For complexity-driven costs, use these percentages to allocate those costs to each product
Product A: 100/250 = 40%Product B: 25/250 = 10%Product C: 75/250 = 30%Product D: 50/250 = 20%
Wilson Perumal & Company, Inc. 31
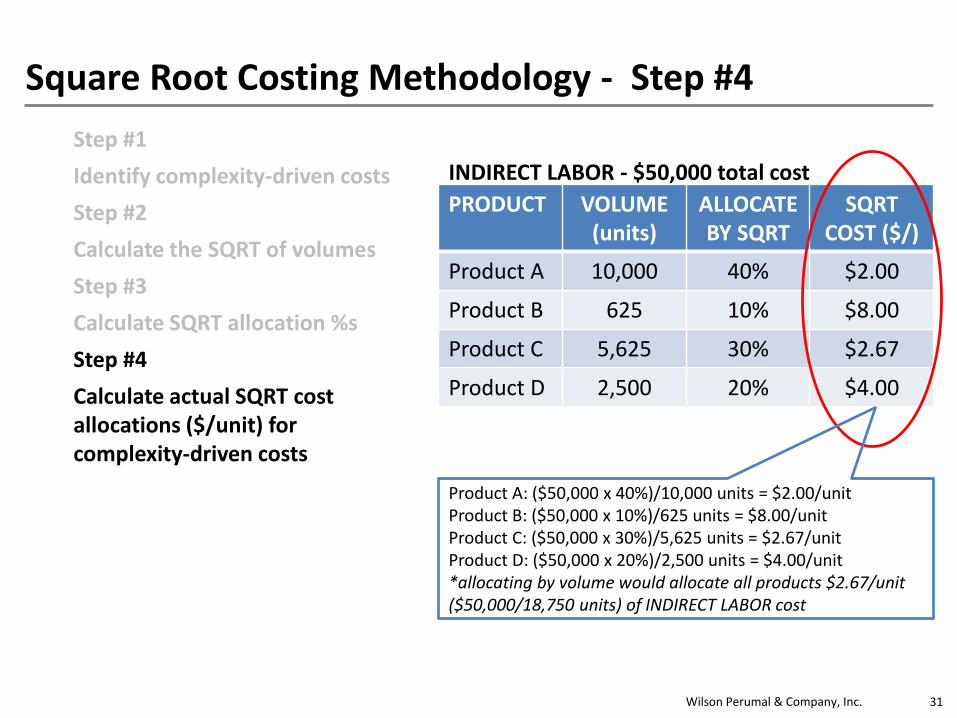
Square Root Costing Methodology - Step #4
Step #1
Identify complexity-driven costs
Step #2
Calculate the SQRT of volumes
Step #3
Calculate SQRT allocation %s
Step #4
Calculate actual SQRT cost allocations ($/unit) for complexity-driven costs
PRODUCT VOLUME(units)
ALLOCATE BY SQRT
SQRTCOST ($/)
Product A 10,000 40% $2.00
Product B 625 10% $8.00
Product C 5,625 30% $2.67
Product D 2,500 20% $4.00
INDIRECT LABOR - $50,000 total cost
Product A: ($50,000 x 40%)/10,000 units = $2.00/unitProduct B: ($50,000 x 10%)/625 units = $8.00/unitProduct C: ($50,000 x 30%)/5,625 units = $2.67/unitProduct D: ($50,000 x 20%)/2,500 units = $4.00/unit*allocating by volume would allocate all products $2.67/unit ($50,000/18,750 units) of INDIRECT LABOR cost

Wilson Perumal & Company, Inc. 32
Square Root Costing Methodology – Step #5
Step #1
Identify complexity-driven costs
Step #2
Calculate the SQRT of volumes
Step #3
Calculate SQRT allocation %s
Step #4
Calculate actual SQRT cost allocations ($/unit) for complexity-driven costs
Step #5
Consolidate all cost data (by volume, by item, SQRT) for a complete view of costs for each product
9%
13%14%
26%
14%
5%
10%
19%
9%
14%
0%
10%
20%
30%
Budget Below Premium Premium Craft Average
% Operating Margin
Typical standard costing
Complexity-adjusted costing
Vol. (bbls): 12.5M 16.4M 44.3M 4.8M 78.0M

Wilson Perumal & Company, Inc. 33
Agenda
• Introductions
• Complexity
– Sources and impacts of complexity
– Accounting for complexity
– Complexity Costing Exercise
– Developing and using Complexity Value Stream Maps
– Utilizing Portfolio Optimization to root out complexity
– Case Study: Complexity in M&A
• LUNCH
• Operational Excellence (OE)
– Foundations of OE and the Operational Excellence Management System
– Achieving OE with an OEMS – Case Study: Koch Industries, Chevron & BP
• Operational Discipline (OD)
– Driving OE with a culture of Operational Discipline
– Case Study: Deepwater Horizon
• Summary/Closing

Wilson Perumal & Company, Inc. 34
Where to begin:
Identifying sources of complexity is the first step
Identify Sources of Complexity
Assess Impact & Size of the Prize
Prioritize Strategies to
Eliminate
Build Foundation to Sustain
(OEMS)
Complexity reduction overview
Now that you know about complexity – What’s next?
‒ Do you have hidden complexity in your business?
‒ How is complexity impacting your customers? Your internal operations?
‒ Where is complexity hiding? How pervasive is it?
‒ How will you identify the sources of complexity and build momentum?

Wilson Perumal & Company, Inc. 35
Mapping exercises can be a powerful tool to identify complexity and build consensus for change
Source: WP&C approach
Process Maps
Value Stream Maps
Complexity Value Stream Maps
Benefits Limitations
• Simple representation of a distinct process
• Visualize the basic end-to-end process flow
• No quantification and identification of complexity
• Typically a silo perspective
• Takes a broader perspective across entire value stream
• Adds data enabling metrics to measure and improve
• Maps standard process, but ignores variation and deviation
• Not effective at identifying sources of complexity
• Holistic, enabling portfolio and org. perspective across value chain
• Visually shows complexity, in addition to capturing data
• Requires participation from all stakeholders to create
• Rich dialog requires more working sessions
Wilson Perumal & Company, Inc. 36
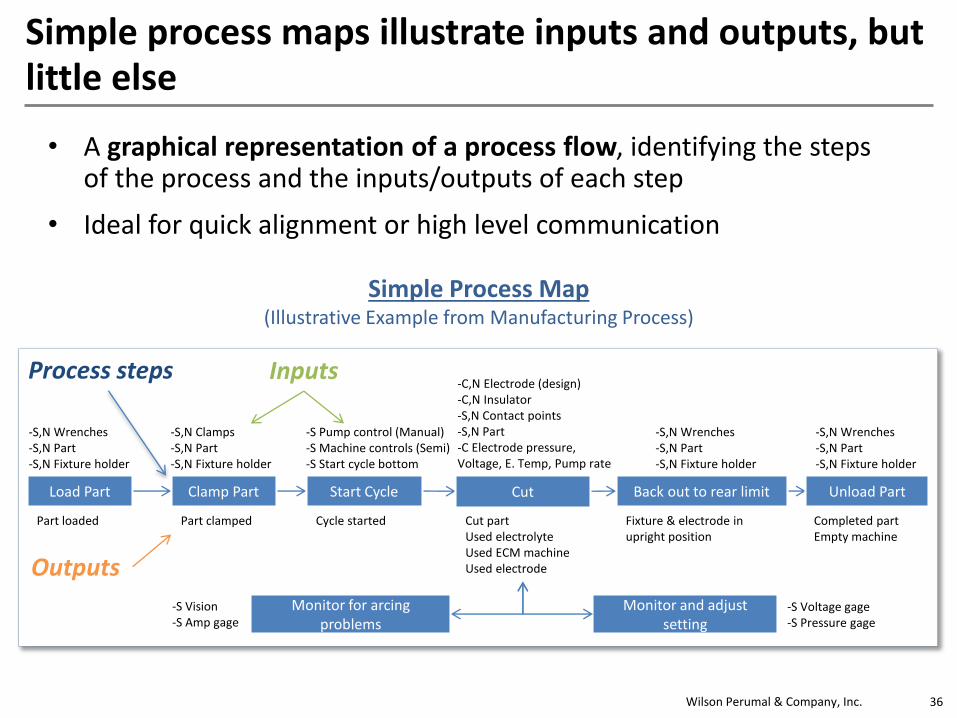
Simple process maps illustrate inputs and outputs, but little else
• A graphical representation of a process flow, identifying the steps of the process and the inputs/outputs of each step
Simple Process Map(Illustrative Example from Manufacturing Process)
Monitor and adjust setting
-S,N Wrenches-S,N Part-S,N Fixture holder
-S,N Clamps-S,N Part-S,N Fixture holder
-S Pump control (Manual)-S Machine controls (Semi)-S Start cycle bottom
-C,N Electrode (design)-C,N Insulator-S,N Contact points-S,N Part-C Electrode pressure, Voltage, E. Temp, Pump rate
Part loaded Part clamped Cycle started Cut partUsed electrolyteUsed ECM machineUsed electrode
-S,N Wrenches-S,N Part-S,N Fixture holder
-S,N Wrenches-S,N Part-S,N Fixture holder
-S Vision-S Amp gage
-S Voltage gage-S Pressure gage
Fixture & electrode in upright position
Completed partEmpty machine
Load Part Clamp Part Start Cycle Cut Back out to rear limit
Monitor for arcing problems
Unload Part
Outputs
InputsProcess steps
• Ideal for quick alignment or high level communication

Wilson Perumal & Company, Inc. 37
Value Stream Maps (VSM) span stakeholders, and add layer of data to better measure the process
• A VSM extends the usefulness of process maps by adding data, such as material and information flow, operating parameters, and lead times
• Ideal to measure and improve a standard process across stakeholders
200,000 pcs/mo
SUPPLIER
2 d
eliv
erie
s/D
ay
CUSTOMER
1000 pcs 5000 pcs 100 pcs 200 pcs
MACHINING
& ASSEMBLY
Forecast, 6 Month, Fax
Order, Weekly (5-day), Fax
Forecast, 90/60/30 Day, Fax
Order, Daily, Fax
CUSTOMER
SERVICEPURCHASING
Work Orders, Daily Release, Paper
X= Raw Casting
Y= Machined pt 1
P/T = 30 Sec
C/O = 30 Min
Uptime 95%
Batch size = 100
MACHINE 1
1x8 hr shift
P/T 145 sec
80 sec
X= Machined pt 2,
bolts, nuts & washer
Y= Assy 1
P/T = 60 Sec
C/O = 5 Min
Uptime 95%
Batch size = 100
ASSEMBLY 1
1x8 hr shift
X= Machined pt 1
Y= Machined pt 2
P/T = 45 Sec
C/O = 60 Min
Uptime 80%
Batch size = 100
MACHINE 2
1x8 hr shift
X= Assy1, o-ring,
bearing, & snap ring
Y= Assy 2
P/T = 50 Sec
C/O = 10 Min
Uptime 95%
Batch size = 100
ASSEMBLY 2
1x8 hr shift
Y= Shipped order
X= Assy2,
Packaging
P/T = 90 Sec
C/O = 10 Min
Uptime 95%
Batch size = 100
DISTRIBUTION
1x8 hr shift
X= Purchased Parts
Y= Raw Casting
P/T = 80 Sec
C/O = 2 Min
Uptime 95%
Batch size = 100
RECEIVING/WHR
1x8 hr shift
500 pcs
1 d
eliv
ery
/Week
45 sec30 sec 60 sec 50 sec 90 sec3 hr1.6 hr92.1 hr23.7 hr1.8 hr PLT 124 hr
20 sec 35 sec 50 sec 40 sec
Machine 2, forgings, bolts, nuts, washers - Daily schedule
Assy 1, o-ring, bearing, snap ring - Daily schedule
Raw castings - Daily schedule
100 pcs 100 pcs100 pcs
Value Stream Map(Illustrative Example from Manufacturing Process)

Wilson Perumal & Company, Inc. 38
Complexity Value Stream Maps (CVSM) are interactive tools used to identify variation and complexity
1 Complexity within a single segment of the process presents an
opportunity for deeper dive diagnostics
2 Complexity across multiple steps presents an opportunity process
improvement across the enterprise
The CVSM is a visual representation of the pain of poor performing, unresponsive, and high-cost processes
1 2
Wilson Perumal & Company, Inc. 39
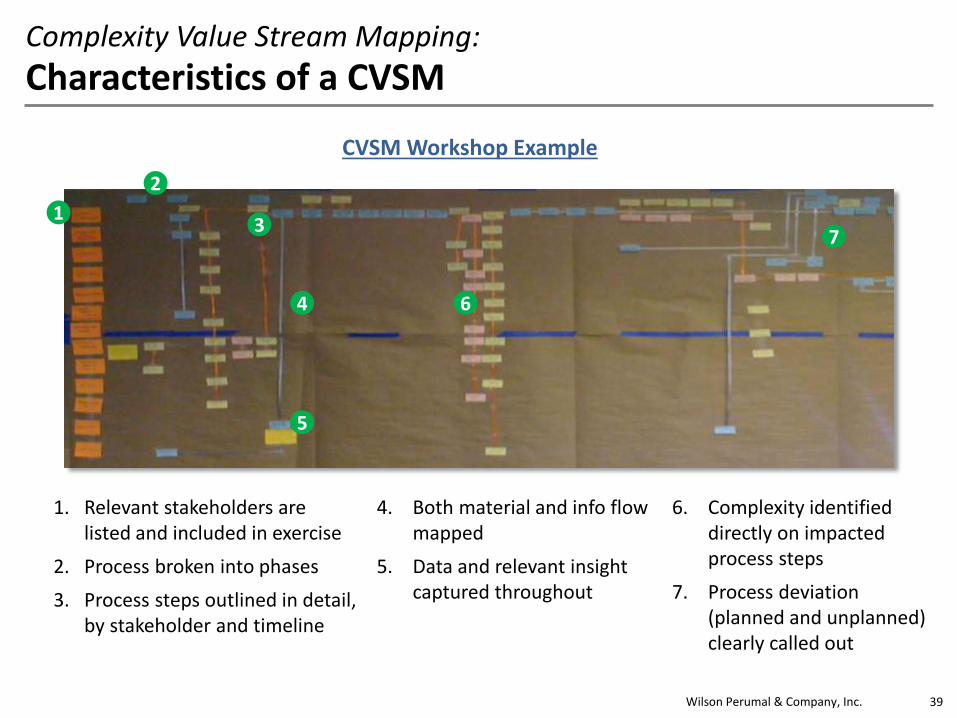
Complexity Value Stream Mapping:
Characteristics of a CVSM
6. Complexity identified directly on impacted process steps
7. Process deviation (planned and unplanned) clearly called out
1
2
3
4
5
7
6
CVSM Workshop Example
4. Both material and info flow mapped
5. Data and relevant insight captured throughout
1. Relevant stakeholders are listed and included in exercise
2. Process broken into phases
3. Process steps outlined in detail, by stakeholder and timeline

Wilson Perumal & Company, Inc. 40
CVSMs are powerful as a display of unique segments, and their interactions with process and stakeholders
All stakeholders included in the map and mapping exercise. Each process step is in their swim lanes. The most common process or segment is mapped first.
Then, additional segments are mapped with supporting data
Vendor Receives
Order
Vendor Ships Order
to DC
DC receives and moves
to Inventory
Order Identified as Direct Ship
Stores scheduled
for delivery
Vendor
D.C.
Segment Deviation (20% of products)
Order placed via order system
Purchasing
Stores confirm
schedule
Retail Store
Wilson Perumal & Company, Inc. 41
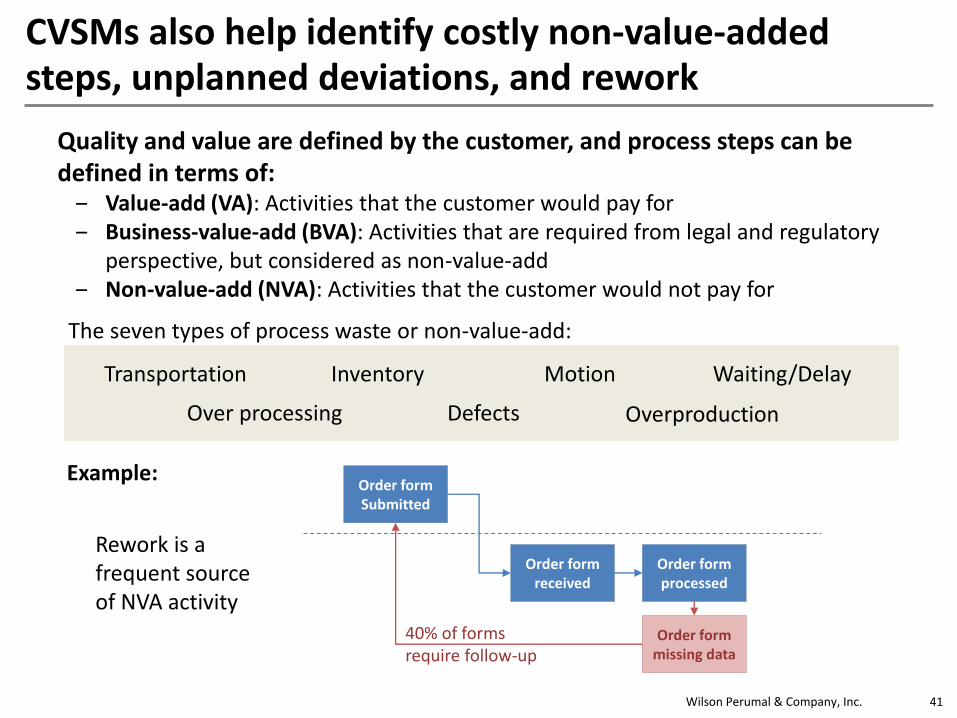
CVSMs also help identify costly non-value-added steps, unplanned deviations, and rework
Quality and value are defined by the customer, and process steps can be defined in terms of:
‒ Value-add (VA): Activities that the customer would pay for‒ Business-value-add (BVA): Activities that are required from legal and regulatory
perspective, but considered as non-value-add‒ Non-value-add (NVA): Activities that the customer would not pay for
Transportation Inventory Motion Waiting/Delay
OverproductionOver processing Defects
The seven types of process waste or non-value-add:
Order form received
Order form missing data
Order form processed
Order form Submitted
40% of forms require follow-up
Rework is a frequent source of NVA activity
Example:

Wilson Perumal & Company, Inc. 42
Ultimately the CVSM is a tool to identify opportunity, and align stakeholders on a path to improvement
Cu
sto
me
r S
ervice
Sh
ip
pin
g/D
istrib
utio
nM
an
ufa
ctu
rin
g/O
pe
ra
tio
ns
Qu
ality A
ssu
ra
nce
/S
yste
ms
Ma
te
ria
ls M
an
ag
em
en
tD
em
an
d/P
ro
du
ctio
n P
la
nn
in
g
Sturgis
North America – Supply Chain
Pu
rch
asin
gS
up
plie
r
Scheduling and Planning Materials Receiving and Purchasing Processing Packing Distribution/Returns
Map Legend
Plug Data into the
Spreadsheet
(Excel)
Review Master
Production
Schedule (MPS)
Receive Request
for Product
Inventory Gap?
Modify Excel
SheetsModify MPS
Verbal Request to
Plant
Sales Forecast
(Monthly)
Sales Fluctuations
and Lost
Production
Impacts Forecast
Reconcile AMAPs
to Forecast
Schedule Frozen
for 3-4 Weeks Out
M Manual activity
Build Excel
Schedule Off of
MPS
Significant
Issue?
Excel Sheet
(Breakdown
from AMAPS)
Shift Change
Meeting
Scheduling
Meeting
(Thursday)
Tweak SchedulePublish Schedule
(Thurs/Fri.)
Calculate Batches
AS400
Print ouf Book
Sort Sections and
Distribute for
Production
Modification to Existing Production Schedule
Assign Batches for
Audit
(Day 0)
Pick Up Signed
Documents
Review Table of
Contents for Batch
File
Audit Filling
Paperwork
(Day 2 or 3 )
Complete NER (If
Necessary)
Analytics
Paperwork (Day 3
or 4)
Micro Paperwork
Liquid
Day 3
Micro Paperwork
Powder
Day 4
Columbus
Provided Tests
(Day 10)
Complete the
Production
Information
Reports (PIRs)
(as Necessary)
Batch Review
Complete
Supervisory
Cursory Review of
Batch Review
Audit
(Day 5 or 6)
Oracle Discover
Report – Weekly
Orders
Order Raw
Materials
Enter PO Release
in AMAPs
(Standing Blanket
POs)
Transmitted to
Vendor via EDI or
Autofax
Batch Feed of
(Overnight) from
AMAPs into
RMMS
Reviews RMMS to
determine
incoming loads
Receive call from
vendor to
Schedule Delivery
Raw Materials
Received
Receiving Enters
Receipt in MITs
Flag Loads without
Delivery
Appointments
Call Vendors on
Flagged Missing
Delivery
Call Vendor for
Past Due Loads
Contact Vendor
About Rejected
Load
Delivery
Scheduled
Receive Work
Order
Stage Minors on
Cart
Move to Inventory
Holding Room
Pre-Stage
Ingredients
Bulk Materials
Move the
Ingredients into
the Dumper
Dump into the Mix
Tank
Blend Tank
(Continuous
Process)
Three tanks
staggered to
pull from the
slurry tanks
continuous
Test PH and
Sediment
Surge Tank (Hold
Tank)Balance Tank Homogenizer
Emolsiphication
Heat Treatment
(ABT Required
NOT legal)
Pasteurization
Finished Product
Tank (30 Min.
Aggitation to make
sure mixed)
Test FP Tank
Correct –
(IF NECESSARY)
Additions
(Water Soluble
Vitamins)
Final Water
PH Test Product
(for Both P and L)Test P1 Micro Test P2 Micro
Staged Batch
Materials
(Materials
Management)
Weigh Room
MITS
Blend Milk Base
(May Use
Reconstituted
CSM or Liquid)
Whey Protein
K-Citrate TestingMarine Oils
Testing
Blend Oil Tanks
Pull from the FP
TankEvaporator Hold Tank
Pasteurization/
Heat Treatment
(Legally Required)
High Pressure
Pump (4200-4800
PSI)
Spray Nozzle Fluid Bed Air Transport Hopper
Isomil ONLY
QA Sediment Test
(1 Per IBC)
QA Analytical Lab
Test
QA Dry Blend
Calculations
(Alimentum Only)
Begin Dryer
Process
Liquid or
Powder
Production?
QA Release Post
Final Water
Hook up Surge
Tank
Flush Tanks
(Depends on
Product
Changeover Grid)
Product Flush
Pre-Load Surge
Tank
(6000 lb Tank)
Begin Filling
Process
“Tap Tone” Cans
(QA done by
Manuf)
Depallitize Cans Depallitize Lids
Sterilizer Retort
(600 Cans Per
Min)
Place Lid and
SeamDryer
Automated
Diversion system to
Hold Cans before
Labeling
“Bright Cans”
Code Cans Labeler
Batch Labels
Tray pack
Tray Pack
Inner Pack (4/6/8
Pack)
Bar Code Scan for
Proper Label (Auto
QA)
Tray Coded Shrink Film
Coded Shrink Film
Palletizer
Palletizer
QA Dilution Test
and Test for Solids
(crack can off the
line)
QA Sterilizer
Check
PH Test Product
(for Both P and L)
QA Dilution Test
and Test for Solids
QA Analytical Lab
Release
Release to
Packaging
(Physical Done by
Ops)
Operations
Checks (Seamer,
etc)
Scoop DropperAir Rinse
Deliver Cans
Move to Filler
C1 and C3 Tested
by QA during First
Hour
Check Weigher
(In Line Test;
Some Clogs)
Seamer (Seam
Bottom of the Can)
Deliver Lids
DedusterCheck Weigher
(Gross
Underwayer)
LabelerVideo Jet (2)
Batch ID
Emboss can with
ID
Bar Code
Challenge (Ops
Check)(Auto
Check)
Overcapper
(Sorter Bowl Used
to Orient Caps)
Overcap Feed
Alpine Conveyors
(Raises
Tray Former
(100%)
Cardboard
Delivery
(Pre Printed)
Shrink Wrap
Feed Film
Bar Code Read
and Check
Overcap
Quality Checks Full Case
Conveyor
F1 and F3 Testing
Final Batch
Testing
Receive Product
Demand
Non-LTL LoadPull Pallets for
Load
Pick LTL
OPS Warehouse
(20%)
Plant
(80% of Volume)
3rd
Party Hub
Before Cut off
Create Master
Order
Master A
Master B
Order
Add C List Orders
Download the
Order to CAMBAR
to Plant
Line Haul Carrier
Picks Bulk Order
Hauls to Pool
Consolidator
Consolidator
Breaks Down the
Orders for Delivery
LTL
LTL for special
clients are sent
direct from AES to
Plant/Hub
Pool ClientCAMBAR
FacilityBuild Truck
Verify Sealed
Truck
Receiving Clerk
Reviews PO
Fork Truck
Unloads Truck
MITS
Visual InspectionMaterial Good
or Bad
Reject Load
Blind Receive on
RF Unit
Compare RF Unit
Report to Packing
List
Correct Count Print MITs LablesSample
Required
QA Tests Sample
Store in
Designated Area
Receive Schedule
from OperationsPull Material
Attached Placard
with Batch Number
Pick for Schedule
and Deliver to Line
Changes to
Schedule results
in re-weights and
batching
~2-4 hours ~3 hours
~6-8 Hours (Including Dump 48 Hours
Add Lactose into
Hopper
M
Run 48 Hours
without CIP; 2-3
CIPs per Week
~ 8 hours
Optimize
(Powder = Min.
Water; Liquid =
Max. Water)
Ratio Testing
Only store for 5 days or
requires additional
testing and potentially
additional Vitamins
Only 50% of the
batches are
Optimized
P3 and P4 Testing
~ 9 Hours – Similac (69K lbs.)
~ 12 Hours – Isomil (76K lbs.)
Pre-Packaging
Hoppers (4)
~ 7 hours
Shrink FilmPalletizer
Liquid
Powder
Agglomerator
9 Hours for 69K lbs.
12 hours 210K lbs. at 600 cans
IEmpty Bottles and Cans
IDeliver Lids
ILabels (Caged)
ILabels (Caged)
IEmpty Bottles
and Cans
IDeliver Lids
Weight Checker
F1 and F2 TestPSV Test and
Dilution Testing
~ 20 Min. to change Label
Every label change
requires a manual
line clearance
check and sign-off
Shrink film causing
packaging
problems
Product Release
Issued
~ 48 hours
I
I
I
I I
Auditors have 4-5
Open Batch Files at
a Time; Finish 1-2
Per Day
RBA (sub
Program of
AS400)
I Inventory
Excel Sheets
AMAPs
Stretch Wrap
Pallets
Label Pallet with
CAMBAR License
Plate
Deliver to Finish
Good Warehouse
Stored in
Warehouse On-Site
or Off-Site
Stretch Wrap
Pallets
Pallet is Moved to
Yard Trailer for
Shuttling
Pallet Stored in
Designated
Location
Switcher Moves
Full Trailer to Off-
Site
Pallets Stored in
Designated
Location
Sample
Requested
30-50% of
Palletized Finished
Product Pulled for
Sampling
Pull Samples for
Quality Assurance
Test Samples
Pulled from
Inventory
Pallets Waiting on
QA Release
Batch Released by
QA
FG Inbound from
Other Plants/Third
Party
Live Load?
Stage in Yard
Unload at
Warehouse DoorPO or ASN
Create PO in
CAMBARPrint PO
Label Pallet with
License Plate
Scan License
Plate the Bar Code
on PO and Enter
Quantity
Select ASN in
CAMBAR
CAMBAR
CAMBAR
Scan Pallet and
Receive
Pull Pallets for LTL
Pick Area
Sufficient
Inventory in
LTL Pick Area
Generate Pick
Load Against
Inventory
Inventory On-
Site?
Missing Inventory
Loaded from Off-
Site onto Shuttle
Trailer
Switcher Delivers
Load
LTL Pallets are
Staged in LTL
Stage Lanes
Print Customer
Pallet Labels/
Placards
No Special
Customer
Instructions
Label/Placard
Pallet and Affix
Other
Specifications
Lo
gistics
Full Load or
LTL
LTL Loads
Schedule Full
Truck Load Pick
Up
Full Truck Load
Remote Customer
Orders Sent to
OPS Warehouses
Receive Demand
Inputs
Sales, Marketing,
VMI, Integrated
Marketing, Finance
Demand Side
Analysis
Supply Side
Analysis
Demand Business
Unit Meeting
Functional
Agreement
Determine
Capacity
Constraints
Functional
Agreement
Coordinate and
Aggregate Info;
Update Forecast
Pre-S&OP
Meeting
Business S&OP
MeetingExecutive S&OP
Release New 12
Month ForecastDemand Pre-Work
Finance, Integrated
Marketing, Marketing,
Sales, VMI
Production Planning,
Logistics, Quality
Assurance, Plants,
Purchasing, TPM
Operations, Finance,
Integrated Marketing,
Plant, Production
Planning, Sales
Business Unit GM,
Finance, Integrated
Marketing, Marketing,
Operations, Production
Planning, Plant, Sales
Business Unit GM,
Finance, Integrated
Marketing, IS, Sales,
Operations
AES (SAP)
Order
Management
Customer Phones
in Return
Generate RIN for
Product Return
> 10 Cases or
< 10 Cases
Autofax sent to
Carrier
Contact Customer
to Schedule Pick
Up
Pick Not Scheduled May Require Customer to Re-contact Customer Service
Carrier Delivery
Return for
Processing
Direct Ship Returned to Plant or Public Warehouse
Pool Agent
Consolidates
Returns
Pool Client or
Direct Ship
Hubs can restock
but not destroy;
Plants can restock
or destroy
Determine
Saleable vs.
Unsaleable
Returns Counts
Transmitted from
Plant
ETCI System
Calculate Credit
Based on Last
Sale Price
Transmitted to AR
SAP
Restock or
Destroy
Enter into
Inventory for
Resale
Schedule for
Destruction
Fedex Tag
Generated and
Mailed to
Customer
Customer
Attaches Fedex
Tag and
Schedules Pick Up
Fedex Picks Up
and Delivers to
DRS
DRS Scans
Tracking #, Lot #
and Item #
DRS Sends to
Waste
Management Land
Fill
Saleable or
Unsaleable?
Generate RIN from
Return Request
Schedule DRS to
Pick Up
DRS Schedules
Pick UpLarge Retail
Weekly Pick Up at
Reclamation
Center
Pick up at
Customer site
Scan Quantity,
Return Reason,
Item, Etc.
DRS System
Counts Calculate
Credit Based on
Fixed Price
(Highest Bracket;
Lowest Price)
ETCI
Transmitted to AR
Inventory
Accounting
Adjustment
SAP
Validate Inventory
MITS
Sufficient
Inventory for
PO
Cut Unavailable Refresh PO
SAP
Identify Source
Site
CAMBAR
Transmit Order to
the Plant or
CAMBAR
Warehouse
TTMS
(Identifies Primary,
Secondary and
Tertiary Delivery
LTL or Full
Load
Food Mart
Customer
Areas of operating complexity and/ or process inefficiency
Rework loop
Planning – adjustments and modifications
QA process is long
Dryer capacity limitations
Sample QA requests pulling product
Returns – expensive and inefficient
Cu
sto
me
r S
ervice
Sh
ip
pin
g/D
istrib
utio
nM
an
ufa
ctu
rin
g/O
pe
ra
tio
ns
Qu
ality A
ssu
ra
nce
/S
yste
ms
Ma
te
ria
ls M
an
ag
em
en
tD
em
an
d/P
ro
du
ctio
n P
la
nn
in
g
Sturgis
North America – Supply Chain
Pu
rch
asin
gS
up
plie
r
Scheduling and Planning Materials Receiving and Purchasing Processing Packing Distribution/Returns
Map Legend
Plug Data into the
Spreadsheet
(Excel)
Review Master
Production
Schedule (MPS)
Receive Request
for Product
Inventory Gap?
Modify Excel
SheetsModify MPS
Verbal Request to
Plant
Sales Forecast
(Monthly)
Sales Fluctuations
and Lost
Production
Impacts Forecast
Reconcile AMAPs
to Forecast
Schedule Frozen
for 3-4 Weeks Out
M Manual activity
Build Excel
Schedule Off of
MPS
Significant
Issue?
Excel Sheet
(Breakdown
from AMAPS)
Shift Change
Meeting
Scheduling
Meeting
(Thursday)
Tweak SchedulePublish Schedule
(Thurs/Fri.)
Calculate Batches
AS400
Print ouf Book
Sort Sections and
Distribute for
Production
Modification to Existing Production Schedule
Assign Batches for
Audit
(Day 0)
Pick Up Signed
Documents
Review Table of
Contents for Batch
File
Audit Filling
Paperwork
(Day 2 or 3 )
Complete NER (If
Necessary)
Analytics
Paperwork (Day 3
or 4)
Micro Paperwork
Liquid
Day 3
Micro Paperwork
Powder
Day 4
Columbus
Provided Tests
(Day 10)
Complete the
Production
Information
Reports (PIRs)
(as Necessary)
Batch Review
Complete
Supervisory
Cursory Review of
Batch Review
Audit
(Day 5 or 6)
Oracle Discover
Report – Weekly
Orders
Order Raw
Materials
Enter PO Release
in AMAPs
(Standing Blanket
POs)
Transmitted to
Vendor via EDI or
Autofax
Batch Feed of
(Overnight) from
AMAPs into
RMMS
Reviews RMMS to
determine
incoming loads
Receive call from
vendor to
Schedule Delivery
Raw Materials
Received
Receiving Enters
Receipt in MITs
Flag Loads without
Delivery
Appointments
Call Vendors on
Flagged Missing
Delivery
Call Vendor for
Past Due Loads
Contact Vendor
About Rejected
Load
Delivery
Scheduled
Receive Work
Order
Stage Minors on
Cart
Move to Inventory
Holding Room
Pre-Stage
Ingredients
Bulk Materials
Move the
Ingredients into
the Dumper
Dump into the Mix
Tank
Blend Tank
(Continuous
Process)
Three tanks
staggered to
pull from the
slurry tanks
continuous
Test PH and
Sediment
Surge Tank (Hold
Tank)Balance Tank Homogenizer
Emolsiphication
Heat Treatment
(ABT Required
NOT legal)
Pasteurization
Finished Product
Tank (30 Min.
Aggitation to make
sure mixed)
Test FP Tank
Correct –
(IF NECESSARY)
Additions
(Water Soluble
Vitamins)
Final Water
PH Test Product
(for Both P and L)Test P1 Micro Test P2 Micro
Staged Batch
Materials
(Materials
Management)
Weigh Room
MITS
Blend Milk Base
(May Use
Reconstituted
CSM or Liquid)
Whey Protein
K-Citrate TestingMarine Oils
Testing
Blend Oil Tanks
Pull from the FP
TankEvaporator Hold Tank
Pasteurization/
Heat Treatment
(Legally Required)
High Pressure
Pump (4200-4800
PSI)
Spray Nozzle Fluid Bed Air Transport Hopper
Isomil ONLY
QA Sediment Test
(1 Per IBC)
QA Analytical Lab
Test
QA Dry Blend
Calculations
(Alimentum Only)
Begin Dryer
Process
Liquid or
Powder
Production?
QA Release Post
Final Water
Hook up Surge
Tank
Flush Tanks
(Depends on
Product
Changeover Grid)
Product Flush
Pre-Load Surge
Tank
(6000 lb Tank)
Begin Filling
Process
“Tap Tone” Cans
(QA done by
Manuf)
Depallitize Cans Depallitize Lids
Sterilizer Retort
(600 Cans Per
Min)
Place Lid and
SeamDryer
Automated
Diversion system to
Hold Cans before
Labeling
“Bright Cans”
Code Cans Labeler
Batch Labels
Tray pack
Tray Pack
Inner Pack (4/6/8
Pack)
Bar Code Scan for
Proper Label (Auto
QA)
Tray Coded Shrink Film
Coded Shrink Film
Palletizer
Palletizer
QA Dilution Test
and Test for Solids
(crack can off the
line)
QA Sterilizer
Check
PH Test Product
(for Both P and L)
QA Dilution Test
and Test for Solids
QA Analytical Lab
Release
Release to
Packaging
(Physical Done by
Ops)
Operations
Checks (Seamer,
etc)
Scoop DropperAir Rinse
Deliver Cans
Move to Filler
C1 and C3 Tested
by QA during First
Hour
Check Weigher
(In Line Test;
Some Clogs)
Seamer (Seam
Bottom of the Can)
Deliver Lids
DedusterCheck Weigher
(Gross
Underwayer)
LabelerVideo Jet (2)
Batch ID
Emboss can with
ID
Bar Code
Challenge (Ops
Check)(Auto
Check)
Overcapper
(Sorter Bowl Used
to Orient Caps)
Overcap Feed
Alpine Conveyors
(Raises
Tray Former
(100%)
Cardboard
Delivery
(Pre Printed)
Shrink Wrap
Feed Film
Bar Code Read
and Check
Overcap
Quality Checks Full Case
Conveyor
F1 and F3 Testing
Final Batch
Testing
Receive Product
Demand
Non-LTL LoadPull Pallets for
Load
Pick LTL
OPS Warehouse
(20%)
Plant
(80% of Volume)
3rd
Party Hub
Before Cut off
Create Master
Order
Master A
Master B
Order
Add C List Orders
Download the
Order to CAMBAR
to Plant
Line Haul Carrier
Picks Bulk Order
Hauls to Pool
Consolidator
Consolidator
Breaks Down the
Orders for Delivery
LTL
LTL for special
clients are sent
direct from AES to
Plant/Hub
Pool ClientCAMBAR
FacilityBuild Truck
Verify Sealed
Truck
Receiving Clerk
Reviews PO
Fork Truck
Unloads Truck
MITS
Visual InspectionMaterial Good
or Bad
Reject Load
Blind Receive on
RF Unit
Compare RF Unit
Report to Packing
List
Correct Count Print MITs LablesSample
Required
QA Tests Sample
Store in
Designated Area
Receive Schedule
from OperationsPull Material
Attached Placard
with Batch Number
Pick for Schedule
and Deliver to Line
Changes to
Schedule results
in re-weights and
batching
~2-4 hours ~3 hours
~6-8 Hours (Including Dump 48 Hours
Add Lactose into
Hopper
M
Run 48 Hours
without CIP; 2-3
CIPs per Week
~ 8 hours
Optimize
(Powder = Min.
Water; Liquid =
Max. Water)
Ratio Testing
Only store for 5 days or
requires additional
testing and potentially
additional Vitamins
Only 50% of the
batches are
Optimized
P3 and P4 Testing
~ 9 Hours – Similac (69K lbs.)
~ 12 Hours – Isomil (76K lbs.)
Pre-Packaging
Hoppers (4)
~ 7 hours
Shrink FilmPalletizer
Liquid
Powder
Agglomerator
9 Hours for 69K lbs.
12 hours 210K lbs. at 600 cans
IEmpty Bottles and Cans
IDeliver Lids
ILabels (Caged)
ILabels (Caged)
IEmpty Bottles
and Cans
IDeliver Lids
Weight Checker
F1 and F2 TestPSV Test and
Dilution Testing
~ 20 Min. to change Label
Every label change
requires a manual
line clearance
check and sign-off
Shrink film causing
packaging
problems
Product Release
Issued
~ 48 hours
I
I
I
I I
Auditors have 4-5
Open Batch Files at
a Time; Finish 1-2
Per Day
RBA (sub
Program of
AS400)
I Inventory
Excel Sheets
AMAPs
Stretch Wrap
Pallets
Label Pallet with
CAMBAR License
Plate
Deliver to Finish
Good Warehouse
Stored in
Warehouse On-Site
or Off-Site
Stretch Wrap
Pallets
Pallet is Moved to
Yard Trailer for
Shuttling
Pallet Stored in
Designated
Location
Switcher Moves
Full Trailer to Off-
Site
Pallets Stored in
Designated
Location
Sample
Requested
30-50% of
Palletized Finished
Product Pulled for
Sampling
Pull Samples for
Quality Assurance
Test Samples
Pulled from
Inventory
Pallets Waiting on
QA Release
Batch Released by
QA
FG Inbound from
Other Plants/Third
Party
Live Load?
Stage in Yard
Unload at
Warehouse DoorPO or ASN
Create PO in
CAMBARPrint PO
Label Pallet with
License Plate
Scan License
Plate the Bar Code
on PO and Enter
Quantity
Select ASN in
CAMBAR
CAMBAR
CAMBAR
Scan Pallet and
Receive
Pull Pallets for LTL
Pick Area
Sufficient
Inventory in
LTL Pick Area
Generate Pick
Load Against
Inventory
Inventory On-
Site?
Missing Inventory
Loaded from Off-
Site onto Shuttle
Trailer
Switcher Delivers
Load
LTL Pallets are
Staged in LTL
Stage Lanes
Print Customer
Pallet Labels/
Placards
No Special
Customer
Instructions
Label/Placard
Pallet and Affix
Other
Specifications
Lo
gistics
Full Load or
LTL
LTL Loads
Schedule Full
Truck Load Pick
Up
Full Truck Load
Remote Customer
Orders Sent to
OPS Warehouses
Receive Demand
Inputs
Sales, Marketing,
VMI, Integrated
Marketing, Finance
Demand Side
Analysis
Supply Side
Analysis
Demand Business
Unit Meeting
Functional
Agreement
Determine
Capacity
Constraints
Functional
Agreement
Coordinate and
Aggregate Info;
Update Forecast
Pre-S&OP
Meeting
Business S&OP
MeetingExecutive S&OP
Release New 12
Month ForecastDemand Pre-Work
Finance, Integrated
Marketing, Marketing,
Sales, VMI
Production Planning,
Logistics, Quality
Assurance, Plants,
Purchasing, TPM
Operations, Finance,
Integrated Marketing,
Plant, Production
Planning, Sales
Business Unit GM,
Finance, Integrated
Marketing, Marketing,
Operations, Production
Planning, Plant, Sales
Business Unit GM,
Finance, Integrated
Marketing, IS, Sales,
Operations
AES (SAP)
Order
Management
Customer Phones
in Return
Generate RIN for
Product Return
> 10 Cases or
< 10 Cases
Autofax sent to
Carrier
Contact Customer
to Schedule Pick
Up
Pick Not Scheduled May Require Customer to Re-contact Customer Service
Carrier Delivery
Return for
Processing
Direct Ship Returned to Plant or Public Warehouse
Pool Agent
Consolidates
Returns
Pool Client or
Direct Ship
Hubs can restock
but not destroy;
Plants can restock
or destroy
Determine
Saleable vs.
Unsaleable
Returns Counts
Transmitted from
Plant
ETCI System
Calculate Credit
Based on Last
Sale Price
Transmitted to AR
SAP
Restock or
Destroy
Enter into
Inventory for
Resale
Schedule for
Destruction
Fedex Tag
Generated and
Mailed to
Customer
Customer
Attaches Fedex
Tag and
Schedules Pick Up
Fedex Picks Up
and Delivers to
DRS
DRS Scans
Tracking #, Lot #
and Item #
DRS Sends to
Waste
Management Land
Fill
Saleable or
Unsaleable?
Generate RIN from
Return Request
Schedule DRS to
Pick Up
DRS Schedules
Pick UpLarge Retail
Weekly Pick Up at
Reclamation
Center
Pick up at
Customer site
Scan Quantity,
Return Reason,
Item, Etc.
DRS System
Counts Calculate
Credit Based on
Fixed Price
(Highest Bracket;
Lowest Price)
ETCI
Transmitted to AR
Inventory
Accounting
Adjustment
SAP
Validate Inventory
MITS
Sufficient
Inventory for
PO
Cut Unavailable Refresh PO
SAP
Identify Source
Site
CAMBAR
Transmit Order to
the Plant or
CAMBAR
Warehouse
TTMS
(Identifies Primary,
Secondary and
Tertiary Delivery
LTL or Full
Load
Food Mart
Customer
Areas of operating complexity and/ or process inefficiency
Rework loop
Planning – adjustments and modifications
QA process is long
Dryer capacity limitations
Sample QA requests pulling product
Returns – expensive and inefficientCustomer
Sales
Cust. Service
Warehouse
Vendor
QA
Engineering
Distribution
Finance
Complexity Value Stream Map(Illustrative End-to-End Example)

Wilson Perumal & Company, Inc. 43
A CVSM allows us to see the business through a different lens
• Differs from standard VSMs by looking at the entire value stream and how different functions and product families interact during the process
• Builds clearer understanding:
– The interaction of different things throughout the processes
– How those interactions affect what the customer sees, as well as how the organization must operate
– The impact of physical and electronic “hand-offs”, rework loops, and IT integration within the processes that may be driving the cost of complexity
• Enables team to determine:
– The financial impact of complexity on the existing processes
– The impact of individual products or product families on capacity, flexibility, and speed
– Whether the organization is properly allocating overhead based on product specific complexity inherent in the existing processes
– The potential effect a product or product family has on the overall quality of the organization
Wilson Perumal & Company, Inc. 44
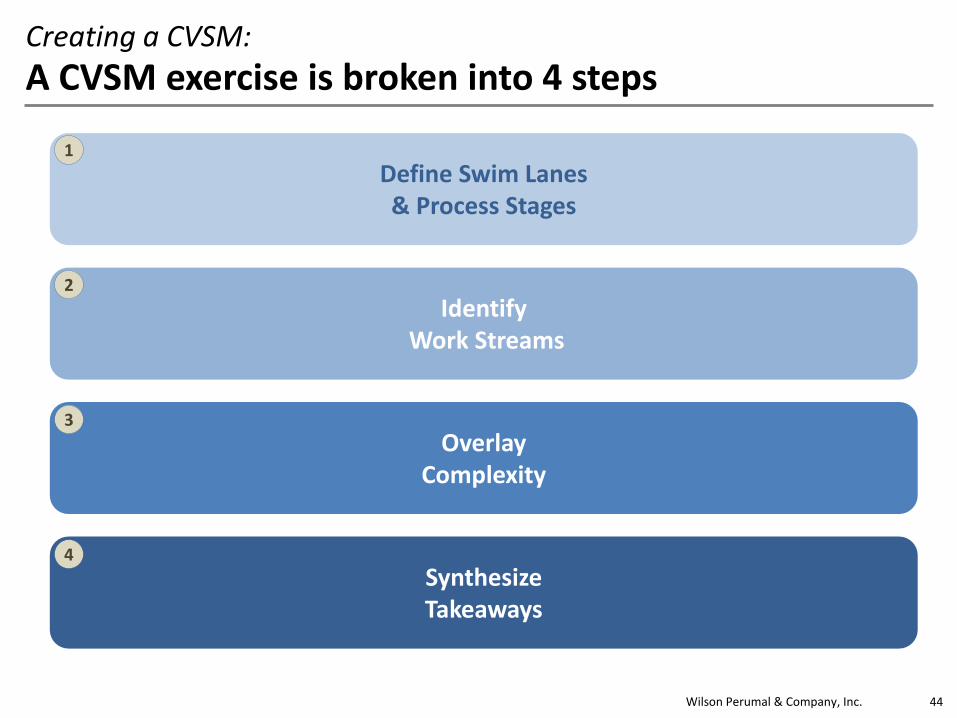
Creating a CVSM:
A CVSM exercise is broken into 4 steps
Define Swim Lanes & Process Stages
IdentifyWork Streams
Overlay Complexity
Synthesize Takeaways
1
2
3
4
Wilson Perumal & Company, Inc. 45
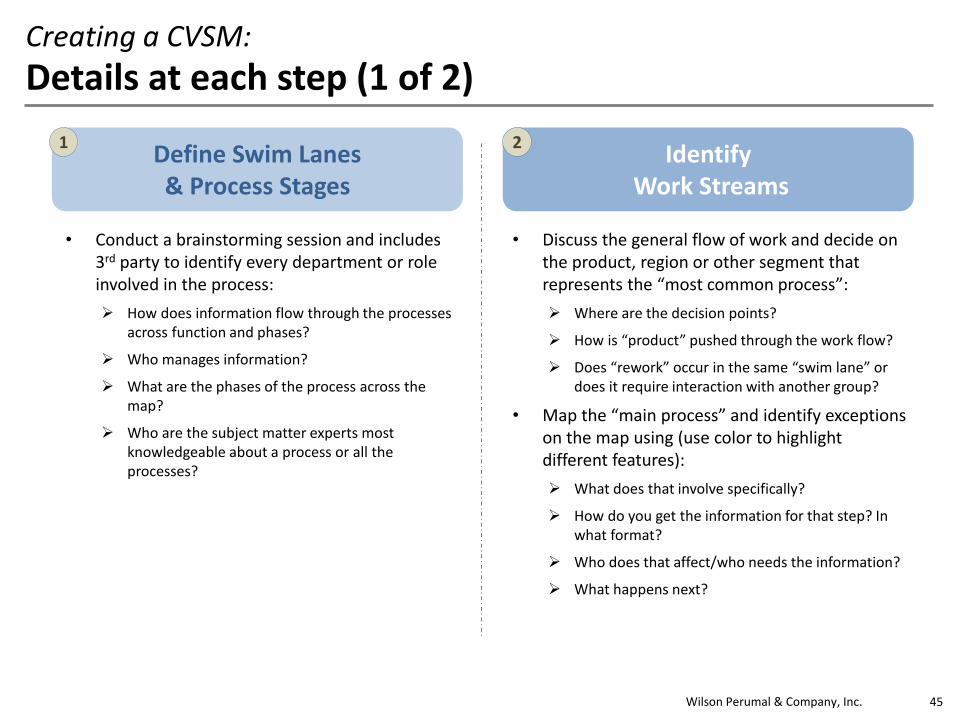
Define Swim Lanes & Process Stages
IdentifyWork Streams
• Conduct a brainstorming session and includes 3rd party to identify every department or role involved in the process:
How does information flow through the processes across function and phases?
Who manages information?
What are the phases of the process across the map?
Who are the subject matter experts most knowledgeable about a process or all the processes?
• Discuss the general flow of work and decide on the product, region or other segment that represents the “most common process”:
Where are the decision points?
How is “product” pushed through the work flow?
Does “rework” occur in the same “swim lane” or does it require interaction with another group?
• Map the “main process” and identify exceptions on the map using (use color to highlight different features):
What does that involve specifically?
How do you get the information for that step? In what format?
Who does that affect/who needs the information?
What happens next?
Creating a CVSM:
Details at each step (1 of 2)
1 2

Wilson Perumal & Company, Inc. 46
Overlay Complexity Synthesize Takeaways
Effort
Be
ne
fit
Balanced Agenda:
Return on invested resources may come with
time or may be a “first
step”
• Used data to quantify complexity and call out concerns, deep dive questions are key:
How long does (and how long can) that take?
What data do we need to determine efficiency and capacity?
How does Product A’s process differ?
What are the process cycle-times each step of the process? Value-add time? Non-Value add time?
Where is inventory building up? How much standing inventory? WIP?
How much time is spent fixing defects/rework?
What is the demand rate (take time)? changeover times? daily “up time”? How long are the queues?
• Document red flags, every exceptions
Red Flags: In large processes, “Red Flags” are easily identifiable and should capture the majority of complexity concerns
Every Exception: In deep dive projects, it may be useful and feasible to document and consider every exception
• Collecting and formatting the takeaways:
Documenting the exceptions and red flags in an actionable manner
• The CVSM is also a great source for estimating baseline Process Cycle Efficiency
• Red Flag documentation
Opportunity matrix and, after further analysis, a benefit-effort matrix
EXAMPLE
Creating a CVSM:
Details at each step (2 of 2)
3 4
Quick wins
Long term
Medium term
Wilson Perumal & Company, Inc. 47
Interactive Demonstration:
Building a CVSM

Wilson Perumal & Company, Inc.
Cu
sto
mer
Sale
sC
on
trac
tsLe
gal
Fulf
illm
en
t
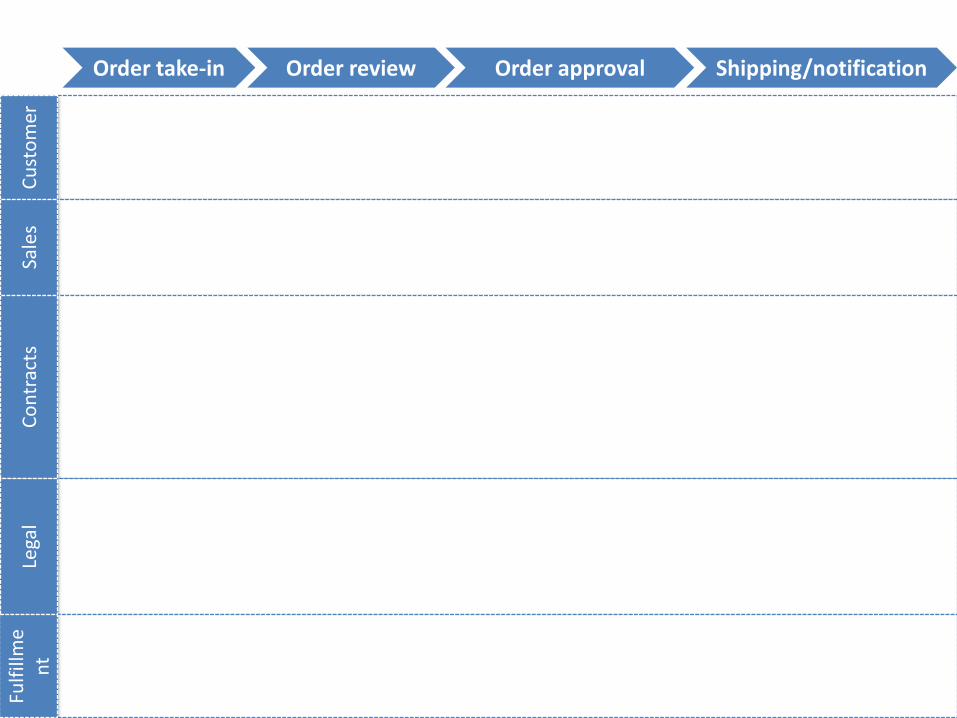
Wilson Perumal & Company, Inc.
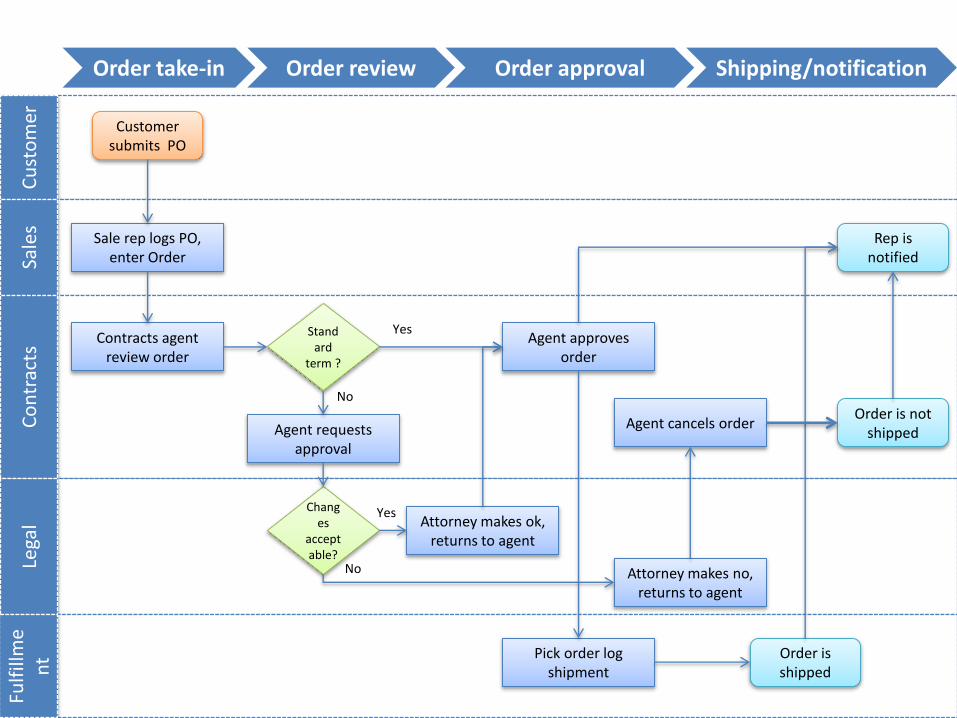
Order take-in Order review Order approval Shipping/notification
Cu
sto
mer
Sale
sC
on
trac
tsLe
gal
Fulf
illm
en
t

Wilson Perumal & Company, Inc.
Cu
sto
mer
Sale
sC
on
trac
tsLe
gal
Fulf
illm
en
t
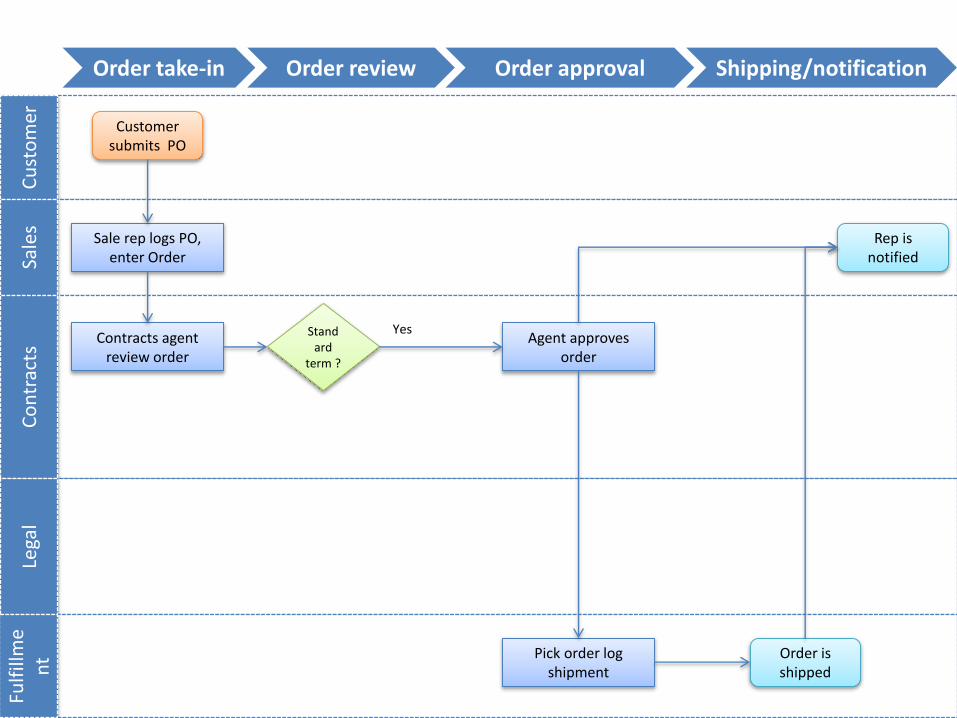
Customer submits PO
Order take-in Order review Order approval Shipping/notification
Wilson Perumal & Company, Inc.
Cu
sto
mer
Sale
sC
on
trac
tsLe
gal
Fulf
illm
en
t
Customer submits PO
Sale rep logs PO, enter Order
Contracts agent review order
Agent approves order
Pick order log shipment
Rep is notified
Order is shipped
Standard
term ?
Yes
Order take-in Order review Order approval Shipping/notification
Wilson Perumal & Company, Inc.
Cu
sto
mer
Sale
sC
on
trac
tsLe
gal
Fulf
illm
en
t
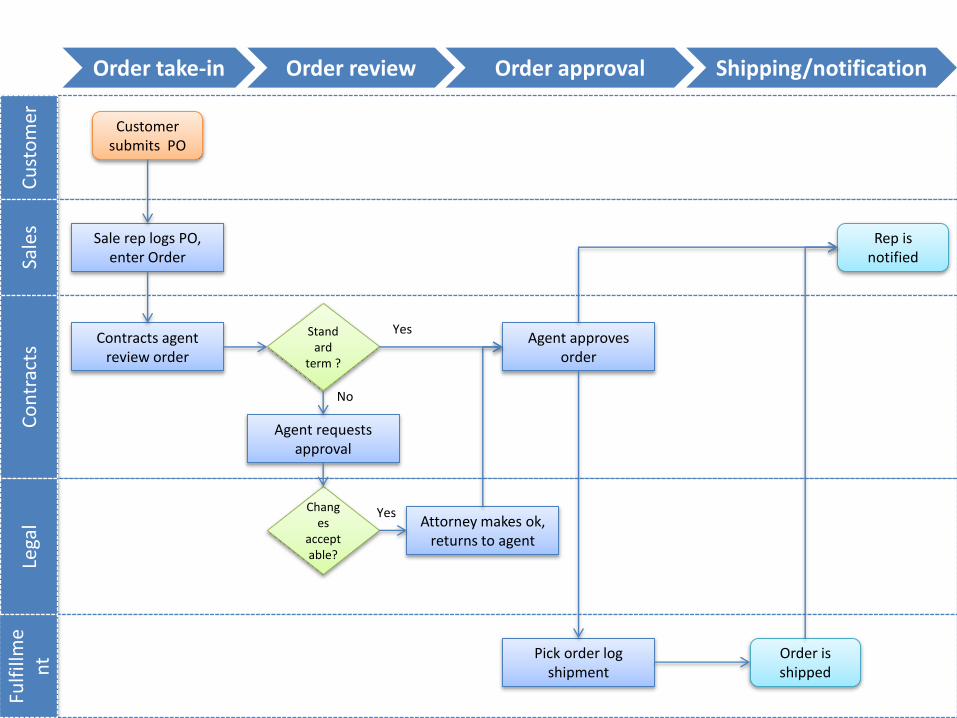
Customer submits PO
Sale rep logs PO, enter Order
Contracts agent review order
Agent approves order
Agent requests approval
Pick order log shipment
Attorney makes ok, returns to agent
Rep is notified
Order is shipped
Standard
term ?
Changes
acceptable?
Yes
Yes
No
Order take-in Order review Order approval Shipping/notification
Wilson Perumal & Company, Inc.
Cu
sto
mer
Sale
sC
on
trac
tsLe
gal
Fulf
illm
en
t
Customer submits PO
Sale rep logs PO, enter Order
Contracts agent review order
Agent approves order
Agent requests approval
Pick order log shipment
Attorney makes no, returns to agent
Attorney makes ok, returns to agent
Agent cancels order
Rep is notified
Order is not shipped
Order is shipped
Standard
term ?
Changes
acceptable?
Yes
Yes
No
No
Order take-in Order review Order approval Shipping/notification
24 hr 12-48 hr12 hr 12 hr

Wilson Perumal & Company, Inc.
Cu
sto
mer
Sale
sC
on
trac
tsLe
gal
Fulf
illm
en
t
Customer submits PO
Sale rep logs PO, enter Order
Contracts agent review order
Order take-in Order review
Order form missing data
24 hr
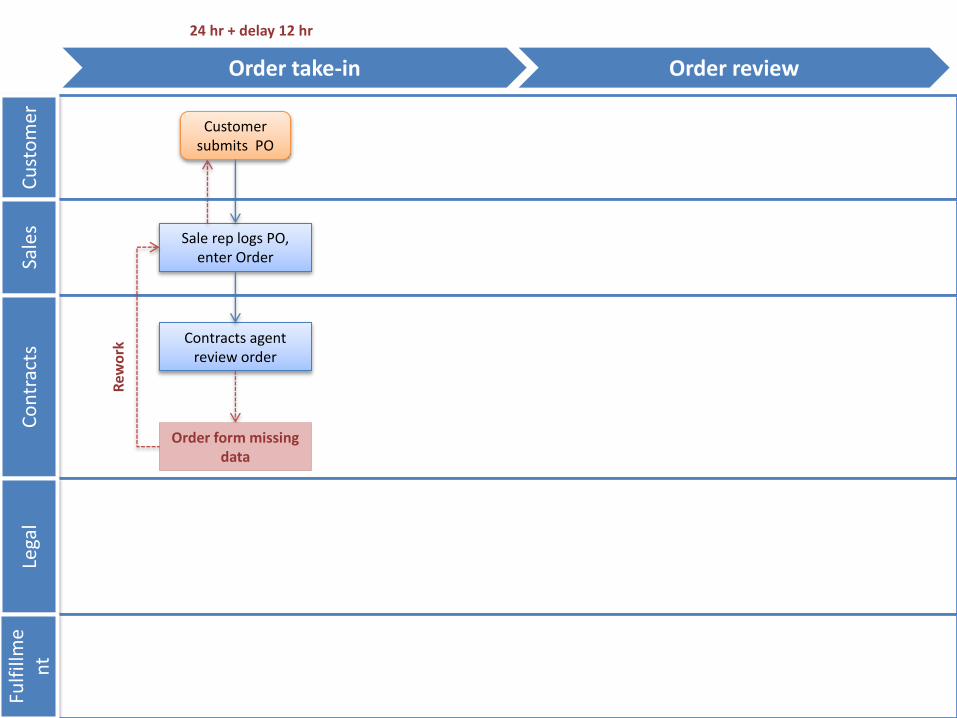
Wilson Perumal & Company, Inc.
Cu
sto
mer
Sale
sC
on
trac
tsLe
gal
Fulf
illm
en
t
Customer submits PO
Sale rep logs PO, enter Order
Contracts agent review order
Order take-in Order review
Rew
ork
Order form missing data
24 hr + delay 12 hr

Wilson Perumal & Company, Inc. 57
Agenda
• Introductions
• Complexity
– Sources and impacts of complexity
– Accounting for complexity
– Complexity Costing Exercise
– Developing and using Complexity Value Stream Maps
– Utilizing Portfolio Optimization to root out complexity
– Case Study: Complexity in M&A
• LUNCH
• Operational Excellence (OE)
– Foundations of OE and the Operational Excellence Management System
– Achieving OE with an OEMS – Case Study: Koch Industries, Chevron & BP
• Operational Discipline (OD)
– Driving OE with a culture of Operational Discipline
– Case Study: Deepwater Horizon
• Summary/Closing

Wilson Perumal & Company, Inc. 58
Recall that complexity can be in the form of products, processes or organizational complexity
Organization
Value add
Non-value add
The Complexity Cube
The interactions between product-process-org create cost and impede productivity; therefore assessing these interactions can be a fruitful angle of investigation

©2011 Wilson Perumal & Company, Inc. 59
Why is portfolio optimization important?
• Often the most profitable 20% to 30% of products generate more than 300% of the profits in a company, meaning…
• …the remaining 70% to 80% lose 200% of the profits.
Products that
create profit
Products that
“lose” profit
0% 25% 50% 75% 100%
100%
300%
% Total Products
0%
% Total
Profits
Portfolio optimization is one of the simplest ways to quickly and effectively reduce complexity
Source: Sievanen, Suomala, and Paranko, Activity-Based Costing and Product Profitability (Tampere, Finland: Institute for Industrial Management, Tampere University of Technology)

©2011 Wilson Perumal & Company, Inc. 60
Portfolio Optimization means looking “deeper” into the portfolio substitutability

Wilson Perumal & Company, Inc.Source: WP&C approach
61
Portfolio optimization requires consideration of 6 facets of the business
• How does SKU variety impact process performance, cost and inventory?
• How many SKUs can the process support?
• Where will benefits be realized?
• From where will costs be extracted post range optimization?
• At what level of reduction are disproportionate benefits realized?
• What is the firm’s value proposition?
• How does the firm compete?
• Where does product line overlap (i.e., substitutability)?
• Where are there gaps or opportunities for growth?
• How do we compete in each region?
Strategy
Breakpoints
Integration framework
• Which products are profitable-GP vs OP?
• After complexity adjusted costing?
• After taking an incremental view?
Portfolio optimization requires consideration of 6 facets of the business
WP&C’s 6-facet methodology

Wilson Perumal & Company, Inc.
Strategy
Breakpoints
What are the gaps or overlaps in the product line? Is there customer
confusion or over-choice?
Integration framework
62
Portfolio Optimization Facet:
Product Line Coverage
• Complexity injects noise between you and your customer
• Portfolios with too much complexity almost always have gaps as well
• This is not just a cost/profitability issue but a sales issue as well
What should your product portfolio be from just a coverage perspective?
What we see:
Wilson Perumal & Company, Inc.
Strategy
Breakpoints
Integration framework
What is the impact of portfolio complexity on
process & organizational performance?
63
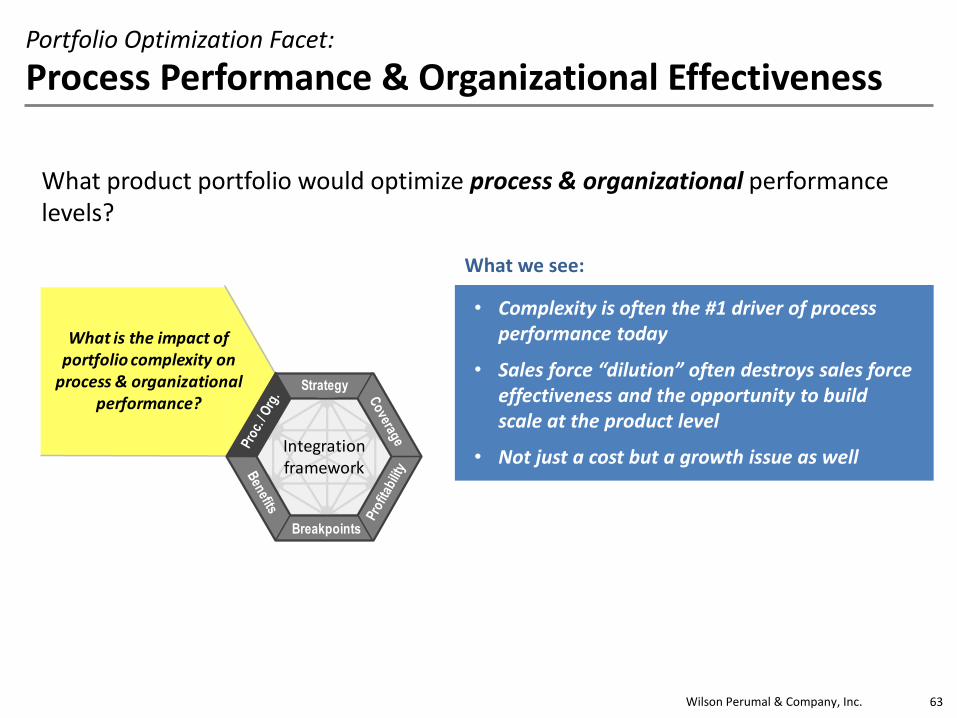
Portfolio Optimization Facet:
Process Performance & Organizational Effectiveness
• Complexity is often the #1 driver of process performance today
• Sales force “dilution” often destroys sales force effectiveness and the opportunity to build scale at the product level
• Not just a cost but a growth issue as well
What we see:
What product portfolio would optimize process & organizational performance levels?
Wilson Perumal & Company, Inc.
Strategy
Breakpoints
Integration framework
What is the true profitability across the
portfolio?
64
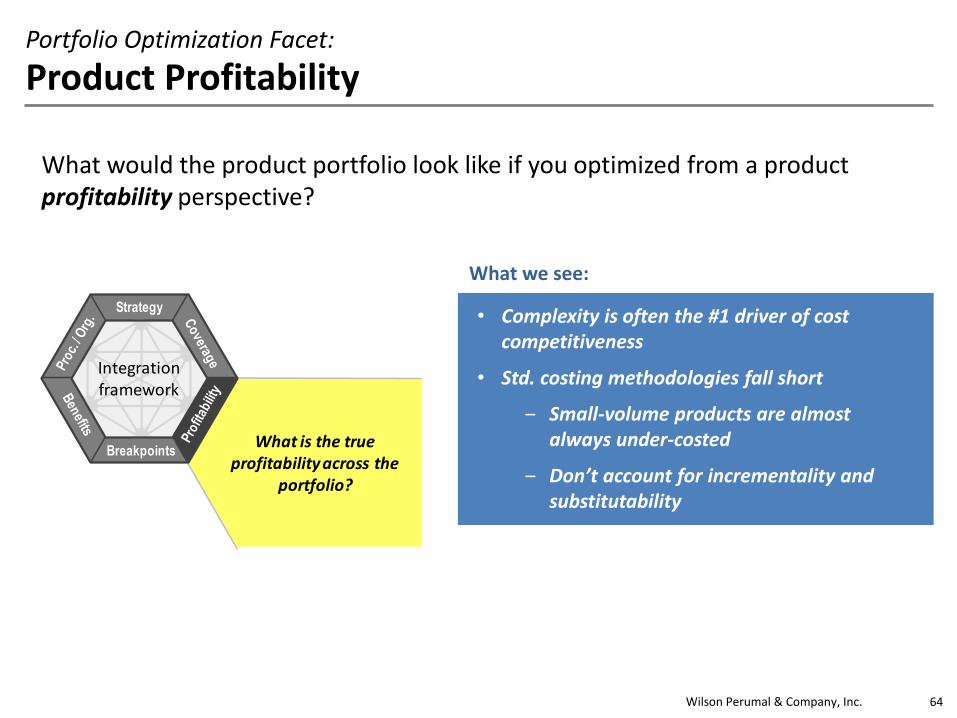
Portfolio Optimization Facet:
Product Profitability
• Complexity is often the #1 driver of cost competitiveness
• Std. costing methodologies fall short
‒ Small-volume products are almost always under-costed
‒ Don’t account for incrementality and substitutability
What we see:
What would the product portfolio look like if you optimized from a product profitability perspective?

Wilson Perumal & Company, Inc.
Strategy
Breakpoints
Integration framework
From where will benefits be realized?
65
Portfolio Optimization Facet:
Benefits
• Complexity reduction creates the opportunity for benefit, not the benefit itself
• Integrating complexity reduction with other initiatives yields disproportionate benefit—complexity is often the key enabler
What we see:
From where will benefits be realized? What is the line of sight from product rationalization to benefit capture?

Wilson Perumal & Company, Inc.
Strategy
Integration framework
Breakpoints
At what level of complexity are
there step changes in cost?
66
Portfolio Optimization Facet:
Opportunity Breakpoints
• Costs creep in incrementally but you must take them out in chunks
• Product rationalization efforts often fail by not going deep enough to make fundamental changes to the business
What we see:
What level of product rationalization, i.e. breakpoint, would allow you to release a chunk of cost or dramatically change your cost structure?

Wilson Perumal & Company, Inc. 67
Portfolio Optimization Facet:
Strategic Alignment
• Portfolio optimization is a strategic question, and the primary driver of value capture from the marketplace
• It is about reclaiming scale, which requires clarity, focus, and alignment
• The same actions that companies take in order to grow often place a ceiling on their ability to grow
What we see:
What product portfolio would best supports the business strategy? Where should you build focus and scale?
Integration framework
Breakpoints
Strategy
How does the product line align
with or impede the business
strategy?
©2011 Wilson Perumal & Company, Inc. 68
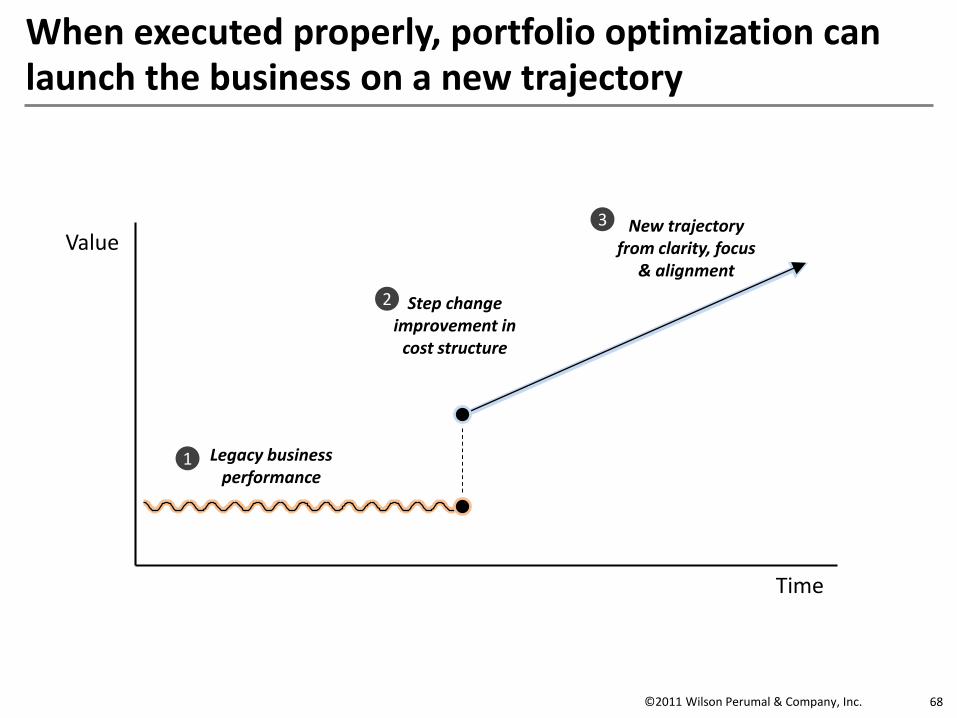
When executed properly, portfolio optimization can launch the business on a new trajectory
Value
Time
Legacy business performance
Step change improvement in
cost structure
New trajectory from clarity, focus
& alignment
1
2
3

©2011 Wilson Perumal & Company, Inc. 69
Key takeaways
• Complexity reduction creates the opportunity for benefit, not the benefit itself
• Substitutability is a significant lever to reduce costs without significantly impacting revenue
• Portfolio optimization will fail to produce lasting benefits if an integrated approach is not used
• Portfolio optimization can drive growth, not just cost reduction
Wilson Perumal & Company, Inc. 70
Agenda
• Introductions
• Complexity
– Sources and impacts of complexity
– Accounting for complexity
– Complexity Costing Exercise
– Developing and using Complexity Value Stream Maps
– Utilizing Portfolio Optimization to root out complexity
– Case Study: Complexity in M&A
• LUNCH
• Operational Excellence (OE)
– Foundations of OE and the Operational Excellence Management System
– Achieving OE with an OEMS – Case Study: Koch Industries, Chevron & BP
• Operational Discipline (OD)
– Driving OE with a culture of Operational Discipline
– Case Study: Deepwater Horizon
• Summary/Closing
Wilson Perumal & Company, Inc.Source: Merger Market Group “Monthly M&A Insider”, Oct 2014 71
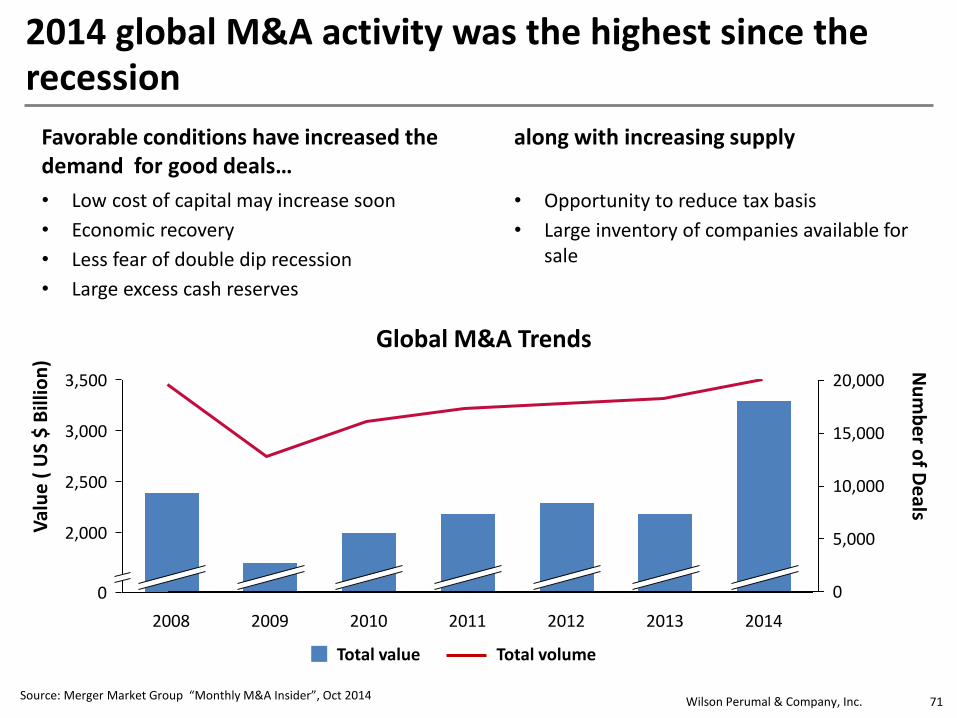
2014 global M&A activity was the highest since the recession
Global M&A Trends
3,500
3,000
2,500
2,000
0
2010 2014201320112009 20122008
10,000
0
20,000
5,000
15,000
Val
ue
( U
S $
Bill
ion
) Nu
mb
er o
f De
als
Total value Total volume
• Low cost of capital may increase soon
• Economic recovery
• Less fear of double dip recession
• Large excess cash reserves
• Opportunity to reduce tax basis
• Large inventory of companies available for sale
Favorable conditions have increased the demand for good deals…
along with increasing supply

Wilson Perumal & Company, Inc.
Source 1: Deloitte “M&A Trends Report 2014”; 2: Bain & Co Brief, “The renaissance in mergers and acquisitions: a lesson from the 2000s” 72
Executives continue to see M&A as a key component of their growth strategy
M&A is the primary intended use of excess cash for 30% of corporations1
44%
30%
8%
5%
2%
11%
Invest organically
Seek to merge or acquire
Buy back stock
One-time dividend
Other
Not applicable
Because those who do it right significantly outperform their peers2
4.0%
3.3%
Large DealsNo M&A Many & Large Deals
Many Deals
4.5%
6.4%
Annual total shareholder returns (CAGR 2000-2010)
Average TSR for all = 4.5%
Primary intended use for excess cash, 2014

Wilson Perumal & Company, Inc.Source 1: various M&A industry reports 73
Yet the majority of M&A deals fail
With so many deals, you would expect higher success rates
50 – 80%1
failure rate

Wilson Perumal & Company, Inc.Source: McKinsey & Company, “McKinsey on Finance, Winter 2004” 74
Most reasons provided for failure focus on the analytical process of due diligence
Overestimate
• Top line growth: 70% of deals failed to realize top-line sales synergies1
• Cost savings: 1 out of 4 deals overestimates cost synergies by at least 25%1
Underestimate
• Customer fall out: average between 2-5% of customers leave1
• Transition costs: often overlooked relative to cost savings11 1 >2

Wilson Perumal & Company, Inc. 75
We believe most of these assessments are missing the key reason for failure of M&A
Complexity
Wilson Perumal & Company, Inc. 76
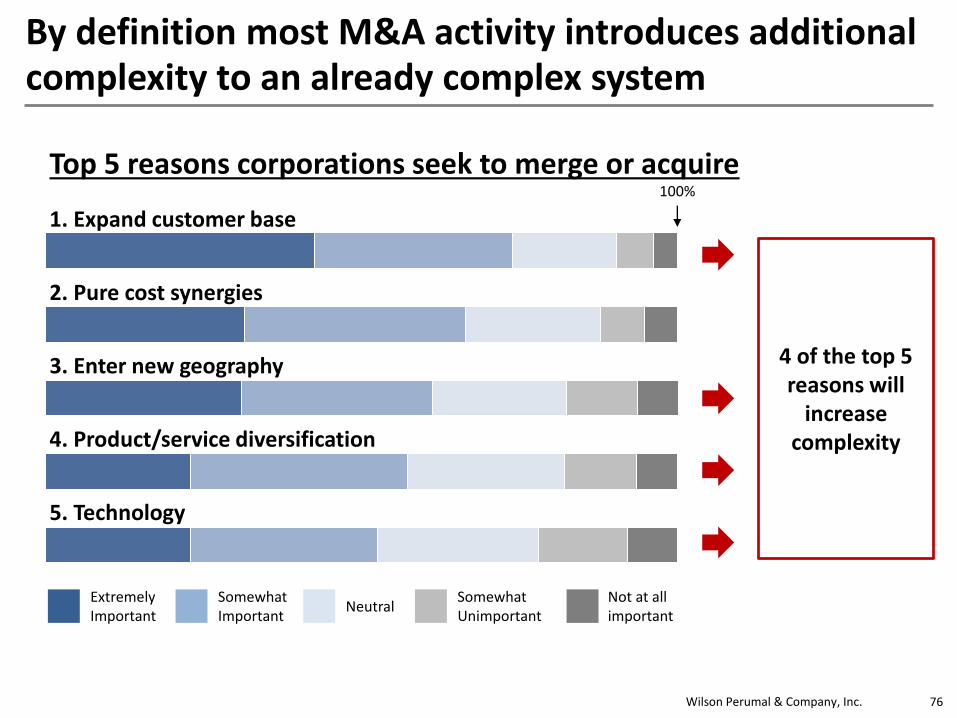
By definition most M&A activity introduces additional complexity to an already complex system
100%
Extremely Important
Somewhat Important
NeutralSomewhat Unimportant
Not at all important
1. Expand customer base
2. Pure cost synergies
3. Enter new geography
4. Product/service diversification
5. Technology
Top 5 reasons corporations seek to merge or acquire
4 of the top 5 reasons will
increase complexity
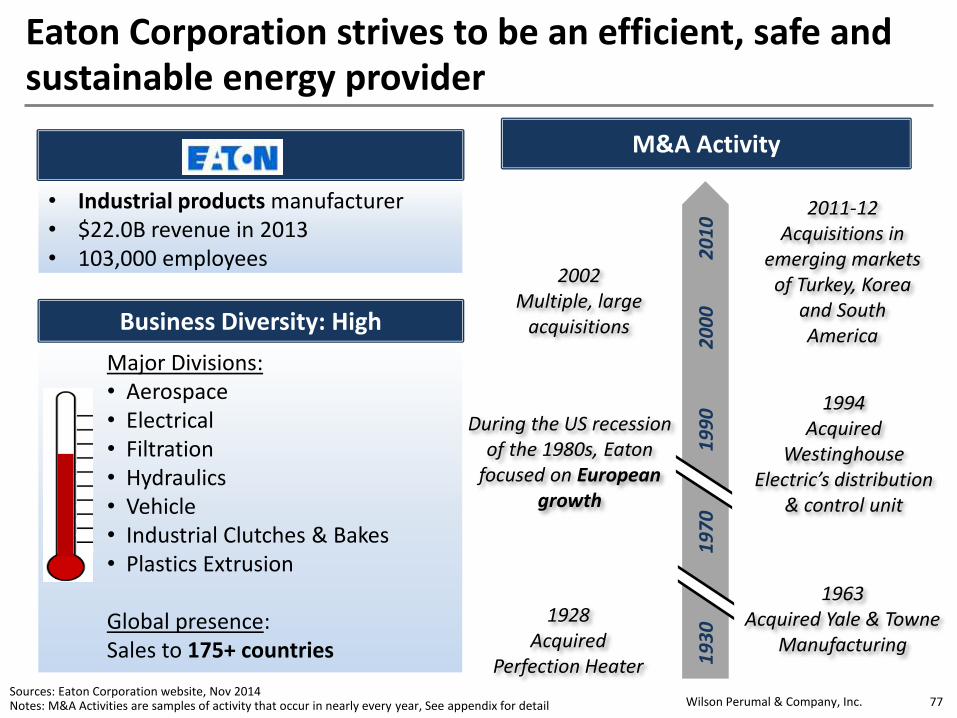
Wilson Perumal & Company, Inc.Sources: Eaton Corporation website, Nov 2014Notes: M&A Activities are samples of activity that occur in nearly every year, See appendix for detail 77
Eaton Corporation strives to be an efficient, safe and sustainable energy provider
• Industrial products manufacturer• $22.0B revenue in 2013• 103,000 employees
Business Diversity: High
Major Divisions: • Aerospace• Electrical• Filtration• Hydraulics• Vehicle• Industrial Clutches & Bakes• Plastics Extrusion
Global presence: Sales to 175+ countries
M&A Activity
19
30
19
70
19
90
20
10
20
00
2002Multiple, large
acquisitions
1928Acquired
Perfection Heater
1963Acquired Yale & Towne
Manufacturing
1994Acquired
Westinghouse Electric’s distribution
& control unit
2011-12 Acquisitions in
emerging markets of Turkey, Korea
and South America
During the US recession of the 1980s, Eaton
focused on European growth
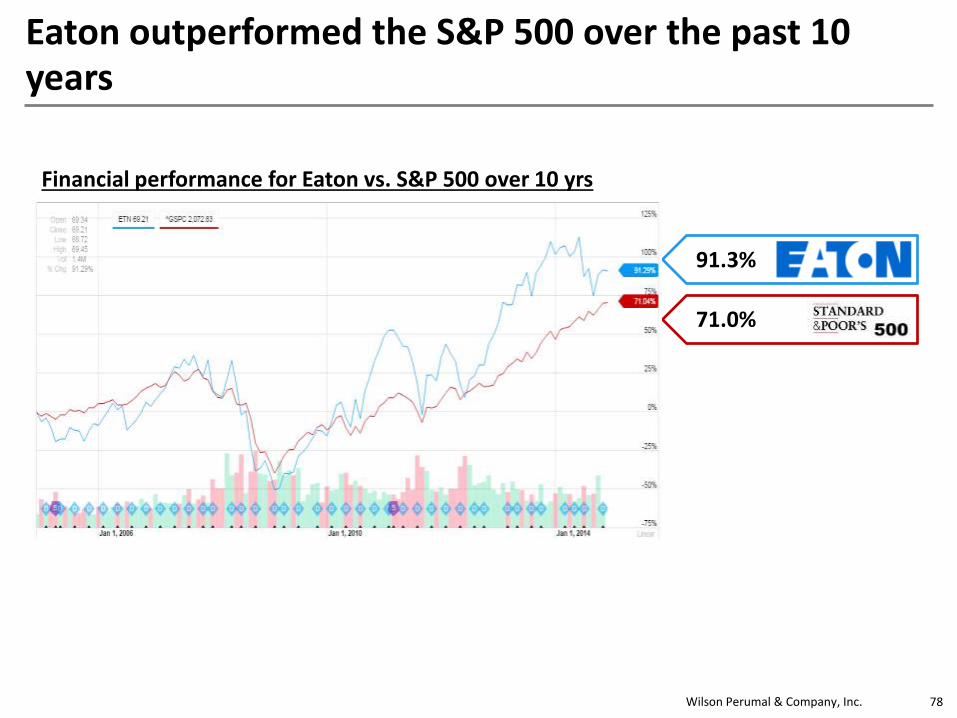
Wilson Perumal & Company, Inc. 78
Eaton outperformed the S&P 500 over the past 10 years
91.3%
71.0%
Financial performance for Eaton vs. S&P 500 over 10 yrs

Wilson Perumal & Company, Inc.Sources: Danaher website, Nov 2014; Fortuna Advisors, 2010; Yahoo Finance, Nov 2014Notes: M&A Activities are samples of activity that occur in nearly every year, See appendix for detail 79
Danaher endeavors to improve quality of life through serial acquisitions
• Global science and technology innovator
• $19.1B revenue in 2013
• 66,000 employees
Business Diversity: High
Reporting Segments: • Environmental• Test & Measurement• Dental• Life Sciences & Diagnostics • Industrial Technologies
M&A Activity
Since 1984 Danaher has acquired more than 400 companies.
1980 1990 20102000
Merged with Beckman Coulter (lab diagnostics)
Acquired 12 companies including UK-based West Instrument
Acquired Maconi Data systems
Acquired Pacific Scientific Company

Wilson Perumal & Company, Inc. 80
Danaher outperformed the market by 2.7X
190.8%
71.1%
Financial performance for Danaher vs. S&P 500 over 10 yrs
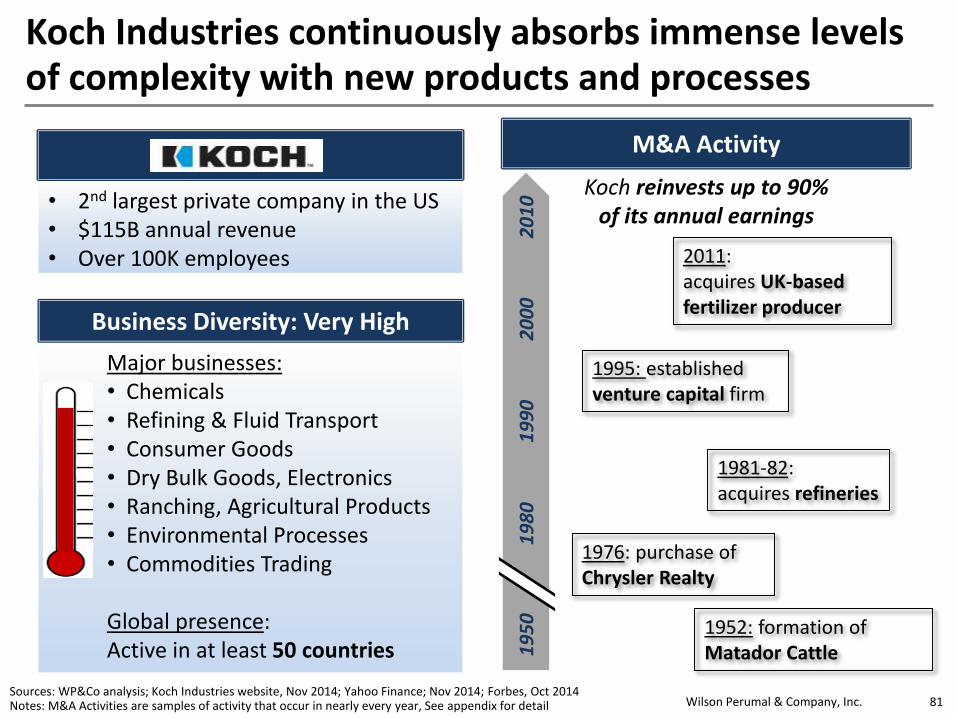
Wilson Perumal & Company, Inc.Sources: WP&Co analysis; Koch Industries website, Nov 2014; Yahoo Finance; Nov 2014; Forbes, Oct 2014Notes: M&A Activities are samples of activity that occur in nearly every year, See appendix for detail 81
Koch Industries continuously absorbs immense levels of complexity with new products and processes
• 2nd largest private company in the US• $115B annual revenue• Over 100K employees
Business Diversity: Very High
Major businesses: • Chemicals• Refining & Fluid Transport• Consumer Goods• Dry Bulk Goods, Electronics• Ranching, Agricultural Products• Environmental Processes• Commodities Trading
Global presence: Active in at least 50 countries
M&A Activity
Koch reinvests up to 90% of its annual earnings
19
50
19
80
19
90
20
10
20
00
2011: acquires UK-based fertilizer producer
1981-82: acquires refineries
1976: purchase of Chrysler Realty
1995: established venture capital firm
1952: formation of Matador Cattle

Wilson Perumal & Company, Inc. 82
Koch Industries increased 4200X in value over a 50 year period
4200X
30X

Wilson Perumal & Company, Inc. 83
These 3 companies are so successful because they eliminate non-value added complexity
M&A Complexity
Value Added Non-value AddedComplexity that adds value to your customers & is reason for M&A
Complexity that adds no value to your end customers
Products
Suppliers
Technology
Geography
Channels
Management System
Culture
1. Management System and Culture always add almost exclusively NVA Complexity2. Most difficult to assess through due diligence3. Most commonly ignored factors4. Unlike other complexity, far more difficult to remove
Management System
Culture
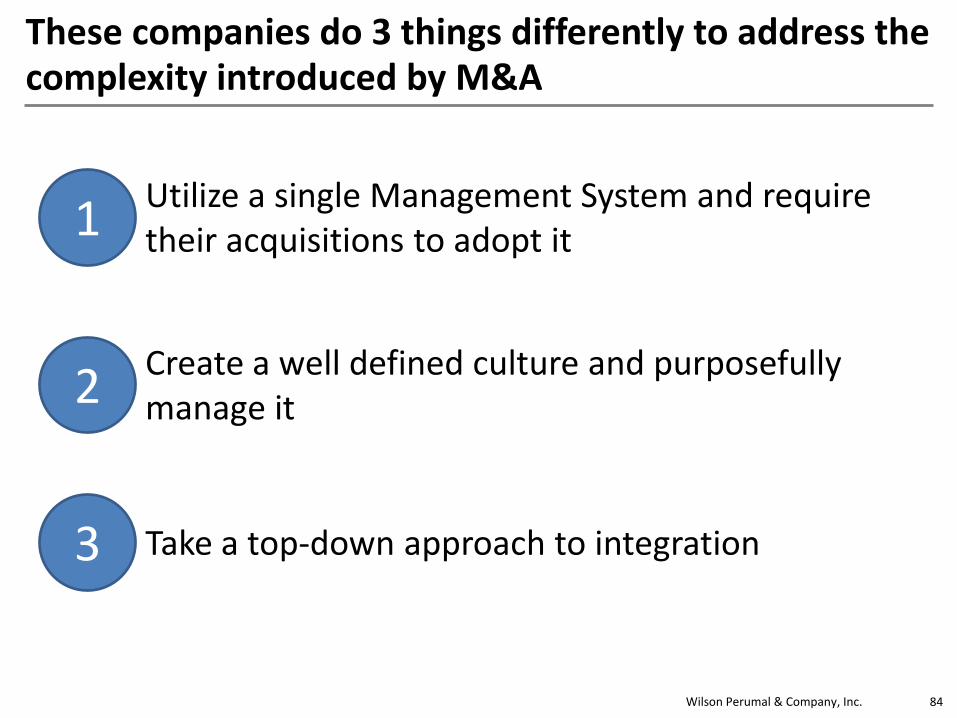
Wilson Perumal & Company, Inc. 84
These companies do 3 things differently to address the complexity introduced by M&A
Utilize a single Management System and require their acquisitions to adopt it
Create a well defined culture and purposefully manage it
Take a top-down approach to integration
1
2
3

Wilson Perumal & Company, Inc. 85
Agenda
• Introductions
• Complexity
– Sources and impacts of complexity
– Accounting for complexity
– Complexity Costing Exercise
– Developing and using Complexity Value Stream Maps
– Utilizing Portfolio Optimization to root out complexity
– Case Study: Complexity in M&A
• LUNCH
• Operational Excellence (OE)
– Foundations of OE and the Operational Excellence Management System
– Achieving OE with an OEMS – Case Study: Koch Industries, Chevron & BP
• Operational Discipline (OD)
– Driving OE with a culture of Operational Discipline
– Case Study: Deepwater Horizon
• Summary/Closing

Wilson Perumal & Company, Inc.
Operational Excellence delivers industry leading performance across 7 Value Drivers
Given two companies with similar strategies, the one that executes better will have greater performance across all 7 Value Drivers.
Sound
Strategy
Operational
Excellence
Leading
Performance
7 Value Drivers
1. Safety2. Environment3. Compliance4. Quality5. Productivity6. Yield 7. Cost
Strategy
1. Product portfolio2. Markets served3. Distribution channels4. Price point5. Level of service6. Partnerships7. Operating model
Operational excellence is the execution of the business strategy more consistently
and reliably than the competition.
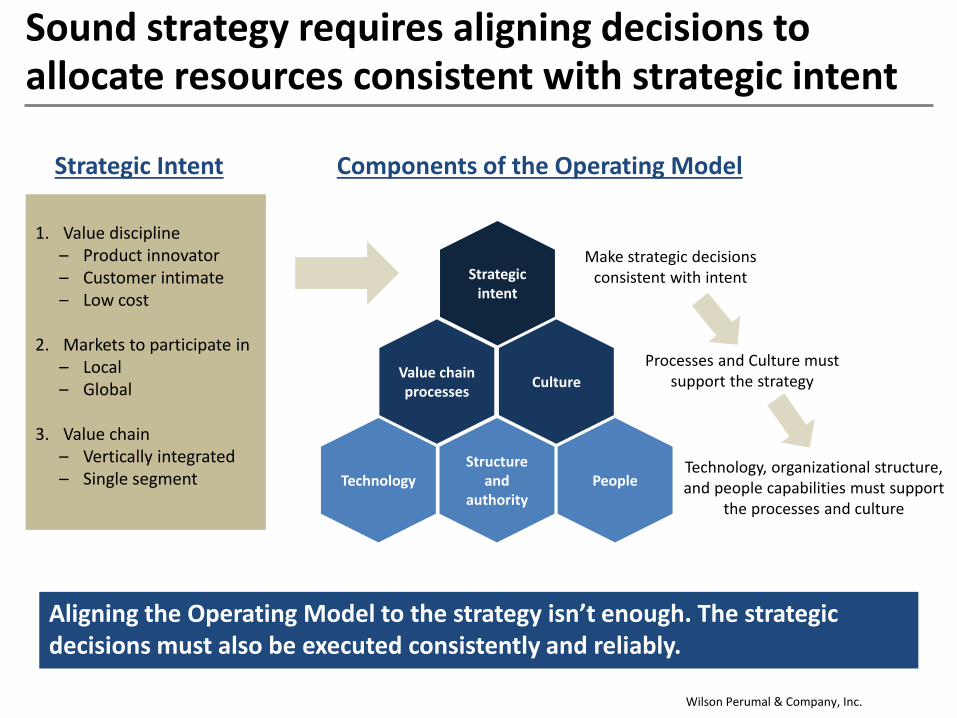
Wilson Perumal & Company, Inc.
Technology
Strategic intent
Value chain processes
Culture
Structure and
authorityPeople
Sound strategy requires aligning decisions to allocate resources consistent with strategic intent
Make strategic decisions consistent with intent
1. Value discipline– Product innovator– Customer intimate– Low cost
2. Markets to participate in– Local– Global
3. Value chain– Vertically integrated– Single segment
Processes and Culture must support the strategy
Technology, organizational structure, and people capabilities must support
the processes and culture
Strategic Intent Components of the Operating Model
Aligning the Operating Model to the strategy isn’t enough. The strategic decisions must also be executed consistently and reliably.

Wilson Perumal & Company, Inc. 88
The foundations of an Operational Excellence Management System
Key Value Drivers
OE is defined by measurable business performance across specific value drivers
Safety
Environment
Compliance
Quality
Productivity
Yield
Cost
What risk exists that can keep a company from achieving performance across the value drivers?

Wilson Perumal & Company, Inc.
The 4 Sources of Risk
EquipmentProcessesPeopleInputsActed on
byTo
produce
Finished Goods/Services
The Operation
Any failure of the operation to produce a good or service that meets the customers requirements is a result of 1 of 4 sources:
1. A person failed to do what they were expected to do.2. A process failed to perform as expected3. A piece of equipment failed to perform as expected4. Un-managed change

Wilson Perumal & Company, Inc. 90
The foundations of an Operational Excellence Management System
Key Value Drivers
Four Sources of
Risk
OE is defined by measurable business performance across specific value drivers
There are only four sources of risk for failure
to perform against the value drivers
Safety
Environment
Compliance
Quality
Productivity
Yield
Cost
People
Processes
Equipment
Change
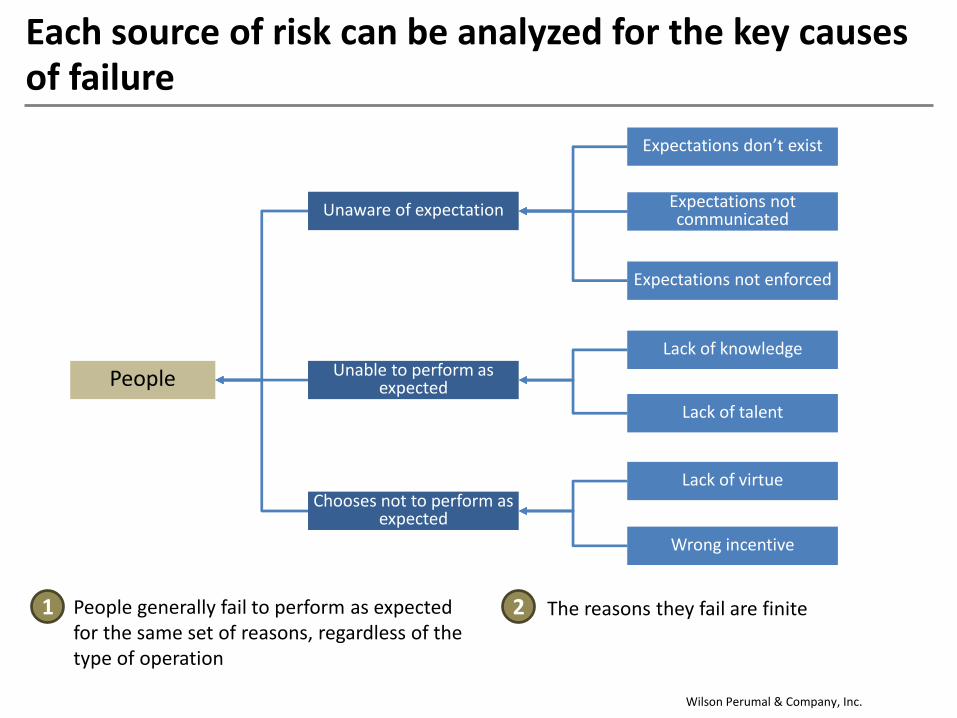
Wilson Perumal & Company, Inc.
Each source of risk can be analyzed for the key causes of failure
People generally fail to perform as expected for the same set of reasons, regardless of the type of operation
People
Unaware of expectation
Unable to perform as expected
Chooses not to perform as expected
Expectations don’t exist
Expectations not communicated
Expectations not enforced
Lack of knowledge
Lack of talent
Lack of virtue
Wrong incentive
The reasons they fail are finite1 2
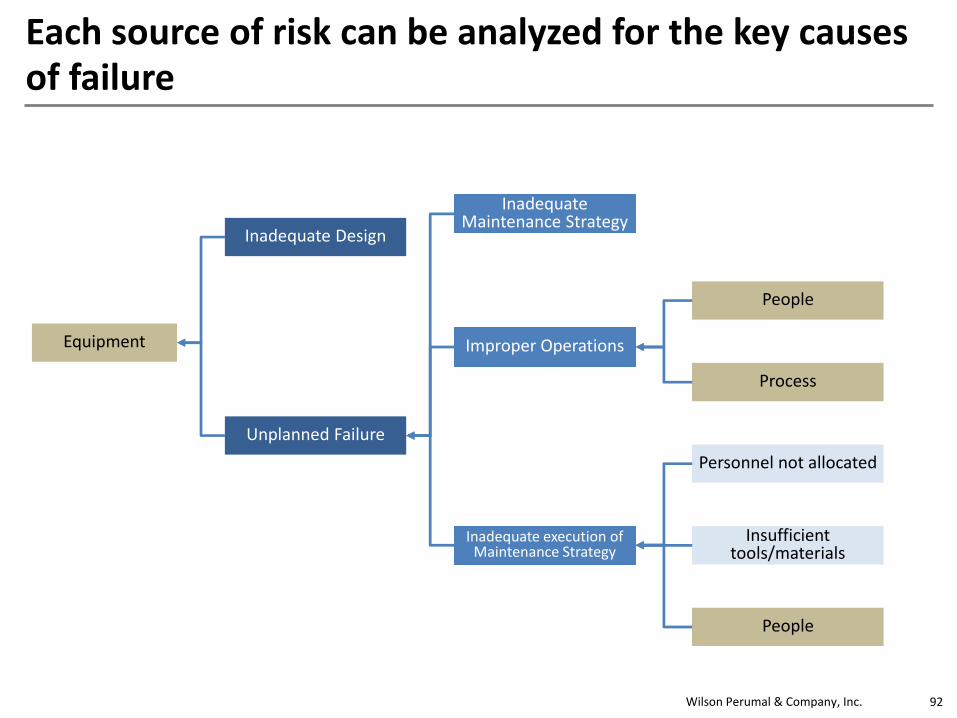
Wilson Perumal & Company, Inc. 92
Each source of risk can be analyzed for the key causes of failure
Equipment
Inadequate Design
Unplanned Failure
Improper Operations
Inadequate Maintenance Strategy
Inadequate execution of Maintenance Strategy
Personnel not allocated
People
Process
Insufficient tools/materials
People

Wilson Perumal & Company, Inc. 93
Each source of risk can be analyzed for the key causes of failure
Process
Process is not capable
Process not in control
Operating limits not defined
People
Equipment
Change
MOC process not capable
MOC process not followed
People
Change not identified
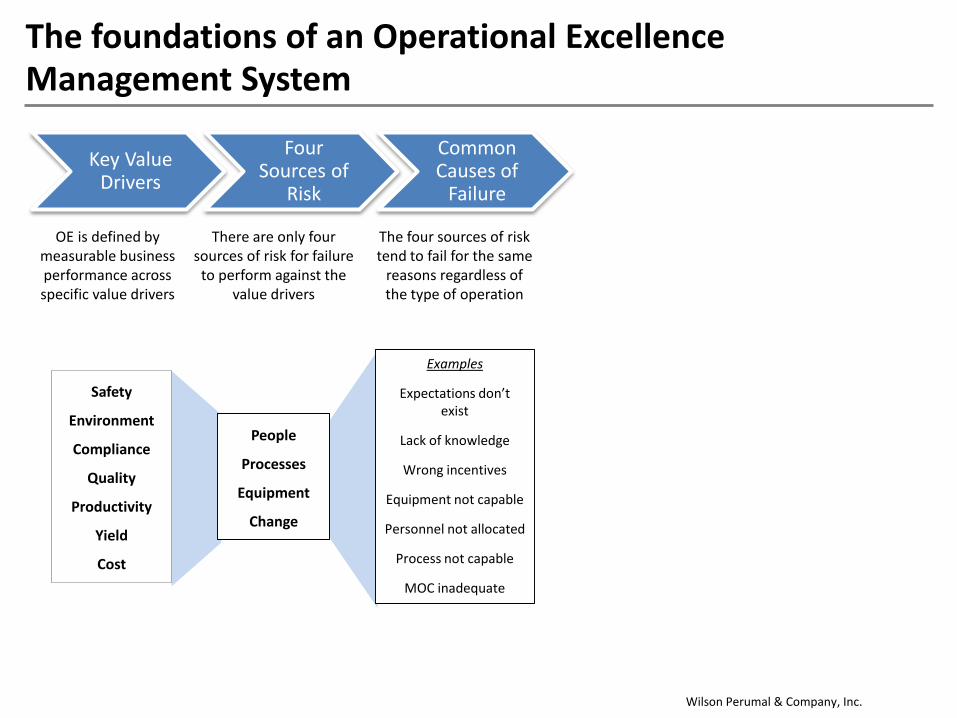
Wilson Perumal & Company, Inc.
The foundations of an Operational Excellence Management System
Key Value Drivers
Four Sources of
Risk
Common Causes of
Failure
OE is defined by measurable business performance across specific value drivers
There are only four sources of risk for failure
to perform against the value drivers
The four sources of risk tend to fail for the same
reasons regardless of the type of operation
Examples
Expectations don’t exist
Lack of knowledge
Wrong incentives
Equipment not capable
Personnel not allocated
Process not capable
MOC inadequate
Safety
Environment
Compliance
Quality
Productivity
Yield
Cost
People
Processes
Equipment
Change

Wilson Perumal & Company, Inc.
If the causes of failure are consistent across various operations, the necessary set of Key Controls is as well
People
Unaware of expectation
Unable to perform as expected
Chooses not to performas expected
Expectations don’t exist
Expectations not communicated
Expectations not enforced
Lack of knowledge
Lack of talent
Lack of virtue
Wrong incentive
Ops/maintenance procedures/policies/standard work
Core communication strategy
Audits/assessments, org structure, performance management
Training/certification
Selection process
Culture, selection process
Compensation strategy, performance management
Key Controls
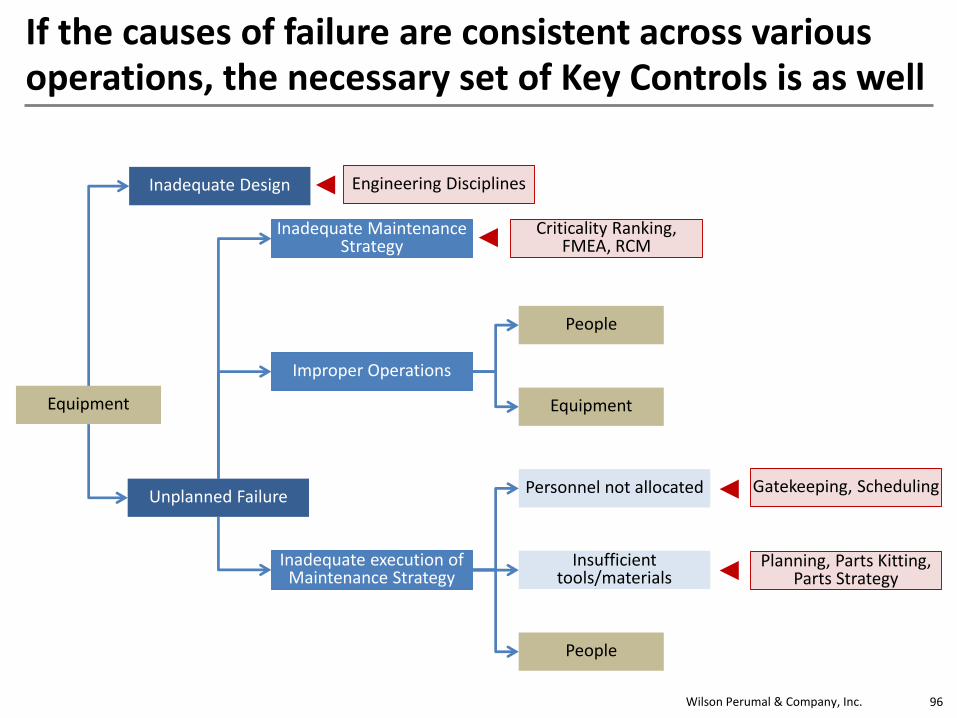
Wilson Perumal & Company, Inc. 96
If the causes of failure are consistent across various operations, the necessary set of Key Controls is as well
Equipment
Inadequate Design
Unplanned Failure
Improper Operations
Inadequate Maintenance Strategy
Inadequate execution of Maintenance Strategy
Personnel not allocated
People
Equipment
Insufficient tools/materials
People
Criticality Ranking, FMEA, RCM
Engineering Disciplines
Gatekeeping, Scheduling
Planning, Parts Kitting, Parts Strategy

Wilson Perumal & Company, Inc. 97
If the causes of failure are consistent across various operations, the necessary set of Key Controls is as well
Process
Process is not capable
Process is not in control
Operating limits not defined
People
Process
Change
MOC process not capable
MOC process not followed People
Process Engineering (LEAN Six Sigma Tools)
Process FMEA, Process Control Plan
Management of Change Program
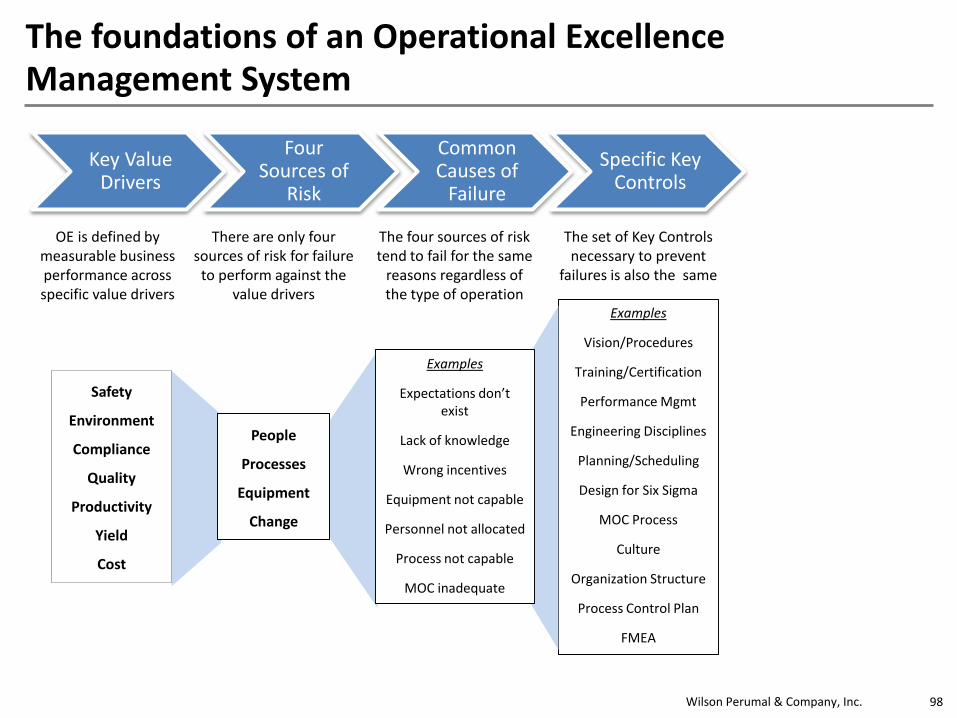
Wilson Perumal & Company, Inc. 98
The foundations of an Operational Excellence Management System
Key Value Drivers
Four Sources of
Risk
Common Causes of
Failure
Specific Key Controls
OE is defined by measurable business performance across specific value drivers
There are only four sources of risk for failure
to perform against the value drivers
The four sources of risk tend to fail for the same
reasons regardless of the type of operation
The set of Key Controls necessary to prevent
failures is also the same
Examples
Vision/Procedures
Training/Certification
Performance Mgmt
Engineering Disciplines
Planning/Scheduling
Design for Six Sigma
MOC Process
Culture
Organization Structure
Process Control Plan
FMEA
Examples
Expectations don’t exist
Lack of knowledge
Wrong incentives
Equipment not capable
Personnel not allocated
Process not capable
MOC inadequate
Safety
Environment
Compliance
Quality
Productivity
Yield
Cost
People
Processes
Equipment
Change

Wilson Perumal & Company, Inc.
The Key Controls can be grouped into Elements to facilitate implementation and management
Risk Identification
Process Hazard
Analysis
Failure Modes Effects
Analysis
Risk Registers
The value of the 7 Elements
• Easier to remember
• More efficient to organize around
• Creates common language that facilitates learning:
– Between management and employees
– Between leaders– From site to site
• Encourages systems thinking– Ensures proactive management
of risk in development of new systems
– Used in root cause analysis, problems aren’t seen in isolation
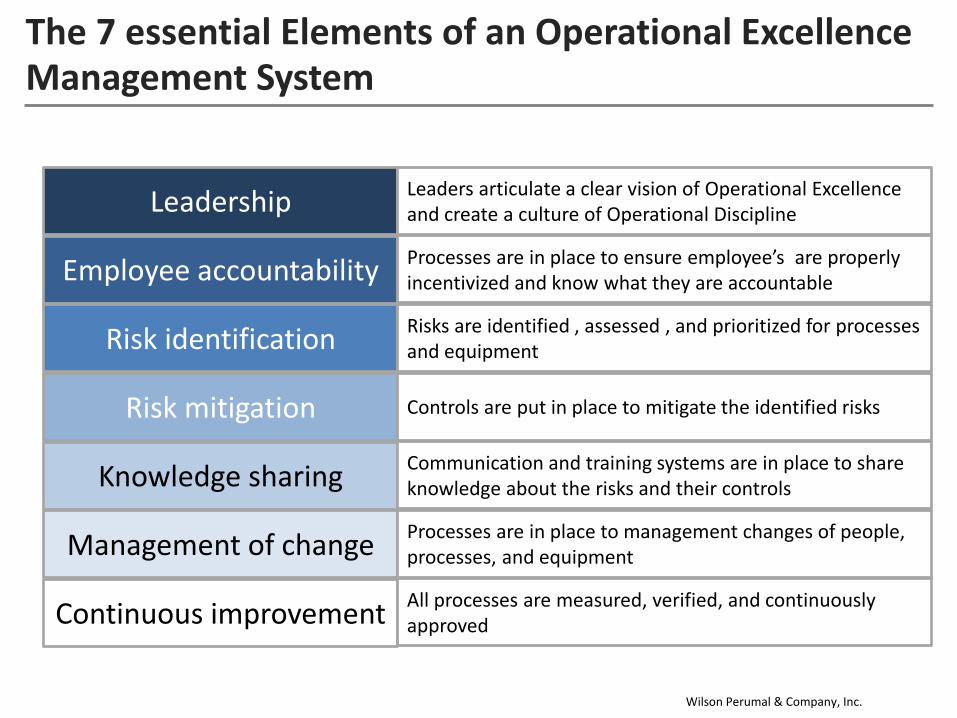
Wilson Perumal & Company, Inc.
The 7 essential Elements of an Operational Excellence Management System
Leadership
Employee accountability
Risk identification
Risk mitigation
Knowledge sharing
Management of change
Continuous improvement
Leaders articulate a clear vision of Operational Excellence and create a culture of Operational Discipline
Processes are in place to ensure employee’s are properly incentivized and know what they are accountable
Risks are identified , assessed , and prioritized for processes and equipment
Controls are put in place to mitigate the identified risks
Communication and training systems are in place to share knowledge about the risks and their controls
Processes are in place to management changes of people, processes, and equipment
All processes are measured, verified, and continuously approved

Wilson Perumal & Company, Inc. 101
The foundations of an Operational Excellence Management System
Key Value Drivers
Four Sources of
Risk
Common Causes of
Failure
Specific Key Controls
OEMS Elements
OE is defined by measurable business performance across specific value drivers
There are only four sources of risk for failure
to perform against the value drivers
The four sources of risk tend to fail for the same
reasons regardless of the type of operation
The set of Key Controls necessary to prevent
failures is also the same
Key controls are organized into
Elements to facilitate implementation and
management Examples
Vision/Procedures
Training/Certification
Performance Mgmt
Engineering Disciplines
Planning/Scheduling
Design for Six Sigma
MOC Process
Culture
Organization Structure
Process Control Plan
FMEA
Examples
Expectations don’t exist
Lack of knowledge
Wrong incentives
Equipment not capable
Personnel not allocated
Process not capable
MOC inadequate
Leadership
Employee Accountability
Risk ID
Risk Mitigation
Knowledge Sharing
Management of Change
Continuous Improvement
Safety
Environment
Compliance
Quality
Productivity
Yield
Cost
People
Processes
Equipment
Change

Wilson Perumal & Company, Inc. 102
Agenda
• Introductions
• Complexity
– Sources and impacts of complexity
– Accounting for complexity
– Complexity Costing Exercise
– Developing and using Complexity Value Stream Maps
– Utilizing Portfolio Optimization to root out complexity
– Case Study: Complexity in M&A
• LUNCH
• Operational Excellence (OE)
– Foundations of OE and the Operational Excellence Management System
– Achieving OE with an OEMS – Case Study: Koch Industries, Chevron & BP
• Operational Discipline (OD)
– Driving OE with a culture of Operational Discipline
– Case Study: Deepwater Horizon
• Summary/Closing

Wilson Perumal & Company, Inc.
Robust processes and procedures alone will not lead to Operational Excellence
Effective Processes
and Procedures
Culture of Operational
Discipline
Operational Excellence
Processes and procedures, without a culture that embraces Operational Discipline, will not result in Operational Excellence.
Sound Strategy
Operational Excellence
Leading Performance
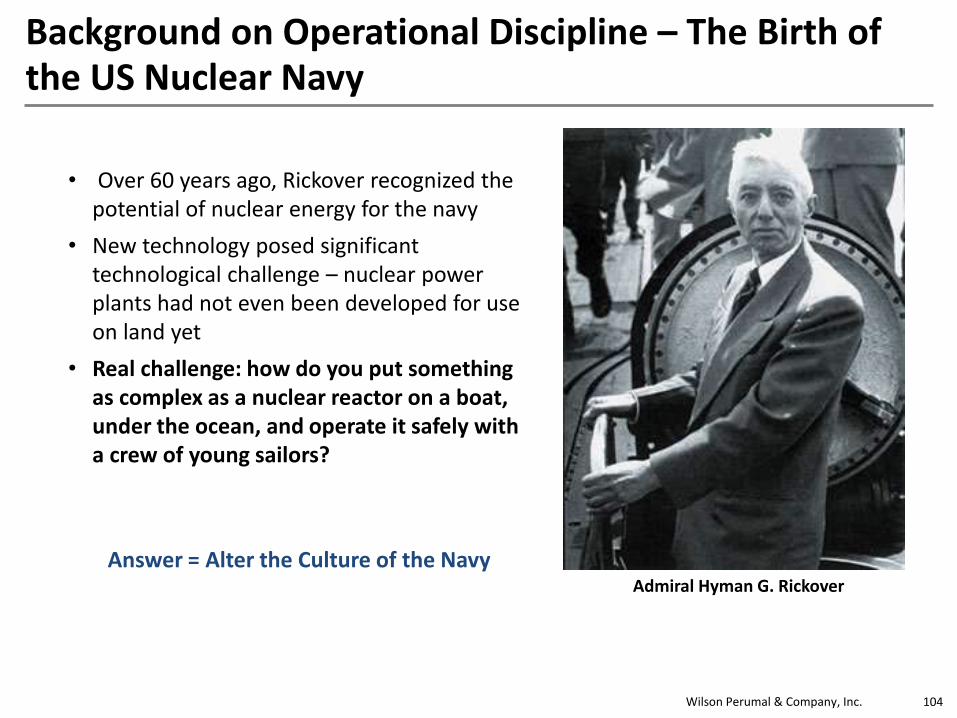
Wilson Perumal & Company, Inc. 104
Background on Operational Discipline – The Birth of the US Nuclear Navy
Admiral Hyman G. Rickover
• Over 60 years ago, Rickover recognized the potential of nuclear energy for the navy
• New technology posed significant technological challenge – nuclear power plants had not even been developed for use on land yet
• Real challenge: how do you put something as complex as a nuclear reactor on a boat, under the ocean, and operate it safely with a crew of young sailors?
Answer = Alter the Culture of the Navy

Wilson Perumal & Company, Inc. 105
The culture required was a vast departure from traditional military culture
Traditional Military Culture
• Follow orders
• Do what you are told
• Don’t ask questions
• Never question your superiors
Rickover’s Cultural Pillars
• Have a higher level of understanding
• Follow procedures
• Question those procedures when things don’t seem right
• Back each other up
• Do it all with integrity
As a result, the US Nuclear Navy has operated nuclear reactors in uncertain environments for over 60 years without a reactor accident!
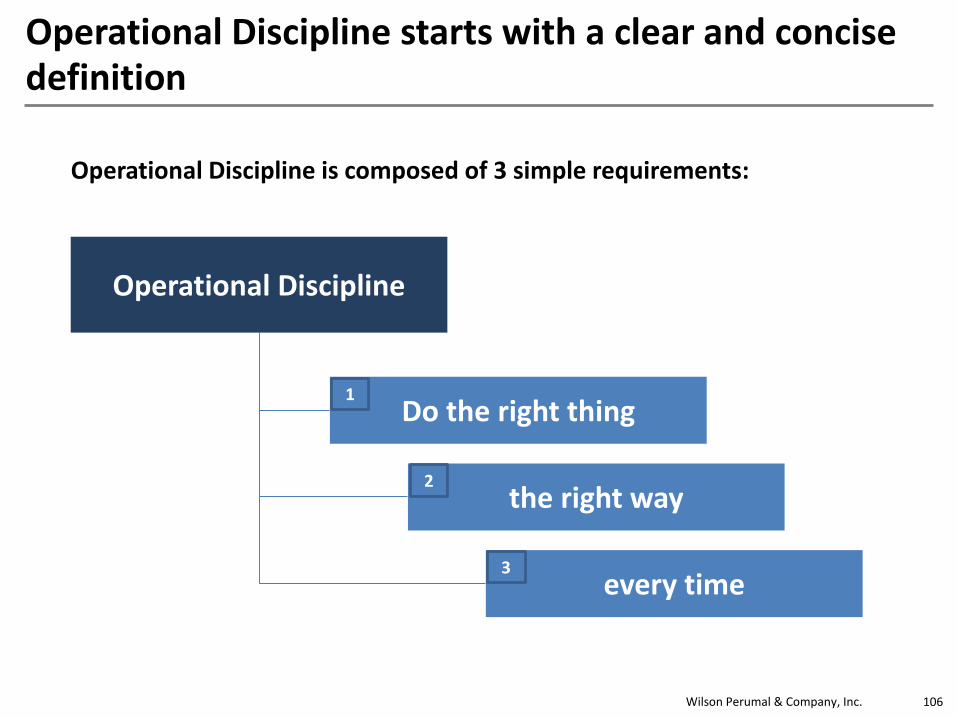
Wilson Perumal & Company, Inc. 106
Operational Discipline starts with a clear and concise definition
Operational Discipline is composed of 3 simple requirements:
Operational Discipline
Do the right thing
the right way
every time
1
2
3
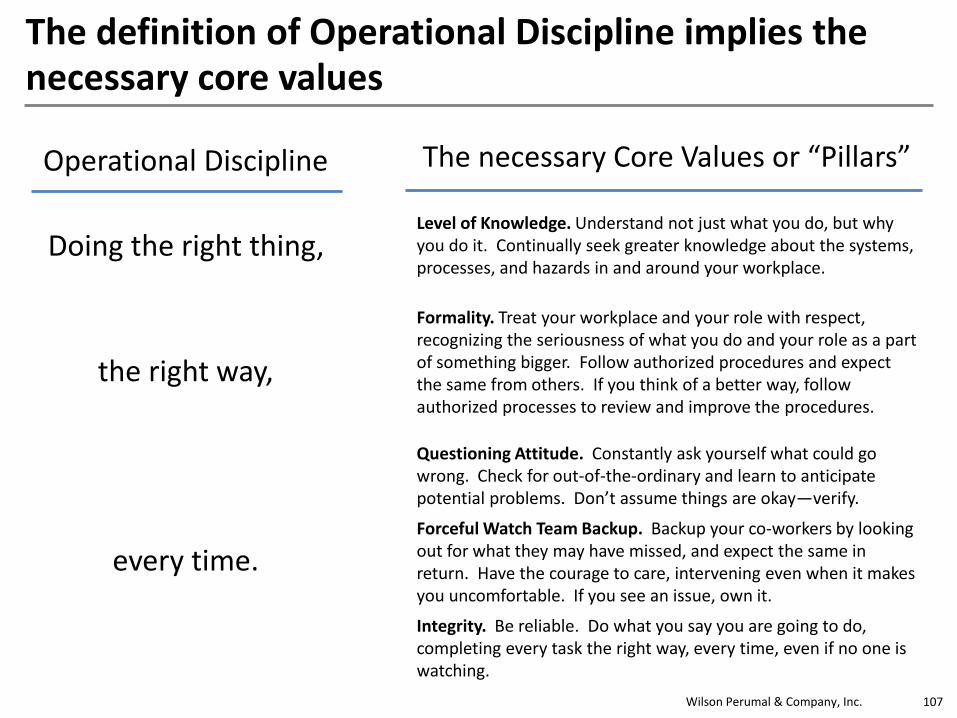
Wilson Perumal & Company, Inc.
Operational Discipline
107
The definition of Operational Discipline implies the necessary core values
Doing the right thing,
The necessary Core Values or “Pillars”
Level of Knowledge. Understand not just what you do, but why you do it. Continually seek greater knowledge about the systems, processes, and hazards in and around your workplace.
the right way,
Formality. Treat your workplace and your role with respect, recognizing the seriousness of what you do and your role as a part of something bigger. Follow authorized procedures and expect the same from others. If you think of a better way, follow authorized processes to review and improve the procedures.
every time.
Questioning Attitude. Constantly ask yourself what could go wrong. Check for out-of-the-ordinary and learn to anticipate potential problems. Don’t assume things are okay—verify.
Forceful Watch Team Backup. Backup your co-workers by looking out for what they may have missed, and expect the same in return. Have the courage to care, intervening even when it makes you uncomfortable. If you see an issue, own it.
Integrity. Be reliable. Do what you say you are going to do, completing every task the right way, every time, even if no one is watching.
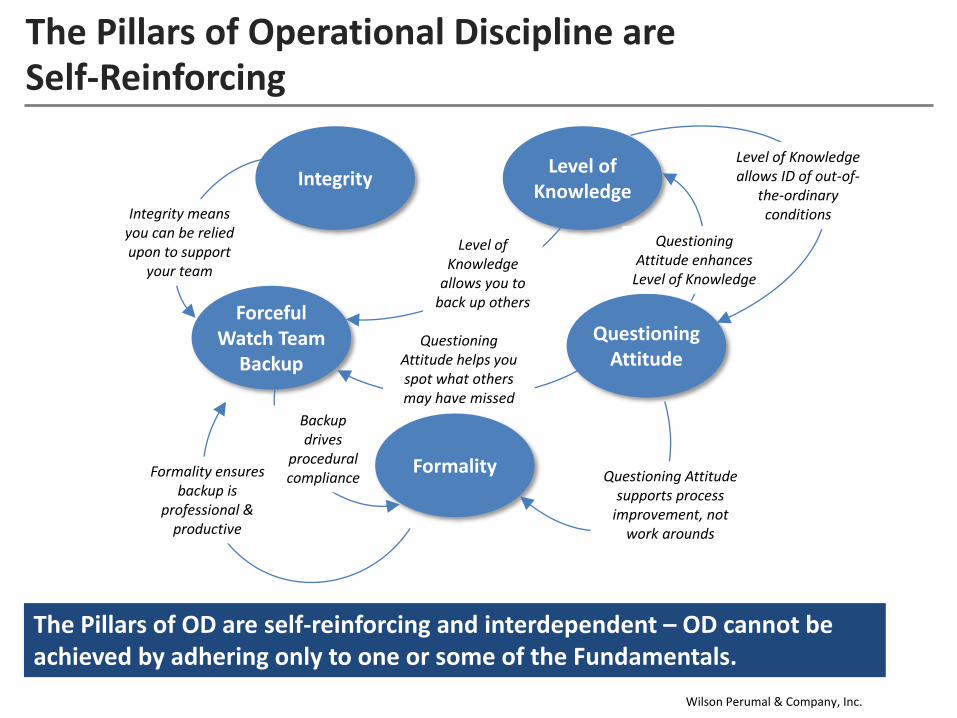
Wilson Perumal & Company, Inc.
The Pillars of Operational Discipline are Self-Reinforcing
IntegrityLevel of
Knowledge
Questioning Attitude
Formality
Forceful Watch Team
Backup
Level of Knowledge allows ID of out-of-
the-ordinary conditions
Questioning Attitude supports process
improvement, not work arounds
Questioning Attitude helps you spot what others may have missed
Level of Knowledge
allows you to back up others
Integrity means you can be relied upon to support
your team
Questioning Attitude enhances
Level of Knowledge
Backup drives
procedural complianceFormality ensures
backup is professional &
productive
The Pillars of OD are self-reinforcing and interdependent – OD cannot be achieved by adhering only to one or some of the Fundamentals.

Wilson Perumal & Company, Inc. 109
Agenda
• Introductions
• Complexity
– Sources and impacts of complexity
– Accounting for complexity
– Complexity Costing Exercise
– Developing and using Complexity Value Stream Maps
– Utilizing Portfolio Optimization to root out complexity
– Case Study: Complexity in M&A
• LUNCH
• Operational Excellence (OE)
– Foundations of OE and the Operational Excellence Management System
– Achieving OE with an OEMS – Case Study: Koch Industries, Chevron & BP
• Operational Discipline (OD)
– Driving OE with a culture of Operational Discipline
– Case Study: Deepwater Horizon
• Summary/Closing

Wilson Perumal & Company, Inc.1) BP: ‘An accident waiting to happen’, Fortune Features, Jan 24, 2011
110
Case Study: Leadership activities and Operational Discipline aboard Deepwater Horizon
• On April 20, 2010, an explosion on BP’s drilling rig “Deepwater Horizon” in the Gulf of Mexico was the largest marine oil spill in the history of the petroleum industry1
• The explosion killed 11 platform workers, injured several others, and released approximately 4.9 million barrels of crude oil
Deepwater Horizon Facts

Wilson Perumal & Company, Inc.
1) Management Walk-Arounds: Lessons from the Gulf of Mexico Oilwell Blowout, Andrew Hopkins, Feb 2011
111
Case Study: Leadership activities and Operational Discipline aboard Deepwater Horizon
• VIP team lands on rig and attends Safety Orientation • The VIP’s proceed with a safety tour.
One VIP inspects safety harnesses. Another looks for a slip/trip hazard.
• Tour continues to Driller’s Control Room where one VIP notices “confusion” . He asks the Rig Manager to stay behind and help out
• VIPs conduct “light-hearted” meeting w/ personnel in galley
• Discuss safety goals, emphasizing “hand safety” and “dropped objects” campaigns
• VIP follows up with Rig Manager and asks "Everything all right up on the rig floor there? Get everything sorted out?“ The Rig Manager responds with thumbs up
3 PM
4 PM
6 PM
8 PM
9 PM
Most people don’t know that a group of four BP and Transocean VIPs were onboard the vessel and conducting a safety focused “management visibility tour” when the explosion occurred. Let’s look at the events of the day.
7 PM
5 PM
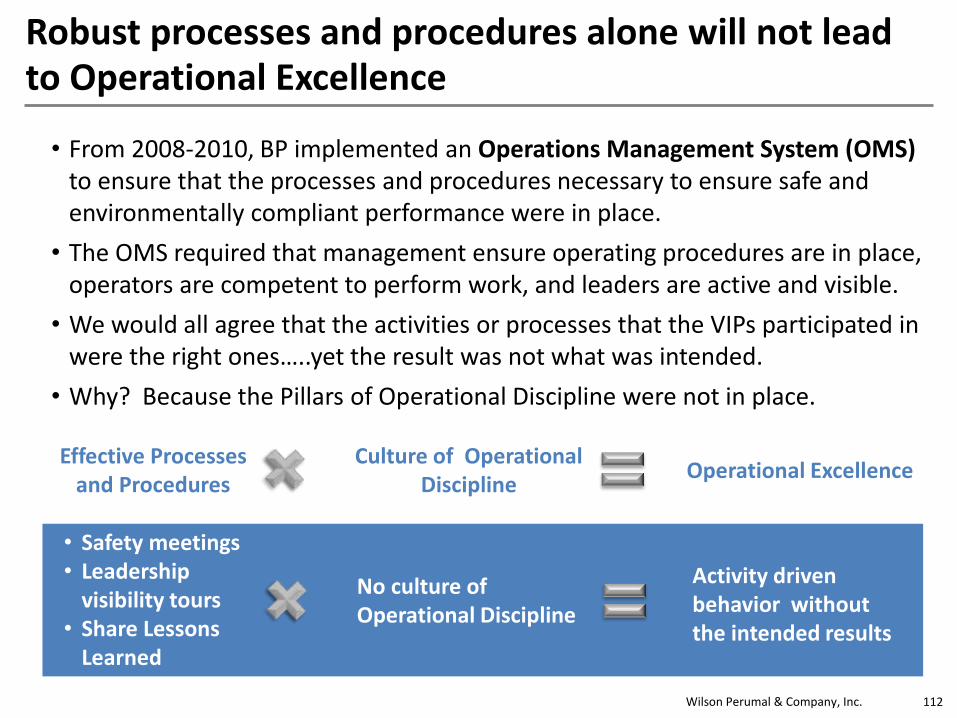
Wilson Perumal & Company, Inc. 112
Robust processes and procedures alone will not lead to Operational Excellence
• Safety meetings• Leadership
visibility tours• Share Lessons
Learned
No culture of Operational Discipline
Activity driven behavior without the intended results
• From 2008-2010, BP implemented an Operations Management System (OMS) to ensure that the processes and procedures necessary to ensure safe and environmentally compliant performance were in place.
• The OMS required that management ensure operating procedures are in place, operators are competent to perform work, and leaders are active and visible.
• We would all agree that the activities or processes that the VIPs participated in were the right ones…..yet the result was not what was intended.
• Why? Because the Pillars of Operational Discipline were not in place.
Effective Processes and Procedures
Culture of OperationalDiscipline
Operational Excellence

Wilson Perumal & Company, Inc.
We will now view several video clips of the VIPs testifying to their activities and behaviors on that fateful day.
While watching, keep in mind the following:• They were following the processes and procedures that were expected
of them.
• We would all agree that the activities they participated in (safety orientation, safety tour, award ceremony, etc.) were all activities in which we would expect good leaders to participate.
• All of these men thought they were doing the right and good thing that day. None of them woke up that morning anticipating this disaster would happen.
113
Deepwater Horizon: In their own words….

Wilson Perumal & Company, Inc.
In their own words……
While viewing the clip on the next slide, consider the following questions.
• Why did these leaders go on the Leadership Visit?
• What was their goal?
• How did they prepare for the visit?
• Did they demonstrate the Fundamentals of Operational Discipline?

Wilson Perumal & Company, Inc. 115
Video Slide

Wilson Perumal & Company, Inc.
Deepwater Horizon Revisited
Questions to consider while viewing the clip on the next slide
• Why was he in the driller’s shack? Was he there to surface problems?
• What did he do when he noticed the confusion?
• Did he ask the right questions?
• Were the Fundamentals of Operational Discipline exercised?

Wilson Perumal & Company, Inc. 117
Video Slide

Wilson Perumal & Company, Inc.
Deepwater Horizon Revisited
Questions to consider while viewing the clip on the next slide
• How do these leaders deal with employees that don’t follow procedures?
• How do they make sure that their employees have adequate knowledge? How do they interact with them?
• Were the Pillars of Operational Discipline exercised?

Wilson Perumal & Company, Inc. 119
Video Slide
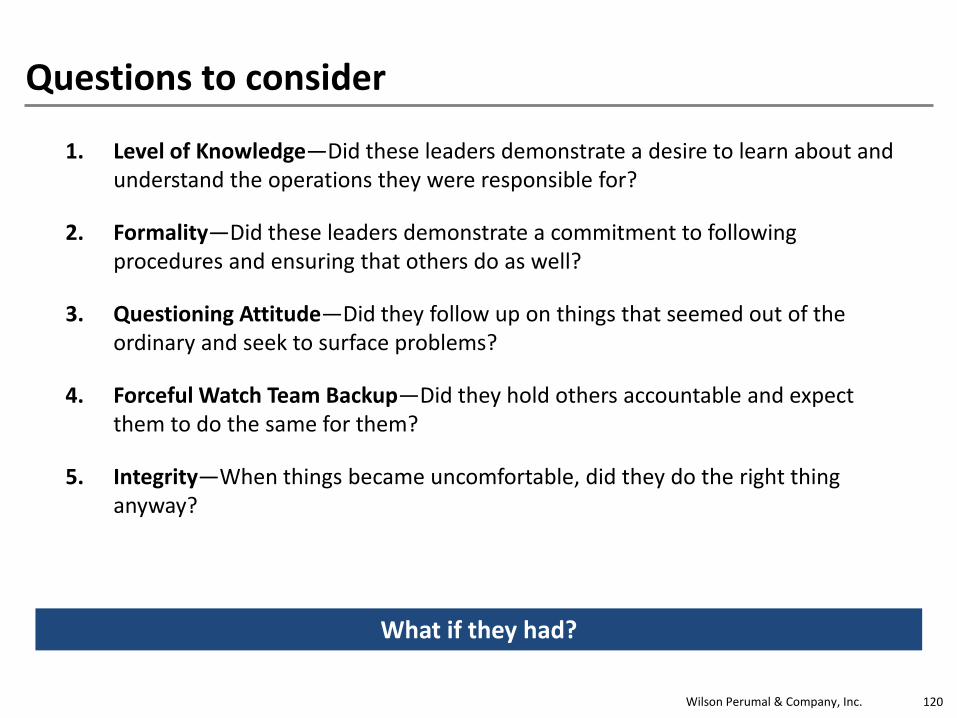
Wilson Perumal & Company, Inc. 120
Questions to consider
1. Level of Knowledge—Did these leaders demonstrate a desire to learn about and understand the operations they were responsible for?
2. Formality—Did these leaders demonstrate a commitment to following procedures and ensuring that others do as well?
3. Questioning Attitude—Did they follow up on things that seemed out of the ordinary and seek to surface problems?
4. Forceful Watch Team Backup—Did they hold others accountable and expect them to do the same for them?
5. Integrity—When things became uncomfortable, did they do the right thing anyway?
What if they had?
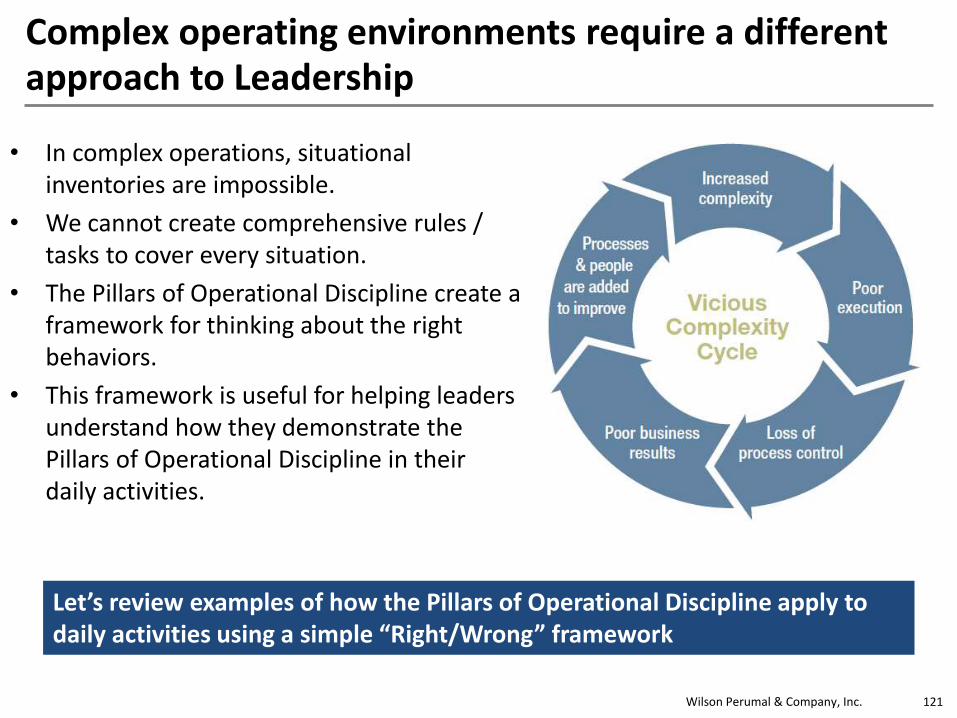
Wilson Perumal & Company, Inc. 121
Complex operating environments require a different approach to Leadership
• In complex operations, situational inventories are impossible.
• We cannot create comprehensive rules / tasks to cover every situation.
• The Pillars of Operational Discipline create a framework for thinking about the right behaviors.
• This framework is useful for helping leaders understand how they demonstrate the Pillars of Operational Discipline in their daily activities.
Let’s review examples of how the Pillars of Operational Discipline apply to daily activities using a simple “Right/Wrong” framework

Wilson Perumal & Company, Inc. 122
The Pillars of OD enable employees to determinethe right behaviors for any activity
Leadership Visits
OD Pillar Fundamentally Right Fundamentally Wrong
Level of KnowledgeLeaders view visits as an opportunity to learn about the business
Not preparing or being knowledgeable about the site and its risks prior to visit
FormalityObserve high risk procedures and verify steps are followed
Not asking to see procedures to verify compliance
QuestioningAttitude
Review past audits prior to visiting and verify completion of corrective actions
Primary goal is to be “visible”, not to identify problems
Forceful Watch Team Backup
Ask other leaders to tour your area and point out issues
Don’t want to make a big deal or interfere
IntegrityWhen you find problems, share them with others even if they might be embarrassing
Visit conducted just because “there is a schedule”

Wilson Perumal & Company, Inc. 123
Agenda
• Introductions
• Complexity
– Sources and impacts of complexity
– Accounting for complexity
– Complexity Costing Exercise
– Developing and using Complexity Value Stream Maps
– Utilizing Portfolio Optimization to root out complexity
– Case Study: Complexity in M&A
• LUNCH
• Operational Excellence (OE)
– Foundations of OE and the Operational Excellence Management System
– Achieving OE with an OEMS – Case Study: Koch Industries, Chevron & BP
• Operational Discipline (OD)
– Driving OE with a culture of Operational Discipline
– Case Study: Deepwater Horizon
• Summary/Closing

©2011 Wilson Perumal & Company, Inc. 124
Key takeaways
• The world has changed – complexity can no longer be an afterthought
• Complexity grows exponentially, and its associated costs can outweigh the benefits of scale
• Identifying and rooting out complexity requires a different toolset
• Square Root Costing to identify complexity costs
• CVSM to identify sources of complexity
• 6 Facet Portfolio Optimization to root out product complexity
• Achieving operational Excellence requires controlling process and organizational complexity through
• OEMS: Operational Excellence Management system
• Operational Discipline
• Top performing companies utilize OEMS and OD to manage process and organizational complexity, and drive leading performance across all value drivers


