105
MIT OpenCourseWare http://ocw.mit.edu 15.912 Technology Strategy Fall 2008 For information about citing these materials or our Terms of Use, visit: http://ocw.mit.edu/terms.

MIT OpenCourseWare http://ocw.mit.edu
15.912 Technology StrategyFall 2008
For information about citing these materials or our Terms of Use, visit: http://ocw.mit.edu/terms.

15.912Technology Strategy
Professor Jason Davis
MIT Sloan School of Management
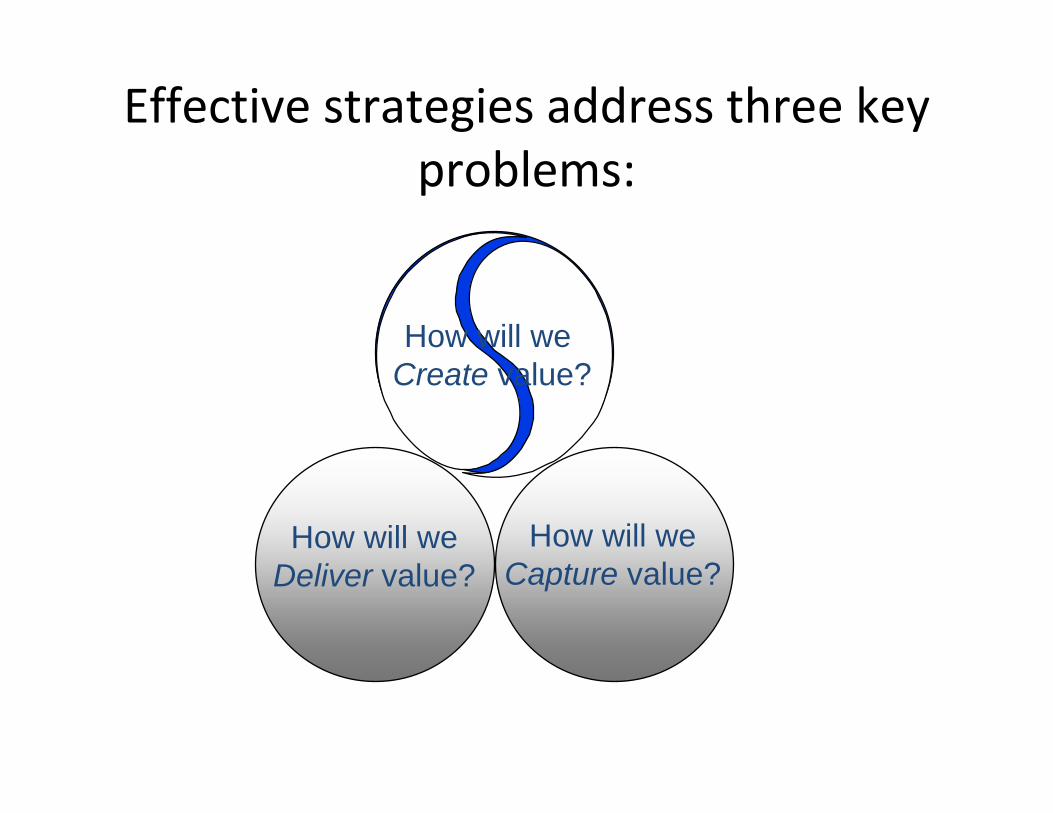
Effective strategies address three keyproblems:
How will we Create value?
How will we Capture value?
How will we Deliver value?

Effective strategies address 3 key problems:
• How will we create value?
– How will the technology evolve?
– How will the market change?
– How do we organize effectively?
• How will we capture value?
– How do we compete to gain sustainable competitive advantage?
– How should we compete if standards are important?
• How will we deliver value?
– How should we execute the strategy?
– How do we make strategic decisions and take decisive action?

Why have a strategy?

Why have a strategy?
1. To make choices and take actions

Is This Your Project Pipeline? (A Log Jam)

Why have a strategy?
2. To be able to change it

Performance
The strategic challenge evolves down the S curve
Ferment
Takeoff
Maturity
Discontinuity
Time

The nature of technical work changes
Performance We need to be responsive & flexible but controlled
Will it work? Exploration, fun,
Can we make creativity key100,000? And service them?
Core Ideas: Will it work? Forecasting S curves?Exploration, fun, creativity key
Time

The marketing challenge evolves
Performance Stay close to your customer – really close
WhoDo we have needs this?any reference customers?
Core Ideas: Market segmentation
Who The Innovator’s Dilemma
Time
needs this?

The ways in which a firm captures value also evolvedramatically
Performance We may not be leading edge but you’d rather buy from us because…
We can sell it, make it, service it, ship it Most of the time
Speed, IP Differentiation, Frontier performance key
Time
Speed, IP Differentiation, Frontier performance key
Core Ideas: 5 forces
Appropriability Complementary assets

The organizational challenge changes significantly
Performance
“Entrepreneurial Energy” critical
“Coordination & control” critical
“Entrepreneurial Energy” critical
Core Ideas: Managing the organizational
dynamics of discontinuity
Time

That is, Technology Strategy is hardbecause it involves doing strategy in
highly dynamic environments:‐ high velocity
‐ high complexity‐ high ambiguity
‐ high unpredictability

Strategic Challenge of TechnologyMarkets: Unpredictability and
Ambiguity
SOURCES IMPLICATIONSIMPLICATIONS
•Planning is limitedmarket evolution are hard to predict!
•Future S-curves and
•Reacting is insufficient
•Traditional strategies of “defend a position” and
•Blurred timing and paths
“leverage core from products to business
•Shifting competitive basis, competence” are
models incomplete
•Lack of control over key •Shift from “closed” internal technology resources innovation to “open”
14 innovation with partners

How shall we create value?

Creating Value:
• Understand how technologies will evolve – (Both your own and those on which you rely)
• Understand how customer needs will evolve
• Organize effectively to develop world class products and services that meet customer needs

Tools for value creation
• Predicting Technological Change –Limits and Growth Rates –Trend extrapolation
• Predicting the Evolution of Customer Needs–Basic segmentation –Crossing the chasm –New technologies, new needs
• Utilize moderate structure and dynamic organizational processes

Trend extrapolation: Semiconductors

Issues in Trend Extrapolation
• Which parameter shall I predict?
• Do all good things come to an end?
• Exploring the difference between progress as a result of the passage of time, and progress as the result of returns to effort
• Predicting progress in complementary technologies

Do all good things come to an end?Technological exhaustion
Physical limit?
Performance
Performance is ultimately constrained by physical limits
E.g.: Sailing ships & the power of the wind Copper wire & transmission capability Semiconductors & the speed of the electron
Time

Modeling the returns to effort vs. time
Performance
Performance may be a non linear function of effort expended: in mature industries more and more effort may lead to less and less progress, while progress in emerging industries may be “surprisingly” fast
Effort

The Unexpectedly Long Old Age ofOptical Photolithography
Source: Henderson, 1995.
19600.1 1 100 1000 100010 1965 1970 1975YearCumulative R&D effort, person years
1980 1985 1990
Min
imum
feat
ure
size
(mic
rons
)
Min
imum
feat
ure
size
(mic
rons
)
Image by MIT OpenCourseWare.

S‐Curves, Real and Imaginary
Source: Henderson, 1995.
19700
1
2
3
4
5
6
7
8
9
10
1975
Res
olut
ion
(mic
rons
)
1980
Year1985 1990 1995
Realized perf.Pred. optical limit
Image by MIT OpenCourseWare.

Implications of the S‐curve
• Technological performance is a function of effort, NOT time
• R&D is often less productive when focused on either early prototypes or mature technologies
• Managing the transitions between S‐curves is a critical strategic task: sticking with an old S‐curve can be disastrous
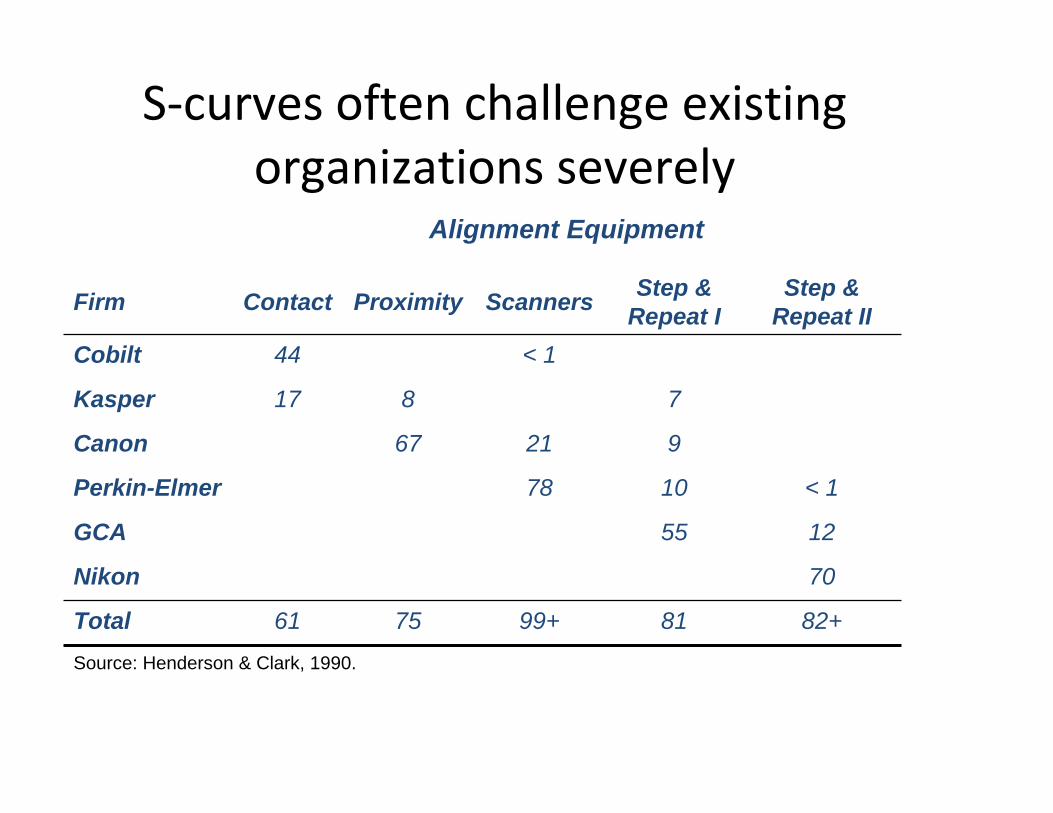
S‐curves often challenge existingorganizations severely
Alignment Equipment
Step & Step &Firm Contact Proximity Scanners Repeat I Repeat II Cobilt 44 < 1
Kasper 17 8 7
Canon 67 21 9
Perkin-Elmer 78 10 < 1
GCA 55 12
Nikon 70
Total 61 75 99+ 81 82+
Source: Henderson & Clark, 1990.

But they also create majoropportunity
• Corning glass – Cookware to optical fiber
• Nokia – Rubber boots to cell phones
• IBM – Mainframes to PCs to Services
• Eli Lilly – “Random” drug discovery to genetics and genomics

The Evolution of Markets
or
Predicting the pattern of customerneeds

A Key Framework:The industry life cycle
Era of Ferment/ Discontinuity
Maturity “Dominant design” emerges
Incremental Innovation

Maturity
The Industry Life Cycle as an S curve
Performance
Discontinuity Takeoff
Ferment
Time

What is the relationship between theS curve and the diffusion curve?
Performance Cumulative sales
=> ?
Time Time

Diffusion is Hard…start with limits andgrowth
• Supply: – Technology S‐curves! …a natural constraint. – Effective Organization …we’re not there yet.
• Demand: – Ultimate Market Limit…changes with demographic growth & changing
preferences – Rate of Information Transfer – Substitutes – …
• Competition: – Price competition can shift growth…
• …and the interactions between Supply, Demand, and Competition!

Market Evolution over the Life Cycle
• Market segmentation
• Crossing the chasm
• New markets, new needs: – The Innovator’s Dilemma

The Key Question:Who buys a technology as it evolves?
Performance
Time

Understanding market dynamics:Basic segmentation (Rogers)
Units Bought
EarlyAdopters
LaggardsInnovators
Time
Early Majority
Late Majority
Adopters differ by, for example, social, economic status --particularly resources, affinity for risk, knowledge, complementary assets, interest in the product
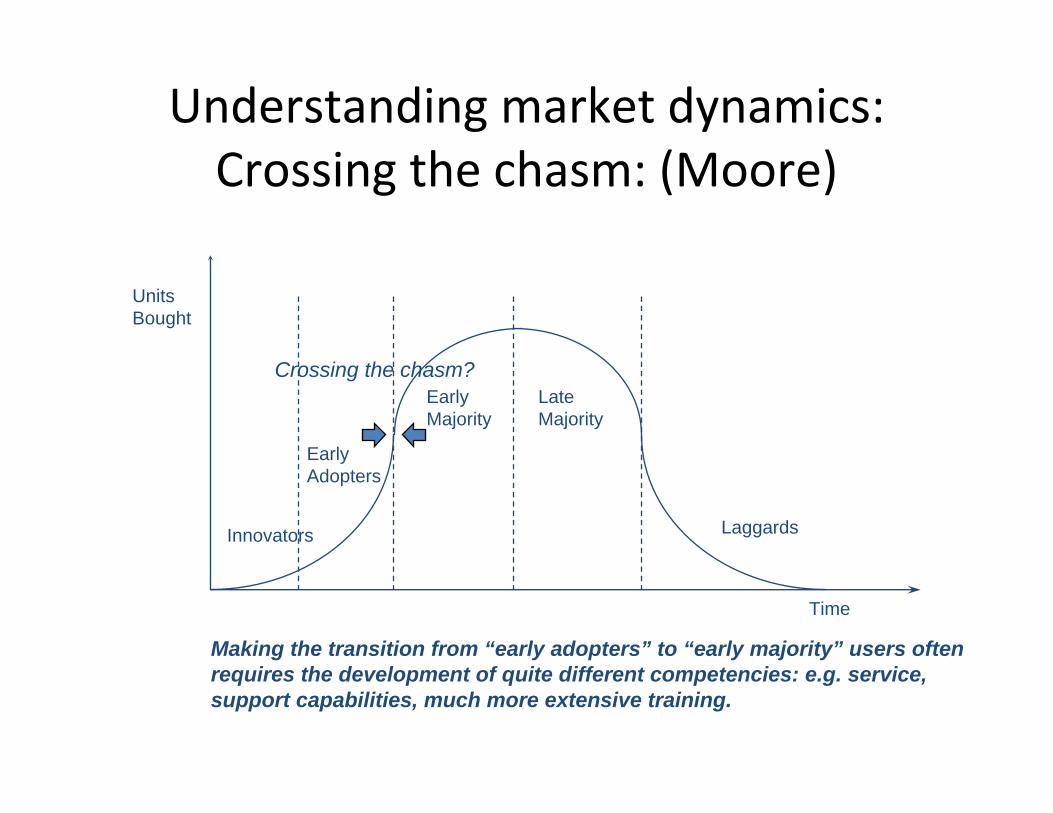
Understanding market dynamics:Crossing the chasm: (Moore)
Units Bought
EarlyAdopters
LaggardsInnovators
Time
Early Majority
Late Majority
Crossing the chasm?
Making the transition from “early adopters” to “early majority” users often requires the development of quite different competencies: e.g. service, support capabilities, much more extensive training.

Managing customers at momentsof discontinuity
Who buys a technology when it is first introduced?
Performance
New technologies sell to: - New customers - With new needs - Often at lower margins
Time

Initially, PDAs did not seem to be athreat to PCs:
Speed, Power, Memory
PCs
PDAs
?
Time
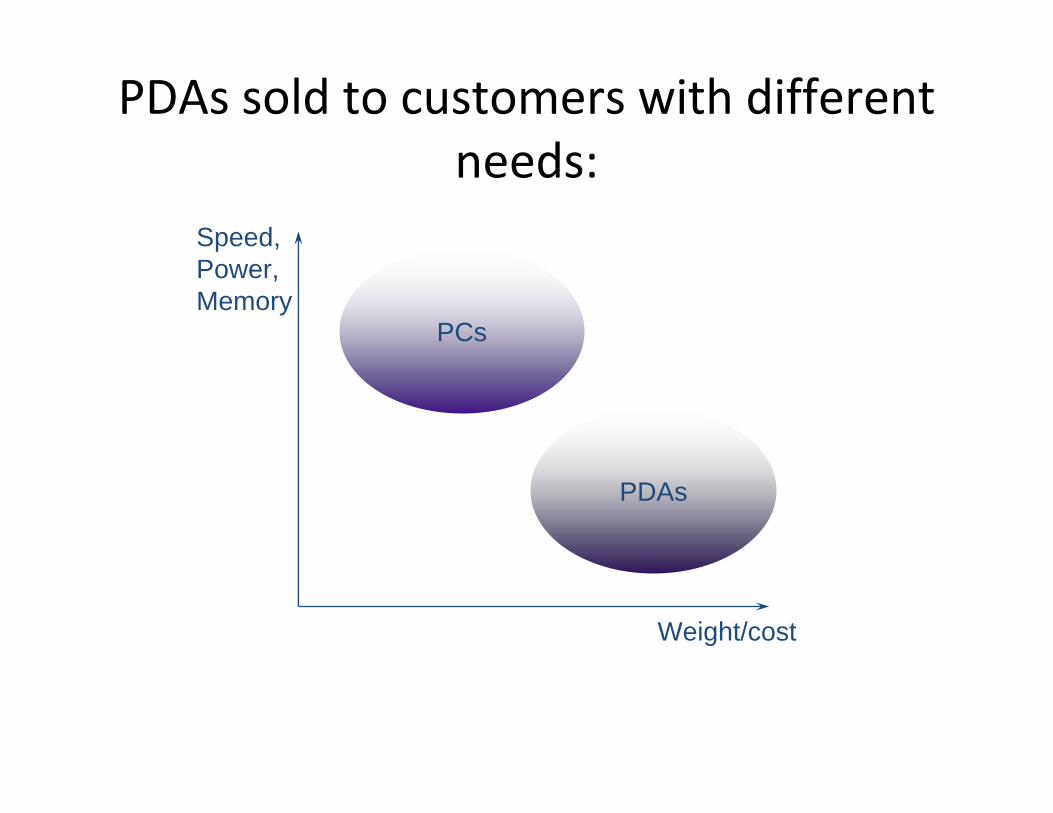
PDAs sold to customers with differentneeds:
Speed, Power, Memory
PCs
PDAs
Weight/cost

But as PDAs improve they may cometo challenge PCs
?Speed, Power, Memory
PCs
PDAs
Weight/cost

Or consumer preferences maychange
?
Speed, Power, Memory
PCs
PDAs
Weight/cost

“Disruptive” technologies may threaten establishedfirms
Performance
Established technology
Mainstream customer needs
Invasive Technology
Niche customer needs
TimeClay Christensen: The Innovator’s Dilemma
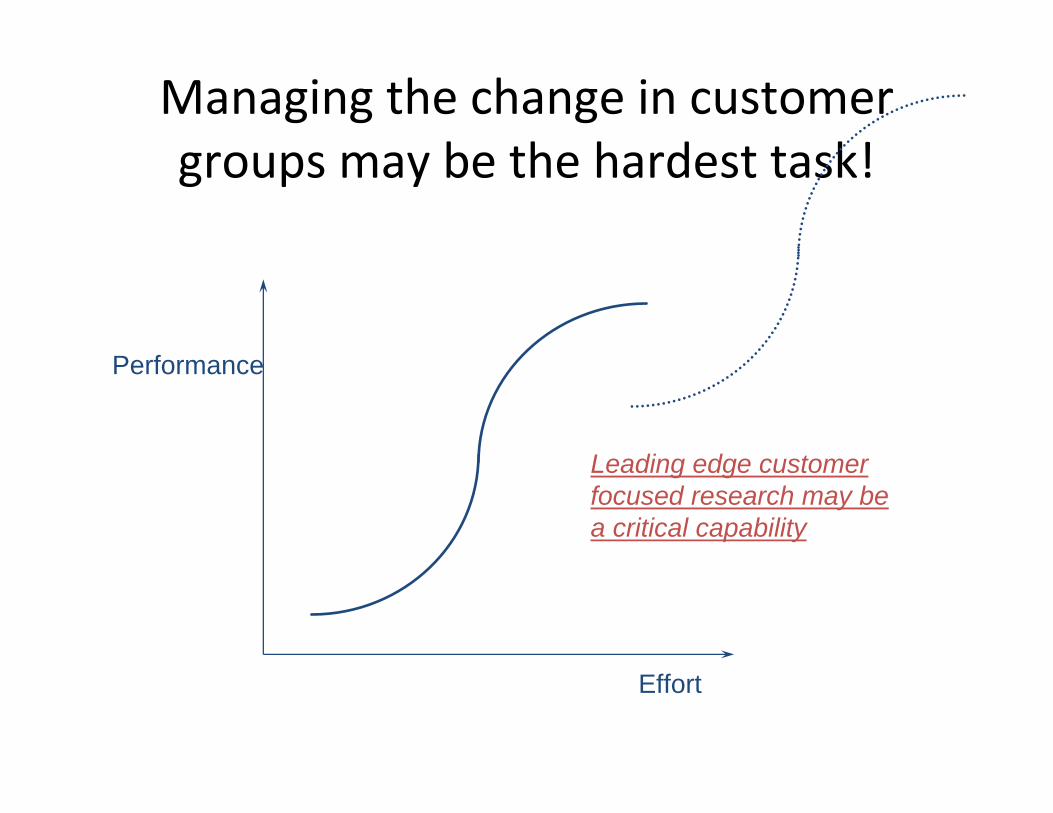
Managing the change in customergroups may be the hardest task!
Performance
Leading edge customer focused research may be a critical capability
Effort

What can be done?
• “Ready, aim, fire”
• Small scale experiments } Significant resources required!
• Virtual products • Lead user research

Creating Value:
• Understand how technologies will evolve –(Both your own and those on which you rely)
• Understand how customer needs will evolve
• Use technologies to develop world class products and services that meet customer needs –How?
• Get lucky…works once or twice • Do it consistently with effective Organization Structures and Processes
–e.g., Apple, Google
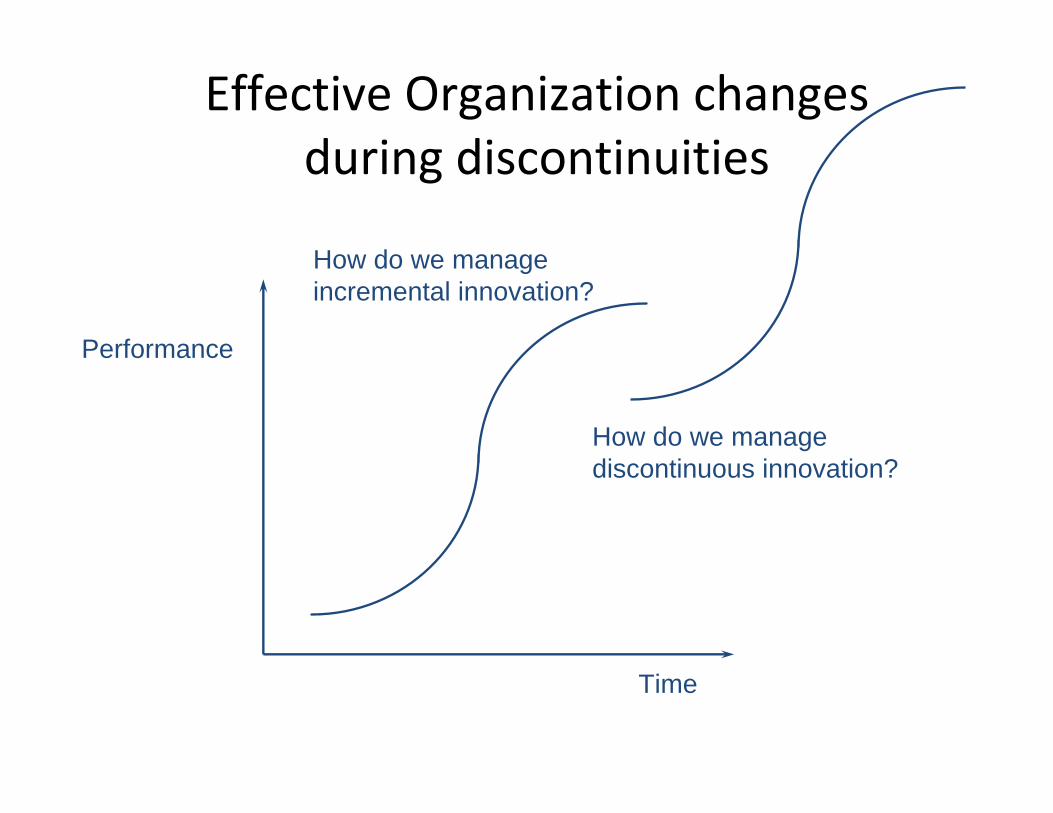
Effective Organization changesduring discontinuities
How do we manage incremental innovation?
Performance
How do we manage discontinuous innovation?
Time
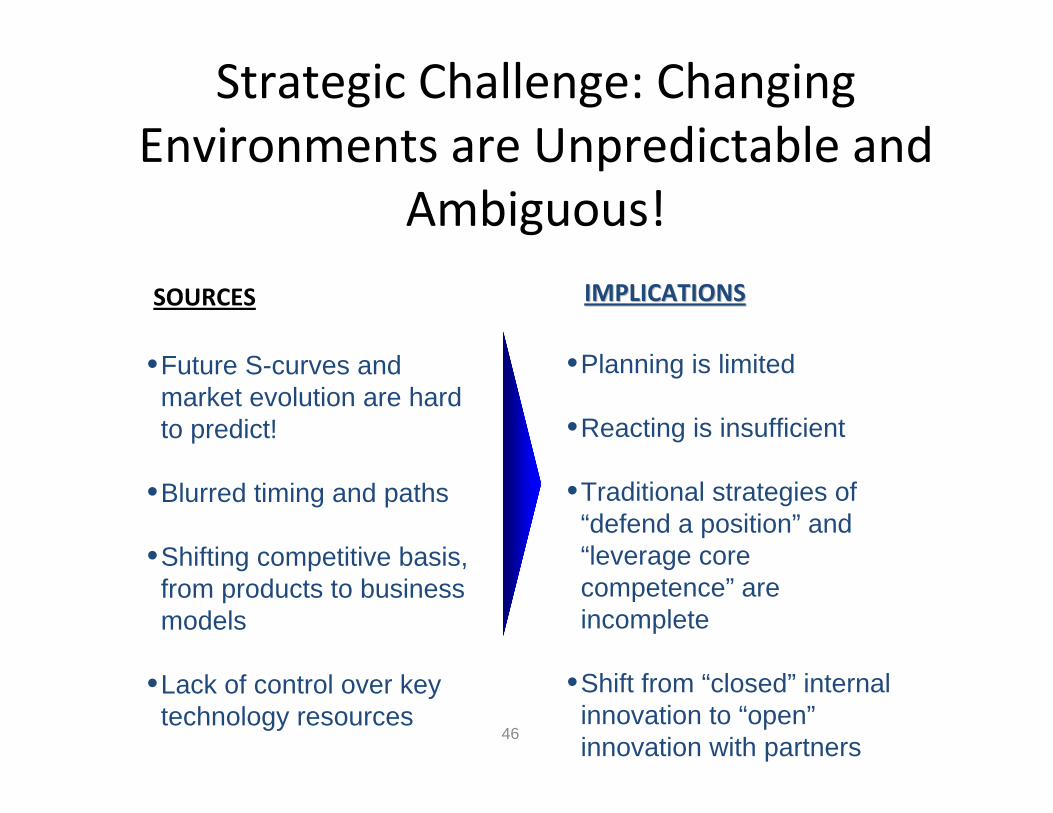
Strategic Challenge: ChangingEnvironments are Unpredictable and
Ambiguous!
SOURCES IMPLICATIONSIMPLICATIONS
•Planning is limitedmarket evolution are hard to predict!
•Future S-curves and
•Reacting is insufficient
•Traditional strategies of “defend a position” and
•Blurred timing and paths
“leverage core from products to business
•Shifting competitive basis, competence” are
models incomplete
•Lack of control over key •Shift from “closed” internal technology resources innovation to “open”
46 innovation with partners

Potential Solution: OrganizationalStructures that respond to change
Organizational Structures enable coordinated responses to environmental change by shaping action in real-time
Unit NetworksUnit NetworksAlliance NetworksAlliance Networks
HierarchyHierarchy
RolesRoles
RulesRules

Amount of Organizational Structurecan vary greatly!
LowLow MediumMedium HighHigh
HierarchyHierarchy
RulesRules
Unit NetworksUnit Networks
Alliance NetworksAlliance Networks

Inverted U‐shaped Relationship btwnthe Amount of Structure and
Performance
• Fundamental Relationship illustrates the tension between efficiency and flexibility
• Observed in multiple industries and for multiple types of structure:
• Hierarchy • Roles • Rules • Networks
Chaotic ConstrainedConstrained

New Modeling and Evidence suggestsAsymmetry and Dependency on
Market Dynamism
• Asymmetry: more forgiving on the side of too much structure
• Optimum is less structured and more severe in less predictable environments
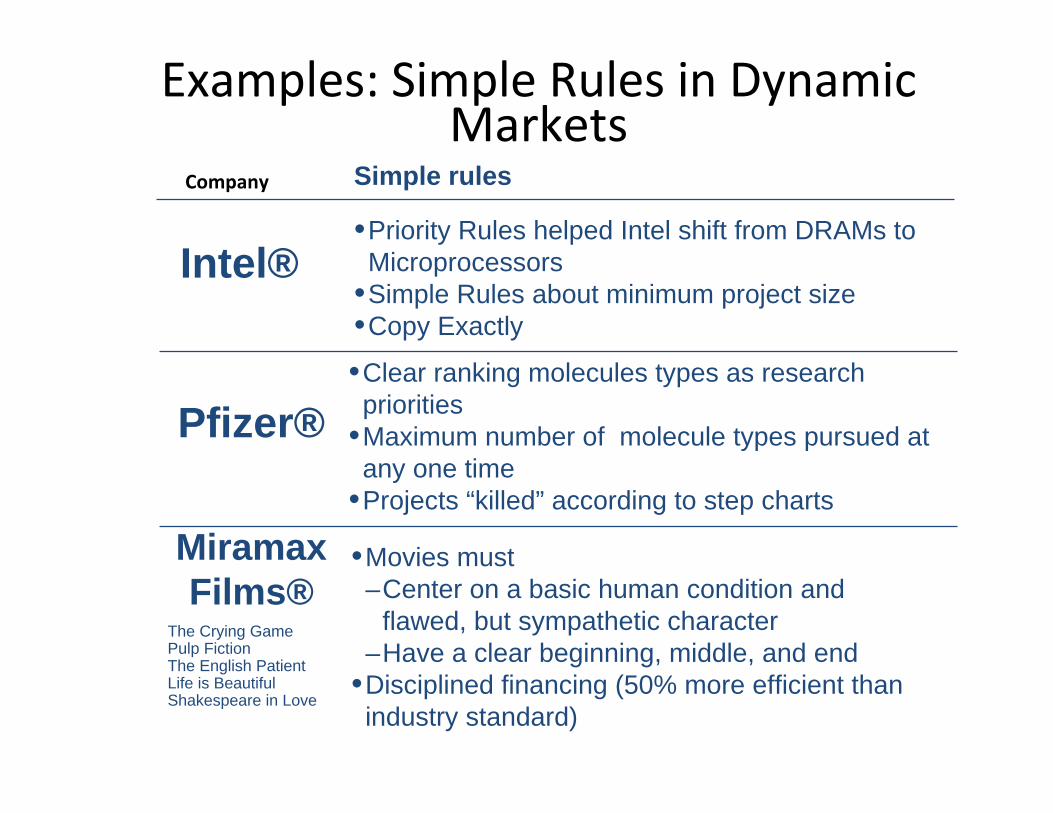
Examples: Simple Rules in DynamicMarkets
Company Simple rules
•Priority Rules helped Intel shift from DRAMs to Intel® Microprocessors
•Simple Rules about minimum project size •Copy Exactly
•Clear ranking molecules types as research
Pfizer® priorities •Maximum number of molecule types pursued at any one time
•Projects “killed” according to step charts
MiramaxFilms®
The Crying GamePulp Fiction The English PatientLife is Beautiful Shakespeare in Love
•Movies must –Center on a basic human condition and
flawed, but sympathetic character–Have a clear beginning, middle, and end
•Disciplined financing (50% more efficient than industry standard)

Explains mysterious organizationalphenomena:
• Liability of newness: less structured entrepreneurial firms can “collapse from within” while large firms w/ more structure can “muddle through” with little innovation
• Maintaining optimal structure is more precarious (more V‐like than U‐like!) in unpredictable markets: –Emerging markets –High‐technology industries
• Effective strategy is more simple in highly dynamic markets – Less structure enables more flexible responses
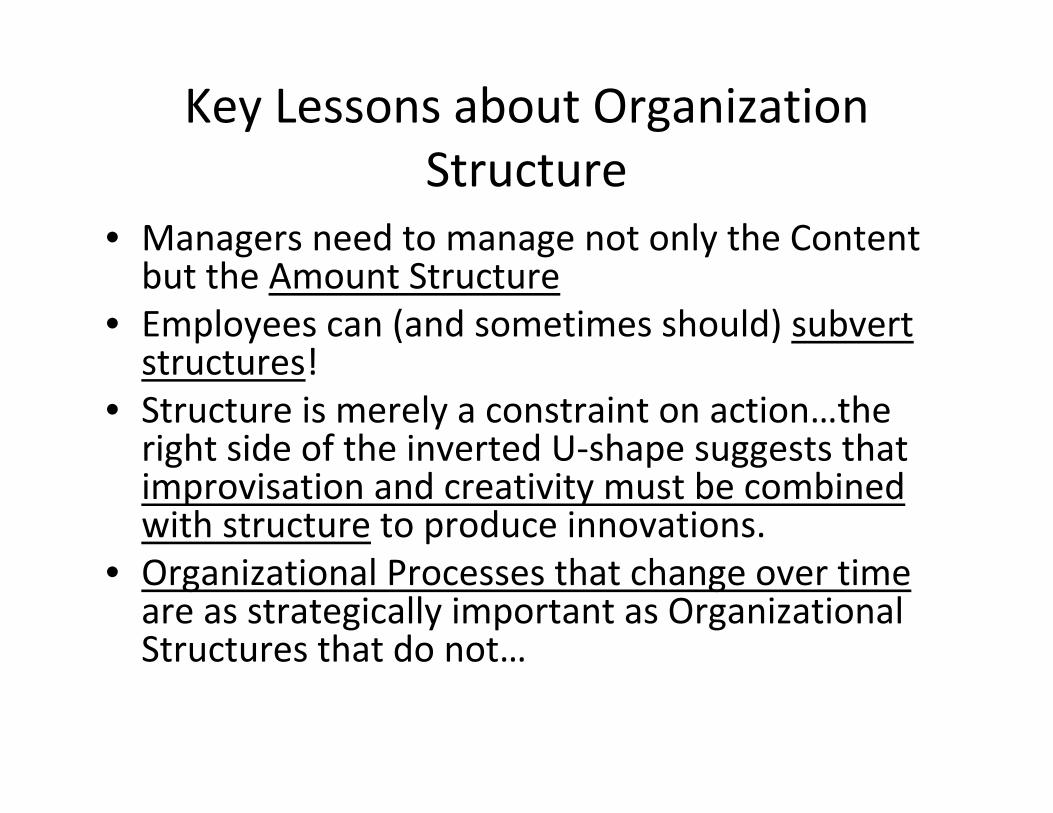
Key Lessons about OrganizationStructure
• Managers need to manage not only the Content but the Amount Structure
• Employees can (and sometimes should) subvert structures!
• Structure is merely a constraint on action…the right side of the inverted U‐shape suggests that improvisation and creativity must be combined with structure to produce innovations.
• Organizational Processes that change over time are as strategically important as Organizational Structures that do not…

How shall we capture value?
Uniqueness, Complementary Assets & the Structure of the Value Chain

Or:What determines the Inventor’s
Share?
CustomersSuppliers
Imitators, Inventor followers
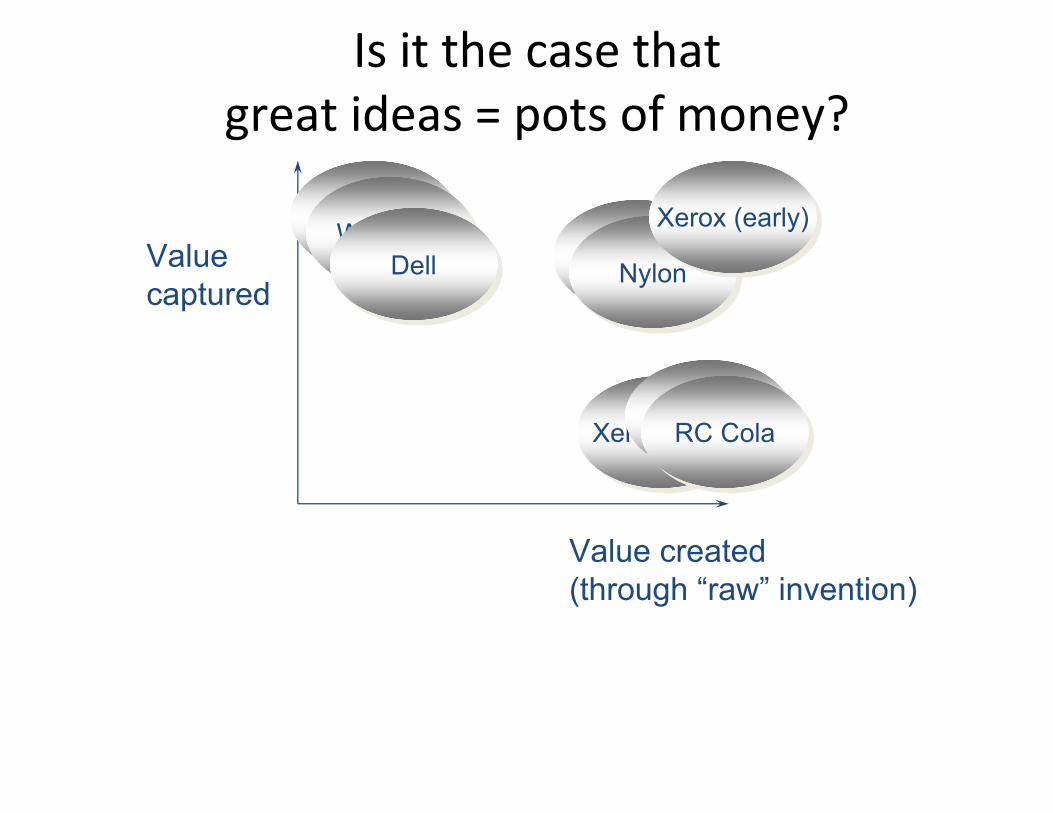
Is it the case that great ideas = pots of money?
Valuecaptured
Value created(through “raw” invention)
ViagraViagraNylonNylon
Xerox (early)Xerox (early)
Xerox (late)Xerox (late)AppleApple
Coca ColaCoca ColaWal MartWal Mart
DellDell
RC ColaRC Cola

Three key ideas:
• Uniqueness – Controlling the knowledge generated by aninnovation: being the only game in town
• Complementary Assets – Controlling the assets necessary to exploit the knowledge generated by innovation
• Five Forces & the Value Chain – Understanding the dynamics of power in the value chain

Uniqueness and ComplementaryAssets
Complementary assets are: Available Tightly
held
Easy to maintain
Uniqueness is:
Hard tomaintain

Uniqueness & ComplementaryAssets over the Life Cycle:
ComplementaryUniqueness Assets
Maturity
Takeoff
Ferment

Managing discontinuities meansmanaging complementary assets:
Maturity
Performance
Discontinuity Takeoff Which of my complementary
assets are useful?
Ferment
Time

Using the model to dive deeper:
• Taking advantage of positive feedback to buildstrong complementary assets: –In marketing & R&D (Novartis) –In process technology (Intel) –In network externalities (Google, Nokia)
• Building an understanding of which assets maybe available: –Are there spillovers? –What is the shape of the learning curve? –What is the structure of demand? –Do network externalities create value?

An exampleDemand
Volume Price
Capacity Average Utilization production
costs Scale
Economies
Learning

Managing discontinuities meansmanaging complementary assets:
Maturity
Performance
Discontinuity Takeoff Which of my complementary
assets are useful?
Ferment
Time

Industry Structure and the ValueChain

Entrants
Substitutes
Suppliers BuyersRivals
Porter’s “5 (actually at least 7) Forces”:Thinking about the balance of power
Entrants
Substitutes
Rivals
Political, regulatory and“Complementors” institutional context
Suppliers Buyers

Entrants
Substitutes
Suppliers BuyersRivals
C.Assets/Uniqueness speak to Rivalryand the Threat of Entry.
Entrants
Substitutes
Suppliers BuyersRivals

Entrants
Substitutes
Suppliers BuyersRivals
Porter reminds us to think about thestructure of the value chain:
Entrants
Substitutes
Suppliers BuyersRivals

Suppliers Buyers
Powerful suppliers and buyers mayconstrain profitability
Suppliers Buyers

Making money from Innovation:Summary
• Creating value is not enough: • It is important to capture value as well • Value can be captured through a variety of mechanisms, including uniqueness and complementary assets
• Value capture strategies change over the life cycle
• Technology strategy and business strategy should thus be intimately linked

Make vs. Buy

Comparing “make” vs. “buy”
Startup Startup
Asset Asset
Supplier Supplier

Key Considerations:
• How easy is it to write contracts? –How tight is the IP regime? –How much uncertainty is there? –“Specificity” of the asset – how “thick” is the market?
• What will happen to “entrepreneurial energy”?
• What will be the key complementary assets going forward?
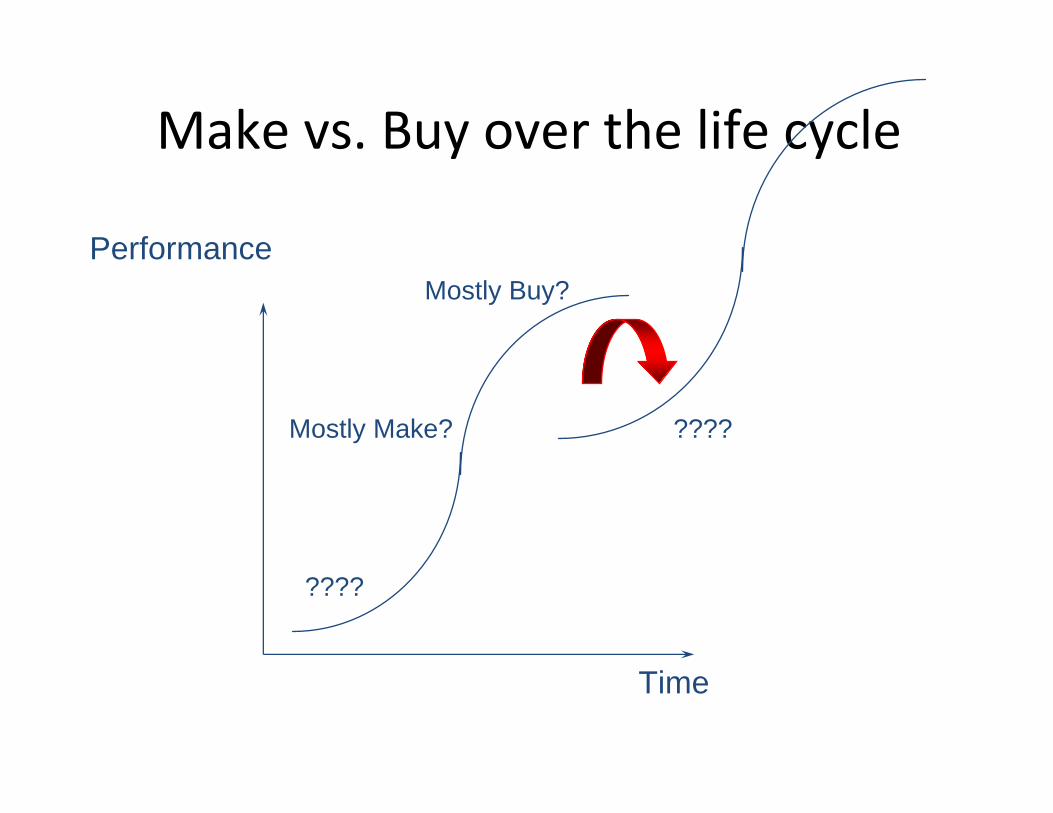
Make vs. Buy over the life cycle
Performance Mostly Buy?
Mostly Make? ????
????
Time

So “make” (i.e. do it in‐house) if:
• There are significant IP worries • There are likely to be contractual problems
–We can’t be sure of getting the “fair” price –We can’t be sure they’ll do the work “right” – I.e., when market are “thin” or there is limitedinformation
• We have unique competencies that are relevant –Or could create them
• And if buying won’t destroy everyone’s incentives to be creative and energetic
But remember…
• One cannot “buy” profit – if everyone knows it is there – it will be in the price
• Besides, shouldn’t we “stick to our knitting”?
• Wouldn’t you rather deal with an independent firm, whom you could fire, than an internal subsidiary?

Standards and Strategy:Competing in Increasingly Open
Worlds
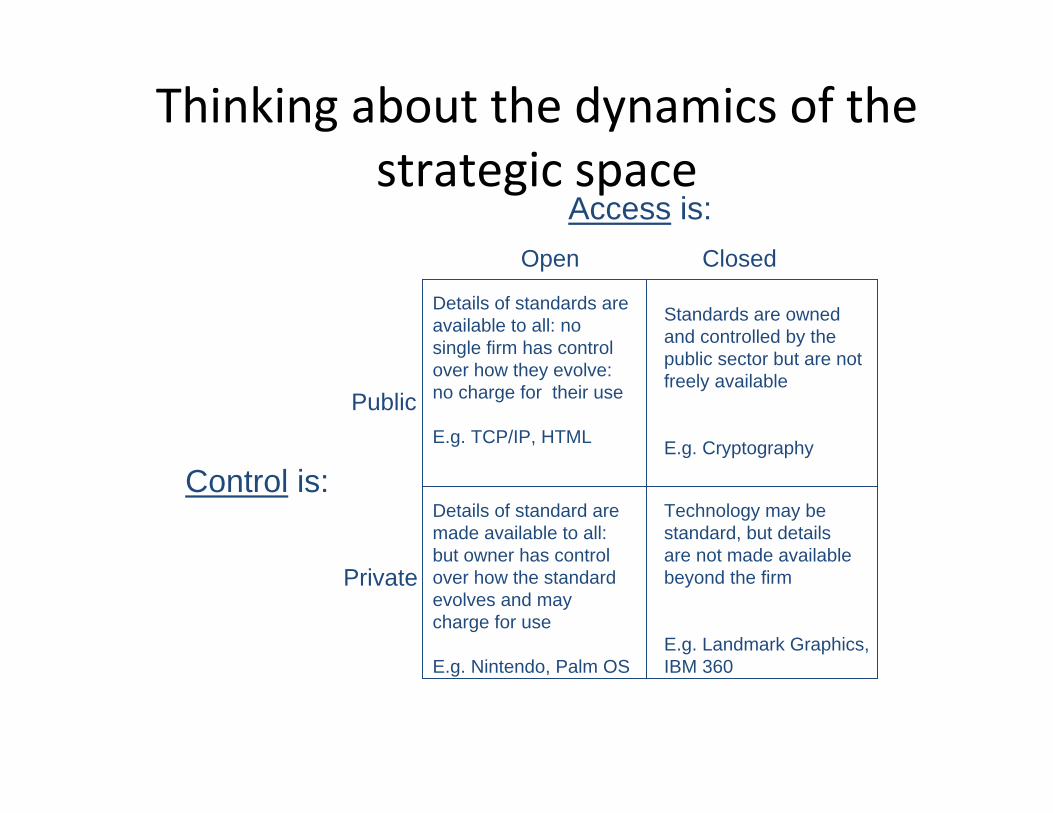
Thinking about the dynamics of thestrategic space
Access is:Open
Details of standards are available to all: no single firm has control over how they evolve: no charge for their use
E.g. TCP/IP, HTML
Closed
Standards are owned and controlled by the public sector but are not freely available
E.g. Cryptography
Public
Control is:
Private
Details of standard are made available to all: but owner has control over how the standard evolves and may charge for use
E.g. Nintendo, Palm OS
Technology may be standard, but details are not made available beyond the firm
E.g. Landmark Graphics, IBM 360

In practice these boundaries arefuzzy:
Access is: More More Open Closed
MorePublic
Control is:
More Private
IBM 360
Linux
Symbian
CDMA Windows
Mercury/ Corba

There are two sources of networkeffects
• Direct network effects – Network size – Value increases with the number of other individuals who own the same product
• E.g.: Telephones, fax machines
• Indirect network effects – Complementary products/services – Value increases with the number of complementary products that are available
• E.g.: CDs, software, VHS/Beta – Learning by using – Standards mean customers invest only once in learning to use the technology:
• E.g.: Qwerty keyboard, Autocad

With Strong Network Effects MarketShare Itself Creates Value
Value of standards Driven product
Value to consumer
Conventional product
Actual (or anticipated) size of the installed base
31

If network effects are important,markets may “tip”
1
Probability the next consumer chooses to buy A
0 A’s share of installed base 1 28
0

Tipping dynamics differ with thestrength of network effects
Products with extensive N.effects
Value to consumer
Products with “threshold”
network effects
Conventional product
Actual (or anticipated) size of the installed base

Markets with moderate network effects only tip oncecritical thresholds are reached
1
Probability the next consumer chooses to buy from Firm A
0 1 Firm A’s actual or anticipated share of installed base

Business models in the differentquadrantsThe technology is:
Closed Open
Compete on a
Public level field Move to “soft”
standards?
Control is: Encourage the
Private “ecosystem” Embrace/extend
Deliver a best in class system

Strategic Management ofPlatforms and Ecosystems
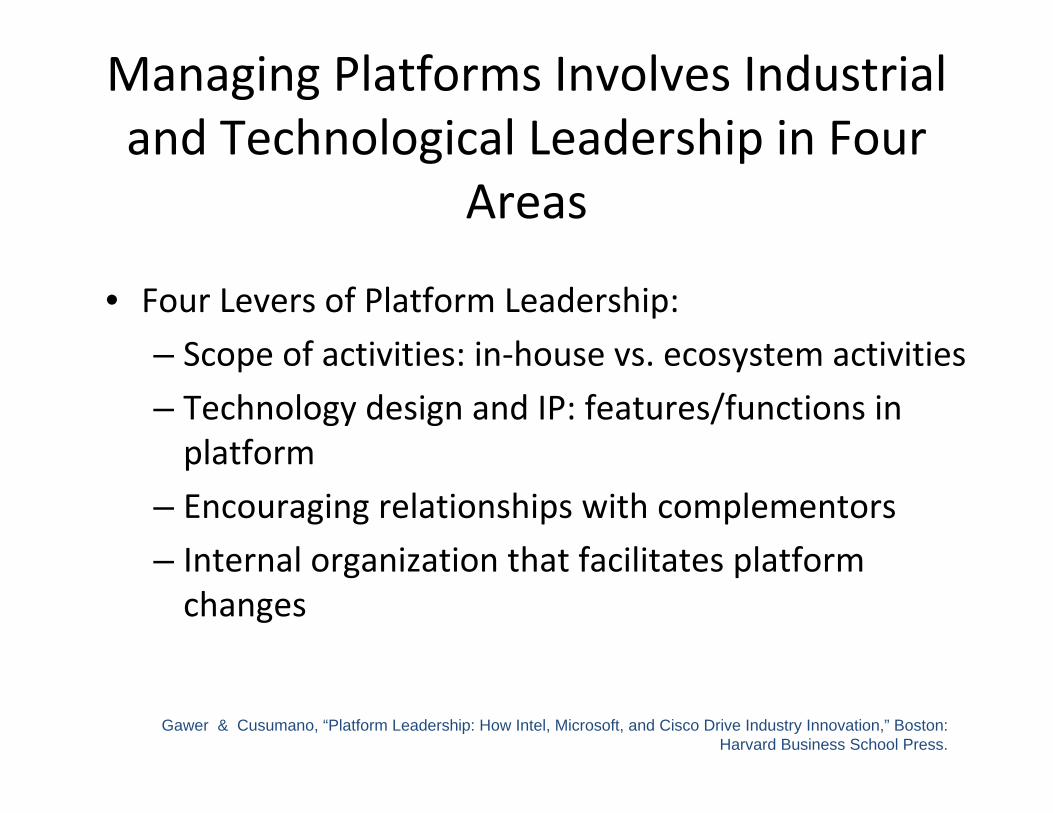
Managing Platforms Involves Industrialand Technological Leadership in Four
Areas
• Four Levers of Platform Leadership:
– Scope of activities: in‐house vs. ecosystem activities
– Technology design and IP: features/functions in platform
– Encouraging relationships with complementors
– Internal organization that facilitates platformchanges
Gawer & Cusumano, “Platform Leadership: How Intel, Microsoft, and Cisco Drive Industry Innovation,” Boston: Harvard Business School Press.

Ecosystem dilemmas of PlatformLeaders
• On the one hand, platforms create enormous incentives to “squeeze” your ecosystem: – Extending the platform into their space – e.g., envelopment
• e.g. Microsoft: Windows platform now includes important middleware not originally part of the platform
– Releasing your own complementary products in the critical areas (high growth, or strategic control points)
• e.g., Microsoft: enters key complementor markets that are high growth (Office suite) or offering strategic control points (IE & the browser wars)
• But complementors must have an incentive to innovate…if you squeeze them they’ll exit! They create much (if not most) of the value for the platform!
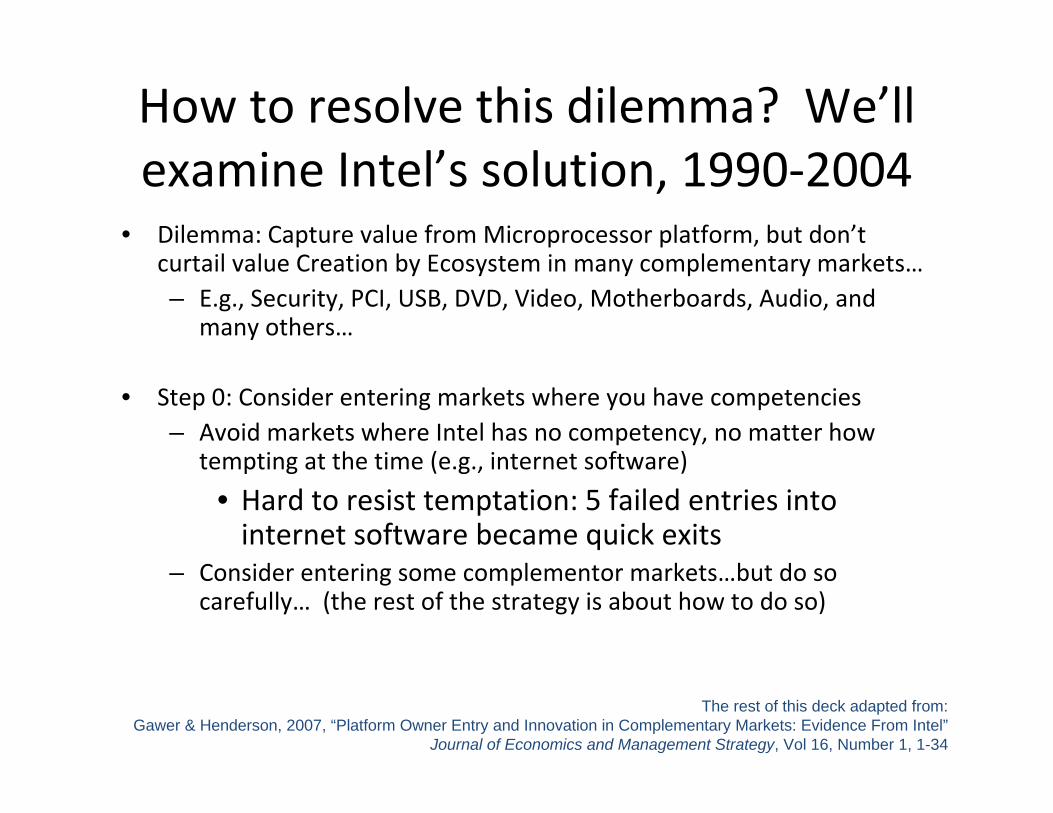
How to resolve this dilemma? We’llexamine Intel’s solution, 1990‐2004
• Dilemma: Capture value from Microprocessor platform, but don’t curtail value Creation by Ecosystem in many complementary markets… – E.g., Security, PCI, USB, DVD, Video, Motherboards, Audio, and
many others…
• Step 0: Consider entering markets where you have competencies – Avoid markets where Intel has no competency, no matter how
tempting at the time (e.g., internet software)
• Hard to resist temptation: 5 failed entries into internet software became quick exits
– Consider entering some complementor markets…but do so carefully… (the rest of the strategy is about how to do so)
The rest of this deck adapted from: Gawer & Henderson, 2007, “Platform Owner Entry and Innovation in Complementary Markets: Evidence From Intel”
Journal of Economics and Management Strategy, Vol 16, Number 1, 1-34

Value Delivery

What went wrong at Medtronic?
Declining Performance
Overload
Pressure to meet short term targets
No time for thinking through strategy
No decisions

Remembering Organizational Change in Medtronic; How didthey fix things?“Best Practice”
• Clear, committed leadership • Well articulated strategic goals
– “He cleaned up the front end…”
• Coherent management philosophy • Measures and incentives • Processes and practices • A sense of urgency
• That reinforce each other
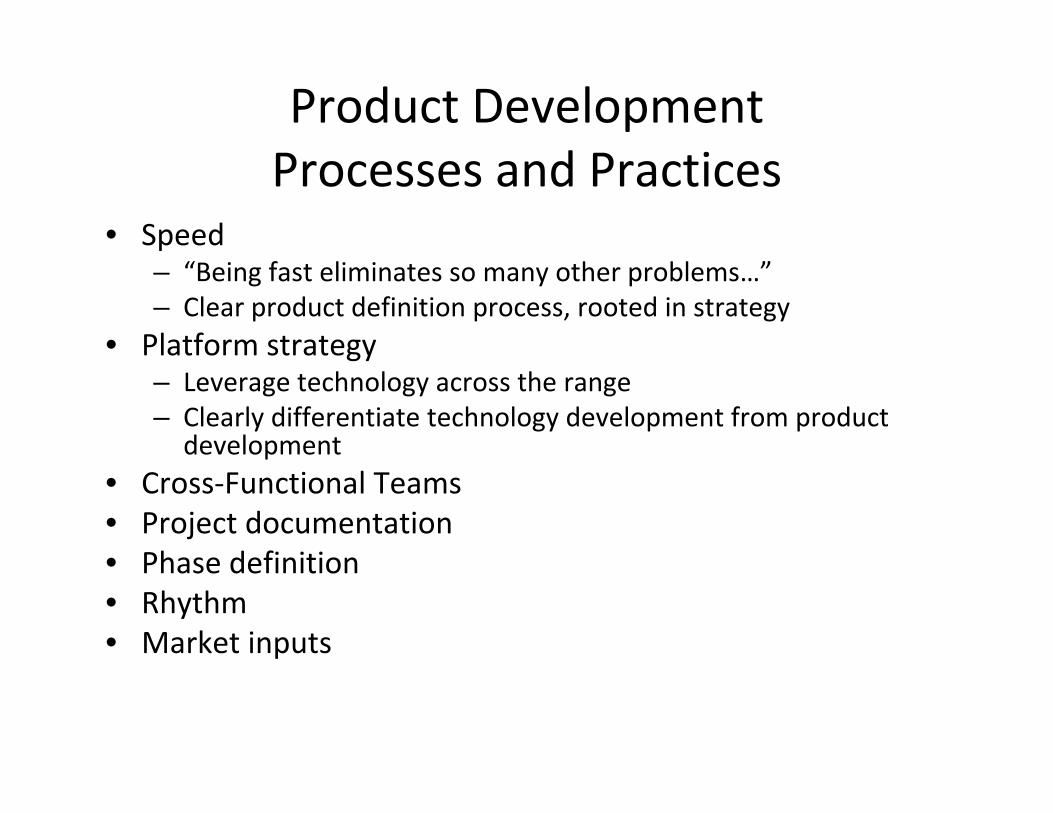
Product DevelopmentProcesses and Practices
• Speed – “Being fast eliminates so many other problems…” – Clear product definition process, rooted in strategy
• Platform strategy – Leverage technology across the range – Clearly differentiate technology development from product
development • Cross‐Functional Teams • Project documentation • Phase definition • Rhythm • Market inputs

Funnels & Project Plans

The innovation funnel
Phase I Phase II Phase III Launch

An Innovation Funnel Example
Initial marketing and technical
concepts
Idea
Generation
Contract
Launch Proposal
Post Launch Review
Gatekeeper Gatekeeper
Feasibility
Concept refinement and
prototype creation
Product optimization
Commercialization Production & Distribution
Capability Launch & Rollout
Tracks success of
Gatekeeper Gatekeeper
Charter Cross-functional
One page description of development plan proposed project including including project plan as objective, rationale and contract between team development routes. Early and Gatekeeper. Commercial Assessment
and key learnings Launch Plan including from launched CEP approval request. products
KEY
= GATE
= DOCUMENT
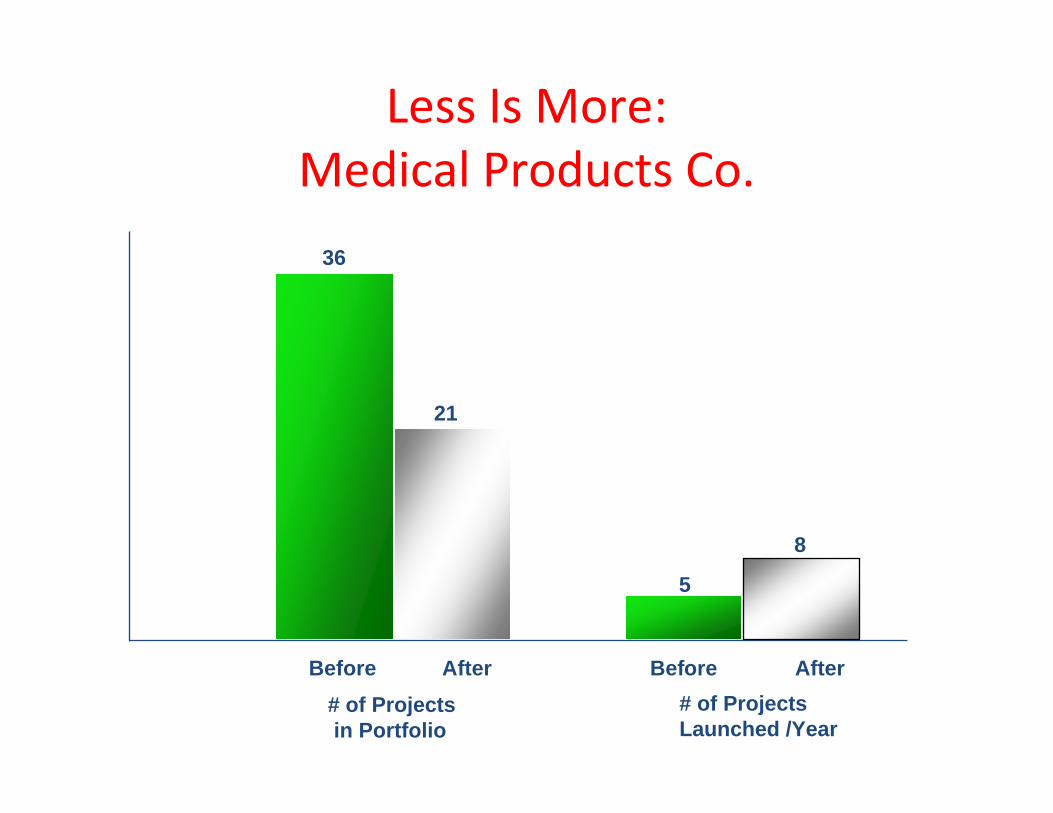
Less Is More:Medical Products Co.
36
21
8
5
Before After Before After # of Projects # of Projects in Portfolio Launched /Year

Develop the ability to manage ambidextrously
Performance
Different expectations, control systems, incentives. “High conflict, high respect”
conversations
Time
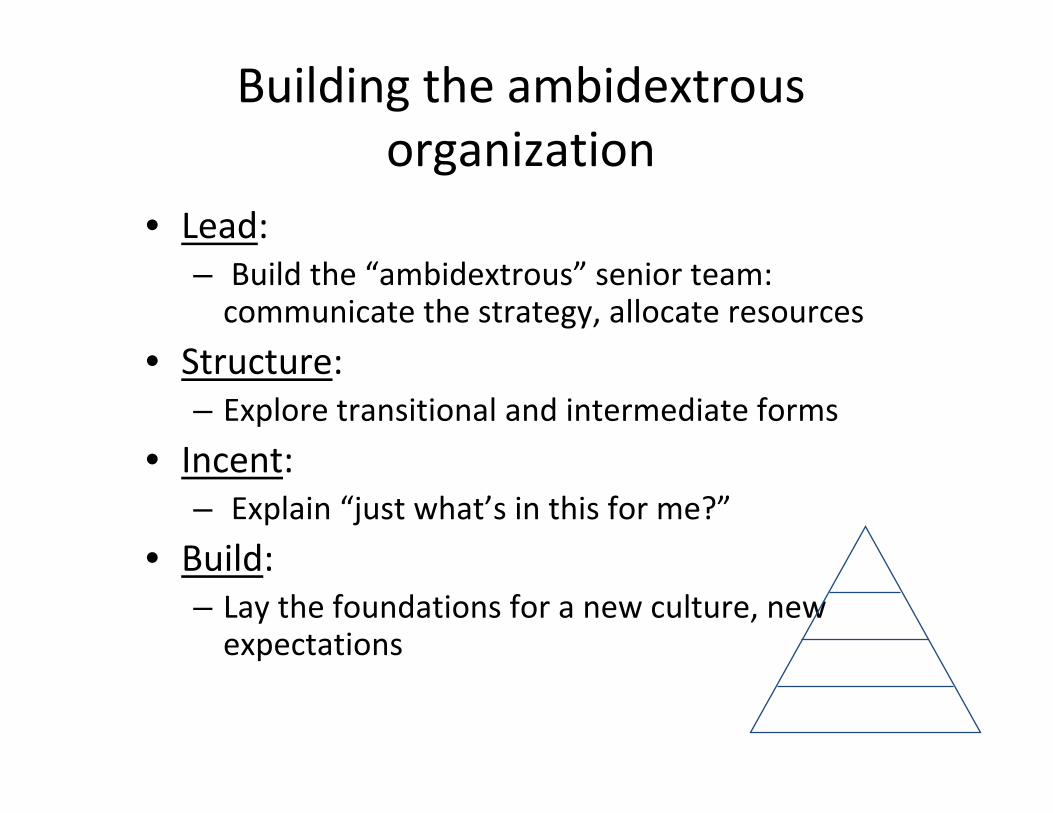
Building the ambidextrousorganization
• Lead: – Build the “ambidextrous” senior team: communicate the strategy, allocate resources
• Structure: – Explore transitional and intermediate forms
• Incent: – Explain “just what’s in this for me?”
• Build: – Lay the foundations for a new culture, new expectations

Summary

Effective strategies addressthree key problems:
How will we Create value?
How will we Capture value?
How will we Deliver value?

Effective strategies answer 7 critical questions:
• How will we create value?
– How will the technology evolve?
– How will the market change?
– How do we organize effectively?
• How will we capture value?
– How do we compete to gain sustainable competitive advantage?
– How should we compete if standards are important?
• How will we deliver value?
– How should we execute the strategy?
– How do we make strategic decisions and take decisive action?
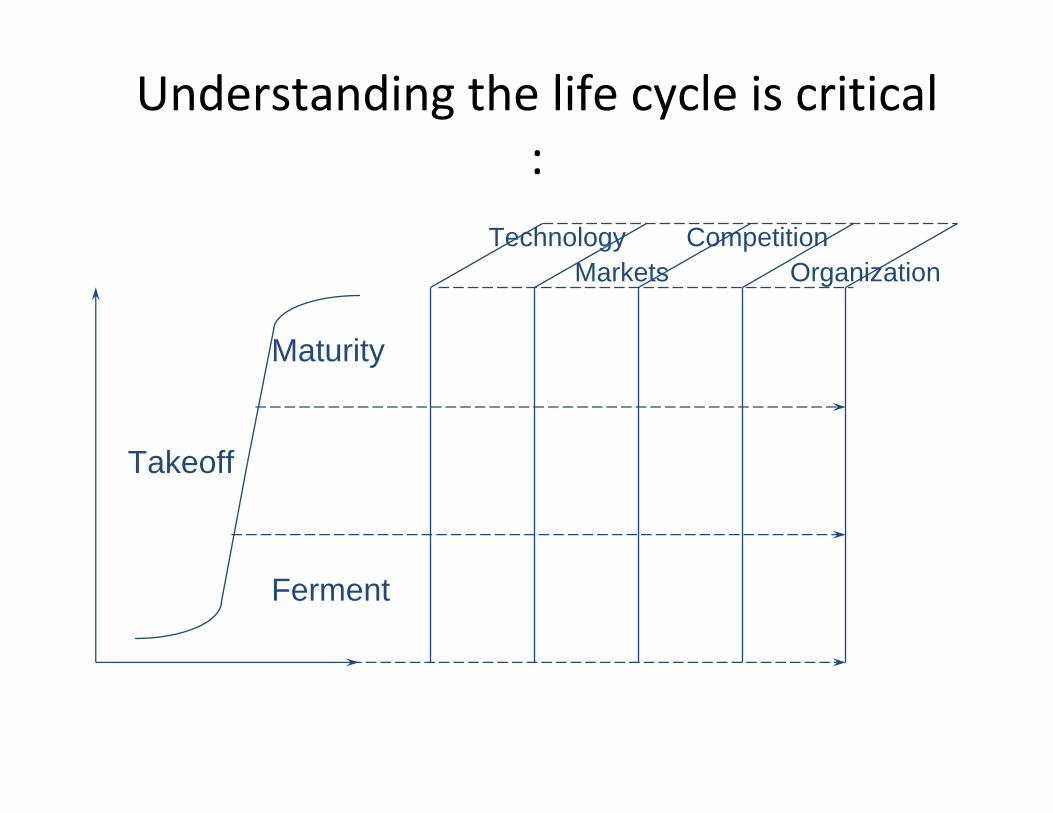
Understanding the life cycle is critical:
CompetitionOrganization
Technology Markets
Maturity
Takeoff
Ferment

Startup
Asset
Supplier
Technology strategy on one slide:
Create
CaptureDeliver
?

Good Luck!


