TERRITORIAL PLANNING OFFICE lolani Palace Honolulu 13, Hawaii 50% GOVERNMENT IN HAWAII A HANDBOOK OF FINANCIAL STATISTICS 1953 THIRD EDITION LIBRARY STATE OF HAWAII DEPARTM ENT OF PLANN ING AND ECONOM IC DEVELOPMENT Territorial 426 Queen Stre General Fund 'i Expenditures E:ai Cost of Living Population 150% 100 % 50% 1941-43 BIENNIUMS 1943-45 1945-47 1947-49 1949-51 1951-53 ESTIMATED TAX STUDY COMMITTEE „ HJ 389.5 I' 139 1953 Chamber of Commerce of Honolulu HONOLULU, HAWAII 1953
Transcript
TERRITORIAL PLANNING OFFICE lolani Palace
Honolulu 13, Hawaii
5 0 %
GOVERNMENT IN HAWAI I
A HANDBOOK OF
F INANC IAL STATISTICS
1953
T H I R D E D I T I O N
L I B R A R Y
STATE OF HAWAII DEPARTMENT OF PLANNING ANDECONOMIC DEVELOPMENT
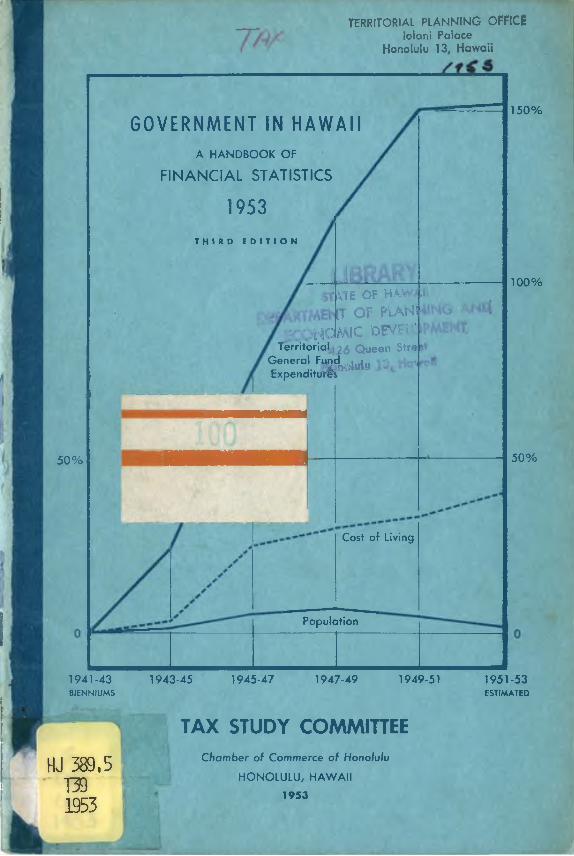
Territorial 426 Queen StreGeneral Fund 'iExpenditure s
E : a i
Cost of Living
Population
15 0 %
100%
5 0 %
1941-43BIENNIUMS
1943-45 1945-47 1947-49 1949-51 1951-53ESTIMATED
TAX STUDY COMMITTEE
„ H J 3 8 9 . 5 I'
1 3 9
1 9 5 3
Chamber of Commerce of Honolulu
HONOLULU, HAWAII
1953
FOREWORD
TERRITORIAL PLANNING OFFICE lolani Palace
Honolulu 13, Hawaii
Government in Hawaii: 1953, is the third in a series initiated by the Tax Study
Committee in 1949. Now, as then, its purpose is to make available in convenient
form some of the more important current and historical statistics pertaining to the
fiscal operation of our government. This edition also includes a section on public
officials.
It is the opinion of the Tax Study Committee that democracy is possible only with
an informed public. The citizen should know what taxes he is paying; how much
of his income governments are taking; how his tax burden compares with that of
persons living in other areas, and the ability of the people to pay these taxes. He
should know where and how his tax dollars are spent, and the proportionate part
of these dollars spent on each governmental service.
Acknowledgment is gratefully made to the Director of the Budget, the Auditor,
the Tax Commissioner, the Treasurer, and other officials of the Territorial and
County governments for their generous assistance in the compilation of this
information.TAX STUDY COMMITTEE
James H. Tabor,
January 1953 Chairman
THE TAX STUDY COMMITTEE
Executive Committee
James H. Tabor, Chairman
H. C. E ichelberger
Roy E. Brown, Director
N o lle R. Smith, Assistant Director
H. C. Babbitt
V. O . Bortz
Edwa rd Z. Buck
F. B. Carter III
W m . C. Chodwick
R. S. C raig
James K. C . Doo
John A . Driver
Samuel J. Dunkley
G eorge R. Ewart II
W m . J. G ask ill L. V. Hass
A . W . Hodgman
C laude A . Jogger
Staff
Members
H. B. Lyman
T. G . Singlehurst
Kenneth H. O hta , Research Analyst
M arion F. Brown, Secretary
Roy Kennedy
Leo Lycurgus
Boyd M acNa ughton
D . McCloskey
A . Q . M arca llino
A . G . Marcus
V. L. Shaefer, Jr.
M . C. Shaver
J. H. Shoemaker
C. N ils Tavares
L. L. Thomas
R. H. W hee ler
H . W . B. W hite
Ralph E. W oo lley
Paul T. Yardley
[ 1 ]
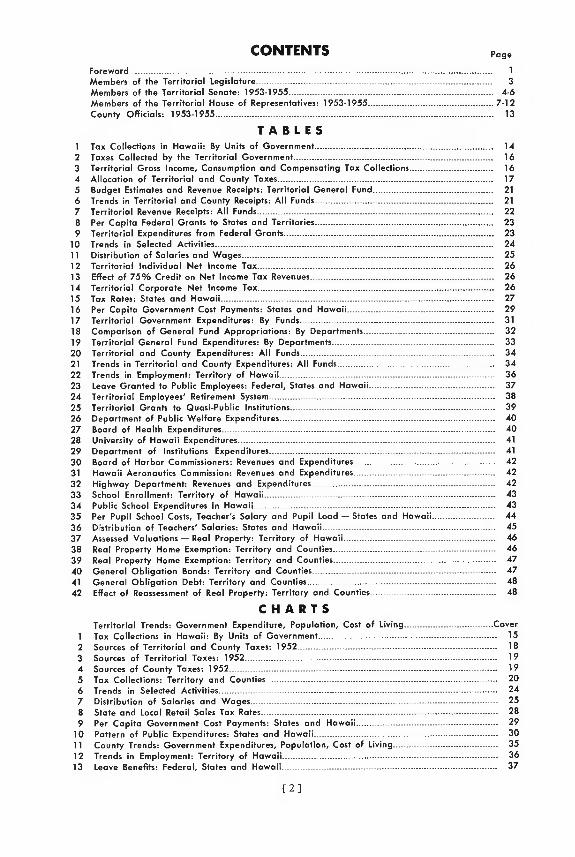
CONTENTS Page
Foreword .............................................................................................................................................................................................................. 1Members o f the Territorial Legislature........................................................................................................................................ 3
Members of the Territoria l Senate: 1953-1955...................................................................................................................... 4-6
Members of the Territoria l House of Representatives: 1953-1955..........................................................................7-12
County O ffic ia ls: 1953-1955................................................................................................................................................................. 13
T A B L E S1 Tax Collections in H aw a ii: By Units of Government...................................................................................................... 14
2 Taxes Collected by the Territorial Government.................................................................................................................. 16
3 Territoria l Gross Income, Consumption and Compensating Tax Collections.................................................. 16
4 A llocation o f Territoria l and County Taxes........................................................................................................................... 17
5 Budget Estimates and Revenue Receipts: Territoria l G enera l Fund..................................................................... 21
6 Trends in Territoria l and County Receipts: A ll Funds...................................................................................................... 21
7 Territorial Revenue Receipts: A ll Funds........................................................................................................................................ 22
8 Per Cap ita Federal Grants to States and Territories...................................................................................................... 23
9 Territorial Expenditures from Federal Grants......................................................................................................................... 23
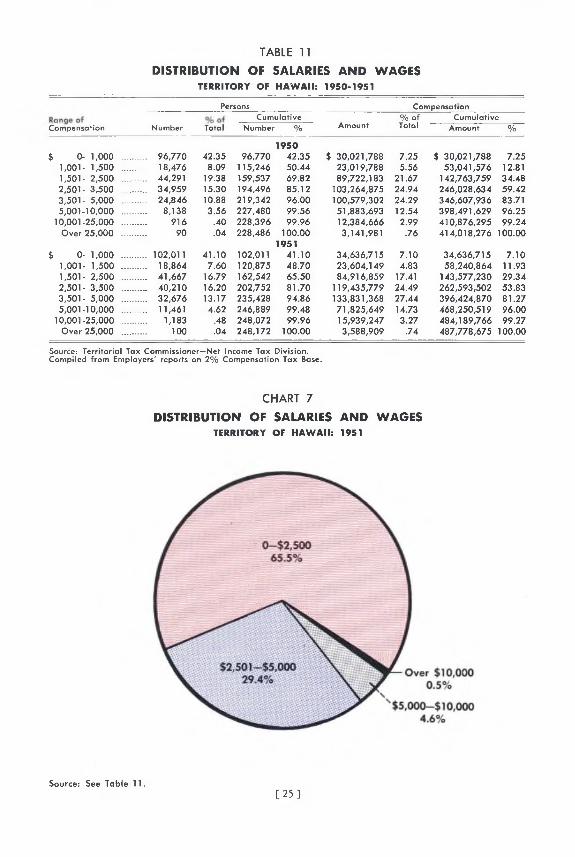
10 Trends in Selected Activities................................................................................................................................................................ 2411 Distribution o f Salaries and W age s ................................................................................................................................................. 25
12 Territorial In d iv idua l Net income Tax........................................................................................................................................ 26
13 Effect of 7 5 % Credit on Net Income Tax Revenues.......................................................................................................... 26
14 Territoria l Corporate Net income Tax........................................................................................................................................ 26
15 Tax Rates: States and H aw a ii............................................................................................................................................................. 2716 Per Cap ita Government Cost Payments: States and H aw a ii.................................................................................... 29
17 Territorial Government Expenditures: By Funds................................................................................................................ 31
18 Comparison of Genera l Fund Appropriations : By Departments........................................................................... 32
19 Territoria l G eneral Fund Expenditures: By Departments.............................................................................................. 33
20 Territorial and County Expenditures: A ll Funds................................................................................................................ 34
21 Trends in Territoria l and County Expenditures: A ll Funds............................................................................................ 34
22 Trends in Employment: Territory of H aw a ii............................................................................................................................. 36
23 Leave G ranted to Public Employees: Federal, States and H aw a ii....................................................................... 37
24 Territoria l Employees' Retirement System.................................................................................................................................. 38
25 Territoria l G ra nt to Quasi-Public Institutions...................................................................................................................... 39
26 Department of Public W e lfa re Expenditures........................................................................................................................... 40
27 Board of Health Expenditures............................................................................................................................................................ 40
28 University of H ow a ii Expenditures................................................................................................................................................... 41
29 Department of Institutions Expenditures................................................................................................................................. 41
30 Board of Harbor Commissioners: Revenues and Expenditures................................................................................... 42
31 H aw a ii Aeronautics Commission: Revenues and Expenditures................................................................................... 42
32 H ighway Department: Revenues and Expenditures............................................................................................................ 42
33 School Enrollment: Territory of H aw a ii....................................................................................................................................... 43
34 Public School Expenditures in H aw a ii.......................................................................................................................................... 4335 Per Pupil School Costs, Teacher's Salary and Pupil Load — States and H aw a ii.................................. 44
36 Distribution of Teachers' Salaries: States and H aw a ii.................................................................................................. 45
37 Assessed Valuations — Real Property: Territory of H aw a ii...................................................................................... 46
38 Real Property Home Exemption: Territory and Counties................................................................................................ 46
39 Real Property Home Exemption: Territory and Counties................................................................................................ 47
40 Genero l O b lig a t io n Bonds: Territory and Counties......................................................................................................... 47
41 Genera l O b liga t io n Debt: Territory and Counties............................................................................................................ 48
42 Effect of Reassessment of Real Property: Territory and Counties........................................................................ 48
C H A R T STerritoria l Trends: Government Expenditure, Popu lation , C o s to f L iving...................................................Cover
1 Tax Collections in H aw a ii: By Units o f Government....................................................................................................... 15
2 Sources o f Territoria l and County Taxes: 1952................................................................................................................... 18
3 Sources of Territoria l Taxes: 1952 ................................................................................................................................................. 19
4 Sources of County Taxes: 1952.......................................................................................................................................................... 19
5 Tax Collections: Territory and Counties..................................................................................................................................... 20
6 Trends in Selected Activities................................................................................................................................................................ 24
7 Distribution of Salaries and W age s .............................................................................................................................................. 25
8 State and Local Retail Sales Tax Rates........................................................................................................................................ 289 Per Cap ita Government Cost Payments: States and H aw a ii................................................................................. 29
10 Pattern of Public Expenditures: States and H aw a ii.......................................................................................................... 3011 County Trends: Government Expenditures, Popu lation , Cost of L iving............................................................... 35
12 Trends in Employment: Territory of H aw a ii............................................................................................................................ 36
13 Leave Benefits: Federal, States and H aw a ii............................................................................................................................ 37
[ 2 ]
MEMBERS OF THE TERRITORIAL LEGISLATURE27 th SESSION
SENATEABE, K A Z U H IS A (D )— 1st District, H aw aii
A N S A I, TO SH IO (R )- 2nd District, M au i
CROCKETT, W END ELL F. (R )- 2 nd District, M au i
D IL L IN G H A M , B EN JA M IN F. I I (R )- 3 rd District, O ahu
DUARTE, J O H N G . (D )- 2 n d District, M au i
FERNANDES , J O H N B. (D )-4 th District, Kauai
HEEN , W IL L IA M H . (D )- 3 rd District, Oahu
H ILL , W IL L IA M H . (R )-1st District, H aw aii
IT A G A K I, JOE (R )- 3 rd District, O ahu
LEE, HERBERT K . H . (D )- 3 rd District, O ahu
M IY A K E , NO BO RU (R )-4 th District, Kauai
N O B R IG A , W IL L IA M J. (D )-1st District, H aw aii
O K IN O , TO M T. (D )-1st District, H aw aii
R O B IN S O N , M A R Y K . (R )- 3 rd District, O ahu
T S U K IY A M A , W ILFRED C. (R )- 3 rd District, O ahu
HOUSE OF REPRESENTATIVESDUPO NTE , DEE (D )- 3 rd District, M au i, M a la k a i, Lana!
E D W A R D S , WEBLEY (R )-4 th District, O ahu
ESPOSITO , O . V IN CENT (D )- 5 th District, O ahu
FERNANDES , W IL L IA M E. (D )-6 th District, Kauai
F O N G , H IR A M L. (R )-5 th District, O ahu
FU K U S H IM A , YASUTAKA (R )-5 th District, O ahu
G A R C IA , JOSEPH R ., JR. (R )-1st District, East H aw aii
HENR IQ UES , M A N U EL S. (D )- 6 th District, Kauai
H IN D , ROBERT L ., JR . (R )- 2 nd District, West H aw aii
K A U H A N E , CHARLES E. (D )— 5th District, O ahu
K IN G , JACK P. (R )-4 th District, Oahu
K O B A Y A S H I, R A Y M O N D M . (D )-1st District, East H aw aii
LYDGATE, E. PERCY (R )- 3 rd District, M au i, M o la ka i, Lanai
M cG U IR E , WALTER F. (R )-4 th District, O ahu
N O D A , STEERE G . (D )- 5 th District, O ahu
PASCHO AL , M A N U E L G . (R )- 3 rd District, M au i, M o la k a i, Lanai
PORTEUS, HEBDEN (R )-4 th District, O ahu
PULE, A K O N I (D )- 2 n d District, West H aw aii
R IC H ARD SO N , ESTHER K . (R )- 2 nd District, West H aw aii
RUSSELL, J . W A R D (R )-4 th District, O ahu
S A K A K IH A R A , THO M A S T. (R )- ls t District, Eost Haw aii
SEO NG , CLARENCE K . (D )- 3 rd District, M au i, M o loko i, Lanai
S E R IZ A W A , TO SH IO (D )-6 th District, Kauai
S H IM A M U R A , CLARENCE Y . (R )-5 th District, O ahu
STARR, W . RUSSELL (R )-4 th District, O ahu
ST. SURE, R ICHARD P. (R )- 3 rd District, M au i, M o lo ka i, Lanai
TO G U C H I, THO M AS T. (R )- 2 nd District, West H aw aii
T O K U N A G A , BARNEY H . (R )- 3 rd District, M au i, M o lo ka i, Lanai
Y A M A , TO SH IHARU (D )- 6 th District, Kauai
Y A M A U C H I, JOE T. (R )-1st District, East H aw aii
[ 3 ]
KAZUHISA ABE, Democrat
SENATOR, 1ST DISTRICT, HAWAII.
Born: January 18, 1914, Pepeekeo; education: Hilo High, University of Hawaii, Michigan Law School; married, two children; attorney; District Magistrate, Kohala, four years; member, Hawaii Island Board of Supervisors, 1946-1952; elected. Senate, 1952; Hold- over, 1955.
S E N A T E
TOSHIO ANSAI, Republican
SENATOR, 2ND DISTRICT, MAUI.
Born: January 5, 1908, W ailuku ; education: Wailuku Elementary; St. Anthony School; University of Hawaii Extension, College of Agriculture; married, two children; Manager, Waihee Dairy & Farm, Wailuku Sugar Company; witness. Statehood Hearings, Washington, D. C., 1950; member, four terms, Maui County Board of Supervisors; member. Senate, 1949-1953; Holdover, 1955.
WENDELL F. CROCKETT, Republican
SENATOR, 2ND DISTRICT, MAUI.
Born: October 15, 1891, Montgomery, A labama;education: University of Michigan; married, threechildren; attorney; Deputy Maui County Attorney, 29 years; member, Senate, 1951-1953.
BENJAMIN F. DILLINGHAM II, Republican
SENATOR, 3RD DISTRICT, OAHU.
Born: October 14, 1916, Honolulu; education: Puna- hou; LaRosey, Gstaad, Switzerland; St. Paul's School, Concord, Mass.; Fountain Valley School, Colorado; Harvard University; married, three children; Vice- President and General Manager, Oahu Railway & Land Company; member. Board of Supervisors, 1946- 1948; member. Senate, 1949-1953; Holdover, 1955.
\
JOHN G. DUARTE, Democrat
SENATOR, 2ND DISTRICT, MAUI.
Born: July 10, 1896, Sprecklesville; education: St. Anthony School; married, one daughter; Owner, Haleakala Hotel; Shop Superintendent, Maui Publish- ing Co., Ltd.; member. Senate, 1949-1953; Holdover, 1955.
t e r r i t o r i a l p l a n n i n g o f f ic e
lo lan i Palace Honolu lu 13, Hawaii
S E N A T E
JOHN BRAGA FERNANDES, Democrat
SENATOR, 4TH DISTRICT, KAUAI.
Born: May 15, 1892, Kapaia; married, four sons; President, Puhi Co., Ltd.; member. Board of Super- visors, 1933-1934; member. House, 1937; member. Senate, since 1939.
WILLIAM H. HEEN, Democrat
SENATOR, 3RD DISTRICT, OAHU.
Born: March 11, 1883, Olowalu, Maui; education: lolani, Oahu College, University of California; mar- ried, six children; attorney; Deputy Attorney, Hawaii County, 1910-1915; Deputy Attorney General, 1915- 1917; Judge, First Circuit Court, 1917-1919; City and County Attorney, Honolulu, 1919-1925; witness. State- hood Hearings, Washington, D. C., 1947, 1950; Delegate, Hawaii State Constitutional Convention of 1950; member. Senate, since 1927.
WILLIAM HARDY HILL, Republican
SENATOR, 1ST DISTRICT, HAWAII.
Born: June 15, 1890, Ashville, North Carolina; educa- tion: public schools, Moscow, Idaho; married, two children; Treasurer-Manager, Realty Investment Co., Ltd.; President-General Manager, Flowers of Hawaii, Ltd.; Hilo Motors, Ltd.; W ailoa Motors, Ltd.; President, Standard Drug Co., Ltd., and Hilo Electric Light Co., Ltd.; member. House, 1929; Senate, 1933-1935, and since 1939.
JOE ITAGAKI, Republican
SENATOR, 3RD DISTRICT, OAHU.
Born: October 10, 1906, Aiea, Oahu; education: public schools of Hawaii; married, two children; Owner, Kewalo Inn; witness. Statehood Hearings, Washington, D. C., 1950; member. House, 1947, 1949; member. Holdover Committee, 1949-1950; Sen- ate, 1953; Holdover, 1955.
HERBERT K. H. LEE, Democrat
SENATOR, 3RD DISTRICT, OAHU.
Education: Universities: Hawaii, Michigan Law, &Yenching, Peking; married, two children; attorney; Assistant Public Prosecutor, City & County of Hono- lulu, 1940-1941; Deputy Attorney General, 1941- 1942; witness. Statehood Hearings, Washington, D. C., 1947, 1950; Delegate, Hawaii State Constitu- tional Convention of 1950; member. House, 1945- 1947; Senate, 1949-1953; Holdover, 1955.
NOBORU MIYAKE, Republican
SENATOR, 4TH DISTRICT, KAUAI.
Born: April 19, 1896, Waimea; education: KauaiElementary, correspondence school; married, three children; Presidemt and Manager, Waimea Electric Co., Ltd., and Waimea Garage, Ltd.; witness. State- hood Hearings, Washington, D. C., 1950; member. Board of Supervisors, ten years; member. House, 1949-1951; Senate, 1953; Holdover, 1955.
S E N A T E
WILLIAM J. NOBRIGA, Democrat
SENATOR, 1ST DISTRICT, HAWAII.
Born: June 15, 1905, Honokaa; education: Paauilo Grammar, Hilo High School, University of Hawaii; married, two children; rancher; witness. Statehood Hearings, Washington, D. C., 1950; member. House, 1943, 1945; member. Holdover Committee, 1949; Senate, 1949-1953; Holdover, 1955.
TOM T. OKINO, Democrat
SENATOR, 1ST DISTRICT, HAWAII.
Born: May 7, 1906, Hilo; education: Oberlin College, Harvard University Law School; married, three chil- dren; attorney; District Magistrate, Puna, 1934-1938; Deputy County Attorney, 1939-1945; County At- torney, 1945-1949; witness. Statehood Hearings, Washington, D. C., 1950; Delegate, Hawaii State Constitutional Convention of 1950; member. Senate, 1951-1953.
MARY K. ROBINSON, Republican
SENATOR, 3RD DISTRICT, OAHU.
Born: Honolulu; education: Wailuku Elementaryand High School, St. Andrew's Priory; married; Owner-Manager, Hawaiian Tour and Travel Service; government service, 31 years; member. Senate, since 1951.
WILFRED C. TSUKIYAMA, Republican
SENATOR, 3RD DISTRICT, OAHU.
Education: Kaahumanu; McKinley High School; Coe College, Iowa; University of Chicago; married, five children; attorney; Deputy City and County Attorney, 1929-1932; City and County Attorney, 1933-1940; witness. Statehood Hearings, Washington, D. C., 1950; member. Senate, since 1947; President of Senate, 1949-1953.
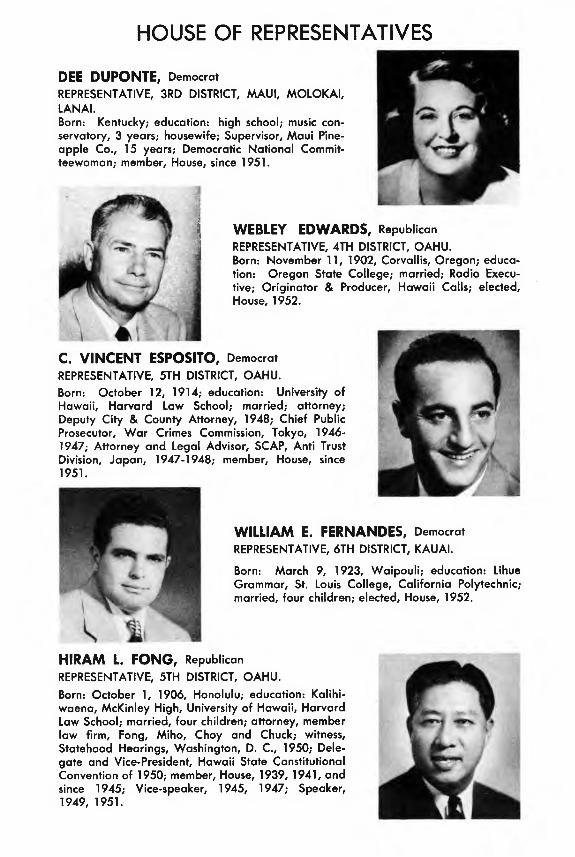
HOUSE OF REPRESENTATIVES
DEE DUPONTE, Democrat
REPRESENTATIVE, 3RD DISTRICT, MAUI, MOLOKAI,LANAI.Born: Kentucky; education: high school; music con-servatory, 3 years; housewife; Supervisor, Maui Pine- apple Co., 15 years; Democratic National Commit- teewoman; member. House, since 1951.
WEBLEY EDWARDS, Republican
REPRESENTATIVE, 4TH DISTRICT, OAHU.Born: November 11, 1902, Corvallis, Oregon; educa- tion: Oregon State College; married; Radio Execu-tive; Originator & Producer, Hawaii Calls; elected. House, 1952.
C. VINCENT ESPOSITO, Democrat
REPRESENTATIVE, 5TH DISTRICT, OAHU.
Born: October 12, 1914; education: University of Hawaii, Harvard Law School; married; attorney; Deputy City & County Attorney, 1948; Chief Public Prosecutor, W ar Crimes Commission, Tokyo, 1946- 1947; Attorney and Legal Advisor, SCAP, Anti Trust Division, Japan, 1947-1948; member. House, since1951.
WILLIAM E. FERNANDES, Democrat
REPRESENTATIVE, 6TH DISTRICT, KAUAI.
Born: March 9, 1923, W aipou li; education: LihueGrammar, St. Louis College, California Polytechnic; married, four children; elected. House, 1952.
HIRAM L. FONG, Republican
REPRESENTATIVE, 5TH DISTRICT, OAHU.
Born: October 1, 1906, Honolulu; education: Kalihi- waena, McKinley High, University of Hawaii, Harvard Law School; married, four children; attorney, member law firm, Fong, Miho, Choy and Chuck; witness. Statehood Hearings, Washington, D. C., 1950; Dele- gate and Vice-President, Hawaii State Constitutional Convention of 1950; member. House, 1939, 1941, and since 1945; Vice-speaker, 1945, 1947; Speaker, 1949, 1951.
HOUSE OF REPRESENTATIVES
YASUTAKA FUKUSHIMA, Republican
REPRESENTATIVE, 5TH DISTRICT, OAHU.
Born: June 3, 1916, Honolulu; education: LeilehuaElementary and High Schools, University of Hawaii, Harvard Law; married, three children; attorney; Dele- gate, Hawaii State Constitutional Convention of 1950; member. House, since 1951.
JOSEPH R. GARCIA, JR., Republican
REPRESENTATIVE, 1ST DISTRICT, EAST HAWAII.
Born: June 26, 1915, Keahua, Maui; education: Puu- kolii Grammar, Lahainaluna Technical, University of California College of Agriculture; married, two sons; Industrial Relations Superintendent, Hakalau Planta- tion; Delegate, Statehood Hearings, Washington, D. C., 1950; member. House, since 1949.
MANUEL S. HENRIQUES, Democrat
REPRESENTATIVE, 6TH DISTRICT, KAUAI.
Born: March 1, 1893, Madeira, Portugal; education: Madeira public schools; College of Good Hope, M a- deira; Blackstone College of Law, Chicago; married, eight children; attorney; member. House, 1945, 1947, and since 1951.
ROBERT LEIGHTON HIND, JR., Republican
REPRESENTATIVE, 2ND DISTRICT, WEST HAWAII.
Education: Hilo Standard and Intermediate Schools; Punahou; Menlo College, California; Stanford Uni- versity; married, one child; Ranch Owner and Mana- ger; member. House, since 1949.
CHARLES E. KAUHANE, Democrat
REPRESENTATIVE, 5TH DISTRICT, OAHU.
Born: June 14, 1905, Honolulu; education: St. Louis College; married, four children; Businessman; Na- tional Committeeman, 1948-1952; witness. Statehood Hearings, Washington, D. C., 1950; Delegate, Ha- waii State Constitutional Convention of 1950; mem- ber, House, 1943-1949; reelected 1952; Democratic Floor Leader, 1947-1949; Chairman, Holdover Com- mittee on UnAmerican Activities, 1949.
HOUSE OF REPRESENTATIVES
JACK P. KING, Republican
REPRESENTATIVE, 4TH DISTRICT, OAHU.
Born: April 13, 1909, Richmond, V irginia; education: McKinley High School; University of Hawaii; married, four daughters; Insurance Counselor; member. House, since 1949.
RAYMOND M . KOBAYASHI, Democrat
REPRESENTATIVE, 1ST DISTRICT, EAST HAW'AII.
Born: February 17, 1909, Lower Paia; education:Maui High, Phillips Commercial School; married, five children; Owner, Auto Driving School, Automotive Parts and Supplies, Rancher; member. House, elected1952.
ELWELL PERCY LYDGATE, Republican
REPRESENTATIVE, 3RD DISTRICT, MAUI, MOLOKAI, LANAI.Born: September 2, 1905, Lihue; education: KauaiHigh School, University of Hawaii; married, one child; Assistant Treasurer, Maui Pineapple Co., Ltd.; mem- ber, House, since 1949.
I
,.7.:
- 1 ^- /
WALTER F. McGUIRE, Republican
REPRESENTATIVE, 4TH DISTRICT, OAHU.
Education: Kamehameha, Punahou, University ofWisconsin; married, one daughter; Regional Affairs Manager, United Airlines; witness. Statehood Hear- ings, Washington, D. C., 1950; member. House, since 1945.
STEERE G. NODA, Democrat
REPRESENTATIVE, 5TH DISTRICT, OAHU.
Born: Ewa, Oahu; education: Japanese High School, Mid-Pacific Institute; married, four children; District Court Practitioner; witness. Statehood Hearings, Washington, D. C., 1950; Delegate, Hawaii State Constitutional Convention of 1950; member. House, since 1949; member. Holdover Committee, 1949.
Age: 70; education: St. Louis College; married, three children; Co-owner, Maui Amusement Company; member. House, since 1917.
HEBDEN PORTEUS, Republican
REPRESENTATIVE, 4TH DISTRICT, OAHU.
Education: Punahou, University of Hawaii, HarvardLaw School; married, five children; attorney; Delegate and Secretary, Hawaii State Constitutional Convention of 1950; member. House, since 1941; Vicespeaker, 1949, 1951.
t A .
AKONI PULE, Democrat
REPRESENTATIVE, 2ND DISTRICT, WEST HAWAII.
Born: September 5, 1906, Niulii, Kohala; education: Kohala High School; married, eight children; W arehouse Issuing Clerk, Kohala Sugar Co.; witness. Statehood Hearings, Washington, D. C., 1950; member. House, 1947, 1949; member. Holdover Committee, 1949; reelected, 1952.
ESTHER K. RICHARDSON, Republican
REPRESENTATIVE, 2ND DISTRICT, WEST HAWAII.
Born: Punaluu, Oahu; education: public and private schools of Honolulu; married, two sons; Owner, Esther's Lauhalo Studio; witness. Statehood Hearings, Washington, D. C., 1950; member. House, since 1943.
J. WARD RUSSELL, Republican
REPRESENTATIVE, 4TH DISTRICT, OAHU.
Born: March 19, 1917, Hilo, Hawaii; education:Punahou; Assistant to Chief Engineer, Mutual Telephone Company; member. House, since 1951.
HOUSE OF REPRESENTATIVES
THOMAS T. SAKAKIHARA, Republican
REPRESENTATIVE, 1ST DISTRICT, EAST HAWAII.
Born: July 17, 1900, Hilo; education: Hilo Grammar . ■*. ■ «Schools, Hilo High; married, two children; District 1
Court Practitioner; witness. Statehood Hearings,Washington, D. C., 1950; Delegate and Vice-President, Hawaii State Constitutional Convention of 1950; .member. House, 1933-1937, 1941, and since 1947. . i
CLARENCE K. SEONG, Democrat
3RD DISTRICT, MAUI, MOLOKAI, LANAI.
Born: Lahaina, Maui; education: Kamehameha, University of Hawaii; married; Owner, Music Sales Company; Manager, Club El Amigo, W ailuku ; member. House, since 1949.■ M V
TOSHIO SERIZAWA, Democrat
REPRESENTATIVE, 6TH DISTRICT, KAUAI. r l" ]
Born: May 26, 1916, Kona, Hawaii; education: ?University of Hawaii; married, four children; Sales Representative, Hawaiian Airlines; member. Board of Supervisors, two terms; Delegate, Hawaii State Con- istitutional Convention of 1950; elected. House, 1952.
CLARENCE Y. SHIMAMURA, Republican
f .. REPRESENTATIVE, 5TH DISTRICT, OAHU..1
Born: February 19, 1907, Honolulu; education:Honolulu public schools. Universities: Hawaii, Ober- lin College, Harvard Law School; married, two children; attorney; Delegate, Hawaii State Constitutional Convention of 1950; member. House, since 1951.
Born: March 18, 1911,Waimea, Hawaii; education: Maui High School; University of Hawaii; Pacific University, Oregon; married, four children; Assistant Accountant, Hawaiian Commercial and Sugar Co.; Delegate, Hawaii State Constitutional Convention of 1950; member. House, since 1951.
HOUSE OF REPRESENTATIVES
W . RUSSELL STARR, Republican
REPRESENTATIVE, 4TH DISTRICT, OAHU.
Born: November 7, 1911, Ryan, Oklahoma; education; Central Grammar, McKinley High, Punahou; married, three children; Freight Traffic Manager, Castle & Cooke, Ltd.; member. House, since 1951.
THOMAS T. TOGUCHI, Republican
REPRESENTATIVE, 2ND DISTRICT, WEST HAWAII.
Born: April 3, 1921, Hakalau, Hawaii; education:Hilo High School; married; Assistant Bookkeeper, Hutchinson Sugar Co.; elected. House, 1952.
Born: September 27, 1911, Wailuku, Maui; education: St. Anthony School; married, four children; Assistant Cashier, Bishop National Bank; elected. House, 1952.
TOSHIHARU YAMA, Democrat
REPRESENTATIVE, 6TH DISTRICT, KAUAI.
Born: February 15, 1908; education: HanamauluSchool, Kauai High, Southern Methodist, Dallas, Military Intelligence Language School, Ft. Snelling, M inn.; married, two children; District Manager, General Insurance; elected. House, 1952.
JOE T. YAMAUCHI, Republican
REPRESENTATIVE, 1ST DISTRICT, EAST HAWAII.
Born: May 24, 1919, Waiakeauka, Hilo; education: Waiakeauka School, Hilo High, University of California; married; Business & Tax Consultant, Public Accountant; Delegate, Hawaii State Constitutional Convention of 1950; member. House, since 1949.
COUNTY OFFICIALSCITY AND COUNTY OF HONOLULU COUNTY OF MAUI
JOHN H. W ILSO N (D), M ayor
SU PERV ISO RSDr. Sam K. A po liona , Jr. (R)
John M . Asing (R)
M ilton D. Beamer (R)
Nob le K. Kauhane (D)
M itsuyuki K ido (D)
Matsuo Takabuk i (D)
Nicholas T. Teves (R)
SHERIFF Duke P. Kahanamoku (R)
AUD ITOR Leonard K. Fong (R)
CLERK Leon K. Sterling, Sr. (D)
TREASURER Lawrence S. Goto (R)
COUNTY OF HAWAII
‘i f :
JAMES KEALOHA (R), Chairman
SU PERV ISO RSEdwin A . DeSilva (D)
Richard Lyman, Jr. (R)
Dr. Charles Ota (R)
Robson K. H ind (R)
Sakuichi Sakai (D)
Dr. Bud Yoshida (R)
COUNTY ATTORNEY Albert M . Felix (R)
AUD ITOR Harry K. Brown (R)
CLERK Edwin M . Desha (R)
TREASURER Dick Tanabe (R)
EDDIE TAM (D), Chairman
SU PERV ISO RSJohn Bulgo (D)
Francis S. Kage (R)
Foster Robinson {R }
M anue l Rodrigues (D)
Robert Y. Shimada (D)
Tom Tagawa (D)
COUNTY ATTORNEYHaro ld L. Duponte (D)
AUD ITORSam A lo , Sr. (R)
CLERKG . N . Toshi Enomoto (R)
TREASURERK. K. Kam (D)
COUNTY OF KAUAI
ANTHONY C. BAPTISTE, JR. (D), Chairman
SU PERV ISO RSMatsuki Arashiro (D)
Francis M . F. Ching (R)
M atao Morita (D)
Tom O kura (D)
Raymond D. Souza (D)
George K. W atase (D)
CO UNTY ATTORNEY Toshio Kabutan (D)
AUD ITO R K. M . A hana (R)
CLERK James K. Burgess (R)
TREASURER K. C. Ahana (R)
[13 ]
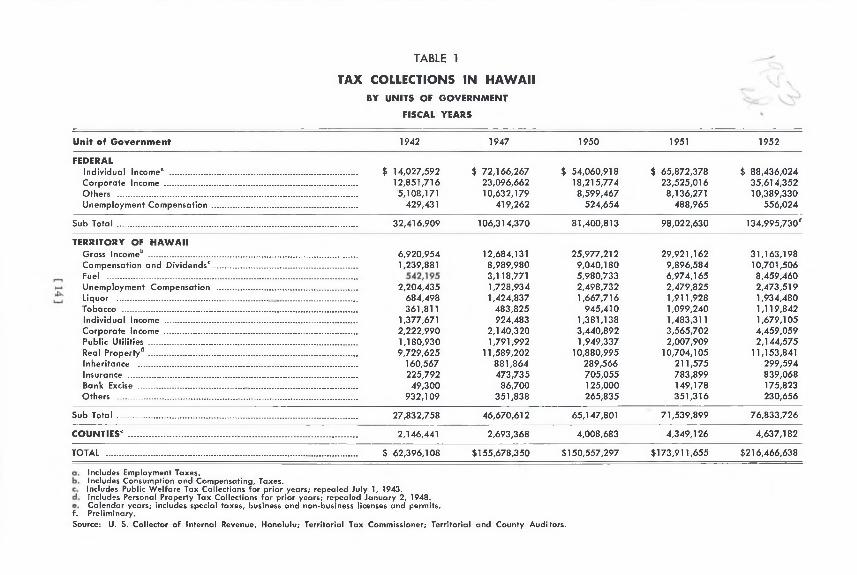
TABLE 1
TAX COLLECTIONS IN H A W A II
BY UNITS OF G O VER N M EN T
FISCAL YEARS
Unit o f Governm ent 1942 1947 1950 1951 1952
FEDERALIn d iv idua l Income* ........................................... ........................... $ 14 ,027,592 $ 72 ,166 ,267 $ 54 ,060 ,918 $ 65 ,872 ,378 $ 88 ,436 ,024
Sub Total .......................................................................... ........................... 32 ,416 ,909 106 ,314 ,370 81 ,400 ,813 98 ,022 ,630 134 ,995 ,730 '
TERRITORY OF H A W A IIGross Income^ ....................................................... .......................... 6 ,920 ,954 12,684,131 25 ,977 ,212 29 ,921 ,162 31 ,163 ,198
Includes Employment Taxes.Includes Consumption and Compensating, Taxes.Includes Public Welfare Tax Collections for prior years; repealed July 1, 1943.Includes Personal Property Tax Collections for prior years; repealed January 2, 1948. Calendar years; includes special taxes, business and non-business licenses and permits. Preliminary.
Source: U. S. Collector of Internal Revenue, Honolulu; Territorial Tax Commissioner; Territorial and County Auditors.
CHART 1
TAX COLLECTIONS IN H A W A II
By Units o f Governm ent
FISCAL YEARS
COUNTIES
TERRITORIAL
FEDERAL
$216,466,638 or $2,000 per family
$28,634,019 $265 family
90
$62,396,108 or $611 per family
60
30
$10,582,435 family
2 1 0
180
150
12 0
90
.6 0
30
1942 1950 1952
Source: See Table 1
[15]
TAXES COLLECTED BY THE TERRITORIAL GOVERNMENTFISCAL 1950 A N D 1952
TABLE 2
1950 1952Per Cent
Change
Gross Income ....................................Compensation and Dividends^.Real Property ....................................Personal Property^ .........................Fuel ..........................................................Corporate Net Income.................Individual Net Income.................Public Utilities ....................................Bank Excise..........................................Liquor .....................................................Tobacco ...............................................Inheritance and Estate..................Insurance .................. .........................All Others® .........................................
Sub Total ...........................................Unemployment Compensation
Total
1. Includes Public Welfare Tax repealed July 1, 1943.2. Repealed January 2, 1948.3. Includes Other Business and Non-Business License Taxes. Source: Territorial Auditor and Tax Commissioner.
TABLE 3
TERRITORIAL GROSS INCOM E, CONSUMPTION AND COMPENSATING TAX COLLECTIONS
Q . Includes Public Welfare Tax collections for prior years; repealed July 1, 1943.b. Includes Personal Property Tax collections for prior years; repealed January 2, 1948.c. Prior Calendar Year Collections.d . Liquor licenses collected by Territorial liquo r Commission. County revenues represent amount collected in each
county.e. Hawaii County Extra Fuel Tax retained by Territory for County h ighways; $504,821 retained during 1949-51,
and $380,892 during fiscal 1952.
Source: Territorial Tax Commissioner; Territorial and County Auditors.
{ 17}
CHART 2
SOURCES OF TERRITORIAL AND COUNTY TAXES
FISCAL 1952
INDIVIDUAL NET INCOME TAXES $ 1,679,105 (2 .1%)
CORPORATE NET INCOME TAXES $4 ,459,059 (5 .6% )
■- LIQUOR TAXES $2 ,377,413 (3 .0%)
■- PUBLIC UTILITIES TAXES $2,541,424 (3.2%)
>— INSURANCE TAXES $839,068 (1.1%)
TOBACCO TAXES $1,119,842 (1.4%)
Source; See Table 4
{ 18}
CHART 3
SOURCES OF TERRITORIAL TAXES
FISCAL 1952
TOBACCO TAXES____$1,119,842 (2 .2 % )
INSURANCE TAXES- $839,068 (1 .7 % )
OTHER TAXES ^ $706,073 (1 .4 % )
INDIVIDUAL NET INCOME TAXES---$1,679,105 (3 .3 % )
Source: See Table 4
CHART 4
SOURCES OF COUNTY TAXES
FISCAL 1952
PUBLIC UTILITIES TAXES $396,849 (1 .4 % )
LIQUOR TAXES--------
$442,933 (1 .5 % )
Source: See Table 4
{ 19}
MillionsDollars
40
30
20
10
CHART 5
TAX COLLECTIONS
Territory of H aw a ii and Counties^
SELECTED YEARS 1942-1952
Gross Income
Compensation & Dividends
I' I Real Property
Personal Property
□ Fuel
Net Income Ind. & Corp.
MillionsDollars
1942 1944 1946 1948 1950 1952
’ Unemployment Compensation collections excluded.
Source: Territoria l Tax Commissioner, Territoria l and County Auditors.
[20 ]
BUDGET ESTIMATES AND REVENUE RECEIPTSTERRITORIAL GENERAL FUND
Net Income .............................................
Compensation and D ividends..
G enera l Excise ...................................
Other Taxes .........................................
Other Revenue ...................................
Total ............................................................
1951-53 $ 9 ,000 ,000
19 ,000,000
34 ,428 ,000
11 ,770,962
4 ,271 ,628
Net Income .........................................
Compensotion and D ividends..
Genera l Excise ................................
Other Taxes .........................................
Other Revenue ................................
Total .........................................................
Net Income .............................................
Compensation and D ividends..
G enera l Excise ...................................
Other Taxes .............................................
Other Revenues ...................................
Total ............................................................
$78 ,470 ,590
1949-51 $ 9 ,670 ,000
14 ,848,500
32 ,107 ,500
9 ,754 ,560 2 ,962 ,044
$69 ,342 ,604
1947-49 $ 5 ,500 ,000
9 ,450 ,000
20 ,075 ,000
9 ,533 ,495
2 ,923 ,422
Net Income .............................................
Compensation and D ividends..
Genera l Excise ....................................
Other Taxes .............................................
O ther Revenue .......................................
Total ............................................................
$47 ,481 ,917
1945-47 $ 5 ,900 ,000
8 ,625 ,000
15 ,060,000
7 ,781 ,175
5 ,145 ,667
Net Income .......................................
Compensation and Dividends"
Genera l Excise ....................................
Other Taxes ..........................................
Other Revenue .................................
Total .........................................................
$42 ,511 ,842
1943-45 $ 5 ,400 ,000
14 ,455 ,000
9 ,159 ,0005,776,761
$34,790,761
a . Estimated on basis of revenues collected for 15 months.b . Enacted July 1, 1943 to replace Public Welfare Tax (previously a Special Fund revenue). 1943-45 collection
of $10,892,589 excluded from comparison.Source: Bureau of the Budget.
TABLE 6
TRENDS IN TERRITORIAL AND COUNTY RECEIPTS: ALL FUNDS
over 1943 .. .. 41 .0 59 .0 127.4 168.9 153.1a . Includes administrative costs of County Employees' Retirement System. Source: Territorial and County Auditors; City and County Controller.
[21 ]
TERRITORIAL REVENUE RECEIPTS
ALL FUNDS
B IEN N IU M 1949-1951; FISCAL 1952
TABLE 7
General Special Revolving
S inking
& Loan Total
B ienn ium 1949-51Comp, and D ividends Tax* $ 18,936,763
Net Income Taxes.................................... 9 ,871 ,044
Gen. Excise Tax ond Lie................... 37 ,337 ,147
Motor Fuel Taxes....................................
Ohio $10.99Conn. 10.84III. 10.61N. Y. 10.53Po. 10.17Ind. 9.82Vo. 9.54Md. 8.60N. J. 7.06D. C. 6.93
Average 19.58Median 16.39
Note: Includes only direct grants to states and Territories under cooperative arrangement. Only $8.9 m illion grants snown for H aw aii, total of our Federal grants exceeds $12 m illion . (See Table 9.)
Total ........................................................................ ... $13,733,281 $12,280,243 $12,250,539
1. Exclusive of grants direct to counties, other non-territorial government agencies, and to individuals In theTerritory. May not Include a ll grants as some do not pass through the Treasurer's office.
2. Includes salaries of governor, secretary, judges, and members of the legislature In regulgr sessions; oppren-ticeshlp tra in ing ; rehabilitation of b lind ; services to veterans; Public Works plann ing , and Employees' Retirement System Administration.
Source: Territorial Auditor, Board of Health, University of H aw aii, Departments of Public W elfare , Public Instruction, Aeronautics and Highways.
[23 ]
TABLE 10
TRENDS IN SELECTED ACTIVITIESTERRITORY OF H A W A II: 1950-1952
1950 1952Per Cent
of 1950 Legend
Population^ ...................................Federal Employment in T. H.Total Employment in T. H____Tourists ...........................................Cost of Living................................Salaries and Wages
Retailing and Services. Total Tax Collections
Bank Clearances ...........Raw Sugar Tonnage......Pineapple Pack (cases).
*75% of dividends received from local corporations.Source: Territorial Tax Commissioner—Net Income Tax Division.
[26 ]
TAX RATES: STATES AND H A W A II
DECEMBER 1, 1952
TABLE 15
Ind iv idualIncome®
CorporateIncome®
RetailSales Gas
Cigarettes c per pkg.
Liquor $ per ga l.
H A W A II..............................3 -6% ^ IQo/o* 2.4 ' 1.81-2.83'
A labam a ...
A rizona .......
A rkansas...
C a lifo rn ia ..
C o lo rado ..................
Connecticut.............
D e law are .................
F lo rida .......................
G eo rg ia .................... .
Id aho ..........................
Illino is .........................
In d ia na ......................
Iow a .............................
Kansas........................
Kentucky...................
Louisiana..................
M a ine ..........................
M a ry land .................
Massachusetts .M ich igan ...................
M innesota................
M 'ssissippi................
M issouri.....................
M ontana ...................
N ebraska .................
N evada .....................
New Hampshire..
New Jersey.............
New Mexico...........New York.................
North C a ro lin a ...
North Dakota .......
O h io .............................
O k lahom a ................
O regon ......................
Pennsylvania.........
Rhode Is land .........
South C a ro lin a ...
South Dakota ........
Tennessee................
Texas..........................
U tah.............................
Vermont....................
V irg in ia ....................
W ash ington ...........
West V irg in ia .......
W isconsin.................
W yom in g .................
1.5-5*
1-4.5*
1-5.0
1-6
1- 10 *
1-3
1-7*
1.5-8*
1-5*
1-4*
2-6 *
2-6 *
2-5
1.845-7.38*
M O *
1-61-4*
1-4*
1-4*
2-7
3-7
1-15*
1-6 *
2 -8 *
2-5
4-6
1-5*
1.5-5.5"
2-5
1-7
3*
1-5*
1-5*
4
5*
3
5.5*
1.5-8*
2 *
2 *
4.5*
4*
4
6.765-8
5-8*
1-6
2-7*
3*
2 *
4.5-5.5
63-6*
4*
85
4-5
4 .5
3
3.75
3*
4*
5
2-6
2 ”
H22
72
VA
2V7
65
6.5
4 .5
64
5
7
6 6 5
4
4
5
7
7
6 5 5
4 .5
5
7
26 5
5 .5
5
3
64
7
5
4
6 .5
65
4
7
5 7
4
5
5
66.5
5
4
5
1.202 .50
.80
1.60
1.001.00
2.17-4.34
1.00
1.00
2.08
1.001.28
1.58
1.25
2.25
2 .75
.80
1.20.80
1.50
1.30
1.50
2.50
1.50
2.72
.75
2.001.41
2.00
a . Deductions and exemptions vary among states.b . Plus 1 5 % surtax.c. Counties also impose extra fuel taxes.d . Food exempt.e. 2 % of 9 8 % .f . Territorial rotes ore Tobacco 1 5 % and Liquor 1 2 % of wholesale prices.* Federal tax deductible.Source: Sfofe and Local Tax Service, Prentice Hall, Inc., New York City.
[27 ]
STATE AND LOCAL RETAIL SALES TAX RATESDECEMBER 1, 1952
CHART 8
State Tax Only
Note: Hawaii imposes a gross income tax with a retail rate of 2V 2% ; Indiana at State Business and Occupation taxes are also imposed in Washington at retailrate of West V irg in ia at V 2% . Local units levying Retail Sales Tax, w ith top rates presently imposed are: A labam a, Colorado and Louisiana 1 % ; CaliforniaV/2% : Mississippi V2 of 1 % ; District of Columbia 2 % . Local units levying gross income type sales tax, with present top rates, are: Arizona 1 % ; Florida $10 on first $3M, $1 each $1M thereafter; Pennsylvania 3/20 of 1 % ; Washington 1/10 of 1 % ; West V irg in ia V2 of 1 % . For states exemption of food, see Table 15.
SOURCE: State and Local Tax Service, Prentice H a ll, Inc., New York.
PER CAPITA GOVERNMENT COST PAYMENTSSTATES A N D H A W A II
Details may not add to totals because of rounding.1. Includes the executive, legislative, lega l, financial and public works departments, and expenditures for constitutional convention.2. Includes Public Lands Department and Hawaiian Homes Commission.3. Includes Hawaiian Homes Commission, Hawaii Housing Authority, Hawaii Visitors Bureau, Statehood Commission and others. Special fund expenditure includes $8,249 for
Unemployment Compensation and Employment Security.Source: Territorial Auditor.
COMPARISON OF GENERAL FUND APPROPRIATIONS
TERRITORY OF H A W A II - BY DEPARTMENTS*
B IEN N IU M S 1941-1943 — 1951-1953
TABLE 18
1941-43 1943-45 1945-47 1947-49 1949-51 1951-53
Agriculture and Forestry............................. $ 719,504 $ 678,752Employees' Retirement System 1,309,362 1,772,063General Government'* ................................ 783,022 1,061,078Health, Board of................................................. 2,227,226* 2,883,335Institutions, Dept, of.......................................... 2,477,290 3,352,040Institutions, Quasi-Public............................. ................ ...............Judicial Department ................................... 116,206Labor and Ind. Rel., Dept, of.................. 182,557Libraries .............................................................. 500,145Military Department ................................... 88,074Public Instruction, Dept, of........................ 13,277,774Public Lands and Survey............................. 380,632Public Welfare, Dept, of............................. ................ ................Public Works, Dept, of................................ 431,651 398,795Tax Commissioner ........................................ 1,012,062 1,244,441Treasury Department ...................... 5,283,115 5,264,905University of Hawaii ..................... 1,093,600 1,336,432Miscellaneous ............................ 2,130,157 2,387,760
Total .................................................................... $32,012,377 $35,412,024 $46,593,333 $61,913,564 $71,102,234 $80,334,651
a . Genera l Appropria tion Act on ly ; does not include special appropriations .
b . Includes Attorney G enera l; A ud it in g ; Bureau o f Budget; C ivil Service Commission; Executive Department; H igh Sheriff; Public Archives; Radio Commission, Secretary of H aw aii.
c. Includes Department of Hospitals and Settlement.
Source: Session Laws of H aw aii.
TERRITORIAL GENERAL FUND EXPENDITURES
BY DEPARTMENTS
B IE N N IU M S 1 9 4 1 -1 9 4 3 - 1951-1953
TABLE 19
1941-43
Agriculture and Forestry............................. $ 696,052Employees' Retirement System 1,369,413General Government" ................................ 781,887Health, Board of........................................... 2,371,515"Institutions, Dept, of ......................... 2,570,413Institutions, Quosi-Public .......................... 1,125,000Judicial Department ................................... 84,153Labor and Ind. Rel., Dept, of.................. 173,013Libraries .............................................................. 515,902Military Department ................................... 441,339Public Instruction, Dept, of........................ 13,785,327Public Lands and Survey............................. 384,069Public Welfare, Dept, of........................... 1,978,315"Public Works, Dept, of................................ 376,180Tax Commissioner ........ 1,049,356Treasury Department................... 5,229,886University of Hawaii..................................... 1,033,627Miscellaneous................................................... 1,007,316Sight Conservation ...................................... 76,227Bonus ......... ,.............................................. ................
Total .................................................................... $35,048,990
a . Includes Attorney G enera l, Aud itor, Budget Bureau, C ivil Service Commission, Executive Department, Public Archives, Radio Commission, Secretary of H aw a ii.
b . Includes Hospitals and Settlement.
c. Financed from speclol funds prio r to 1949, Included for comparison.
d . Included In departmental expenditures. Breakdown not ava ila b le for 1945-47.
Per Cent Increase over 1943.. 91 .3 119.9 221.5 239.7 235.4
a . Includes Liquor Commission and Motor Vehicle Dealers and Salesmen's Licensing Board Fund expenditui Source; Territorial and County Auditors and City & County Controller.
res. Territory on fiscal year; county on previous calendar year basis.
CHART 11
COUNTY TRENDS
GO VERN M EN TAL EXPENDITURES (ALL FUNDS), COST OF L IV IN G
PO PULAT IO N (1942-1951)
Source: County Auditors' Reports, Territorial Board o f Health , H aw a ii Employers' Council.
Source: H aw a ii Employers' Council. Research Department; Bureau of Employment Security,, Territory of
H aw a ii; University of H aw a ii.
CHART 12
TRENDS IN EMPLOYMENT
GO VERNM ENTAL EM PLOYM ENT A N D TOTAL EMPLOYED
TERRITORY OF H A W A II: 1943-1952
Source; See Table 22.
[ 3 6 ]
LEAVES GRANTED TO PUBUC EMPLOYEESFEDERAL, STATE A N D TERRITORY OF H A W A II
TABLE 23
V A C A T IO N SDAYS
S ICK LEAVEDAYS
HOLIDAYS®DAYS
Hawaii .......................... .... 21 Hawaii ......................... 21 Hawaii ......................... 13State Median ............. . .. . 13 State Median ........... . 14 State Median ........... 10Federal® ....................... ..... 13 Federal ......................... ...... 13 Federal ......................... 8
M a ternal and Child Health.................................. ............................... 236,077 88,154 324,231 81,593 76,815 158,408 70 ,726
C ripp led Children ....................................................................................... 72(124 101,611 173,735 54,417 94,312 148,729 101,967
1. Includes Health Statistics. 2 . Includes Hous ing ; Industria l H yg iene ; M osqu ito , P lague and Typhus Contro l; Pure Food and Drugs, an d Sanitary Eng ineering . 3 . Includes Cancer Control and M o rb id ity Study; Heart Disease, Cerebral Palsy, Rheumatic Fever p rogram s; N utr it io n ; W ate r Pollution Control, and Premature In fan t Nursery. 4 . Includes Ep idem io lo gy ; not otherw ise classified expenditures, and outstanding o b lig a t io n s at June 30 o f each year.Source: Board o f Health.
Adm inistratian ................................................................ ....................... ... $ 73 ,032 $ 72 ,047 $ 145,079 $ 72 ,686 $ 77,471 $ 150,157 $ 74 ,414Territaria l Haspital ....................................................... ............................ 1 ,164,057 1,211,117 2 ,375 ,174 1,400 ,056 1,506,478 2 ,906 ,534 1 ,595,638H aw aii Prisan System'......................................... ....................... 766 ,886 1,342,523 2,109 ,409 1,029,442 843 ,775 1,873,217 923 ,180W a im ana Hame ............................................................. ............... ............ 595,991 664,722 1,260,713 662 ,620 917 ,524 1,580 ,144 742,121K aw a ilaa G irls Schoo l ................................................. ............................ 223,834 222,771 446,605 276,299 239,713 516 ,012
W a ia le e Bays Schoo l........... ........................................ ............................ 245,056 268,320 513 ,376 266,019 23,418 289 ,437Kaalau Bays Ho me.......................................................... 263 ,444 263 ,444 625 ,537M auna loa Forestry C am p........................................
Paro le and Home Placement............................... ............................ 97 ,999 92,191 190,190 94 ,904 86 ,558 181,462 78,702Parole and Pardons............... ........... ........................... ............................ 41,199 43,909 85,108 53,042 54 ,040 107,082 57,611
1. Exclusive o f Loan Funds. 2 . Includes Oahu Prison, K u lan i Prison and O lin d a a n d H a le a ka la Prison Comps. Source: Department o f Institutions.
TABLE 30
BOARD OF HARBOR COMMISSIONERS: REVENUES AND EXPENDITURES
REVENUES
Wharfage ............Dackage ...............Pilat Fees ...............Rentals ....................Sales af Services Miscellaneous ....
1. Current expense (exc lud ing interest) per p up il in Average D a ily Attendance from state and local sources as estimated by N ationa l Education Association based on datafrom State departments o f education . Territorial an d county expenditures e xc lu d in g cap ita l outlay and adu lt education .
2. Calculated on enrollment estimates and teacher data o f N ationa l Education Association . Includes k indergarten through 12th g rad e ; excludes non-teaching princ ipa ls andsupervisors.
3 . Includes Principals and Supervisors. 4 . Legal ratio Is 32 to 1. Exclusive o f k indergarten and off-ratio pos itions, present ra t io is 31 .4 to 1.Source; Book o f the States: 1952-53, The Council o f State Governments, Ch icago , I I I . ; Department o f Public Instruction, Territory o f H a w a ii.
DISTRIBUTION OF TEACHERS' SALARIES^STATES A N D H A W A II
1. Excludes non-teaching princ ipa ls and supervisors.Source: Book o f the States: 1952-53, The Council o f State Governments, C h icago , I I I . ; Department o f Public
1. Includes exemptions on homes, eleemosynary and public properties, and one half of amounts of assessment appeals.
2. Net amounts provided by law to be collected during each year.3. Computed by d iv id ing amount of valuation for tax purposes into amount of property tax to be raised.Source: Territorial Tax Commissioner.
1. Includes fee simple and leasehold properties and improvements.2. Home exemption on ly ; excludes other statutory exemptions.3. Net Assessable values of home properties.Source: Territorial Tax Commissioner.
Total ....... 38,145 $237,808,802 $104,271,866 $133,536,936 $2,331,317
1. 1951 Valuations approximately 3 0 % of market price; 1952 valuations 6 0 % .
2. Basic exemption $1500; add itional exemption, ha lf of assessed valuation in excess of $1500; maximum , $3250. Source: Territorial Tax Commissioner.
/
TABLE 40
GENERAL OBLIGATION BONDS
TERRITORY OF H A W A II A N D COUNTIES
JUNE 30, 1952
Purpose Honolulu Maui Hawaii Kauai Territory Totals
a . Organic Act limits territorial debt to 1 0 % of net assessed property valuations, and county debt to 5 % w ithin each county (See Table 42), but these limits can be superseded by special Congressional authorizations.
b. Interest and principal payments on Territorial bonds issued for County purposes are county obligations.Source: Territorial Treasurer and County Auditors.


![[Scherma] - Ewart Oakeshott - Sword in the Age of Chivalry](https://static.documents.pub/doc/80x56/55cf9bf4550346d033a800d4/scherma-ewart-oakeshott-sword-in-the-age-of-chivalry.jpg)