66
Acknowledgments
������������ ������ �����!��� ������������������ �������������
����������� ������������ ����������� �������������������������������� ��������������� ��� ����������������Andrea Curry , Karen
Mills �� ���Janice Valdisera ������ ��������������������� ���������
���������� ���������� ������ ���� �������������� ������������ ������������ � ������������!�Thomas Moore � ���GenevaBurns ���������� ����� �� ������ ������������������������� �������������� ����� �������� ������������������������ Walter C. Odom �
���������������������� ������� �������������� ������� ���������
������������ �������������� ������ ��������������������� ����������� ����� ����������� ���������������! Penny Heiston �������� ����� ������ ���������������!�Kim Ottenstein �

Economics and Statistics AdministrationRobert J. Shapiro ���$��'����'�)�',�
�%'���%$%#!������!'(
BUREAU OF THE CENSUSJames F. Holmes ����)!$���!'��)%'
Nancy M. Gordon, �((%�!�)���!'��)%'�%'���#%�'�& !���'%�'�#(
John F. Long, C !���%&*"�)!%$��!+!(!%$
Daniel H. Weinberg, Ch!���%*(!$���$���%*(� %"�
��%$%#!���)�)!()!�(��!+!(!%$
Suggested Citation������*'��*�%��) �� �$(*(�� *''�$)��%&*"�)!%$���&%')(�
��'!�(���������������� ������� ���������� ��������������������%+�'$#�$)��'!$)!$�����!������( !$�)%$��� ����
�%'�(�"���,��*&�'!$)�$��$)�%���%�*#�$)(��������%+�'$#�$)�'!$)!$�����!������( !$�)%$��� �������

Contents�+/!.� �+0/��$%.��!,+-/ �����������������������������������������������������������������������������������������������������������������
�%#$(%#$/. �����������������������������������������������������������������������������������������������������������������������������������������
�� ��/%+*�(��+,0(�/%+*��-!* . ���������������������������������������������������������������������������������������������������� �*�#�������&�$&��
�� ��/%+*�(��+,0(�/%+*��-+&!�/%+*. ���������������������������������������������������������������������������������������������&��$&,��%�#��&���&���&�� ����$!!"�##
�� �/�/!��+,0(�/%+*��-!* . ����������������������������������������������������������������������������������������������������������� �$#�!��������"�##����&�������&&,
�� �/�/!��+,0(�/%+*��-+&!�/%+*. ����������������������������������������������������������������������������������������������������)!������"%��!!
��� �!/-+,+(%/�*��* ��+*)!/-+,+(%/�*� -!���+,0(�/%+*��-!* . �������������������������������������������������$���&�����$�#'$#
�� �!+#-�,$%��(��+�%(%/4 �������������������������������������������������������������������������������������������������������������&$!��������&
�� ��$++(��*-+(()!*/ �������������������������������������������������������������������������������������������������������������������$'�!�#������&)#$
��� � 0��/%+*�(� //�%*)!*/ �����������������������������������������������������������������������������������������������������������#�&����)&&,����##���&������,
�� �+./.!�+* �-4���$++(��%*�*�%*# ��������������������������������������������������������������������������������������������##���&������,�� &�'(�#�������( $+' �
���� �+0.!$+( .��* ���)%(%!. �������������������������������������������������������������������������������������������������������&!�#�������!)(�&
���� ��-%/�(��/�/0.��* ��%1%*#� --�*#!)!*/. �������������������������������������������������������������������������������&&,�����)���!�
���� �!-/%(%/4 ���������������������������������������������������������������������������������������������������������������������������������������"�&������)
���� �$%( ���-!� --�*#!)!*/.�+"��-!.�$++(!-. ���������������������������������������������������������������������������,##�������'%�&
���� �%.��%(%/4 �����������������������������������������������������������������������������������������������������������������������������������$�#������!
���� �!�*.��!./! ��-+#-�)���-/%�%,�/%+* ��������������������������������������������������������������������������������������#���#
��� �!�(/$��*.0-�*�! ����������������������������������������������������������������������������������������������������������������������$&�������$*�
��� �+*!4��*�+)! �������������������������������������������������������������������������������������������������������������������������$��&(�����!�*�!�#�
���� �+1!-/4 ��������������������������������������������������������������������������������������������������������������������������������������&#���((������&$�($&
���� �$!��(��'��+,0(�/%+* �������������������������������������������������������������������������������������������������������������!�)��((�������##�((�� ,"��&!,��������&&$'
���� �$!��%.,�*%���+,0(�/%+* ���������������������������������������������������������������������������������������������������������$�#��������
���� �$!� .%�*��* ����%"%���.(�* !-��+,0(�/%+* ��������������������������������������������������������������������������!�)��((�������##�((�� ,"��&!,��������&&$'
��� �$%( -!* ���������������������������������������������������������������������������������������������������������������������������������� �#��&,'$#
���� �$!��( !-(4��+,0(�/%+* ��������������������������������������������������������������������������������������������������������������#�'������"�(�
���� �$!��+-!%#*��+-*��+,0(�/%+* ������������������������������������������������������������������������������������������������ &�'(�#�����#'�#����&$!��������&
���� �+)!+2*!-.$%,� ""+- ��%(%/4 ������������������������������������������������������������������������������������������������$+�&�������*���
��� �+)!+2*!-.$%, ����������������������������������������������������������������������������������������������������������������������$��&(���!!�'
,,!* %3� ���+0-�!��* � ��0-��4�+"���/� ��������������������������������������������������������������������������������
1U.S. Census Bureau, the Official StatisticsTM August 7, 1998
Notes About This Report
Population Profile of the United States: 1997 �#3*/(4�50(&5)&36/%&3�0/&�$07&3�"�8*%&�3"/(&�0'�4".1-&�4637&:�"/%�$&/464�%"5"0/�%&.0(3"1)*$��40$*"-��&$0/0.*$��"/%�)064*/(�53&/%4�'03�5)&
�"5*0/�"4�"�8)0-&���)&�3&1035�*/$-6%&4�%"5"�$0--&$5&%�'30.������50�����"/%�3&'-&$54�5)&�.045�3&$&/5�*/'03."5*0/�"7"*-"#-&�0/�&"$)501*$�"4�0'���� ���/�."/:�$"4&4��5)&�%"5"�"3&�4)08/�#:�3"$&
"/%��*41"/*$�03*(*/��0'�"/:�3"$&��
�)&�4".1-&4�'03�5)&��633&/5��016-"5*0/��637&:�������"/%�5)&�637&:�0'��/$0.&�"/%��30(3".��"35*$*1"5*0/��������"3&�%3"8/
'30.�5)&�/0/*/45*565*0/"-�1016-"5*0/�*/�5)&����45"5&4�"/%�5)&��*453*$50'��0-6.#*"�"/%�%0�/05�*/$-6%&�5)&�1016-"5*0/�0'��6&350��*$0�03
5)&�065-:*/(�"3&"4�
�6.#&34�*/�5)&�5&95�"/%�5"#-&4�.":�/05�"%%�50�505"-4�%6&�50�306/%*/(�
�5�5)&�&/%�0'�&"$)�4&$5*0/��"�;�03��635)&3��/'03."5*0/��#09�-*4544063$&4�0'�%"5"�"/%�"�46#+&$5�41&$*"-*45�8)0�$"/�"/48&3�5&$)/*$"-26&45*0/4���--��633&/5��016-"5*0/��&10354�-*45&%�*/�5)*4�#09�"3&
"7"*-"#-&�'30.�5)&��61&3*/5&/%&/5�0'��0$6.&/54�� �����07&3/.&/5�3*/5*/(��''*$&��!"4)*/(50/����������
�)&�%*''&3&/5�1016-"5*0/�6/*7&34&4�*/$-6%&%�*/�5)*4�3&1035"3&�4)08/�*/��11&/%*9�����5�4)06-%�#&�/05&%�5)"5�5)&�/"5*0/"-"/%�45"5&�1016-"5*0/�&45*."5&4�"3&�130+&$5*0/4�"/%�5)&�����"/%-"5&3�4637&:�%"5"�*/�5)*4�3&1035�"3&�$0/4*45&/5�8*5)�5)&�����
%&$&//*"-�$&/464���637&:�%"5"�13*03�50�����"3&�$0/4*45&/5�8*5)5)&�.045�3&$&/5�%&$&//*"-�$&/464�"5�5)"5�5*.&���&&��11&/%*9��
'03�'635)&3�%*4$644*0/�
�&/&3"-�26&45*0/4�03�$0..&/54�"#065�5)*4�3&1035�.":�#&"%%3&44&%�50��0#&35�����0.*/4,*���016-"5*0/��*7*4*0/�� �����63&"6
0'�5)&��&/464��!"4)*/(50/������������<� <�������03��<."*-��,0.*/4,*�$&/464�(07�

����������
2 U.S. Census Bureau, the Official StatisticsTM August 7, 1998
National Population Trends�3��&39&6=����������8-*6*;*6*� ���������5*451*�.38-*�#3.8*)�!8&8*7��&3�.3(6*&7*4+�������������5*6(*38�4:*6�8-*��&39&6=������� �*78.2&8*��&3)�&�,&.3�4+���������������5*6(*38�7.3(*�8-*������(*3797�
�4591&8.43�,64;8-�;&7�(43@(*386&8*)�&243,�8-*�7(-441@&,*�54591&8.43��8-*�54591&@8.43�.3�8-*.6�8-.68.*7�&3)�+468.*7�&3)�8-*�*1)*61=�
"-*�(-&3,.3,�&,*�7869(896*�4+8-*�54591&8.43�;&7�8-*�56.3(.@5&1�6*&743�+46�+*;*6�'.68-7&3)�246*�)*&8-7�)96.3,���� �
�96.3,���� ��,64;8-�6&8*7;*6*�-.,-*78�+46�8-*��.75&3.(�4+�&3=�6&(*��&3)�+46�8-*�7.&3�&3)��&(.+.(��71&3)*654591&8.437�
National PopulationProjections"-*�#3.8*)�!8&8*7�54591&8.43.7�564/*(8*)�84�.3(6*&7*�84���2.11.43�'=����A8-.7�.7&'498����5*6(*38�1&6,*6�8-&384)&=�7�54591&8.43�
"-*�&:*6&,*�&,*�4+�8-*54591&8.43�;.11�'*�41)*6�8-&3�.8.7�34;�
"-*��1&(0���7.&3�&3)��&(.+.(�71&3)*6���2*6.(&3��3).&3��70.24��&3)��1*98��&3)�.75&3.(��4+�&3=�6&(*��5459@1&8.437�&6*�564/*(8*)�84�2&0*95�&3�.3(6*&7.3,�7-&6*�4+�8-*#�!��54591&8.43�
State Population Trends�478�4+�8-*�6&5.)�54591&@8.43�,64;8-�78&8*7�;*6*�14@(&8*)�.3�8-*�$*78�46�!498-��.);*78*63�78&8*7�;*6*,64;.3,�24)*6&8*1=��714;,64;8-�56*)42.3&8*)�.38-*��468-*&78�
�*:&)&�;&7�8-*�24786&5.)1=�,64;.3,�78&8*�.3�8-*(49386=�)96.3,�8-*�����@� 5*6.4)��.3(6*&7.3,�'=����5*6(*38��.8�;&7�+4114;*)�'=�6.>43&�����5*6(*38��&3)#8&-����5*6(*38��
!42*�78&8*7��79(-�&7��&1.+46@3.&�&3)��*;�%460��;*6*�,&[email protected],�2&3=�3*;�6*7.)*387�+642.38*63&8.43&1�2.,6&8.43�;-.1*147.3,�*:*3�1&6,*6�392'*678-649,-�3*8�498@2.,6&8.43�8448-*6�78&8*7�
!*:*6&1�78&8*7�-&:*�*<5*6.@*3(*)�7.,3.+.(&38�7-.+87�.38-*.6�54591&8.43�,64;8-�6&8*77.3(*�8-*�'*,.33.3,�4+�8-*)*(&)*����*;��&257-.6*�;-.(-�7-.+8*)�+642�714;�846&5.)�,64;8-��&3)��1&70&�;-.(-�7-.+8*)�+642�6&5.)�84714;*6�,64;8-��564:.)*)�8;4*<&251*7�4+�79(-�7-.+87�
�38*678&8*�2.,6&8.43�+14;7)96.3,�8-*�����7�6*7918*).3�6&5.)�54591&8.43�,&.37+46�742*�78&8*7�&3)�6&5.)1477*7�+46�48-*67���!8&8*7�;.8-(437.78*381=�-.,-�6&8*7�4+�3*8.3@2.,6&8.43�+642�48-*6�78&8*7;*6*��*:&)&���)&-4���6.>43&��4146&)4��&3)��*46,.&�!8&8*7�;.8-�5*67.78*381=�-.,-6&8*7�4+�3*8�498@2.,6&8.43�8448-*6�78&8*7�;*6*��&1.+463.&��*;�%460���*;��*67*=��433*(8.(98��&3)� -4)*�71&3)��"-*��.786.(8�4+��4192@'.&�&174�*<5*6.*3(*)�&�-.,-6&8*�4+�3*8�498@2.,6&8.43)96.3,�8-*�����7�
State Population Projections�*8;**3������&3)�����&1.+463.&��"*<&7��&3)��146.)&*<5*(8�8-*�,6*&8*78�78&8*54591&8.43�,&.37A246*�8-&3 �2.11.43�5*451*�84�*&(-�78&8*�
�3�8-.7�7&2*�5*6.4)��8-*���+&78*78@,64;.3,�78&8*7��.36&30�46)*6��&6*�564/*(8*)�84'*��&1.+463.&���*;��*<.(4��&;&..���6.>43&���*:&)&��)&-4��#8&-���1&70&���146.)&�&3)�"*<&7�
�7.&37�&3)��&(.+.(��71&3)*67&3)��.75&3.(7��4+�&3=�6&(*�&6*�*<5*(8*)�84�-&:*�8-*+&78*78�6&8*7�4+�,64;8-�
�3�������=493,�5*451*��8-47*93)*6���=*&67�41)��([email protected]*)���5*6(*38�46�246*�4+8-*�848&1�54591&8.43�.3�&11�&6*&7*<(*58�8-*��.786.(8�4+��4192@'.&����=�����=493,�5*451*&6*�*<5*(8*)�84�2&0*�95�1*778-&3���5*6(*38�4+�8-*�54591&@8.43�.3����78&8*7�
�3�246*�8-&3�43*@8-.6)�4+�8-*78&8*7��8-*�*1)*61=�&6*�564/*(8@*)�84�)49'1*�8-*.6�7-&6*�4+�8-*78&8*7��848&1�54591&8.43�
Metropolitan and Non-metropolitan AreaPopulation Trends�*864541.8&3�&6*&7�;*6*�-42*84�3*&61=�+496@+.+8-7�4+�8-*
(49386=�7�6*7.)*387�.3���� '98�(4:*6*)�1*77�8-&3�43*@+.+8-4+�8-*�(49386=�7�1&3)�&6*&�
�*864541.8&3�&6*&7�,6*;�+&78*68-&3�3432*864541.8&3�&6*&7�.38-*�����7���"-*�&:*6&,*&339&1�5*6(*38&,*�,64;8-;&7�����5*6(*38�+46�2*864541.@8&3�&6*&7�&3)����5*6(*38�+463432*864541.8&3�&6*&7�
�432*864541.8&3�&6*&�,64;8-6&8*7�796,*)�84�����5*6(*38&339&11=�+642������84���� �;-.1*�2*864541.8&3�&6*&�,64;8-6&8*7�71.,-81=�)*(6*&7*)�84����5*6(*38�
�*864541.8&3�&3)�3432*[email protected]&3�&6*&�,64;8-�+642�����84���� �;&7�-.,-*78�.3�8-*!498-�&3)�$*78����64;8-�;&724)*6&8*�.3�8-*��.);*78�&3)714;�.3�8-*��468-*&78�
Geographical Mobility�*8;**3��&6(-������&3)�&6(-���� ������2.11.43�2*6.(&37�24:*)����47824:*67�78&=*)�.3�8-*�7&2*(4938=����3�+&(8��3*&61=�8;[email protected])7�4+�8-*�24:*67�'*8;**3�&6(-������&3)��&6(-��� �2&)*�8-.7�8=5*�4+?14(&1��24:*�
"-*�-.,-*78�24:.3,�6&8*7;*6*�+46�5*451*�.3�8-*.6�8;*3@8.*7����'498�43*@8-.6)�4+5*451*���84���=*&67�41)24:*)�.3�8-*�56*:.497�=*&6�
�'498���.3�*:*6=��5*451*1.:.3,�.3�6*38*6@4((95.*)-497.3,�93.87�.3��&6(-���� 24:*)�.3�8-*�56*:.497�=*&6����5*6(*38�����3�(4386&78�431=���.3���5*67437�.3�4;3*6@4((95.*)�-497.3,�93.8724:*)�.3�8-*�7&2*�5*6.4)����5*6(*38��
"-*�79'96'7�;*6*�8-*�247854591&6�)*78.3&8.43�&243,24:*67�;.8-.3�&3)�'*8;**32*864541.8&3�&6*&7�
School Enrollment�3��(84'*6������� ���2.11.43�5*451*�;*6*�*36411*).3�7(-441�
�243,�@�&3)��@=*&6@41)7������5*6(*38�;*6*�*36411*)�.33967*6=�7(-441�
"-*�392'*6�4+�*1*2*38&6=&3)�-.,-�7(-441�789)*387�;&714;*6�.3������8-&3�.3�8-*�5*&0
3U.S. Census Bureau, the Official StatisticsTM August 7, 1998
:'#34�1(�5*'�'#3.:����4�$65*+)*'3�5*#0�+0�5*'�/+&=���4�
�5�5*'�%1..')'�.'7'.��5*'3'8'3'�����/+..+10�456&'054�+0�� ����2'3%'05�1(�8*1/8'3'� �:'#34�1.&�#0&�17'3�
�$165�� ���2'3%'05�1(�#..456&'054�+0�5*'��5*��5*�#0&�5*�)3#&'4�&3122'&165�1(�4%*11.�+0�5*'�=:'#32'3+1&�(31/��%51$'3�����51�%51$'3��� �
Educational Attainment�/10)�2'12.'� �:'#34�1.�&�17'3�+0����������2'3=%'05�*#&�%1/2.'5'&�*+)*4%*11.��#0&�����2'3%'05�*#&%1/2.'5'&���13�/13'�:'#341(�%1..')'�
�13�:160)�#&6.54� �51��:'#34�1.&�������2'3%'05�*#&%1/2.'5'&�*+)*�4%*11.��#0&���2'3%'05�*#&�%1/2.'5'&��13�/13'�:'#34�1(�%1..')'�
�+)*�4%*11.�%1/2.'5+10�(132'12.'� �:'#34�1.&�#0&�17'34511&�#5�����2'3%'05�(13"*+5'4�������2'3%'05�(13�.#%-4��#0&� ���2'3%'05�(13�+42#0+%4��1(�#0:�3#%'��
�.5*16)*�5*'3'�8#4�01�4+)0+(+=%#05�&+(('3'0%'�$'58''0�/'0#0&�81/'0�+0�5*'+3�*+)*4%*11.�%1/2.'5+10�3#5'4�����2'3%'05�#0&�����2'3%'05���#4+)0+(+%#05.:�*+)*'3�2312135+101(�/'0�5*#0�81/'0�*#&%1/2.'5'&���13�/13'�:'#34�1(%1..')'������2'3%'05%1/2#3'&�8+5*����2'3%'05��
PostsecondarySchool Financing�1454'%10:�4%*11.�456=&'054�2#+&�#$165�����&63+0)�5*'����=���4%*11.:'#3�(13�5*'+3�56+5+10�#0&�(''4�$11-4�#0&�'&6%#5+10#.�462=2.+'4��#0&�311/�#0&�$1#3&�
�56&'054�8*1�#55'0&'&�4%*11.(6..�5+/'�(13�#5�.'#45���/105*41(�5*'�23'7+164�:'#3�*#&*+)*'3�4%*11.�%1454������� �5*#0�5*14'�8*1�8'3'�'031..'&2#35�5+/'�13�(13�2#35�1(�5*':'#3�������
�7'3�*#.(�� �2'3%'05��1(�5*'�/+..+10�21454'%10:4%*11.�456&'054�3'%'+7'&41/'�-+0&�1(�(+0#0%+#.�#+&�#7'3#)+0)����� �
�+)*'3�2312135+104�1((6..=5+/'�456&'054����2'3%'05�
5*#0�1(�2#35=5+/'�456&'054� �2'3%'05��3'%'+7'&41/'�-+0&�1(�(+0#0%+#.�#+&�#7'3#)+0)��������#0&�������3'42'%5+7'.:�
*'�#7'3#)'�#/1605�1(�#+&3'%'+7'&�8#4�.#3)'3�(13�456=&'054�8+5*�#�<.18��#006#.(#/+.:�+0%1/'�5*#0�(13�456=&'054�8+5*�#�<*+)*��#006#.(#/+.:�+0%1/'�
�1#04��'/2.1:'3�#44+45#0%'�#0&��'..��3#054�8'3'�5*'�/145%1//10�4163%'4�1(�(+0#0%+#.#+&��2317+&+0)�#7'3#)'#/16054�1(���������� �#0&��������3'42'%5+7'.:�
�'..��3#054�8'3'�5*'�/145%1//10�4163%'�1(�#+&�(13456&'054�+0�.18=+0%1/'�(#/+=.+'4��8*+.'��'/2.1:'3�#44+4=5#0%'�8#4�5*'�/145�%1//104163%'�1(�#+&�(13�456&'054�+0*+)*=+0%1/'�(#/+.+'4�
Households and Families *'3'�8'3'������/+..+10*164'*1.&4�+0�5*'�!0+5'&�5#5'4�+0������62�(31/�����/+..+10�+0�����
*'�4*#3'�1(�*164'*1.&43'23'4'05'&�$:�(#/+.+'4�('..(31/���2'3%'05�+0�����51��2'3%'05�+0�����#0&�3'/#+0'�5*#5�.'7'.�+0�����
�'58''0�����#0&�����5*'�06/$'3�1(�4+0).'�2#3'054+0%3'#4'&�(31/�����51���/+..+10�
Marital Status andLiving Arrangements *'�'45+/#5'&�/'&+#0�#)'�#5(+345�/#33+#)'�+0�����8#4����:'#34�(13�81/'0�#0&���:'#34�(13�/'0�
�0����������/+..+10�2'12.'�13��2'3%'05�1(�#..�#&6.54�.+7'&�#.10'�
*'3'�8'3'���60/#33+'&%162.'4�(13�'7'3:����/#33+'&%162.'4�+0������62�(31/#$165��(13�'7'3:����+0�����
�/10)�%*+.&3'0�+0�10'=2#3'05�4+56#5+104����2'3%'05.+7'&�8+5*�10.:�5*'+3�(#5*'34�+0�����%1/2#3'&�8+5*���2'3=%'05�+0�����
Fertility�(�5*'�����/+..+10�81/'0� 51����:'#34�1.&�+0��� �� �
2'3%'05�3'2135'&�*#7+0)�)+7'0$+35*�51�#5�.'#45�10'�%*+.&�
*'�#7'3#)'�06/$'3�1(�%*+.=&3'0�$130�51�#..�81/'0�1(�5*+4#)'�8#4���'#%*�
*'3'�8'3'����/+..+10(13'+)0=$130�81/'0��� *'#7'3#)'�06/$'3�1(�%*+.&3'0$130�51�5*'4'�81/'0�8#4���%*+.&3'0�'#%*��%1/2#3'&8+5*���%*+.&3'0�'#%*�510#5+7'=$130�81/'0�
"1/'0�$130�+0��'9+%1�%1/=23+4'&�10'=5*+3&�1(�#..�(13'+)0=$130�81/'0�+0�5*'�%*+.&$'#3=+0)�#)'4��5*':�*#&�$130'���%*+.&3'0�'#%*�
�$165��2'3%'05�1(�0'7'3=/#33+'&�81/'0�*#&�)+7'0$+35*�51�#5�.'#45�10'�%*+.&�
�7'3�10'=*#.(�� �2'3%'05�1(�81/'0�8*1�*#&�#�$+35*�+05*'�.#45�:'#3�8'3'�+0�5*'.#$13�(13%'�
Child Care Arrangementsof Preschoolers�0������/13'�23'4%*11.'34+0�(#/+.+'4�8+5*�'/2.1:'&/15*'34�8'3'�%#3'&�(13�+013)#0+;'&�%*+.&�%#3'�(#%+.+5+'45*#0�+0�#0:�15*'3�4+0).'�#3=3#0)'/'05��#22319+/#5'.:�+0���8'3'�%#3'&�(13�+05*+4�#33#0)'/'05�
�#3'�$:�(#5*'34��8*+.'�45#$.'#5� �2'3%'05�+0�$15*����#0&�������+0%3'#4'&�4*#32.:51���2'3%'05�+0�������18='7'3��5*+4�2'3%'05#)'�*#&&3122'&�$#%-�51���2'3%'05$:�����
�#/+.:�&#:�%#3'�8#4�#.41�#%104+45'05�4163%'�1(�%*+.&%#3'�#33#0)'/'054��2317+&+0)��2'3%'05�1(�#..�#33#0)'=/'054�(13�23'4%*11.'34�+0�$15*����#0&��������18'7'3��5*+42312135+10�('..�51���2'3%'05�+0���#0&�3'/#+0'&�#5�5*+4*+4513+%#..:�.18�.'7'.�+0�����
�0���������2'3%'05�1(�#..%*+.&�%#3'�(13�23'4%*11.'34+0�2113�(#/+.+'4�8#4�2317+&'&$:�3'.#5+7'4��%1/2#3'&8+5*�10.:����2'3%'05�+00102113�(#/+.+'4�
�3'4%*11.'34�+0�2113�(#/+.+'48'3'� ��2'3%'05�/13'�.+-'.:�51$'�%#3'&�(13�$:�5*'+3�)3#0&=2#3'054�#0&�15*'3�3'.#5+7'45*#0�8'3'�5*14'�+0�0102113(#/+.+'4�����2'3%'05�7'3464��2'3%'05��
Disability�0�����#0&��� ��#$165� �/+..+10��/'3+%#04�*#&�#&+4#$+.+5:��1(�8*1/���/+..+10*#&�#�4'7'3'�&+4#$+.+5:�
*'�&+4#$+.+5:�3#5'�3#0)'&(31/�����2'3%'05�(13�2'12.'60&'3��:'#34�1.&�51��� 2'3%'05�(13�2'12.'����:'#341.&�#0&�17'3�
�/10)�2'12.'��51����:'#341.&�8+5*�01�&+4#$+.+5:�����2'3%'05�*#&�#�.18�.'7'.�1(3'.#5+7'�+0%1/'���"+5*+0�5*+4#)'�)3162��5*'�2312135+10�8+5*#�.18�.'7'.�1(�3'.#5+7'�+0%1/'8#4�����2'3%'05�(13�2'12.'8+5*�#�0104'7'3'�&+4#$+.+5:#0&����2'3%'05�(13�5*14'8+5*�#�4'7'3'�&+4#$+.+5:�
*'�'/2.1:/'05�3#5'�#/10)2'12.'��51����:'#34�1.&�8#4���2'3%'05�(13�5*14'�8+5*�01&+4#$+.+5:�������2'3%'05�(135*14'�8+5*�#�0104'7'3'�&+4=#$+.+5:��#0&����2'3%'05�(135*14'�8+5*�#�4'7'3'�&+4#$+.+5:�
�/10)�2'12.'��51���:'#34�1.&�8+5*�#�4'7'3'&+4#$+.+5:��10.:������2'3%'058'3'�%17'3'&�$:�#�23+7#5'*'#.5*�+0463#0%'�2.#0������2'3%'05�*#&�%17'3#)'5*316)*�#�)17'30/'05�2.#0�#0&�����2'3%'05�*#&�01*'#.5*�+0463#0%'�
Means-Tested ProgramParticipation�22319+/#5'.:��+0����/'3+=%#04�2#35+%+2#5'&�+0�/#,1326$.+%�#44+45#0%'�231)3#/4�+0�������0�#7'3#)'������/+..+10�2'12.'��13�����2'3%'051(�5*'�515#.�2126.#5+10��8'3'#44+45'&�5*#5�:'#3��#0�+0%3'#4'1(�����/+..+10�231)3#/�2#35+%+=2#054�(31/�5*'�����.'7'.�1(����/+..+10�
�0������17'3�10'=5*+3&�1(�.#%-4��� � �2'3%'05��2#35+%+=2#5'&�+0�/#,13�26$.+%�#44+4=5#0%'�231)3#/4���%1/2#3'&8+5*�����2'3%'05�1(�"*+5'4� *'�2312135+10�1(��+42#0+%4�1(�#0:�3#%'��3'%'+7+0)�5*+4#44+45#0%'�8#4�����2'3%'05�
�'#3.:�10'=(1635*�1(�5*'�%160=53:�4�%*+.&3'0�2#35+%+2#5'&�+0�#5.'#45�10'�1(�5*'4'�#44+45#0%'231)3#/4�+0��������$165����2'3%'05�1(�%*+.&3'0�60&'3��:'#34�1.&�3'%'+7'&�#44+4=5#0%'��8*+.'�10.:�����2'3%'05

4 U.S. Census Bureau, the Official StatisticsTM August 7, 1998
0'�1&01-&�"(&���50����:&"340-%�"/%����1&3$&/5�0'�5)&&-%&3-:��� �:&"34�0-%�"/%07&3��8&3&�1"35*$*1"/54�
Health Insurance�045�1&01-&�������1&3$&/5�)"%�40.&�5:1&�0'�)&"-5)*/463"/$&�*/��� ��"/%�."/:1&01-&�8&3&�$07&3&%�#:�.03&5)"/�0/&�5:1&�0'�*/463"/$&�
�#065�����1&3$&/5�0'�5)&1003�����.*--*0/��)"%�/0)&"-5)�*/463"/$&�0'�"/:�,*/%*/��� ��"�3"5&�6/$)"/(&%'30.�5)&�13&7*064�:&"3�"/%"#065�%06#-&�5)&�3"5&�'03"--�1&01-&����003�1&01-&."%&�61����1&3$&/5�0'�5)&�6/*/463&%�
�&%*$"*%�8"4�5)&�.045�8*%&=413&"%�5:1&�0'�$07&3"(&".0/(�5)&�1003����#065�����1&3$&/5�0'�"--�1003�1&01-&8&3&�$07&3&%�#:��&%*$"*%�"540.&�5*.&�%63*/(��� �
!06/(�"%6-54���50���:&"340-%�8&3&�.03&�-*,&-:�5)"/�05)&3"(&�(30614�50�-"$,�$07&3"(&����1&3$&/5�)"%�/0�$07&3="(&���8)*-&�5)&�&-%&3-:��"5�5)&05)&3�&/%�0'�5)&�41&$536.�8&3&�5)&�-&"45�-*,&-:�50�-"$,$07&3"(&��0/-:�����1&3$&/5)"%�/0�$07&3"(&��
�"35=5*.&�803,&34��-&44�5)"/� �)0634�1&3�8&&,��8&3&.03&�-*,&-:�5)"/�'6--=5*.&�803,=&34�50�/05�)"7&�)&"-5)�*/463="/$&�����1&3$&/5�7&3464����1&3$&/5��
Money Income�&"-�.&%*"/�)064&)0-%�*/=$0.&�4)08&%�"/�"//6"-*/$3&"4&�'03�5)&�'*345�5*.&�*/��:&"34����&58&&/�����"/%�� ��*5�304&�#:����1&3$&/5�'30.��������50���������
�)&��*%8&45�8"4�5)&�0/-:3&(*0/�50�&91&3*&/$&�"�4*(/*'*=$"/5�$)"/(&�*/�3&"-�.&%*"/)064&)0-%�*/$0.&�#&58&&/����"/%��� ��*/$3&"4*/('30.��������50��� �����
�)&��� �"//6"-�.&%*"/&"3/*/(4�0'�80.&/�803,*/(:&"3�306/%��'6--�5*.&�8&3&�������8)*-&�5)&�.&%*"/&"3/*/(4�'03�$033&410/%*/(.&/�8&3&�����������)&'&."-&=50=."-&�&"3/*/(43"5*0�*/��� �8"4������/0545"5*45*$"--:�%*''&3&/5�'30.�5)&
"--=5*.&�)*()�3"5*0�3&"$)&%*/�����
�)&3&�8"4�/0�$)"/(&�#&=58&&/�����"/%��� �*/�5)&07&3"--�*/&26"-*5:�*/�5)&�%*4=53*#65*0/�0'�)064&)0-%�*/$0.&�
Poverty�/��� �������.*--*0/�1&01-&-*7&%�#&-08�5)&�107&35:�-&7&-�3&13&4&/5*/(�����1&3$&/5�0'5)&�$06/53:�4�1016-"5*0/�
�)&�107&35:�3"5&�'03�$)*-%3&/8"4�����1&3$&/5��)*()&3�5)"/5)"5�'03�05)&3�"(&�(30614�
�.0/(�'".*-*&4�."*/5"*/&%#:�80.&/�8*5)�/0�)64#"/%13&4&/5�������1&3$&/58&3&�1003�
The Black Population�)&��-"$,�1016-"5*0/�*4�130=+&$5&%�50�3&"$)����.*--*0/�#:5)&�:&"3����
�*/(-&=1"3&/5��-"$,�'".*-*&4$0/5*/6&%�50�*/$3&"4&�#65�"5�".03&�.0%&3"5&�3"5&�
�"$*"-�%*''&3&/$&4�*/�&%6$"=5*0/"-�"55"*/.&/5�$0/5*/6&%50�/"3308�
�*.*-"3�1301035*0/4�0'��-"$,."33*&%=$061-&�'".*-*&4�"/%$0.1"3"#-&�/0/=�*41"/*$ )*5&�'".*-*&4�)"%�580�03.03&�&"3/&34�*/��� �
�&%*"/�&"3/*/(4�0'��-"$,:&"3=306/%��'6--=5*.&�803,&34*/$3&"4&%�"4�&%6$"5*0/"-"55"*/.&/5�*/$3&"4&%�
�.0/(�1003�1&01-&� �:&"340-%�"/%�07&3��� �1&3$&/5�0'�-"$,4�803,&%�*/��� �
The Hispanic Population�/������5)&��*41"/*$��0'�"/:3"$&��1016-"5*0/�8"4�<:06/=(&3��5)"/�5)&�/0/=�*41"/*$ )*5&�1016-"5*0/�
�*41"/*$4�8&3&�.03&�-*,&-:5)"/�/0/=�*41"/*$� )*5&4�50-*7&�*/�-"3(&�)064&)0-%4�
�*41"/*$4�8&3&�.03&�-*,&-:�50#&�6/&.1-0:&%�5)"/�/0/=�*41"/*$� )*5&4�
�*41"/*$4�&"3/&%�-&44�5)"//0/=�*41"/*$� )*5&4�
The Asian and PacificIslander Population�)&��4*"/�"/%��"$*'*$��4-"/%=&3�1016-"5*0/�)"4�#&&/�(308=*/(�3"1*%-:�
�)&��4*"/�"/%��"$*'*$��4-"/%=&3�1016-"5*0/�8"4�3&-"5*7&-::06/(�*/�����
�)&��4*"/�"/%��"$*'*$�4-"/%&3�1016-"5*0/�8"4�)*()-:$0/$&/53"5&%�*/�5)&� &453&(*0/��"/%�"�3&-"5*7&-:)*()�1301035*0/�8&3&�$&/53"-$*5:�%8&--&34�
�4*"/4�"/%��"$*'*$��4-"/%&34)"%�-"3(&3�'".*-*&4�5)"/�/0/=�*41"/*$� )*5&4�
�4*"/4�"/%��"$*'*$��4-"/%&34$0/5*/6&%�50�)"7&�)*()�&%6=$"5*0/"-�"55"*/.&/5�
�4*"/�"/%��"$*'*$��4-"/%&3'".*-*&4�"/%�/0/=�*41"/*$ )*5&�'".*-*&4�)"%�$0.1"3"=#-&�.&%*"/�'".*-:�*/$0.&4*/��� �
�4*"/�"/%��"$*'*$��4-"/%&3"/%�/0/=�*41"/*$� )*5&80.&/�$0--&(&�(3"%6"5&48)0�803,&%�:&"3�306/%�'6--�5*.&�*/��� �)"%�4*.*-"3&"3/*/(4�
�)&�107&35:�3"5&�'03��4*"/�"/%�"$*'*$��4-"/%&3�'".*-*&4�7"3*&%#:�'".*-:�5:1&�
Children�)&3&�8&3&����.*--*0/�$)*-=%3&/�:06/(&3�5)"/���:&"340-%�*/������.03&�5)"/�%63*/(5)&��"#:��00.�:&"34��#655)&*3�4)"3&�0'�5)&�505"-�1016-"=5*0/�)"4�'"--&/��'30.����1&3=$&/5�*/�����50���1&3$&/5*/�����
�/��������1&3$&/5�0'�$)*-=%3&/�8&3&�-*7*/(�8*5)�0/-:�0/&1"3&/5��646"--:�5)&*3�.05)&3�$0.1"3&%�8*5)��1&3$&/5*/�����
�)&3&�8&3&�����.*--*0/�$)*-%3&/-*7*/(�8*5)�"�/&7&3=."33*&%.05)&3�*/������"4�01104&%50��� �.*--*0/�*/�����
�#065��1&3$&/5�0'�$)*-%3&/-*7&%�*/�"�1003�'".*-:�*/�����5)*4�1301035*0/�8"4�-08&3�5)"/5)&�-&7&-�*/��������1&3$&/5�#65�)*()&3�5)"/�5)"5�*/����� �1&3$&/5��
The Elderly Population�)&�/6.#&3�0'�&-%&3-:�*/5)&��/*5&%��5"5&4�)"4�(308/%3"."5*$"--:�%63*/(�5)&�5)�$&/563:��&41&$*"--:�5)&0-%&45�0-%��1&01-&�� �:&"34"/%�07&3��
�)&�&-%&3-:�8*--�#&$0.&�*/=$3&"4*/(-:�%*7&34&��3"$*"--:"/%�&5)/*$"--:�
�.0/(�5)&�&-%&3-:��5)&�-&"%=*/(�$"64&�0'�%&"5)�8"4)&"35�%*4&"4&�
�4�5)&:�"(&��5)&�&-%&3-:/&&%�*/$3&"4*/(�)&-1�*/�&7&3:=%":�"$5*7*5*&4�
�)&�&-%&3-:�)"7&�&91&3*&/$&%"�%&$-*/&�*/�5)&*3�1301035*0/�*/107&35:�4*/$&�����
The Foreign-BornPopulation�/������"-.045��0'�&7&3:��3&4*%&/54�*/�5)&�$06/53:�8"4'03&*(/�#03/��505"-*/(����.*--*0/�1&01-&�
�03&�5)"/�0/&='0635)���1&3$&/5��0'�5)&�'03&*(/=#03/1016-"5*0/�8"4�#03/�*/��&9*=$0��"/05)&3���1&3$&/5�8&3/�*/��4*"����1&3$&/5�8&3/�*/��6301&��"/%��1&3=$&/5�8&3&�#03/�*/��&/53"-�03�065)��.&3*$"�
�.0/(�5)&�45"5&4���"-*'03/*")"%�#05)�5)&�-"3(&45�/6.#&3"/%�1&3$&/5�'03&*(/�#03/>�.*--*0/�1&01-&�03�0/&=26"35&30'��"-*'03/*"�4�505"-�1016-"5*0/�
�03&�5)"/�0/&='0635)�����1&3$&/5��0'�5)&�'03&*(/=#03/1016-"5*0/�0'�5)&��/*5&%�5"5&4�)"4�$0.&�*/50�5)*4$06/53:�4*/$&��������/��������1&3$&/5�0'�5)&�'03&*(/=#03/�1016-"5*0/�*/�5)&�����8&3&�/"563"-*;&%�$*5*;&/4�
�'�5)&�$06/53:�4�'03&*(/=#03/1016-"5*0/�����1&3$&/5�8&3& )*5&����1&3$&/5�8&3&��4*"/03��"$*'*$��4-"/%&3��"/%��1&3$&/5�8&3&��-"$,����7&3���1&3$&/5�0'�5)&�$06/53:�4'03&*(/=#03/�8&3&��*41"/*$�0'�"/:�3"$&��
HomeownershipAffordability�#065���1&3$&/5�0'�.&3*$"/�'".*-*&4�$06-%�/05"''03%�"�.0%&45-:�13*$&%)064&�*/�����
�)&�"#*-*5:�50�"''03%�"�.0%&45=-:�13*$&%�)064&�8"4�5)&4".&�*/�����"4�*5�8"4�*/���'03�"--�'".*-*&4�"/%6/3&-"5&%�*/%*7*%6"-4�
�08&7&3��5)&�.&%*"/�'03�"."9*.6.�13*$&�)064&�5)"508/&3�'".*-*&4�$06-%�"''03%

5U.S. Census Bureau, the Official StatisticsTM August 7, 1998
-�)� !� �(�!%��������������* �%�!%�����������������
��&+*����'�(��%*�&��� !*�$�((!��/�&+'#����$!#.(�%*�()��&+#��%&*����&(���$&��)*#.�'(!���� &+)��!%������&$'�(���-!* ���'�(��%*�&���#��"�$�((!��/�&+'#����$!#.�(�%*�()�
Homeownership� �������%�*!&%�#� &$�&-%/�() !'�(�*��-�)�����'�(/��%*0* �� !� �)*�)!%��������
�&$�&-%�() !'�(�*�)�-�(�#&-�)*�!%�* ����)*�������'�(/��%*���%�� !� �)*�!%�* ���!�/-�)*�� ����'�(��%*��
�$&%��* �����#�(��)*�$�*(&/'&#!*�%��(��)����)���* � &$�&-%�() !'�(�*��-�)#&-�)*�!%�* ����-��&("����������*����'�(��%*���%� !� �)*�!%�* ����))�+/�+��&#"����������*�����'�(��%*�
�&$�&-%�() !'�(�*�),�(!����.�(�����%���* %!�!*.�&�* �� &+)� &#��(�
� �� &$�&-%�() !'�(�*���&( &+)� &#��()�+%��(����.��()&#��-�)�&%#.������'�(��%*��&$'�(���-!* �����'�(��%*�&(� &+)� &#��()����*&���.��()�&#��
��((!��/�&+'#����$!#!�)� �,���$+� � !� �(�#!"�#! &&��&� &$�&-%�() !'�������'�(/��%*��* �%�&* �(�*.'�)�&���$!#!�)�����'�(��%*��

1920 1927 1934 1941 1948 1955 1962 1969 1976 1983 19901920 1927 1934 1941 1948 1955 1962 1969 1976 1983 1990
1.�� �������� ��������
Kevin E. Deardorff
Figure 1-1.
Women Age 15 to 44, Live Births, andBirths per 1,000 Women 15 to 44 YearsOld: 1920 to 1996��&3*%&/4�1015-"4*0/����0/3*34&/4�7*4)�4)&�����$&/353��"3�&/5.&2"4&%�
!0.&/�#*24)3��*/�.*--*0/3� �*24)3�1&2������70.&/60/6
50/5
40/4
30/3
20/2
10/1
0
�5.#&2�0'70.&/�-&'4�3$"-&�
�&/&2"-'&24*-*49�2"4&�2*()4�3$"-&�
�5.#&2�0'-*6&�#*24)3�-&'4�3$"-&�
1996
80
60
40
20
0
100
140
120
�052$&��� �����52&"5�0'�4)&��&/353��%&$&//*"-�$&/353�"/%�1015-"4*0/�&34*."4&3�
6 U.S. Census Bureau, the Official StatisticsTM September 21, 1998
The population of theUnited States has grown bynearly 18 million peoplesince the 1990 census.�/��"/5"29��������4)&2&7&2&������������1&01-&�*/4)&� /*4&%��4"4&3����)*3�2&12&<3&/4&%�"/�*/$2&"3&�0'���������02�����1&2$&/4�06&2�4)&��"/5"29�������&34*."4&��"/%�"�("*/�0'����������02����1&2$&/4�3*/$&�4)&�����$&/353�
�)&�$05/429�3�1015-"4*0/(2074)�%52*/(�����7"3.034-9�4)&�2&35-4�0'�;/"452"-*/$2&"3&������ ������#*24)3.*/53����������%&"4)3�����)& /*4&%��4"4&3�"-30�&81&2*<&/$&%�"/�&34*."4&%�/&4�("*/'20.�.*(2"4*0/�0'�������1&01-&���� �����*/4&2/"4*0/"-.*(2"/43�"/%�����2&452/*/(�'&%&2"--9�"''*-*"4&% ����$*4*:&/3���
The population is growingmore slowly now than in theearly 1990s.�&31*4&�4)&�/5.&2*$"-�*/<$2&"3&3�40�4)&�1015-"4*0/��"3.&/4*0/&%�"#06&��4)&�"//5"-2"4&�0'�1015-"4*0/�(2074)�'&--'20.����1&2$&/4�*/�����40-&33�4)"/������1&2$&/4�*/�������52*/(�4)&�3".&�4*.&�4)&�-&6&-�0'�/"452"-�*/$2&"3&
%&$-*/&%�'20.��.*--*0/�40�� .*--*0/��"�%201�0'�����1&2<$&/4�����)*3�%&$-*/*/(�-&6&-�0'/"452"-�*/$2&"3&�7"3�4)&�2&35-40'�'&7&2�#*24)3���� �.*--*0/�*/�������� �.*--*0/�*/�����"/%�(2&"4&2�/5.#&23�0'%&"4)3�����.*--*0/�*/������� �.*--*0/�*/������
�&4�.*(2"4*0/�)"3�2&."*/&%2&-"4*6&-9�$0/34"/4��"6&2"(*/(���������%52*/(�4)&����3�"$$05/4*/(�'02�"11208*."4&-90/&<4)*2%�0'�4)&�404"-�"//5"-*/$2&"3&�40�4)&�1015-"4*0/�
The changing age structureof the population is the prin-cipal reason for fewer birthsand more deaths.�&$&/4�120+&$4*0/3�*/%*$"4&4)"4�4)&�$)"/(*/(�"(&�3425$<452&�7*4)*/�4)&�'&."-&�1015-"<4*0/� �40����9&"23�0-%��"37&--�"3�35#34"/4*"-�%&$-*/&3�*/4)&�"(&<31&$*'*$�'&24*-*49�2"4&30'��-"$,�70.&/��)"3�-&%�40'&7&2�404"-�#*24)3���*(52&�<��
�3�"�2&35-4�0'�4)&�"(*/(�0'�4)&�"#9��00.��.02&�70.&/�"2&&/4&2*/(�4)&�-&33�'&24*-&�$)*-%<#&"2*/(�"(&3����02�&8".1-&�4)&�/5.#&2�0'�70.&/����40���9&"23�0-%�0/��"/5"29�������7"3��� ��������"/*/$2&"3&�0'������������1&2$&/4��'20.�4)&�12&6*053
9&"2��"/%�"/�*/$2&"3&�0'��������������1&2$&/4�'20.�4)&�����$&/353����/4)&�04)&2�)"/%��4)&�/5.#&20'�70.&/� �40���9&"230-%�0/��"/5"29�������7"3������������"/�*/$2&"3&0'�0/-9�����������1&2$&/4�'20.�0/&�9&"2�#&'02&��"/%"�%&$2&"3&�0'����������< ���1&2$&/4��'20.�4)&����$&/353�
�)&�."+02�'"$402�5/%&2-9*/(4)&�*/$2&"3&�*/�%&"4)3�%52*/(4)&����3�)"3�"-30�#&&/�4)&$)"/(*/(�"(&�3425$452&�0'4)&�1015-"4*0/����&-"4*6&-9)*()�(2074)�".0/(�4)&0-%&34�0-%��1&01-&�� �9&"230-%�"/%�06&2��)"3�$2&"4&%�"2&-"4*6&-9�-"2(&2�1015-"4*0/�*/"(&�$"4&(02*&3�7*4)�(2&"4&2353$&14*#*-*49�40�%&"4)���!*4)4)&�0-%&34�0-%�1015-"4*0/(207*/(�2"1*%-9��4)&�/5.#&20'�%&"4)3�7*--�$0/4*/5&�40�2*3&"//5"--9�5/-&33�"�%2"."4*$2&%5$4*0/�*/�"(&<31&$*'*$%&"4)�2"4&3�0$$523�
Population growth isconcentrated among theschool-age population, thepopulation in their thirtiesand forties, and the elderly.�/�*/$2&"3&�*/�4)&�3$)00-<"(&1015-"4*0/��4)03&� �40��9&"23�0-%��7"3�4)&�2&35-4�0'�4)&

Figure 1-2.
Percent of Total Population Growth, by Race andHispanic Origin: 1990 and 1996��(6,'(17�3238/$7,21�&216,67(17�:,7+�7+(������&(1686�$6�(180(5$7('����$&(�'$7$�)25������02',),('�72�$66,*1�$63(&,),('�5$&(�72�($&+�3(5621�
����
#+,7(��127�,63$1,&
�/$&. �6,$1$1'�$&,),&�6/$1'(5
�,63$1,&25,*,1��2)�$1<5$&(�
����
�0(5,&$1�1',$1��6.,02�$1'��/(87
36.9
27.4
17.7 18.3
1.4 1.5
14.7 14.9
32.3
41.6
�27(����(5&(176�$''�72�025(�7+$1�������6,1&(�3(23/(�2)��,63$1,&�25,*,1�0$<�%(�2)�$1<�5$&(�
285&(���"� ���85($8�2)�7+(��(1686��'(&(11,$/�&(1686�$1'�3238/$7,21�(67,0$7(6�
7U.S. Census Bureau, the Official StatisticsTM September 21, 1998
/$5*(5�180%(5�2)�%,57+6�7+$72&&855('�'85,1*�7+(�/$7(�� �6�$1'�($5/<�����6���!+(6&+22/=$*(�3238/$7,21�180=%(5('���0,//,21�21��$18$5<���������$1�,1&5($6(�2)������������3(5&(17��)520�7+(�35(=9,286�<($5�$1'�$1�,1&5($6(�2)���������������3(5&(17��)5207+(������&(1686�
!+(��$%<��220��:+,&+�,1=&/8'(6�3(23/(�%251�)520����72������&217,18('�72�&21&(1=75$7(�3238/$7,21�*52:7+�:,7+,17+(�$*(�*52836�7+(<�5($&+�!+(��$%<��220�&2+257�3(23/(����72���<($56�2/'�21�$18$5<����������$&&2817(')25�� ���������3(23/(��25����3(5&(17�2)�7+(�727$/�3238/$7,21�
!+(�180%(5�2)�3(23/(�,1(/'(5/<�$*(�&$7(*25,(6�$/62&217,18('�72�,1&5($6(���!+(180%(5�2)��0(5,&$16��<($56�2/'�$1'�29(5�21��$18=$5<����������:$6������������$1�,1&5($6(�2)�������������3(5&(17��)520�21(�<($5�%()25($1'�$1�,1&5($6(�2)�������������3(5&(17��)520�7+(�����&(1686�
��025(�3521281&('�3(5&(17=$*(�,1&5($6(�2&&855('�,1�7+(2/'(67�6(*0(17�2)�7+(�(/'(5/<3238/$7,21��25�7+26(� �<($562/'�$1'�29(5���!+(�180%(5�2)3(23/(�,1�7+,6�&$7(*25<�:$6
�� �������21��$18$5<���������$1�,1&5($6(�2)����������� �3(5&(17��)520�7+(�35(=9,286�<($5�$1'�$1�,1&5($6(�2)�������������3(5&(17��)5207+(������&(1686���!+,6�',))(5=(17,$/�,1&5($6(�,1�7+(�3238/$=7,21� �<($56�$1'�29(5�:$67+(�5(68/7�2)�,03529(0(176�,17+(�/,)(�(;3(&7$1&<�$7�$'=9$1&('�$*(6��&217,18('�+,*+/(9(/6�2)�%,57+6�'85,1*�7+(�),567'(&$'(�2)�7+,6�&(1785<��$1'9(5<�+,*+�,00,*5$7,21�)520�8523(�'85,1*�7+(�($5/<�3$572)�7+,6�&(1785<��
Growth rates are highestfor the Asian and PacificIslander and for theHispanic populations. �85,1*�������7+(��6,$1�$1'�$&,),&��6/$1'(5�3238/$7,21*5(:�%<�������������3(5=&(17���7+(��/$&.�3238/$7,21�%<�������������3(5&(17���7+(�0(5,&$1��1',$1���6.,02��$1'�/(87�3238/$7,21��%<����������3(5&(17���$1'�7+(�#+,7(�121=�,63$1,&�3238/$7,21��%<�� ����������3(5&(17��
!+(��6,$1�$1'��$&,),&��6/$1'=(5�3238/$7,21�:$6�7+(�21/<3238/$7,21�6(*0(17�)25�:+,&+1(7�0,*5$7,21�����������$''('025(�3(23/(�7+$1�1$785$/,1&5($6(�������������!+(
�,63$1,&�25,*,1��2)�$1<�5$&(�3238/$7,21�*5(:�%<������������3(5&(17��'85,1*������
!+(��,63$1,&=25,*,1�3238/$=7,21�+$6�%((1�&2175,%87,1*�$1,1&5($6,1*/<�',63523257,21$7(6+$5(�72�7+(�727$/�3238/$7,21*52:7+��:+,/(�7+(�121=�,63$1,&�#+,7(�3238/$7,21+$6�%((1�&2175,%87,1*�$'(&5($6,1*�6+$5(���,*85(��=���
For Further Information ((����85($8�2)�7+(��(1686����=�����������������������������!�������� �� �������������������������������������
�217$&7���$7$�5(48(676�� 7$7,67,&$/��1)250$7,21� 7$))���=�=���323�&(1686�*29
�(7+2'2/2*<��238/$7,21��52-(&7,216��5$1&+���=�=����

2.�� �������� ������� ���
Gregory SpencerFrederick W. Hollmann
8 U.S. Census Bureau, the Official StatisticsTM September 21, 1998
Projections illustratepossible courses of population growth.�)&��&/464��63&"6�4-"5&45�1016-"5*0/�130+&$5*0/41307*%&�10-*$:.",&34�8*5)5)3&&�1044*#-&�4$&/"3*04"#065�5)&�4*;&�"/%�$0.104*<5*0/�0'�5)&� ����1016-"5*0/�*/5)&�'6563&����)&4&�130+&$5*0/4"3&�%&3*7&%�'30.�"446.15*0/4"#065�'&35*-*5:��-*'&�&91&$5"/$:�"/%�/&5�.*(3"5*0/�50�5)& /*5&%��5"5&4�'30.�"#30"%�
�)&�.*%%-&�4&3*&4�130+&$5*0/4"3&�5)&�0/&4�.045�0'5&/�64&%#:�1-"//&34�"/%�'03&$"45&34�"/%�5)&�3&45�0'�5)*4�"35*$-&�8*--3&-:�610/�5)04&�130+&$5*0/46/-&44�41&$*'*$"--:�/05&%�
�&35*-*5:�*/�5)&�.*%%-&�4&3*&4*4�"446.&%�50�*/$3&"4&45&"%*-:��'30.�$-04&�50����-*7&#*35)4�1&3�80."/�*/�����50���#*35)4�*/��������03*/%*7*%6"-�3"$*"-�"/%��*41"/*$<03*(*/��0'�"/:�3"$&��(30614�'&35*-*5:�*4�"446.&%�$0/45"/5�5)&�07&3"--�*/$3&"4&�3&46-54'30.�4)*'54�*/�5)&�$0.104*5*0/0'�5)&�1016-"5*0/�50�"�-"3(&31301035*0/�0'�)*()&3<'&35*-*5:(30614����03�5)&�-08�"/%)*()�'&35*-*5:�"446.15*0/4��5)&/6.#&34�0'�#*35)4�1&3�80."/*/�����"3&�"446.&%�50�#&����#*35)4�"/%�� �#*35)4�1&380."/��3&41&$5*7&-:�
�*'&�&91&$5"/$:�"5�#*35)�'&."-&�."-&��*4�130+&$5&%�50*/$3&"4&�'30.���������:&"34*/������50����������:&"34�*/�������/������-*'&�&91&$5"/<$:�806-%�#&�����������:&"34*/�5)&�-08�"446.15*0/�"/%���� ���:&"34�*/�5)&�)*()"446.15*0/�
�&5�*/5&3/"5*0/"-�.*(3"5*0/�*4"446.&%�50�3&."*/�$0/45"/5"5��������1&01-&�1&3�:&"3����8*%&�3"/(&�#&58&&/�5)&�)*()�����������"/%�-08���������/&5�.*(3"5*0/�'*(63&4�3&'-&$546/$&35"*/5:�$0/$&3/*/(�5)&'6563&�'-08�0'�*/5&3/"5*0/"-.*(3"/54��8)*$)�8*--�#&�%3*7&/�*/�-"3(&�1"35��#:�/"5*0/"-10-*$:�0/�*..*(3"5*0/�"/%3&'6(&&�"%.*44*0/4�
The size of the U.S. popula-tion is increasing.�)&�1016-"5*0/�*4�130+&$5&%�50*/$3&"4&�50����.*--*0/�#:���="���<1&3$&/5�*/$3&"4&
'30.�*54������4*;&�0'���.*--*0/����63*/(�5)&�����4��5)&1016-"5*0/�*4�130+&$5&%�50(308�#:� �.*--*0/��"�����<1&3$&/5�*/$3&"4&����)*4�"4<46.&4�5)"5�'&35*-*5:��.035"-*5:�"/%�/&5�*/5&3/"5*0/"-�.*(3"5*0/8*--�$0/5*/6&�50�3&'-&$5�3&$&/553&/%4����/-:�%63*/(�5)&�����48&3&�.03&�1&01-&�"%%&%�505)&�$06/53:�4�1016-"5*0/�5)"/"3&�130+&$5&%�50�#&�"%%&%%63*/(�5)&�����4�
�0/4*%&3*/(�5)&�-0/(&3�5&3.�5)&�-08&45�(3085)�"446.15*0/#3*/(4�"#065�"�7&3:�(3"%6"-*/$3&"4&�50�"�-&7&-�0'���.*--*0/�#:�����'0--08&%�#:�"(3"%6"-�%&$-*/&����0/7&34&-:�5)&�)*()&45�4&3*&4�130+&$5�5)&1016-"5*0/�50�*/$3&"4&�26*5&45&"%*-:�07&3�5)&�/&95�4&7&3"-%&$"%&4��.03&�5)"/�%06#-*/(*54������4*;&�#:�5)&�.*%%-&�0'5)&�/&95�$&/563:�
The U.S. population growthrate is slowing.�&41*5&�5)&�-"3(&�*/$3&"4&4&91&$5&%�*/�5)&�/6.#&3�0'1&01-&�*/�5)&�1016-"5*0/��5)&3"5&�0'�1016-"5*0/�(3085)�3&'&33&%�50�"4�5)&�"7&3"(&"//6"-�1&3$&/5�$)"/(&���*4130+&$5&%�50�%&$3&"4&�%63*/(5)&�/&95�'&8�%&$"%&4��'30.��� �1&3$&/5�#&58&&/�����"/%�����50��� �1&3$&/5#&58&&/�����"/%��������)&%&$3&"4&�*/�5)&�3"5&�0'�(3085)8*--�#&�%6&�13&%0.*/"/5-:�505)&�"(*/(�0'�5)&�1016-"5*0/"/%�5)&�3&46-5*/(�*/$3&"4&�*/%&"5)4�3&-"5*7&�50�1016-"5*0/��30.����50������5)&� /*5&%�5"5&4�806-%�(308�"5�"�3"5&$0.1"3"#-&�50�5)"5�*/�5)&�&"3-:���4��5)&�1&3*0%�0'�4-08&451016-"5*0/�(3085)�*/�5)& /*5&%��5"5&4��)*4503:�
The U.S. population will beolder than it is now.�/�"--�0'�5)&�130+&$5*0/�4&3*&4�5)&�'6563&�"(&�4536$563&�0'�5)&1016-"5*0/�8*--�#&�0-%&3�5)"/*5�*4�/08����)&�"7&3"(&�"(&�0'
���)&�"7&3"(&�"//6"-�3"5&�0'$)"/(&��03�*/$3&"4&��*4�%&'*/&%"4�5)&�/"563"-�-0("3*5).�0'�5)&3"5*0�0'�5)&�1016-"5*0/�"5�5)&�&/%0'�"�1&3*0%�50�5)&�1016-"5*0/�"55)&�#&(*//*/(�0'�5)&�1&3*0%�%*7*%&%�#:�5)&�%63"5*0/�0'�5)&1&3*0%�*/�:&"34�
5)&�1016-"5*0/�8*--�*/$3&"4&'30.�����:&"34�*/������50����:&"34�*/������"/%�3&<."*/�/&"3-:�-&7&-�6/5*-������)*4�*/$3&"4*/(�"7&3"(&�"(&*4�%3*7&/�#:�5)&�"(*/(�0'�5)&1016-"5*0/�#03/�%63*/(�5)&�"#:��00.����� < ����"4�8&--"4�#:�5)&�"446.&%�*/$3&"4&*/�)6."/�-0/(&7*5:����#065��1&3$&/5�0'�5)&�1016-"5*0/�*/�����8"4�#03/�%63*/(�5)&�"#:��00.�:&"34����4�5)*41016-"5*0/�"(&4��5)&�"7&3"(&"(&�8*--�3*4&����&01-&�#03/%63*/(�5)&��"#:��00.�8*--�#&#&58&&/� �"/%����:&"34�0-%"5�5)&�563/�0'�5)&�$&/563:��8*5)5)&�'*345�.&.#&34�0'�5)&��"#:�00.�3&"$)*/(�"(&� ��*/�������/�5)&�&/46*/(�:&"34�5)&*3�*/$3&"4*/(�"(&�8*--�$0/<5*/6&�50�4611035�5)&�*/$3&"4*/("7&3"(&�"(&�0'�5)&�1016-"<5*0/����:�5)&����4��5)&*3/6.#&34�8*--�)"7&�#&&/�40%&$3&"4&%�#:�5)&�&''&$5�0'.035"-*5:�5)"5�5)&�*.1"$5�0'5)&*3�"(*/(�8*--�/0�-0/(&3130%6$&�"�3*4&�*/�5)&�"7&3"(&"(&����/�5)&�.&"/5*.&��5)&1016-"5*0/�8*--�#&�3&+67&/"5&%5)306()�5)&�$)*-%#&"3*/(�0'5)&*3�(3"/%%"6()5&34�
The race and Hispanic-origin distribution of theU.S. population is projectedto become increasinglymore diverse.�4�5)&��-"$,���4*"/�"/%�"$*'*$��4-"/%&3���.&3*$"/�/%*"/���4,*.0��"/%��-&65�"/%��*41"/*$<03*(*/�1016-"<5*0/4�*/$3&"4&�"4�1301035*0/40'�5)&�505"-�1016-"5*0/��5)&/0/<�*41"/*$�!)*5&�1016-"<5*0/�1301035*0/�8*--�%&$3&"4&��*(63&�<���
�:������5)&�/0/<�*41"/*$!)*5&�1301035*0/�0'�5)&�1016<-"5*0/�*4�130+&$5&%�50�%&$3&"4&50�-&44�5)"/���1&3$&/5�8*5)+645�6/%&3���1&3$&/5��-"$,�07&3����1&3$&/5��*41"/*$03*(*/����1&3$&/5��4*"/�"/%�"$*'*$��4-"/%&3��"/%�-&44�5)"/��1&3$&/5��.&3*$"/��/%*"/��4,*.0��"/%��-&65����:�����5)&4&�1301035*0/"-�4)"3&4�8*--4)*'5�26*5&�%3"."5*$"--:����&445)"/���1&3$&/5�8*--�#&�/0/<�*41"/*$�!)*5&�����1&3$&/5�-"$,��07&3���1&3$&/5��*4<1"/*$�03*(*/��"-.045���1&3$&/5�4*"/�"/%��"$*'*$��4-"/%&3�

Figure 2-1.
Percent of the Population, by Race and HispanicOrigin: 1990, 2000, 2025, and 2050��-((0)?7)6-)7�463.)'8-327�
����
���
��
���
�0%'/ �1)6-'%2��2(-%2��7/-13��%2(��0)98
�7-%2�%2(��%'-*-'�70%2()6
�-74%2-'36-+-2
�3*�%2=�6%')�
$,-8)�238��-74%2-'
�� ������ ����
��� ��� ��� ��� �� ��� � ��� ���
�������
���
��������
��
���
!396')���#�!���96)%9�3*�8,)��)2797��()')22-%0�')2797�%2(�43490%8-32�463.)'8-327�
9U.S. Census Bureau, the Official StatisticsTM September 21, 1998
%2(�.978�3:)6���4)6')28�1)6-'%2��2(-%2���7/-13�%2(��0)98��
�32?�-74%2-'�$,-8)7��8,)703;)78?+63;-2+�+6394��%6)0-/)0=�83�'3286-&98)�0)77�%2(0)77�83�8,)�838%0�43490%8-32+63;8,�-2�8,-7�'39286=���",)-6%229%0�+63;8,�6%8)�*631�����83�����-7�463.)'8)(�83�&)����4)6')28��639+,0=�32)?8,-6(�3*�8,)�43490%8-32�%7�%;,30)����36�8,)�4)6-3(�����83����8,)=�;-00�+63;�%8����4)6')28�%229%00=��%2(�*631���83������8,)=�;-00�()'0-2)&=�����4)6')28��6)%',-2+8,)-6�4)%/�43490%8-32�7->)%6392(����
",)��0%'/�43490%8-32�;-00-2'6)%7)�%8�%2�%229%0�6%8)�3*����4)6')28�*631������83�����;,-0)�8%4)6-2+�83�����4)6')28�&=�8,)�()'%()�*631����83�������",)��0%'/43490%8-32�;-00�2)%60=�(39&0)-87�46)7)28�7->)�83� ��1-00-32&=�����
",)�*%78)78?+63;-2+�6%')+6394�-2�8,)�2)%6�8)61�;-00'328-29)�83�&)�8,)��7-%2�%2(�%'-*-'��70%2()6�43490%8-32�;-8,�%2�%:)6%+)�%229%0+63;8,�6%8)�3*�����4)6')28(96-2+�8,)�����7��8%4)6-2+�83�� ��4)6')28�&=�8,)�()'%()*631�����83�������",)
�7-%2�%2(��%'-*-'��70%2()643490%8-32�;-00�)<4%2(�83�3:)6���1-00-32�&=�8,)�8962�3*�8,)')2896=��(39&0)�-87�'966)287->)�����1-00-32��&=�����%2(86-40)�-8�&=��������=������-8;-00�&)���1-00-32������8-1)7-87������0):)0�
Growth of the Hispanic-origin population will prob-ably be a major element intotal population growth.",)��-74%2-'?36-+-2�43490%?8-32�;-00�7,3;�8,)�0%6+)78291)6-'�-2'6)%7)7�3*�%2=+6394���",)��-74%2-'?36-+-243490%8-32�;-00�-2'6)%7)�83��1-00-32�&=������%2((39&0)�-87������7->)�&=�����=�������-74%2-'7�;-00�-2?'6)%7)�83����1-00-32�����8-1)7�-87������43490%8-32�",)�291)6-'�-2'6)%7)�3*�8,-743490%8-32�*631������83�����%8����1-00-32��;-00�+6)%80=�)<?'))(�8,%8�3*�%2=�38,)6�6%')36�)8,2-'�+6394�
Population change is drivenpositively by births andmigration into the UnitedStates and negatively bydeaths and migration fromthe United States.",)�'966)28�+6%(9%0�()'0-2)-2�8,)�291&)6�3*�&-68,7�-7
463.)'8)(�83�)2(�-2������;,)6)9432�%229%0�&-68,7-2'6)%7)�463+6)77-:)0=8,639+,398�8,)�463.)'8-324)6-3(����)+-22-2+�-2����8,)�291&)6�3*�&-68,7�)%',=)%6�;-00�)<'))(�8,)�,-+,)78%229%0�291&)6�3*�&-68,7�):)6%',-):)(�-2�8,)�#2-8)(�!8%8)7�
�)%8,7�%6)�463.)'8)(�83�-2?'6)%7)��;-8,398�6):)67%0�8,639+,398�8,)�4)6-3(���!9&?86%'8-2+�()%8,7�*631�&-68,7=-)0(7�%�2%896%0�-2'6)%7)�8,%8',%2+)7�:)6=�0-880)��;-8,�&-68,7)<'))(-2+�()%8,7�&=�%7�0-880)%7�%2�%229%0�����1-00-32%6392(�����4)%/-2+�%6392(����1-00-32�%6392(��� �(6344-2+�&)03;�����1-00-32%+%-2�-2�8,)���7��%2(�6)?'3:)6-2+�83�2)%60=�����1-00-32&=������
The full impact of interna-tional migration will be amajor contributor to popula-tion growth.$,)2�:-);)(�730)0=�%7%�'966)28�):)28��2)8�1-+6%?8-32��-2?1-+6%8-32�1-297398?1-+6%8-32��+)2)6%00=�%'?'39287�*36�*%6�0)77�3*�8,)',%2+)�-2�8,)�43490%8-32�8,%22%896%0�-2'6)%7)�*36�%2=�4%68-'?90%6�=)%6��&)'%97)�&38,�-87�-2
%2(�398�'31432)287�%6)291)6-'%00=�71%00)6����2������;)�463.)'8)(�2)8�1-+6%8-32�838,)�#2-8)(�!8%8)7�%8�������%2(�,)0(�8,-7�%229%0�463.)'?8-32�'3278%28�8,639+,�����",639+,398�8,)�4)6-3(��8,)463.)'8)(�)<')77�3*�&-68,73:)6�()%8,7�-7�,-+,)6��%7�-82):)6�(6347�&)03;�����1-00-32�
�3;):)6��8,)�-14%'8�3*�1-+6%?8-32�-7�*%6�+6)%8)6�-*�-8�-7�7))2�83-2'09()�8,)�3**746-2+�3*�-11-?+6%287�3:)6�%2�)<8)2()(4)6-3(�3*�8-1)����631������83�����8,)�'39286=�7�43490%8-32-7�463.)'8)(�83�-2'6)%7)�&=��1-00-32����1-00-32�136)�8,%2�-8;390(�,%:)�-2'6)%7)(�-*�8,)6);)6)�23�2)8�1-+6%8-32�83�8,)#2-8)(�!8%8)7�%*8)6��90=�����������=������8,-7�(-**)6)2');-00�-2'6)%7)�83����1-00-32��;)003:)6�,%0*�8,)�-2'6)%7)�3*���1-00-32�*631������83������378�3*�8,)�-14368%2')�3*�2)81-+6%8-32�-2�92()678%2(-2+43490%8-32�+63;8,�-7�-2�8,)2%896%0�-2'6)%7)�3*�8,)�4349?0%8-32�8,%8�-8�%((7�
For Further Information!))����966)28��3490%8-32 )43687��!)6-)7���?�������!�� ���������� �������� ����� ���� � ����#�������"� ����������������������������� �������
�328%'8��%8%�6)59)787�!8%8-78-'%0��2*361%8-32�!8%**��?���?�434�')2797�+3:
�)8,3(303+=��3490%8-32��63.)'8-327��6%2',��?���?��

Figure 3-1.
Percent Change in Population, by State: 1995 to 1996
3.� � ����� ��������
Donald C. DahmannMarc J. Perry
���51�����2(3&(05����51�����2(3&(05����51�����2(3&(05� ���51�<����2(3&(05
United States0.9 percent
WA
OR
CA
NV
NMAZ
TX
ID
ND
SD
OK
KS
NE
WY
UTCO
WI
IA
INIL
KY
TN
MO
AR
MS AL GA
SC
NC
VAWV
PA
NY
AK
HI
MD
DENJ
CTRI
MA
VT
NH
DC
MT
MI
FL
LA
ME
OH
MN
�163&(���!�����63($6�1)�5+(��(0464��(45,/$5(4�
10 U.S. Census Bureau, the Official StatisticsTM September 21, 1998
Recent population growth is fastest in the West and the South. �..�%65�581�1)�5+(�45$5(4(92(3,(0&,0*�2126.$5,10*3185+�3$5(4�)13�����<� �$5�13$%17(�5+(�0$5,10$.�$7(3$*(�1)����2(3&(05�8(3(�.1&$5('�,05+(�"(45�13��165+���,*63(�<����(7$'$�8$4�5+(�&16053:�4)$45(45<*318,0*�45$5(�%(58((0�6.:������$0'��6.:���� �,0&3($4,0*�%:�����2(3&(0513��������2(12.(����5+(33$2,'.:�*318,0*�45$5(4�8(3(�3,;10$�����2(3&(05���!5$+���2(3&(05���$0'��1.13$'1��'$+1��$0'��(13*,$����2(3&(05�($&+��
+(�45$5(4�(92(3,(0&,0*�5+(4.18(45�2126.$5,10�*3185+��13'(&.,0(��'63,0*�5+(�����<� 2(3,1'�8(3(�.1&$5('�,0�5+(�135+($45��� +(��,453,&5�1)�1.6/%,$�(92(3,(0&('�5+(.$3*(45�3$5(�$0'�$/16051)�2126.$5,10�.144�'63,0*5+,4�2(3,1'�
The South is addingthe largest number ofnew residents."+,.(�5+(�"(45�*3(8�$5�$41/(8+$5�)$45(3�3$5(�5+$0�5+(�165+������2(3&(05�7(3464���
2(3&(05���5+(��165+�$''('/13(�0(8�3(4,'(054�5+$0�$0:15+(3�3(*,10�'63,0*�5+(����<� �2(3,1'����7(3$..��5+(2126.$5,10�1)�4165+(30�45$5(4,0&3($4('�%:����������2(12.(�$0'�5+(�2126.$5,101)�8(45(30�45$5(4�,0&3($4('%:��������
�,9�45$5(4��$..�,0�5+(��165+�13"(45��,0&3($4('�5+(,3�2126.$<5,104�%:�$5�.($45��������2(12.(��� (9$4����������$.,)130,$�����������.13,'$�� ��������(13*,$������������3,;10$����������$0'��135+�$31.,0$����������
The Midwest andNortheast are registeringmodest growth.�126.$5,10�*3185+�,0�5+(�,'8(45�$0'��135+($45�)13�5+(����<� �2(3,1'�8$4�/1'(45$0'�$5�$�4.18(3�3$5(�5+$0�5+(0$5,10$.�$7(3$*(��8,5+�5+((9&(25,104�1)��,00(415$�$0'�(8��$/24+,3(�
+(��,'8(45�$''('�������0(8�3(4,'(054��$�*3185+�3$5(1)��� �2(3&(05���.5+16*+�5+(�,'8(45�.145�������3(4,'(0545+316*+�/,*3$5,10�51�15+(32$354�1)�5+(�&16053:��($&+,0',7,'6$.�45$5(�,0�5+(��,'8(45
/13(�5+$0�/$'(�62�)13�5+,40(5�'1/(45,&�165</,*3$5,108,5+�*$,04�)31/�,05(30$5,10$./,*3$5,10�$0'�0$563$.�,0&3($4(�(9&(44�1)�%,35+4�17(3�'($5+4�51�3(*,45(3�$0�17(3$..2126.$5,10�*$,0�
+(��135+($45�*3(8�%:�10.:�������2(12.(��$�����2(3&(05,0&3($4(����145�45$5(4�,0�5+(�135+($45�.145�3(4,'(054�)31//,*3$5,10�51�15+(3�45$5(4�%653(*,45(3('�17(3$..�2126.$5,10*$,04�'6(�51�,05(30$5,10$./,*3$5,10�$0'�0$563$.�,0<&3($4(����(8��$/24+,3(��5+(�135+($45�4�)$45(45<*318,0*45$5(��8$4�5+(�3(*,10�4�10.:45$5(�8,5+�$�2126.$5,10�*3185+3$5(�����2(3&(05��$%17(�5+(0$5,10$.�$7(3$*(��
Some states are gaining in-ternational migrants whilelosing domestic migrants. +3((�45$5(4���$.,)130,$���(8#13-��$0'��(8��(34(:��$4�8(..$4�5+(��,453,&5�1)��1.6/%,$�+$7(�&104,45(05.:�(92(3,(0&('+,*+�3$5(4�1)�,05(30$5,10$.,0</,*3$5,10�8+,.(�4,/6.5$<0(164.:�(92(3,(0&,0*�+,*+3$5(4�1)�0(5�165</,*3$5,10�5115+(3�45$5(4����63,0*�5+(����<� �2(3,1'���$.,)130,$�$0'

Figure 3-2.
Net Domestic Migration Rate, byState: 1995 to 1996 ��;7�����8-9+-6;
���;7����8-9+-6;
��;7�� �8-9+-6;
C���;7�C��8-9+-6;
WA
OR
CA
NV
NMAZ
TX
ID
ND
SD
OK
KS
NE
WY
UTCO
WI
MN
IA
INIL
KY
TN
MO
AR
MS AL GA
SC
NC
VA
PA
NY
AK
HI
MD
DENJ
CTRI
MA
VT
NH
DC
MT
MI
FL
LA
ME
OH
�7;-���$0-�6-;�,75-:;1+�51/9);176�9);-�1:�+)4+<4);-,�*@�,1=1,16/�;0-�)57<6;�7.�6-;�,75-:;1+�51/9)C;176��16C51/9)6;:�516<:�7<;C51/9)6;:��*@�;0-�����:;);-�878<4);176�)6,�5<4;184@16/�*@��
#7<9+-���%�#���<9-)<�7.�;0-��-6:<:��-:;15);-:�
WV
11U.S. Census Bureau, the Official StatisticsTM September 21, 1998
�->�(793�/)16-,��9-:8-+�;1=-4@��� ���)6,���8-784-�;097</0�6-;�16;-96)C;176)4�51/9);176�>014-�47:16/�����)6,�����8-784-;7�7;0-9�:;);-:��
Alaska and New Hampshireare examples of shiftingtrends during the decade.�91=-6�*@�5)279�+0)6/-:16�;0-�.47>:�7.�16;-9:;);-�51C/9)6;:��:75-�:;);-:�-?8-91C-6+-,�:1/61.1+)6;�+0)6/-:�16;0-19�878<4);176�/97>;0�9);-:,<916/�;0-���C���8-917,��4):3)�:;)9;-,�;0-�,-+),-)576/�;0-�%61;-,�#;);-:�.):;-:;C/97>16/�:;);-:����7>C-=-9��).;-9�-?8-91-6+16/�)9-=-9:)4�.975�6-;�,75-:;1+16C51/9);176�;7�6-;�,75-:;1+7<;C51/9);176��1;�,9788-,�;7)576/�;0-��:47>-:;C/97>16/�:;);-:�;7>)9,�;0-�-6,7.�;0-�8-917,���� C����
�->��)58:019-�0),�;0-7887:1;-�-?8-91-6+-�>1;016;-9:;);-�51/9);176����;�:01.;-,.975�47::-:�;7�/)16:�)6,97:-�.975�)576/�;0-�:47>-:;C/97>16/�:;);-:�;7
*-+75-�;0-� ;0�.):;-:;C/97>16/�:;);-�*@�;0-�-6,�7.;0-�8-917,�
Some trends have persistedduring the 1990 decade.�1=-�:;);-:�16�;0-�'-:;�0)=-*--6�)576/�;0-��.):;-:;C/97>16/�:;);-:�16�;0-�+7<6;9@-=-9@�@-)9�,<916/�;0-���:��-=),)���91A76)��%;)0���747C9),7��)6,��,)07����-=),)�0):*--6�;0-�.):;-:;C/97>16/�:;);--=-9@�@-)9�16�;0-���:�
#7�.)9�,<916/�;01:�,-+),-�;0-�4)9/-:;�.47>:�7.�1551/9)6;:;7�;0-�%61;-,�#;);-:�0)=-:-;;4-,�+76:1:;-6;4@�16�;0-:)5-�:-;�7.�:;);-:����)41.7961)0):�4-,�>1;0�)6�)=-9)/-�6-;/)16�7.�579-�;0)6����8-784-�.975�16;-96);176)451/9);176�8-9�@-)9��.7447>-,*@���->�(793�>1;0�579-�;0)6���8-784-�� ;0-9�:;);-:;0);�>-9-�)576/�;0-�;78�9-+181-6;:�-=-9@�@-)9�>-9-$-?):���4791,)���441671:���->�-9:-@���)::)+0<:-;;:��)6,&19/161)��):�>-44�):�;0-��1:;91+;7.��74<5*1)�
�6;-9:;);-�51/9);176�+76;16<-,;7�9-:<4;�16�878<4);176�/)16:.79�)�6<5*-9�7.�:;);-:�16�;0-#7<;0�)6,�'-:;�,<916/�;0-���C���8-917,���1/<9-��C����<916/�;0-���:��;0-�'-:;,7516);-,�;0-�41:;�7.�:;);-:-?8-91-6+16/�;0-�01/0-:;�9);-:7.�6-;�16;-9:;);-�51/9);176��-=),)�� 9-/76���7479),7�)6,��,)07�>-9-�)576/�;0-;78��:;);-:�16�;-95:�7.�6-;,75-:;1+�51/9);176�/)16:-)+0�@-)9����-79/1)�>):�;0-764@�676>-:;-96�:;);-�;7�*-.7<6,�)576/�;0-�;78�-=-9@�@-)9��
#;);-:�;0);�47:;�9-:1,-6;:;7�7;0-9�)9-):�7.�;0-�+7<6;9@);�+76:1:;-6;4@�01/0�9);-:16+4<,-��)41.7961)�)6,�)�+4<:C;-9�7.��79;0-):;-96�:;);-:D�->�(793���->��-9:-@��766-+;1+<;��)6,�"07,-�:4)6,D):�>-44�):�;0-�1:;91+;�7.��74<5*1)�
For Further Information#--����-8)9;5-6;�7.�755-9+-�!9-::�"-4-):-����C�� ��B!78<4);176��97>;0"-5)16:��):;-:;�16�'-:;-96)6,�#7<;0-96�#;);-:���-6:<:�<9-)<�"-879;:��)6,�;0-�-6:<:��<9-)<�:��6;-96-;�:1;-�0;;8���>>>�+-6:<:�/7=�878<4);176�>>>�-:;15);-:�878-:;�0;54��.79�)66<)4878<4);176�-:;15);-:�)6,,-57/9)801+�+75876-6;:7.�+0)6/-�:;);1:;1+:�.79-)+0�:;);-�
�76;)+;��)9+����!-99@!78<4);176��1:;91*<;176��9)6+0�C ��C� �58-99@�+-6:<:�/7=

4.� � ����� ������� ���
Paul R. Campbell
Figure 4-1.
Net Population Change for States Expected toGain at Least 1 M Illion People: 1995 to 2025
��3�2.11.438�4+�5*451*�
�&1.+473.&
!*=&8
�147.)&
�*47,.&
$&8-.3,943
�7.?43&
�479-��&741.3&
#.7,.3.&
�*<�%470
�*<��*78*>
�11.34.8
�4147&)4
!*33*88**
�&7>1&3)
�7*,43 ���
��
����
����
�� �
�� �
�� �
����
���
��
��
� �
���
���
�����
4:7(*���"� ���:7*&:�4+�9-*��*38:8��545:1&9.43�574/*(9.438�
12 U.S. Census Bureau, the Official StatisticsTM September 21, 1998
California, Texas, andFlorida expect thebiggest gains between1995 and 2025. �:7.3,�9-*�5*7.4)������94����3*9�545:1&9.43�(-&3,*�'.79-8�2.3:8�)*&9-8�51:8�3*92.,7&398��.8�574/*(9*)�94�'*9-*�1&7,*89�.3��&1.+473.&��!*=&8�&3)��147.)&����&(-�4+�9-*8*89&9*8�.8�*=5*(9*)�94�,&.3247*�9-&3� �2.11.43�5*451*�(42'.3*)��9-*.7�,74<9-�.81.0*1>�94�&((4:39�+47����5*7A(*39�4+�9-*�3*9�545:1&9.43(-&3,*�.3�9-*�"3.9*)� 9&9*8���949&1�4+����89&9*8�2&>�,&.3&9�1*&89���2.11.43�5*451*�):7A.3,�9-*��A>*&7�5*7.4)��(42A'.3*)��9-*.7�,74<9-�2&>�&(A(4:39�+47����5*7(*39�4+�9-*3*9�545:1&9.43�(-&3,**=5*(9*)�.3�9-*�"3.9*) 9&9*8���.,:7*��A���
�&1.+473.&��9-*�2489�545:14:889&9*�<.9-��� �2.11.43�5*451*.3�������(439&.3*)���5*7(*394+�9-*�(4:397>�8�545:1&9.43��>�����9-.8�89&9*�.8�*=A5*(9*)�94�-&;*����5*7(*39�4+9-*�"3.9*)� 9&9*8��545:1&9.43��*8.)*8�3&9:7&1�.3(7*&8*��9-*8:751:8�4+�'.79-8�4;*7�)*&9-8��.39*73&9.43&1�2.,7&9.43�.8*=5*(9*)�94�&((4:39�+47�&1&7,*�5479.43�4+��&1.+473.&�87&5.)�,74<9-����;*7�9-*�A>*&7�5*7.4)���&1.+473.&�.8574/*(9*)�94�-&;*�9-*�+&89*897&9*�4+�545:1&9.43�,74<9-�
�� �5*7(*39����.,:7*��A����!-*3*=9�3.3*�+&89*89A,74<.3,89&9*8��.3�7&30�47)*7��&7**=5*(9*)�94�'*��*<��*=.(4��&<&..���7.?43&���*;&)&��)&-4��"9&-���1&80&���147.)&�&3)�!*=&8�
Fertility and migrationtrends are projected to varywidely among the states.!-*�8*5&7&9*�(42543*398�4+545:1&9.43�,74<9-B'.79-8�)*&9-8��.39*73&1�2.,7&9.43�)42*89.(�2.,7&9.43�47�89&9*A94A89&9*�24;*8���&3)�.39*73&A9.43&1�2.,7&9.43B<.11�&++*(9*&(-�89&9*�).++*7*391>�'*9<**3�����&3)�������47�*=&251*��1&80&���&1.+473.&��"9&-��&<&..��&3)�!*=&8��.3�7&3047)*7��&7*�574/*(9*)�94�-&;*9-*�-.,-*89�&;*7&,*�&33:&17&9*�4+�3&9:7&1�.3(7*&8*��<.9-,&.38�7&3,.3,�+742����5*451*5*7�������545:1&9.43�)4<3�94��5*451*�5*7���������$*89#.7,.3.&�.8�9-*�431>�89&9*�1.0*1>94�-&;*�&�3*,&9.;*�����A��&;*7&,*�&33:&1�7&9*�4+3&9:7&1�.3(7*&8*���A�5*451*5*7���������
!-*�����A���&;*7&,*&33:&1�'.79-�7&9*�.8�*=5*(9*)94�7&3,*�+742���'.79-8�5*7������545:1&9.43�.3��*1&<&7*&3)��&1.+473.&�)4<3�94���'.79-8�5*7�������.3�$*89�#.7A,.3.&���!-*�<.)*�7&3,*�4+�'.79-7&9*8�.8�*=5*(9*)�94�7*+1*(9�9-*
).++*7*39.&1�,74<9-�4+�7&(*�&3)*9-3.(�,74:58�<.9-�-.,-�+*79.1.9>&3)�).++*7*39.&1�2.,7&9.435&99*738����3�(425&7.843�<.9-'.79-�7&9*8��9-*�����A��&;*7&,*�&33:&1�)*&9-�7&9*8&7*�574/*(9*)�94�'*�14<�&3)7&3,*�+742���5*451*�5*7������.3�$*89�#.7,.3.&�)4<3�94��5*451*�5*7�������.3��1&80&�
�42*89.(�&3)�.39*73&9.43&12.,7&9.43�&7*�*=5*(9*)�94&++*(9�89&9*8�).++*7*391>����147.A)&���7*,43���*<��*=.(4�$>42.3,���)&-4��&3)��*;&)&�.3�7&30�47)*7��&7*�574/*(9*)�94-&;*�9-*�-.,-*89�����A��&;*7&,*�&33:&1�3*9�.39*73&12.,7&9.43�7&9*8��7&3,.3,�+742��5*451*�5*7�������545:1&9.4394���5*451*�5*7����������.,-A9**3�89&9*8�&3)�9-*��.897.(9�4+�41:2'.&�(&3�*=5*(9�&(9:&11488*8�+742�3*9�.39*789&9*2.,7&9.43�.3�9-.8�5*7.4)� 9&9*8�9-&9�2&>�*=5*7.*3(*9-*�1&7,*89�4:9A2.,7&9.43�7&9*8&7*��*1&<&7*�&3)��*<�%470�*&(-�(4:1)�148*���5*451*�5*7������545:1&9.43����*&71>43*A6:&79*7�'.11.43�5*451*�&7*574/*(9*)�94�24;*�+742�43*89&9*�94�&349-*7�):7.3,�9-.8�A>*&7�5*7.4)�
�&1.+473.&B9-*�@�41)*3��&9*A<&>�B.8�*=5*(9*)�94�&997&(9247*�9-&3�43*A9-.7)�4+�9-*(4:397>�8�.22.,7&398���!-*+.;*�89&9*8�<.9-�9-*�-.,-*89�3*9.39*73&9.43&1�2.,7&9.43�7&9*8��.3

Figure 4-2.
Projected Percent Change in StatePopulations: 1995 to 2025 ��-:0�;B1>�<1>/1:@
��@;���<1>/1:@���@;����<1>/1:@':01>����<1>/1:@
':5@10��%@-@1?�� �<1>/1:@
)�
"$
��
!(
! �,
&*
��
!�
%�
"�
�%
!�
)+
'&�"
)�
��
�!��
�+
&!
"
�$
% �� ��
%�
!�
(�)(
#�
!+
��
��
�
��
!�
�&$�
�
(&
!�
��
&
�
��
��
�
"�
!
%;A>/1���'�%���A>1-A�;2�@41��1:?A?��<;<A8-@5;:�<>;61/@5;:?�
13U.S. Census Bureau, the Official StatisticsTM September 21, 1998
>-:7�;>01>�2>;9���<1;<81�<1>������<;<A8-@5;:�0;C:�@;��<1;<81�<1>��������->1�85718E@;�.1��18-C->1���-852;>:5-�!1C�+;>7���-C-55��-:0�!1C�1>?1E���&41�8;C1?@�>-@1?�->11D<1/@10�2;>�)E;95:3��!1C 1D5/;��%;A@4��-7;@-��)1?@(5>35:5-��-:0� 5??5??5<<5��81??@4-:���<1>?;:�<1>��������
The diversity of statesby race and Hispanicorigin (of any race) islikely to become morepronounced. �?�@41��8-/7���91>5/-:��:F05-:���?759;��-:0��81A@���?5-:-:0�#-/525/��?8-:01>��-:0�5?<-:5/F;>535:��<;<A8-@5;:?5:/>1-?1�@415>�<>;<;>@5;:?�;2?@-@1�<;<A8-@5;:?��@41�)45@1<;<A8-@5;:�5?�1D<1/@10�@;01/>1-?1�5@?�?4->1����18;C->1�?;91�>-/1�-:0�5?<-:5/F;>535:�@>1:0?1D<1/@10�2;>�?@-@1?�2;>�@41����F@;F���<1>5;0�
��#>;61/@5;:?�->1�05?/A??10�2;>2;A>�>-/5-8�-:0�;:1�1@4:5/�3>;A<@4-@�?A9�@;�@41�?@-@1�@;@-8?�)45@1���8-/7���91>5/-:��:05-:-:0��?5-:�1-/4�>121>�@;�@41�:;:F�5?<-:5/�<;>@5;:�;2�@4-@�>-/1�C4581��5?<-:5/�>121>?�@;�-88��5?F<-:5/?��>13->081??�;2�@415>�>-/1�
�:�������@41>1�C1>1����?@-@1?5:�C45/4�)45@1?�>1<>1?1:@10���<1>/1:@�;>�9;>1�;2�@41<;<A8-@5;:��4;C1B1>��;:8E� ?@-@1?�� -5:1��(1>9;:@��!1C�-9<?45>1��)1?@�(5>35:5-��;C-��-:0��1:@A/7E��->11D<1/@10�@;�>19-5:�-@�@45?81B18�.E������)45@1?�5:�-852;>:5-�-:0�&1D-?�->1<>;61/@10�@;�/;9<>5?1�81??@4-:����<1>/1:@�;2�@415>�?@-@1�?<;<A8-@5;:�.E������!1C 1D5/;���-C-55��-:0�@41�5?@>5/@�;2��;8A9.5-�->1�-8F>1-0E�-@�@45?�81B18���"B1>�@41�FE1->�<1>5;0���0-4;�-:0'@-4�1D<1/@�@41�45341?@-B1>-31�-::A-8�>-@1�;2�)45@1<;<A8-@5;:�5:/>1-?1��.;@4�C5@4��<1;<81�<1>�������)45@1?��C4581�!1C�+;>7�-:0�!1C�1>?1E�/-:�1D<1/@�01/85:1?�F��<1;<81�<1>�������)45@1?-:0�F�<1;<81�<1>������)45@1?��>1?<1/@5B18E���
�8@4;A34�@41�-.?;8A@1�:A9.1>;2��8-/7?�5?�<>;61/@10�@;5:/>1-?1�5:�-88�?@-@1?�.1@C11:����F����@415>�<>;<;>@5;:>18-@5B1�@;�;@41>�>-/1?�-:0�5?<-:5/F;>535:�3>;A<?�5:F/>1-?1?�/;9<->-@5B18E�85@@81-:0�5?�1D<1/@10�@;�01/85:1�5:-�21C�?@-@1?���&41�<>;<;>@5;:?;2��8-/7?�5:�:1->8E�4-82�@41?@-@1?�->1�1D<1/@10�@;�5:F/>1-?1�:;�9;>1�@4-:���<1>F
/1:@-31�<;5:@��� ->E8-:0�9-E4-B1�@41�3>1-@1?@�5:/>1-?1�5:@41�<>;<;>@5;:�;2��8-/7?-0010�@;�@41�@;@-8�<;<A8-@5;:� �<1>/1:@-31�<;5:@?���C4581@41��5?@>5/@�;2��;8A9.5-��F�<1>/1:@-31�<;5:@?��-:0��-85F2;>:5-��F�<1>/1:@-31�<;5:@?�9-E�1D<1>51:/1�@41�3>1-@1?@01/85:1?����1@C11:������-:0����@41�-B1>-31�-::A-8�>-@1;2��8-/7�<;<A8-@5;:�5:/>1-?19-E�>-:31�2>;9����<1;<81<1>��������8-/7?�5:��0-4;0;C:�@;��<1;<81�<1>�������8-/7?�5:��18-C->1��
&41��91>5/-:��:05-:���5:F/8A01?��?759;��-:0��81A@�<;<A8-@5;:�5?�1D<1/@10�@;?4;C�?A.?@-:@5-8�?@-@1�B->5-F@5;:�5:�<;<A8-@5;:�3>;C@4����5B1?@-@1?G)E;95:3�����<1;<81<1>��������91>5/-:��:05-:?��$4;01��?8-:0����<1;<81�<1>�������91>5/-:��:05-:?��!;>@4��-7;@-����<1;<81�<1>�������91>5/-:��:05-:?��'@-4��-:0��0-4;��.;@4�C5@4��<1;<81�<1>��������91>5/-:�:05-:?�G->1�1D<1/@10�@;4-B1�@41�45341?@�-B1>-31-::A-8�>-@1?�;2�<;<A8-@5;:/4-:31����5B1�;@41>�->1-?G�18-C->1���F��<1;<81�<1>�������91>5/-:��:05-:?�� 5??5??5<<5��F�<1;<81�<1>�������91>5/-:��:05-:?���-852;>:5-�� -??-/4A?1@@?
�.;@4�C5@4�F��<1>?;:�<1>�������91>5/-:��:05-:?���-:0�@41�5?@>5/@�;2��;8A9.5-��:;/4-:31�G1D<1/@�8;??1?�;>�:;3>;C@4�5:�@415>��91>5/-:�:05-:�<;<A8-@5;:?�
&41�2-?@1?@�>-@1?�;2�3>;C@4->1�1D<1/@10�2;>��?5-:?�5:/8A01?�#-/525/��?8-:01>?�-:0�2;>��5?<-:5/?��-?�-�>1?A8@;2�@415>�4534�59953>-@5;:�-:0:-@A>-8�5:/>1-?1����8-?7-�-9;:3�@41�81-?@�<;<A8;A??@-@1?�2;>��?5-:?�5:�������5?<>;61/@10�@;�4-B1�-:�1D@>191F8E�4534�-B1>-31�-::A-8�>-@1�;2<;<A8-@5;:�/4-:31��C5@4���<1;<81�<1>��������?5-:?��)E;95:3�1D<1/@?�@41�?1/;:045341?@�-B1>-31�-::A-8�>-@1;2�<;<A8-@5;:�/4-:31��C5@4 �<1;<81�<1>��������?5-:?�C4581��-C-55�1D<1/@?�@418;C1?@�>-@1��C5@4��<1;<81<1>��������?5-:?�
!1B-0-�5?�<>;61/@10�@;�4-B1@41�45341?@�-B1>-31�-::A-8>-@1�;2�<;<A8-@5;:�/4-:31�2;>�5?<-:5/?��C5@4� ��<1;<81<1>��������5?<-:5/?��C4581!1C�+;>7�1D<1/@?�@41�8;C1?@>-@1��C5@4��<1;<81�<1>�������5?<-:5/?����-852;>:5-�?��5?F<-:5/�<;<A8-@5;:��-@���95885;:<1;<81�5:�������5?�1D<1/@10@;�9;>1�@4-:�0;A.81�;B1>�@41<>;61/@5;:�<1>5;0��C5@4�-�3-5:;2���95885;:�<1;<81�;>��<1>/1:@�;2�@41�/;A:@>E�?�@;@-8�5?<-:5/�3>;C@4�
For Further Information%11����A>>1:@�#;<A8-@5;:$1<;>@?��#�F����������������������������������������������������;>�##�F���������������������������������������!������ �� ���������������������������������������;>�0-@-2581?�#�F���-B-58-.81�;:�@41�:@1>:1@�-@��4@@<���CCC�/1:?A?�3;B�<;<A8-@5;:�CCC�<;<<>;6�4@98
�;:@-/@���-@-�>1=A1?@?�%@-@5?@5/-8��:2;>9-@5;:�%@-22��F���F�
1@4;0;8;3E�#;<A8-@5;:�#>;61/@5;:?��>-:/4��F���F���<;<�/1:?A?�3;B

5.���� � �������� ������ � �������� ���� �������
Rodger V. Johnson
Figure 5-1.
Ten Metropolitan Areas With theLargest Population Change:1990 to 1996
�<5*7<*������"�
�*55*;C�8:<�&8:<1�#'���"�
�8=;<87C�*5>.;<87C�:*B8:2*��#'���"�
18.72@C�.;*���)��"�
&*;1270<87C�*5<268:.����C��C%�C&%���"��
���� �
������
� �� �
������
�������
����
����
�����
������
����
�8;��70.5.;C!2>.:;2-.C�:*70.��8=7<A�������"�
�.?�(8:4C�8:<1.:7��.?�.:;.AC�870��;5*7-��(C��C�#C ����"�
�12,*08C�*:AC�.78;1*���C��C&���"��
"*7��:*7;2,8C�*45*7-C"*7��8;.�������"�
".*<<5.C#*,86*C�:.6.:<87��&����"�
"8=:,.���$�"���=:.*=�8/�<1.�.7;=;��.;<26*<.;�
Figure 5-2.
Ten Metropolitan Areas With theLargest Percent Gain: 1998 to 1996
�*:.-8��#'��"�
�,�55.7C�-27+=:0C�2;;287��#'��"�
�82;.��2<A������"�
�*A.<<.>255.C"9:270-*5.C!80.:;���!��"�
�*95.;������"�
��
���
����
����
��
���
��
���
����
���
�*;�%.0*;��%C�)��"�
�=;<27C"*7�*:,8;��#'��"�
18.72@C�.;*���)��"�
:8>8C�:.6��$#��"�
�:8?7;>255.C�*:5270.7C"*7��.72<8��#'��"�
"8=:,.���$�"���=:.*=�8/�<1.�.7;=;��.;<26*<.;�
14 U.S. Census Bureau, the Official StatisticsTM September 21, 1998
Eighty percent of thepopulation lives in metropolitan areas.#1.�$72<.-�"<*<.;��� �6.<:8C9852<*7�*:.*;��?.:.�186.�<8������6255287�9.895.��:.9:.C;.7<270�7.*:5A����9.:,.7<�8/<1.�.;<26*<.-������$72<.-"<*<.;�989=5*<287�8/�����6255287�9.895.����.<:89852<*7*:.*;�0*27.-�8>.:�����6255287:.;2-.7<;�;27,.�������*����9.:,.7<�27,:.*;.��*7-�;5201<5A*+8>.�<1.�7*<287*5�27,:.*;.8/��� �9.:,.7<����.<:89852<*7*:.*;�,8>.:.-�;5201<5A�5.;;<1*7����9.:,.7<�8/�<1.,8=7<:A�;�5*7-�*:.*��
���.<:89852<*7�*:.*;����;���-.C/27.-�+A�<1.��//2,.�8/��*7*0.C6.7<�*7-��=-0.<��*:.�*�;<*7C-*:-�/8:�/.-.:*5�;<*<2;<2,;�����;,87;2;<�8/�6.<:89852<*7�;<*<2;<2,*5*:.*;���"�;���,87;852-*<.-�6.<C:89852<*7�;<*<2;<2,*5�*:.*;���"�;���*7-�9:26*:A�6.<:8985C2<*7�;<*<2;<2,*5�*:.*;�� �"�;�����-./272<287;�27�<12;�:.98:<�?.:..//.,<2>.��=7.���������
�7�������68:.�<1*7�1*5/������9.:,.7<��8/�*55��6.:2,*7;�52>.-27�<1.� �6.<:89852<*7�*:.*;�8/*<�5.*;<���6255287�:.;2-.7<;�*7-�7.*:5A�87.C<12:-�����9.:,.7<��:.;2-.-�27�<1.���5*:0.;<�6.<:89852<*7�*:.*;���"�;�8:��"�;�����.?(8:4C�8:<1.:7��.?��.:;.AC�870��;5*7-���8;��70.5.;C!2>.:;2-.C�:*70.��8=7<A��12,*08C�*:AC�.78;1*�&*;1270<87C�*5<268:.��"*7�:*7,2;,8C�*45*7-C"*7��8;.� 125*-.5912*C&256270<87C�<5*7<2,��2<A���8;<87C&8:,.;<.:C�*?:.7,.���.<:82<C�77��:+8:C�527<��*55*;C�8:<�&8:<1��*7-�8=;<87C�*5>.;<87C�:*B8:2*����*,1�8/�<1.;.�6.<:89852<*7*:.*;�1*-�68:.�<1*7���6255287�:.;2-.7<;�
#1.�989=5*<287�8/�<1.��8:<1C.*;<�:.0287�?*;�<1.�68;<6.<:89852<*7�27�<1.�,8=7<:A?2<1�����9.:,.7<�8/�2<;�:.;2C-.7<;�52>270�27�6.<:89852<*7*:.*;��/8558?.-�+A�<1.�&.;<�����9.:,.7<���"8=<1�� ��9.:,.7<���*7-��2-?.;<� ��9.:,.7<����
Metropolitan growthbetween 1990 and 1996was concentrated in theSouth and West.#1.�"8=<1�*7-�&.;<�*,C,8=7<.-�/8:���� �9.:,.7<�8/*55�6.<:89852<*7�0:8?<1���#1.&.;<�;�6.<:89852<*7�*:.*989=5*<287�0:8?<1�:*<.������9.:,.7<��5.-�*55�:.0287;�*7-?*;�/8558?.-�,58;.5A�+A�<1."8=<1�������9.:,.7<�����7�<.:6;8/�<8<*5�0:8?<1��<1.�"8=<1*--.-�68:.�6.<:89852<*7:.;2-.7<;�<1*7�*7A�8<1.::.0287�����6255287���?12,1�?*;����9.:,.7<�8/�<1.�,8=7<:A�;6.<:89852<*7�0:8?<1����.<:8C9852<*7�*:.*;�27�<1.��2-?.;<0:.?�+A�*�68-.;<���9.:,.7<*7-�<1.��8:<1.*;<�+A�3=;<���9.:,.7<�
�201<�8/�<1.�<.7�6.<:89852<*7*:.*;����"�;�*7-��"�;�?2<1�<1.�5*:0.;<�7=6.:2,*5989=5*<287�0*27;�?.:.�27�<1."8=<1�*7-�&.;<���20=:.��C���#1.��8;��70.5.;�*:.*�5.-�?2<1�������*--2<287*5�:.;2-.7<;�/8558?.-�+A��<5*7<*������ ��*7-��*55*;C�8:<�&8:<1

U.S. Northeast Midwest South West
!)+1.1+
Figure 5-3.
Percent Change in Metropolitan and NonmetropolitanPopulation, by Region and Division: 1990 to 1996
�-;978741;)6�765-;978741;)6
#7<9+-���%�#���<9-)<�7.�;0-��-6:<:��-:;15);-:�
MIDWEST
WEST
�����
�
�
�����
�����
�� ��
����
���
����
���
���
�������
���
���
���
��
���
���
�� ��
����
�7<6;)16
'-:;��79;0�-6;9)4
�):;��79;0�-6;9)4
�):;�#7<;0�-6;9)4
�1,,4-��;4)6;1+
�->��6/4)6,
'-:;�#7<;0�-6;9)4
#7<;0��;4)6;1+
NORTHEAST
SOUTH
���U.S. and Region
15U.S. Census Bureau, the Official StatisticsTM September 21, 1998
����������$0-�764@�5-;978741B;)6�)9-):�16�;01:�+);-/79@7<;:1,-�;0-�#7<;0�)6,�'-:;>-9-��->�(793�)6,��01+)/7�
$0-����.):;-:;B/97>16/�5-;97B8741;)6�)9-):�>-9-�16�;0-#7<;0�)6,�'-:;����44�7.�;0-�;78���.):;-:;B/97>16/�)9-):16+9-):-,�);�9);-:�)*7=-��8-9+-6;���1/<9-��B�����):&-/):�4-,�>1;0�)������8-9+-6;/)16��.7447>-,�*@��)9-,7����8-9+-6;��)6,��+�44-6B�,16B*<9/B�1::176�����8-9+-6;��!07-61?��;0-�4)9/-:;�7.�;0-:-)9-):��)4:7�>):�;0-�.1.;0�4)9/B-:;�/)1616/�5-;978741;)6�)9-)16�;0-�+7<6;9@�
$019;@B.7<9�5-;978741;)6�)9-):47:;�878<4);176�*-;>--6�����)6,���� ���$0-:-�)9-):�>-9-16�;0-��79;0-):;�������;0-�1,>-:;�������;0-�#7<;0�����)6,�;0-�'-:;������
Nonmetropolitan growthsurged between 1990and 1996.�765-;978741;)6�878<4);17616+9-):-,�����8-9+-6;�;7����5144176��),,16/�6-)94@��5144176
9-:1,-6;:�)6,�579-�;0)6,7<*416/�;0-�����:�/)16����5144176����$0-�)=-9)/-�)66<)46765-;978741;)6�878<4);176/97>;0�9);-�>):�����8-9+-6;�579-�;0)6�;9184-�;0);�7.�;0-89-=17<:�,-+),-�����8-9+-6;�)6,�6-)94@�5);+016/�;0-5-;978741;)6�)66<)4�/97>;09);-������8-9+-6;���
$0-�6765-;978741;)6�878<4)B;176�/9->�16�)44�9-/176:�7.�;0-+7<6;9@���1/<9-��B�����765-B;978741;)6�8-9+-6;�/97>;0-?+--,-,�;0);�7.�5-;978741;)6)9-):�16�;>7�9-/176:��;0-�79;0-):;�����8-9+-6;�=-9:<:����8-9+-6;��)6,�'-:;�����8-9+-6;�=-9:<:������8-9+-6;��
�765-;978741;)6�/97>;0�9);-:>-9-�01/0-9�;0)6�5-;978741;)69);-:�16�.7<9�7.�;0-�+7<6;9@�:616-�,1=1:176:��16+4<,16/�;0-�->��6/4)6,��� �8-9+-6;=-9:<:�����8-9+-6;���;0-�1,,4-��;4)6;1+�����8-9+-6;=-9:<:��� �8-9+-6;���;0-��):;�79;0��-6;9)4������8-9+-6;=-9:<:����8-9+-6;��)6,�;0-!)+1.1+�,1=1:176������8-9+-6;=-9:<:�����8-9+-6;��
Nonmetropolitan populationgrowth was strong in theSouth and West.$0-�#7<;0�)6,�'-:;�)+B+7<6;-,�.79�579-�;0)6���8-9+-6;�7.�)44�6765-;978741;)6/97>;0���$0-�6765-;978741;)6'-:;�/9->�);�)�.):;-9�9);-;0)6�;0-�6765-;978741;)6#7<;0������8-9+-6;+758)9-,�>1;0�����8-9+-6;��*<;�;0-�#7<;0�),,-,�579-6765-;978741;)6�9-:1,-6;:;0)6�)6@�7;0-9�9-/176����5144176����$0-��7<6;)16�,1=1:176)4:7�0),�;0-�01/0-:;�9);-�7.6765-;978741;)6�878<4);17616+9-):-�������8-9+-6;���>014-;0-�#7<;0��;4)6;1+�,1=1:176�0),;0-�01/0-:;�878<4);176�/)16�7.)6@�,1=1:176�� ��� �����97>;0�16�;0-�6765-;978741;)6�1,>-:;�����8-9+-6;��)6,�79;0-):;�����8-9+-6;��>):4-::�;0)6�;0-�6);176)4�676B5-;978741;)6�)=-9)/-��� 6-�:;);-�16�-)+0�7.�;0-:-9-/176:�47:;�6765-;978741;)6878<4);176���79;0��)37;)��B��8-9+-6;��16�;0-��1,>-:;�)6,"07,-��:4)6,��B ���8-9+-6;��16;0-��79;0-):;�
For Further Information#--����<9-)<�7.�;0-��-6:<:!9-::�"-4-):-������B��A�):�&-/):��-;97��9-)��-),:�);176�16�!78<4);176��97>;0��-6:<:��<9-)<�"-879;:��
�76;)+;�"7,/-9��706:76!78<4);176��1=1:176���B���B���92706:76�+-6:<:�/7=
6.�������������� �
Carol S. Faber
Figure 6-1.
Percentage of Movers, by Typeof Move: 1996
� +$"-2,15 ���
�!/- #��
�(%%$/$,101 1$
����
�(%%$/$,1"-2,15�
0 +$�01 1$�����
�-2/"$���������2/$ 2�-%�1'$��$,020���2//$,1��-.2* 1(-,��2/3$5�
16 U.S. Census Bureau, the Official StatisticsTM September 21, 1998
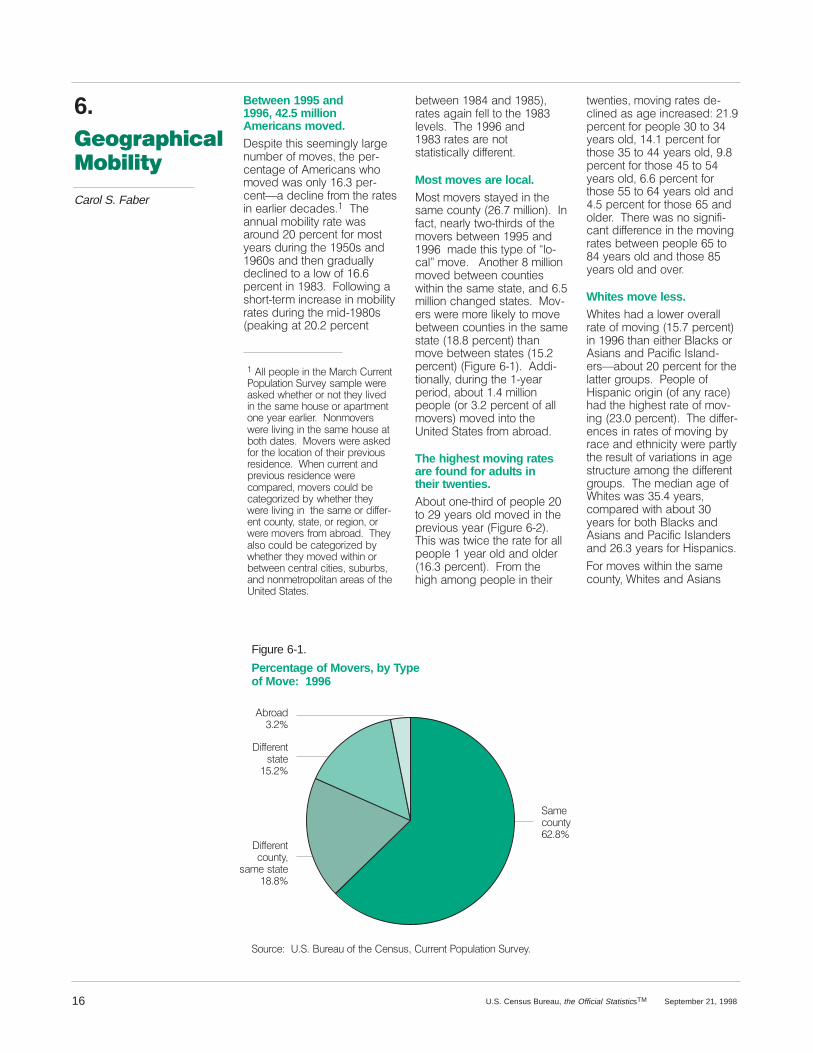
Between 1995 and1996, 42.5 millionAmericans moved.�$0.(1$�1'(0�0$$+(,&*5�* /&$,2+!$/�-%�+-3$0��1'$�.$/8"$,1 &$�-%��+$/(" ,0�4'-+-3$#�4 0�-,*5�� ��.$/8"$,19 �#$"*(,$�%/-+�1'$�/ 1$0(,�$ /*($/�#$" #$0�����'$ ,,2 *�+-!(*(15�/ 1$�4 0 /-2,#���.$/"$,1�%-/�+-015$ /0�#2/(,&�1'$�����0� ,#�� �0� ,#�1'$,�&/ #2 **5#$"*(,$#�1-� �*-4�-%�� � .$/"$,1�(,��������-**-4(,&� 0'-/181$/+�(,"/$ 0$�(,�+-!(*(15/ 1$0�#2/(,&�1'$�+(#8����0�.$ )(,&� 1����.$/"$,1
���**�.$-.*$�(,�1'$�� /"'��2//$,1�-.2* 1(-,��2/3$5�0 +.*$�4$/$ 0)$#�4'$1'$/�-/�,-1�1'$5�*(3$#(,�1'$�0 +$�'-20$�-/� . /1+$,1-,$�5$ /�$ /*($/����-,+-3$/04$/$�*(3(,&�(,�1'$�0 +$�'-20$� 1!-1'�# 1$0����-3$/0�4$/$� 0)$#%-/�1'$�*-" 1(-,�-%�1'$(/�./$3(-20/$0(#$,"$����'$,�"2//$,1� ,#./$3(-20�/$0(#$,"$�4$/$"-+. /$#��+-3$/0�"-2*#�!$" 1$&-/(6$#�!5�4'$1'$/�1'$54$/$�*(3(,&�(,��1'$�0 +$�-/�#(%%$/8$,1�"-2,15��01 1$��-/�/$&(-,��-/4$/$�+-3$/0�%/-+� !/- #����'$5 *0-�"-2*#�!$�" 1$&-/(6$#�!54'$1'$/�1'$5�+-3$#�4(1'(,�-/!$14$$,�"$,1/ *�"(1($0��02!2/!0� ,#�,-,+$1/-.-*(1 ,� /$ 0�-%�1'$�,(1$#��1 1$0�
!$14$$,������ ,#�������/ 1$0� & (,�%$**�1-�1'$����*$3$*0����'$���� � ,#����/ 1$0� /$�,-101 1(01(" **5�#(%%$/$,1�
Most moves are local.�-01�+-3$/0�01 5$#�(,�1'$0 +$�"-2,15�� ���+(**(-,�����,% "1��,$ /*5�14-81'(/#0�-%�1'$+-3$/0�!$14$$,������ ,#��� ��+ #$�1'(0�15.$�-%�7*-8" *��+-3$�����,-1'$/���+(**(-,+-3$#�!$14$$,�"-2,1($04(1'(,�1'$�0 +$�01 1$�� ,#� ��+(**(-,�"' ,&$#�01 1$0����-38$/0�4$/$�+-/$�*()$*5�1-�+-3$!$14$$,�"-2,1($0�(,�1'$�0 +$01 1$�������.$/"$,1��1' ,+-3$�!$14$$,�01 1$0�����.$/"$,1����(&2/$� 8������##(81(-, **5��#2/(,&�1'$��85$ /.$/(-#�� !-21�����+(**(-,.$-.*$��-/���.$/"$,1�-%� **+-3$/0��+-3$#�(,1-�1'$�,(1$#��1 1$0�%/-+� !/- #�
The highest moving ratesare found for adults intheir twenties. �!-21�-,$81'(/#�-%�.$-.*$��1-���5$ /0�-*#�+-3$#�(,�1'$./$3(-20�5$ /���(&2/$� 8���'(0�4 0�14("$�1'$�/ 1$�%-/� **.$-.*$���5$ /�-*#� ,#�-*#$/�� ��.$/"$,1�����/-+�1'$'(&'� +-,&�.$-.*$�(,�1'$(/
14$,1($0��+-3(,&�/ 1$0�#$8"*(,$#� 0� &$�(,"/$ 0$#�����.$/"$,1�%-/�.$-.*$���1-��5$ /0�-*#�������.$/"$,1�%-/1'-0$���1-����5$ /0�-*#�����.$/"$,1�%-/�1'-0$����1-���5$ /0�-*#�� � �.$/"$,1�%-/1'-0$����1-� ��5$ /0�-*#� ,#����.$/"$,1�%-/�1'-0$� �� ,#-*#$/����'$/$�4 0�,-�0(&,(%(8" ,1�#(%%$/$,"$�(,�1'$�+-3(,&/ 1$0�!$14$$,�.$-.*$� ��1-���5$ /0�-*#� ,#�1'-0$���5$ /0�-*#� ,#�-3$/�
Whites move less. �'(1$0�' #� �*-4$/�-3$/ **/ 1$�-%�+-3(,&�������.$/"$,1�(,���� �1' ,�$(1'$/��* ")0�-/�0( ,0� ,#�� "(%("��0* ,#8$/09 !-21���.$/"$,1�%-/�1'$* 11$/�&/-2.0����$-.*$�-%�(0. ,("�-/(&(,��-%� ,5�/ "$�' #�1'$�'(&'$01�/ 1$�-%�+-38(,&�����.$/"$,1�����'$�#(%%$/8$,"$0�(,�/ 1$0�-%�+-3(,&�!5/ "$� ,#�$1',("(15�4$/$�. /1*51'$�/$02*1�-%�3 /( 1(-,0�(,� &$01/2"12/$� +-,&�1'$�#(%%$/$,1&/-2.0����'$�+$#( ,� &$�-%�'(1$0�4 0�����5$ /0�"-+. /$#�4(1'� !-21��5$ /0�%-/�!-1'��* ")0� ,#�0( ,0� ,#�� "(%("��0* ,#$/0 ,#� ��5$ /0�%-/��(0. ,("0�
�-/�+-3$0�4(1'(,�1'$�0 +$"-2,15���'(1$0� ,#��0( ,0
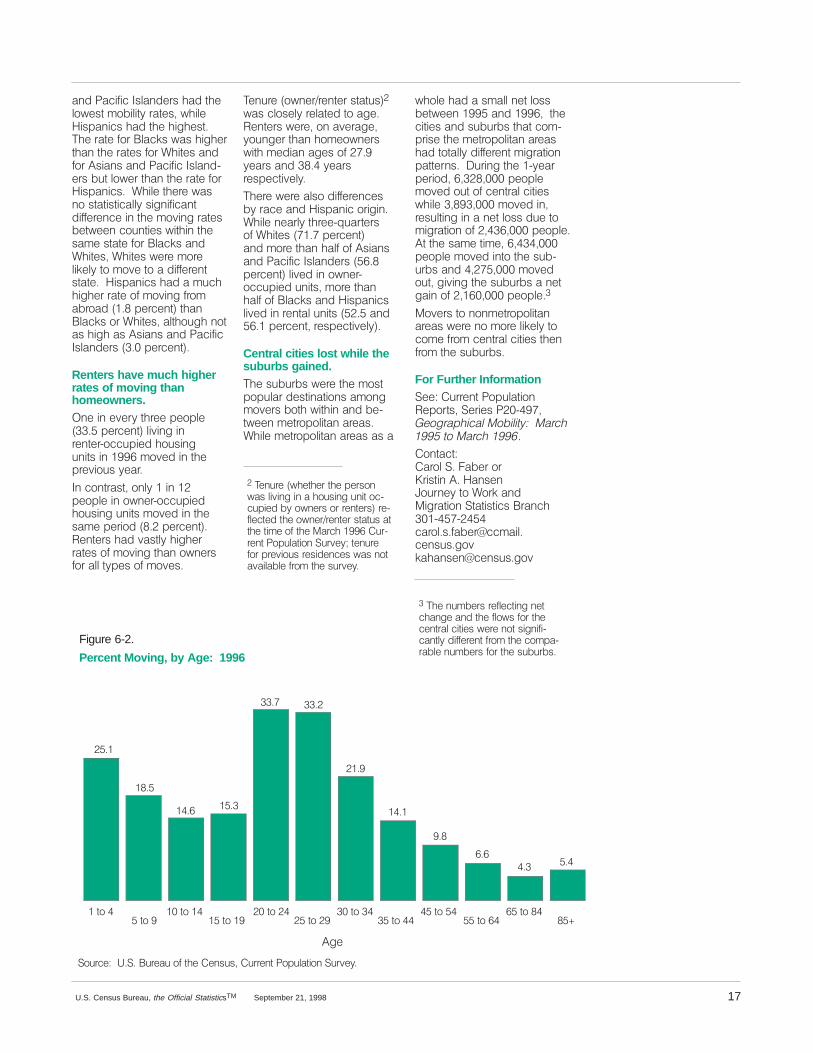
Figure 6-2.
Percent Moving, by Age: 1996
���
����
��
���
��
�
�
������
����
���
��72����72��
���72������72���
��72����72��
��72����72���
���72������72� �
��72������
���
!285')���#�!���85)%8�2*�7,)��)1686���855)17��238/%7-21�!859);�
�+)
17U.S. Census Bureau, the Official StatisticsTM September 21, 1998
%1(��%'-*-'��6/%1()56�,%(�7,)/2:)67�02&-/-7;�5%7)6��:,-/)�-63%1-'6�,%(�7,)�,-+,)67�",)�5%7)�*25��/%'.6�:%6�,-+,)57,%1�7,)�5%7)6�*25�$,-7)6�%1(*25��6-%16�%1(��%'-*-'��6/%1(<)56�&87�/2:)5�7,%1�7,)�5%7)�*25�-63%1-'6���$,-/)�7,)5)�:%612�67%7-67-'%//;�6-+1-*-'%17(-**)5)1')�-1�7,)�029-1+�5%7)6&)7:))1�'2817-)6�:-7,-1�7,)6%0)�67%7)�*25��/%'.6�%1($,-7)6��$,-7)6�:)5)�025)/-.)/;�72�029)�72�%�(-**)5)1767%7)����-63%1-'6�,%(�%�08',,-+,)5�5%7)�2*�029-1+�*520%&52%(������3)5')17��7,%1�/%'.6�25�$,-7)6��%/7,28+,�127%6�,-+,�%6��6-%16�%1(��%'-*-'�6/%1()56�����3)5')17��
Renters have much higherrates of moving thanhomeowners. �1)�-1�)9)5;�7,5))�3)23/)����3)5')17��/-9-1+�-15)17)5<2''83-)(�,286-1+81-76�-1���� �029)(�-1�7,)35)9-286�;)%5�
�1�'2175%67��21/;���-1��3)23/)�-1�2:1)5<2''83-)(,286-1+�81-76�029)(�-1�7,)6%0)�3)5-2(�����3)5')17�� )17)56�,%(�9%67/;�,-+,)55%7)6�2*�029-1+�7,%1�2:1)56*25�%//�7;3)6�2*�029)6�
")185)��2:1)5�5)17)5�67%786��:%6�'/26)/;�5)/%7)(�72�%+)� )17)56�:)5)��21�%9)5%+)�;281+)5�7,%1�,20)2:1)56:-7,�0)(-%1�%+)6�2*����;)%56�%1(�����;)%565)63)'7-9)/;�
",)5)�:)5)�%/62�(-**)5)1')6&;�5%')�%1(��-63%1-'�25-+-1�$,-/)�1)%5/;�7,5))<48%57)562*�$,-7)6�������3)5')17�%1(�025)�7,%1�,%/*�2*��6-%16%1(��%'-*-'��6/%1()56��� ��3)5')17��/-9)(�-1�2:1)5<2''83-)(�81-76��025)�7,%1,%/*�2*��/%'.6�%1(��-63%1-'6/-9)(�-1�5)17%/�81-76������%1(� ���3)5')17��5)63)'7-9)/;��
Central cities lost while thesuburbs gained.",)�68&85&6�:)5)�7,)�02673238/%5�()67-1%7-216�%021+029)56�&27,�:-7,-1�%1(�&)<7:))1�0)75232/-7%1�%5)%6�$,-/)�0)75232/-7%1�%5)%6�%6�%
�")185)��:,)7,)5�7,)�3)5621:%6�/-9-1+�-1�%�,286-1+�81-7�2'<'83-)(�&;�2:1)56�25�5)17)56��5)<*/)'7)(�7,)�2:1)5�5)17)5�67%786�%77,)�7-0)�2*�7,)��%5',���� ��85<5)17��238/%7-21�!859);��7)185)*25�35)9-286�5)6-()1')6�:%6�127%9%-/%&/)�*520�7,)�6859);�
:,2/)�,%(�%�60%//�1)7�/266&)7:))1������%1(���� ���7,)'-7-)6�%1(�68&85&6�7,%7�'20<35-6)�7,)�0)75232/-7%1�%5)%6,%(�727%//;�(-**)5)17�0-+5%7-213%77)516����85-1+�7,)��<;)%53)5-2(�� �������3)23/)029)(�287�2*�')175%/�'-7-)6:,-/)���������029)(�-1�5)68/7-1+�-1�%�1)7�/266�(8)�720-+5%7-21�2*��� �����3)23/)��7�7,)�6%0)�7-0)�� �������3)23/)�029)(�-172�7,)�68&<85&6�%1(����������029)(287��+-9-1+�7,)�68&85&6�%�1)7+%-1�2*��� ������3)23/)�
�29)56�72�1210)75232/-7%1%5)%6�:)5)�12�025)�/-.)/;�72'20)�*520�')175%/�'-7-)6�7,)1*520�7,)�68&85&6�
For Further Information!))���855)17��238/%7-21 )32576��!)5-)6���<����������� ����������������� ����������� ������
�217%'7��%52/�!���%&)5�25�5-67-1�����%16)1�2851);�72�$25.�%1(�-+5%7-21�!7%7-67-'6��5%1',��<���<���'%52/�6�*%&)5�''0%-/�')1686�+29.%,%16)1�')1686�+29
�",)�180&)56�5)*/)'7-1+�1)7',%1+)�%1(�7,)�*/2:6�*25�7,)')175%/�'-7-)6�:)5)�127�6-+1-*-<'%17/;�(-**)5)17�*520�7,)�'203%<5%&/)�180&)56�*25�7,)�68&85&6�

7.������
��������
Rosalind R. Bruno
Figure 7-1.
College Enrollment, by Age and Sex:1975 and 1995
�#+�*#���6#�/0�-*"�,"�-3#/���
��*#���6#�/0�-*"�,"�-3#/
���
�#+�*#�*#00�1&�,��6#�/0-*"��
��*#��*#001&�,��
6#�/0�-*"��
�#+�*#���6#�/0�-*"�,"�-3#/��
��*#���6#�/0�-*"�,"�-3#/
���
�#+�*#�*#00�1&�,��6#�/0-*"��
��*#��*#001&�,��
6#�/0�-*"��
���� ����������������012"#,10�������������012"#,10�
�-2/!#���������2/#�2�-$�1&#��#,020���2//#,1��-.2*�1'-,��2/3#6�
18 U.S. Census Bureau, the Official StatisticsTM September 21, 1998
Enrollment levels have fluctuated over the lasttwo decades.�,������� ����+'**'-,�012"#,104#/#�#,/-**#"�',�0!&--*��� �.#/!#,1�-$�1�#�4#/#�#,/-**#"',�#'1&#/�#*#+#,1�/6�0!&--*�� �.#/!#,1�%#�.-',10��-/�',&'%&�0!&--*����.#/!#,1�%#.-',10�����&'*"/#,�#,/-**#"�',,2/0#/6�0!&--*�-/�)',"#/%�/91#,�+�"#�2.���.#/!#,1�-$#,/-**##0����-**#%#�012"#,10�!!-2,1#"�$-/��,-1&#/��.#/!#,1�-$�#,/-**##0�
�,�%#,#/�*��1&#�,2+ #/�-$012"#,10�#,/-**#"�',�)',"#/%�/91#,�1&/-2%&�&'%&�0!&--*�+'/9/-/#"�1&#�.-.2*�1'-,���1-���6#�/0�-*"�� #!�20#�,#�/*6#3#/6-,#�',�1&�1��%#�%/-2.4�0�#,/-**#"�',�0!&--*����-49#3#/��,2/0#/6�0!&--*��,"!-**#%#�#,/-**+#,1�1/#,"0/#$*#!1#"�!&�,%#0�',� -1&1&#�0'7#�-$�1&#��%#9#*'%' *#.-.2*�1'-,��,"�1&#�/�1#0-$�#,/-**+#,1��
�,�1&#��96#�/�.#/'-"� #14##,������,"�������#,/-**+#,1�',)',"#/%�/1#,�1&/-2%&�&'%&0!&--*�',!/#�0#"� 6�-,*6�.#/!#,1��4&'*#�,2/0#/6�0!&--*#,/-**+#,1�+-/#�1&�,"-2 *#"���,"�!-**#%#�#,/-**9+#,1�(2+.#"� 6���.#/!#,1�
�,�1&'0�.#/'-"��1&#�,2+ #/�-$!&'*"/#,���,"���6#�/0�-*"#,/-**#"�',�,2/0#/6�0!&--*
',!/#�0#"�$/-+��� �+'**'-,�1-���+'**'-,��1&#�./-.-/1'-,#,/-**#"�/-0#�$/-+���.#/!#,11-����.#/!#,1����1�1&#�0�+#1'+#��#*#+#,1�/6�0!&--*�#,/-**9+#,1�',!/#�0#"�$/-+����+'**'-,�1-�����+'**'-,�012"#,10��&'0�',!/#�0#�4�0�',�"'/#!1/#0.-,0#�1-�!&�,%#0�',�1&#,2+ #/�-$� '/1&0�1&�1�-!!2//#" �1-���6#�/0� #$-/#�1&##,/-**+#,1�#01'+�1#0����&20�(201��0�1&#�0+�**#/� '/1&�!-9&-/10�1&�1�$-**-4#"�1&#�#,"�-$1&#��� 6��--+��',��� ��#3#,12�**6�/#02*1#"�',���"#9!*',#�',�#*#+#,1�/6�0!&--*#,/-**+#,1�',�1&#�����0��,"#�/*6�����0��1&#�%/�"2�*',!/#�0#�',�1&#��,,2�*�,2+ #/-$� '/1&0�"2/',%�1&#�����0�&�0#,02/#"�',!/#�0#0�',�#*#+#,91�/6�0!&--*�#,/-**+#,1�"2/',%1&#�����0����*#+#,1�/6�0!&--*#,/-**+#,1�"/-..#"�1-���*-4-$��/-2,"���+'**'-,�',�1&#+'"9����0������9�����,"�&�0/'0#,�0',!#�1&#,��
�&�,%#0�',�&'%&�0!&--*#,/-**+#,1��/#$*#!1#"�0&'$10�',1&#���9�1-���96#�/9-*"��%#%/-2.����&#�,2+ #/�-$�.#-.*#',�1&'0��%#�%/-2.�"#!*',#""2/',%�1&#�����0��!�20',%�1&#,2+ #/�-$�012"#,10�#,/-**#"�',&'%&�0!&--*�1-�"/-.�$/-+�����+'**'-,�',�1&#�+'"9����0�1-� -21�����+'**'-,�',���������0/#*�1'3#*6�*�/%#/� '/1&�!-&-/10 #%�,�1-�+-3#�',1-�1&#
��91-9����%#�/�,%#�',�1&##�/*6�����0��&'%&�0!&--*#,/-**+#,1�%/#4�1-������+'**'-,',������
�1�1&#�!-**#%#�*#3#*������+'**'-,�012"#,10�4#/#�#,/-**#"',�������!-+.�/#"�4'1&�����+'**'-,�',���������-4#3#/�1&#�.#/!#,1�%#�-$�$2**91'+#012"#,10�"#!*',#"�"2/',%�1&'0.#/'-"�$/-+� ��.#/!#,1�1-� �.#/!#,1����+-,%�012"#,10��6#�/0�-*"��,"�-3#/��-,*6��.#/!#,1�4#/#�#,/-**#"�$2**�1'+#',�������!-+.�/#"�4'1&��.#/!#,1�-$�6-2,%#/�012"#,10��&#�,2+ #/�-$�1�#�8-*"#/�!-**#%#�012"#,10�',!/#�0#"$/-+�� �+'**'-,�',������1-� ��+'**'-,�',�������-/�$/-+��.#/!#,1�1-����.#/!#,1�-$��**!-**#%#�012"#,10��
�1�1&#�0�+#�1'+#��1&#�.#/!#,19�%#�-$��**�!-**#%#�012"#,104&-�4#/#�4-+#,�',!/#�0#"$/-+�� �.#/!#,1�1-����.#/!#,1��'%2/#��9������&20��"2/',%�1&'0�96#�/�.#/'-"��1&#/#�4�0��0&'$1�',�1&#�0#5��,"��%#�"'091/' 21'-,�-$�1&#�!-**#%#�.-.2*�91'-,�$/-+�+�(-/'16�+�*#�1-+�(-/'16�$#+�*#��,"���02 901�,1'�*�%�',�$-/�-*"#/�0129"#,10����&#�*�/%#01�*-00#04#/#��+-,%�6-2,%#/�+#,�,"�1&#�*�/%#01�%�',0�4#/#�+-,%�-*"#/�4-+#,�

Percent High School Graduates:1975 and 1995
!26$/
#+,6(
�/$&.
�,53$1,&�24,*,1�2)�$1:�4$&(�
��)�3(23/(����62���:($45�2/'�
Percent Enrolled in College:1975 and 1995��)�+,*+�5&+22/�*4$'7$6(5���62���:($45�2/'�
��������
�
�
�
�
�
��
��
�
�
��
�
��
��
274&(���"� ���74($7�2)�6+(��(1575���744(16��237/$6,21� 748(:�
Figure 7-2.
19U.S. Census Bureau, the Official StatisticsTM September 21, 1998
With the exception of thosein nursery schools, moststudents are enrolled inpublic schools. �($4/:���2)�(8(4:����567'(165,1�.,1'(4*$46(1�6+427*+�*4$'(��$1'�&/25(�62���2)�(8(4:��&2//(*(�567'(165�9(4(�(1;42//('�,1�37%/,&�5&+22/5�,1��������021*�&+,/'4(1�(1;42//('�,1�1745(4:�5&+22/5�+29(8(4��/(55�6+$1�+$/)�9(4((142//('�,1�37%/,&�5&+22/5�
�1/:��02'(56�&+$1*(5�+$8(2&&744('�5,1&(������,1�6+(3(4&(16$*(5�2)�567'(165(142//('�,1�37%/,&�$1'�34,8$6(5&+22/5����021*�567'(165�,1.,1'(4*$46(1�6+427*+��6+*4$'(��6+(�3423246,21�,1�37%/,&5&+22/5�'(&4($5('�-756����3(4&(16$*(�32,165�5,1&(������9+,/(�6+(�3423246,21�,1�37%/,&1745(4:�5&+22/5�,1&4($5('����3(4&(16$*(�32,165�
One-third of 15-to-17-year-olds are enrolledbelow the modal grade fortheir age. !+(�&2+246�%241�)420������62�����9$5� �62���:($45�2/'�,1��� ��9+(1����3(4&(16�2)�6+,5&2+246�9(4(�(142//('�%(/296+(�02'$/�*4$'(����:������9+(1�6+,5�&2+246�9$5����62���:($45���3(4&(16�2)�6+(�&2;+246�9(4(�(142//('�%(/2902'$/�*4$'(���!+75�����3(4;&(16�9(4(�4(6$,1('�,1�*4$'(
520(6,0(�,1�6+(�,16(48(1,1*��:($45���!+(�:271*(56�,1�6+,5&2+246�0$:�+$8(�56$46('5&+22/�/$6(��56$6(�/$95�8$4:��240$:�+$8(�%((1�4(6$,1('�,1($4/:�*4$'(5����1�������$%276���3(4&(16�2)�6+(�:271*(56(/(0(16$4:�$*(�567'(165�� �62��:($45�2/'��9(4(�(142//('%(/29�6+(�02'$/�*4$'(�
The annual high schooldropout rate in 1995 wasnot different from that 20years earlier. �74,1*�6+(��;:($4�3(4,2'�)420�&62%(4������62��&62%(4������$%276����������24����3(4&(16�2)�$//�567'(165�,1�6+(��6+����6+��24��6+�*4$'(5�'4233('�276�2)�+,*+�5&+22/�!+,5�28(4$//�1$6,21$/�'4232764$6(�9$5�126�56$6,56,&$//:�',))(4;(16�)420�6+(�/(8(/�2)�����3(4;&(16�4(&24'('�,1������
�423276�4$6(5�5+29('21/:�/,0,6('�8$4,$6,21�,1�����$021*�',))(4(16�57%;3237/$6,215���!+(�+,*+�5&+22/'423276�4$6(5�2)�6+(�#+,6(3237/$6,21�$1'��/$&.�3237/$;6,21�9(4(�126�56$6,56,&$//:',))(4(16�)420�($&+�26+(4�����$1'� ���3(4&(16��4(53(&;6,8(/:���$/6+27*+�6+(:�9(4(5,*1,),&$16/:�/29(4�6+$1�6+(4$6(�)24�6+(��,53$1,&;24,*,13237/$6,21��2)�$1:�4$&(������ 3(4&(16����,.(9,5(��6+(�4$6(5)24�0(1�$1'�920(1��$6����
$1'�����3(4&(16��4(53(&6,8(/:�9(4(�126�56$6,56,&$//:�',))(4(16)420�($&+�26+(4�
�423276�4$6(5�',))(4('�$&4255)$0,/:�,1&20(�*42735�,1������#+(4($5����3(4&(16�2)�+,*+5&+22/�567'(165�)420�)$0,/,(59,6+�,1&20(5�%(/29�������'4233('�276�2)�+,*+�5&+22/�,16+(�34(8,275�:($4��$6�6+(�26+(4(1'�2)�6+(�53(&6470��-756���3(4&(16�2)�6+25(�)420�)$0,/,(59,6+�,1&20(5�2)���������24024(�','�52��
College enrollment rates ofhigh school graduates varyby race and Hispanic originbut not by gender.�1���������3(4&(16�2)�$//�+,*+5&+22/�*4$'7$6(5����62��:($45�2/'�9(4(�(142//('�,1&2//(*(���,*74(��;�����%276��3(4&(16�2)�#+,6(�+,*+�5&+22/*4$'7$6(5����62���:($45�2/'9(4(�(142//('�,1�&2//(*(�&203$4('�9,6+���3(4&(16($&+�2)�&244(5321',1*��/$&.5$1'��,53$1,&5�
�74,1*�6+(�3$56���:($45���6+(*$3�,1�+,*+�5&+22/�*4$'7$6,214$6(5�1$4429('�)24��/$&.5$1'�#+,6(5��9+,/(�6+(�*$3�,16+(,4�&2//(*(�$66(1'$1&(�4$6(5','�126����!+(4(�9$5�$1�,1;&4($5(�,1�6+(�+,*+�5&+22/*4$'7$6,21�4$6(�)24��/$&.5$1'�$�5/,*+6�'(&4($5(�)24#+,6(5����6�6+(�5$0(�6,0(�6+(4(�9$5�$1�,1&4($5(�,1
&2//(*(�(142//0(16�2)�+,*+5&+22/�*4$'7$6(5�)24�#+,6(5�%76�126�$�5,*1,),&$16�,1&4($5()24��/$&.5����24��,53$1,&5�6+(4(�9(4(�12�5,*1,),&$16&+$1*(5�,1�+,*+�5&+22/�*4$';7$6,21�4$6(5�24�&2//(*(�(142//;0(16�)24�6+(5(�*4$'7$6(5�
�24�:271*�0(1�$1'�920(1�6+(�3423246,215�2)�*4$'7$6(5(142//('�,1�&2//(*(�,1�����9(4(�126�56$6,56,&$//:�',))(4(16���$1'���3(4&(16��4(53(&;6,8(/:����!+(�4$6(�)24�920(1�+29(8(4��4(34(5(165�$1�,1;&4($5(�2)����3(4&(16$*(32,165�5,1&(�������9+,/(�6+(4$6(�)24�0(1�425(�21/:� �3(4;&(16$*(�32,165�
For Further Information ((����744(16��237/$6,21�(32465�� (4,(5���;��������������������������������������������������������������������� �����������������$1'�'(6$,/('�6$%/(521�6+(��16(41(6�5,6(�+663���999�&(1575�*28�3237/$6,21�999�52&'(02�5&+22/�+60/
�216$&6���25$/,1'�����4712�24�1'4($��744:��'7&$6,21�$1'� 2&,$/��� 64$6,),&$6,21��4$1&+��;���;� �4%4712�&(1575�*28$&744:�&(1575�*28

�
��
�
�
��
��
�
��
��
��
���
8.���������
��������
Andrea CurryJennifer C. Day
Figure 8-1.
Percent of People Who Have Completed High Schoolor College: Selected Years 1940 to 1996
��4"�-.��*!�+1"-��/+���4"�-.
�&$%�. %++(�$-�!0�/"�+-�)+-"
�� %"(+-�.�!"$-""�+-�)+-"
�&$%�. %++(�$-�!0�/"�+-�)+-"
�� %"(+-�.�!"$-""�+-�)+-"
���� ���� �� � ���� ���� ���� ���
(People 25 years old and over)
�+0- "���������0-"�0�+#�/%"��"*.0.���0--"*/��+,0(�/&+*��0-1"4�
20 U.S. Census Bureau, the Official StatisticsTM September 21, 1998
The United States’population is moreeducated than ever before.�&* "�/%"��0-"�0�+#�/%"�"*.0.�#&-./� +((" /"!�!�/�+*�"!0 �/&+*�(��//�&*)"*/�&*/%"������ "*.0.��"!0 �/&+*�(�//�&*)"*/��)+*$�/%"��)"-&5 �*�,"+,("�%�.�-&."*�.0�5./�*/&�((4����*���������&*��,"+,("������,"- "*/���4"�-.�+(!��*!�+1"-�%�!� +)5,("/"!�%&$%�. %++(�+-�)+-""!0 �/&+*���*!���&*������ ,"- "*/��%�!� +),("/"!��+-�)+-"�4"�-.�+#� +(("$"��&$0-"��5���
�4���� ��+1"-���&*���,"+,("������,"- "*/��%�!� +),("/"!��4"�-.�+#�%&$%�. %++(�+-)+-"���*!�+1"-���&*����� ,"- "*/��%�!� +),("/"!���+-)+-"�4"�-.�+#� +(("$"��
�%"�&* -"�."�&*�"!0 �/&+*�(�//�&*)"*/�+1"-�/%"�,�./%�(#5 "*/0-4�2�.�!0"�,-&)�-&(4/+�/%"�%&$%"-�"!0 �/&+*�(�//�&*)"*/�+#�4+0*$��!0(/.� +)�&*"!�2&/%�/%"��//-&/&+*�+#+(!"-��!0(/.�2%+�/4,& �((4�%�!
("..�#+-)�(�"!0 �/&+*����+-"3�),("���"/2""*�������*!��� ��/%"�,-+,+-/&+*�+#�,"+,("2%+�2"-"�%&$%�. %++(�$-�!05�/".�-+."�#-+)�����,"- "*/�/+����,"- "*/�#+-�/%+."���/+��4"�-.�+(!��*!�#-+)����,"- "*/�/+� ����,"- "*/�#+-/%+."� ��4"�-.�+(!��*!�+1"-�
Gender differences are de-creasing in educational at-tainment at the college level.�&./+-& �((4��"!0 �/&+*�(��//�&*5)"*/��"/2""*�)"*��*!2+)"*�!&##"-"!��/�/%"� +(("$"("1"(����*�������/%"�,"- "*/5�$".�+#�)"*��*!�2+)"*��4"�-.�+(!��*!�+1"-�2%+�%�! +),("/"!���+-�)+-"�4"�-.�+# +(("$"�2"-"�����,"- "*/��*!���,"- "*/��-".," /&1"(4��"/2""*�������*!��������+/%."3".�&* -"�."!�/%"&-� +(("$"�//�&*)"*/���0/�)"*�.�$�&*.2"-"�.&$*&#& �*/(4�$-"�/"-����*������/%"� +(("$"� +),("/&+*-�/".��)+*$�/%+."���4"�-.+(!��*!�+1"-�2"-"������,"-5 "*/�#+-�)"*��*!����,"- "*/#+-�2+)"*����&* "������
%+2"1"-��/%"� +(("$"�$�&*.�+#2+)"*�%�1"�+0/,� "!�/%+."+#�)"*��.+�/%�/��4���� ��/%",-+,+-/&+*.�+#�)"*��*!2+)"*���4"�-.�+(!��*!+1"-�2&/%���+-�)+-"�4"�-.�+# +(("$"�2"-"� ����*!����,"- "*/��-".," /&1"(4��&$0-"��5��
Blacks are makingsubstantial progress innarrowing the gap withWhites in obtaining a highschool diploma.�-�)�/& �$�&*.�&*�/%"�,-+,+-5/&+*�+#��(� '�./0!"*/.�+�/�&*5&*$���%&$%�. %++(�"!0 �/&+*%�1"�!&)&*&.%"!�/%"�%&./+-& �(5(4�(�-$"��(� '��%&/"�!&##"-5"* "����*�������+*(4�����,"-5 "*/�+#��(� '.��*!�+/%"--� ".���4"�-.�+(!��*!�+1"-%�!� +),("/"!�%&$%�. %++(� +),�-"!�2&/%� ���,"- "*/+#��%&/".���4���� ��%+2"1"-�����,"- "*/�+#��(� '.�+#/%"."��$".�%�!� +),("/"!%&$%�. %++(�� +),�-"!�2&/%����,"- "*/�+#��%&/".���

Figure 8-2.
Educational Attainment of People 25 Years Old and Over, bySex, Race, Hispanic Origin, and Age: March 1996
26$/
�$/(
�(0$/(
"+,6(
�/$&.
�6+(4�4$&(5
�,53$1,&�24,*,1�2)�$1:�4$&(�
���62��:($45
��62��:($45
��62���:($45
���62���:($45
���62� �:($45
��:($45�$1'�28(4
33.6 24.6 23.6 81.7
31.9 24.0 26.0 81.9
35.1 25.1 21.4 81.6
33.9 24.6 24.3 82.8
35.1 25.5 13.6 74.3
23.7 21.0 36.4 81.0
26.0 17.9 9.3 53.1
30.8 15.3 12.7 58.7
36.3 18.2 14.9 69.3
37.0 20.2 20.2 77.5
32.7 25.8 28.0 86.5
33.9 27.8 26.3 87.9
32.0 28.4 26.5 86.9
�,*+�5&+22/*4$'7$6(
�20(&2//(*(�12�'(*4((
�$&+(/24�5'(*4((�24�024(
26$/�+,*+�5&+22/*4$'7$6(5�24�024(
��1�3(4&(16�
�274&(���!�����74($7�2)�6+(��(1575���744(16��237/$6,21��748(:�
21U.S. Census Bureau, the Official StatisticsTM September 21, 1998
High school completionrates for young adult Blacksand Whites are similar.�1�������6+(�3423246,215�2)�/$&.5�$1'�"+,6(5����62���:($45�2/'�9,6+�$�+,*+�5&+22/',3/20$�9(4(�56$6,56,&$//:�6+(5$0(��$6������3(4&(16�$1'� ���3(4&(16��4(53(&6,8(/:���,0,/$4/:�)24�:271*�0(1��6+(4(9$5�12�56$6,56,&$/�',))(4(1&(�,16+(�3423246,215�2)��/$&.5�� ���3(4&(16��$1'�"+,6(5�����3(4&(16��9+2�+$'�&20;3/(6('�+,*+�5&+22/��#(6�$',))(4(1&(�,1�+,*+�5&+22/&203/(6,21�4$6(5�3(45,56('%(69((1�:271*��/$&.�920(1���62����:($45�2/'�����3(4&(16��$1'�6+(,4�"+,6(&2716(43$465�������3(4&(16����
Whites still have highercollege completion ratesthan Blacks.�/6+27*+�6+(�3423246,21�2)�/$&.5����:($45�2/'�$1'�28(49+2�&203/(6('�&2//(*(�+$5,1&4($5('�5,1&(������,1�����,6�9$5�56,//�21/:�$%276�21(;+$/)6+(�&244(5321',1*�3423246,21)24�"+,6(5������3(4&(16&203$4('�9,6+����3(4&(16��
�021*�:271*�$'7/65����62���:($45�2/'�,1��������/$&.59(4(�024(�6+$1�+$/)�$5�/,.(/:$5�"+,6(5������3(4&(16&203$4('�9,6+������3(4&(16�62�+$8(�&203/(6('��24�024(:($45�2)�&2//(*(��
Education levels are risingfor people of Hispanic origin(of any race).�021*��,53$1,&5����:($452/'�$1'�28(4������3(4&(16+$'�&203/(6('�+,*+�5&+22/�,1������73�'4$0$6,&$//:�)420����3(4&(16�,1��� ��9+(1�,53$1,&�24,*,1�'$6$�),456�9(4(&2//(&6('�����1�$'',6,21�&203/(6,21�2)�&2//(*(�5622'�$6���3(4&(16�)24��,53$1,&5�,1������$�5,*1,),&$16�,1&4($5()420�6+(�/(8(/�2)�����3(4&(16,1��� �
For Further Information�((����744(16��237/$6,21�(32465���(4,(5����;������������������ ��������
��� ����� �������������
�!3'$6(��
�216$&6��(11,)(4�����$:�24�1'4($��744:�'7&$6,21�$1'��2&,$/����64$6,),&$6,21��4$1&+��;� ;��-'$:�&(1575�*28$&744:�&(1575�*28

9.������������ �������������
Jennifer C. DayKristine M. Witkowski
Figure 9-1.
Average Postsecondary Schooling Costs, by SelectedCharacteristics: 1993–94 School Year
�--�345%&/43
�"-&�&."-&
Sex
Race/ethnicity
Annual family income
Dependency status
Enrollment level
!)*4&��/04��*31"/*$
�-"$,��/04��*31"/*$
�*31"/*$��0'�"/9�2"$&�
�4)&2�2"$&3��/04��*31"/*$
�&33�4)"/��������
��������40�������
��������02�.02&
�&1&/%&/4
�/%&1&/%&/4
�0--&(&�9&"2����34�02��/%
�0--&(&�9&"2���2%�02�4)
�0--&(&�9&"2����4)�02�)*()&2
0$"4*0/"-��4&$)/*$"-��#53*/&33�3$)00-��02�04)&2
����
������
�����
��� �
������
�����
����������
�����
�����
����
����
�����
������
����
���
�����
���� �
�5--�4*.&��'5--�9&"2
�"24�4*.&�02�1"24�9&"2
Enrollment pattern
�052$&���������52&"5�0'�4)&��&/353���526&9�0'��/$0.&�"/%�20(2".��"24*$*1"4*0/�
22 U.S. Census Bureau, the Official StatisticsTM September 21, 1998
About 20.5 m illion peoplewere enrolled in a postsecondary school duringthe 1993-94 school year.�#054���1&2$&/4�0'�)*()3$)00-�(2"%5"4&3�� �9&"230-%�"/%�06&2��02������.*--*0/345%&/43��7&2&�&/20--&%�*/�"10343&$0/%"29�3$)00-�"430.&�10*/4�%52*/(�4)&���:��3$)00-�9&"2�����.0/(4)&3&�345%&/43��+534�5/%&2�)"-'���1&2$&/4��7&2&�&/20--&%�'5--4*.&�'02�"4�-&"34���.0/4)3�0'4)&�12&6*053�9&"2����)&�2&:."*/*/(����1&2$&/4�7&2&&/20--&%�1"24�4*.&�02�'02�1"24�0'
���)*3�*/$-5%&%�'5--:4*.&�"/%1"24:4*.&�345%&/43��345%&/437)0�400,�0/&�$0523&�02�7&2&&/20--&%�%52*/(�0/&�3&.&34&2�"3�7&--�"3�4)03&�7)0�%2011&%054�#&'02&�$0.1-&4*/("�3&.&34&2�
4)&�9&"2����'�"--�345%&/43��1&2$&/4�7&2&�&/20--&%�*/�4)&'*234�02�3&$0/%�9&"2�0'�$0--&(&�*/$-5%&3��:�"/%�:9&"2�$0-:-&(&3������1&2$&/4�7&2&�&/:20--&%�*/�4)&�4)*2%�02�'0524)�9&"20'�$0--&(&�����1&2$&/4�7&2&&/20--&%�*/�4)&�'*'4)�9&"2�0'$0--&(&�02�)*()&2��"/%���1&2$&/4�7&2&�&/20--&%*/�"�/0/$0--&(*"4&�1034:3&$0/%"29�3$)00-������
���)&�1201024*0/3�0'�345%&/43&/20--&%�*/�4)&�'*'4)�9&"20'�$0--&(&�02�)*()&2�"/%�*/"�/0/$0--&(*"4&�10343&$0/%:"29�3$)00-�7&2&�/04�3*(/*'*:$"/4-9�%*''&2&/4�
Postsecondary studentspaid an average of $2,919during the 1993-94 schoolyear for their schooling. 3 �45%&/43�&/20--&%�'5--�4*.&�)"%)*()&2�"6&2"(&�404"-�$0343��������0'�3$)00-*/(��4)"/1"24:4*.&�345%&/43�����������*(52&��:������$)00-*/(�$0343"-30�6"2*&%�'20.�������'02/0/$0--&(*"4&�10343&$0/%"293$)00-3��35$)�"3�60$"4*0/"-�4&$)/*$"-��"/%�#53*/&333$)00-3��40���� �'02�345:%&/43�*/�4)&*2�4)*2%�02�'0524)9&"2�0'�$0--&(&����.0/(�2"$&"/%�&4)/*$�(20513���*31"/*$3
��)&�$034�0'�3$)00-*/(�*/:$-5%&%�45*4*0/�"/%�'&&3��4&84:#00,3�"/%�&%5$"4*0/"-�351:1-*&3��"/%�200.�"/%�#0"2%��*'"11-*$"#-&��

Figure 9-2.
Recipients of Financial Aid, by Selected Characteristics: 1993–94 School Year
$/<-/8>90�+66
=>?./8>=
"?7,/<�90</-3:3/8>=
��8�>29?=+8.=�
"9>/���D&�#���</0/<=�>9�&?::6/7/8>+6��.?-+>398+6�#::9<>?83>C��<+8>��D)��$��</0/<=�>9��)/>/<E+8=���.?-+>398+6��==3=>+8-/�$<91<+7=�
��� �
�����
�����
����
�����
�����
����
�����
&9?<-/���(�&���?</+?�90�>2/��/8=?=��&?<@/C�90��8-97/�+8.�$<91<+7�$+<>3-3:+>398�
�66�=9?<-/=
�7:69C/<�+==3=>+8-/
9+8
$/66��<+8>
&�#���966/1/�A9<5�=>?.C
�/669A=23:�=-296+<=23:
����366�)��$
����
����
����
�����
����
����
���
� �
#>2/<
��
�
�
�
�
�
�
!/+8�+79?8>�</-/3@/.&9?<-/90�+3.
23U.S. Census Bureau, the Official StatisticsTM September 21, 1998
�90�+8C�<+-/��2+.�>2/�69A/=>+@/<+1/�>9>+6�-9=>=����� ����
Dependent students paymore for schooling thanindependent students. �/:/8./8>�=>?./8>=��>29=/=>366�-98=3./</.�>9�,/�:+<>�90>2/�0+736C�38�A23-2�>2/C�1</A?:��:+3.�+�>9>+6�90�+,9?>� � ��09<�=-2996381�.?<381>2/����E� �C/+<���#8�>2/9>2/<�2+8.��38./:/8./8>=>?./8>=���>29=/�6/==�/-9897E3-+66C�>3/.�>9�>2/3<�9<3138+60+736C��:+3.�+�>9>+6�90�+,9?>����������/:/8./8>�=>?./8>=A/</�79</�635/6C�>9�+>>/8.=-2996�0?66�>37/�>2+8
�%/0/</8-/=�>9�*23>/���6+-5�+8.�9>2/<�<+-/=�</0/<�>9�>2/�898E�3=:+83-�:9<>398�90�>2/=/�1<9?:=�
��&>?./8>=�A/</�-6+==303/.�+=38./:/8./8>�30�>2/C�A/</�7+<E<3/.��� �C/+<=�96.�9<�9@/<��+@/>/<+8��>2/�</0/</8-/�:/<=9890�>2/�29?=/296.��9<�30�>2/C2+.�2/+6>2�38=?<+8-/�38�>2/3<9A8�8+7/�
38./:/8./8>�=>?./8>=����:/<-/8>�@/<=?=�� �:/<-/8>���
Over half of postsecondaryschool students receivesome kind of financial aid.#@/<�2+60�����:/<-/8>��90�>2/����7366398�:9=>=/-98.+<C=>?./8>=�</-/3@/.�=97/�538.90�038+8-3+6�+==3=>+8-/�.?<381>2/����E� �=-2996�C/+<��31?</��E�����#8�+@/<+1/��+=>?./8>�</-/3@/.���� ��:/<C/+<��-9@/<381�>2<//E09?<>2=����:/<-/8>��90�>2/�=>?./8>�=>9>+6�/B:/8=/=�
'2/�+@/<+1/�+79?8>�90�+3.+6=9�@+<3/.�,C�:+>>/<8�+8.6/@/6�90�/8<9667/8>����?66E>37/=>?./8>=�</-/3@/.�79</�038+8E-3+6�+3.�>2+8�:+<>E>37/�=>?E./8>=��+@/<+1381�� � ��@/<=?=������������8�+@/<+1/90���� ��38�+3.�A+=�</:9<>/.,C�:/9:6/�/8<966/.�38�898E-966/13+>/�38=>3>?>398=�-97:+</.�A3>2������,C03<=>E�9<�=/-98.EC/+<�=>?./8>=������ �,C�>23<.E�9<�09?<>2EC/+<=>?./8>=��+8.�� �����,C030>2EC/+<E9<E2312/<�=>?./8>=�
Loans and employerassistance are the mostcommon sources offinancial aid.!9</�=>?./8>=�/8<966/.�38:9=>=/-98.+<C�=-2996�</E-/3@/.�038+8-3+6�+3.�0<97�69+8=�������=>?./8>=��+8./7:69C/<�+==3=>+8-/�����������'2/�6+<1/=>+@/<+1/�+3.�+79?8>=�A/</:<9@3./.�,C�69+8=��������+8.�0/669A=23:=�=-296+<=23:=���������89>�=318303-+8>6C.300/</8>�0<97�/+-2�9>2/<��'2/�=7+66/=>�+@/<+1/�+3.+79?8>�A+=�0<97�&�#��9<-966/1/�A9<5E=>?.C�:<91<+7=�������
�?66E>37/�=>?./8>=�+-;?3</.038+8-3+6�+3.�79=>6C�0<97�69+8=�+@/<+1381���� ������9<�:+<>E>37/�=>?./8>=��>2/�79=>�-97E798�=9?<-/�90�038+8-3+6�+3.A+=�/7:69C//�+==3=>+8-/��+@/<+1381���� ��
��'2/�8?7,/<�90�=>?./8>=</-/3@381�69+8=�+8.�/7:69C//+==3=>+8-/�.3.�89>�.300/<=318303-+8>6C�
The lower the family in-come, the higher the pro-portion of postsecondarystudents receiving aid.�7981�:9=>=/-98.+<C=>?./8>=�A3>2�+�D69A��+88?+60+736C�38-97/��,/69A����������:/<-/8>�</-/3@/.+==3=>+8-/��-9@/<381���:/<E-/8>�90�>2/3<�=-2996381�-9=>=�'2/�+@/<+1/�+79?8>�90+3.�A+=��������09<�>2/=/=>?./8>=���$/66��<+8>=�A23-2�+</�8//.E,+=/.�A/</�>2/�79=>�-97798=9?<-/�90�+3.�09<�=>?./8>=�3869AE38-97/�0+7363/=�
�8�-97:+<3=98�� ��:/<-/8>90�:9=>=/-98.+<C�=>?./8>=A3>2�+�D2312���+88?+6�0+736C38-97/������9<�79</�</-/3@/.�+3.��-9@/<381�� :/<-/8>�90�>2/�=>?./8>=��-9=>=�'2/�+@/<+1/�+79?8>�90�+3.A+=��������09<�>2/=/�=>?E./8>=����7:69C/<�+==3=>+8-/A+=�>2/�79=>�-97798�=9?<-/90�+3.�09<�=>?./8>=�38�2312E38-97/�0+7363/=�
Although a higherproportion of Blackstudents receive aid thanWhite students, Blackstudents receive a smalleramount than theirWhite counterparts.�,9?>���:/<-/8>�90��6+-5=>?./8>=�</-/3@/.�+3.�-97:+</.�A3>2�� �:/<-/8>�90*23>/�=>?./8>=���*23>/�=>?E./8>=��29A/@/<��</-/3@/.�+6+<1/<�.966+<�+79?8>�90�+3.��98+@/<+1/��>2+8��6+-5�=>?./8>=���� ��+8.���������</=:/-E>3@/6C���&>?./8>=�90�9>2/<�<+-/=</-/3@/.�+8�+@/<+1/�90� ����38�+3.���$/66��<+8>=A/</�>2/�7+38�=9?<-/�90038+8-3+6�+3.�09<��6+-5�=>?E./8>=����9<�*23>/�=>?./8>=��>2/79=>�-97798�=9?<-/�90�+3.A+=�/7:69C/<�+==3=>+8-/�
For Further Information&//����?<</8>�$9:?6+>398%/:9<>=��&/<3/=�$�E�������� ��������������������� ������������������������������� �������������������
�98>+->��/8830/<�����+C�.?-+>398�+8.�&9-3+6���&><+>303-+>398��<+8-2��E ��E� � 4.+C�-/8=?=�19@

1970 1980 1990 1996
10.�� �������
����������
Arlene F. Saluter
Figure 10-1.
Household Composition: 1978 to 1996��"- "*/�+#��((�%+0."%+(!.�
Married couples with children
Married couples without children
Other families with children
Other families without children
People living alone
Other nonfamily households
40.3 30.9 26.3 25.0
30.3
29.9
29.8 28.8
5.0
7.58.3
9.3
5.6
5.46.5 6.8
17.1
22.7 24.625.0
1.7 3.6 4.6 5.1
Family households
Nonfamily households
�+0- "���������0-"�0�+#�/%"��"*.0.���0--"*/��+,0(�/&+*��0-1"4�
81.2 73.7 70.8 69.9Percent family households
of all households
24 U.S. Census Bureau, the Official StatisticsTM September 21, 1998
Households are increasingat a slower pace.�*�������/%"-"�2"-"�����)&((&+*�%+0."%+(!.�&*�/%"�*&/"!��/�/".��0,�#-+)���)&((&+*�&*��������&* "������%+2"1"-��/%"�-�/"�+#�&* -"�."%�.�.(+2"!����"/2""*������*!��� ���/%"�*0)�"-�+#%+0."%+(!.�&* -"�."!��4��*�1"-�$"�+#�����)&((&+*�,"-4"�-����0-&*$�/%"��� �.�$-+2/%�.(+2"!�/+���+0/���)&((&+*�%+0."%+(!.�,"-�4"�-��*!�/%0.�#�-�&*�/%"�����.��&/%�.�.(+2"!�"1"*�#0-/%"-�/+��+0/�����)&((&+*�%+0."%+(!.,"-�4"�-�
�%"�/"-)�6%+0."%+(!��-"#"-./+�/%"�,"+,("�+ 0,4&*$��%+0.&*$�0*&/��-�/%"-�/%�*�/%",%4.& �(�./-0 /0-"�&*�2%& %/%"4�(&1"����+0."%+(!.�"3%&�&/!&1"-.&/4�&*�/%"&-� +),+.&/&+*��%"�/2+�)�'+-�/4,".�+#�%+0."7%+(!.��-"�6#�)&(4���*!
6*+*#�)&(4������#�)&(4�%+0."7%+(!�&.� +),+."!�+#��/�("�.//2+�,"+,("�-"(�/"!��4��&-/%�)�--&�$"��+-��!+,/&+*����*+*#�)&(4�%+0."%+(!�&.�"&/%"-��,"-.+*�(&1&*$��(+*"�+-��%+0."%+(!"-�2%+�&.�*+/�-"7(�/"!�/+��*4�+#�/%"�+/%"-,"+,("�.%�-&*$�/%"�%+)"��
The composition ofhouseholds haschanged significantly.�%"-"�2"-"������)&((&+*�#�)&(4%+0."%+(!.�&*����������)&(&"./-�!&/&+*�((4�� +0*/"!�#+-��(�-$"�)�'+-&/4�+#��((�%+0."7%+(!.���0/�/%"&-�,-+,+-/&+*�+#/%"�/+/�(�2�.�.&$*&#& �*/(4(+2"-�&*������/%�*�&*�/%"�,�./��%"�.%�-"�+#�%+0."%+(!.-",-"."*/"!��4�#�)&(&".�#"((#-+)���+0/� ��,"- "*/�&*�����/+����,"- "*/�&*��������&$0-"��7������%0.�#�-�&*�/%"�����.�/%&.�,-+,+-/&+*�%�.�./��&(&5"!����,"- "*/�&*����������"..
/%�*�%�(#�+#��((�#�)&(&".�%�1"/%"&-�+2*� %&(!-"*�0*!"-��$"� �(&1&*$��/�%+)"�� +),�-"!2&/%���,"- "*/�&*�������
��)&(&".��-"�.0�!&1&!"!�&*/+/%+."�)�&*/�&*"!��4���)�-7-&"!� +0,("��*!�6�/%"-�#�)&7(&".��)�&*/�&*"!��4�)"*�+-2+)"*�2&/%�*+�.,+0."�,-".7"*/���6�/%"-�#�)&(&".��)�4&* (0!"�.&*$("7,�-"*/�#�)&(&".�+-��*4� +)�&*�/&+*�+#-"(�/&1".���0/�*+�.,+0."�+#/%"�%+0."%+(!"-�
�+*#�)&(4�%+0."%+(!.�*0)7�"-"!���)&((&+*�&*������ +),�-"!�2&/%������)&((&+*&*���������0-&*$�/%&.���74"�-,"-&+!��/%"�,-+,+-/&+*�+#��((%+0."%+(!.�/%�/�2"-"�*+*7#�)&(4�%+0."%+(!.� (&)�"!#-+)����,"- "*/�/+���,"- "*/��(/%+0$%�*+*#�)&(&".�� 7 +0*/"!�#+-��+#�"1"-4���%+0."%+(!.�&*�������/%"�-�/"+#�&* -"�."�&*�/%"�*0)�"-�+#

Figure 10-2.
Households, by Size: 1970 to 1996����
�� �
����
����(Percent of all households)
��-/���.#-.*#
��-/��.#-.*#
�-/�+-/#�.#-.*#
���
����
���
����
����
���
����
����
���
���
��
���
�-2/!#���������2/#�2�-$�1&#��#,020���2//#,1��-.2*�1'-,��2/3#5�
25U.S. Census Bureau, the Official StatisticsTM September 21, 1998
1&'0�15.#�-$�&-20#&-*"&�0�0*-4#"�0'%,'$'!�,1*5�',/#!#,1�5#�/0�
�&#�3�01�+�(-/'15�-$�,-,$�+'*5&-20#&-*"0��/#�-,#7.#/0-,&-20#&-*"0���� -21� ��.#/7!#,1�-$�,-,$�+'*5�&-20#&-*"0',������4#/#�!-+.-0#"�-$.#-.*#�*'3',%��*-,#����0�4'1&,-,$�+'*5�&-20#&-*"0�-3#/�**�1&#�,2+ #/�-$�-,#7.#/0-,&-20#&-*"0�',!/#�0#"��1��+2!&�&'%&#/�/�1#�',�1&#�����01&�,�'1�&�0�',�1&#�5#�/0�0',!#�
The decline inaverage household sizehas stopped.�&#��3#/�%#�,2+ #/�-$.#-.*#�.#/�&-20#&-*""#!*',#"�0'%,'$'!�,1*5�"2/',%1&#�"#!�"#0�-$�1&#�����0��,"�� �0� 21�&�0�,-1�!&�,%#"0',!#���������,�������1&#/#4#/#�����.#-.*#�.#/&-20#&-*"��$�**',%�1-�����.#-.*#�',��� ���4'1&���$2/1&#/"#!*',#�1-������.#-.*#�',��������-�0'%,'$'!�,1�!&�,%#&�0� ##,�,-1#"�0',!#�������0�1&#��3#/�%#�0'6#�.#/&-20#&-*"�01--"��1����.#-.*#�',��������
��/%#�&-20#&-*"0�&�3#� #7!-+#�+2!&�*#00�!-++-,��&#�./-.-/1'-,�-$�&-20#&-*"04'1&�$'3#�-/�+-/#�.#-.*#�4�0���.#/!#,1�',�������!-+.�/#"4'1&����.#/!#,1�',�������'%2/#���7���
�#"'2+70'6#"�&-20#&-*"0!-+.-0#"�-$�1&/##�-/�$-2/.#-.*#��!!-2,1#"�$-/�� -21-,#71&'/"�-$�&-20#&-*"0�', -1&�������,"���������',�**5�1&#�0+�**#01�&-20#&-*"0�4'1&-,*5�-,#�-/�14-�.#-.*#�',7!/#�0#"�1&#'/�0&�/#�-$�1&#�1-1�*$/-+���.#/!#,1�',������1- �.#/!#,1�',������
The number of single par-ents continues to grow.�&#�,2+ #/�-$�0',%*#�.�/#,104'1&�-4,�!&'*"/#,�2,"#/�� 5#�/0�*'3',%�4'1&�1&#+�1/'.*#"$/-+��� �+'**'-,�',������1-�����+'**'-,�',��������&#%/-41&�/�1#�',�1&#'/�,2+ #/4�0�%/#�1#01�"2/',%�1&#�����0�� -21�����.#/!#,1�.#/�5#�/��1&#,�0*-4#"�1-����.#/!#,1.#/�5#�/�"2/',%�1&#��� �0��&20�$�/�"2/',%�1&#�����0�1&#�/�1#�'0�����.#/!#,1�.#/5#�/��,-1�0'%,'$'!�,1*5�"'$$#/#,1$/-+�1&#��� �0�/�1#���
� -21��� �+'**'-,��-/����.#/7!#,1�-$��**�0',%*#�.�/#,10��4#/#�&'1#�',������� 21�1&#�',!'7"#,!#�-$�-,#7.�/#,1�0'12�1'-,0'0�+2!&�&'%&#/��+-,%��*�!)01&�,��+-,%��&'1#0����',%*#.�/#,10��!!-2,1#"�$-/��*+-0114-71&'/"0����.#/!#,1��-$��**�*�!)�$�+'*5�%/-2.0�4'1&!&'*"/#,�./#0#,1���-,#7��,"14-7.�/#,1�0'12�1'-,0�!-+7 ',#"���!-+.�/#"�4'1&���.#/!#,1��+-,%��&'1#0��
�-1&#/0��!!-2,1#"�$-/�1�01�+�(-/'15�-$�0',%*#�.�/#,10��,�������1&#/#�4#/#�� -21����+'**'-,�0',%*#�+-1&#/0�3#/020����+'**'-,�0',%*#�$�1&#/0��&'*#�0',%*#�+-1&#/0�/#./#70#,1#"� �.#/!#,1�-$�0',%*#.�/#,10�',�������1&'0�./-.-/71'-,�&�0�"#!*',#"�$/-+� �.#/!#,1�',�������,"����.#/7!#,1�',��� ���,"������
�-01�0',%*#�.�/#,10�#'1&#/�&�",#3#/� ##,�+�//'#"�-/�4#/#!2//#,1*5�"'3-/!#"����,������
����+'*5�%/-2.0�4'1&�!&'*"/#,�/#��**�$�+'*'#0��,"�02 $�+'7*'#0�+�',1�',#"� 5�+�//'#"!-2.*#0�-/�0',%*#�.�/#,10�4'1&�1�*#�01�-,#�-4,�!&'*"�2,"#/� �5#�/0�-*"�*'3',%�4'1&�1&#+�
���.#/!#,1�-$�0',%*#�.�/#,104#/#�,#3#/�+�//'#"���,"���.#/!#,1�4#/#�"'3-/!#"���#�14-�!�1#%-/'#0!-+ ',#"��!!-2,1#"�$-/���-$#3#/5��0',%*#�.�/#,10���&#�/#+�',"#/�4#/#�#'1&#/+�//'#"� 21�,-1�*'3',%�4'1&1&#'/�0.-20#�����.#/!#,1��-/4'"-4#"���.#/!#,1��
For Further Information�##����2//#,1��-.2*�1'-,�#.-/10���#/'#0����7���������� ��� ������������������������������������ �����
�-,1�!1��#/1'*'15��,"���+'*5����1�1'01'!0��/�,!&���7�7��+-!-,,#**�!#,020�%-3

���� ���� ��� ���� ��� �� � �� � �� �� � �� ���� ���� ��� ����
11.�� ����������������� ���������
Terry A. Lugaila
Figure 11-1.
Estimated Median Age at FirstMarriage, by Sex: 1970 to 1996
���2 �+,
�).+� ���������.+ �.�)!�-# �� (,.,���.++ (-��)*.&�-$)(��.+/ 2�
���2 �+,
��2 �+,
���2 �+,
Men
Women
� �2 �+,
���2 �+,
����
���
����
��
26 U.S. Census Bureau, the Official StatisticsTM September 21, 1998
Men and women are marry-ing later than ever before.�# � ,-$'�- ��' �$�(��" ��-!$+,-�'�++$�" �$,�#$"# +�-#�( / +�� !)+ ����(�������-# ' �$�(��" ��-�!$+,-�'�++$�" 0�,������2 �+,�!)+�' (��(��� �2 �+,�!)+�0)' (��**+)1$'�- &2��2 �+,�#$"# +-#�(�-# �' �$�(��" �$(�����������2 �+,�!)+�' (��(����� 2 �+,�!)+�0)' (����$".+ ��3����
�()-# +�$(�$��-$)(�)!�� &�2 �'�++$�" �0�,�-# �,$"($!$��(-$(�+ �, �$(�-# �*+)*)+-$)(,�)!2).("���.&-,�0#)�#���()-�2 -'�++$ �����$(� �������-# *+)*)+-$)(,�)!�' (��(�0)' (�0#)�#���( / +�'�+3+$ ��#�/ ��-�& �,-��).�& ��(��$(�,)' ���, ,�-+$*& ��!)+-# ��" �"+).*,�� -0 (���(���2 �+,����)+� 1�'*& �� -0 (�������(��������-# *+)*)+-$)(�)!�* )*& ����-)��2 �+,�)&��0#)�#���( / +'�++$ ��-+$*& ��!+)'���* +� (--)����* +� (-�!)+�0)' (��(�!+)'���* +� (-�-)����* +� (-!)+�' (����$% 0$, ���')("
-#), ���-)����2 �+,�)&���-# *+)*)+-$)(,�( / +�'�++$ �-+$*& ��!+)'��* +� (-�-)���* +� (-�!)+�0)' (��(��!+)'��* +� (-�-)����* +� (-�!)+�' (�
Nearly 1 in every 8 adultslives alone. �(�����������'$&&$)(�* )*& �)+����* +� (-�)!��&&���.&-,�&$/ ���&)( ����#$& �0)' (���).(- ��!)+�-# �&�+" +�,#�+ )!�* )*& �&$/$("��&)( ����)!�����-# �(.'� +�)!�' (�&$/$("�&)( �$(�+ �, ���-���!�,- +*�� ���� -0 (�������(�������-# �(.'� +�)!�0)' (&$/$("��&)( ��).�& ��!+)'����'$&&$)(�-)�����'$&&$)(��0#$& -# �(.'� +�)!�' (�&$/$("�&)( �-+$*& ��!+)'����'$&&$)(-)������'$&&$)(�
�$/$("��&)( �0�,�')+ �)'')(��')("�-# � &� +&2� ,* �$�&&2��')("�0)' (���!���.&-,�.(� +���2 �+,�)&��)(&2��* +� (-�)!�0)' (�(����* +� (-�)!�' (�&$/ ��&)( �$(���������)+�* )*& ��2 �+,�)&���(��)/ +��-# �*+)3*)+-$)(�&$/$("��&)( �0�,
��* +� (-�!)+�0)' (��(����* +� (-�!)+�' (���$".+ ���3����
�$(� �������-# + �#�,�� (()�,$"($!$��(-��#�(" �$(�-# *+)*)+-$)(�)!� &� +&2�' (�$(-#$,��" �"+).*�&$/$("��&)( �!+)'����* +� (-�-)����* +3� (-���0#$& �-# �*+)*)+-$)(�)! &� +&2�0)' (�&$/$("��&)( #�,�"+)0(�,.�,-�(-$�&&2��!+)'���* +� (-�-)���* +� (-��
Unmarried-couple house-holds have increased nearlysevenfold since 1970. �(�.('�++$ �3�).*& �#)., 3#)&��$,��)'*), ��)!�-0).(+ &�- ����.&-,�)!�-# �)**)3,$- �, 1��)( �)!�0#)'�$,�-# #)., #)&� +��0#)�,#�+ ��#).,$("�.($-�0$-#�)+�0$-#).--# �*+ , (� �)!��#$&�+ (.(� +���2 �+,�)&�����# �).(-�)!�.('�++$ �3�).*& #)., #)&�,�$,�$(- (� ��'�$(&2-)� ,-$'�- �-# �(.'� +�)!�)#��$-$("��).*& ,���.-�$-�'�2�&,)�$(�&.� �#)., #)&�,�0$-#��+))''�- ���)�+� +��)+�*�$� '*&)2 �)!�-# �)**),$- �, 1�

Figure 11-2.
Percent of Adults Living Alone, by Age and Sex: 1970 and 1996
Men
��3"�-.�*!�+1"-
��/+���3"�-.
�/+���3"�-.
��/+��3"�-.
�+)"*
��������
��/+���3"�-.
�
��
��
��
��
��
�
�
�
��
��
�
��
��
�
��
�
�
�
�+0- "���������0-"�0�+#�/%"��"*.0.���0--"*/��+,0(�/&+*��0-1"3�
27U.S. Census Bureau, the Official StatisticsTM September 21, 1998
�"/2""*�������*!�������/%"*0)�"-�+#�0*)�--&"!4 +0,("%+0."%+(!.�'0),"!�#-+)�������/+����)&((&+*����%"-"2"-"���0*)�--&"!� +0,(".�#+-"1"-3�����)�--&"!� +0,(".�&*������ +),�-"!�2&/%���+0/��#+-�"1"-3�����&*����������+0/+*"4/%&-!�+#�/%"."�0*)�--&"! +0,(".�&*������%�!� %&(!-"*0*!"-���3"�-.�+(!�,-"."*/�&*/%"�%+)"�
The number of childrenliving with never-marriedparents is on the rise. �%&(!-"*�(&1&*$�2&/%�+*"�,�-"*/���� �)&((&+*��-",-"."*/"!�� ,"- "*/�+#��((� %&(!-"*�0*!"-� �3"�-.�+(!�&*�������0,�#-+)���,"- "*/�&*���������%")�'+-&/3�(&1"!�2&/%�/%"&-�)+/%"-��0/��*�&* -"�.&*$�,-+,+-/&+*(&1"!�2&/%�/%"&-�#�/%"-����*��������,"- "*/�+#�/%"� %&(!-"*�&*��+*"4,�-"*/�.&/0�/&+*�(&1"!�2&/%/%"&-�#�/%"-��0,�#-+)���,"- "*/&*������
�#�/%"� %&(!-"*�2%+�(&1"!�2&/%+*"�,�-"*/��/%"�,-+,+-/&+*2%+�(&1"!�2&/%���*"1"-4)�--&"!,�-"*/��$-"2�#-+)����,"- "*//+����,"- "*/��"/2""*��� ��*!�������2%&("�/%"�,-+,+-/&+*2%+�(&1"!�2&/%���!&1+- "!,�-"*/�!" (&*"!�#-+)��,"- "*/�/+����,"- "*/����%",-+,+-/&+*�+#� %&(!-"*�(&1&*$2&/%���.",�-�/"!�,�-"*/�!"4 -"�."!�#-+)����,"- "*/�/+�� ,"- "*/��"/2""*��� ���*!�������*!�/%"�,-+,+-/&+*(&1&*$�2&/%���2&!+2"!�,�-"*/#"((�#-+)���,"- "*/�/+��,"-4 "*/�
For Further Information�""����0--"*/��+,0(�/&+*�",+-/.���"-&".����4����������������������� ���� �������������������
�+*/� /��"--3�����0$�&(��"-/&(&/3��*!���)&(3����/�/&./& .��-�* %���4�4��/(0$�&(�� "*.0.�$+1
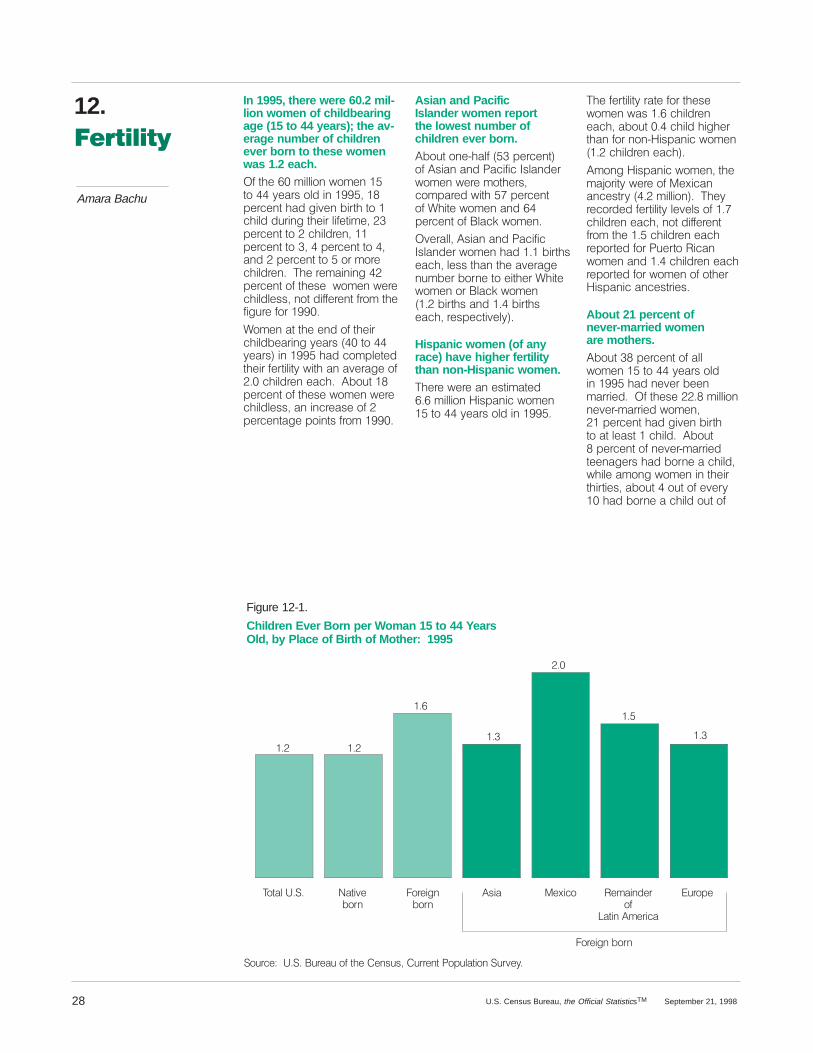
12.���������
Amara Bachu
Figure 12-1.
Children Ever Born per Woman 15 to 44 YearsOld, by Place of Birth of Mother: 1995
�/3!,����� �!3)5%"/1.
�/1%)'."/1.
�2)! �%7)#/ �%-!).$%1/&
�!3).��-%1)#!
�41/0%
��� ���
���
���
���
��
���
�/41#%���������41%!4�/&�3(%��%.242���411%.3��/04,!3)/.��415%8�
�/1%)'.�"/1.
28 U.S. Census Bureau, the Official StatisticsTM September 21, 1998
In 1995, there were 60.2 mil-lion women of childbearingage (15 to 44 years); the av-erage number of childrenever born to these womenwas 1.2 each.�&�3(%����-),,)/.�6/-%.��3/��8%!12�/,$�).������� 0%1#%.3�(!$�')5%.�")13(�3/��#(),$�$41).'�3(%)1�,)&%3)-%����0%1#%.3�3/���#(),$1%.����0%1#%.3�3/�����0%1#%.3�3/��!.$���0%1#%.3�3/��/1�-/1%#(),$1%.����(%�1%-!).).'��0%1#%.3�/&�3(%2%��6/-%.�6%1%#(),$,%22��./3�$)&&%1%.3�&1/-�3(%&)'41%�&/1�������
/-%.�!3�3(%�%.$�/&�3(%)1#(),$"%!1).'�8%!12����3/�8%!12��).�����(!$�#/-0,%3%$3(%)1�&%13),)38�6)3(�!.�!5%1!'%�/&����#(),$1%.�%!#(����"/43�� 0%1#%.3�/&�3(%2%�6/-%.�6%1%#(),$,%22��!.�).#1%!2%�/&��0%1#%.3!'%�0/).32�&1/-������
Asian and PacificIslander women reportthe lowest number ofchildren ever born.�"/43�/.%9(!,&����0%1#%.3�/&��2)!.�!.$��!#)&)#��2,!.$%16/-%.�6%1%�-/3(%12�#/-0!1%$�6)3(���0%1#%.3/&� ()3%�6/-%.�!.$��0%1#%.3�/&��,!#+�6/-%.�
�5%1!,,���2)!.�!.$��!#)&)#�2,!.$%1�6/-%.�(!$�����")13(2%!#(��,%22�3(!.�3(%�!5%1!'%.4-"%1�"/1.%�3/�%)3(%1� ()3%6/-%.�/1��,!#+�6/-%.�����")13(2�!.$����")13(2%!#(��1%20%#3)5%,8��
Hispanic women (of anyrace) have higher fert ilitythan non-Hispanic women.�(%1%�6%1%�!.�%23)-!3%$����-),,)/.��)20!.)#�6/-%.��3/��8%!12�/,$�).�����
�(%�&%13),)38�1!3%�&/1�3(%2%6/-%.�6!2�����#(),$1%.%!#(��!"/43����#(),$�()'(%13(!.�&/1�./.9�)20!.)#�6/-%.�����#(),$1%.�%!#(��
�-/.'��)20!.)#�6/-%.��3(%-!*/1)38�6%1%�/&��%7)#!.!.#%2318�����-),,)/.�����(%81%#/1$%$�&%13),)38�,%5%,2�/&����#(),$1%.�%!#(��./3�$)&&%1%.3&1/-�3(%����#(),$1%.�%!#(1%0/13%$�&/1��4%13/��)#!.6/-%.�!.$����#(),$1%.�%!#(1%0/13%$�&/1�6/-%.�/&�/3(%1�)20!.)#�!.#%231)%2�
About 21 percent ofnever-married womenare mothers.�"/43�� �0%1#%.3�/&�!,,6/-%.���3/��8%!12�/,$).�����(!$�.%5%1�"%%.-!11)%$����&�3(%2%���� �-),,)/..%5%19-!11)%$�6/-%.����0%1#%.3�(!$�')5%.�")13(3/�!3�,%!23���#(),$����"/43 �0%1#%.3�/&�.%5%19-!11)%$3%%.!'%12�(!$�"/1.%�!�#(),$�6(),%�!-/.'�6/-%.�).�3(%)13()13)%2��!"/43��/43�/&�%5%18���(!$�"/1.%�!�#(),$�/43�/&

Figure 12-2.
Labor Force Participation Rates for Women by Age andWhether They Had a Child in the Last Year: 1995
���2.��7%!01 ���2.����7%!01 ���2.���7%!01 ���2.����7%!01 ��2.��7%!01
��-�/%0#%-2�
����
���
���
� ��
����
�.30#%���������30%!3�.&�2(%��%-131���300%-2��./3+!2).-��304%7�
��
��
��� ��� ��
�)02(�)-�+!12�7%!0
�.�")02(�+!12�7%!0
29U.S. Census Bureau, the Official StatisticsTM September 21, 1998
5%$+.#*����%11�2(!-���)-��-%4%08,!00)%$��+!#*�5.,%-(!$�!�"!"7��#.,/!0%$�5)2(��)-���)1/!-)#�5.,%-�!-$��)-��� ()2%�5.,%-�
Fertility of foreign-bornwomen is higher than thatof native-born women.�-�������2(%0%�5%0%�����,)++).-&.0%)'-8".0-�5.,%-����2.�7%!01�.+$����(%�!4%0!'%�-3,8"%0�.&�#()+$0%-�".0-�2.�2(%1%5.,%-�5!1�!".32�����#()+8$0%-�%!#(��#.,/!0%$�5)2(����#()+$0%-�&.0�-!2)4%8".0-5.,%-���)'30%���8���
.,%-�".0-�)-��!2)-��,%0)#!(!$�2(%�()'(%12�&%02)+)27�+%4%+15)2(�����#()+$0%-�%!#(��!".32����#()+$�()'(%0�2(!-�&.05.,%-�&0.,�.2(%0�0%').-1�.&2(%�5.0+$��� .,%-�".0-�)-�%6)#.�#.,/0)1%$�.-%82()0$�.&!++�&.0%)'-8".0-�5.,%-�)-�2(%#()+$"%!0)-'�!'%1�!-$�(!$".0-%�����#()+$0%-�%!#(�
Over half of womenwith a newborn are in the labor force.�-����������/%0#%-2�.&�5.,%-���2.��7%!01�.+$�5(.�(!$�!#()+$�)-�2(%�/0%#%$)-'���,.-2(1�5%0%�)-�2(%�+!".0&.0#%��-.2�1)'-)&)#!-2+7�$)&&%0%-2&0.,���/%0#%-2�)-�������)'30%���8���
�,.-'�,.2(%01�5)2(�-%5".0-#()+$0%-�����/%0#%-2�.&�,.2(8%01�5(.�(!$�!2�+%!12�!�"!#(%8+.0�1�$%'0%%�5%0%�)-�2(%�+!".0&.0#%��#.,/!0%$�5)2(���/%0#%-2�5(.�(!$�#.,/+%2%$.-+7�()'(�1#(..+�!-$�/%0#%-2�5)2(�+%11�2(!-�!�()'(1#(..+�$)/+.,!����2�)1�+)*%+7�2(!2()'(+7�%$3#!2%$�5.,%-�5)2(/0).0�#!0%%0�#.,,)2,%-21�!-$()'(%0�%!0-)-'1�/.2%-2)!+13&&%0�'0%!2%0�+.11%1�&0.,5.0*�&.0#%�)-2%003/2).-1��13#(!1�(!4)-'�!�#()+$��2(%0%"7%-#.30!')-'�!�,.0%�0!/)$0%%-207�)-2.�2(%�+!".0�&.0#%!&2%0�!�#()+$�1�")02(�
For Further Information�%%����300%-2��./3+!2).-�%/.021���%0)%1����8������� � ���������� �������������������&.02(#.,)-'�
�.-2!#2��,!0!��!#(3�%02)+)27�!-$��!,)+7����2!2)12)#1��0!-#(��8� 8��!"!#(3�#%-131�'.4

13.���������������� ������������������
Lynne M. Casper
Figure 13-1.
Child Care Arrangements for Preschoolers Used by Fam iliesWith Employed Mothers: 1993��&3$&/5�0'�13&4$)00-&34�#:�5:1&�0'�"33"/(&.&/5�
���/$-6%&4�.05)&34�803,*/(�"5�)0.&�03�"8":�'30.�)0.&���/$-6%&4�$)*-%3&/�*/�,*/%&3("35&/�03�4$)00-<#"4&%�"$5*7*5*&4�
�063$&���!�����63&"6�0'�5)&��&/464���637&:�0'��/$0.&�"/%��30(3".��"35*$*1"5*0/�
�05)&3�
�
�"5)&3� �
�3"/%1"3&/54���
�5)&3�3&-"5*7&4��
�3("/*;&%�'"$*-*5*&4��
�0/3&-"5*7&4��
�5)&34�
��
30 U.S. Census Bureau, the Official StatisticsTM September 21, 1998
�/&�0'�5)&�(3&"5&45�$)"-<-&/(&4�'03�&.1-0:&%�1"3&/54*4�'*/%*/(�(00%�26"-*5:��-08<$045�$)*-%�$"3&����&-*"#-&�26"-*5:�$"3&�*4�&41&$*"--:*.1035"/5�'03�13&4$)00-&34#&$"64&�:06/(�$)*-%3&/�"3&%&1&/%&/5�0/�$"3&(*7&34�50'6-'*--�5)&*3�#"4*$�/&&%4�"/%,&&1�5)&.�'30.�)"3.���3&4$)00-&34�"3&�"-40�*/�5)&.*%45�0'�'03.*/(�1&340/"-*5*&4�%&7&-01*/(�$0(/*5*7&-:��"/%-&"3/*/(�40$*"-�4,*--4��"/%$)*-%�$"3&�1307*%&34�$"/�"/%%0�)"7&�"�."+03�*.1"$5�0/5)&4&�130$&44&4�"/%�5)&*3065$0.&4����03�5)&4&�3&"40/4�'*/%*/(�5)&�3*()5�1307*%&3�*4$3*5*$"-�
�&3&��8&�&9".*/&�)08�803,<*/(�1"3&/54�"33"/(&�$"3&�'035)&*3�13&4$)00-&34���
Almost half of all pre-schoolers are cared forby relatives while theirmothers are at work.�/������5)&3&�8&3&�����.*--*0/$)*-%3&/�6/%&3���:&"34�0-%8)0�8&3&�*/�/&&%�0'�$)*-%$"3&�8)*-&�5)&*3�.05)&34�8&3&803,*/(����-.045�)"-'����1&3$&/5��8&3&�$"3&%�'03�13*<."3*-:�#:�3&-"5*7&4���*(63&
�<�������&7&/5&&/�1&3$&/58&3&�$"3&%�'03�#:�5)&*3�(3"/%<1"3&/54�%63*/(�5)&*3�.05)&34�803,*/(�)0634��"#065�5)&4".&�1301035*0/�8&3&�$"3&%'03�#:�5)&*3�'"5)&34��� )&�."<+03*5:�0'�13&4$)00-&34�8)08&3&�$"3&%�'03�#:�3&-"5*7&48&3&��*/�'"$5��$"3&%�'03�#:&*5)&3�5)&*3�(3"/%1"3&/54�035)&*3�'"5)&34��&"$)�"$$06/5*/('03�"�5)*3%�0'�5)&�$"3&�1307*%&%#:�3&-"5*7&4����5)&3�3&-"5*7&4=46$)�"4�"6/54��6/$-&4��"/%$064*/4=1-":&%�"�4."--&330-&�*/�1307*%*/(�$)*-%�$"3&4&37*$&4��".06/5*/(�50�"#065��1&3$&/5�0'�"--�"33"/(&.&/54��05)&34�1307*%&%�5)&�3&."*/<%&3�0'�5)&�$"3&�#:�3&-"5*7&4��#065� �1&3$&/5�0'�13&4$)00-<&34�8&3&�$"3&%�'03�#:�5)&*3.05)&34��.045�0'�8)0.803,&%�"5�)0.&��
�� )&�5&3.�3&-"5*7&4�*/$-6%&4.05)&34��'"5)&34��4*#-*/(4��(3"/%<1"3&/54��"/%�05)&3�3&-"5*7&4��5)&3�3&-"5*7&4�*/$-6%&�"6/54��6/<$-&4��"/%�$064*/4����/�03("/*;&%$)*-%�$"3&�'"$*-*5:�*4�"�%":�$"3&$&/5&3���/634&3:�4$)00-��03�13&<4$)00-����0/3&-"5*7&4�*/$-6%&'".*-:�%":�$"3&�1307*%&34�"/%�*/<)0.&�#"#:4*55&34���".*-:�%":$"3&�*4�1307*%&%�#:�"�/0/3&-"5*7&8)0�$"3&4�'03�0/&�03�.03&�6/3&<-"5&%�$)*-%3&/�*/�5)&�$"3&(*7&3�4)0.&����/<)0.&�#"#:4*55&34�"3&/0/3&-"5*7&4�8)0�1307*%&�$"3&8*5)*/�5)&�$)*-%�4�)0.&�
��-*55-&�.03&�5)"/�)"-'���1&3$&/5��0'�13&4$)00-<"(&$)*-%3&/�8&3&�$"3&%�'03�#:40.&0/&�05)&3�5)"/�3&-"5*7&48)*-&�5)&*3�.05)&34�8&3&�"5803,����/������.03&�13&<4$)00-&34�8&3&�$"3&%�'03�*/03("/*;&%�$)*-%�$"3&�'"$*-*5*&45)"/�*/�"/:�05)&3�4*/(-&�"3<3"/(&.&/5��"11309*."5&-:���*/�8&3&�$"3&%�'03�*/�5)*4�"3<3"/(&.&/5����0/3&-"5*7&4�*/$-6%*/(�*/<)0.&�#"#:4*55&34"/%�'".*-:�%":�$"3&�1307*%&34�8&3&�"-40�*.1035"/5�4063$&40'�$)*-%�$"3&��"#065���*/��13&4$)00-<"(&�$)*-%3&/�8&3&$"3&%�'03�#:�/0/3&-"5*7&4�
�/05)&3�*.1035"/5�$0/4*%&3<"5*0/�*/�5)&�$)0*$&�0'�$)*-%$"3&�"33"/(&.&/54�8"4�5)&&/7*30/.&/5�*/�8)*$)�$"3&8"4�1307*%&%����/������"#065"�5)*3%�0'�13&4$)00-&34�8&3&$"3&%�'03�*/�&"$)�0'�5)&�5)3&&."+03�$)*-%�$"3&�&/7*30/<.&/54��5)&�$)*-%�4�)0.&��5)&1307*%&3�4�)0.&��03�03("/*;&%$)*-%�$"3&�'"$*-*5*&4�
Preschoolers’ child carearrangements havechanged dramatically overthe past few years. )&�1301035*0/�0'�13&4$)00-<&34�8)0�8&3&�$"3&%�'03�*/03("/*;&%�$)*-%�$"3&�'"$*-*5*&4%&$-*/&%�'30.� �1&3$&/5�*/�����50��1&3$&/5�*/������

�335 �324335
Figure 13-2.
Child Care Arrangements for Preschoolers, by Poverty Status: 1993��)5')27�3*�45)6',330)56�:,36)�)1403<)(�137,)56�86)�%55%2+)1)27�������������
�%7,)5
�37,)5
�5%2(4%5)276
�7,)5�5)0%7-9)6
�%&<6-77)56
�%1-0<�(%<�'%5)
�� ��
����
��
�
�
�
�
�
�
�
Care by relatives
���2'08()6�(%<�'%5)�')27)56��2856)5<�6',3306��45)6',3306��%2(�%&387���4)5')27�3*',-0(5)2�-2�/-2()5+%57)2�35�6',330>&%6)(�%'7-9-7-)6�
!385')���#�!���85)%8�3*�7,)��)2686��!859)<�3*��2'31)�%2(��53+5%1��%57-'-4%7-32�
�5+%2-=)(�*%'-0-7-)6 ���
��
31U.S. Census Bureau, the Official StatisticsTM September 21, 1998
�3:)9)5��7,-6�4534357-32.814)(�73�%2�%00>7-1)�,-+,�3*��4)5')27�*35�����
�85-2+�7,)�6%1)�7-1)4)5-3(6�7,)6)�6,-*76�:)5)3''855-2+��7,)5)�:)5)�3**6)7>7-2+�',%2+)6�-2�7,)�453435>7-326�3*�45)6',330)56�&)-2+'%5)(�*35�&<�*%7,)56�%2(*%1-0<�(%<�'%5)�4539-()56��%5)�&<�*%7,)56��:,-0)�67%&0)%7����4)5')27�-2�&37,��� %2(�������6,%540<�-2'5)%6)(73����4)5')27�&<���������3:>)9)5��7,-6�4)5')27%+)�(5344)(&%'/�73����4)5')27�&<�����
�%1-0<�(%<�'%5)�,%6�%063&))2�%�'326-67)27�6385')�3*',-0(�'%5)�%55%2+)1)276�4539-(-2+���4)5')27�3*�%00%55%2+)1)276�*35�45)6',330>)56�-2��� �%2(���������3:>)9)5��7,-6�4534357-32�*)00�73���4)5')27�-2������%2(�5)>1%-2)(�%7�7,%7�,-6735-'%00<03:�0)9)0�-2�����
�531������73�������7,)()'0-2)6�-2�7,)�86)�3*�35+%>2-=)(�',-0(�'%5)�*%'-0-7-)6�%2(*%1-0<�(%<�'%5)�4539-()56?%2(�7,)�-2'5)%6)�-2�'%5)�&<*%7,)56?1-+,7�,%9)�&))2�%5%7-32%0�5)64326)�73�7,)�)'3>231-'�5)')66-32�3''855-2+
(85-2+�7,)�6%1)�4)5-3(���",)5)')66-32�&)+%2�-2��80<�����%2(�&37731)(�387�-2����������,-+,)5�4534357-32�3*�*%7,)56:,3�:)5)�82)1403<)(�35:35/-2+�%7�4%57>7-1)�.3&61)%27�7,%7�135)�3*�7,)1�:)5)%9%-0%&0)�73�6)59)�%6�',-0('%5)�4539-()56����35)39)5�4%5)276�1-+,7�,%9)�:%27)(�73'87�(3:2�32�',-0(�'%5)�'3676&<�6:-7',-2+�73�4%5)27%0�68>4)59-6-32�3*�7,)-5�',-0(5)2:,)2)9)5�4366-&0)�
",)�'327-28)(�'314%5%7-9)8243480%5-7<�3*�*%1-0<�(%<'%5)�1%<��-2�4%57��5)*0)'7�%+53:-2+�82)%6-2)66�3*�4%5>)276�:-7,�86-2+�%�1-2-1%00<5)+80%7)(�%55%2+)1)27�:,)5)7,)5)�-6�%�6-2+0)�4539-()5�5%7,)5�7,%2�%�,)%9-0<�5)+80%7)(%55%2+)1)27?%2�35+%2-=)(',-0(�'%5)�*%'-0-7<?:,)5)7,)5)�%5)�%�281&)5�3*�4539-(>)56��� )')27�1)(-%�5)435763*�',-0(�2)+0)'7�%2(�%&86)%7�7,)�,%2(6�3*�&%&<6-77)56%2(�*%1-0<�(%<�'%5)�4539-()56%063�1%<�&)�%�*%'735�-2�7,)()'0-2)�-2�7,)�86)�3*�*%1-0<(%<�'%5)�4539-()56���
Relatives provide a greatdeal of child care for pre-schoolers in poor fam iliesand in families r eceivingwelfare benefits.�,-0(�'%5)�'3676�'3267-787)�%2)64)'-%00<�0%5+)�4357-32�3*�7,)4335�*%1-0<�6�&8(+)7��63�-7'31)6�%6�23�68545-6)�7,%74335�*%1-0-)6�5)0-)(�135),)%9-0<�32�5)0%7-9)6�73�,)047,)1�387�:-7,�',-0(�'%5)�7,%2(-(�2324335�*%1-0-)6����2��������4)5')27�3*�%00�',-0(�'%5)�*3545)6',330)56�-2�4335�*%1-0-)6:%6�4539-()(�&<�5)0%7-9)6�'314%5)(�:-7,�320<���4)5>')27�-2�2324335�*%1-0-)6��-+85)��>���
�5%2(4%5)276�%2(�37,)55)0%7-9)6�40%<)(�%2�)64)'-%00<0%5+)�530)�-2�7,)�',-0(�'%5)�3*4335�',-0(5)2����5)6',330)56�-24335�*%1-0-)6�:)5)����4)5')27135)�0-/)0<�73�&)�'%5)(�*35�&<7,)-5�+5%2(4%5)276�%2(�37,)55)0%7-9)6�7,%2�:)5)�7,36)�-22324335�*%1-0-)6����4)5')279)5686���4)5')27�����2�'32>75%67��*%7,)56�%2(�137,)56:)5)�23�135)�0-/)0<�73�4539-()',-0(�'%5)�-2�4335�*%1-0-)67,%2�-2�2324335�*%1-0-)6���
�335�*%1-0-)6�:)5)�0)66�0-/)0<73�86)�35+%2-=)(�',-0(�'%5)*%'-0-7-)6�7,%2�2324335�*%1-0-)6453&%&0<�&)'%86)�7,-6�7<4)�3*'%5)�:%6�32)�3*�7,)�1367);4)26-9)����2������',-0(5)2-2�4335�*%1-0-)6�:)5)�320<7:3>7,-5(6�%6�0-/)0<�%6�7,36)�-22324335�*%1-0-)6�73�&)�'%5)(*35�-2�35+%2-=)(�',-0(�'%5)*%'-0-7-)6�:,-0)�7,)-5�137,)56:)5)�%7�:35/�����4)5')279)5686���4)5')27��
�2������%4453;-1%7)0<����1-00-32�45)6',330)56�0-9)(�-2*%1-0-)6�7,%7�5)')-9)(�)-7,)5+)2)5%0�%66-67%2')���-(�73�%1-0-)6�:-7,��)4)2()27�,-0(5)2���������*33(67%146��35�&)2)*-76�*531�7,)64)'-%0�68440)1)27%0�*33(453+5%1�*35�$31)2���2*%276�%2(��,-0(5)2��$��������6-+2-*->'%27�4534357-32�3*�7,)6)',-0(5)2���4)5')27��0-9)(�-2*%1-0-)6�7,%7�4%57-'-4%7)(�-2135)�7,%2�32)�453+5%1�%7�7,)6%1)�7-1)�
�-/)�',-0(5)2�-2�4335�*%1-0-)6�7,36)�5)')-9-2+�)-7,)5�+)2)5%0%66-67%2')��������*33(67%146��35�$���&)2)*-76�:)5)135)�0-/)0<�73�&)�'%5)(�*35�&<5)0%7-9)6�7,%2�:)5)�',-0(5)2237�5)')-9-2+�7,)6)�&)2)*-76�� �4)5')27�9)5686���4)5>')27�����,-0(5)2�:,36)�*%1-0-)65)')-9)(�%7�0)%67�32)�7<4)�3*%66-67%2')�:)5)�%063�0)660-/)0<�73�&)�'%5)(�*35�-2�35+%>2-=)(�(%<�'%5)�*%'-0-7-)6�7,%2',-0(5)2�237�5)')-9-2+�7,)6)&)2)*-76����4)5')27�9)5686��4)5')27��
For Further Information!))����855)27��3480%7-32 )43576��!)5-)6�� �>��������������������� ������� �����%2(��855)27�3480%7-32� )43576��!)5-)6� �>���������� ����������������������� ������ ���
�327%'7���<22)�����%64)5�)57-0-7<�%2(��%1-0<���!7%7-67-'6��5%2',��>� >���0'%64)5�')2686�+39

14.����������
John McNeil
Figure 14-1.
Disability Rates, by Age: 1994 to 1995�&0%��+5�!&/��&)&05
�&0%���+,+/"2"."�!&/��&)&05
�&0%���/"2"."�!&/��&)&05
���5"�./��+!�,2".
��0,����5"�./
���0,� ��5"�./
���0,����5"�./
�0,����5"�./
�+!".��5"�./
���
��
����
����
���
����
�
���
���
����
���
���
����
��+�-". "+0�
���
����
���
��
����
�,1. "���������1."�1�,#�0%"��"+/1/���1.2"5�,#��+ ,*"��+!��.,$.�*���.0& &-�0&,+
32 U.S. Census Bureau, the Official StatisticsTM September 21, 1998
About 54 m illion Americanshave a disability; 26 millionof these have a disabilitythat is severe.�+�)�0"�������+!�"�.)5������0%"�+1*�".�,#�-",-)"�3&0%��)&*&0�0&,+�&+���#1+ 0&,+�)�� 0&2&705�,.���/, &�)�.,)"�3�/����*&))&,+�����%"�+1*�".�3&0%��/"2"."�!&/��&)&05��1+��)"�0,-".#,.*�,+"�,.�*,."�� 0&2&0&"/,.�.,)"/��3�/� �*&))&,+��%"/"�"/0&*�0"/�"4 )1!"-",-)"�)&2&+$�&+�&+/0&010&,+/�
The likelihood of havinga disability incr easeswith age. �%"�-.,-,.0&,+�3&0%���!&/��&)&053�/������-". "+0��*,+$-",-)"�1+!".��5"�./������-". "+0��*,+$�0%,/"��0,���
����/"!�,+�0%"��1.2"5�,#��+7 ,*"��+!��.,$.�*���.0& &-�70&,+��������!1.&+$�0%"�)�/0�*,+0%/�,#�������+!�0%"�#&./0*,+0%�,#������
5"�./�,)!������-". "+0�*,+$�0%,/"����0,����5"�./,)!�� ��-". "+0��*,+$0%,/"����0,� ��5"�./�,)!�����-". "+0��*,+$�0%,/"� ��0,���5"�./�,)!���+!������-". "+0�*,+$�0%,/"����5"�./�,)!�+!�,2".���&$1."���7���
�*,+$�-",-)"�&+�0%"�,)!"/0�$"�$.,1-�����5"�./��+!,2".�������-". "+0�%�!��/"2"."�!&/��&)&05������-". "+0+""!"!�-"./,+�)��//&/0�+ "3&0%�,+"�,.�*,."�"2".5!�5� 0&2&0&"/�����-". "+0�1/"!�+��&!��3%"") %�&.�� �+"� .10 %"/��,.�3�)(".��0,�$"0�.,1+!�� ���-". "+0�+""!"!0%"��//&/0�+ "�,#��+,0%".-"./,+�0,�$,�,10/&!"�0%"%,*"������-". "+0�+""!"!-"./,+�)��//&/0�+ "�3&0%��0%&+$���+!�����-". "+03"."��)&+!�
The presence of a disab ilityis associated with lowerlevels of income.�%"+�-",-)"��0,� ��5"�./,)!�3"."� )�//&#&"!��5�0%"&.
.")�0&2"�&+ ,*"�)"2")��0%"-.,-,.0&,+�3&0%���),3��)"//0%�+�%�)#�0%"�*"!&�+��.")�0&2"&+ ,*"�3�/����-". "+0�*,+$�0%,/"�3&0%�+,�!&/��&)&705������-". "+0��*,+$�0%,/"3&0%��+5�!&/��&)&05���+!���-". "+0��*,+$�0%,/"�3&0%��/"2"."�!&/��&)&05�
�*,+$�-",-)"� ��5"�./��+!,2".��0%"�-.,-,.0&,+�3&0%���),3.")�0&2"�&+ ,*"�3�/�� ��-". "+0�#,.�0%,/"�3&0%�+,!&/��&)&05������-". "+0�#,.0%,/"�3&0%��+5�!&/��&)&05���+!����-". "+0�#,.�0%,/"�3&0%��/"2"."�!&/��&)&05����,*-�.��)"#&$1."/�#,.�-",-)"���5"�./
��")�0&2"�&+ ,*"�#,.��+�&+!&72&!1�)�&/� �) 1)�0"!�&+�0%.""/0"-/�������//&$+�0%"�&+!&2&!17�)�0%"�&+ ,*"�,#�%&/�%".�#�*&)5�!'1/0"!�#,.�#�*&)5�/&6"���� �) 1)�0"�0%"�*"!&�+�2�)1"�#,.0%"��!'1/0"!�&+ ,*"�*"�7/1."���+!����!"0".*&+"�0%".�0&,�,#�0%"�&+!&2&!1�)�/��!7'1/0"!�&+ ,*"�0,�0%"�*"!&�+�

Figure 14-2.
Employment Rates of People 21 to 64 Years Old,by Sex and Disability Status: 1994 to 1995
%.8-�34�).7&'.1.8=
%.8-�&�3437*:*6*�).7&'.1.8=
%.8-�&�7*:*6*�).7&'.1.8=
�48-�7*<*7
�&1*
�*2&1*
����
���
���
����
����
��
���
��3�5*6(*38�
���
� ��
"496(*���$�"���96*&9�4+�8-*��*3797��"96:*=�4+��3(42*�&3)� 64,6&2� &68.(.5&8.43�
33U.S. Census Bureau, the Official StatisticsTM September 21, 1998
&3)�93)*6�;*6*����5*6(*38�34�).7&'.1.8=�����5*6(*38�&3=�).7&'.1.8=���&3)�����5*6(*38��7*:*6*�).7&'.1.8=��
#-*�).7&'.1.8=�6&8*�&243,5*451*�6*(*.:.3,�59'1.(&77.78&3(*�'*3*+.87�;&76*1&8.:*1=�-.,-���243,�8-*��2.11.43�5*451*��84� �=*&67�41)�;-4�6*(*.:*)�(&7-�+44)��46�6*38&1�&77.78&3(*���� �5*6(*38�-&)�&�).7&'.1.8=�*.8-*6�7*:*6*�46�3437*:*6*��&3)�����5*6(*38�-&)�&�7*>:*6*�).7&'.1.8=����3�(4386&78�8-*�).7&'.1.8=�6&8*7�&243,8-*���2.11.43�59'1.(&77.78&3(*�3436*(.5.*387�.38-*�7&2*�&,*�,6495�;*6*� ���5*6(*38��7*:*6*�463437*:*6*�).7&'.1.8=��&3)� ��5*6(*38��7*:*6*�).7&'.1.8=����
�478�5*451*�;.8-�).7&'.1.8.*7�*:*3�7*:*6*�).7&'.1.8.*7��).)348�6*(*.:*�59'1.(�&77.78&3(*�#-*�5645468.43�4+�5*451*�;.8-&�7*:*6*�).7&'.1.8=�;-4�6*>(*.:*)�59'1.(�&77.78&3(*�;&7����5*6(*38�&243,�8-47*�84� ��=*&67�41)�&3)�����5*6(*38�&243,�8-47*� �=*&67�41)�&3)�4:*6�
Disability means a reducedchance for employment andlower earnings.#-*�4:*6&11�*2514=2*38�6&8*+46�5*451*���84� ��=*&67�41);&7�� ��5*6(*38��'98�8-.7�6&8*:&6.*)�(437.)*6&'1=�'=�).7>&'.1.8=�78&897���#-*�*2514=>2*38�6&8*�;&7�����5*6(*38&243,�8-*�������2.11.435*451*�;.8-�34�).7&'.1.8=��� ��5*6(*38�&243,�8-*����2.11.43�5*451*�;.8-�&�3437*:>*6*�).7&'.1.8=��&3)� ���5*6>(*38�&243,�8-*�����2.11.435*451*�;.8-�&�7*:*6*�).7&'.1.8=��.,96*���>��
�243,�*2514=*)�5*451*��84� ��=*&67�41)������5*6(*38-&)�&�).7&'.1.8=�������5*6(*38-&)�&�3437*:*6*�).7&'.1.8=�&3)�����5*6(*38�-&)�&7*:*6*�).7&'.1.8=�
�.7&'.1.8=�&174�-&)�&�3*,&8.:*.25&(8�43�*&63.3,7����462&1*�;460*67���84����=*&6741)��8-*�2*).&3�2438-1=*&63.3,7�;*6*���� �&243,8-47*�;.8-�34�).7&'.1.8=�������&243,�8-47*�;.8-&�3437*:*6*�).7&'.1.8=��&3)���� ��&243,�8-47*�;.8-&�7*:*6*�).7&'.1.8=�
Disability is associatedwith an increased likelihoodof government healthinsurance coverage anda reduced likelihood ofprivate coverage. �243,�5*451*��84� ��=*&6741)�;.8-�34�).7&'.1.8=������5*6(*38�;*6*�(4:*6*)�'=�&56.:&8*�-*&18-�.3796&3(*�51&3����5*6(*38�;*6*�348�(4:*6*)'=�&�56.:&8*�51&3�'98�-&)(4:*6&,*�+642�8-*��*)*6&1,4:*632*38��&3)������5*6(*38-&)�34�(4:*6&,*����243,8-47*�.3�8-*�7&2*�&,*�,6495;.8-�&�3437*:*6*�).7&'.1.8=��8-*(425&6&'1*�6&8*7�;*6*�����5*6(*38�� ���5*6(*38��&3)���5*6(*38�
#-*�*++*(8�4+�).7&'.1.8=�43�8-*1.0*1.-44)�4+�56.:&8*�(4:*6&,*;&7�5&68.(91&61=�78643,�&243,5*451*��84� ��=*&67�41)�;.8-&�7*:*6*�).7&'.1.8=����31=����5*6(*38�;*6*�(4:*6*)�'=�&56.:&8*�51&3��;-.1*��� �5*6>(*38�1&(0*)�56.:&8*�(4:*6&,*'98�).)�-&:*�,4:*632*38
(4:*6&,*��&3)�� ���5*6(*38-&)�34�(4:*6&,*�
People with a disability re-port difficulties with a rangeof activities.#-*�392'*6�4+�5*451*� �=*&6741)�&3)�4:*6�6*5468.3,�).++.(91>8.*7�;.8-�75*(.+.(�&(8.:.8.*7.3(19)*)�8-*�+4114;.3,��).++.(91>8=�-*&6.3,�;-&8�.7�7&.)�.3�&(43:*67&8.43�;.8-�&348-*65*6743�������2.11.43��93&'1*�84-*&6�;-&8�.7�7&.)�.3�&�3462&1(43:*67&8.43����2.11.43��).++.(91>8=�7**.3,�;46)7�&3)�1*88*67�.346).3&6=�3*;756.38������2.11.43�93&'1*�84�7**�;46)7�&3)1*88*67�.3�46).3&6=�3*;756.38��� �2.11.43��3**)7�&77.78&3(*;.8-�43*�46�246*�&(8.:.8.*7�4+)&.1=�1.:.3,������2.11.43��97*7�&;-**1(-&.6������2.11.43��)4*7348�97*�&�;-**1(-&.6�'98�-&797*)�&�(&3*�46�;&10*6�+46� 2438-7�46�246*�����2.11.43�
For Further Information"**����966*38� 4591&8.43!*54687��"*6.*7� ��>������������� ������������
���������&3)�8-*��38*63*87.8*�+46�).7&'.1.8=�)&8&�&8;;;�(*3797�,4:�--*7�;;;�).7&'1*�-821
�438&(8��4-3��(�*.1�497.3,�&3)��497*-41)����(4342.(�"8&8.78.(7��.:.7.43��>���>�/4-3�2�2(3*.1�((2&.1����(*3797�,4:
��243,�5*451*��84� �=*&67�41)��8-*6*�;&7�34�78&8.7>8.(&1�).++*6*3(*�'*8;**3�&115*451*�&3)�5*451*�;.8-�&�7*>:*6*�).7&'.1.8=�.3�8-*�564546>8.43�1&(0.3,�&3=�8=5*�4+�-*&18-.3796&3(*�(4:*6&,*�

15.������������ �� ��� ���������
Jan Tin
Figure 15-1.
Average Participation Rates for Major Means-TestedAssistance Programs: 1993
�-8�, ).1�,$ -293$23$# 22(23 -"$�/1.&1 ,
�����.1�.3'$1�" 2'� 22(23 -"$
�4//+$,$-3 +��$"41(38��-".,$
�..#�23 ,/2
�$#(" (#
����
���
���
���
��
���
��$1"$-3�.%�3'$�3.3 +�/./4+ 3(.-�
�.42(-&� 22(23 -"$
�.41"$���������41$ 4�.%�3'$��$-242���415$8�.%��-".,$� -#�1.&1 ,�� 13("(/ 3(.-�
34 U.S. Census Bureau, the Official StatisticsTM September 21, 1998
One in seven Americansreceives public assistance.�%�3'$�$23(, 3$#����,(++(.-"(5(+( -2�+(5(-&�(-�3'$��-(3$#�3 3$2�(-������ //1.7(, 3$+8 �,(++(.-��.1������/$1"$-3�/ 13("(/ 3$#�(-�.-$�.1�,.1$.%�3'$�, ).1�,$ -293$23$#&.5$1-,$-3� 22(23 -"$/1.&1 ,2:24"'� 2��(#�3.� ,(+($2�6(3'��$/$-#$-3�'(+#1$-���������%..#23 ,/2���$#(" (#���4//+$9,$-3 +��$"41(38��-".,$�������.1�'.42(-&� 22(23 -"$��
�'$� 5$1 &$�,.-3'+8�/1.&1 ,/ 13("(/ 3(.-�1 3$�(-"1$ 2$#-.3("$ !+8�%1.,������3.�����%1.,������/$1"$-3�3.�����/$1"$-3�����24!23 -3( +�/1./.193(.-�.%�/1.&1 ,�1$"(/($-32�'.6$5$1��/ 13("(/ 3$#�.-+8�.- �2'.1393$1,�! 2(2��
���$ -293$23$#�/1.&1 ,2 1$�3'.2$�3' 3�1$04(1$�3'$�(-9".,$� -#�.1� 22$32�.%�3'$(-#(5(#4 +�.1�% ,(+8�3.�!$�!$9+.6�2/$"(%($#�3'1$2'.+#2�(-.1#$1�3.�04 +(%8�%.1�!$-$%(32��'$2$�/1.&1 ,2�/1.5(#$" 2'� -#�-.-" 2'� 22(23 -"$3.�/.13(.-2�.%�3'$�+.69(-".,$�/./4+ 3(.-�
�-+8��� �/$1"$-3�.%�/$./+$/ 13("(/ 3$#�(-� 22(23 -"$/1.&1 ,2� ++���,.-3'2�.%�3'$���9��/$1(.#����'$2$�+.-&93$1,�1$"(/($-32�6$1$�+(*$+8�3.!$�$(3'$1�"'(+#1$-��4-#$1���8$ 12�.+#��.1�$+#$1+8�� ��8$ 12.+#� -#�.5$1����'$�/1./.13(.-2.%�"'(+#1$-� -#�3'$�$+#$1+8�3' 3/ 13("(/ 3$#�(-�3'$2$�/1.9&1 ,2�$ "'�,.-3'�.%���� -#�����6$1$������/$1"$-3 -#�����/$1"$-3��1$2/$"3(5$+8�".,/ 1$#�6(3'� ���/$1"$-3�.%/$./+$����3.� ��8$ 12�.+#�
Medicaid has the highestparticipation rate.�-#(5(#4 +2�6$1$�,.1$�+(*$+83.�/ 13("(/ 3$�(-��$#(" (#�3' -(-� -8�.3'$1� 22(23 -"$�/1.9&1 ,����-������3'$� 5$1 &$,.-3'+8�/ 13("(/ 3(.-�1 3$�%.1�$#(" (#������/$1"$-3��6 2'(&'$1�3' -�3' 3�%.1�%..#23 ,/2�������.1�&$-$1 + 22(23 -"$��'.42(-&� 22(293 -"$��.1�������(&41$���9������2(,(+ 1�$-1.++,$-3�/ 33$1-$7(23$#�%.1�/$./+$�6'.�6$1$+.-&93$1,�/ 13("(/ -32��3' 3�(2�%.1�3'.2$�/ 13("(/ 3(-&� ++��,.-3'2�.%�3'$����9��/$1(.#�
Over 1 in 3 Black Americansreceives public assistance.�-������3'$� 5$1 &$�,.-3'+8-4,!$1�.%��'(3$2�1$"$(5(-&,$ -293$23$#� 22(23 -"$����,(++(.-��6 2�% 1�&1$ 3$13' -�3' 3�.%��+ "*2����� ,(++(.-�����.6$5$1���+ "*2 -#��(2/ -("2��.%� -8�1 "$�' #�'(&'$1� 5$1 &$�/1.&1 ,/ 13("(/ 3(.-�1 3$2�3' -��'(3$2 -#�-.-9�(2/ -("2��1$2/$"93(5$+8��!.3'�.5$1 ++� -#�%.1(-#(5(#4 +� 22(23 -"$�/1.9&1 ,2���(&41$���9����.1$�3' -�.-$93'(1#�����/$1"$-3��.%��+ "*2�/ 13("(9/ 3$#�(-�,$ -293$23$#�/1.9&1 ,2��".,/ 1$#�6(3'�.-+8.-$93$-3'����� �/$1"$-3��.%�'(3$2����'$�/1./.13(.-�.%�(2/ -("2�6'.�1$"$(5$#!$-$%(32�6 2�����/$1"$-3�2(&-(%(" -3+8�'(&'$1�3' -�3'$���/$1"$-3�.%�-.-9�(2/ -("26'.�/ 13("(/ 3$#�
�+ "*2�3$-#$#�3.�1$"$(5$'(&'$1�,.-3'+8�!$-$%(32�3' -�'(3$2�� �1$%+$"3(.-�.%�3'$(11$+ 3(5$+8�+.6$1�(-".,$2� -#+ 1&$1�% ,(+($2����'$�,$#( -,.-3'+8�!$-$%(3�(-�����%.1�+ "*�% ,(+($2���� ��6 22(&-(%(" -3+8�'(&'$1�3' -�3'$,$#( -�%.1��'(3$�% ,(+($2

Figure 15-2.
Average Rate of Participation in Any of the Major Means-TestedAssistance Programs, by Selected Characteristics: 1993
�..�2'12.'
�'12.'�+0/#33+'&;%162.'�(#/+.+'4
�'12.'�+0�('/#.';*164'*1.&'3�(#/+.+'4�01�*64$#0&�23'4'05�
"*+5'
�.#%-
�+42#0+%�13+)+0�1(�#09�3#%'�
���
���
� �
���
���
���
��0�2'3%'05�
!0&'3���9'#34
��51����9'#34
� �9'#34�#0&�17'3 ��
���
���
�163%'���!�����63'#6�1(�5*'��'0464���637'9�1(��0%1/'�#0&�31)3#/��#35+%+2#5+10�
35U.S. Census Bureau, the Official StatisticsTM September 21, 1998
��������� *'�/'&+#0�$'0'(+5(13��+42#0+%4��������8#4�0154+)0+(+%#05.9�&+(('3'05�(31/�5*#51(�010;�+42#0+%4��������
About one-fourth of childrenunder 18 years old receivepublic assistance.�31)3#/�2#35+%+2#5+10�8#4%.14'.9�#441%+#5'&�8+5*�#)'�1(5*'�+0&+7+&6#.����0������0'#3.9�+0��������2'3%'05��1(�%*+.;&3'0�60&'3���9'#34�1.&3'%'+7'&�41/'�592'�1(�26$.+%#44+45#0%'��%1/2#3'&�8+5*10.9��+0��������2'3%'05�1(�2'12.'���51����9'#34�1.�&��+0�������2'3%'05��1(5*'�'.&'3.9���
Over half of the poor receivemeans-tested assistance.�0������ ����2'3%'05�1(�5*'2113�3'%'+7'&�/'#04;5'45'&$'0'(+54��%1/2#3'&�8+5*���
2'3%'05�1(�5*'�0102113���13'17'3��17'3�*#.(�� �� 2'3%'05��1(�5*'�2113�2#35+%+;2#5'&�#..���/105*4�1(���#0&������#4�&+&�10.9����2'3%'05�1(�5*'�0102113����0#&&+5+10��5*'�/'&+#0�&63#5+101(�3'%'+25�1(�$'0'(+54�(13�5*'2113�8#4�#$165�58+%'�5*#5�(135*'�0102113��� �/105*4%1/2#3'&�8+5*�����/105*4����
Families maintained bywomen have higher partici-pation rates in assistanceprograms.�'(.'%5+0)�5*'+3�3'.#5+7'.9�.18(#/+.9�+0%1/'4��+0&+7+&6#.4�+0(#/+.+'4�/#+05#+0'&�$9�81/'08'3'�/6%*�/13'�.+-'.9�+0����51�2#35+%+2#5'�+0�/'#04;5'45'&
� *'�217'359�45#564�1(�#�2'3;410�+0�#�)+7'0�2'3+1&�+4�&';(+0'&�$9�&+7+&+0)�5*'�46/�1(*+4�*'3�/105*.9�(#/+.9�+0%1/'$9�5*'�46/�1(�*+4�*'3�/105*.9(#/+.9�217'359�5*3'4*1.&��� *'2'3410�+4�%104+&'3'&�:2113��+(5*'�3#5+1�+4�.'44�5*#0�10'�#0&+4�%104+&'3'&�:0102113�15*'38+4'�� *+4�+/2.+'4�5*#5�+0;&+7+&6#.4�8*1�#3'�%104+&'3'&:2113��+0�#�9'#3�/#9�015�0'%;'44#3+.9�$'�:2113��+0�'7'39/105*�1(�5*'�9'#3�
231)3#/4�5*#0�5*14'�+0�/#3;3+'&;%162.'�(#/+.+'4<���2'3%'05�%1/2#3'&�8+5*����2'3%'05����13'17'3��17'3�*#.(� ��2'3%'05��1(�5*14'�+0(#/+.+'4�/#+05#+0'&�$9�81/'02#35+%+2#5'&�+0�/'#04;5'45'&231)3#/4�&63+0)�#5�.'#45�/105*�1(����#0&�����%1/2#3'&�8+5*�����2'3%'051(�5*14'�+0�/#33+'&;%162.'(#/+.+'4����+/+.#3.9��#�*+)*'32312135+10�1(�(#/+.+'4�/#+0;5#+0'&�$9�81/'0�5*#0�1(/#33+'&;%162.'�(#/+.+'4�3';%'+7'&�/'#04;5'45'&�$'0'(+54+0�#..���/105*4�
For Further Information�''���633'05��126.#5+10�'21354���'3+'4����; ��������������������������������� ������� �������������������������������������������
�105#%5��#0� +0�#$13��13%'�#0&� 3#04('3����31)3#/4��5#5+45+%4��3#0%*��;� �;��,5+0�%'0464�)17

16.�����
��������
Deborah M. Dove
Figure 16-1.
Type of Health Insurance CoverageAmericans Had in 1995
�.8�01*5"3&�0,".
�-0,/8-&.39#"2&%�0,".
�&%*$"1&
�&%*$"*%
��
���
����
���
��.�0&1$&.3�
���*,*3"18�)&",3)�$"1&�*.$,4%&2�����������/-01&)&.2*5&��&",3)�".%��&%*$",�,".�'/1��.*'/1-&%��&15*$&2�������� ����*5*,*".��&",3)�".%��&%*$",��1/(1"-/'�3)&��&0"13-&.3�/'� &3&1".�2��''"*12���".%� &3&1".�2�".%�-*,*3"18�)&",3)�$"1&�
�/3&����)&�0&1$&.3"(&2�#8�380&�/'�$/5&1"(&�"1&�./3�-434",,8�&7$,42*5&�3)"3�*2��0&/0,&�$".�#&�$/5&1&%�#8�-/1&�3)".�/.&�380&�/'�)&",3)�*.241".$&%41*.(�3)&�8&"1�
�/41$&���������41&"4�/'�3)&��&.242���411&.3��/04,"3*/.��415&8�
�/�*.241".$&
�*,*3"18�)&",3)�$"1&�
Private Insurance
Government Insurance
���
���
���
��
��
����
����
���
�,,�0&/0,&
�//1�0&/0,&
36 U.S. Census Bureau, the Official StatisticsTM September 21, 1998
Who goes without health insurance?�.�&23*-"3&%�����-*,,*/.0&/0,&�*.�3)&��.*3&%��3"3&2�����0&1$&.3��6&1&�6*3)/43)&",3)�*.241".$&�$/5&1"(&%41*.(�3)&�&.3*1&������$",&.9%"1�8&"1����)&2&�'*(41&2�6&1&23"3*23*$",,8�4.$)".(&%�'1/-3)&�01&5*/42�8&"1�
Employment is theleading source of healthinsurance coverage.�/23�0&/0,&�� ���0&1$&.3�6&1&�$/5&1&%�#8�"�01*5"3&*.241".$&�0,".�'/1�2/-&�/1�",,/'��������*(41&���9������01*5"3&�0,".�*2�/.&�3)"3�*2/''&1&%�3)1/4()�&-0,/8-&.3�&*3)&1�/.&�2�/6.�/1�"�1&,"93*5&�2��/1�*2�01*5"3&,8�0419$)"2&%����/23�01*5"3&�*.2419".$&�6"2�/#3"*.&%�3)1/4()�"$411&.3�/1�'/1-&1�&-0,/8&1�/14.*/.��&-0,/8-&.39#"2&%���)&�01/0/13*/.�/'�0&/0,&�6*3)
2/-&�+*.%�/'�(/5&1.-&.3$/5&1"(&�6"2�����0&19$&.3:����0&1$&.3�)"%�-&%*9$"1&�������0&1$&.3�)"%�-&%*$9"*%��".%����0&1$&.3�)"%-*,*3"18�$/5&1"(&�
The poor are less likely tohave insurance coverage.�&20*3&�3)&�&7*23&.$&�/'01/(1"-2�24$)�"2��&%*$"*%".%��&%*$"1&������0&1$&.3/'�3)&�0//1�������-*,,*/.��)"%./�)&",3)�*.241".$&�/'�".8+*.%�%41*.(��������*(41&��9������)*2�0&1$&.3"(&:6)*$)�6"2�%/4#,&�3)&�1"3&�'/1",,�0&/0,&:6"2�23"3*23*$",,84.$)".(&%�'1/-�3)&01&5*/42�8&"1����//1�0&/0,&$/-01*2&%�� ���0&1$&.3�/'",,�4.*.241&%�0&/0,&��
�&%*$"*%�6"2�3)&�-/23�6*%&9201&"%�380&�/'�$/5&1"(&"-/.(�3)&�0//1���#/43���0&1$&.3�/'�",,�0//1�0&/0,&6&1&�$/5&1&%�#8�-&%*$"*%�"32/-&�3*-&�%41*.(�3)&�8&"1�
�&5&1",�+&8�'"$3/12�*.',4&.$&%3)&�$)".$&2�/'�,"$+*.()&",3)�*.241".$&�$/5&1"(&�*.��������)&8�*.$,4%&%�
��:!/4.(�"%4,32����3/��8&"12�/,%�6&1&�-/1&�,*+&,83)".�/3)&1�"(&�(1/402�3/�,"$+$/5&1"(&�%41*.(�",,�/'�����������0&1$&.3�,"$+&%�$/5&19"(&�����&$"42&�/'��&%*$"1&�3)&�&,%&1,8�6&1&�"3�3)&�/3)&1&731&-&��/.,8�����0&1$&.3,"$+&%�$/5&1"(&�����-/.(�3)&0//1��"%4,32����3/���8&"12�/,%)"%�-4$)�)*()&1�./.$/5&19"(&�1"3&2�3)".�&*3)&1�$)*,%1&./1�3)&�&,%&1,8�
����� ������� �������� ���� ������:�-/.(�",,�0&/0,&".%�3)&�0//1�",*+&��3)/2&�/'�*20".*$�/1*(*.�)"%�3)&�)*()9&23�$)".$&�/'�,"$+*.(�$/5&19"(&�3)1/4()/43������

�22�6+562+
557�6+562+
#59'2
�'2+
��95���>+'78
�95�����>+'78
�����
�������
���
���
��
�����
��
���
���
��
Age
Race and Hispanic Origin
Education (People 25 Years and Over)
Work Experience (People 15 Years and Over)
�+3'2+
� �95����>+'78
� �95����>+'78
� �>+'78�'4*�5;+7
&./9+
�2')1
�/86'4/)�57/-/4�5,�'4>�7')+�
�5�./-.8).552�*/6253'
�/-.�8).552-7'*:'9+�542>
�885)/'9+�*+-7++
�').+257�8�*+-7++57�./-.+7
"53+�)522+-+�45�*+-7++
&571+*�*:7/4-9.+�>+'7
&571+*�,:22�9/3+
&571+*�6'79�9/3+
�/*�459�<571
� �
�������
� �����
��
��
����
����
��������
���
� ��
�������
���
��
� ��
����
���
��
���
���
��� ��
��
��� ��
Figure 16-2.
Who Lacked Coverage in 1995?� +7)+49�5,�'22�6+562+�'4*�6557�6+562+�459)5;+7+*�(>�.+'29.�/48:7'4)+�*:7/4-�9.+�+49/7+�>+'7�(>�8+2+)9+*�).'7')9+7/89/)8�
��4�6+7)+49�
$4*+7���>+'78
Sex
"5:7)+���$�"���:7+':�5,�9.+��+48:8���:77+49 56:2'9/54�":7;+>�
�������
��� ��
����
������
�'9/;+
�57+/-4�(574
�'9:7'2/?+*�)/9/?+4
�59�'�)/9/?+4
Nativity
37U.S. Census Bureau, the Official StatisticsTM September 21, 1998
� ����������������������A�354-�'22�'*:298��9.+�2/1+2/@.55*�5,�(+/4-�:4/48:7+**+)2/4+*�'8�9.+�2+;+2�5,+*:)'9/54�758+����354-�9.58+<.5�<+7+�6557��.5<+;+7��9.+7+<+7+�45�8/-4/,/)'49�*/,,+7+4)+8')7588�+*:)'9/54�-75:68��
����� ��������A�354-<571+78���95����>+'78�52*�6'79@9/3+�<571+78�.'*�9.+./-.+89�454)5;+7'-+�7'9+A���6+7)+49��)536'7+*�</9.����6+7)+49�,57�,:22@9/3+<571+78����354-�9.+�-+4+7'2656:2'9/54���95����>+'78�52*�<571+78��(59.�,:22�'4*�6'799/3+��.'*�'�25<+7�:4/48:7+*7'9+�9.'4�454<571+78���� 6+7)+49�)536'7+*�</9.� ��6+7)+49�����354-�9.+�6557�.5<+;+7��<571+78�.'*�'./-.+7�:4/48:7+*�7'9+�9.'4454<571+78������6+7)+49)536'7+*�</9.�� ���6+7)+49��
�������!A��./-.+7�6756579/545,�9.+�,57+/-4@(574�656:2'9/54/4�9.+�$4/9+*�"9'9+8�<'8</9.5:9�.+'29.�/48:7'4)+���� 6+7)+49��9.'4�9.+�4'9/;+@(574656:2'9/54������6+7)+49���57+5;+7��'354-�9.+�,57+/-4(574��454)/9/?+48�.'*�'4:4/48:7+*�7'9+�357+�9.'49</)+�'8�./-.�'8�9.'9�5,�4'9:@7'2/?+*�)/9/?+48A�����6+7)+49)536'7+*�</9.� ���6+7)+49� 557�/33/-7'498�<+7+�+;+4<578+�5,,��5;+7�54+@.'2,�5,9.+3�� ���6+7)+49��<+7+</9.5:9�.+'29.�/48:7'4)+�
Household income and sizeof employer play importantroles in coverage.�54)5;+7'-+�7'9+8�,+22�'8.5:8+.52*�/4)53+�758+����4�� ��9.+�6+7)+49�5,�6+562+</9.5:9�.+'29.�/48:7'4)+7'4-+*�,753�����6+7)+49'354-�6+562+�/4�.5:8+.52*8
�&571+78�<+7+�)2'88/,/+*�'86'79�9/3+�/,�9.+>�<571+*�,+<+79.'4�� �.5:78�6+7�<++1�/4�9.+3'057/9>�5,�9.+�<++18�9.+><571+*�/4��� �
��'9/;+8�'7+�6+562+�(574�/49.+�$4/9+*�"9'9+8�� :+795�!/)5�57�'4�5:92>/4-�'7+'�5,�9.+�$4/9+*"9'9+8�8:).�'8��:'3�57�9.+�$�"�%/7-/4��82'4*8��'4*�6+562+�(574/4�'�,57+/-4�)5:497>�<.5�.'*�'92+'89�54+�6'7+49�<.5�<'8�'$�"��)/9/?+4����22�59.+7�6+562+�'7+,57+/-4�(574�
</9.�/4)53+8�5,��� �����57357+�95�����6+7)+49�'354-9.58+�/4�.5:8+.52*8�</9./4)53+8�:4*+7�� �����
�,�9.+������3/22/54�<571+78/4��� �� ���6+7)+49�.'*+3625>3+49@('8+*�.+'29./48:7'4)+�652/)/+8�/4�9.+/7�5<44'3+���#./8�6756579/54�;'7/+*(>�8/?+�5,�+3625>+7��</9.<571+78�+3625>+*�(>�83'22,/738�(+/4-�2+'89�2/1+2>�95�.';+8:).�652/)/+8���#.+�6756579/545,�<571+78�.';/4-�8:).�652/@)/+8�7'4-+*�,753�����6+7)+49,57�<571+78�/4�,/738�5,�,+<+79.'4� �6+562+�95������6+7@)+49�,57�<571+78�/4�,/738�5,�����57�357+�6+562+���#.+8++89/3'9+8�*5�459�7+,2+)9�9.+,')9�9.'9�853+�<571+78�'7+)5;+7+*�(>�+3625>3+49@('8+*�)5;+7'-+�9.75:-.'459.+7�,'3/2>�3+3(+7�
States show widedifferences innoncoverage rates. 756579/548�5,�6+562+�</9.5:9.+'29.�/48:7'4)+�)5;+7'-+7'4-+*�,753�����6+7)+49�/4&/8)548/4�95� ���6+7)+49�/4�+<��+=/)5����+9<++4����'4*��� ��454)5;+7'-+�7'9+8,+22�/4��2'('3'�����6+7)+4995��� �6+7)+49��'4*�758+�/4#+44+88++�����6+7)+49�95����6+7)+49��'4*�%+73549�����6+7)+49�95����6+7)+49���
For Further Information"++���:77+49� 56:2'9/54!+65798��"+7/+8� ��@� �������������������������������� ������� ����������������������
�549')9���+(57'.�����5;+ 5;+79>�'4*��+'29.���"9'9/89/)8��7'4).��@� ���� *+(57'.�3�*5;+����))3'/2�)+48:8�-5;�
��&+�'*;/8+�'-'/489�:8/4-9.+8+�+89/3'9+8�95�7'41�9.+89'9+8���!+8:298�,753�*/,,+7+498'362+8�)5:2*�+'8/2>�8.5<*/,,+7+49�+89/3'9+8�'4*�7'41@/4-8�(+)':8+�5,�83'228'362+�8/?+8�

����
����
����
����
17.�����������
Robert W. Cleveland
Figure 17-1.
Median Household Income by Race and HispanicOrigin: 1988, 1989, 1994, and 1995
��.������$/,,!12�
�����
������
����
�%1#%.3�).#1%!2%�).�-%$)!.�(/42%(/,$�).#/-%�!&3%1�!$*423).'�&/1�).&,!3)/.�����:��������0%1#%.3�����:��������0%1#%.3
� ��
�/41#%��������41%!4�/&�3(%��%.242���411%.3��/04,!3)/.��415%8�
����
�����
���
� ���
�����
�����
���
������
�����
����
���
��� �
�,,�1!#%2
()3%
�,!#+
�)20!.)#�/1)').��/&�!.8�1!#%�
38 U.S. Census Bureau, the Official StatisticsTM September 21, 1998
Household incomeincreased for the firsttime in 6 years.�%36%%.������!.$������(/42%(/,$2�).�3(%��.)3%$�3!3%2�%70%1)%.#%$�!.!..4!,�).#1%!2%�).�1%!,�-%:$)!.�).#/-%�/&����0%1#%.3�&1/-�������3/������ ��)'41%���:����
Household incomevaried by region. �%36%%.������!.$�������3(%�)$6%23�6!2�3(%�/.,8�1%')/.3/�%70%1)%.#%�!�2)'.)&)#!.3#(!.'%�).�1%!,�-%$)!.�(/42%:(/,$�).#/-%��).#1%!2).'���0%1#%.3�&1/-���� �3/���������()2�6!2�3(%�&)123!..4!,�).#1%!2%�).�-%$)!.
���(!.'%2�).�91%!,��).#/-%1%&%1�3/�#/-0!1)2/.2�!&3%1�!$:*423).'�&/1�).&,!3)/.�"!2%$�/.#(!.'%2�).�3(%��/.24-%1�1)#%��.$%7�
(/42%(/,$�).#/-%�%70%1):%.#%$�"8�3(%��)$6%23�2).#%��������(%�/3(%1�3(1%%�1%')/.2$)$�./3�1%#/1$�2)'.)&)#!.3����:���).#1%!2%2�
�&�3(%�1%')/.2��3(%��/43(�(!$3(%�,/6%23�-%$)!.�(/42%(/,$).#/-%�).��������������
�3�6!2�� �����).�3(%�/13(%!23�!.$��������).3(%� %23�
Household incomeincreased for all typesof households. �!-),8�(/42%(/,$2�%70%1):%.#%$�!����:0%1#%.3�).#1%!2%).�1%!,�-%$)!.�).#/-%��1)2).'&1/-������� �).������3/������).���������(%�).:#1%!2%�6!2�!,2/�����0%1#%.3�&1/-��� ����3/���������&/1-!11)%$:#/40,%�&!-),)%2��"43
��(%�-%$)!.�(/42%(/,$�).:#/-%2�/&�3(%��/13(%!23���)$:6%23��!.$� %23�1%')/.2�6%1%./3�23!3)23)#!,,8�$)&&%1%.3�
����0%1#%.3��&1/-�������3/��������&/1�&!-),)%2�-!).:3!).%$�"8�6/-%.�6)3(�./(42"!.$�01%2%.3��!.$����0%1#%.3��&1/-���� �3/������&/1�3(/2%�-!).3!).%$"8�-%.�6)3(�./�6)&%�01%2%.3�
�/.&!-),8�(/42%(/,$2�1%')2:3%1%$�!��:0%1#%.3�).#1%!2%�&1/-���������3/��������
Household income variedby race and ethnicity.�.�������!-/.'�3(%�1!#%�!.$%3(.)#�'1/402���2)!.�!.$�!#)&)#��2,!.$%1�(/42%(/,$2(!$�3(%�()'(%23�-%$)!.�).:#/-%������ �����!.$��,!#+
��(%�0%1#%.3�).#1%!2%2�).-%$)!.�(/42%(/,$�).#/-%&/1�3(%�5!1)/42�380%2�/&(/42%(/,$2�6%1%�./323!3)23)#!,,8�$)&&%1%.3�

��� �� ��� �� ��� �� ��� �� ��� �� ��� �� ��� �� ��� �� ��� ��
Figure 17-2.
Share of Aggregate Household Income, by Quintile: 1968 to 1995
�4<*89���5*7(*39 �.))1*����5*7(*39 �.,-*89���5*7(*39
�� ��� ��� ��� ��� ���
��� �� �� ��� ����
����
���
��������� ��
�������
��� �� �� ������
��
"45� 5*7(*39
�
!4:7(*��#�!���:7*&:�4+�9-*��*38:8���:77*39��45:1&9.43�!:7;*>�
39U.S. Census Bureau, the Official StatisticsTM September 21, 1998
&3)��.85&3.(��4+�&3>�7&(*�-4:8*-41)8�-&)�9-*�14<*89.3(42*��������&3)�������7*85*(9.;*1>�����%-.9*-4:8*-41)8�-&)�&�2*).&3.3(42*�4+��� ����� �
��"-*�2*).&3�.3(42*8�4+��1&(0-4:8*-41)8�&3)�4+��.85&3.(@47.,.3�-4:8*-41)8�<*7*�34989&9.89.(&11>�).++*7*39�
��9�1*&89�5&79�4+�9-*�).++*7@*3(*�.3�.3(42*�'*9<**3%-.9*�-4:8*-41)8�&3)��8.&3&3)��&(.+.(��81&3)*7�-4:8*@-41)8�<&8�&997.':9&'1*�94�9-*1&7,*7�8.?*�4+��8.&3�&3)��&(.+@.(��81&3)*7�-4:8*-41)8����3�����9-*�&;*7&,*�8.?*�4+�8.&3�&3)��&(.+.(��81&3)*7-4:8*-41)8�<&8��� �5*451*�(425&7*)�<.9-�� ��5*451*+47�%-.9*�-4:8*-41)8����&8*)43�&3�.3(42*@5*7@-4:8*-41)@2*2'*7�2*&8:7*��9-*�.3(42*4+��8.&38�&3)��&(.+.(��81&3)@*78����������<&8�349�8.,3.+.@(&391>�).++*7*39�+742�9-&9�4+%-.9*8��������
Household income differsby the number of earners inthe household.�4:8*-41)8�<.9-�34�*&73*78-&)�&�2*).&3�.3(42*�.3��� 4+�������431>�&'4:9�43*@+4:79-�9-&9�4+�-4:8*-41)8�<.9-9<4�47�247*�*&73*78�� ��������4:8*-41)8�<.9-43*�*&73*7�-&)�&�2*).&3.3(42*�4+���� ���
Median earnings of year-round, full-time workersvary by gender.�3��� ��2*).&3�*&73.3,8�4+>*&7@74:3)��+:[email protected]*�<470*78<*7*��������+47�2*3�&3)������+47�<42*3���"-*+*2&1*@94@2&1*�*&73.3,87&9.4�.3��� �<&8������34989&9.89.(&11>�).++*7*39�+742�9-*&[email protected]*�-.,-�7&9.4������7*&(-*)�.3�����
Median earnings of year-round, full-time workersdiffer by occupation.�3��� ��&243,�2&1*�>*&7@74:3)��+:[email protected]*�<470*78��2*@).&3�*&73.3,8�<*7*����� ��+47�*=*(:9.;*8�&3)�2&3&,*78��� �����+47�8&1*8�<470*78�
&3)�������+47�57*(.8.43574):(9.43��(7&+9��&3)�7*5&.7<470*78����47�<42*3��9-*(425&7&'1*�+.,:7*8�<*7*������ ���������&3)�������7*85*(9.;*1>��
Median earnings of year-round, full-time workers varyby educational attainment.�3��� ��2*).&3�*&73.3,84+�2&1*�>*&7@74:3)��+:[email protected]*<470*78� �>*&78�41)�&3)4;*7�<*7*���������+47�9-48*<.9-�&�(411*,*�)*,7**���� ��+47�9-48*�<.9-�431>�&-.,-�8(-441�).5142&��&3)������+47�9-48*�<.9-�842*-.,-�8(-441�*):(&9.43�':9�34).5142&�����47�+*2&1*�>*&7@74:3)��+:[email protected]*�<470*78��9-*(425&7&'1*�+.,:7*8�<*7*�����������������&3)� �����7*85*(9.;*1>�
���*).&3�*&73.3,8�+47�+*2&1*8&1*8�<470*78�<*7*�349�8.,3.+@.(&391>�).++*7*39�+742�9-48*�4++*2&1*�57*(.8.43��(7&+9��&3)7*5&.7�<470*78�
The distribution of incomehas become somewhatmore unequal over time.�*9<**3�����&3)��� �9-*7*�<&8�34�(-&3,*�.3�9-*.3*6:&1.9>�.3�9-*�).897.':9.43�4+-4:8*-41)�.3(42*���.,:7*�@�����4<*;*7��8.3(*�����.3(42*�.3*6:&1.9>�-&8�.3@(7*&8*)���"-*�143,@9*72�97*3)-&8�'**3�9-&9�-4:8*-41)8�&99-*�'49942���5*7(*39�4+�9-*.3(42*�).897.':9.43�-&;*7*(*.;*)�1*88�&3)�1*88�4+�9-*(4:397>�8�.3(42*��<-.1*�9-48*&9�9-*�945���5*7(*39�-&;*7*(*.;*)�247*�&3)�247*�
�47�*=&251*��.3������9-*14<*89���5*7(*39�4+�-4:8*@-41)8�7*(*.;*)����5*7(*39�4+9-*�&,,7*,&9*�-4:8*-41).3(42*����>��� ��9-*.7�8-&7*-&)�)*(1.3*)�94�/:89�����5*7@(*39����3�(4397&89��9-*�-.,-*89��5*7(*39�4+�-4:8*-41)87*(*.;*)�����5*7(*39�4+�9-*&,,7*,&9*�-4:8*-41)�.3(42*.3��������>��� ��9-*.7�8-&7*-&)�.3(7*&8*)�94������5*7@(*39����438*6:*391>��-4:8*@-41)8�.3�9-*�2.))1*�4+�9-*.3(42*�).897.':9.43�<*7*7*(*.;.3,�5745479.43&11>�1*88�4+9-*�(4:397>�8�.3(42*�.3��� 9-&3�.3��������47�*=&251*�9-*�2.))1*����5*7(*39�4+-4:8*-41)8�7*(*.;*)� ���5*7(*39�4+�9-*�&,,7*,&9*-4:8*-41)�.3(42*�.3����':9�431>������5*7(*39�.3�� �
For Further Information!**����:77*39��45:1&9.43 *54798��!*7.*8����@������������������� ����������������������%.9-�!*5&7&9*�&9&�43�$&1:&9.43�4+��43(&8-�*3*+.98��
�439&(9� 4'*79�%���1*;*1&3)�3(42*�!9&9.89.(��7&3(-��@� �����74'*79�<�(1*;*1&3)����((2&.1�(*38:8�,4;

�
��
�
�
��
��
���� �� �� � ���� ���� ���� ��� ���� ���� ����
18.�������
Bernadette D. Proctor
Figure 18-1.
People Below the Poverty Level: 1959 to 1995
�2+ #/�-$�.--/��,�+'**'-,0�
�-3#/16�/�1#��,�.#/!#,1�
�-2/!#���������2/#�2�-$�1&#��#,020���2//#,1��-.2*�1'-,��2/3#6�
40 U.S. Census Bureau, the Official StatisticsTM September 21, 1998
The number of poordropped significantly.�&#/#�4#/#� ���+'**'-,.#-.*#� #*-4�1&#�-$$'!'�*.-3#/16�*#3#*��',������0'%,'$'!�,1*6�*-4#/�1&�,�1&#����+'**'-,�.--/�/#!-/"#"�',��������&#�./-.-/1'-,�-$�1&#.-.2*�1'-,�4'1&�',!-+#0 #*-4�1&#�.-3#/16�*#3#*�',������*0-�4�0�0'%,'$'!�,1*6*-4#/�1&�,�1&�1�',����������.#/!#,1�!-+.�/#"�4'1&�����.#/!#,1����'%2/#���8���
The poverty ratevaries across race andethnic groups. �,�������1&#�.-3#/16�/�1#4�0�����.#/!#,1�$-/��&'1#0����.#/!#,1�$-/��*�!)0���,"���.#/!#,1�$-/��'0.�,'!0��-$
���&#�.-3#/16�"#$','1'-,�20#" 6�1&#��#"#/�*�%-3#/,+#,1$-/�01�1'01'!�*�.2/.-0#0�'0 �0#"�-,���0#1�-$�+-,#6�',8!-+#�1&/#0&-*"0�1&�1�3�/6� 6$�+'*6�0'7#��,"�!-+.-0'1'-,�,"�"-�,-1�1�)#�',1-��!!-2,1,-,!�0&� #,#$'10�-/�1�5#0��&#��3#/�%#�.-3#/16�1&/#0&8-*"�$-/���$�+'*6�-$�$-2/�',�����4�0������ ������$-2/8.#/0-,$�+'*6�4'1&�!�0&�',!-+#� #8*-4�'10�1&/#0&-*"�4-2*"� #!-2,1#"��0�.--/�
�,6�/�!#����'%2/#���8�����-/1&#��0'�,��,"���!'$'!��0*�,"#/.-.2*�1'-,��1&#�*�/%#01�!-+8.-,#,1�-$�1&#�/#+�',',%�/�!#%/-2.0��1&#�.-3#/16�/�1#�4�0��� �.#/!#,1�',�������1��+#��0�',������
�*�!)0��,"��&'1#0�#�!&0&-4#"�0'%,'$'!�,1�"#!/#�0#0',�1&#'/�.-3#/16�/�1#0� #14##,������,"���������*�!)0"/-..#"�$/-+��� �.#/!#,1�1-���.#/!#,1���,"��&'1#0"/-..#"�$/-+������.#/!#,1�1-����.#/!#,1����-/��'0.�,'!0�1&#/#�4�0�,-�0'%,'$'!�,1!&�,%#�',�1&#�,2+ #/�-$�.--/-/�1&#�.-3#/16�/�1#� #14##,������,"������
�3#,�1&-2%&�1&#�.-3#/16�/�1#$-/��&'1#0�4�0�*-4#/�1&�,�1&�1$-/�1&#�-1&#/�/�!'�*��,"�#1&,'!%/-2.0��1&#�+�(-/'16�-$�.--/.#-.*#�� ����.#/!#,1��',�����4#/#��&'1#����*�!)0�!-,01'8121#"�����.#/!#,1�-$��**.#-.*#� #*-4�1&#�.-3#/16*#3#*��4&#/#�0�1&#��0'�,��,"��!'$'!��0*�,"#/�.-.2*�1'-,/#./#0#,1#"����.#/!#,1�-$�1&#��1'-,�0�.--/����'0.�,'!0!-+./'0#"����.#/!#,1�-$1&#�.--/�
About one-third of fam iliesmaintained by womenwith no husband presenthave incomes below thepoverty level.�&'*#������.#/!#,1�-$��**$�+'*'#0�&�"�',!-+#0� #*-41&#�.-3#/16�*#3#*�',���������.#/!#,1�-$�$�+'*'#0�+�',1�',#" 6�4-+#,�4'1&�,-�&20 �,"./#0#,1�4#/#�.--/����,�!-,81/�01��-,*6��� �.#/!#,1�-$+�//'#"8!-2.*#�$�+'*'#0�*'3#"',�.-3#/16�
�&#�./-.-/1'-,�-$�$#+�*#8&-20#&-*"#/�$�+'*'#0�',�.-3#/816�4�0�02 01�,1'�**6�&'%&#/�+-,%��*�!)�$�+'*'#0��,"�'0.�,'!�$�+'*'#0�1&�,��+-,%�&'1#�$�+'*'#0����&'1#�$�+'*'#0+�',1�',#"� 6�4-+#,�4'1&�,-&20 �,"�./#0#,1�&�"���.-38#/16�/�1#�-$� � �.#/!#,1����&#!-//#0.-,"',%�/�1#0�$-/��*�!)$�+'*'#0��,"��'0.�,'!�$�+'*'#04#/#������.#/!#,1��,"�����.#/!#,1��/#0.#!1'3#*6��,-10'%,'$'!�,1*6�"'$$#/#,1�$/-+-,#��,-1&#/��
�,�����������.#/!#,1�-$�**�.--/�$�+'*'#0�4#/#�+�',81�',#"� 6�4-+#,�4'1&�,-&20 �,"�./#0#,1��4&#/#�0�� �.#/!#,1�4#/#�+�',1�',#" 6�+�//'#"�!-2.*#0�

Figure 18-2.
Poverty Rates for People and FamiliesWith Selected Characteristics: 1995
All families
All people
Householder workingyear round, full time
Householder withsome college, no degree
Householder withbachelor’s degree or more
Married-couple families
People 65 years and over
Related children under 18 years
Unrelated individuals
People 65 years andover, living alone
Hispanic origin(of any race)
Black
Female-householder families,no spouse present
����
���
��
���
���
��
��
����
��
���
��
��
��
��
Householder withouthigh school diploma
(In percent)
�,1.!#���������1.#�1�,$�0&#��#+/1/���1..#+0��,-1)�0',+��1.2#5�
White
Householder with high schooldiploma, no college
��
���
41U.S. Census Bureau, the Official StatisticsTM September 21, 1998
Half of the poverty popula-tion consists of the elderlyand children.��)$�,$�0&#���0',+�/�-,,.�'+�����3#.#�#'0&#.�!&')".#+1+"#.����5#�./�,)"�����-#.!#+0��,.�-#,-)#� ��5#�./,)"��+"�,2#.������-#.!#+0���&#�-,2#.05�.�0#�$,.�!&')".#+3�/�����-#.!#+0��&'%&#.�0&�+0&�0�$,.��+5�,0&#.��%#�%.,1-��&#�-,2#.05�.�0#�$,.�0&#�#)"#.7)5�3�/������-#.!#+0���-#.!#+0�%#�-,'+0/� #),3�0&#-,2#.05�.�0#�$,.��))�-#,-)#���
�,3#2#.����&'%&#.�-.,-,.0',+,$�0&#�#)"#.)5�����-#.!#+0�0&�+�,$�0&#�+,+#)"#.)5����-#.!#+0��3#.#�!,+!#+0.�0#"(1/0�,2#.�0&#'.�.#/-#!0'2#-,2#.05�0&.#/&,)"/��0&�0�'/� #03##+������+"����-#.!#+0,$�0&#'.�0&.#/&,)"����)0&,1%&0&#�#)"#.)5�!,+/0'010#"�,+)5��-#.!#+0�,$�0&#�0,0�)�-,-1)�0',+������-#.!#+0�,$�0&#���0',+�/���*'))',+�6+#�.�-,,.�3#.#�#)"#.)5��
The number of poorpeople varies considerablyunder alternative definitionsof income.�'+!#�*1!&�,$�*#�+/70#/0#"�//'/0�+!#�0,�-#,-)#�'/�'+�0&#$,.*�,$�+,+!�/&� #+#$'0/�/1!&��/�*#"'!�'"��+"�$,,"/0�*-/��#4-#.'*#+0�)�#/0'7*�0#/�3#.#�-.#-�.#"� 5�0&#�#+/1/��1.#�1�0,�"#*,+7/0.�0#�0&#�#$$#!0/�,$�'+!)1"'+%/1!&� #+#$'0/����1 0.�!0'+%��))%,2#.+*#+0�!�/&�0.�+/$#./$.,*�0&#�,$$'!'�)�"#$'+'0',+�,$'+!,*#�.#/1)0#"�'+���-,2#.05
-,-1)�0',+�'+������,$���� *'))',+�-#,-)#��+"���!,..#7/-,+"'+%�-,2#.05�.�0#�,$����-#.!#+0����&#+�0�4#/�3#.#/1 0.�!0#"�$.,*�'+!,*#��+"%,2#.+*#+0�!�/&��+"�+,+7!�/&� #+#$'0/��/1!&��/�$,,"/0�*-/��&,1/'+%���+"�*#"'!7�'"��3#.#�'+!)1"#"�'+�'+!,*#�0&#�+1* #.�,$�-#,-)#� #),3-,2#.05�".,--#"�0,���*'))',+��+"�0&#�-,2#.05�.�0#�0,����-#.!#+0�
For Further Information�##����1..#+0��,-1)�0',+�#-,.0/���#.'#/�� �7������������ ����� ��������������
�,+0�!0��#.+�"#00#�����.,!0,.�,2#.05��+"��#�)0&����0�0'/0'!/��.�+!&��7���7�� #.+�"#00#�"�-.,!0,.����!!*�')�!#+/1/�%,2

�
��
��
�
�
��
��
�
��
��
���
19.��������� ������
Claudette E. BennettKymberly A. Debarros
Figure 19-1.
Percent of People 25 Years Old and Over With at Least aHigh School Diploma, by Race and Sex: 1965 to 1996
�$, +$� +$
���� ��
�.30"$���������30$ 3�.%�2'$��$-131���300$-2��./3+ 2(.-��304$7�
���� �������� �� ���� ��� ����
�'(2$
�+ "*
42 U.S. Census Bureau, the Official StatisticsTM September 21, 1998
The Black population is projected to reach 40 m illionby the year 2010.�-�������2'$��+ "*�/./3+ 2(.-5 1�$12(, 2$#� 2����,(++(.- -#�".-12(232$#������/$0"$-2.%�2'$�".3-207�1�/./3+ 2(.-��3/%0.,�����/$0"$-2�(-������ -#��� �/$0"$-2�(-��������2�2'$230-�.%�2'(1�"$-2307��2'$��+ "*/./3+ 2(.-�(1�$6/$"2$#�2.0$ "'����,(++(.-� -#�0$/0$81$-2������/$0"$-2�.%�2'$�/./38+ 2(.-����$-�7$ 01�+ 2$0��(-������2'$��+ "*�/./3+ 2(.-�(1/0.)$"2$#�2.�!$�����,(++(.-�0$/0$1$-2(-&�����/$0"$-2�.%2'$�2.2 +�/./3+ 2(.-�
�!.32���/$0"$-2�.%�2'$&0.52'�(-�2'$��+ "*�/./3+ 2(.-1(-"$������' 1�!$$-�#3$�2.- 230 +�(-"0$ 1$��!(02'1�,(-31#$ 2'1���5'(+$�(,,(&0 2(.-�' 1 "".3-2$#�%.0�2'$�0$, (-(-&���/$0"$-2��
Families maintained bysingle parents continue torepresent a growing shareof Black families.�-������� �/$0"$-2�.%� ++�+ "*�% ,(+($1�5$0$�, (-82 (-$#�!7�5.,$-�5(2'�-.1/.31$�/0$1$-2�� -#� - ##(2(.- +� �/$0"$-2�5$0$, (-2 (-$#�!7�,$-�5(2'�-.1/.31$�/0$1$-2����-�".-20 12�
+$11�2' -����/$0"$-2�.%�-.-8�(1/ -("��'(2$�% ,(+($1�5$0$1(-&+$8/ 0$-2�% ,(+($1����$112' -�.-$8' +%����/$0"$-2��.% ++��+ "*�% ,(+($1�5$0$�, 00($#".3/+$1�(-�������".,/ 0$#5(2'����/$0"$-2�(-���������/$0"$-2�(-������� -#���/$0"$-2�(-��� ��
�'$�(-"0$ 1$�(-�2'$�/0./.02(.-.%��+ "*�1(-&+$8/ 0$-2�% ,(+($15 1�&0$ 2$0�!$25$$-��� � -#������2' -�!$25$$-����� -#������ -#�!$25$$-����� -#�������%0.,��/$0"$-2�2.��/$0"$-2��/$0"$-2�2.����/$0"$-2�� -#���/$0"$-2�2.���/$0"$-2��0$1/$"82(4$+7�����'(1�20$-#�(1�.""300(-& ,.-&�!.2'��'(2$�% ,(+($1 -#��+ "*�% ,(+($1��
Blacks continue tomake progress in narrowingthe educational gapwith Whites.�-�������.-+7�� �/$0"$-2�.%�+ "*1����7$ 01�.+#� -#�.4$0' #�".,/+$2$#� 2�+$ 12�'(&'1"'..+��".,/ 0$#�5(2'���/$0"$-2�.%���'(2$1���(&30$��8������-�������2'$�".00$81/.-#(-&�%(&30$1�5$0$���/$0"$-2� -#� ��/$0"$-2����7������ �/$0"$-2�.%� ++��+ "*1���7$ 01�.+#� -#�.4$0�' #".,/+$2$#� 2�+$ 12�'(&'
1"'..+��".,/ 0$#�5(2'��/$0"$-2�.%��'(2$1�� -#���/$0"$-2�.%�-.-8�(1/ -("�'(2$1�
�-������� �'(&'$0�/0./.02(.-.%��+ "*�%$, +$1�2' -�.%��+ "*, +$1�(-�!.2'�2'$���82.87$ 0� &$�&0.3/� -#�2'$�82.8�7$ 0� &$�&0.3/�' #$ 0-$#� 2�+$ 12� �! "'$+.0�1#$&0$$����'$�%(&30$1�5$0$���/$0"$-2�4$0131����/$0"$-2� -#����/$0"$-2�4$0131���/$0"$-2��0$1/$"2(4$+7����-".-20 12�� ,.-&�-.-8�(1/ -("�'(2$1��2'$0$�5 1�-.�12 2(12(" +#(%%$0$-"$�!$25$$-�, +$1� -#%$, +$1�� !.32���/$0"$-2�(-$ "'� &$�&0.3/�5$0$� 2�+$ 12".++$&$�&0 #3 2$1�
Similar proportions of Blackand non-Hispanic Whitemarried-couple fam ilieshave both the husband andwife as earners. �.2'�2'$�'31! -#� -#�5(%$5$0$�$ 0-$01�(-� �1(,(+ 0/0./.02(.-�.%��+ "*�����/$08"$-2�� -#�.%�-.-8�(1/ -("�'(2$�����/$0"$-2��, 00($#8".3/+$�% ,(+($1�(-�������$4$02'$+$11��2'$(0�,$#( -% ,(+7�(-".,$�#(%%$0$#�13!812 -2( ++7����'$�,$#( -�(-".,$.%��+ "*�, 00($#8".3/+$% ,(+($1�(-�5'("'�!.2'�2'$

�&1*�*2&1*�*77�8-&3�-.,-�7(-441
�.,-�7(-441�,6&)9&8*�431<
�&(-*146�7�)*,6**�46�246*
Figure 19-2.
Median Earnings of Year-Round,Full-Time Workers 25 Years Old andOver, by Educational Attainment,Sex, and Race: 1995
�����
�������
��� �
���� ��
� ���
�����
��� �
�������
Black
White, non-Hispanic
������
������
������
�����
�*77�8-&3�-.,-�7(-441
�.,-�7(-441�,6&)9&8*�431<
�&(-*146�7�)*,6**�46�246*
"496(*���$�"���96*&9�4+�8-*��*3797���966*38� 4591&8.43�"96:*<�
43U.S. Census Bureau, the Official StatisticsTM September 21, 1998
-97'&3)�&3)�;.+*�;*6*�*&63=*67�����������6*56*7*38*)&'498����5*6(*38�4+�8-*(425&6&'1*�2*).&3�4+�(466*=7543).3,�343=�.75&3.(�%-.8*+&2.1.*7����������
�.0*;.7*��8-*6*�;&7�34�78&8.78.=(&1�).++*6*3(*�.3�8-*�5645468.43�&'498���5*6(*38��4+��1&(0&3)�4+�343=�.75&3.(�%-.8*2&66.*)=(4951*�+&2.1.*7�.3;-.(-�8-*�-97'&3)�;&7�8-*431<�*&63*6����4;*:*6��8-*2*).&3�.3(42*�+46��1&(02&66.*)=(4951*�+&2.1.*7�.3;-.(-�8-*�-97'&3)�;&7�8-*431<�*&63*6�;&7�&'498���5*6(*38�4+�8-*�2*).&3�+46(425&6&'1*�343=�.75&3.(%-.8*�+&2.1.*7��
�3��������1&(0�+&2.1.*7�4:*6&11;*6*�1*77�1.0*1<�84�-&:*�8;446�246*�*&63*67�8-&3�343=�.75&3.(�%-.8*�+&2.1.*7����5*6(*38�:*6797����5*6(*38��&3)�246*�1.0*1<�84�-&:*�34*&63*67�����5*6(*38�:*6797���5*6(*38����#-.7�).++*6*3(*(438.39*)�84�(4386.'98*�84�8-*14;*6�2*).&3�+&2.1<�.3(42*�4+�1&(07����3�8963��8-*�1&6,*65645468.43�4+��1&(0�+&2.1.*7����5*6(*38��8-&3�4+�343=�.75&3.(�%-.8*�+&2.1.*7���5*6(*38��2&.38&.3*)'<�;42*3�;.8-�34�75497*56*7*38�(4386.'98*)�84�8-*
).++*6*3(*�.3�8-*�5645468.434+�34�*&63*6�&3)�8;4=46=246**&63*6�+&2.1.*7�����7.2.1&65645468.43�4+��1&(0�� ��5*6=(*38��&3)�4+�343=�.75&3.(%-.8*�� ��5*6(*38��2&66.*)=(4951*�+&2.1.*7�-&)�8;4�46246*�*&63*67��
The value of moreeducation is evidentin the substantialearnings differencesamong year-round, full-time workers. �3�������8-*�2*).&3�*&63.3,74+��1&(07���<*&67�41)�&3)4:*6��;-4�;460*)�<*&6�6493)�+911�8.2*�&3)�-&)�431<�&�-.,-7(-441�).5142&��;*6*��� ���(425&6*)�;.8-�����+46�8-47*�;.8-�&8�1*&78&�'&(-*146�7�)*,6**����31<���5*6(*38�4+��1&(0�(411*,*,6&)9&8*7�*&63*)�1*77�8-&3��������(425&6*)�;.8-���5*6(*38�4+�8-47*�;.8-�/978�&-.,-�7(-441�).5142&�
�1&(0�;42*3���<*&67�41)&3)�4:*6�;.8-�431<�&�-.,-7(-441�).5142&�;-4�;460*)<*&6�6493)��+911�8.2*�-&)2*).&3�*&63.3,7�4+����� ���&'498����5*6(*38�4+�8-*�*&63=.3,7�4+�(425&6&'1*��1&(02*3�&3)����5*6(*38�4+�8-**&63.3,7�4+�(425&6&'1*
343=�.75&3.(�%-.8*�;42*3��.,96*���=��
�243,�2*3�;.8-�/978�&�-.,-7(-441�).5142&���1&(0�2*3;-4�;460*)�<*&6�6493)��+9118.2*�*&63*)����5*6(*38�4+;-&8�(425&6&'1*�343=�.75&3=.(�%-.8*�2*3�*&63*)��8-*�6&8.4;&7�7.2.1&6�������&243,�8-*(411*,*�,6&)9&8*7���243,(425&6&'1*�(411*,*�,6&)9=&8*7��8-*�2*).&3�*&63.3,7�4+�1&(0�;42*3�;*6*���5*6(*384+�8-47*�4+��1&(0�2*3�&3)���5*6(*38�4+�8-*�*&63.3,7�4+343=�.75&3.(�%-.8*�;42*3�
Nearly half of all poorBlacks are children. �3���������5*6(*38�4+�&11�1&(07�;*6*�5446��&�564546=8.43�348�78&8.78.(&11<�).++*6*38+642�8-*���5*6(*38�.3�������4;*:*6��8-*������6&8*���5*6(*38��;&7�14;*6�8-&3�8-*6&8*�4'7*6:*)�.3�����&3)����� �5*6(*38���;-.(-�;&78-*�-.,-*78�5645468.43�.3�8-*� �<*&67�7.3(*������
�*&61<�43*=-&1+�����5*6(*38�4+�&11�5446��1&(07�;*6*�1*778-&3����<*&67�41)�.3������#-*6*�;&7�34�78&8.78.(&1�).++*6=*3(*�.3�8-*�54:*68<�6&8*�+46�1&(07����84� ��<*&67�4+�&,*&3)�8-47*� ��<*&67�&3)�4:*6�&'498���5*6(*38���#-.7�6&8*
;&7�7.,3.+.(&381<�14;*6�8-&38-*����5*6(*38�54:*68<�6&8*�+46�1&(07�1*77�8-&3����<*&67�41)�
�243,�5446�5*451*����<*&6741)�&3)�4:*6����5*6(*38�4+�1&(07�&3)���5*6(*38�4+343=�.75&3.(�%-.8*7�;460*)���7.2.1&6�5645468.43�4+�5446�1&(0�2*3�&3)�;42*3;460*)����5*6(*38���;-.1*&243,�5446�343=�.75&3.(%-.8*7��&�1&6,*6�5645468.43�4+2*3�8-&3�;42*3�;460*)����5*6(*38�:*6797 �5*6(*38����#-*6*�;&7�3478&8.78.(&1�).++*6*3(*�.3�8-*5645468.43�4+�5446��1&(0;42*3�&3)�343=�.75&3.(%-.8*�;42*3�;-4�;460*)��4;*:*6��8-*6*�;*6*�246*�1&(0�;42*3�����2.11.43�8-&3��1&(0�2*3������2.11.43�&243,�8-*�;460.3,�5446�
For Further Information"**���966*38� 4591&8.43!*54687��"*6.*7� �=����������������������������������� ��������������������$5)&8*�&3)�8&'1*7�43�8-*��38*63*8�&8��;;;�(*3797�,4:
�438&(8��1&9)*88*��*33*88�46�<2'*61<��*'&6647!&(.&1�"8&8.78.(7��6&3(-��=���=��(1&9)*88*�*�'*33*88����((2&.1�(*3797�,4:0<2'*61<�&�)*'&6647����((2&.1�(*3797�,4:
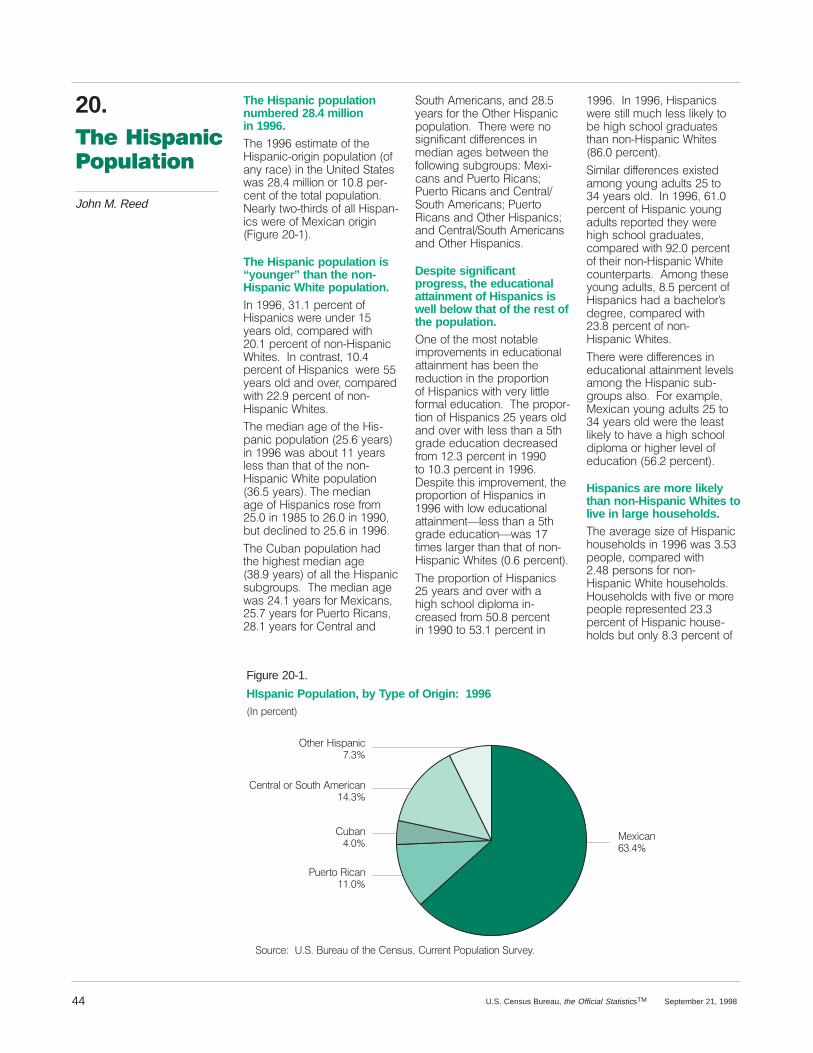
20.������ ������������
John M. Reed
Figure 20-1.
HIspanic Population, by Type of Origin: 1996��0�2(3&(05�
�(053$.�13� 165+��/(3,&$0����
�5+(3��,42$0,&����
�(9,&$0�����
�6%$0����
�6(351��,&$0���
163&(���"� ���63($6�1)�5+(��(0464���633(05��126.$5,10� 637(:�
44 U.S. Census Bureau, the Official StatisticsTM September 21, 1998
The Hispanic populationnumbered 28.4 millionin 1996.!+(�����(45,/$5(�1)�5+(�,42$0,&<13,*,0�2126.$5,10��1)$0:�3$&(��,0�5+(�"0,5('� 5$5(48$4�����/,..,10�13�����2(3<&(05�1)�5+(�515$.�2126.$5,10��($3.:�581<5+,3'4�1)�$..��,42$0<,&4�8(3(�1)��(9,&$0�13,*,0��,*63(��<��
The Hispanic population is“younger” than the non-Hispanic White population.�0���������2(3&(05�1)�,42$0,&4�8(3(�60'(3� :($34�1.'��&1/2$3('�8,5+���2(3&(05�1)�010<�,42$0,&#+,5(4����0�&1053$45�����2(3&(05�1)��,42$0,&4��8(3(� :($34�1.'�$0'�17(3��&1/2$3('8,5+����2(3&(05�1)�010<�,42$0,&�#+,5(4��
!+(�/(',$0�$*(�1)�5+(��,4<2$0,&�2126.$5,10�� ���:($34�,0�����8$4�$%165��:($34.(44�5+$0�5+$5�1)�5+(�010<�,42$0,&�#+,5(�2126.$5,10���� �:($34���!+(�/(',$0�$*(�1)��,42$0,&4�314(�)31/ ���,0��� �51�����,0�����%65�'(&.,0('�51� ���,0�����
!+(��6%$0�2126.$5,10�+$'5+(�+,*+(45�/(',$0�$*(������:($34��1)�$..�5+(��,42$0,&46%*31624���!+(�/(',$0�$*(8$4����:($34�)13��(9,&$04� ���:($34�)13��6(351��,&$04����:($34�)13��(053$.�$0'
165+��/(3,&$04��$0'��� :($34�)13�5+(��5+(3��,42$0,&2126.$5,10���!+(3(�8(3(�014,*0,),&$05�',))(3(0&(4�,0/(',$0�$*(4�%(58((0�5+()1..18,0*�46%*31624���(9,<&$04�$0'��6(351��,&$04��6(351��,&$04�$0'��(053$.� 165+��/(3,&$04���6(351�,&$04�$0'��5+(3��,42$0,&4�$0'��(053$.� 165+��/(3,&$04$0'��5+(3��,42$0,&4��
Despite significantprogress, the educationalattainment of Hispanics iswell below that of the rest ofthe population.�0(�1)�5+(�/145�015$%.(,/2317(/(054�,0�('6&$5,10$.$55$,0/(05�+$4�%((0�5+(3('6&5,10�,0�5+(�2312135,101)��,42$0,&4�8,5+�7(3:�.,55.()13/$.�('6&$5,10���!+(�231213<5,10�1)��,42$0,&4� �:($34�1.'$0'�17(3�8,5+�.(44�5+$0�$� 5+*3$'(�('6&$5,10�'(&3($4(')31/����2(3&(05�,0����51�����2(3&(05�,0������(42,5(�5+,4�,/2317(/(05��5+(2312135,10�1)��,42$0,&4�,0����8,5+�.18�('6&$5,10$.$55$,0/(05=.(44�5+$0�$� 5+*3$'(�('6&$5,10=8$4��5,/(4�.$3*(3�5+$0�5+$5�1)�010<�,42$0,&�#+,5(4������2(3&(05��
!+(�2312135,10�1)��,42$0,&4 �:($34�$0'�17(3�8,5+�$+,*+�4&+11.�',2.1/$�,0<&3($4('�)31/� ����2(3&(05,0�����51� ���2(3&(05�,0
�������0�������,42$0,&48(3(�45,..�/6&+�.(44�.,-(.:�51%(�+,*+�4&+11.�*3$'6$5(45+$0�010<�,42$0,&�#+,5(4������2(3&(05���
,/,.$3�',))(3(0&(4�(9,45('$/10*�:160*�$'6.54� �51���:($34�1.'����0���������2(3&(05�1)��,42$0,&�:160*$'6.54�3(2135('�5+(:�8(3(+,*+�4&+11.�*3$'6$5(4�&1/2$3('�8,5+�����2(3&(051)�5+(,3�010<�,42$0,&�#+,5(&1605(32$354����/10*�5+(4(:160*�$'6.54���� �2(3&(05�1)�,42$0,&4�+$'�$�%$&+(.13�4'(*3((��&1/2$3('�8,5+����2(3&(05�1)�010<�,42$0,&�#+,5(4�
!+(3(�8(3(�',))(3(0&(4�,0('6&$5,10$.�$55$,0/(05�.(7(.4$/10*�5+(��,42$0,&�46%<*31624�$.41����13�(9$/2.(��(9,&$0�:160*�$'6.54� �51���:($34�1.'�8(3(�5+(�.($45.,-(.:�51�+$7(�$�+,*+�4&+11.',2.1/$�13�+,*+(3�.(7(.�1)('6&$5,10�� ���2(3&(05��
Hispanics are more likelythan non-Hispanic Whites tolive in large households.!+(�$7(3$*(�4,;(�1)��,42$0,&+164(+1.'4�,0�����8$4��� �2(12.(��&1/2$3('�8,5+����2(34104�)13�010<�,42$0,&�#+,5(�+164(+1.'4��164(+1.'4�8,5+�),7(�13�/13(2(12.(�3(23(4(05('����2(3&(05�1)��,42$0,&�+164(<+1.'4�%65�10.:�����2(3&(05�1)

Figure 20-2.
Total Hispanics and Hispanic Subgroups,by Nativity and Citizenship: 1996
��2�4)5')27�
"37%0��-64%2-' �8&%2�);-'%2
�%7-9)�&352
�35)-+2�&352��2%785%0-=)(�'-7-=)2
�35)-+2�&352�237�%�'-7-=)2
��� � ��� �� ���
�� ���
���
���
��
��� �� � ��� ����
!385')���#�!���85)%8�3*�7,)��)2686���855)27��3480%7-32�!859)<�
�7,)5��-64%2-'�)275%0�35�!387,�1)5-'%2
45U.S. Census Bureau, the Official StatisticsTM September 21, 1998
232>�-64%2-'�$,-7)�,386)>,30(6����2�'3275%67��32)>4)5632,386),30(6�5)45)6)27)(�320<�����4)5')27�3*��-64%2-',386),30(6��%6�34436)(�73 ���4)5')27�3*�232>�-64%2-'$,-7)�,386),30(6�
�%1-0<�,386),30(6�'3267-787)(%�,-+,)5�4534357-32�3*��-64%2>-'�,386),30(6������4)5')27�7,%2�3*�232>�-64%2-'�$,-7),386),30(6�� ����4)5')27���
More than 40 percent of theforeign-born population areof Hispanic origin.�&387���� �������1-00-32�-64%2-'6�:)5)�*35)-+2�&352�5)45)6)27-2+�����4)5')27�3*7,)��-64%2-'�43480%7-32�
�*�7,)�737%0�����1-00-32*35)-+2>&352�43480%7-32�-2��� ������4)5')27�:)5)�-64%2-'����132+�*35)-+2>&352��-64%2-'6��%�18',�0%5+)54534357-32�:)5)�237�2%785%0>-=)(�'-7-=)26�������4)5')27�7,%2�%132+�*35)-+2>&352232>�-64%2-'�$,-7)6������4)5')27�����132+��-64%2-'68&+53846��7,)5)�:%6�'326-(>)5%&0)�9%5-%7-32�-2�(-675-&87-32&<�2%7-9-7<�%2(�'-7-=)26,-4��-+85)��>������8)573� -'%26%5)�);'08()(�-2�7,)�+5%4,&)'%86)�4)340)�&352�-2
�8)573� -'3�%5)�()*-2)(�%62%7-9)�&352��
Hispanics are more likelyto be unemployed thannon-Hispanic Whites.",)�82)1403<1)27�5%7)�*35�-64%2-'6�� �<)%56�30(�%2(39)5�:%6����4)5')27�-2�����������4)5')27�-2������%2(����4)5')27�-2���� ����35�-64%2-'�1%0)6��7,)�82)1>403<1)27�5%7)�(5344)(�*531����4)5')27�-2�����73����4)5')27�-2���� ����3:)9)5�7,)5)�:%6�23�6-+2-*-'%27',%2+)�-2�7,)�82)1403<1)275%7)�*35��-64%2-'�*)1%0)6&)7:))2����������4)5')27�%2(���� �������4)5')27������
�-64%2-'6�:)5)�39)5�7:-')%6�0-/)0<�73�&)�82)1403<)(-2���� �7,%2�:)5)�232>�-64%2-'�$,-7)6������9)5686�� �4)5')27�����132+��-64%2>-'�68&+53846���8&%26�,%(�%6-+2-*-'%270<�03:)5�82)1403<>1)27�5%7)�� ��4)5')27��7,%2%00�37,)5��-64%2-'�68&+53846);')47�*35��)275%0�%2(�!387,�1)5-'%26������4)5')27��
��",)5)�:%6�23�6-+2-*-'%27(-**)5)2')�&)7:))2�82)1>403<1)27�5%7)6�&)7:))2�7,)6);)6�*35�)-7,)5�����35���� �
Hispanics earn less thannon-Hispanic Whites.�132+�<)%5>5382(��*800>7-1):35/)56��1)(-%2�)%52-2+6�-2�����:)5)�03:)5�*35��-64%2-'1%0)6�7,%2�*35�232>�-64%2-'$,-7)�1%0)6����)(-%2�)%52>-2+6�3*��-64%2-'�1%0)6��������:)5)������4)5')273*�7,36)�3*�232>�-64%2-'$,-7)�1%0)6����� �������)>(-%2�)%52-2+6�3*��-64%2-'*)1%0)6�����������:)5)�����4)5')27�3*�7,36)�3*�232>�-64%2-'�$,-7)�*)1%0)6�����������",)�5%7-3�3**)1%0)>73>1%0)�)%52-2+6�*35�-64%2-'6��������:%6�18',,-+,)5�7,%2�7,)�5%7-3�*35�232>�-64%2-'�$,-7)6�����������
",)�(-**)5)2')6�-2������)%52>-2+6�*35�<)%5>5382(��*800>7-1):35/)56�:)5)�%063�)9-()27�-27,)�(-675-&87-32�3*�7,)�)%52>-2+6����7�7,)�03:�)2(�3*�7,))%52-2+6�(-675-&87-32������4)5')27�3*��-64%2-'�1%0)6)%52)(�0)66�7,%2���������%<)%5��'314%5)(�:-7,�� 4)5')27�*35�232>�-64%2-'$,-7)�1%0)6����7�7,)�,-+,�)2(3*�7,)�(-675-&87-32������4)5')273*��-64%2-'�1%0)6�,%(�)%52>-2+6�3*���������35�135)�'314%5)(�:-7,� ���4)5')273*�232>�-64%2-'�$,-7)�1%0)6��132+�*)1%0)6����� �4)5')273*��-64%2-'6�%2(�����4)5')27
3*�232>�-64%2-'�$,-7)6�,%()%52-2+6�3*�0)66�7,%2���������:,-0)� � �4)5')27�3*��-64%2>-'6�%2(�� ���4)5')27�3*�232>�-64%2-'�$,-7)6�,%(�)%52-2+63*��������35�135)�
Hispanics are more likely tolive below the poverty levelthan non-Hispanics.�2�������7,)�439)57<�5%7)�:%6���4)5')27�*35��-64%2-'6�'314%5)(�:-7,�����*35�232>�-64%2-'�$,-7)6����07,38+,320<�%&387���-2�)9)5<���4)340)�-2�7,)�#2-7)(�!7%7)6:%6��-64%2-'��135)�7,%2�-2�)9)5<����4)340)����4)5')27��0-9-2+�-2�439)57<:%6��-64%2-'�
�-64%2-'�',-0(5)2�:)5)135)�0-/)0<�7,%2�232>�-64%2-'$,-7)�',-0(5)2�73�&)�0-9-2+&)03:�7,)�439)57<�0)9)0����2��������� �4)5')27�3*��-64%2>-'�',-0(5)2�82()5����<)%56�30(:)5)�0-9-2+�-2�439)57<�'314%5)(�:-7,�����4)5')273*�232>�-64%2-'�$,-7)�',-0>(5)2����-64%2-'�',-0(5)25)45)6)27)(������4)5')27�3*%00�',-0(5)2�-2�7,)�#2-7)(!7%7)6�&87�:)5)�����4)5')273*�%00�',-0(5)2�-2�439)57<�
For Further Information:!))����855)27��3480%7-32 )43576��!)5-)6���>������������������������������������� ���������������������%2(�8248&0-6,)(�:35/�7%&0)6*531�7,)��%5',���� ��855)27�3480%7-32�!859)<�
�327%'7���3,2���� ))(�7,2-'�%2(��-64%2-'���!7%7-67-'6��5%2',��>���>��.5))(�')2686�+39

21.������� � ������������ ������������
Claudette E. BennettKymberly A. Debarros
Figure 21-1.
Median Earnings of Year-Round, Full-TimeWorkers 25 Years Old and Over, by EducationalAttainment, Sex, and Race: 1995 �$/(
�(0$/(
�,*+�5&+22/�*4$'7$6(�21/:
�$&+(/24�5�'(*4((�24�024(
�,*+�5&+22/�*4$'7$6(�21/:
�$&+(/24�5�'(*4((�24�024(
Asian and Pacific Islander
White, non-Hispanic
������
�����
������
�����
������
������
������
�����
�274&(���!�����74($7�2)�6+(��(1575���744(16��237/$6,21��748(:�
46 U.S. Census Bureau, the Official StatisticsTM September 21, 1998
The Asian and PacificIslander population isgrowing rapidly.�1���� ��6+(��5,$1�$1'�$&,),&��5/$1'(4�3237/$6,219$5�(56,0$6('�$6�����0,//,21�73�)420����0,//,21�4(&24'('�,16+(������&(1575�����,1&(������6+(��5,$1�$1'��$&,),&�5/$1'(4�3237/$6,21�+$5�*4291$%276��3(4&(16�3(4�:($4��00,*4$6,21�62�6+(�!1,6('�6$6(5�$&&2716('�)24�07&+�2)6+,5�*4296+��$%276�� �3(4;&(16���6+(�%$/$1&(�9$5�'7(62�1$674$/�,1&4($5(��%,46+5
�� +(��744(16��237/$6,21�748(:�������(56,0$6(��%$5('21�$�5$03/(��,5�57%-(&6�625$03/,1*�$1'�1215$03/,1*(44245����6�,5�126�&21642//('�62,1'(3(1'(16�(56,0$6(5�)24�6+,53237/$6,21����56,0$6(5�0$:',))(4�%(&$75(�2)�',))(4(16'$6$�&2//(&6,21�$1'�(56,0$6,21342&('74(5�$1'�5$03/,1*(4424����29(8(4��',564,%76,2152)�&+$4$&6(4,56,&5�)24�6+(�5,$1�$1'��$&,),&��5/$1'(43237/$6,21�,1�6+(��$4&+���� ����$33($4�4($521$%/(�9+(1&203$4('�9,6+�6+(�����&(1575�',564,%76,21���"+(1&203$4,1*�'$6$�)24�6+(��5,$1$1'��$&,),&��5/$1'(4�3237/$;6,21�)24�34(8,275�:($45��&$7;6,21�5+27/'�%(�75('�
0,175�'($6+5���� +(��5,$1$1'��$&,),&��5/$1'(4�3237/$;6,21�$&&2716('�)24����3(4&(162)��0(4,&$�5�3237/$6,21�,1��� ����:�6+(�:($4������6+,53237/$6,21�,5�342-(&6('�624($&+�����0,//,21�$1'�4(34(;5(16�$%276���3(4&(16�2)�6+(626$/�3237/$6,21�
+(��5,$1�$1'��$&,),&�5/$1'(4�3237/$6,21�,5�+(6(42;*(1(275�$1'�,1&/7'(5�*427356+$6�',))(4�,1�/$1*7$*(��&7/674(�$1'�4(&(1&:�2)�,00,*4$6,21��(8(4$/��5,$1�*42735��57&+$5�6+(��+,1(5(�$1'��$3$;1(5(��+$8(�%((1�,1�6+,5�&271;64:�)24�*(1(4$6,215����1�&21;64$56��4(/$6,8(/:�)(9��$&,),&�5/$1'(45�$4(�)24(,*1�%241��$9$,,$15��2)�&2745(��$4(1$6,8(�62�6+,5�&27164:�
",6+�$�0(',$1�$*(�2)����:($45�,1���� ��6+(��5,$1�$1'�$&,),&��5/$1'(4�3237/$6,219$5�:271*(4�6+$1�6+(�121;�,53$1,&�"+,6(�3237/$6,21�0(',$1�$*(�2)� ���:($45�� +,5�',))(4(1&(�4()/(&6('�6+($*(�5647&674(�2)�6+(�692*42735����3(4&(16�2)�6+(�5,$1�$1'��$&,),&��5/$1'(43237/$6,21�9(4(�71'(4���:($45�2/'��$1'� � �3(4&(169(4(� ��:($45�2/'�$1'�28(4��1�&2164$56����3(4&(16�2)
121;�,53$1,&�"+,6(5��9(4(71'(4����:($45��$1'����3(4;&(16�9(4(� ��:($45�$1'�28(4�
A majority of the Asian andPacific Islander populationlives in just three states. �1���� �����3(4&(16�2)�6+(�5,$1�$1'��$&,),&��5/$1'(43237/$6,21�/,8('�,1�6+(�"(56�9+(4(�6+,5�3237/$6,21�4(34(;5(16('���3(4&(16�2)�6+(�4(;*,21�5�3237/$6,21�����0$-24,6:����3(4&(16��2)�6+(��5,$1�$1'�$&,),&��5/$1'(4�3237/$6,21/,8('�,1�-756�6+4((�56$6(5��$/,)241,$���(9�#24.��$1'�$9$,,�
+(�8$56�0$-24,6:�����3(4&(16�2)�6+(��5,$1�$1'��$&,),&��5;/$1'(4�3237/$6,21�/,8('�,10(64232/,6$1�$4($5�,1���� ��)��6+(5(��21(;+$/)��/,8('�,1�6+(57%74%5�2)�0(64232/,6$1�$4($5�$�/,66/(�/(55�6+$1�21(;+$/)����3(4&(16��/,8('�,1�6+(�&(164$/&,6,(5�2)�0(64232/,6$1�$4($5� +(��5,$1�$1'��$&,),&��5/$1';(4�3237/$6,21�4(34(5(16('��3(4&(16�2)�6+(�626$/�3237/$6,21/,8,1*�,1�6+(�57%74%5�$1'��3(4&(16�2)�6+(�626$/�3237/$6,21/,8,1*�,1�6+(�&(164$/�&,6,(5�

Figure 21-2.
Poverty Rates, by Type of Familyand Race of Householder: 1995��2�4*5(*27�
�6.&2�&2)� &(.+.(��60&2)*5
%-.7*��232>�.64&2.(
�&55.*)>(3840*+&1.0.*6
�*1&0*�-386*-30)*5�23�64386*�45*6*27
�&0*�-386*-30)*5�23�64386*�45*6*27
���
���
���
�
���
�
"385(*���$�"���85*&8�3+�7-*��*2686���855*27� 3480&7.32�"859*<�
47U.S. Census Bureau, the Official StatisticsTM September 21, 1998
Asian and Pacific Islanderfamilies were more likelythan non-Hispanic Whitefamilies to be large.�2������7-*�&9*5&,*�6.=*�+35'37-��6.&2�&2)� &(.+.(��60&2)>*5�+&1.0.*6�&2)�232>�.64&2.(%-.7*�+&1.0.*6�:&6�&'387�+3854*340*����'387����4*5(*27�3+�6.&2�&2)� &(.+.(��60&2)*5+&1.0.*6�-&)�7-5**�35�135*4*340*��(314&5*)�:.7-� �4*5(*27�3+�232>�.64&2.(�%-.7*+&1.0.*6����2�&)).7.32���6.&2&2)� &(.+.(��60&2)*5�+&1.0.*6:*5*�7:.(*�&6�0./*0<�73�-&9*+.9*�35�135*�4*340*�&6�232>�.64&2.(�%-.7*�+&1.0.*6��4*5(*27�9*5686��4*5(*27��
".;�.2�7*2��6.&2�&2)� &(.+.(�60&2)*5�+&1.0.*6�-&)�5*0&7*)(-.0)5*2�82)*5���<*&56�30)�(314&5*)�:.7-� �.2���232>�.64&2.(�%-.7*�+&1.0.*6��3:*9*5��7-*�7:3�,53846-&)�&�6.1.0&5�4534357.32�3+5*0&7*)�(-.0)5*2�82)*5��<*&56�30)�0.9.2,�:.7-�'37-4&5*276��&'387����4*5(*27��
Educational attainmentremains high for theAsian and PacificIslander population.�2������&132,�7-*��6.&2&2)� &(.+.(��60&2)*5�43480&>7.32� �<*&56�30)�&2)�39*5�2*&50<���387�3+���1*2�&2)&'387���387�3+���:31*2�-&)
&7�0*&67�&�-.,-�6(-330�).403>1&����3:*9*5��-.,-�6(-330(3140*7.32�5&7*6�9&5.*)�:.)*0<&132,��6.&2�&2)� &(.+.(�60&2)*5�,53846���#-*����(*2686��7-*�0&7*67�)&7*�+35:-.(-�67&7.67.(&00<�5*0.&'0*�)&7&+35�7-*�,53846�&5*�&9&.0&'0*�6-3:*)�7-&7�&132,��6.&26�7-*�5&7*�9&5.*)�+531���4*5>(*27�+35��132,6��:-3�&5*&132,�7-*�1367�5*(*27�6.&2�.11.,5&27�,53846��73���4*5(*27�+35��&4&2*6*��:-3-&9*�'**2�.2�7-.6�(38275<�+356*9*5&0�,*2*5&7.326�
%.7-.2�7-*� &(.+.(��60&2)*5,5384��7-*�4534357.32�:.7-&7�0*&67�&�-.,-�6(-330�).4031&5&2,*)�+531����4*5(*27+35�#32,&26�73����4*5(*27+35��&:&..&26�
��03:*5�4534357.32�3+��6.&26&2)� &(.+.(��60&2)*56� �<*&56&2)�39*5�7-&2�3+�(314&5&'0*232>�.64&2.(�%-.7*6�-&)�&70*&67�&�-.,-�6(-330�).4031&�.2��������4*5(*27�9*5686���4*5(*27��5*64*(7.9*0<���&0>7-38,-�7-*�).++*5*2(*�.2�7-*4*5(*27&,*6�:&6�5*0&7.9*0<61&00����3:*9*5��7-*�453435>7.32�3+�7-*��6.&2�&2)� &(.+.(�60&2)*5�43480&7.32�:-3(3140*7*)�(300*,*����4*5>(*27��:&6�&01367�7:.(*�7-&7�3+7-*�232>�.64&2.(�%-.7*�4348>0&7.32����4*5(*27��
�6.&2�&2)� &(.+.(��60&2)*51*2�&2)�:31*2�����4*5(*27&2)����4*5(*27��5*64*(7.9*0<�:*5*�135*�7-&2����7.1*6&6�0./*0<�73�-&9*�&�'&(-*035�6)*,5**�7-&2�232>�.64&2.(%-.7*�1*2�&2)�:31*2���4*5(*27�&2)���4*5(*27�5*64*(7.9*0<��
!*6*&5(-*56�-&9*�68,,*67*)7-&7�4&67�6*0*(7.9*�1.,5&7.32�3+135*�-.,-0<�*)8(&7*)�4*340*+531��6.&�&2)�7-*� &(.+.(�60&2)6�1&<�-&9*�(3275.'87*)73�7-*�-.,-�*)8(&7.32&0�&77&.2>1*27�3+�7-.6�,5384����3:*9*5�7-*�*)8(&7.32&0�&77&.21*27�3+7-*�2&7.9*>'352��6.&2�&2) &(.+.(��60&2)*5�43480&7.32:&6�&063�-.,-�����7�.6�&063.14357&27�73�237*�7-&7�7-*4534357.32�(3140*7.2,�-.,-6(-330�&2)�(300*,*�9&5.*6,5*&70<�&132,�7-*��6.&2�&2) &(.+.(��60&2)*5�,53846�
Median income is similarfor Asian and PacificIslander families andfor non-HispanicWhite families.�2��� ��7-*�1*).&2�.2(31*3+��6.&2�&2)� &(.+.(��60&2)*5+&1.0.*6�����������:&6�6.1.0&573�7-&7�3+�232>�.64&2.(�%-.7*+&1.0.*6���� �������#-*1*).&2�.2(31*�3+�*&(-,5384�:&6�&063�6.1.0&5&132,�+&1.0.*6�1&.27&.2*)'<�:31*2�:.7-�23�64386*45*6*27��&'387���� ���&2)&132,�7-36*�1&.27&.2*)�'<1*2�:.7-�23�64386*�45*6*27�&'387��������+35��6.&2�&2) &(.+.(��60&2)*5�+&1.0.*6�&2)�������+35�232>�.64&2.(%-.7*�+&1.0.*6��
�2��� ��1*).&2�*&52.2,6�3+7-*��6.&2�&2)� &(.+.(��60&2)*543480&7.32� �<*&56�30)�&2)39*5�:.7-�&�-.,-�6(-330*)8(&7.32�:-3�:35/*)�<*&55382)��+800�7.1*�������:*5*03:*5�7-&2�7-36*�3+�7-*�(31>4&5&'0*�232>�.64&2.(�%-.7*43480&7.32��� �� ���
�6.&26�&2)� &(.+.(��60&2)*56:.7-�&�'&(-*035�6�)*,5**�35135*�&063�-&)�03:*5�1*).&2*&52.2,6�����������7-&2(314&5&'0*�232>�.64&2.(%-.7*6������ �����%31*2:.7-�&7�0*&67�&�'&(-*035�6)*,5**�-&)�6.1.0&5�*&52.2,6����� ��+35��6.&26�&2) &(.+.(��60&2)*56�&2)����� �
+35�232>�.64&2.(�%-.7*6���.,85*�>�����314&5&'0<*)8(&7*)��6.&2�&2)� &(.+.(�60&2)*5�1*2��32�7-*�37-*5-&2)��*&52*)�&'387����+35*9*5<�����*&52*)�'<�7-*.5232>�.64&2.(�%-.7*�1&0*(3827*54&576��������(314&5*)�:.7-�� ������
�132,�7-*��6.&2�&2)� &(.+.(�60&2)*5�43480&7.32�.2��� �1*2� �<*&56�30)�&2)�39*5:-3�:35/*)�<*&5�5382)��+8007.1*�-&)�-.,-*5�1*).&2*&52.2,6����������7-&2(314&5&'0*�:31*2����� ���
The poverty rate forAsian and Pacific Islanderfamilies is more that twicethat for non-HispanicWhite families.�*64.7*�-.,-*5�*)8(&7.32&0&77&.21*27�&2)�&�6.1.0&5�1*>).&2�+&1.0<�.2(31*���6.&2�&2) &(.+.(��60&2)*5�+&1.0.*6�-&)�&439*57<�5&7*���4*5(*27�)38'0*�7-&7�+35�232>�.64&2.(�%-.7*�+&1.0.*6���4*5(*27��.2��� ����0*9*24*5(*27�3+��6.&2�&2)� &(.+.(�60&2)*5�1&55.*)>(3840*�+&1.>0.*6�&2)���4*5(*27�3+�(355*>6432).2,�232>�.64&2.(�%-.7*+&1.0.*6�0.9*)�.2�439*57<���.,>85*�>����#-*5*�:&6�2367&7.67.(&0�).++*5*2(*�.2�7-*439*57<�5&7*6�+35�+*1&0*-386*-30)*5�+&1.0.*6���4*5(*27�+35��6.&2�&2)� &(.+.(�60&2)*5�&2)��4*5(*27�+35232>�.64&2.(�%-.7*��
�9*5&00�.2��� ������4*5(*273+��6.&26�&2)� &(.+.(��60&2)>*56�:*5*�4335��(314&5*):.7-��� �4*5(*27�3+�232>�.64&2.(�%-.7*6�
For Further Information"**���855*27� 3480&7.32!*43576��"*5.*6� �> ����������� �� ��� �������� ��������� ������������������� ������ ���������$4)&7*��&2)�7&'0*6�32�7-*�27*52*7��&7���:::�(*2686�,39
�327&(7��0&8)*77*�����*22*77�35�<1'*50<�����*'&5536!&(.&0�"7&7.67.(6��5&2(-���>� �>� �(0&8)*77*�*�'*22*77����((1&.0�(*2686�,39/<1'*50<�&�)*'&5536����((1&.0�(*2686�,39

�
��
�
��
�
���
��� ���� ���� �� � ���� ���� ���� ���� ���� ��� ���
22.��������
Ken Bryson
Figure 22-1.
Estimates and Projections of the Number and Percentof Children Under 18 Years Old: 1950 to 2050��1*�"./�&+�*&))&,+/�
�,1. "���������1."�1�,#�0%"��"+/1/��"/0&*�0"/��+!�-.,'" 0&,+/�
�,-1)�0&,+�1+!".�� �5"�./
�". "+0�1+!".�� �5"�./
�
��
�
��
�
�����+�-". "+0�
48 U.S. Census Bureau, the Official StatisticsTM September 21, 1998
The number of Americanchildren is up, but theirshare of the country’spopulation is down.�%"�+1*�".�,#� %&)!."+�)"//0%�+�� �5"�./�,)!�."� %"!��+�))60&*"�%&$%�,#�������*&))&,+�&+��������+�������#,)),3&+$�0%"���5��,,*������0,������0%"."�3"."��)*,/0��/�*�+5 %&)!."+�������*&))&,+���/�&+��������%"+�0%"�+1*�".!" )&+"!�0,�����*&))&,+�&+�� ���+!�."�,1+!"!�/)&$%0)50,�����*&))&,+�&+������
�%"��"+/1/��1."�1�-.,'" 0/�� ,+0&+1&+$�&+ ."�/"�&+�0%"+1*�".�,#� %&)!."+�&#� 1.."+0)"2")/�,#�#".0&)&05��+!�*&$.�0&,+-"./&/0����&$1."���6��/%,3/"/0&*�0"/��+!�-.,'" 0&,+/�,#0%"�+1*�".�,#� %&)!."+�#,.�0%"-".&,!�����0,�����
�"03""+�������+!������ %&)!."+�1+!".�� �5"�./�,)!�/���-". "+0�$"�,#�0%"�0,0�)-,-1)�0&,+�!.,--"!�#.,*��-". "+0�0,����-". "+0��%&/�!,3+3�.!�0."+!�&/�"46-" 0"!�0,� ,+0&+1"���10�*,."/),3)5��0�-".&+$�0,���-". "+0&+�����
�2".�0%"���65"�.�-".&,!��0%")&2&+$��..�+$"*"+0/�,#� %&)6!."+� %�+$"!�/1�/0�+0&�))5��+������� �-". "+0�,# %&)!."+�)&2"!�3&0%��,0%�
-�."+0/����10��5�������0%&/-.,-,.0&,+�%�!�!.,--"!�0,� �-". "+0����!!&0&,+�))5��&+��������-". "+0�,#� %&)!."+)&2"!�&+�*,0%".6 %&)!�#�*&)&"/��-". "+0�&+�#�0%".6 %&)!�#�*&6)&"/���+!��-". "+0�&+�)&2&+$�..�+$"*"+0/�3&0%�+"&0%".-�."+0�-."/"+0��
�/��&$1."���6��/%,3/��0%")&2&+$��..�+$"*"+0/�,#� %&)6!."+�!&##"."!��5�.� "��+!�&/-�+& �,.&$&+��,#��+5�.� "���+����������-". "+0�,#�+,+6�&/-�+& ��%&0"� %&)!."+�3".")&2&+$�3&0%��,0%�-�."+0/� ,*-�."!�3&0%����-". "+0,#��&/-�+& � %&)!."+��+!���-". "+0�,#�+,+6�&/-�+& �)� (� %&)!."+�
���,*"� %&)!."+� )�//&#&"!��/)&2&+$�3&0%��,0%�-�."+0/�3".")&2&+$�3&0%�/0"-6�,.��!,-0&2"-�."+0/�.�0%".�0%�+�3&0%��&.0%-�."+0/�
���%&)!."+�)&2&+$�3&0%�+"&0%".-�."+0�3"."�)&2&+$�&+�*�+505-"/�,#�#�*&)5��+!�+,+#�*&)5%,1/"%,)!/����%"/"�%,1/"6%,)!/�&+ )1!"!�0%,/"�3&0%#,/0".� %&)!."+�� %&)!."+�)&2&+$&+�0%"�%,*"/�,#�$.�+!-�."+0/�+!�,0%".�.")�0&2"/���/�3"))�/� %&)!."+���0,����5"�./,)!�)&2&+$��),+"�,.�3&0%��/-,1/"��1+*�..&"!�-�.0+".�,.�.,,**�0"�
�+����������*&))&,+� %&)!."+3"."�)&2&+$�3&0%���*,0%".�3%,%�!�+"2".�*�..&"!����%&/."-."/"+0"!���-". "+0�,#��)) %&)!."+�1+!".�� �5"�./�,)!�+!����-". "+0�,#�0%,/"�&+*,0%".6 %&)!�)&2&+$��..�+$"6*"+0/�3&0%�0%"�#�0%".���/"+0��+� ,+0.�/0��0%"�+1*�".�,# %&)!."+�)&2&+$�3&0%���+"2".6*�..&"!�*,0%".�3�/�,+)5���*&))&,+�&+��������
�#�0%,/"�&+�*,0%".6 %&)!�#�*&)5$.,1-/�&+�������.,1$%)5�,+"6#�%�,#�+,+6�&/-�+& ��%&0" %&)!."+��03,6#�%/�,#��&/-�+& %&)!."+���+!�0%.""6#�%/�,#+,+6�&/-�+& ��)� (� %&)!."+%�!���+"2".6*�..&"!�*,0%".�
About 1 child in 5 livesin poverty.�%"������ %&)!�-,2".05�.�0"�,#����-". "+0�3�/�),3".�0%�+&+�������3%"+�0%"�.�0"�3�/�����-". "+0���10�%&$%".�0%�+&+�������3%"+�0%"�.�0"�3�/,+)5�����-". "+0����&+ "������0%&/�-". "+0�$"�%�/#,)),3"!���#)1 01�0&+$��$"+".6�))5�1-3�.!� ,1./"����%"� %&)!-,2".05�.�0"�3�/�� ���-". "+0&+��� ���+!������-". "+0&+������
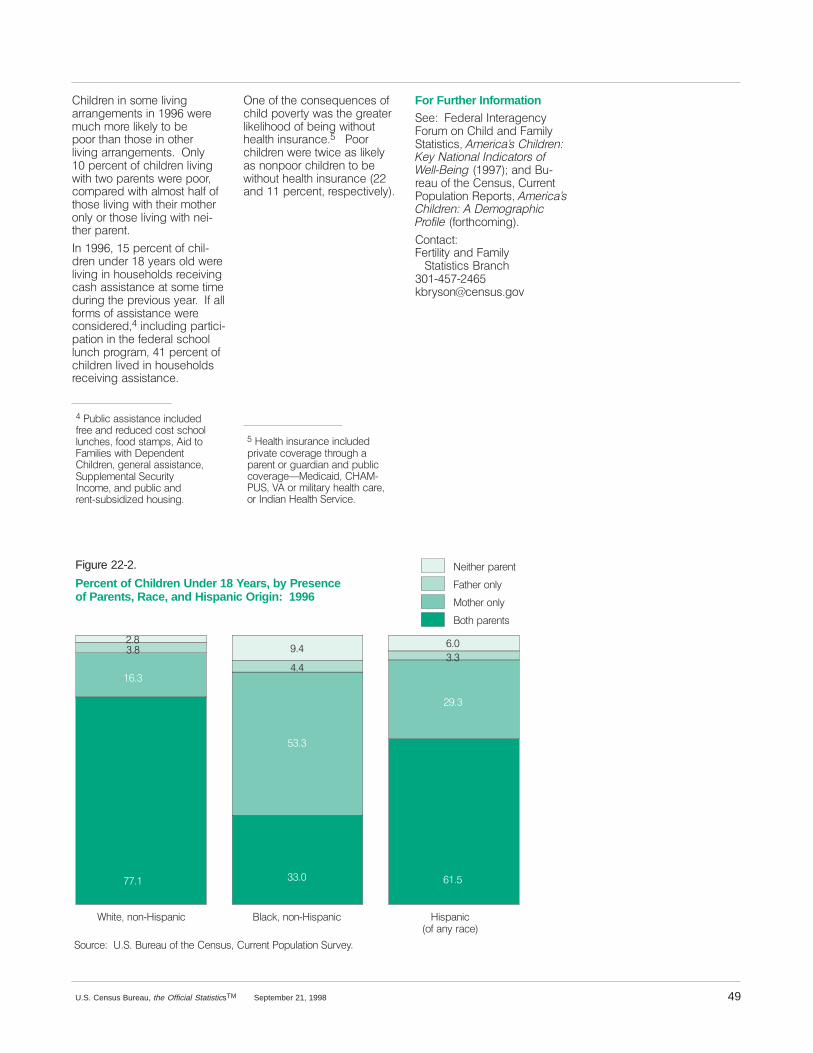
Figure 22-2.
Percent of Children Under 18 Years, by Presenceof Parents, Race, and Hispanic Origin: 1996
�������
����
����
����
���
!)*4&��./.:�*30".*$ �*30".*$�/'�".8�2"$&�
�,"$+��./.:�*30".*$
�� ���
�
�/52$&���������52&"5�/'�4)&��&.353���522&.4��/05,"4*/.��526&8�
�&*4)&2�0"2&.4
�"4)&2�/.,8
�/4)&2�/.,8
�/4)�0"2&.43
�� �����
49U.S. Census Bureau, the Official StatisticsTM September 21, 1998
�)*,%2&.�*.�3/-&�,*6*.("22".(&-&.43�*.������7&2&-5$)�-/2&�,*+&,8�4/�#&0//2�4)".�4)/3&�*.�/4)&2,*6*.(�"22".(&-&.43����.,8���0&2$&.4�/'�$)*,%2&.�,*6*.(7*4)�47/�0"2&.43�7&2&�0//2�$/-0"2&%�7*4)�",-/34�)",'�/'4)/3&�,*6*.(�7*4)�4)&*2�-/4)&2/.,8�/2�4)/3&�,*6*.(�7*4)�.&*:4)&2�0"2&.4�
�.���������0&2$&.4�/'�$)*,:%2&.�5.%&2�� �8&"23�/,%�7&2&,*6*.(�*.�)/53&)/,%3�2&$&*6*.($"3)�"33*34".$&�"4�3/-&�4*-&%52*.(�4)&�02&6*/53�8&"2����'�",,'/2-3�/'�"33*34".$&�7&2&$/.3*%&2&%��*.$,5%*.(�0"24*$*:0"4*/.�*.�4)&�'&%&2",�3$)//,,5.$)�02/(2"-����0&2$&.4�/'$)*,%2&.�,*6&%�*.�)/53&)/,%32&$&*6*.(�"33*34".$&�
��5#,*$�"33*34".$&�*.$,5%&%'2&&�".%�2&%5$&%�$/34�3$)//,,5.$)&3��'//%�34"-03���*%�4/�"-*,*&3�7*4)��&0&.%&.4��)*,%2&.��(&.&2",�"33*34".$&��500,&-&.4",��&$52*48�.$/-&��".%�05#,*$�".%2&.4:35#3*%*9&%�)/53*.(�
�.&�/'�4)&�$/.3&15&.$&3�/'$)*,%�0/6&248�7"3�4)&�(2&"4&2,*+&,*)//%�/'�#&*.(�7*4)/54)&",4)�*.352".$&�����//2$)*,%2&.�7&2&�47*$&�"3�,*+&,8"3�./.0//2�$)*,%2&.�4/�#&7*4)/54�)&",4)�*.352".$&����".%����0&2$&.4��2&30&$4*6&,8��
��&",4)�*.352".$&�*.$,5%&%02*6"4&�$/6&2"(&�4)2/5()�"0"2&.4�/2�(5"2%*".�".%�05#,*$$/6&2"(&;�&%*$"*%������:����� ��/2�-*,*4"28�)&",4)�$"2&�/2��.%*".��&",4)��&26*$&�
For Further Information�&&����&%&2",��.4&2"(&.$8�/25-�/.��)*,%�".%��"-*,8�4"4*34*$3������� ����������������������������� ���������������������������".%��5:2&"5�/'�4)&��&.353���522&.4�/05,"4*/.��&0/243������� ������������������������� ��������'/24)$/-*.(��
�/.4"$4��&24*,*48�".%��"-*,8����4"4*34*$3��2".$)���:�:��+#283/.�$&.353�(/6

23.������� ���������
Denise I. Smith
Figure 23-1.
Percent Elderly, by Race andHispanic Origin: 1996 and 2050 ����
����
�'(2$
�+ "*
�,$0(" -��-#( -���1*(,.�� -#��+$32
�1( -� -#�� "(%("��1+ -#$0
�(1/ -("�.0(&(-��.%� -7�0 "$�
��(##+$81$0($1�/0.)$"2(.-1�
����
����
����
���
���
���
���
��
���
����
��
��
�++�0 "$1
�.30"$���������30$ 3�.%�2'$��$-131��$12(, 2$1 -#�/0.)$"2(.-1�
50 U.S. Census Bureau, the Official StatisticsTM September 21, 1998
The elderly populationincreased dramaticallybetween 1900 and 1996.�-�2'(1�"$-2307��2'$�0 2$�.%&0.52'�.%�2'$�$+#$0+7�/./3+ 82(.-��/$./+$����7$ 01�.+#� -#.4$0��&0$ 2+7�$6"$$#$#�2'$&0.52'�0 2$�.%�2'$�/./3+ 2(.-.%�2'$�".3-207� 1� �5'.+$��'$�$+#$0+7�/./3+ 2(.-�5 1���2(,$1�+ 0&$0�(-�������,(++(.-��2' -�(-��������,(+8+(.-�����-�".,/ 0(1.-��2'$�2.2 +/./3+ 2(.-�� 1�5$++� 1�2'$/./3+ 2(.-�3-#$0����7$ 01.+#��20(/+$#�
�-#$0�2'$��$-131��30$ 3�1,(##+$81$0($1�/./3+ 2(.-/0.)$"2(.-1��2'$�-3,!$0�.%/$./+$����7$ 01� -#�.4$0�5(++,.0$�2' -�#.3!+$�!7�2'$,(##+$�.%�2'$�-$62�"$-2307�2. ��,(++(.-����'$�$+#$0+7� 0$/0.)$"2$#�2.�(-"0$ 1$�%0.,�����/$0"$-2�.%�2'$�2.2 +�/./38+ 2(.-�(-������2.����/$0"$-2�(-����� !.32����7$ 01� %2$0�2'$$-#�.%�2'$����8��� !7�..,�� -#�2.�0$, (-� 2� !.32���/$0"$-2�3-2(+�������
The oldest old is thefastest-growing segment ofthe elderly population.�'$�.+#$12�.+#��/$./+$���7$ 01�.+#� -#�.4$0��5$0$� 1, ++�!32�0 /(#+7�&0.5(-&
&0.3/��".,/0(1(-&�)312�.4$0��/$0"$-2�.%�2'$��,$0(" -/./3+ 2(.-�(-���������'(1/./3+ 2(.-�5 1�".,/0(1$#�.%���,(++(.-�/$./+$�(-������ !.32���2(,$1�+ 0&$0�2' -�(-��������0.,������2.�������2'(1&0.3/�(-"0$ 1$#����/$0"$-2�".,/ 0$#�5(2'� -�(-"0$ 1$�.%���/$0"$-2�%.0�/$./+$���7$ 01� -#�.4$0� -#� -�(-8"0$ 1$�.%� �/$0"$-2�%.0�2'$2.2 +�/./3+ 2(.-����4$0 ++��2'$.+#$12�.+#� 0$�/0.)$"2$#�2.�!$2'$�% 12$128&0.5(-&�1$&,$-2.%�2'$�$+#$0+7�/./3+ 2(.-�(-2.2'$�-$62�"$-2307�
As age increases, thesex ratio decreases.�$0' /1�-.�%$ 230$�.%�2'$.+#$12�.+#�5 1� 1�120(*(-& 1�2'$(0�1$6�0 2(.��2'$�-3,!$0.%�, +$1�/$0�����%$, +$1��5'("'�5 1���(-��������,(++(.-�, +$1�4$0131��� ,(++(.-�%$, +$1�����-�".-20 12�2'$�1$6�0 2(.�5 1���%.0/$./+$����2.����7$ 01�.+#�
The racial and ethnicdiversity among the elderlyis expected to increase inthe future.�%�2'$�".3-207�1�$+#$0+7�(-������ !.32���,(++(.-5$0$��'(2$������,(++(.-
5$0$��+ "*���������5$0$�,$0(" -��-#( -���1*(,.� -#��+$32���������5$0$�1( -� -#�� "(%("��1+ -#$0� -#�����,(++(.-�5$0$�.%�(1/ -("�.0(&(-��.%� -7�0 "$��
�'$�$+#$0+7�/./3+ 2(.-�(1$6/$"2$#�2.�!$".,$�,.0$0 "( ++7� -#�$2'-(" ++7�#(4$01$(-�2'$�%3230$����(1/ -("�$+#$0+75.3+#�(-"0$ 1$�%0.,���/$0"$-2.%�2'$�2.2 +�$+#$0+7�/./3+ 2(.-(-������2.�� �/$0"$-2�!7�2'$,(##+$�.%�2'$�-$62�"$-2307��'$�/$0"$-2��+ "*�.%�2'$�2.2 +$+#$0+7�/./3+ 2(.-� +1.�5.3+#(-"0$ 1$�#30(-&�2'$�".,(-&#$" #$1����7�2'$�,(##+$�.%2'$�-$62�"$-2307��2'$�-.-8�(1/ -("��+ "*�/0./.02(.-�.%2'$�$+#$0+7�/./3+ 2(.-�5.3+#!$����/$0"$-2��2'$�-.-8�(1/ -("��'(2$�/0./.02(.-����/$0"$-2�� -#�2'$��1( -� -#� "(%("��1+ -#$0�/0./.02(.-���/$0"$-2�
�'$�/0./.02(.-�$+#$0+7�5(2'(-$ "'�.%�2'$�%.30�, ).0�0 "$&0.3/1� -#�2'$��(1/ -("/./3+ 2(.-�(1�/0.)$"2$#�2.(-"0$ 1$�13!12 -2( ++7�#30(-&2'$�%(012�' +%�.%�2'$���12"$-2307���(&30$��8�������0.,����� -#�������2'$�/0./.02(.-$+#$0+7�5.3+#�(-"0$ 1$�%0.,��/$0"$-2�2.����/$0"$-2�%.0�'(2$1��%0.,���/$0"$-2�2.��
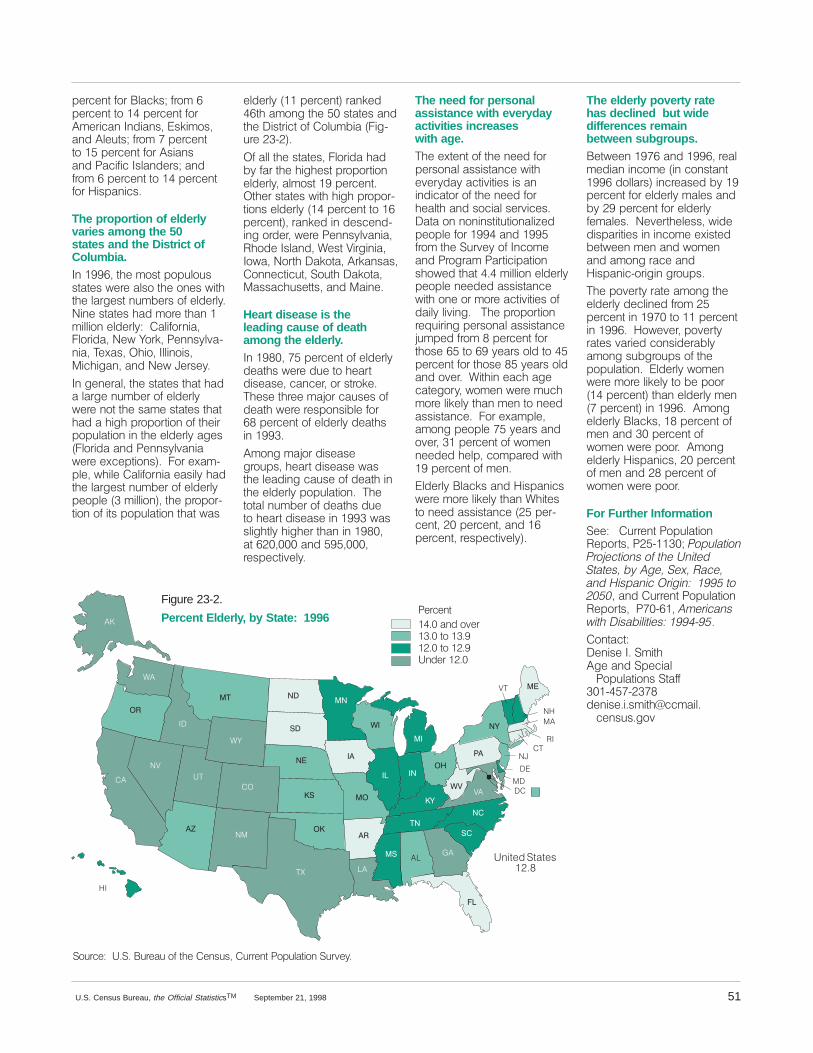
Figure 23-2.
Percent Elderly, by State: 1996����*7-�8?.;�����=8����������=8�����%7-.;�����
%72=.-�#=*=.<���
'�
�
��
�&
����
$( ��
��
�
��
��
��
�
')
%$
�
��
��
���
��
��
�
��
�
�
���
��
��
�
&���
��
�
�
��
��
��
��
���$
"�
��
&$
��
��
�
�
!.;,.7=
#8>;,.���%�#���>;.*>�8/�=1.��.7<><���>;;.7=�!89>5*=287�#>;?.B�
51U.S. Census Bureau, the Official StatisticsTM September 21, 1998
9.;,.7=�/8;��5*,4<��/;86��9.;,.7=�=8���9.;,.7=�/8;�6.;2,*7��7-2*7<���<4268<�*7-��5.>=<��/;86���9.;,.7==8���9.;,.7=�/8;��<2*7<*7-�!*,2/2,��<5*7-.;<��*7-/;86���9.;,.7=�=8���9.;,.7=/8;��2<9*72,<�
The proportion of elderlyvaries among the 50states and the District ofColumbia. �7�������=1.�68<=�989>58><<=*=.<�@.;.�*5<8�=1.�87.<�@2=1=1.�5*;0.<=�7>6+.;<�8/�.5-.;5B��27.�<=*=.<�1*-�68;.�=1*7��6255287�.5-.;5B����*52/8;72*��58;2-*���.@�)8;4��!.77<B5?*D72*��$.A*<�� 128���552782<��2,120*7��*7-��.@��.;<.B�
�7�0.7.;*5��=1.�<=*=.<�=1*=�1*-*�5*;0.�7>6+.;�8/�.5-.;5B@.;.�78=�=1.�<*6.�<=*=.<�=1*=1*-�*�1201�9;898;=287�8/�=1.2;989>5*=287�27�=1.�.5-.;5B�*0.<��58;2-*�*7-�!.77<B5?*72*@.;.�.A,.9=287<�����8;�.A*6D95.��@125.��*52/8;72*�.*<25B�1*-=1.�5*;0.<=�7>6+.;�8/�.5-.;5B9.895.����6255287���=1.�9;898;D=287�8/�2=<�989>5*=287�=1*=�@*<
.5-.;5B�����9.;,.7=��;*74.-�=1�*6870�=1.���<=*=.<�*7-=1.��2<=;2,=�8/��85>6+2*���20D>;.���D���
/�*55�=1.�<=*=.<���58;2-*�1*-+B�/*;�=1.�1201.<=�9;898;=287.5-.;5B��*568<=����9.;,.7=� =1.;�<=*=.<�@2=1�1201�9;898;D=287<�.5-.;5B����9.;,.7=�=8���9.;,.7=���;*74.-�27�-.<,.7-D270�8;-.;��@.;.�!.77<B5?*72*�"18-.��<5*7-��'.<=�&2;0272*��8@*���8;=1��*48=*���;4*7<*<��877.,=2,>=��#8>=1��*48=*��*<<*,1><.==<��*7-��*27.�
Heart disease is theleading cause of deathamong the elderly.�7��� �����9.;,.7=�8/�.5-.;5B-.*=1<�@.;.�->.�=8�1.*;=-2<.*<.��,*7,.;��8;�<=;84.�$1.<.�=1;..�6*38;�,*><.<�8/-.*=1�@.;.�;.<987<2+5.�/8;� �9.;,.7=�8/�.5-.;5B�-.*=1<27������
�6870�6*38;�-2<.*<.0;8>9<��1.*;=�-2<.*<.�@*<=1.�5.*-270�,*><.�8/�-.*=1�27=1.�.5-.;5B�989>5*=287���$1.=8=*5�7>6+.;�8/�-.*=1<�->.=8�1.*;=�-2<.*<.�27������@*<<5201=5B�1201.;�=1*7�27��� ��*=���������*7-�������;.<9.,=2?.5B�
The need for personalassistance with everydayactivities increaseswith age.$1.�.A=.7=�8/�=1.�7..-�/8;9.;<87*5�*<<2<=*7,.�@2=1.?.;B-*B�*,=2?2=2.<�2<�*727-2,*=8;�8/�=1.�7..-�/8;1.*5=1�*7-�<8,2*5�<.;?2,.<��*=*�87�78727<=2=>=287*52C.-9.895.�/8;�����*7-����/;86�=1.�#>;?.B�8/��7,86.*7-�!;80;*6�!*;=2,29*=287<[email protected]�=1*=���6255287�.5-.;5B9.895.�7..-.-�*<<2<=*7,.@2=1�87.�8;�68;.�*,=2?2=2.<�8/-*25B�52?270����$1.�9;898;=287;.:>2;270�9.;<87*5�*<<2<=*7,.3>69.-�/;86� �9.;,.7=�/8;=18<.���=8����B.*;<�85-�=8�9.;,.7=�/8;�=18<.� �B.*;<�85-*7-�8?.;���'2=127�.*,1�*0.,*=.08;B��@86.7�@.;.�6>,168;.�524.5B�=1*7�6.7�=8�7..-*<<2<=*7,.����8;�.A*695.�*6870�9.895.���B.*;<�*7-8?.;�����9.;,.7=�8/�@86.77..-.-�1.59��,869*;.-�@2=1���9.;,.7=�8/�6.7�
�5-.;5B��5*,4<�*7-��2<9*72,<@.;.�68;.�524.5B�=1*7�'12=.<=8�7..-�*<<2<=*7,.����9.;D,.7=�����9.;,.7=��*7-���9.;,.7=��;.<9.,=2?.5B��
The elderly poverty ratehas declined but widedifferences remainbetween subgroups.�[email protected]������*7-�������;.*56.-2*7�27,86.��27�,87<=*7=�����-855*;<��27,;.*<.-�+B���9.;,.7=�/8;�.5-.;5B�6*5.<�*7-+B����9.;,.7=�/8;�.5-.;5B/.6*5.<����.?.;=1.5.<<��@2-.-2<9*;2=2.<�27�27,86.�.A2<[email protected]�6.7�*7-�@86.7*7-�*6870�;*,.�*7-�2<9*72,D8;2027�0;8>9<�
$1.�98?.;=B�;*=.�*6870�=1..5-.;5B�-.,527.-�/;86��9.;,.7=�27������=8����9.;,.7=27���������8@.?.;��98?.;=B;*=.<�?*;2.-�,87<2-.;*+5B*6870�<>+0;8>9<�8/�=1.989>5*=287����5-.;5B�@86.7@.;.�68;.�524.5B�=8�+.�988;���9.;,.7=��=1*7�.5-.;5B�6.7���9.;,.7=��27���������6870.5-.;5B��5*,4<��� �9.;,.7=�8/6.7�*7-����9.;,.7=�8/@86.7�@.;.�988;����6870.5-.;5B��2<9*72,<�����9.;,.7=8/�6.7�*7-�� �9.;,.7=�8/@86.7�@.;.�988;�
For Further Information#..�����>;;.7=�!89>5*=287".98;=<��!�D������ ��#��"��� ����"���!����"������"���"�"�!���&�������%�������������!������� ������������"�������*7-��>;;.7=�!89>5*=287".98;=<���!��D������ ����!$�"���!�����"��!������'���
�87=*,=��.72<.����#62=1�0.�*7-�#9.,2*5���!89>5*=287<�#=*//���D�D��� -.72<.�2�<62=1�,,6*25����,.7<><�08?

���� ���� ���� ��� ��� ���� ���� �� � ���� ���� ����
24.����������������� �����
Kristin A. Hansen Carol S. Faber
Figure 24-1.
Percent of the U.S. Population Who Were Foreign Born: 1900 to 1996
���
��
���
����
���
���
����
���
��
��
!385(*���#�!���85*&8�3+�7-*��*2686��)*(*22.&0�(*2686�&2)��855*27��3480&7.32�!859*<�
52 U.S. Census Bureau, the Official StatisticsTM September 21, 1998
Almost 1 in 10 peoplein the United States isforeign born.�2����������4*5(*27�3+�7-*#2.7*)�!7&7*6��43480&7.32��35����1.00.32�4*340*��:*5*+35*.,2�'352���.,85*��>�����85.2,�7-.6�(*2785<��7-*�453>4357.32�:-3�:*5*�+35*.,2�'352)*(0.2*)�+531�&�-.,-�3+�� �4*5(*27�.2������73�&�03:3+����4*5(*27�.2��� ����!.2(*7-*2��7-&7�4*5(*27&,*�-&6.2(5*&6*)�67*&).0<��
The largest country ofbirth of the foreign-bornpopulation is Mexico.�2�������39*5�-&0+�3+�7-*�(382>75<�6�+35*.,2�'352�:*5*�'352�.27-*�:*67*52�-*1.64-*5*��35*�7-&2�32*>+3857-�3+�7-*
���&7.9*6�&5*�7-36*�'352.2�7-*�#2.7*)�!7&7*6���8*573 .(3��35�&2�3870<.2,�&5*&�3+7-*�#2.7*)�!7&7*6�68(-�&6�8&1�35�7-*�#�!��$.5,.2�60&2)6��&2)�7-36*�'352.2�&�+35*.,2�(38275<�:-3�-&)&7�0*&67�32*�4&5*27�:-3�:&6&�#�!��(.7.=*2����00�37-*54*340*�&5*�+35*.,2�'352���07-38,-�(31436*)�45.1&5.0<3+�0*,&00<�&)1.77*)�.11.>,5&276��7-*�+35*.,2>'35243480&7.32�&063�.2(08)*65*+8,**6��7*1435&5<�5*6.)*27668(-�&6�678)*276�&2)7*1435&5<�:35/*56��&2)�631*82)3(81*27*)�.11.,5&276�
737&0�:*5*�'352�.2��*;.(3���� 1.00.32��������4*5(*27�32�32*3+�7-*��&5.''*&2�.60&2)6�� ��4*5(*27�.2��*275&0��1*5.(&����4*5(*27�.2�!387-��1*5.(&�&2)��� �4*5(*27�.2��&2&)&��3003:.2,��*;.(3��7-*��-.0.4>4.2*6�:&6�7-*�6*(32)�0&5,*67(38275<�3+�35.,.2��:.7-����1.00.32�4*340*�-&9.2,�'**2'352�7-*5*�
�35*�7-&2����4*5(*27�3+�7-*+35*.,2�'352�(0&.1*)��6.&�&67-*.5�'.57-40&(*��&2)�����4*5(*27�:*5*�'352�.2��8534*��20<�&'387�����4*5(*27�(&1*+531�*.7-*5��+5.(&���8675&0.&��3532*�3+�7-*��&(.+.(�.60&2)6��"-*�5*1&.2.2,�����4*5(*27(380)�237�'*�(&7*,35.=*)�'<(38275<�35�(327.2*27��
California has both thelargest number and percentforeign born."-*�+35*.,2>'352�43480&7.32�.2�����:&6�237�).675.'87*)*9*20<�7-538,-387�7-*�(38275<��&0.+352.&�-&)�7-*�0&5,*67+35*.,2>'352�43480&7.32�.27*516�3+�'37-�281'*56���1.00.32��&2)�4*5(*27&,*�32*>+3857-�3+�7-*�67&7*�643480&7.32����.,85*��>���
�*:�%35/�-&)�7-*�6*(32)-.,-*67�281'*5�����1.00.32��3++35*.,2�'352�.2���������7-*567&7*6�:.7-�&7�0*&67���1.00.32+35*.,2>'352�5*6.)*276�.2>
(08)*)��035.)&��"*;&6���*:�*56*<��&2)��00.23.6����)).7.32&067&7*6�:.7-�&7�0*&67����4*5(*273+�7-*.5�43480&7.326�+35*.,2'352�:*5*��*:�%35/���&:&..��035.)&���*:��*56*<���*9&)&�"*;&6���5.=32&��&2) -3)*��60&2)�
Citizenship rates increasewith length of residence.�35*�7-&2�32*>+3857-�3+�7-*#�!��+35*.,2>'352�43480&7.32-&9*�(31*�.273�7-.6�(38275<6.2(*�������&2)�&237-*5��4*5(*27�*27*5*)�)85.2,�7-*����6���"-*�5*1&.2.2,����4*5(*27�3+�7-*�+35*.,2�'352-&9*�'**2�.2�7-.6�(38275<135*�7-&2����<*&56�
�2�����������4*5(*27�3+�7-*(38275<�6�+35*.,2>'352�43480&>7.32�:*5*�2&785&0.=*)�(.7.=*26��
���35*.,2>'352�4*340*���<*&56�30)�&2)�39*5�(&2'*(31*�2&785&0.=*)�(.7.=*263+�7-*�#2.7*)�!7&7*6�&+7*5�7-*<-&9*�0.9*)�-*5*�&�1.2.181�3+��<*&56�&2)�-&9*�4&66*)�&(.7.=*26-.4�*;&1���!4386*63+�#�!��(.7.=*26��&2)�(*57&.237-*5�4*340*��(&2�'*(31*2&785&0.=*)�&+7*5��<*&56��&2)(-.0)5*2�:-3�.11.,5&7*�,*2>*5&00<�'*(31*�(.7.=*26�:-*27-*.5�4&5*276�&5*�2&785&0.=*)�.+7-*�(-.0)5*2�&5*�82)*5���<*&56�30)�&7�7-*�7.1*�

�%0-*362-%
�);�$36/
�%;%--
�036-(%
�);��)67)=
�):%(%
!)<%7
�6->32%
�,3()��70%2(
Figure 24-2.
States With 10 Percent or More of TheirPopulation Foreign Born: 1996
���
����
����
���
���
� �
����
����
����
396')���"� ���96)%9�3*�8,)��)2797���966)28��3490%8-32� 96:)=�
53U.S. Census Bureau, the Official StatisticsTM September 21, 1998
�8�-7�238�/23;2�;,%8�4)6')283*�8,)�6)1%-2-2+�*36)-+2�&362;)6)�320=�8)1436%6=�6)7-@()287��36�;,%8�4)6')28�-2@8)2()(�83�&)'31)�'-8->)27�
!,)�032+)6�8,%8�*36)-+2@&3624)340)�;)6)�-2�8,)�"2-8)( 8%8)7��8,)�136)�0-/)0=�8,)=;)6)�83�&)'31)�2%896%0->)('-8->)27���#,-0)�320=�����4)6')28�3*�8,37)�;,3�)28)6)((96-2+�8,)�����7�;)6)�2%89@6%0->)(�'-8->)27�-2�������8,)6%8)�-2'6)%7)(�83����4)6')28*36�8,37)�;,3�'%1)�(96-2+8,)��� �7�%2(�83� ����4)6')28*36�8,37)�;,3�)28)6)(&)*36)��� ����
!,)�'-8->)27,-4�6%8)�*36�8,)1378�6)')28�%66-:%07�����4)6')28��;%7�03;�*36�7):)6%06)%7327��� 31)�3*�8,)7)4)340)�;)6)�8)1436%6=�6)7-@()287��79',�%7�'300)+)�789@()287�%2(�4)340)�32�8)143@6%6=�&97-2)77�:-7%7��;,3�;-006)8962�83�8,)-6�,31)�'39286=��8,)67�,%(�238�&))2�6)7-@()287�032+�)239+,�83�&))0-+-&0)�*36�2%896%0->%8-32��368,)=�1%=�,%:)�,%(�23�-28)2@8-32�3*�&)'31-2+�"� ��'-8->)27�
Most foreign-bornpeople are White.!,)�*36)-+2@&362�43490%8-32�-2�����-2'09()(�0%6+)6�463436@8-327�3*�1-236-8-)7�8,%2�(-(�8,)2%8-:)�43490%8-32���#,-0)�136)8,%2�8;3@8,-6(7�3*�8,)�*36)-+2@&362�43490%8-32�;)6)�#,-8)�� � �4)6')28���2)%60=�32)@*3968,�;)6)��7-%2�36��%'-*-'�70%2()6������4)6')28���%2(����4)6')28�;)6)��0%'/���!,)6)1%-2()6�;)6)��1)6-'%2�2(-%2���7/-13��36��0)98����:)6��4)6')28�3*�%00�*36)-+2@&3624)340)�;)6)��-74%2-'��3*�%2=6%')��
�2�'314%6-732������4)6')283*�8,)�2%8-:)@&362�43490%8-32;)6)�#,-8)�����4)6')28;)6)��0%'/��%2(�����4)6')28;)6)��7-%2�36��%'-*-'��70%2()6��20=� ��4)6')28�3*�2%8-:)7;)6)��-74%2-'�����
�36)-+2@&362��7-%27�%2(�%'-*-'��70%2()67�,%(�,-+,)66%8)7�3*�2%896%0->%8-32�8,%2*36)-+2@&362��-74%2-'7����80)%78�8;3@8,-6(7�3*�)%',�+6394,%(�0-:)(�-2�8,)�"2-8)(� 8%8)7032+�)239+,�83�59%0-*=�*362%896%0->%8-32��8,)=�%66-:)(&)*36)���������#,-0)���
4)6')28�3*�*36)-+2@&362��7-%27%2(��%'-*-'��70%2()67�;)6)2%896%0->)(�'-8->)27��320=����3*�*36)-+2@&362��-74%2-'7�,%(&))2�2%896%0->)(���!,-7�03;)66%8)�3*�2%896%0->%8-32�%132+�-74%2-'7�1%=�,%:)�78)11)(*631�8,)-6�6)0%8-:)0=�03;�)(9'%@8-32%0�%88%-21)28�'314%6)(;-8,�1%2=��7-%27�%2(��%'-*-'�70%2()67��0%6+)6�291&)67&)-2+�92(3'91)28)(�%2(%*6%-(�83�%440=�*36�'-8->)27,-4�36�%�()7-6)�%132+�1%2=�-74%2-'7�83�6)8962?,31)��):)289%00=�
Recent arrivals have thehighest proportion withcollege degrees. �:)6%00��*36)-+2@&362�4)340)���=)%67�30(�%2(�3:)6�-2�����;)6)�.978�%7�0-/)0=�%7�2%8-:)783�,%:)�%�'300)+)�()+6))�����4)6')28�%2(�����4)6@')28�����98�2%896%0->)(�'-8->)27;)6)�136)�0-/)0=�83�,%:)'300)+)�()+6))7������4)6@')28��8,%2�)-8,)6�*36)-+2@&3624)340)�;,3�;)6)�238�'-8->)27������4)6')28��36�2%8-:)7�
�8�8,)�7%1)�8-1)��*36)-+2@&3624)340)����=)%67�%2(�3:)6%073�;)6)�0)77�0-/)0=�8,%2
2%8-:)7�83�,%:)�+6%(9%8)(*631�,-+,�7',330����20=�����4)6')28�3*�8,)�2%8-:)�&362�(-(238�,%:)�%�,-+,�7',330�(-403@1%��'314%6)(�;-8,����4)6')28�3*�8,)�*36)-+2�&362�
#,)2�)(9'%8-32%0�%88%-21)283*�8,)�*36)-+2�&362�;%7)<%1-2)(�&=�=)%6�3*�)286=�8,)�1378�6)')28�%66-:%07�8,37)�;,3�'%1)�83�8,-7'39286=�(96-2+�8,)�����7�,%(�8,)�,-+,)78�4)6')28%+);-8,�'300)+)�()+6))7A�����4)6')28����%2=�3*�8,)6)')28�%66-:%07A�����4)6@')28A,%(�+6%(9%8)�36463*)77-32%0�()+6))7�
For Further Information ))���966)28��3490%8-32�)43687�� )6-)7����@�������� ������������� ���������
�328%'8��6-78-2�����%27)2�%630� ���%&)6�3962)=�83�#36/�%2(����-+6%8-32� 8%8-78-'7��6%2',��@� @��/%,%27)2�')2797�+3:'%630�7�*%&)6�''1%-0����')2797�+3:

25.������������ ������������
Howard A. Savage
Figure 25-1.
Housing Affordability, by Type ofHouse and Tenure: 1993
�%$)!-�-%62)-'+%9&!,)+8�(.,%
�%$)!-�/1)#%9!$*423%$�(.,%
�%$)!-�#.-$.,)-)4,
�.$%23+8�/1)#%$�(.,%
�.69/1)#%$�(.,%
�%$)!-9/1)#%$�(.,%
��
�
�
���
��
� �
�
��%1#%-3�6(.�#.4+$�-.3�!&&.1$�5!1).42�/1)#%$�(.42%2�)-�3(%)1�!1%!�
��
� ��
���
� ��
��
���
� �
���
�.3%����&&.1$!")+)38�1%+!3%2�3.�3(%�!")+)38�3.�04!+)&8�&.1�!�#.-5%-3).-!+���98%!1�,.13'!'%�6)3(�!� �/%1#%-3�$.6-�/!8,%-3����%-41%�$)&&%19%-3)!3%2�"%36%%-�.6-)-'�!-$�1%-3)-'�.-%�2�(.,%�
�.41#%��� �����41%!4�.&�3(%��%-242���415%8�.&��-#.,%�!-$�1.'1!,��!13)#)/!3).-�
�!,)+)%2
�-$)5)$4!+2
�!,)+)%2
�-$)5)$4!+2
�6-%1 �%-3%1
54 U.S. Census Bureau, the Official StatisticsTM September 21, 1998
About 42 percent of American families could notafford a modestly pricedhouse in 1993.�(%�/%1#%-3!'%�.&�&!,)+)%24-!"+%�3.�!&&.1$�!�,.$%23+8/1)#%$�(.42%�)-�3(%�!1%!6(%1%�3(%8�+)5%$��42)-'�#.-95%-3).-!+�&)-!-#)-'�6)3(�! 9/%1#%-3�$.6-�/!8,%-3��6!23(%�2!,%�)-�����!2�)-������/%1#%-3��
�(%�/%1#%-3!'%�.&�4-1%+!3%$)-$)5)$4!+2�6(.�#.4+$�-.3!&&.1$�3.�"48�!�,.$%23+8/1)#%$�(.42%�6!2�!+2.�3(%2!,%�)-�����!2�)-�������/%1#%-3��
��.$%23+8�/1)#%$�(.42%2�!1%3(.2%�/1)#%$�24#(�3(!3� /%1#%-3�.&�!++�.6-%1�(.42%2�)-3(%�!1%!�!1%�"%+.6�3()2�5!+4%!-$�� �/%1#%-3�!1%�!".5%�
��(%�$!3!�!1%�"!2%$�.-�3(%�415%8�.&��-#.,%�!-$��1.9'1!,��!13)#)/!3).-�$41)-'�3(%&)123���,.-3(2�.&�����!-$.&����
Affordability differs forowners and renters.�(%�!")+)38�3.�/41#(!2%�!,.$%23+8�/1)#%$�(.42%5!1)%$�2)'-)&)#!-3+8�"8�6(%3(%1.-%�.6-%$�.1�1%-3%$�3(%#411%-3�1%2)$%-#%����".43��/%1#%-3�.&�!++�#411%-3�.6-%12#.4+$�-.3�!&&.1$�3.�/41#(!2%�!,.$%23+8�/1)#%$�(.,%�)-�����#.,/!1%$�6)3(���/%1#%-3�.&�!++�1%-3%12���)'41% 9�����-�������/%1#%-3�.&.6-%12�!-$����/%1#%-3�.&1%-3%12�#.4+$�-.3�!&&.1$�!,.$%23+8�/1)#%$�(.42%�
Owner families can affordhigher priced homes.�(%�,%$)!-�,!7),4,9/1)#%$(.42%�3(!3�(.,%.6-%1�&!,)9+)%2�#.4+$�!&&.1$�)-�����42)-'�#.-5%-3).-!+�&)-!-#)-'�6!2���������#.,/!1%$6)3(���������&.1�4-1%+!3%$)-$)5)$4!+�.6-%12����(%#.,/!1!"+%�&)'41%2�&.1���6%1%��� ���&.1�.6-%1&!,)+)%2�!-$��������&.14-1%+!3%$�)-$)5)$4!+�.6-%12��(%�,!7),4,9/1)#%$�(.42%)2�3(%�()'(%23�/1)#%$�(.42%
&!,)+)%2�.1�4-1%+!3%$)-$)5)$4!+2�#!-�!&&.1$��')5%-3(%�+),)3!3).-2�.&�3(%)1�)-#.,%�$%"32��!-$�&)-!-#)!+�!22%32��(%�,%$)!-�,!7),4,9/1)#%$(.42%�!++�1%-3%1�&!,)+)%2�!-$4-1%+!3%$�)-$)5)$4!+2�#.4+$!&&.1$�6!2�+%22�3(!-�������)-�".3(�����!-$����
Affordability differs by thetype and price of housingin an area.�-������!".43�(!+&�.&�!++&!,)+)%2�#.4+$�-.3�!&&.1$�3(%,%$)!-9/1)#%$�(.42%�)-�3(%)1!1%!��3(%�/1)#%9!$*423%$(.42%��.1�!�#.-$.,)-)4,����,%$)!-9/1)#%$�(.42%�(!2�!/1)#%�24#(�3(!3�(!+&�.&�3(%(.42%2�)-�3(%�!1%!�!1%�!".5%3(!3�/1)#%�!-$�(!+&�!1%�"%+.63(!3�/1)#%����/1)#%9!$*423%$(.42%�)2�!�,%$)!-9/1)#%$(.42%�)-�����6)3(�)-#1%!2%2)-�/1)#%�&.1�)-&+!3).-�&1.,����3.�����
�".43���/%1#%-3�.&�&!,)+)%2#.4+$�-.3�!&&.1$�!�,.$%23+8/1)#%$�(.42%�)-������!-$���/%1#%-3�#.4+$�-.3�!&&.1$�!+.69/1)#%$�(.42%���.69/1)#%$

Figure 25-2.
Housing Affordability for a Modestly Priced House, byRace, Hispanic Origin, andTenure: 1993
�.74&2.(�36.,.2��3+�&2=�6&(*�
�32>�.74&2.(
�0&(/
�8-*6�6&(*7
%-.8*
��
�
���
��
����
�
� *6(*28�;-3�(390)�238�&++36)�&�13)*780=�46.(*)�-397*�.2�8-*.6�&6*&�
��
����
����
����
��
����
�38*����++36)&'.0.8=�6*0&8*7�83�8-*�&'.0.8=�83�59&0.+=�+36�&(32:*28.32&0����>=*&6�1368,&,*�;.8-�&� >4*6(*28�)3;2�4&=1*28�
"396(*���$�"���96*&9�3+�8-*��*2797��"96:*=�3+��2(31*�&2) 63,6&1� &68.(.4&8.32�
�&1.0.*7
�2).:.)9&07
�&1.0.*7
�2).:.)9&07
�;2*6 !*28*6
55U.S. Census Bureau, the Official StatisticsTM September 21, 1998
-397*7�&6*�46.(*)�79(-�8-&8��4*6(*28�3+�&00�3;2*6-397*7�.2�&2�&6*&�&6*�'*03;8-.7�:&09*�&2)����4*6(*28�&6*&'3:*�
Affordability differs byregion and metropolitanstatus.�36�&00�+&1.0.*7�&2)�926*0&8*).2).:.)9&07�.2������-&0+(390)�238�&++36)�&�13)*780=46.(*)�-397*�.2�8-*�"398-�(314&6*)�;.8-� ��4*6(*28�.28-*�%*78�� �4*6(*28�.2�8-*�368-*&78��&2)�� �4*6(*28�.28-*��.);*78���
�2�(*286&0�(.8.*7�3+�1*863430.8&2&6*&7����4*6(*28�(390)�238&++36)�&�13)*780=�46.(*)-397*��&7�34437*)�83�� 4*6(*28�.2�79'96'&2�&6*&7&2)����4*6(*28�3987.)*1*863430.8&2�&6*&7�
Affordability varies byfamily status, presence ofchildren, race, ethnic origin,and age.%-.0*�-&0+�3+�&00�+&1.0.*7�(390)238�&++36)�&�13)*780=�46.(*)
-397*�.2������32*>8-.6)�3+1&66.*)�(3940*�+&1.0.*7��&'3987.<�3+�8*2�+&1.0.*7�1&.28&.2*)'=�1*2�;.8-�23�;.+*�46*7*28�&2)�8-6**>+3968-7�3+�+&1.0.*71&.28&.2*)�'=�;31*2�;.8-�23-97'&2)�46*7*28�(390)�238&++36)�79(-�&�-397*�
#-*�&'.0.8=�83�&++36)�&13)*780=�46.(*)�-397*�&0736*0&8*)�83�;-*8-*6�+&1.0.*7-&)�(-.0)6*2�92)*6���=*&6730)����36�1&66.*)�(3940*7�;.8-(-.0)6*2�92)*6���=*&67�30)�&'398�8;3�398�3+�+.:*�(390)�238&++36)�&�-397*��'98�+36�8-37*;.8-�23�(-.0)6*2�92)*6�&,*���320=���4*6(*28�(390)�238&++36)�&�-397*��
%.8-.2�6&(.&0�&2)�*8-2.(,63947��8-*6*�;*6*�&073�).++*6>*2(*7�.2�-31*3;2*67-.4&++36)&'.0.8=��*:*2�;-*2�7.1.0&6+&1.0=�8=4*7�;*6*�(314&6*)��'398���4*6(*28�3+�%-.8*1&66.*)�(3940*�+&1.0=�-31*>3;2*67�(390)�238�&++36)�&13)*780=�46.(*)�-397*�.2�8-*&6*&�;-*6*�8-*=�0.:*)�(314&6*)�;.8-�&'398�8-6**�3+*:*6=�8*2��0&(/�1&66.*)>(3940*�+&1.0=�3;2*67���.,96*
>�����'398�+396�3+�*:*6=�+.:*%-.8*�1&66.*)>(3940*�+&1.0=6*28*67�(390)�238�59&0.+=�83'9=�&�13)*780=�46.(*)�-397*�;-.0*���4*6(*28�3+�8-*.6��0&(/(3928*64&687�(390)�238�59&0.+=�
�.74&2.(��3+�&2=�6&(*�1&66.*)>(3940*�+&1.0=�-31*>3;2*67�(390)�238�&++36)�&13)*780=�46.(*)�-397*���4*6(*28�3+�8-*�8.1*��(314&6*);.8-���4*6(*28�3+�232>�.74&2.(�1&66.*)>(3940*+&1.0=�3;2*67����.74&2.(1&66.*)>(3940*�+&1.0=�6*28*67(390)�238�&++36)�&�13)*780=46.(*)�-397*����4*6(*28�3+8-*�8.1*��(314&6*)�;.8-�+396398�3+�+.:*�232>�.74&2.(1&66.*)>(3940*�+&1.0=�6*28*67�
�&1.0=�-31*3;2*67�;-3(390)�238�&++36)�83�'9=�&13)*780=�46.(*)�-397*;*6*�=392,*6��1*).&2�&,*����8-&2�&00�+&1.0=�-31*>3;2*67��1*).&2�&,*��������2&)).8.32��+&1.0=�6*28*67�;-3(390)�238�&++36)�83�'9=�&13)*780=�46.(*)�-397*�;*6*70.,-80=�=392,*6��1*).&2�&,*
� ��8-&2�&00�+&1.0=�6*28*67�1*).&2�&,*�����
Affordability is associatedwith differences in income,debt, and financial assets.#-*�1*).&2�.2(31*�3+�&00-31*3;2*6�+&1.0.*7��������;&7�19(-�-.,-*6�8-&2�8-&8�3+3;2*6�+&1.0.*7�;-3�(390)�238&++36)�83�'9=�&�13)*780=46.(*)�-397*�����������.2&2(.&0�&77*87�.2(09)*)*59.8=�.2�3;2*6�7�46*7*28-397*��(&7-��&2)�38-*6�&77*878-&8�(390)�'*�(32:*68*)�.283(&7-���#-*�1*).&2�.2(31*�3+&00�6*28*6�+&1.0.*7���������;&7�-.,-*6�8-&2�8-*�1*).&2.2(31*�3+�6*28*6�+&1.0.*7;-3�(390)�238�&++36)�83'9=�&�13)*780=�46.(*)-397*��� ������
#-*�0&6,*78�7.2,0*�6*&7323;2*6�+&1.0.*7�(390)�238�&++36)&�13)*780=�46.(*)�-397*�;&78-&8�8-*.6�)*'8�0*:*0�;&7�833-.,-�83�59&0.+=�+36�&�1368,&,*���4*6(*28�,&:*�8-.7�6*&732����378�6*28*6�+&1.0.*7��� �4*6>(*28��(390)�238�59&0.+=�+361908.40*�6*&7327����'398���4*6(*28�3+�8-*1�-&)�'38-*<(*77.:*�)*'8�463'0*17�&2).279++.(.*28�.2(31*�+36�&�1368>,&,*��;-.0*���4*6(*28�0&(/*)(&7-��+36�8-*�)3;2�4&=1*28&2)�(037.2,�(3787��&2)�79++.>(.*28�.2(31*�83�59&0.+=�+36&�1368,&,*�
For Further Information"**����966*28��397.2,!*43687��"*6.*7�����>�� ��������������������������������
�328&(8��3;&6)�"&:&,*�397.2,�&2)��397*-30)����(3231.(�"8&8.78.(7��.:.7.32��>� �>���-3;&6)�&�7&:&,*����((1&.0�(*2797�,3:

26.������������
Robert Callis
Figure 26-1.
Homeownership Rates, by State: 1996����8.9,.6;�79�4.::����;7�� ���8.9,.6;�����8.9,.6;�79�579.
$62;.-��";*;.:���8.9,.6;
&�
�!
��
�%
���)
#' ��
��
��
"�
��
�"
��
&(
$#
��
&�
��
��
����
��
�(
#�
��
��
�!
�"��
��
"�
��
%�&%
�
�(
��
��
��
��
��
���#
!�
��
%#
��
��
�#
��
"7<9,.���$�"���<9.*<�7/�;1.��.6:<:���<99.6;� 78<4*;276�"<9=.?�*6-��7<:260�%*,*6,?�"<9=.?�
56 U.S. Census Bureau, the Official StatisticsTM September 21, 1998
The United States’homeownership rate isthe highest since 1981.#1.�175.7>6.9:128�9*;./79�;1.�,7<6;9?�*:�*�>174.�26�����>*:����8.9,.6;��<8/975�����8.9,.6;�26����*6-�;1.�1201.:;�:26,.��� ��
�5760�9.0276:��;1.��2->.:;1*-�;1.�1201.:;�175.7>6.9@:128�9*;.�������8.9,.6;��26������>124.�;1.�&.:;�1*-�;1.47>.:;�9*;.������8.9,.6;��#1.�9*;.�>*:������8.9,.6;�26;1.��79;1.*:;�*6-������8.9@,.6;�26�;1.�"7<;1�
Homeownership rates varywidely among states.�7<9;..6�7/�;1.����:;*;.:�26;1.�"7<;1�26������1*-�175.@7>6.9:128�9*;.:�7/�����8.9@,.6;�79�1201.9���20<9.���@����6�;1.��2->.:;��*44����7/�2;::;*;.:�1*-�9*;.:�*;�79�*+7=.����8.9,.6;����76=.9:.4?�� �7/;1.����:;*;.:�26�;1.�&.:;�*6-�7/�;1.���:;*;.:�26�;1.��79;1@.*:;�1*-�175.7>6.9:1289*;.:�7/�����8.9,.6;�79�47>.9�
�6�;1.��79;1.*:;��/7<9�:;*;.:1*-�175.7>6.9:128�9*;.:�7/���8.9,.6;�79�1201.9��>124.�;1.9.5*26260�/2=.�1*-�9*;.:�7/
��8.9,.6;�79�47>.9����6�;1.�2->.:;��;1.�175.7>6.9:1289*;.�26�.*,1�:;*;.�>*:�*+7<;;1.�:*5.�79�*+7=.�;1.�6*;276@*4�9*;.�7/����8.9,.6;�
�6�;1.�"7<;1�� �7/����:;*;.:*6-�;1.��2:;92,;�7/�;1.��74<5@+2*�1*-�9*;.:�7/������8.9,.6;79�1201.9��>124.�26�;1.�&.:;764?���7/����:;*;.:�1*-175.7>6.9:128�9*;.:�7/�����8.9,.6;�79�1201.9�
Homeownership rates varyby metropolitan area.�6�;1.��79;1.*:;��;1.�175.@7>6.9:128�9*;.�>*:�47>.:;26�;1.��.>�(793���(��5.;97@8742;*6�*9.*������������8.9@,.6;��*6-�1201.:;�26�;1.��*:@:*<@"<//743���(������ ��8.9,.6;�����6�*--2;276�;7�;1.�*::*<@"<//743���(������;>77;1.9���:�26�;1.��79;1.*:;1*-�9*;.:�7/����8.9,.6;�791201.9����7657<;1@�,.*6�����*6-� 2;;:+<901�� ��
�6�;1.��2->.:;��/7<9���:�1*-175.7>6.9:128�9*;.:7/����8.9,.6;�79�1201.9��26,266*;2�������4.=.4*6-@�79*26@�4?92*�������.;972;�����*6-��266.*8742:@";�� *<4���@&��
�6�;1.�"7<;1��764?�;1.��1*9@47;;.@�*:;762*@!7,3��244����@"�������*6-�;1.��7<2:=244.��(�����1*-�175.7>6.9:1289*;.:�7/����8.9,.6;�79�1201.9�
�6�;1.�&.:;��;1.�175.7>6.9@:128�9*;.�>*:�47>.:;�26�;1.�7:��60.4.:@�760��.*,1����������� �8.9,.6;��*6-1201.:;�26�;1.�"*4;��*3.��2;?�$#����������8.9,.6;�����6/*,;��;1.�175.7>6.9:128�9*;.26�"*4;��*3.��2;?�>*:�*+7<;���8.9,.6;*0.�8726;:�1201.9�;1*626�*6?�7/�;1.�7;1.9���5.;97@8742;*6�*9.*:�26�;1.�&.:;�/79>12,1�-*;*�>.9.�*=*24*+4.�
Race and ethnicity play asignificant role in determin-ing whether or not someonewill own a home.�6�������175.7>6.9:128�9*;.:>.9.�1201.:;�/79�&12;.�17<:[email protected]:��*;������8.9,.6;�,758*9.-�>2;1����8.9,.6;/79��4*,3�17<:.174-.9:��*6-����8.9,.6;�/79�17<:.174-.9:7/�7;1.9�9*,.:����79��2:8*62,17<:.174-.9:��7/�*6?�9*,.��;1.�175.7>6.9:128�9*;.�>*:��� �8.9,.6;��,758*9.->2;1�����8.9,.6;�/79�676@�2:8*62,�17<:.174-.9:�

Figure 26-2.
Homeownership Rates, by Family Typeand Age of Householder: 1996
��+�-#.!#+0�
���
���
�������
���� ���
���
����
����
� ��
������
��..'#"6!,1-)#�$�*')'#/
�0&#.�$�*')'#/�$#*�)#�&,1/#&,)"#./
�0&#.�$�*')'#/�*�)#�&,1/#&,)"#./
������
��� ����
��
����
�������
�������
��������
�,1.!#���������1.#�1�,$�0&#��#+/1/���1..#+0��,-1)�0',+�1.2#5��+"��,1/'+%���!�+!5��1.2#5�
�����0,0�) ��0,��5#�./
��0,���5#�./
���0,���5#�./
�����
����
��������
����
������
���� ��
����
�+"#.���5#�./
���5#�./��+"�,2#.
�0&#.�03,�,.�*,.#&,1/#&,)"��*�)#
�))��%#/
���
�������
��������
���
�+#�-#./,+&,1/#&,)"��*�)#
�+#�-#./,+&,1/#&,)"��$#*�)#
�0&#.�03,�,.�*,.#&,1/#&,)"��$#*�)#
�������
�������� ���
Family Households
Nonfamily Households
57U.S. Census Bureau, the Official StatisticsTM September 21, 1998
As we get older, there is agreater likelihood that wewill own our own home—up to a point.�+�������&,*#,3+#./&'-�.�0#/!)'* #"��/�0&#��%#�,$�0&#&,1/#&,)"#.�'+!.#�/#"71-0&.,1%&�0&#���60,6����%#!�0#%,.5����,.�#4�*-)#��0&#&,*#,3+#./&'-�.�0#�3�/�����-#.!#+0�$,.�&,1/#&,)"#./1+"#.����5#�./�,)"��!,*-�.#"
3'0&�����-#.!#+0�$,.�&,1/#6&,)"#./����0,����5#�./�,)"���&#�.�0#�0&#+� #%�+�0,�".,-/0�.0'+%�3'0&�&,1/#&,)"#./� �0,� �5#�./�,)"���/�-#,-)#*,2#"�'+0,�.#0'.#*#+0��+" #%�+�0,�!,+/'"#.�.#+0�)&,1/'+%��+"�,0&#.�&,1/'+%,-0',+/��/��)0#.+�0'2#/�0,,3+'+%���&,*#����,.�&,1/#6&,)"#./� ��5#�./�,)"��+"�,2#.�
0&#�&,*#,3+#./&'-�.�0#�3�/ ���-#.!#+0��
�&#�'+!.#�/#/� 5��%#�'+&,*#,3+#./&'-�3#.#�*,.#".�*�0'!�$,.�5,1+%#.�&,1/#6&,)"#./73'0&�0&#�.�0#�$,.&,1/#&,)"#./����0,����5#�./,)"��� �-#.!#+0��� ,10�� -,'+0/�&'%&#.�0&�+�0&�0�$,.&,1/#&,)"#./�)#//�0&�+���5#�./�,)"�������-#.!#+0���'*')�.)5��0&#�.�0#�$,.
&,1/#&,)"#./���0,��5#�./,)"������-#.!#+0��3�/��)/,*1!&�&'%&#.�0&�+�0&#�.�0#�$,.0&,/#����0,����5#�./�,)"����&#'+!.#�/#/�'+�&,*#,3+#./&'-3#.#�)#//�".�*�0'!�/0�.0'+%$,.�&,1/#&,)"#./���0,��5#�./�,)"�
The homeownershiprate is highest formarried-couple fam ilies.�#'+%�'+�0&#�0.�"'0',+�)*�..'#"6!,1-)#�$�*')5�'//0'))�0&#� #/0�%1�.�+0##�,$��!&�+!#�0,�,3+�5,1.�,3+&,*#����&#�&,*#,3+#./&'-.�0#�$,.�*�..'#"6!,1-)#�$�*')5&,1/#&,)"/�'+������3�/�����-#.!#+0��!,*-�.#"�3'0&,+)5����-#.!#+0�$,.�,0&#.05-#/�,$�$�*')5�&,1/#&,)"/��'%1.#���6�������*')'#/�3'0&*�)#�&,1/#&,)"#./��+,�3'$#-.#/#+0�&�"���%.#�0#.�)'(#)'6&,,"�,$�&,*#,3+#./&'-�0&�+$�*')'#/�3'0&�$#*�)#�&,1/#6&,)"#./��+,�&1/ �+"�-.#/#+0������-#.!#+0�2#./1/����-#.!#+0��
�*,+%�+,+$�*')5�&,1/#&,)"/�0&#�&,*#,3+#./&'-�.�0#�3�/����-#.!#+0�$,.�,+#6-#./,+&,1/#&,)"/��+"��� �-#.!#+0$,.�03,6,.6*,.#�-#./,+�&,1/#6&,)"/����+#6-#./,+�$#*�)#&,1/#&,)"#./�3#.#�*,.#�)'(#)50,� #�&,*#,3+#./������-#.!#+0��0&�+�,+#6-#./,+*�)#�&,1/#&,)"#./����-#.!#+0�����&#.#�3�/�+,�/0�0'/60'!�)�"'$$#.#+!#� #03##+�0&#.�0#/�$,.�$�*')'#/�3'0&�$#*�)#&,1/#&,)"#./��+,�&1/ �+"-.#/#+0�������-#.!#+0���+",+#6-#./,+�$#*�)#�&,1/#6&,)"#./�������-#.!#+0��
For Further Information�##��������� ���������������������������������������������,+�0&#��+0#.6+#0��0�333�!#+/1/�%,2�&&#/�333�&2/�&0*)
�,+0�!0��, ���))'/�'+�+!'�)��+"���.(#0����&�.�!0#.'/0'!/��.�+!&��6� 6���"!�))'/�!#+/1/�%,2

� �������� ����������Appendix A.
58
Source of Data�'(2�1$/.13�(-"+4#$2�# 3 �%1.,3'$��$-242��41$ 4� -#�3'$� 3(.- +��$-3$1�%.1��$ +3'�3 3(23("2������������'$��$-:242��41$ 4�# 3 �(-�3'(2�1$/.13�6'("'�".5$1� �6(#$�1 -&$�.%3./("2� -#�8$ 12���6$1$".++$"3$#�/1(, 1(+8�(-�3'$�411$-3��./4+ 3(.-��415$8�������3'$��415$8�.%��-".,$ -#��1.&1 ,�� 13("(/ 3(.-�������� -#�3'$�#$"$--( +"$-242$2���� 3 �%1.,�3'$����� 1$�%1.,�(32�5(3 +�23 3(2:3("2�1$&(231 3(.-�2823$,�
�415$8�$23(, 3$2����'$�$2:3(, 3(.-�/1."$#41$2�42$#�%.1���� -#������# 3 �(-%+ 3$6$(&'3$#�2 ,/+$�1$24+32�3.(-#$/$-#$-3�$23(, 3$2�.%�3'$"(5(+( -�-.-(-23(343(.- +�/./4+ :3(.-�.%�3'$��-(3$#��3 3$2�!8 &$��2$7��1 "$�� -#��(2/ -("�-.-��(2/ -("�" 3$&.1($2��'$2$�(-#$/$-#$-3�$23(, 3$2 1$�! 2$#�.-�23 3(23("2�%1.,#$"$--( +�"$-242$2��23 3(23("2.-�!(13'2��#$ 3'2��(,,(&1 3(.-� -#�$,(&1 3(.-��23 3(23("2�.-3'$�2(9$�.%�3'$��1,$#��.1"$2� -#��23 13(-&�(-������ - #)423,$-3�%.1�4-#$1".5$1 &$(-�3'$�"$-242����'$�$23(, 3(.-/1."$#41$�%.1����� -#�+ 3$18$ 12�42$#�(-#$/$-#$-3$23(, 3$2�! 2$#�.-�3'$���#$"$--( +�"$-242��$ 1+($1�# 3 42$#�(-#$/$-#$-3�$23(, 3$2! 2$#�.-�3'$�,.23�1$"$-3#$"$--( +�"$-242� 3�3' 3�3(,$��� 3 �(-�2.,$�2$"3(.-2� 1$1$5(2$#�%.1�$ 1+($1�8$ 12��3'$2$1$5(2(.-2� 1$�(-#(" 3$#�(-�3'$1$+$5 -3�2$"3(.-�����'(2"' -&$�(-�(-#$/$-#$-3�$23(:, 3$2�' #�1$+ 3(5$+8�+(33+$(,/ "3�.-�24,, 18�,$ :241$2��24"'� 2�,$#( -2� -#/$1"$-3�#(231(!43(.-2��!43�#(#' 5$� �2(&-(%(" -3�(,/ "3�.-+$5$+2����.1�$7 ,/+$��42$�.%3'$����! 2$#�/./4+ 3(.-".-31.+2�1$24+3$#�(-� !.43� �/$1"$-3�(-"1$ 2$�(-�3'$"(5(+( -�-.-(-23(343(.- +�/./4+ :3(.-� -#�(-�3'$�-4,!$1�.%% ,(+($2� -#�'.42$'.+#2��'42��$23(, 3$2�.%�+$5$+2�%.1���� -#�+ 3$1�8$ 12�6(++�#(%%$1%1.,�3'.2$�%.1�$ 1+($1�8$ 12�!8,.1$�3' -�6' 3�".4+#�!$ 331(!43$#�3.� "34 +�"' -&$2(-�3'$�/./4+ 3(.-����'$2$#(%%$1$-"$2�".4+#�!$�#(2/1.:/.13(.- 3$+8�&1$ 3$1�%.1�"$13 (-
/./4+ 3(.-�24!&1.4/2�3' -%.1�3'$�3.3 +�/./4+ 3(.-����'$�$23(, 3(.-�/1."$#41$242$#�%.1����� -#������# 3 1$�#(2"422$#�(-�,.1$�#$3 (+(-�3'$�/4!+(" 3(.-2�"(3$#� 3�3'$�$-#�.%�,.23�2$"3(.-2�(-3'(2�1$/.13�
Reliability of Estimates�(-"$�3'$����� -#�����$23(, 3$2� 1$�! 2$#�.-�2 ,:/+$2��3'$8�, 8�#(%%$1�2.,$:6' 3�%1.,�3'$�%(&41$2�%1.,� ".,/+$3$�"$-242�42(-&�3'$2 ,$�04$23(.-- (1$2��(-2314":3(.-2�� -#�$-4,$1 3.12����'$1$ 1$�36.�38/$2�.%�$11.12�/.2:2(!+$�(-� -�$23(, 3$�! 2$#�.- �2 ,/+$�2415$8���2 ,/+(-& -#�-.-2 ,/+(-&����'$�23 -:# 1#�$11.12�/1.5(#$#�(-�,.23�411$-3��./4+ 3(.-��$/.132/1(, 1(+8�(-#(" 3$�3'$�, &-(:34#$�.%�3'$�2 ,/+(-&�$11.12��'$8� +2.�/ 13( ++8�,$ 241$3'$�$%%$"3�.%�2.,$�-.-2 ,:/+(-&�$11.12�(-�1$2/.-2$� -#$-4,$1 3(.-���!43�3'$8�#.�-.3,$ 241$� -8�2823$, 3("!( 2$2�(-�3'$�# 3 ����( 2�(23'$�#(%%$1$-"$�� 5$1 &$#.5$1� ++�/.22(!+$�2 ,/+$2�!$36$$-�3'$�$23(, 3$� -#3'$��314$��5 +4$����'$� ""41 :"8�.%� �2415$8�1$24+3�#$/$-#2.-�3'$�-$3�$%%$"3�.%�2 ,/+(-& -#�-.-2 ,/+(-&�$11.12�� 13("4+ 1�" 1$�2'.4+#�!$$7$1"(2$#�(-�3'$�(-3$1/1$3 3(.-.%�%(&41$2�! 2$#�.-� �1$+ 3(5$:+8�2, ++�-4,!$1�.%�" 2$2.1�.-�2, ++�#(%%$1$-"$2!$36$$-�$23(, 3$2�
� ,/+(-&�5 1( !(+(38����3 -# 1#$11.12� 1$�/1(, 1(+8�,$ 241$2.%�2 ,/+(-&�5 1( !(+(38��3' 3(2��.%�3'$�5 1( 3(.-2�3' 3�.""41!8�"' -"$�!$" 42$�.%�".+:+$"3(-&� �2 ,/+$�1 3'$1�3' -$-4,$1 3(-&�3'$�$-3(1$�/./4:+ 3(.-����3 -# 1#�$11.12� 1$�-.3&(5$-�(-�3'(2�1$/.13�!$" 42$�.%3'$�6(#$�1 -&$�.%�3./("2(-"+4#$#� -#�3'$�6(#$�5 1($38.%�# 3 �2.41"$2����3 -# 1#$11.12�, 8�!$�%.4-#�(-�3'$/4!+(" 3(.-2�3' 3� 1$�-.3$# 3�3'$�$-#�.%�,.23�2$"3(.-2�.1!8�".-3 "3(-&�3'$�24!)$"32/$"( +(23�/1.5(#$#�
�.,$�23 3$,$-32�(-�3'$2$/4!+(" 3(.-2�, 8�".-3 (-$23(, 3$2�%.++.6$#�(,,$#( 3$:+8�!8� -.3'$1�-4,!$1����.13'.2$�23 3$,$-32��.-$�" -
##�3'$�-4,!$1�3.�3'$�$23(:, 3$� -#�24!31 "3�3'$�-4,!$1%1.,�3'$�$23(, 3$�3.�" +"4+ 3$4//$1� -#�+.6$1�!.4-#2�.%3'$���/$1"$-3�".-%(#$-"$(-3$15 +����.1�$7 ,/+$��(%� 23 3$,$-3�".-3 (-2�3'$�/'1 2$�&1$6�!8�� ����� ���/$1:"$-3���3'$���/$1"$-3�".-%(:#$-"$�(-3$15 +�%.1�3'$�$23(:, 3$��� �/$1"$-3��6.4+#�!$%1.,�� �3.��� �/$1"$-3�
�.-2 ,/+(-&�5 1( !(+(38����2�(- -8�2415$8�6.1*��3'$�1$24+32 1$�24!)$"3�3.�$11.12�.%�1$:2/.-2$� -#�-.-1$/.13(-&�(- ##(3(.-�3.�2 ,/+(-&�5 1( !(+(:38����.-2 ,/+(-&�$11.12�" -!$� 331(!43$#�3.�, -82.41"$2��%.1�$7 ,/+$��(- !(+(383.�.!3 (-�(-%.1, 3(.-� !.43� ++" 2$2�(-�3'$�2 ,/+$��#$%(-(:3(.- +�#(%%("4+3($2��#(%%$1$-"$2�(-3'$�(-3$1/1$3 3(.-�.%�04$23(.-2�(- !(+(38�.1�4-6(++(-&-$22�.-3'$�/ 13�.%�3'$�1$2/.-#$-32�3./1.5(#$�".11$"3�(-%.1, 3(.-�(- !(+(38�3.�1$" ++�(-%.1, 3(.-�$11.12�, #$�(-�".++$"3(.-�24"' 2�(-�1$".1#(-&�.1�".#(-&# 3 ��$11.12�, #$�(-�/1."$22:(-&�# 3 ��$11.12�, #$�(-$23(, 3(-&�5 +4$2�%.1�,(22(-&# 3 �� -#�% (+41$�3.�1$/1$2$-3 ++�4-(32�6(3'�3'$�2 ,/+$�4-#$1".5$1 &$��
�.,/ 1 !(+(38�6(3'�.3'$1�# 3 �� 3 �.!3 (-$#�%1.,�2 ,/+$2415$82� -#�.3'$1�2.41"$2� 1$-.3�$-3(1$+8�".,/ 1 !+$����'(2(2�#4$�+ 1&$+8�3.�#(%%$1$-"$2�(-(-3$15($6$1�31 (-(-&� -#�$7/$:1($-"$� -#�(-�#(%%$1(-&�2415$8/1."$#41$2����'(2�(2� -� ##(:3(.- +�".,/.-$-3�.%�$11.1�3' 3(2�-.3�1$%+$"3$#�(-�3'$�23 -# 1#$11.12����'$1$%.1$��" 43(.-2'.4+#�!$�42$#�(-�".,/ 1(-&1$24+32� ,.-&�3'$2$�2.41"$2�
��-4,!$1�.%�"' -&$2�6$1$, #$�(-�����# 3 �".++$"3(.- -#�$23(, 3(.-�/1."$#41$2!$&(--(-&�(-�� -4 18������'$�, ).1�"' -&$�6 2�3'$42$�.%� �-$6�04$23(.-- (1$��'$�04$23(.-- (1$�6 2�1$#$:2(&-$#�3.�,$ 241$�3'$�.%%("( ++ !.1�%.1"$�".-"$/32�,.1$/1$"(2$+8��3.�$7/ -#�3'$ ,.4-3�.%�# 3 � 5 (+ !+$��3.(,/+$,$-3�2$5$1 +�#$%(-(3(.- +"' -&$2�� -#�3.� # /3�3. �".,/43$1� 22(23$#�(-3$1:5($6(-&�$-5(1.-,$-3����'$� 1"'�����24//+$,$-3 +(-".,$�04$23(.-2�6$1$� +2.

Table A–1.
Components of Selected Population Universes: July 1, 1996� :3),78�04�9/5:8(4+8���%/,8,�,8903(9,8�(7,�*548089,49�<09/�9/,������*,48:8��(8�,4:3,7(9,+�
Population universe Number Percent
#,80+,49�656:2(9054� ���� �����
#,80+,49��73,+��57*,8� ��� ���
�0;020(4�656:2(9054 ���� ����
�48909:9054(2�656:2(9054 � ���
54048909:9054(2�656:2(9054 ��� ����
���8903(9,8�5-�9/,�&�$��7,80+,49�656:2(9054�04*2:+,�6,562,�7,80+,49�04�9/,����89(9,8�(4+�9/,��08970*9�5-�52:3)0(�):9�459�":,795�#0*5���%/,8,�,8903(9,8�,=*2:+,�9/,�&�$���73,+��57*,8�5;,78,(8��(8�<,22�(8�*0;020(4&�$��*090?,48�</58,�:8:(2�62(*,�5-�7,80+,4*,�08�5:980+,�9/,�&409,+�$9(9,8�
��0;020(4�656:2(9054�,8903(9,8�04*2:+,�&�$��7,80+,498�459�04�9/,�(*90;,�+:9>��73,+��57*,8���%/,�+0--,7,4*,),9<,,4�7,80+,49�656:2(9054�62:8��73,+��57*,8�5;,78,(8�(4+�*0;020(4�656:2(9054�08�9/,�<572+<0+,��73,+�57*,8�656:2(9054�
�%/,�048909:9054(2�656:2(9054�08�,8903(9,+�-753�67565790548�5-�9/,�959(2�656:2(9054�7,80+04.�04�048909:90548�(9�9/,903,�5-�9/,������*,48:8��(6620,+�95�*:77,49�,8903(9,8�5-�9/,�959(2�656:2(9054���%/,�*0;020(4�454048909:9054(2656:2(9054�08�*536:9,+�(8�9/,�+0--,7,4*,�),9<,,4�9/,�*0;020(4�656:2(9054�(4+�9/,�048909:9054(2�656:2(9054�
$5:7*,��&�$���:7,(:�5-�9/,��,48:8���:77,49�"56:2(9054�#,65798��$,70,8�""��������������������������������!�������� �� ��������������������������������������
59
35+0-0,+�-57�(+(69(9054�95*536:9,7� (88089,+�049,7;0,<@04.��(29/5:./�9/,7,�<,7,45�*/(4.,8�04�+,-04090548(4+�*54*,698����:,�95�9/,8,(4+�59/,7�*/(4.,8��*(:90548/5:2+�),�:8,+�</,4*536(704.�,8903(9,8�-753+(9(�*522,*9,+�04������(4+2(9,7�>,(78�<09/�,8903(9,8�-753,(720,7�>,(78���$,,�9/,�6:)20@*(90548�459,+�(9�9/,�,4+�5-,(*/�8,*9054�-57�(�+,8*70690545-�9/,8,�*/(4.,8�(4+�9/,,--,*9�9/,>�/(+�54�9/,�+(9(�
%/,��6702����������*,48:8656:2(9054�<(8�()5:9����3022054�2,88�9/(4�9/,�,8903(9,-57�9/,�8(3,�+(9,�5)9(04,+�)>*(77>04.�-57<(7+�9/,�����*,48:8�656:2(9054�<09/�+(9(54�)079/8��+,(9/8��2,.(2�049,7@4(9054(2�30.7(9054��(4+�9/,�4,930.7(9054�5-�&�$��*090?,48(*7588�4(9054(2�)5:4+(70,8�%/,7,�(7,�8,;,7(2�65880)2,,=62(4(90548�-57�9/,�+0--,7@,4*,��57��,7757�5-�*258:7,��04*2:+04.�(�2(7.,7�4,9�:4+,7@,4:3,7(9054�04�9/,�����*,48:8��(4+�+:620*(90548�(4+,7754,5:8�,4:3,7(90548�04�9/,�����*,48:8����57�(�+,9(02,++08*:88054��8,,�����7,.57>#5)04854���(8/07��/3,+�"709/<08��(8��:69(��(4+�(7,4����'55+75<����8903(9@04.��5;,7(.,�5-�9/,������&�$�
�,48:8����,35.7(6/0*��4(2>@808��������"75*,,+04.8�5-�9/,$5*0(2�$9(90890*8�$,*9054��3,70*(4�$9(90890*(2��885*0(@9054��6(.,8������
%/08�7,6579�04*2:+,8�+(9(-57�9/7,,�+0--,7,49�656:2(9054:40;,78,8���7,80+,49�656:2(9054�*,48:8�:40;,78,���*0;020(4454048909:9054(2�656:2(9054�62:8��73,+��57*,8�20;04.5--�6589�57�<09/�9/,07�-(3020,854�6589��$�""�(4+��(7*/�"$�:40;,78,8���(4+�*0;020(4454048909:9054(2�656:2(9054��"$�:40;,78,�04�3549/859/,7�9/(4��(7*/����%/,�,890@3(9,+�*0;020(4�454048909:9054(2656:2(9054�54��:2>������� �<(8� ��� ������%()2,������%/08�656:2(9054�,8903(9,�08�459(+1:89,+�-57�,8903(9,+�4,9:4+,7,4:3,7(9054�04�9/,�����*,48:8����5<,;,7��09�04*5765@7(9,8�(�83(22�04*7,(8,�������6,78548��04�9/,�*,48:8�)(8,656:2(9054�-753�*5:49�7,852:@9054�*577,*90548�675*,88,+9/75:./���� �����
'/02,�9/,�*0;020(4�454048909:@9054(2�656:2(9054�/(8�),,4(+569,+�(8�9/,�:40;,78,�-573(4>�8(362,�8:7;,>8��9/,+(9(�04�%()2,8�����(4+���(7,�459�*548089,49�<09/�7,8:2985-�*:77,49�8:7;,>8�*54+:*9,+)>�9/,��,48:8��:7,(:
9/75:./�9/,�,4+�5-�����04*2:+04.�9/,��"$��</0*/�<,7,*(20)7(9,+�95������57�,(720,7*,48:8�)(8,+�6751,*90548��:77,49�,8903(9,8�-57�+(9,8-753��(4:(7>����������54<(7+(7,�459�*548089,49�<09/�9/,7,8:298�5-�9/58,�8:7;,>8�04*2:+04.�9/,��"$��</0*/�(7,*(20)7(9,+�95�6751,*90548�9/(9/(;,�),,4�(+1:89,+�-57�,890@3(9,+�4,9�:4+,7,4:3,7(9054)(8,+�54�9/,������"589�4:3,7(9054�$:7;,>�
%/,�7,80+,49��73,+��57*,8(4+�9/,�048909:9054(2�656:2(9054+0--,7�.7,(92>�-753�9/,�7,80+,49656:2(9054�04�(.,� 8,=�897:*@9:7,��%()2,�������!4��:2>������ ��3(2,8����95� ��>,(7852+�*548909:9,+�� ���6,7*,49�5-9/,�7,80+,49��73,+��57*,8656:2(9054��*536(7,+�<09/����6,7*,49�5-�9/,�7,80+,49656:2(9054��(4+�-,3(2,8� �>,(78�(4+�5;,7�*548909:9,+����6,7*,49�5-�9/,�048909:9054(2656:2(9054��*536(7,+�<09/����6,7*,49�5-�9/,�7,80+,49�656:@2(9054����5<,;,7��9/,8,�9<5.75:68�95.,9/,7��7,80+,49�73,+��57*,8�(4+�048909:9054(2656:2(9054��(**5:49,+�-57542>�()5:9�����6,7*,49�5-�9/,7,80+,49�656:2(9054����8�(7,8:29��9/,�*0;020(4�454048909:@9054(2�656:2(9054��</0*/�(*@*5:49,+�-57������6,7*,49�5-
9/,�7,80+,49�656:2(9054��/(8(4�(.,� 8,=�897:*9:7,�;,7>80302(7�95�9/(9�5-�9/,�7,80+,49656:2(9054���$0302(72>��9/,85*0(2�(4+�,*54530*�*/(7(*@9,70890*8�5-�9/,�7,80+,49��73,+�57*,8�(4+�5-�9/,�048909:9054(2656:2(9054�*5:2+�+0--,7�.7,(92>-753�9/58,�5-�9/,�7,80+,49656:2(9054��+,8609,�7,2(90;,2>83(22�+0--,7,4*,8�),9<,,4�9/,*/(7(*9,70890*8�5-�9/,�7,80+,49656:2(9054�(4+�5-�9/,�*0;020(4454048909:9054(2�656:2(9054�

60
Table A–2.
Selected Population Universes, by Sex and Broad Age Groups: July 1, 1996��)&1&�&12*,"2&1�"0&�$.-1*12&-2�5*2)�2)&������$&-131��"1�&-3,&0"2&%�
Percent ofPopulation population universe
Population universe and age Total Male Female Total Male Female
������������ �������
����.2"+ ������� � ����������� ��� ���� ����� ��� ����
-%&0����7&"01 ������� ������� �� ��� ���� �� ���
���2.���7&"01 ���� �� � ��������� �������� ���� �� ���
���7&"01�"-%�.4&0 �������� ��������� ���� ����� ���� ��� ��
���������������������
����.2"+� ��������� �������� �� ��� ����� � �� ���
-%&0����7&"01 ���� ���� �� ��� ��� �
���2.���7&"01 ������� ���� �� ���� �� ���� ���� ���
���7&"01�"-%�.4&0 � � � � � �
������ ���������� ������
����.2"+ ������� ������ ��� ���� ����� ���� �
-%&0����7&"01 � ��� �� ��� ��� � �� ���
���2.���7&"01 �� ���� ��� �� ���� �� �� ��� �
���7&"01�"-%�.4&0 �� ���� ���� ���� ��� �� ���� ���
��!��������������� ��������� �������
����.2"+ ���� ��� �������� �� �� ����� ��� ���
-%&0����7&"01� ���� ����� ��� ��� ����� � ��� ��� ����
���2.���7&"01 ������� ��� � ���� �� � ���� ���� ��
���7&"01�"-%�.4&0 ������� ��� ���� ��� ����� ��� ��� ��
�� �&/0&1&-21�8&0.�.0�0.3-%1�2.�8&0.�
���12*,"2&1�.'�2)&� ����0&1*%&-2�/./3+"2*.-�*-$+3%&�/&./+&�0&1*%&-2�*-�2)&����12"2&1�"-%�2)&��*120*$2�.'��.+3,#*"�#32�-.2��3&02.��*$.����)&1&�&12*,"2&1&6$+3%&�2)&� �����0,&%��.0$&1�.4&01&"1��"1�5&++�"1�$*4*+*"-� ����$*2*8&-1�5).1&�313"+�/+"$&�.'�0&1*%&-$&�*1�.321*%&�2)&� -*2&%��2"2&1�
���)&�*-12*232*.-"+�/./3+"2*.-�*1�&12*,"2&%�'0.,�/0./.02*.-1�.'�2)&�2.2"+�/./3+"2*.-�0&1*%*-(�*-�*-12*232*.-1�"2�2)&�2*,&�.'�2)&������$&-131��"//+*&%�2.�$300&-2&12*,"2&1�.'�2)&�2.2"+�/./3+"2*.-�#7�"(&�"-%�1&6����)&�$*4*+*"-�-.-*-12*232*.-"+�/./3+"2*.-�*1�$.,/32&%�"1�2)&�%*''&0&-$&�#&25&&-�2)&�$*4*+*"-�/./3+"2*.-"-%�2)&�*-12*232*.-"+�/./3+"2*.-�
�.30$&�� �����30&"3�.'�2)&��&-131���300&-2��./3+"2*.-��&/.021���&0*&1������ ����������������������������!�������� �� �������������������������������������


![CURRENT POPULATION SURVEY, OCTOBER 1997: SCHOOL … · Current Population Survey, October 1997: School Enrollment [machine- readable data fi/e] / conducted by the Bureau of the Census](https://static.documents.pub/doc/80x56/5f94364f07ee530156723c03/current-population-survey-october-1997-school-current-population-survey-october.jpg)


