Page 1
1H13 Business Report I. Corporate Overview
□ Affiliates
As of end-1H 2013, Samsung Group had a total of 77 domestic affiliates. Compared to end-2012, two new affiliates (Jung-ahm Wind Power, and Sungkyunkwan University Dormitory) were added and six (SECRON, SEHF Korea, SB LiMotive, GES, Idea Company Prog, Top Cloud Corporation) were excluded. Among Samsung Group’s 77 affiliates, 17 including Samsung Electronics are listed, and 60 are unlisted.
(As of June 30, 2013)
No. of affiliates Name of affiliates
Listed 17
Samsung C&T, Cheil Industries, Samsung Electronics, Samsung SDI, Samsung Techwin, Samsung Life Insurance, SEMCO, Samsung Heavy Industries, Samsung Card, Hotel Shilla, Samsung Fire & Marine Insurance, Samsung Securities, S1, Samsung Fine Chemicals, Samsung Engineering, Cheil Worldwide, Credu,
Unlisted 60
Samsung Everland, Samsung Petrochemical, Samsung SDS, Samsung General Chemicals, Samsung Total Petrochemicals, Samsung Lions, SERI, STECO, Samsung Thales, SEMES, Living Plaza, Samsung Corning Precision Materials, Samsung SNS, Samsung Electronics Service, Samsung Electronics Logitech, Hantok Chemicals, Global Tech, CVnet Corporation, Care Camp, Allat Corp., SECUI.com, Wealthia.com, Open Tide Korea, Samsung Futures, 365Homecare, Samsung Venture Investment Corporation, Samsung Asset Management, Saengbo, Samsung Claim Adjustment Service, Anycar Service, World Cyber Games, SD Flex, Gemi Plus Distribution, Samsung Bluewings, HTSS, RAY, Songdo Land Mark City, S-Core, S1 CRM, Open Hands, S-EnPol, Samsung Medison, Samsung Biologics, Miracom Inc., Samsung Life Service, SMP, STM, SSLM, SU Materials, Colombo Korea, Samsung Display, Samsung Bioepis, Nuri Solution, Samsung Corning Advanced Glass , Natural 9, Daejung Offshore Wind Power, SERICEO, Samsung Real Estate, Jung-ahm Wind Power, Sungkyunkwan University Dormitory
Total 77
☞ Refer to 『□ Affiliates』 in 『III. Corporate Governance and Affiliates』 for more details about
domestic and overseas affiliates.
Page 2
□ Subsidiaries Subject to Consolidated Financial Statements
As of end-1H 2013, Samsung Electronics’ consolidated subsidiaries totaled 158 with five subsidiaries being newly included and 13 being excluded compared to end-2012. Following is the list of consolidated subsidiaries.
(Million won)
Subsidiaries Established
in Major business
End-2012 asset
StakeClassified as major
subsidiary
Samsung Electronics America Inc. 1978.07 Sale of electronic
goods 11,432,490
Over 50%
O
Samsung Receivables Corporation 1998.03 Bond management 2,528,399 Over 50%
O
Samsung Semiconductor Inc. 1983.07 Sale of electronic
goods 5,502,929
Over 50%
O
Samsung Electronics Canada Inc. 1980.07 Sale of electronic
goods 609,192
Over 50%
O
Samsung Information Systems America Inc.
1988.10 R&D 134,074 Over 50%
O
Grandis, Inc. 2002.06 R&D 110,570 Over 50%
O
mSpot, Inc. 2004.11 Software 49,648 Over 50%
X
Samsung International Inc. 1983.10 CTV production 36,327 Over 50%
X
Samsung Mexicana S.A. de C.V 1988.03 Production of
electronic goods 1,238,719
Over 50%
O
Samsung Telecommunications America LLC.
1992.01 Sale of telecom
products 5,009,772
Over 50%
O
Samsung Austin Semiconductor LLC. 1996.02 Production of
semiconductors 6,728,824
Over 50%
O
Samsung Electronics Mexico S.A. De C.V.
1995.07 Production and sale of electronic goods
1,291,398 Over 50%
O
SEMES America Inc. 1998.10 Semiconductor
equipment 1,025
Over 50%
X
Samsung Electronics Corporativo, SA de CV
2012.12 Consulting 9,429 Over 50%
X
Samsung Electronics Digital Appliances Mexico, SA de CV
2012.12 Consulting 12,635 Over 50%
X
Samsung Electronics Latino America Miami, Inc.
1995.05 Sale of electronic
goods 142,021
Over 50%
O
Nvelo, Inc. 2010.05 Software 1,418 Over 50%
X
Samsung Electronics Latinoamerica (Zona Libre)
1989.04 Sale of electronic
goods 352,772
Over 50%
O
Samsung Electronics Venezuela, C.A. 2010.05 Marketing and
services 6,149
Over 50%
X
Samsung Electronica Colombia S.A. 1997.03 Sale of electronic
goods 290,814
Over 50%
O
Samsung Electronics Panama. S.A 2012.07 Consulting 800 Over 50%
X
Page 3
Samsung Electronica Da Amazonia LTDA.
1994.10 Production and sale of electronic goods
2,556,334 Over 50%
O
Samsung Electronics Argentina S.A. 1996.06 Marketing and
services 58,163
Over 50%
O
Samsung Electronics Chile Limitada 2002.12 Sale of electronic
goods 478,188
Over 50%
O
Samsung Electronics Peru S.A.C. 2010.04 Sale of electronic
goods 149,924
Over 50%
O
Samsung Electronics (UK) Ltd. 1995.07 Sale of electronic
goods 1,349,828
Over 50%
O
Samsung Electronics(London) Ltd. 1999.01 Holding company 8,249 Over 50%
X
Samsung Electronics Holding GmbH 1982.02 Holding company 764,776 Over 50%
O
Samsung Semiconductor Europe GmbH 1987.12 Sale of
semiconductors and LCD
1,569,684 Over 50%
O
Samsung Electronics GmbH 1984.12 Sale of electronic
goods 1,184,135
Over 50%
O
Samsung Opto-Electronics GmbH 2002.02 Sale of electronic
goods 11,557
Over 50%
X
Samsung Electronics Iberia, S.A. 1989.01 Sale of electronic
goods 836,508
Over 50%
O
Samsung Electronics France S.A.S 1988.01 Sale of electronic
goods 922,036
Over 50%
O
Samsung Electronics Hungarian RT. 1989.10 Production and sale of electronic goods
1,301,842 Over 50%
O
Samsung Electronics Czech and Slovak s.r.o.
2010.01 Sale of electronic
goods 169,368
Over 50%
O
Samsung Electronics Italia S.P.A. 1991.04 Sale of electronic
goods 1,161,920
Over 50%
O
Samsung Electronics Europe Logistics B.V.
1991.05 Logistics 1,529,851 Over 50%
O
Samsung Electronics Benelux B.V. 1995.07 Sale of electronic
goods 1,038,688
Over 50%
O
Samsung Display Slovakia s.r.o. 2007.03 TFT-LCD processing
282,662 Over 50%
O
Samsung Electronics Romania LLC 2007.09 Sale of electronic
goods 132,361
Over 50%
O
Samsung Electronics Polska, SP.Zo.o 1996.04 Sale of electronic
goods 487,348
Over 50%
O
Samsung Electronics Portuguesa S.A. 1982.09 Sale of electronic
goods 154,281
Over 50%
O
Samsung Electronics Nordic Aktiebolag 1992.03 Sale of electronic
goods 503,651
Over 50%
O
Samsung Semiconductor Europe Limited 1997.04 Sale of
semiconductor and LCD
102,212 Over 50%
O
Samsung Electronics Austria GmbH 2002.01 Sale of electronic
goods 299,978
Over 50%
O
Samsung Electronics Slovakia s.r.o 2002.06 Production of CTV
and monitors 1,696,474
Over 50%
O
Page 4
Samsung Electronics European Holding Cooperatief U.A.
2008.10 Holding company 4,377,597 Over 50%
O
Samsung Electronics Poland Manufacturing SP.Zo.o
2010.02 Production of home
appliances 356,189
Over 50%
O
Samsung Electronics Greece S.A. 2010.04 Sale of electronic
goods 103,523
Over 50%
O
Samsung Nanoradio Design Center 2004.02 R&D 21,807 Over 50%
X
Nanoradio Hellas AE 2007.11 R&D 21,807 Over 50%
X
Samsung Denmark Research Center ApS 2012.09 R&D 20,038 Over 50%
X
Samsung France Research Center SARL 2012.10 R&D 6,796 Over 50%
X
Samsung Cambridge Solution Centre Limited
2012.09 R&D 127,487 Over 50%
O
Samsung Electronics Baltic SIA 2001.10 Sale of electronic
goods 54,448
Over 50%
O
Samsung Electronics Overseas B.V. 1997.01 Sale of electronic
goods 143,657
Over 50%
O
Samsung Electronics Rus LLC 1999.03 Marketing 13,200 Over 50%
X
Samsung Electronics Rus Company LLC 2006.10 Sale of electronic
goods 1,705,108
Over 50%
O
Samsung Electronics Ukraine LLC 2004.01 Marketing 384 Over 50%
X
Samsung Electronics Ukraine Company LLC
2008.09 Sale of electronic
goods 215,219
Over 50%
O
Samsung Moscow Research Centre 2011.11 R&D 11,232 Over 50%
X
Samsung Electronics Kazakhstan LLP 2006.07 Marketing 891 Over 50%
X
Samsung Electronics KZ and Central Asia LLP
2008.09 Sale of electronic
goods 173,887
Over 50%
O
Samsung Electronics Rus Kaluga LLC 2007.07 Production of CTV 1,296,147 Over 50%
O
Samsung Russia Service Centre LLC 1997.11 Service 39,003 Over 50%
X
Samsung Electronics West Africa 2010.03 Marketing 40,100 Over 50%
X
Samsung Electronics East Africa 2011.12 Marketing 31,968 Over 50%
X
Samsung Gulf Electronics Co., Ltd. 1995.05 Sale of electronic
goods 589,143
Over 50%
O
Samsung Electronics Egypt S.A.E 2012.07 CTV/monitor
production 45,446
Over 50%
X
Samsung Electronics Israel Ltd. 2012.09 Marketing 1,991 Over 50%
X
Samsung Electronics Tunisia S.A.R.L 2012.09 Marketing 1,275 Over 50%
X
Samsung Electronics Pakistan(Private) Ltd.
2012.11 Marketing 1,674 Over 50%
X
Page 5
Samsung Electronics South Africa(Pty) Ltd.
1994.06 Sale of electronic
goods 605,065
Over 50%
O
Samsung Electronics Turkey 1984.12 Sale of electronic
goods 775,610
Over 50%
O
Samsung Semiconductor Israel R&D Center,Ltd.
2007.10 R&D 16,819 Over 50%
X
Samsung Electronics Levant Co.,Ltd. 2009.07 Sale of electronic
goods 229,683
Over 50%
O
Samsung Electronics Morocco SARLAU 2009.11 Sale of electronic
goods 78,945
Over 50%
O
Samsung Japan Corporation 1975.12 Sale of electronic
goods 1,570,232
Over 50%
O
Samsung R&D Institute Japan Co. Ltd. (Previously Samsung Yokohama Research
Institute) 1992.08 R&D 207,798
Over 50%
O
Samsung Electronics Japan Co., Ltd. 2008.09 Sale of telecom
systems and services
1,018,630 Over 50%
O
Samsung Electronics Display (M) Sdn. Bhd.
1995.03 Production and sale of electronic goods
860,402 Over 50%
O
Samsung Electronics (M) Sdn. Bhd. 1989.09 Production of home
appliances 271,191
Over 50%
O
Samsung Vina Electronics Co., Ltd. 1995.01 Production and sale of electronic goods
150,310 Over 50%
O
Samsung Asia Private Ltd. 2006.07 Sale of electronic
goods 1,897,717
Over 50%
O
Samsung India Electronics Private Ltd. 1995.08 Production and sale of electronic goods
1,449,983 Over 50%
O
Samsung India Software Operations Private Ltd.
2005.05 R&D 120,280 Over 50%
O
Samsung Electronics Australia Pty. Ltd. 1987.11 Sale of electronic
goods 527,635
Over 50%
O
PT Samsung Electronics Indonesia 1991.08 Production and sale of electronic goods
562,515 Over 50%
O
PT Samsung Telecommunications Indonesia
2003.03 Sale of telecom
systems and services
17,127 Over 50%
X
Thai-Samsung Electronics Co., Ltd. 1988.10 Production and sale of electronic goods
1,447,777 Over 50%
O
Samsung Electronics Philippines Corporation
1996.03 Sale of electronic
goods 133,548
Over 50%
O
Samsung Malaysia Electronics (SME) Sdn. Bhd.
2003.05 Sale of electronic
goods 572,463
Over 50%
O
Samsung Bangladesh R&D Co., Ltd. 2010.08 R&D 3,555 Over 50%
X
Samsung Electronics Vietnam Co., Ltd. 2008.03 Production of
electronic goods 3,416,148
Over 50%
O
Samsung Telecommunications Malaysia Sbn. Bhd.
2009.08 Sale of telecom
systems and services
9,065 Over 50%
X
Samsung Display DongGuan Co., Ltd. 2001.11 TFT-LCD production
919,972 Over 50%
O
Page 6
Samsung Display TianJin Co., Ltd. 2004.06 TFT-LCD production
614,425 Over 50%
O
Samsung Electronics Hong Kong Co., Ltd.
1988.09 Sale of electronic
goods 1,294,473
Over 50%
O
Suzhou Samsung Electronics Co., Ltd. 1995.04 Production of home
appliances 577,834
Over 50%
O
Samsung Suzhou Electronics Export Co., Ltd.
1995.04 Production of home
appliances 340,415
Over 50%
O
Samsung (CHINA) Investment Co., Ltd. 1996.03 Sale of electronic
goods 5,407,272
Over 50%
O
Samsung Guangzhou Mobile R&D Center
2010.01 R&D 33,103 Over 50%
X
Samsung Tianjin Mobile Development Center
2010.08 R&D 14,988 Over 50%
X
Samsung Electronics Suzhou Semiconductor Co., Ltd.
1994.12 Semiconductor
processing 752,898
Over 50%
O
Samsung Electronics (Shandong) Digital Printing Co., Ltd.
1993.03 Production of
printers 721,678
Over 50%
O
Samsung Electronics Huizhou Co., Ltd. 1992.12 Production of
electronic goods 3,275,716
Over 50%
O
Tianjin Samsung Electronics Co., Ltd. 1993.04 Production of
electronic goods 837,993
Over 50%
O
Samsung Electronics Taiwan Co., Ltd. 1994.11 Sale of electronic
goods 2,117,243
Over 50%
O
Beijing Samsung Telecom R&D Center 2000.09 R&D 29,692 Over 50%
X
Tianjin Samsung Telecom Technology Co., Ltd.
2001.03 Prodution of
telecom products 2,234,437
Over 50%
O
Shanghai Samsung Semiconductor Co., Ltd.
2001.10 Sale of
semiconductor and LCD
1,998,989 Over 50%
O
Samsung Electronics Suzhou Computer Co., Ltd.
2002.09 Production of
electronic goods 1,232,625
Over 50%
O
Samsung Display SuZhou Co., Ltd. 2002.09 TFT-LCD processing
476,488 Over 50%
O
Samsung Suzhou LCD Co., Ltd 2011.07 TFT-LCD processing
328,157 Over 50%
O
Shenzhen Samsung Electronics Telecommunication Co., Ltd.(Previously
Shenzhen Samsung Kejian Mobile Telecommunication Technology Co.,
Ltd.)
2002.02 Production of
telecom products 88,103
Over 50%
O
Samsung Electronics Shanghai Telecommunication Co., Ltd.
2001.11 Sale of telecom and network products
5,923 Over 50%
X
Samsung Semiconductor (China) R&D Co., Ltd.
2003.04 R&D 15,611 Over 50%
X
Samsung Electronics China R&D Centre 2004.05 R&D 14,098 Over 50%
X
Samsung (China) Semiconductor Co., Ltd.
2012.09 Production of semiconductor
424,487 Over 50%
O
Page 7
Samsung Electronics Hainan Fiberoptics Co., Ltd.
2004.04 Production of fiber
optic and cable 109,423
Over 50%
O
Samsung Electronics (Beijing) Service Company Limited
2005.01 Services 97,445 Over 50%
O
Tianjin Samsung LED Co., Ltd. 2009.05 Production of LED 479,900 Over 50%
O
Tianjin Samsung Opto-Electronics Co., Ltd.
1994.02 Production of camera and camcorder
239,269 Over 50%
O
World Cyber Games 2000.07 Game tournaments 1,893 Over 50%
X
Samsung Display 2012.04 Production and sale
of display 33,791,814
Over 50%
O
SU Materials 2011.08 Production of
electronic goods 23,035
Over 50%
X
STECO 1995.06 Production of semiconductor
components 103,646
Over 50%
O
SEMES 1993.01 Semiconductor/FPD
manufacturing equipment
338,822 Over 50%
O
Samsung Electronics Service 1998.10 Electronics goods
repair services 292,387
Over 50%
O
Living Plaza 1996.07 Sale of electronic
goods 514,542
Over 50%
O
Samsung Electronics Logitech 1998.04 Total logistic
services 178,876
Over 50%
O
Samsung Bluewings 2008.12 Team and game
sponsorship 4,001
Over 50%
X
SVIC #6 Venture Capital Union 2005.07 Investment in
venture firms and new technologies
53,441 Over 50%
O
SVIC #14 Venture Capital Union 2009.05 Investment in
venture firms and new technologies
67,324 Over 50%
O
SVIC #20 Venture Capital Union 2011.03 Investment in
venture firms and new technologies
43,844 Over 50%
X
SVIC #21 Venture Capital Union 2011.11 Investment in
venture firms and new technologies
35,026 Over 50%
X
SVIC #22 Venture Capital Union 2011.11 Investment in
venture firms and new technologies
61,773 Over 50%
O
SVIC #23 Venture Capital Union 2012.10 Investment in
venture firms and new technologies
2,515 Over 50%
X
Hi Pioneer Private Securities Investment Trust 1
2011.08 Investment in
venture firms and new technologies
19,498 Over 50%
X
TNP Small/Medium Size & Venture Enterprises Growth Promotion
Investment Limited Partnership(TSUNAMI)
2011.08 Investment in
venture firms and new technologies
3,059 Over 50%
X
Page 8
Samsung Medison 1985.07 Medical equipment 297,714 Over 50%
O
RAY 2004.10 Dental CT 3,940 Over 50%
X
Samsung Medison Brasil Ltda. 1995.12 Medical equipment 18,390 Over 50%
X
SONOACE Deutschland GmbH 2001.10 Medical equipment 934 Over 50%
X
Samsung Medison Italia S.r.l. 2008.10 Medical equipment 1,409 Over 50%
X
Samsung Medison Europe B.V. 2005.11 Medical equipment 751 Over 50%
X
Samsung Medison Shanghai Medical Instrument Co., Ltd.
1992.11 Medical equipment 13,455 Over 50%
X
Medison (shanghai) Co., Ltd. 2003.09 Medical equipment 1,875 Over 50%
X
Medison Medical Equipment Shanghai Co., Ltd.
2005.03 Medical equipment 793 Over 50%
X
Samsung Medison India Private Ltd. 2009.01 Medical equipment 305 Over 50%
X
Medision Medical Systems India Private Ltd.
1997.10 Medical equipment 37 Over 50%
X
Nexus DX Inc. 2009.07 Medical equipment 9,136 Over 50%
X
Nanogen Recognomics GmbH 2001.07 Medical equipment - Over 50%
X
NeuroLogica Corp. 2004.02 Medical equipment 24,630 Over 50%
X
Intellectual Keystone Technology LLC. 2013.03 New technology
investment -
Over 50%
X
Samsung Electronics Vietnam THAINGUYEN Co., Ltd.
2013.03 Production of
telecom products -
Over 50%
X
Samsung Network R&D Center China-Shenzhen
2013.03 R&D - Over 50%
X
Samsung Electronics Switzerland GmbH 2013.05 Sale of electronic
goods -
Over 50%
X
※ Companies whose total assets were KRW50 billion or more at end-2012 are classified as major subsidiaries.
Page 9
□ Total Number of Shares, etc. 1. Total number of shares ( As of June 30, 2013)
(Unit: # of shares)
Classification Type of shares
Note Common Preferred Total
I. No. of authorized shares 400,000,000 100,000,000 500,000,000 - II. No. of shares issued 155,609,337 23,893,427 179,502,764 - III. No. of shares decreased 8,310,000 1,060,000 9,370,000 -
1. Capital reduction - - - -
2. Share cancellation 8,310,000 1,060,000 9,370,000 Treasury share cancelation
3. Redemption of redeemable shares - - - - 4. Others - - - -
IV. No. of outstanding shares (II-III) 147,299,337 22,833,427 170,132,764 - V. Treasury shares 16,420,624 2,979,693 19,400,317 - VI. Float (IV-V) 130,878,713 19,853,734 150,732,447 - 2. Treasury shares
In 1H 2013, Samsung Electronics distributed 30,814 common shares in relation to the exercise of stock options of current and former management. As of end-1H 2013, Samsung Electronics held 16,420,624 common treasury shares and 2,979,693 preferred treasury shares.
(As of June 30, 2013)
(# of shares)
Acquisition method Share type
Period-beginning
shares
Change Period-end
shares Acquisition (+)
Disposal (-)
Cancellation (-)
Acquisition under the Capital
Market Act
Direct acquisition
Intra-market direct
acquisition
Common 16,451,438 - 30,814 - 16,420,624
Preferred 2,979,693 - - - 2,979,693
TOB Common - - - - -
Preferred - - - - - Exercise
of appraisal
right
Common - - - - -
Preferred - - - - -
Sub-total (a)
Common 16,451,438 - 30,814 - 16,420,624
Preferred 2,979,693 - - - 2,979,693
Acquisition under trust contracts
Shares held by trustee
Common - - - - -
Preferred - - - - - Shares held in kind
Common - - - - -
Preferred - - - - -
Page 10
Sub-total (b)
Common - - - - -
Preferred - - - - -
Other acquisitions (c) Common - - - - -
Preferred - - - - -
Total (a+b+c) Common 16,451,438 - 30,814 - 16,420,624
Preferred 2,979,693 - - - 2,979,693
□ Voting Shares
Samsung Electronics issued 147,299,337 common shares, which is 29.5% of authorized shares. The company issued 22,833,427 preferred shares. 16,420,624 common treasury shares held by the company and preferred shares do not have voting rights. 12,506,577 shares have limited voting rights under relevant laws. Thus, the number of shares with voting rights is 118,372,136.
( As of June 30, 2013)
(# of shares) Classification No. of shares Note
No. of outstanding shares (A)
Common 147,299,337 - Preferred 22,833,427 -
Shares without voting rights (B)
Common 16,420,624Article 369-2 of the Commercial Act "Treasury Shares"
- - -
Shares with voting rights eliminated by Articles of Incorporation (C)
Preferred 22,833,4272,979,693 preferred treasury shares included
- - -
Shares with limited voting rights under relevant laws (D)
Common 12,479,184
Restricted by the Monopoly Regulation and Fair Trade Act: 10,622,814 shares held by Samsung Life Insurance & 1,856, 370 shares held by Samsung Fire & Marine Insurance
Common 27,393Restricted by the Insurance Business Act: Some part of shares held by special account of Samsung Life Insurance
Shares with revived voting rights (E)
- - - - - -
Shares with voting rights (F = A - B - C - D + E)
Common 118,372,136 - Preferred - -
※ Voting rights on agendas excluding appointment and dismissal of board members, revision of the
Articles of Incorporation, and merger/business transfer. ※ Among shares for which voting rights are restricted by relevant laws, some of 12,479,184 shares
(10,622,814 shares held by Samsung Life Insurance’s proprietary account and 1,856,370 shares held by Samsung Fire & Marine Insurance) whose voting rights are restricted by the Monopoly Regulation and Fair Trade Act can exercise voting rights in relation to appointment and dismissal of board members, revision of the Articles of Incorporation, etc.
Page 11
□ Dividend - Dividends paid out in the recent three fiscal years
Classification 1H 2013 2012 2011 Par value per share (won) 5,000 5,000 5,000Net profit (million won) 9,333,829 17,398,530 10,048,192
EPS (won) 61,925 115,576 66,995Total cash dividend (million won) 75,366 1,206,562 827,196Total stock dividend (million won) - - -
Dividend payout ratio (%) - 6.93 8.23
Cash dividend yield (%) Common - 0.54 0.52Preferred - 0.95 0.85
Stock dividend yield (%) Common - - -Preferred - - -
Cash dividend per share (won) Common 500 8,000 5,500Preferred 500 8,050 5,550
Stock dividend per share (share) Common - - -Preferred - - -
※Interim dividend of 75,366 million won was paid out in 2013. (500 won per share)
※Based on individual financial statements. ※EPS denotes to basic EPS.
※For information about calculation of basic EPS, refer to notes of 1H 2013 audited financial
statements.
Page 12
II. Business Operation
□ Summary of Financials by Business Division
(Unit: million won, %)
Business category
Classification 1H 2013 1H 2012 2012 2011
Amount Portion Amount Portion Amount Portion Amount Portion
CE
Total sales 58,245,577 21.7% 54,851,524 25.0% 117,897,781 24.6% 109,263,383 28.9%
Internal sales 34,227,723 21.6% 30,522,152 24.2% 66,792,779 24.0% 59,143,495 27.7%Net sales 24,017,854 21.8% 24,329,372 26.2% 51,105,002 25.4% 50,119,888 30.4%Operating
profit 663,483 3.6% 1,227,407 10.1% 2,324,036 8.0% 1,271,292 8.1%
Total asset 46,226,578 14.7% 39,331,487 15.4% 38,947,252 14.1% 38,447,546 17.1%
IM
Total sales 147,497,108 54.9% 95,557,476 43.6% 224,920,171 46.9% 136,394,346 36.0%
Internal sales 79,138,817 50.0% 49,724,707 39.4% 119,075,388 42.8% 71,769,656 33.6%Net sales 68,358,291 62.0% 45,832,769 49.4% 105,844,783 52.6% 64,624,690 39.2%Operating
profit 12,791,394 69.9% 8,313,231 68.4% 19,418,235 66.8% 8,108,122 51.8%
Total asset 85,945,829 27.3% 54,583,704 21.3% 68,743,115 24.9% 49,319,880 22.0%
DS
Semi-conductor
Total sales 31,530,793 11.7% 31,769,764 14.5% 66,976,623 14.0% 71,305,465 18.8%
Internal sales 14,275,268 9.0% 15,195,885 12.0% 32,090,017 11.5% 34,315,914 16.1%Net sales 17,255,525 15.6% 16,573,879 17.8% 34,886,606 17.3% 36,989,551 22.4%Operating
profit 2,830,611 15.5% 1,729,466 14.2% 4,173,730 14.4% 6,383,875 40.8%
Total asset 68,650,979 21.8% 65,103,683 25.4% 67,136,914 24.4% 64,294,570 28.6%
Display
Total sales 31,425,221 11.7% 36,499,608 16.7% 69,359,762 14.5% 61,648,667 16.3%Internal sales 16,135,023 10.2% 19,714,238 15.6% 36,360,406 13.1% 32,405,595 15.2%
Net sales 15,290,198 13.9% 16,785,370 18.1% 32,999,356 16.4% 29,243,072 17.7%Operating
profit 1,888,765 10.3% 939,981 7.7% 3,214,750 11.1% △347,114 △2.2%
Total asset 44,066,518 14.0% 42,203,756 16.5% 41,429,074 15.0% 36,609,172 16.3%
Total
Total sales 63,687,449 23.7% 68,782,921 31.4% 136,724,256 28.5% 132,790,577 35.1%Internal sales 30,825,778 19.5% 35,415,580 28.0% 68,436,962 24.6% 67,015,926 31.4%
Net sales 32,861,671 29.8% 33,367,341 35.9% 68,287,294 34.0% 65,774,651 39.9%Operating
profit 4,765,970 26.0% 2,639,663 21.7% 7,416,325 25.5% 6,062,934 38.8%
Total asset 139,353,591 44.3% 129,032,682 50.4% 130,371,546 47.3% 103,930,878 46.3%
※ Internal sales include sales within Business divisions.
※ Summary was restated based on business divisions as of 2013 (on a consolidated basis).
※ Net sales include sales between Business divisions of the head office and overseas subsidiaries
subject to consolidated financial statements.
Page 13
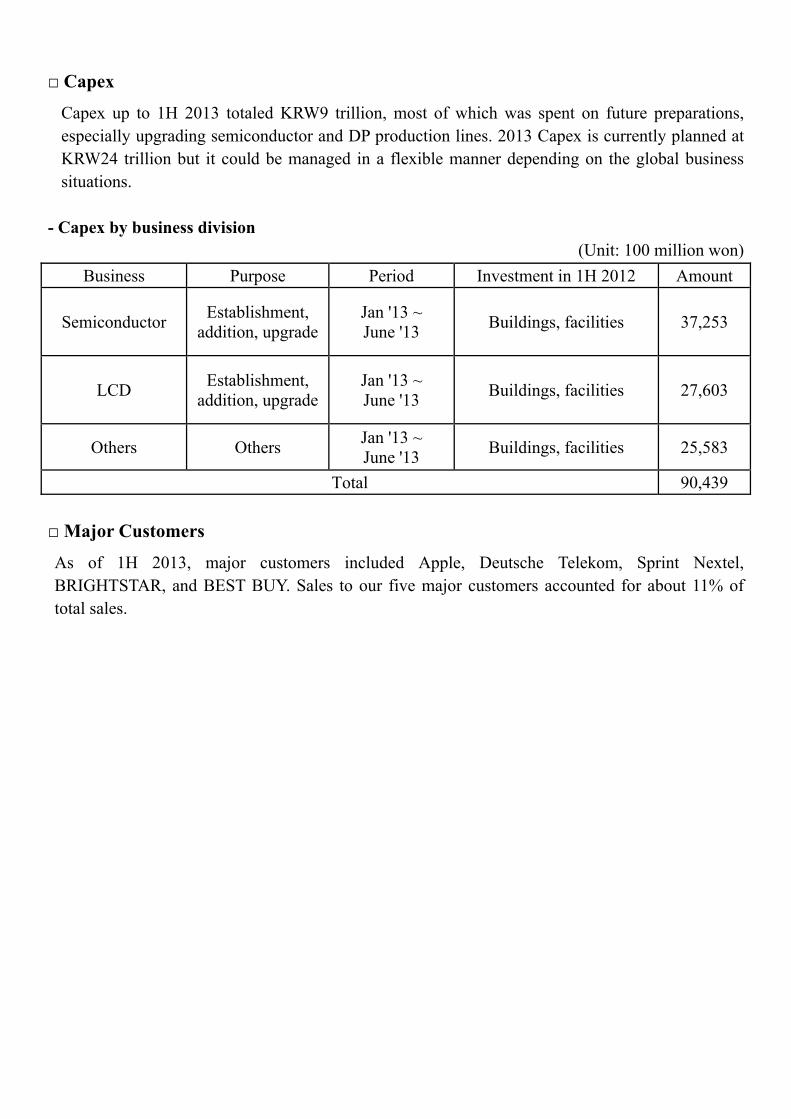
□ Capex
Capex up to 1H 2013 totaled KRW9 trillion, most of which was spent on future preparations, especially upgrading semiconductor and DP production lines. 2013 Capex is currently planned at KRW24 trillion but it could be managed in a flexible manner depending on the global business situations.
- Capex by business division
(Unit: 100 million won)
Business Purpose Period Investment in 1H 2012 Amount
Semiconductor Establishment,
addition, upgrade Jan '13 ~ June '13
Buildings, facilities 37,253
LCD Establishment,
addition, upgrade Jan '13 ~ June '13
Buildings, facilities 27,603
Others Others Jan '13 ~ June '13
Buildings, facilities 25,583
Total 90,439 □ Major Customers
As of 1H 2013, major customers included Apple, Deutsche Telekom, Sprint Nextel, BRIGHTSTAR, and BEST BUY. Sales to our five major customers accounted for about 11% of total sales.
Page 14
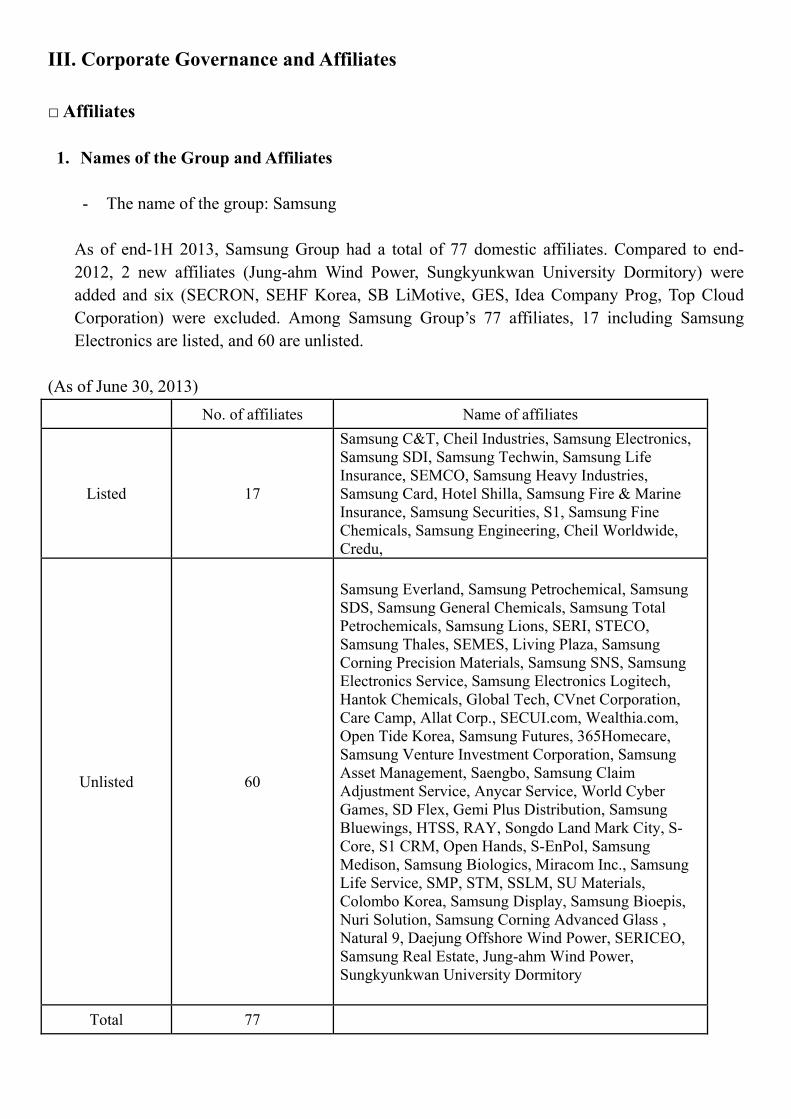
III. Corporate Governance and Affiliates □ Affiliates 1. Names of the Group and Affiliates
- The name of the group: Samsung
As of end-1H 2013, Samsung Group had a total of 77 domestic affiliates. Compared to end-2012, 2 new affiliates (Jung-ahm Wind Power, Sungkyunkwan University Dormitory) were added and six (SECRON, SEHF Korea, SB LiMotive, GES, Idea Company Prog, Top Cloud Corporation) were excluded. Among Samsung Group’s 77 affiliates, 17 including Samsung Electronics are listed, and 60 are unlisted.
(As of June 30, 2013)
No. of affiliates Name of affiliates
Listed 17
Samsung C&T, Cheil Industries, Samsung Electronics, Samsung SDI, Samsung Techwin, Samsung Life Insurance, SEMCO, Samsung Heavy Industries, Samsung Card, Hotel Shilla, Samsung Fire & Marine Insurance, Samsung Securities, S1, Samsung Fine Chemicals, Samsung Engineering, Cheil Worldwide, Credu,
Unlisted 60
Samsung Everland, Samsung Petrochemical, Samsung SDS, Samsung General Chemicals, Samsung Total Petrochemicals, Samsung Lions, SERI, STECO, Samsung Thales, SEMES, Living Plaza, Samsung Corning Precision Materials, Samsung SNS, Samsung Electronics Service, Samsung Electronics Logitech, Hantok Chemicals, Global Tech, CVnet Corporation, Care Camp, Allat Corp., SECUI.com, Wealthia.com, Open Tide Korea, Samsung Futures, 365Homecare, Samsung Venture Investment Corporation, Samsung Asset Management, Saengbo, Samsung Claim Adjustment Service, Anycar Service, World Cyber Games, SD Flex, Gemi Plus Distribution, Samsung Bluewings, HTSS, RAY, Songdo Land Mark City, S-Core, S1 CRM, Open Hands, S-EnPol, Samsung Medison, Samsung Biologics, Miracom Inc., Samsung Life Service, SMP, STM, SSLM, SU Materials, Colombo Korea, Samsung Display, Samsung Bioepis, Nuri Solution, Samsung Corning Advanced Glass , Natural 9, Daejung Offshore Wind Power, SERICEO, Samsung Real Estate, Jung-ahm Wind Power, Sungkyunkwan University Dormitory
Total 77
Page 15
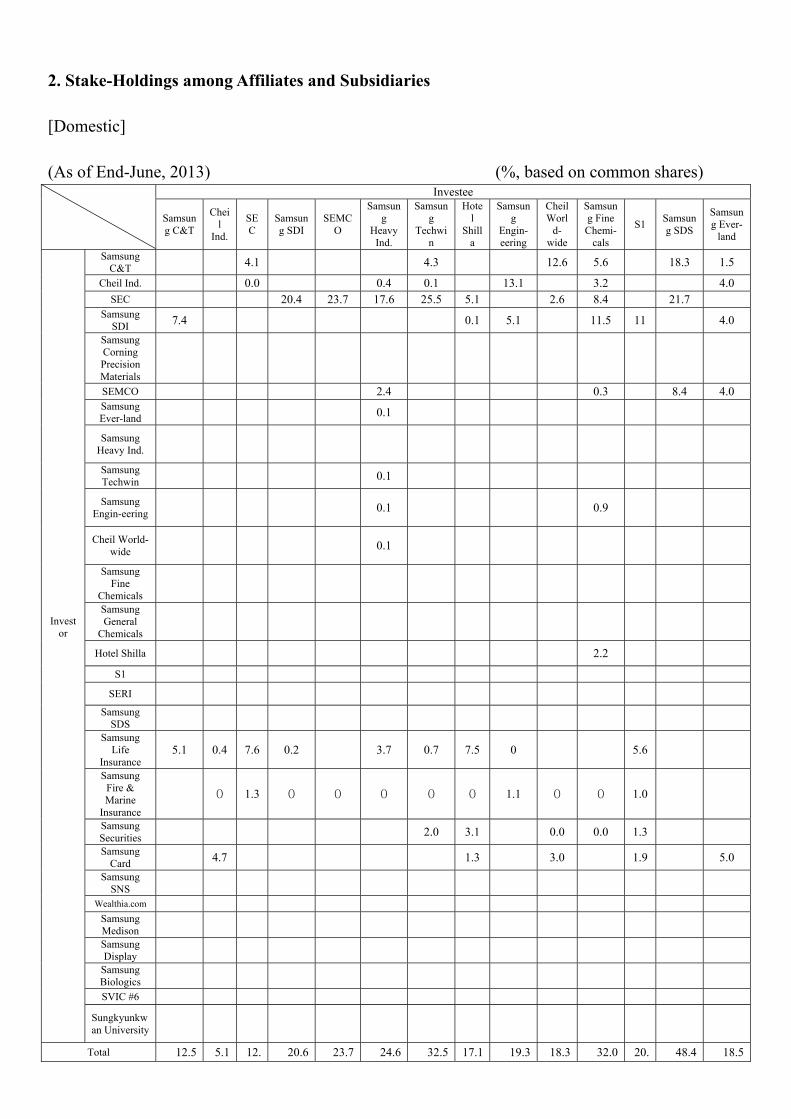
2. Stake-Holdings among Affiliates and Subsidiaries [Domestic] (As of End-June, 2013) (%, based on common shares)
Investee
Samsung C&T
Cheil
Ind.
SEC
Samsung SDI
SEMCO
Samsung
Heavy Ind.
Samsung
Techwin
Hotel
Shilla
Samsung
Engin-eering
Cheil Worl
d-wide
Samsung Fine Chemi-
cals
S1 Samsung SDS
Samsung Ever-
land
Investor
Samsung C&T 4.1 4.3 12.6 5.6 18.3 1.5
Cheil Ind. 0.0 0.4 0.1 13.1 3.2 4.0 SEC 20.4 23.7 17.6 25.5 5.1 2.6 8.4 21.7
Samsung SDI 7.4 0.1 5.1 11.5 11 4.0
Samsung Corning Precision Materials
SEMCO 2.4 0.3 8.4 4.0 Samsung Ever-land 0.1
Samsung Heavy Ind.
Samsung Techwin 0.1
Samsung Engin-eering 0.1 0.9
Cheil World-wide 0.1
Samsung Fine
Chemicals
Samsung General
Chemicals
Hotel Shilla 2.2
S1
SERI
Samsung SDS
Samsung Life
Insurance 5.1 0.4 7.6 0.2 3.7 0.7 7.5 0 5.6
Samsung Fire & Marine
Insurance
0 1.3 0 0 0 0 0 1.1 0 0 1.0
Samsung Securities 2.0 3.1 0.0 0.0 1.3
Samsung Card 4.7 1.3 3.0 1.9 5.0
Samsung SNS
Wealthia.com Samsung Medison
Samsung Display
Samsung Biologics
SVIC #6
Sungkyunkwan University
Total 12.5 5.1 12. 20.6 23.7 24.6 32.5 17.1 19.3 18.3 32.0 20. 48.4 18.5
Page 16
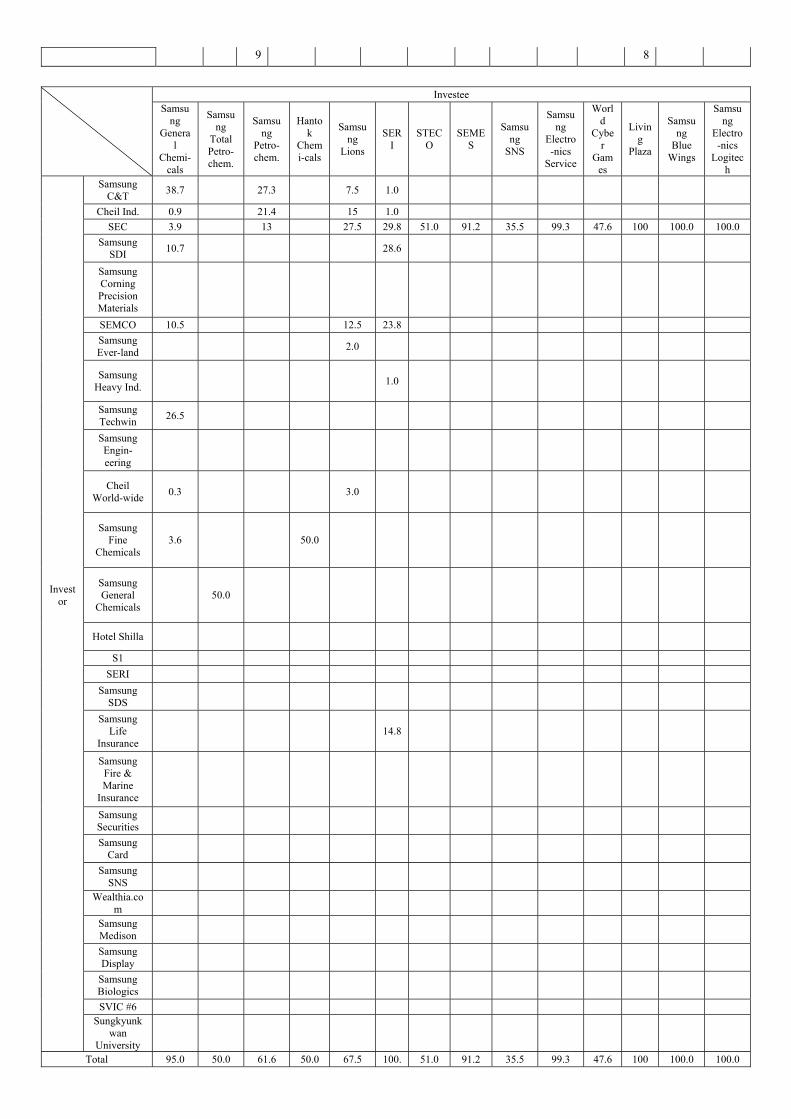
9 8
Investee Samsu
ng Genera
l Chemi-
cals
Samsung
Total Petro-chem.
Samsung
Petro-chem.
Hantok
Chemi-cals
Samsung
Lions
SERI
STECO
SEMES
Samsung
SNS
Samsung
Electro-nics
Service
World
Cyber
Games
Living
Plaza
Samsung
Blue Wings
Samsung
Electro-nics
Logitech
Investor
Samsung C&T
38.7
27.3
7.5 1.0
Cheil Ind. 0.9 21.4 15 1.0
SEC 3.9 13 27.5 29.8 51.0 91.2 35.5 99.3 47.6 100 100.0 100.0
Samsung SDI
10.7
28.6
Samsung Corning Precision Materials
SEMCO 10.5 12.5 23.8
Samsung Ever-land
2.0
Samsung Heavy Ind.
1.0
Samsung Techwin
26.5
Samsung Engin-eering
Cheil World-wide
0.3
3.0
Samsung Fine
Chemicals 3.6
50.0
Samsung General
Chemicals 50.0
Hotel Shilla
S1
SERI
Samsung SDS
Samsung Life
Insurance 14.8
Samsung Fire & Marine
Insurance
Samsung Securities
Samsung Card
Samsung SNS
Wealthia.com
Samsung Medison
Samsung Display
Samsung Biologics
SVIC #6
Sungkyunkwan
University
Total 95.0 50.0 61.6 50.0 67.5 100. 51.0 91.2 35.5 99.3 47.6 100 100.0 100.0
Page 17
0
Investee
Samsung
Display
RAY
Samsung
Medison
Samsung Biolo-
gics
Samsung
Bioepis
Samsung Corning Advanced Glass
SSLM
SU Material
s
Samsung
Corning Precisio
n Material
s
Global Tech
Samsung
Thales
Cvnet
Care Cam
p
Investor
Samsung C&T
10.5
40.1 52.8
Cheil Ind.
SEC 84.8 68.5 42.1 50
Samsung SDI 15.2
Samsung Corning Precision Materials
51
SEMCO
Samsung Ever-land
42.1
Samsung Heavy Ind.
Samsung Techwin
50
Samsung Engin-eering
Cheil World-wide
Samsung Fine Chemicals
Samsung General
Chemicals
Hotel Shilla
S1
SERI
Samsung SDS
Samsung Life Insurance
0
Samsung Fire & Marine Insurance
Samsung Securities
Samsung Card
Samsung SNS 9.4
Wealthia.com
Samsung Medison
Samsung Display
50
50.0 42.6
Samsung Biologics
85
SVIC #6 64.6
Sungkyunkwan University
Page 18
Total 100.0 64.6 68.5 94.6 85 50 50.0 50.0 42.7 51.0 50 49.5 52.8
Investee
Songdo Land Mark City
SD Flex
Gemi Plus
Distri-bution
Colombo Korea
Natural 9
Daejung Offshore
Wind Power
Jung-ahm
Wind Power
SECUI. com
HTSS S1
CRM S-
EnPolSMP STM
Investor
Samsung C&T 41.4
Cheil Ind. 50.0 100.0 100.0 51.0
SEC
Samsung SDI
Samsung Corning Precision Materials
SEMCO
Samsung Ever-land
8.7
Samsung Heavy Ind.
50.1 50.0
Samsung Techwin
Samsung Engin-eering
Cheil World-wide
Samsung Fine Chemicals
100.0 50.0 50.0
Samsung General
Chemicals
Hotel Shilla
S1 52.2 80.0 93.4
SERI
Samsung SDS 4.3
Samsung Life Insurance
Samsung Fire & Marine Insurance
Samsung Securities
Samsung Card
Samsung SNS
Wealthia.com
Samsung Medison
Samsung Display
Samsung Biologics
SVIC #6
Sungkyunkwan
University
Page 19
Total 41.4 50 100.0 100.0 51.0 50.1 50.0 65.2 80.0 93.4 100.0 50.0 50.0
Investee
Credu
Wealthia .com
Open
Tide
Korea
S-Core
Open
Hands
Mirac-om Inc.
Nuri Soluti
on
SERICEO
Sungkyunkwan
University
Samsung
Life Insura
nce
Saengbo
365 Hom
e-care
Samsung
Life Servic
e
Samsung
Real Estate
Investor
Samsung C&T
Cheil Ind.
SEC
Samsung SDI
Samsung Corning Precision Materials
SEMCO 0.6
Samsung Ever-land
21.0
19.3
Samsung Heavy Ind.
Samsung Techwin
Samsung Engin-eering
Cheil World-wide
10.4
0.2
Samsung Fine
Chemicals
0.5
Samsung General
Chemicals
Hotel Shilla
S1 19.2
SERI 10.7 5.2 100
Samsung SDS
49.7 10.5 72.6 94.8
100.0
100.0
100.0
0.4
28.8
Samsung Life
Insurance 0.0
50
99.8 100
Samsung Fire & Marine
Insurance
Samsung Securities
1.6
Samsung Card
3.3
Samsung SNS
Wealthia.com
14.4
Samsung Medison
Samsung Display
Samsung Biologics
SVIC #6
Sungkyunkwan
University
100
Total 60.4 41.5 83.0 94.8
100.0
100.0
100.0 100.0 100.0 21.0 50.0 62.5 99.8 100
Page 20
Investee
Samsung Fire & Marine
Insurance
Samsung Claim
Adjustment Service
Anycar Service
Samsung Securities
Samsung Card
Allat Corp.
Samsung Asset Mana-gement
Samsung Futures
Samsung Venture Invest-
ment Corp.
Investor
Samsung C&T
0.3 2.5
Cheil Ind.
SEC 37.5 16.3
Samsung SDI 16.3
Samsung Corning Precision Materials
SEMCO 3.8 17
Samsung Ever-land
30
Samsung Heavy Ind.
0
3.9
17
Samsung Techwin
16.7
Samsung Engin-eering
Cheil World-wide
Samsung Fine Chemicals
Samsung General Chemicals
Hotel Shilla
S1
SERI
Samsung SDS
Samsung Life Insurance
10.4
11.1 28
5.5 41
Samsung Fire & Marine Insurance
99.9 100 8.0
1.2 4
Samsung Securities
0
65.3 51 16.7
Samsung Card 0.6 30
Samsung SNS
Wealthia.com
Samsung Medison
Samsung Display
Samsung Biologics
SVIC #6
Sungkyunkwan
University
Total 11.0 99.9 100 19.4 71.9 60 75.8 96 100.0
Page 21
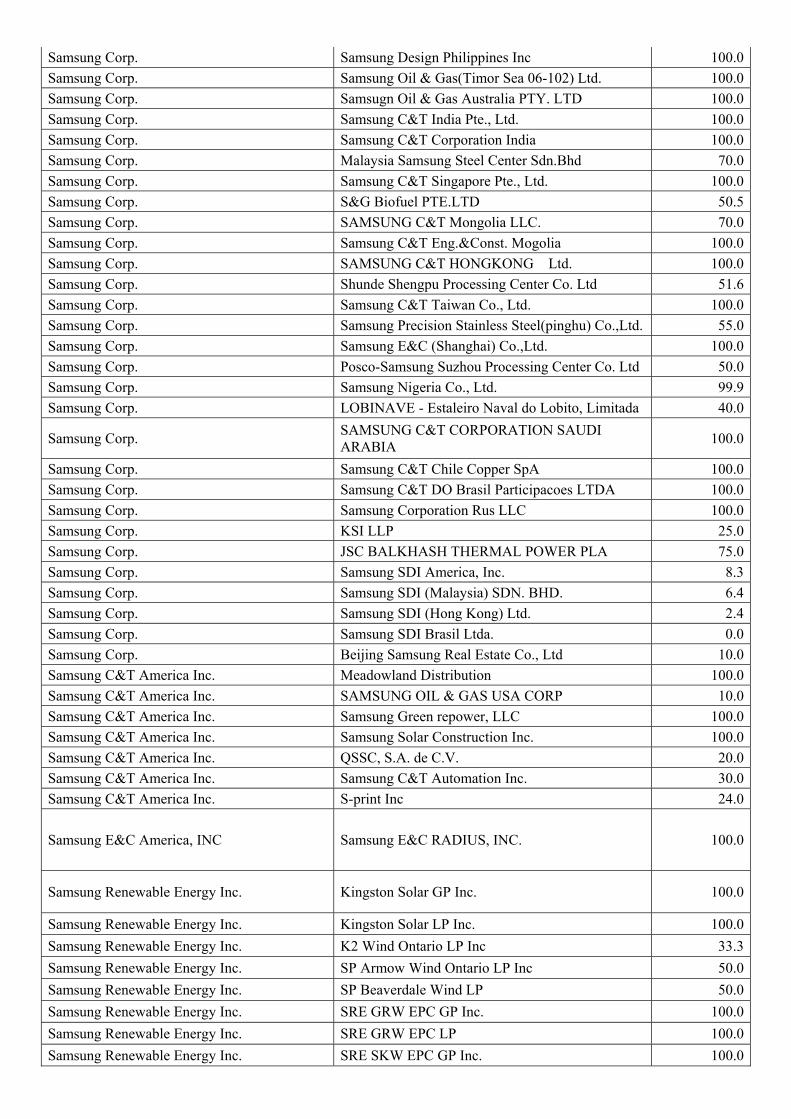
[Overseas] (As of end-June, 2013) (%, based on common shares)
Investor Investee Stake
Samsung Corp. MYODO METAL CO., LTD. 100.0
Samsung Corp. Samsung C&T Japan Corporation 100.0
Samsung Corp. Samsung C&T America Inc. 100.0
Samsung Corp. Samsung Finance Corporation. 80.0
Samsung Corp. Samsung E&C America, INC. 100.0
Samsung Corp. SAMSUNG OIL & GAS USA CORP 90.0
Samsung Corp. Samsung Renewable Energy Inc. 100.0
Samsung Corp. SCNT Power Norte S. De R.L. de C.V. 100.0
Samsung Corp. QSSC, S.A. de C.V. 60.0
Samsung Corp. Samsung C&T Oil & Gas Parallel 100.0
Samsung Corp. Samsung C&T Automation Inc. 70.0
Samsung Corp. Samsung C&T Canada Ltd. 100.0
Samsung Corp. Samsung C&T Deutchland GmbH 100.0
Samsung Corp. Samsung C&T U.K. Ltd. 100.0
Samsung Corp. Samsung Trading PLC. 100.0
Samsung Corp. Xiod Distribution 25.0
Samsung Corp. Samsung C&T France S.A.S 100.0
Samsung Corp. Samsung C&T ECUK Limited 100.0
Samsung Corp. Whessoe Project Limited. 100.0
Samsung Corp. SCNT Investment Atlantic SPRL 100.0
Samsung Corp. POSS-SLPC, s.r.o 50.0
Samsung Corp. Solluce Romania 1 B.V. 80.0
Samsung Corp. SAM investment Manzanilo.B.V 53.3
Samsung Corp. Solluce Slovenia 1 B.V. 80.0
Samsung Corp. Ecosolar OOD 100.0
Samsung Corp. Ecoenergy Solar OOD 100.0
Samsung Corp. Agirlplam EOOD 100.0
Samsung Corp. Fishtrade EOOD 100.0
Samsung Corp. Manageprojekt EOOD 100.0
Samsung Corp. Solar Park EOOD 100.0
Samsung Corp. Veselinovo Energy OOD 100.0
Samsung Corp. Samsung Engineering & Construction(M) SDN.BHD.
100.0
Samsung Corp. Samsung C&T Malaysia SDN. BHD 100.0
Samsung Corp. Erdsam Co., Ltd. 100.0
Samsung Corp. Samsung Chemtech 51.7
Samsung Corp. S-print Inc 40.0
Samsung Corp. Cassava Investment Korea Pte. Ltd. 29.7
Samsung Corp. P.T. Samsung Development 100.0
Samsung Corp. Samsung Development (Thailand) Co., Ltd. 33.0
Samsung Corp. Samsung C&T Thailand Co., Ltd 44.0
Samsung Corp. Cheil Holding Inc. 40.0
Samsung Corp. Samsung Const. Co. Phils.,Inc. 25.0
Page 22
Samsung Corp. Samsung Design Philippines Inc 100.0
Samsung Corp. Samsung Oil & Gas(Timor Sea 06-102) Ltd. 100.0
Samsung Corp. Samsugn Oil & Gas Australia PTY. LTD 100.0
Samsung Corp. Samsung C&T India Pte., Ltd. 100.0
Samsung Corp. Samsung C&T Corporation India 100.0
Samsung Corp. Malaysia Samsung Steel Center Sdn.Bhd 70.0
Samsung Corp. Samsung C&T Singapore Pte., Ltd. 100.0
Samsung Corp. S&G Biofuel PTE.LTD 50.5
Samsung Corp. SAMSUNG C&T Mongolia LLC. 70.0
Samsung Corp. Samsung C&T Eng.&Const. Mogolia 100.0
Samsung Corp. SAMSUNG C&T HONGKONG Ltd. 100.0
Samsung Corp. Shunde Shengpu Processing Center Co. Ltd 51.6
Samsung Corp. Samsung C&T Taiwan Co., Ltd. 100.0
Samsung Corp. Samsung Precision Stainless Steel(pinghu) Co.,Ltd. 55.0
Samsung Corp. Samsung E&C (Shanghai) Co.,Ltd. 100.0
Samsung Corp. Posco-Samsung Suzhou Processing Center Co. Ltd 50.0
Samsung Corp. Samsung Nigeria Co., Ltd. 99.9
Samsung Corp. LOBINAVE - Estaleiro Naval do Lobito, Limitada 40.0
Samsung Corp. SAMSUNG C&T CORPORATION SAUDI ARABIA
100.0
Samsung Corp. Samsung C&T Chile Copper SpA 100.0
Samsung Corp. Samsung C&T DO Brasil Participacoes LTDA 100.0
Samsung Corp. Samsung Corporation Rus LLC 100.0
Samsung Corp. KSI LLP 25.0
Samsung Corp. JSC BALKHASH THERMAL POWER PLA 75.0
Samsung Corp. Samsung SDI America, Inc. 8.3
Samsung Corp. Samsung SDI (Malaysia) SDN. BHD. 6.4
Samsung Corp. Samsung SDI (Hong Kong) Ltd. 2.4
Samsung Corp. Samsung SDI Brasil Ltda. 0.0
Samsung Corp. Beijing Samsung Real Estate Co., Ltd 10.0
Samsung C&T America Inc. Meadowland Distribution 100.0
Samsung C&T America Inc. SAMSUNG OIL & GAS USA CORP 10.0
Samsung C&T America Inc. Samsung Green repower, LLC 100.0
Samsung C&T America Inc. Samsung Solar Construction Inc. 100.0
Samsung C&T America Inc. QSSC, S.A. de C.V. 20.0
Samsung C&T America Inc. Samsung C&T Automation Inc. 30.0
Samsung C&T America Inc. S-print Inc 24.0
Samsung E&C America, INC Samsung E&C RADIUS, INC. 100.0
Samsung Renewable Energy Inc. Kingston Solar GP Inc. 100.0
Samsung Renewable Energy Inc. Kingston Solar LP Inc. 100.0
Samsung Renewable Energy Inc. K2 Wind Ontario LP Inc 33.3
Samsung Renewable Energy Inc. SP Armow Wind Ontario LP Inc 50.0
Samsung Renewable Energy Inc. SP Beaverdale Wind LP 50.0
Samsung Renewable Energy Inc. SRE GRW EPC GP Inc. 100.0
Samsung Renewable Energy Inc. SRE GRW EPC LP 100.0
Samsung Renewable Energy Inc. SRE SKW EPC GP Inc. 100.0
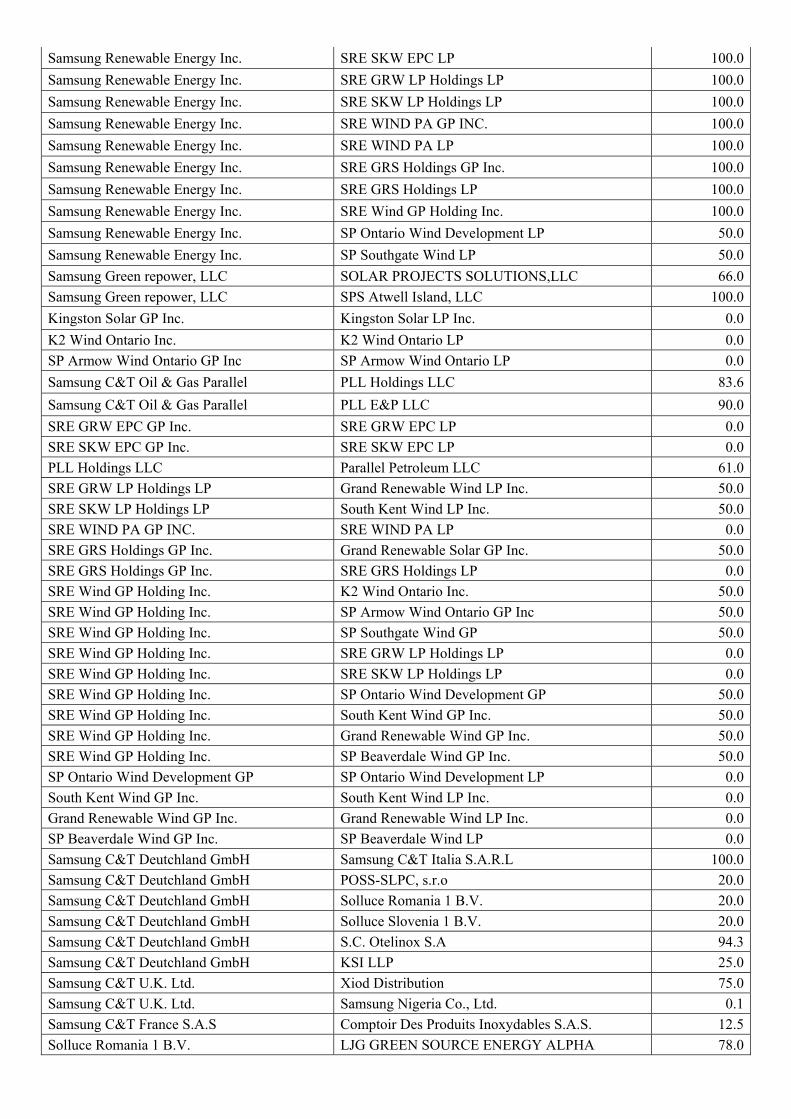
Page 23
Samsung Renewable Energy Inc. SRE SKW EPC LP 100.0
Samsung Renewable Energy Inc. SRE GRW LP Holdings LP 100.0
Samsung Renewable Energy Inc. SRE SKW LP Holdings LP 100.0
Samsung Renewable Energy Inc. SRE WIND PA GP INC. 100.0
Samsung Renewable Energy Inc. SRE WIND PA LP 100.0
Samsung Renewable Energy Inc. SRE GRS Holdings GP Inc. 100.0
Samsung Renewable Energy Inc. SRE GRS Holdings LP 100.0
Samsung Renewable Energy Inc. SRE Wind GP Holding Inc. 100.0
Samsung Renewable Energy Inc. SP Ontario Wind Development LP 50.0
Samsung Renewable Energy Inc. SP Southgate Wind LP 50.0
Samsung Green repower, LLC SOLAR PROJECTS SOLUTIONS,LLC 66.0
Samsung Green repower, LLC SPS Atwell Island, LLC 100.0
Kingston Solar GP Inc. Kingston Solar LP Inc. 0.0
K2 Wind Ontario Inc. K2 Wind Ontario LP 0.0
SP Armow Wind Ontario GP Inc SP Armow Wind Ontario LP 0.0
Samsung C&T Oil & Gas Parallel PLL Holdings LLC 83.6
Samsung C&T Oil & Gas Parallel PLL E&P LLC 90.0
SRE GRW EPC GP Inc. SRE GRW EPC LP 0.0
SRE SKW EPC GP Inc. SRE SKW EPC LP 0.0
PLL Holdings LLC Parallel Petroleum LLC 61.0
SRE GRW LP Holdings LP Grand Renewable Wind LP Inc. 50.0
SRE SKW LP Holdings LP South Kent Wind LP Inc. 50.0
SRE WIND PA GP INC. SRE WIND PA LP 0.0
SRE GRS Holdings GP Inc. Grand Renewable Solar GP Inc. 50.0
SRE GRS Holdings GP Inc. SRE GRS Holdings LP 0.0
SRE Wind GP Holding Inc. K2 Wind Ontario Inc. 50.0
SRE Wind GP Holding Inc. SP Armow Wind Ontario GP Inc 50.0
SRE Wind GP Holding Inc. SP Southgate Wind GP 50.0
SRE Wind GP Holding Inc. SRE GRW LP Holdings LP 0.0
SRE Wind GP Holding Inc. SRE SKW LP Holdings LP 0.0
SRE Wind GP Holding Inc. SP Ontario Wind Development GP 50.0
SRE Wind GP Holding Inc. South Kent Wind GP Inc. 50.0
SRE Wind GP Holding Inc. Grand Renewable Wind GP Inc. 50.0
SRE Wind GP Holding Inc. SP Beaverdale Wind GP Inc. 50.0
SP Ontario Wind Development GP SP Ontario Wind Development LP 0.0
South Kent Wind GP Inc. South Kent Wind LP Inc. 0.0
Grand Renewable Wind GP Inc. Grand Renewable Wind LP Inc. 0.0
SP Beaverdale Wind GP Inc. SP Beaverdale Wind LP 0.0
Samsung C&T Deutchland GmbH Samsung C&T Italia S.A.R.L 100.0
Samsung C&T Deutchland GmbH POSS-SLPC, s.r.o 20.0
Samsung C&T Deutchland GmbH Solluce Romania 1 B.V. 20.0
Samsung C&T Deutchland GmbH Solluce Slovenia 1 B.V. 20.0
Samsung C&T Deutchland GmbH S.C. Otelinox S.A 94.3
Samsung C&T Deutchland GmbH KSI LLP 25.0
Samsung C&T U.K. Ltd. Xiod Distribution 75.0
Samsung C&T U.K. Ltd. Samsung Nigeria Co., Ltd. 0.1
Samsung C&T France S.A.S Comptoir Des Produits Inoxydables S.A.S. 12.5
Solluce Romania 1 B.V. LJG GREEN SOURCE ENERGY ALPHA 78.0
Page 24
SAM investment Manzanilo.B.V Terminal KMS de GNL S. de R.L de C.V 37.5
Solluce Slovenia 1 B.V. ZE Solar 1 D.O.O. 70.0
Samsung Engineering & Construction(M) SDN.BHD.
SS KUKDONG JASATERA J/V 70.0
Cassava Investment Korea Pte. PT. Cahaya Borneo Sukses Agros 49.0
Cassava Investment Korea Pte. PT. Cassava Borneo Sukses Plan 49.0
Samsung C&T Thailand Co., Ltd Samsung Development (Thailand) 67.0
Cheil Holding Inc. Samsung Const. Co. Phils.,Inc. 75.0
Samsung C&T Singapore Pte., Ltd. Samsung Chemtech 48.3
Samsung C&T Singapore Pte., Ltd. S-print Inc 16.0
Samsung C&T Singapore Pte., Ltd. Cassava Investment Korea Pte. Ltd. 12.7
Samsung C&T Singapore Pte., Ltd. Malaysia Samsung Steel Center Sdn.Bhd 30.0
Samsung C&T Singapore Pte., Ltd. Samsung C&T Corporation Hanoi Logistics 40.0
Samsung C&T Singapore Pte., Ltd. S&G Biofuel PTE.LTD 12.6
S&G Biofuel PTE.LTD PT. Gandaerah Hendana 95.0
S&G Biofuel PTE.LTD PT. Inecda 95.0
SAMSUNG C&T HONGKONG Ltd. Samsung C&T Thailand Co., Ltd 13.2
SAMSUNG C&T HONGKONG Ltd. Tianjin International Trade Co. Ltd 100.0
SAMSUNG C&T HONGKONG Ltd. Samsung Trading (Shanghai Pu Dong New Area) Co., Ltd.
100.0
SAMSUNG C&T HONGKONG Ltd. Karson Industrial Co., Ltd. 100.0
SAMSUNG C&T HONGKONG Ltd. Samsung Trading (Shenzhen) Co., Ltd. 100.0
SAMSUNG C&T HONGKONG Ltd. Samsung Precision Stainless St 45.0
SAMSUNG C&T HONGKONG Ltd. Samsung (China) Logistics Ltd. 100.0
SAMSUNG C&T HONGKONG Ltd. Samsung Corporation (Gaungzhou) Limited. 100.0
SAMSUNG C&T HONGKONG Ltd. Posco-Samsung Suzhou Processing Center Co. Ltd 20.0
Samsung (China) Logistics Ltd. Samsung C&T Corporation Hanoi Logistics 11.0
Samsung (China) Logistics Ltd. Samsung Logistics (Tianjin) Ltd 100.0
Samsung (China) Logistics Ltd. Shenzhen Samsung Shipping Container Line Co., Ltd.
100.0
Samsung C&T Chile Copper SpA Pampa Camarones S.A. 46.5
S.C. Otelinox S.A Comptoir Des Produits Inoxydables S.A.S. 87.5
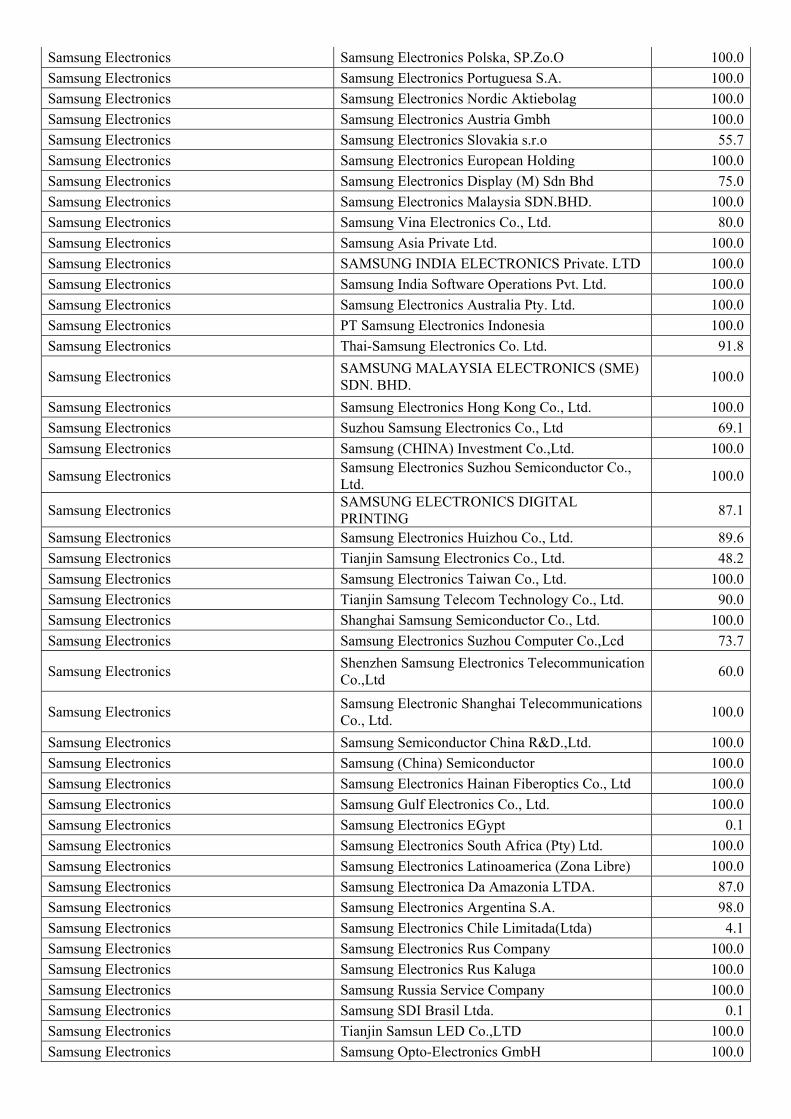
Samsung Electronics Samsung Japan Co., Ltd. 100.0
Samsung Electronics Samsung R&D Institute Japan Co. Ltd. 100.0
Samsung Electronics Samsung Electronics America Inc. 100.0
Samsung Electronics Samsung Electronics Canada Inc. 100.0
Samsung Electronics Samsung Electronics Mexico S.A. De C.V. 63.6
Samsung Electronics Nvelo.Inc 100.0
Samsung Electronics Samsung Electronics (UK) Ltd. 100.0
Samsung Electronics Samsung Electronics Ltd. 100.0
Samsung Electronics Samsung Electronics Holding GmbH 100.0
Samsung Electronics Samsung Electronics Iberia, S.A. 100.0
Samsung Electronics Samsung Electronics France S.A.S 100.0
Samsung Electronics Samsung Electronics Hungarian RT. 100.0
Samsung Electronics Samsung Electronics Italia S.P.A. 100.0
Samsung Electronics Samsung Electronics Europe Logistics B.V. 100.0
Samsung Electronics Samsung Electronics Benelux B.V. 100.0
Samsung Electronics Samsung Electronics Overseas B.V. 100.0
Page 25
Samsung Electronics Samsung Electronics Polska, SP.Zo.O 100.0
Samsung Electronics Samsung Electronics Portuguesa S.A. 100.0
Samsung Electronics Samsung Electronics Nordic Aktiebolag 100.0
Samsung Electronics Samsung Electronics Austria Gmbh 100.0
Samsung Electronics Samsung Electronics Slovakia s.r.o 55.7
Samsung Electronics Samsung Electronics European Holding 100.0
Samsung Electronics Samsung Electronics Display (M) Sdn Bhd 75.0
Samsung Electronics Samsung Electronics Malaysia SDN.BHD. 100.0
Samsung Electronics Samsung Vina Electronics Co., Ltd. 80.0
Samsung Electronics Samsung Asia Private Ltd. 100.0
Samsung Electronics SAMSUNG INDIA ELECTRONICS Private. LTD 100.0
Samsung Electronics Samsung India Software Operations Pvt. Ltd. 100.0
Samsung Electronics Samsung Electronics Australia Pty. Ltd. 100.0
Samsung Electronics PT Samsung Electronics Indonesia 100.0
Samsung Electronics Thai-Samsung Electronics Co. Ltd. 91.8
Samsung Electronics SAMSUNG MALAYSIA ELECTRONICS (SME) SDN. BHD.
100.0
Samsung Electronics Samsung Electronics Hong Kong Co., Ltd. 100.0
Samsung Electronics Suzhou Samsung Electronics Co., Ltd 69.1
Samsung Electronics Samsung (CHINA) Investment Co.,Ltd. 100.0
Samsung Electronics Samsung Electronics Suzhou Semiconductor Co., Ltd.
100.0
Samsung Electronics SAMSUNG ELECTRONICS DIGITAL PRINTING
87.1
Samsung Electronics Samsung Electronics Huizhou Co., Ltd. 89.6
Samsung Electronics Tianjin Samsung Electronics Co., Ltd. 48.2
Samsung Electronics Samsung Electronics Taiwan Co., Ltd. 100.0
Samsung Electronics Tianjin Samsung Telecom Technology Co., Ltd. 90.0
Samsung Electronics Shanghai Samsung Semiconductor Co., Ltd. 100.0
Samsung Electronics Samsung Electronics Suzhou Computer Co.,Lcd 73.7
Samsung Electronics Shenzhen Samsung Electronics Telecommunication Co.,Ltd
60.0
Samsung Electronics Samsung Electronic Shanghai Telecommunications Co., Ltd.
100.0
Samsung Electronics Samsung Semiconductor China R&D.,Ltd. 100.0
Samsung Electronics Samsung (China) Semiconductor 100.0
Samsung Electronics Samsung Electronics Hainan Fiberoptics Co., Ltd 100.0
Samsung Electronics Samsung Gulf Electronics Co., Ltd. 100.0
Samsung Electronics Samsung Electronics EGypt 0.1
Samsung Electronics Samsung Electronics South Africa (Pty) Ltd. 100.0
Samsung Electronics Samsung Electronics Latinoamerica (Zona Libre) 100.0
Samsung Electronics Samsung Electronica Da Amazonia LTDA. 87.0
Samsung Electronics Samsung Electronics Argentina S.A. 98.0
Samsung Electronics Samsung Electronics Chile Limitada(Ltda) 4.1
Samsung Electronics Samsung Electronics Rus Company 100.0
Samsung Electronics Samsung Electronics Rus Kaluga 100.0
Samsung Electronics Samsung Russia Service Company 100.0
Samsung Electronics Samsung SDI Brasil Ltda. 0.1
Samsung Electronics Tianjin Samsun LED Co.,LTD 100.0
Samsung Electronics Samsung Opto-Electronics GmbH 100.0
Page 26
Samsung Electronics Tianjin Samsung Opto-Electronics Co.Ltd 82.0
Samsung Display Intellectual Keystone Technology 100.0
Samsung Display Samsung Display Slovakia 100.0
Samsung Display Samsung Display Suzhou 100.0
Samsung Display Samsung Suzhou LCD 60.0
Samsung Display Samsung Display Dongguan 100.0
Samsung Display Samsung Display Tianjin 95.0
SEMES SEMES America,Inc.(previously KDNSA) 100.0
Samsung SNS Samsung SNS America.Inc. 100.0
Samsung SNS Samsung SNS Europe, Ltd. 100.0
Samsung Medison SonAce Deutschland GmbH 100.0
Samsung Medison Medison Italy SRL 100.0
Samsung Medison Medison Europe B.V. 100.0
Samsung Medison Medison Systems India Private LTD. 100.0
Samsung Medison Medison Medical Systems India 100.0
Samsung Medison Medison(Shanhai)Co.Ltd. 100.0
Samsung Medison Shanghai Medison Medical Instrument Co., Ltd 100.0
Samsung Medison Medison Medical Equipment 100.0
Samsung Medison Medison Do Brazil Ltda 100.0
Samsung Electronics America In Nexus DX, Inc. 100.0
Samsung Electronics America In NeuroLogica Corp. 100.0
Samsung Electronics America Inc. Samsung Receivables Corporation 39.2
Samsung Electronics America Inc. Samsung Semiconductor Inc. 100.0
Samsung Electronics America Inc. Samsung R&D Institute America 100.0
Samsung Electronics America Inc. Samsung International Inc. 100.0
Samsung Electronics America Inc. Samsung Telecommunications America LLC. 100.0
Nexus DX, Inc. Deltapoint Cardiac diagnostics 100.0
Nexus DX, Inc. Nanogen Recognomics GmbH 60.0
Samsung Semiconductor Inc. Grandis Inc. 100.0
Samsung Semiconductor Inc. Samsung Austin Semiconductor LLC. 100.0
Samsung R&D Institute America mSpot, Inc. 100.0
Samsung International Inc. Samsung Mexicana S.A. De C.V. 100.0
Samsung Telecommunications America LLC. Samsung Receivables Corporation 60.8
Samsung Electronics Mexico S.A Samsung Electroncis Corportati 99.9
Samsung Electronics Mexico S.A Samsung Electronics Digital Ap 99.9
Samsung Electronics (UK) Ltd. Samsung Semiconductor Europe Limited 100.0
Samsung Electronics Holding GmbH Samsung Semiconductor Europe G 100.0
Samsung Electronics Holding GmbH Samsung Electronics GmbH 100.0
Samsung Electronics Hungarian RT. Samsung Electronics Czech and Slovak s.r.o. 30.0
Samsung Electronics Hungarian RT. Samsung Electronics Slovakia s.r.o 44.3
Samsung Electronics Benelux B.V. Samsung Electronics Mexico S.A. De C.V. 36.4
Samsung Electronics Benelux B.V. Samsung Electronics West Africa 100.0
Samsung Electronics Benelux B.V. Samsung Electronics East Afric 100.0
Samsung Electronics Benelux B.V. Samsung Electronics EGypt 99.9
Samsung Electronics Benelux B.V. Samsung Electronics Israel 100.0
Samsung Electronics Benelux B.V. Samsung Electronics Tunisia 99.0
Samsung Electronics Benelux B.V. Samsung Electronics Pakistan 100.0
Samsung Electronics Benelux B.V. Samsung Electronics Turkey 100.0
Samsung Electronics Benelux B.V. Samsung Semiconductor Israel R&D Center,LTD. 100.0
Page 27
Samsung Electronics Benelux B.V. Samsung Electronics Levant Co.,Ltd 100.0
Samsung Electronics Benelux B.V. Samsung Electronics Morocco SARLAU 100.0
Samsung Electronics Benelux B.V. Samsung Electronics Venezuela 100.0
Samsung Electronics Benelux B.V. Samsung Electronica Da Amazonia LTDA. 13.0
Samsung Electronics Benelux B.V. Samsung Electronics Chile Limitada(Ltda) 95.9
Samsung Electronics Benelux B.V. Samsung Electronics Peru 100.0
Samsung Electronics Benelux B.V. Samsung Electronics Russia 100.0
Samsung Electronics Benelux B.V. Samsung Electronics Ukraine 100.0
Samsung Electronics Benelux B.V. Samsung Electronics Baltics 100.0
Samsung Electronics Benelux B.V. Samsung Electronics Ukraine Company 100.0
Samsung Electronics Benelux B.V. Samsung Moscow Reserch Center 100.0
Samsung Electronics Benelux B.V. Samsung Electronics Kazakhstan 100.0
Samsung Electronics Benelux B.V. SAMSUNG ELECTRONICS KZ AND CENTRAL ASIA LLP
100.0
Samsung Electronics European Holding Samsung Electronics Czech and Slovak s.r.o. 70.0
Samsung Electronics European Holding Samsung Electronics Romania LLC 100.0
Samsung Electronics European Holding Samsung Electronics Poland Manufacturing 100.0
Samsung Electronics European Holding Samsung Electronics Greece S.A. 100.0
Samsung Electronics European Holding Samsung Nanoradio Design Cente 100.0
Samsung Electronics European Holding Samsung Denmark Research Cente 100.0
Samsung Electronics European Holding Samsung France Research Center 100.0
Samsung Electronics European Holding Samsung Cambridge Solution Cen 100.0
Samsung Nanoradio Design Center General RF Modules AB 100.0
Samsung Nanoradio Design Center Nanoradio Hellas AE 100.0
Samsung Electronics Display (M) Sdn Bhd Tianjin Samsung Electronics Co., Ltd. 2.2
Samsung Asia Private Ltd. Samsung Electronics Japan Co., 100.0
Samsung Asia Private Ltd. Samsung Electronics Display (M) Sdn Bhd 25.0
Samsung Asia Private Ltd. Samsung Electronics Philippine 100.0
Samsung Asia Private Ltd. Samsung R&D Institute BanglaDe 100.0
Samsung Asia Private Ltd. Samsung Electronics Vietnam Co 100.0
Samsung Asia Private Ltd. Samsung Telecommunications Mal 100.0
Samsung Asia Private Ltd. Samsung Electronics Vietnam 100.0
Samsung Asia Private Ltd. Samsung SDI (Malaysia) SDN. BH 25.0
Samsung Asia Private Ltd. Samsung Electro-Mechanics Thailand Co., Ltd. 25.0
Samsung Asia Private Ltd. eSamsung Greater China Co., Lt 11.4
Samsung Asia Private Ltd. iMarket Asia Co., Ltd. 11.4
PT Samsung Electronics Indonesia P.T. Samsung Telecommunications Indonesia 99.0
Samsung Electronics Hong Kong Co., Ltd. eSamsung Greater China Co., Ltd. 11.3
Samsung Electronics Hong Kong iMarket Asia Co., Ltd. 11.3
Suzhou Samsung Electronics Co., Ltd Samsung Suzhou Electronics Export Co.,Ltd 100.0
Samsung (CHINA) Investment Co.,Ltd. Suzhou Samsung Electronics Co., Ltd 19.2
Samsung (CHINA) Investment Co.,Ltd. Samsung Guangzhou Mobile R&D Center 100.0
Samsung (CHINA) Investment Co.,Ltd. Samsung Tianjin Mobile Development Center 100.0
Samsung (CHINA) Investment Co.,Ltd. SRC-Shenzhen 100.0
Samsung (CHINA) Investment Co.,Ltd. SAMSUNG ELECTRONICS DIGITAL PRINTING
12.9
Samsung (CHINA) Investment Co.,Ltd. Samsung Electronics Huizhou Co., Ltd. 10.3
Samsung (CHINA) Investment Co.,Ltd. Tianjin Samsung Electronics Co., Ltd. 40.8
Samsung (CHINA) Investment Co.,Ltd. Beijing Samsung Telecom. R&D Center. 100.0
Page 28
Samsung (CHINA) Investment Co.,Ltd. Samsung Electronics Suzhou Computer Co.,Lcd 26.3
Samsung (CHINA) Investment Co.,Ltd. Samsung Electronics China R&D Center 100.0
Samsung (CHINA) Investment Co.,Ltd. Samsung Electronics Beijing Service Co., Ltd 100.0
Samsung (CHINA) Investment Co.,Ltd. Tianjin Samsung Opto-Electronics Co.Ltd 8.0
Samsung Gulf Electronics Co., Samsung Electronics EGypt 0.1
Samsung Electronics Morocco Co. Samsung Electronics Tunisia 1.0
Samsung Electronics Latin America Samsung Electronics Latino America Miami, Inc. 100.0
Samsung Electronics Latin America Samsung Electronica Columbia 100.0
Samsung Electronics Latin America Samsung Electronics Panama S.A 100.0
Samsung Electronica Da Amazonia LTDA. Samsung Electronics Argentina S.A. 2.0
Samsung SDI Samsung SDI Japan co.Ltd 100.0
Samsung SDI Samsung SDI America, Inc. 91.7
Samsung SDI Samsung SDI Germany GmbH. 100.0
Samsung SDI Samsung SDI Hungary Rt. 100.0
Samsung SDI Samsung SDI Europe GmbH. 100.0
Samsung SDI Samsung SDI (Malaysia) SDN. BHD. 68.6
Samsung SDI Samsung SDI Vietnam Co., LTD. 100.0
Samsung SDI Samsung SDI Energy Malaysia SD 100.0
Samsung SDI Samsung SDI (Hong Kong) Ltd. 91.9
Samsung SDI Samsung SDI China Co,.Ltd 100.0
Samsung SDI Samsung SDI Brasil Ltda. 4.0
Samsung SDI eSamsung Greater China Co., Lt 8.7
Samsung SDI iMarket Asia Co., Ltd. 8.7
Samsung SDI SSH Limited. 40.0
Samsung SDI America, Inc. Samsung SDI Mexico S.A. de C.V. 100.0
Samsung SDI America, Inc. Samsung SDI Brasil Ltda. 40.4
Samsung SDI Germany GmbH. Samsung SDI (Hong Kong) Ltd. 0.4
Samsung SDI Germany GmbH. Samsung SDI Brasil Ltda. 40.8
Samsung SDI (Malaysia) SDN. BHD. Samsung SDI (Hong Kong) Ltd. 5.3
Samsung SDI (Malaysia) SDN. BHD. Samsung SDI Brasil Ltda. 0.2
Samsung SDI (Hong Kong) Ltd. Shenzhen Samsung SDI Co., Ltd. 80.0
Samsung SDI (Hong Kong) Ltd. Tianjin Samsung SDI Co., Ltd. 80.0
Samsung SDI (Hong Kong) Ltd. Shanghai Samsung Electronic Devices Co., Ltd 60.3
Samsung SDI (Hong Kong) Ltd. Samsung SDI Brasil Ltda. 14.5
SEMCO Samsung Electro-Machanics Japan 100.0
SEMCO Samsung Electro-Mechanics Japan Advanced Technology Co.,Ltd.
100.0
SEMCO Samsung Electro-Mechanics America, Inc. 100.0
SEMCO Samsung Electro-Mechanics Germany, GMBH 100.0
SEMCO Samsung Electro-Mechanics Hungary Inc. 100.0
SEMCO Samsung Electro-Mechanics Thailand Co., Ltd. 75.0
SEMCO Samsung Electro-Mechanics Philippines, Corp. 100.0
SEMCO Calamba Premier Realty Corporation. 39.8
SEMCO Samsung Electro-Mechanics Pte. 100.0
SEMCO Dongguan Samsung Electro Mechanics Co., Ltd. 100.0
SEMCO Tianjin Samsung Electro-Mechanics 81.8
SEMCO Samsung Electro-Mechanics Hongkong Co., Ltd. 100.0
SEMCO Samsung High Techelectro-Mechanics Co., Ltd. 95.0
SEMCO Kunshan Samsung Electro-Mechanics 100.0
Page 29
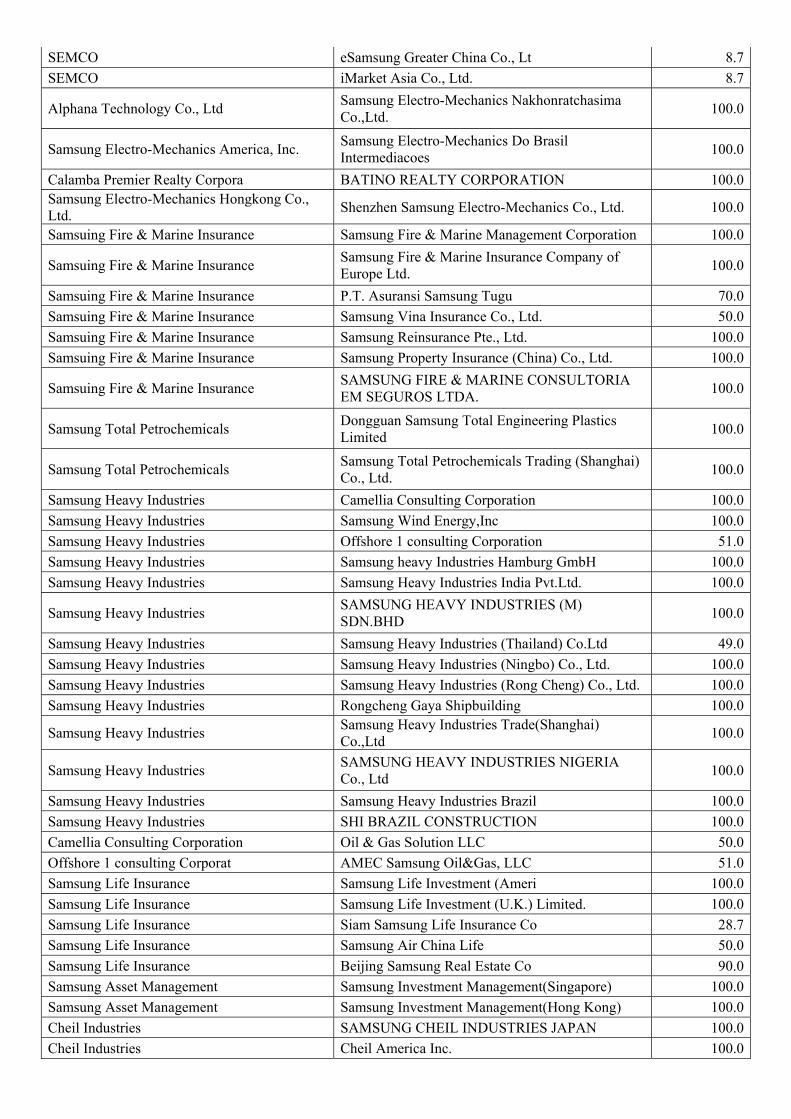
SEMCO eSamsung Greater China Co., Lt 8.7
SEMCO iMarket Asia Co., Ltd. 8.7
Alphana Technology Co., Ltd Samsung Electro-Mechanics Nakhonratchasima Co.,Ltd.
100.0
Samsung Electro-Mechanics America, Inc. Samsung Electro-Mechanics Do Brasil Intermediacoes
100.0
Calamba Premier Realty Corpora BATINO REALTY CORPORATION 100.0Samsung Electro-Mechanics Hongkong Co., Ltd.
Shenzhen Samsung Electro-Mechanics Co., Ltd. 100.0
Samsuing Fire & Marine Insurance Samsung Fire & Marine Management Corporation 100.0
Samsuing Fire & Marine Insurance Samsung Fire & Marine Insurance Company of Europe Ltd.
100.0
Samsuing Fire & Marine Insurance P.T. Asuransi Samsung Tugu 70.0
Samsuing Fire & Marine Insurance Samsung Vina Insurance Co., Ltd. 50.0
Samsuing Fire & Marine Insurance Samsung Reinsurance Pte., Ltd. 100.0
Samsuing Fire & Marine Insurance Samsung Property Insurance (China) Co., Ltd. 100.0
Samsuing Fire & Marine Insurance SAMSUNG FIRE & MARINE CONSULTORIA EM SEGUROS LTDA.
100.0
Samsung Total Petrochemicals Dongguan Samsung Total Engineering Plastics Limited
100.0
Samsung Total Petrochemicals Samsung Total Petrochemicals Trading (Shanghai) Co., Ltd.
100.0
Samsung Heavy Industries Camellia Consulting Corporation 100.0
Samsung Heavy Industries Samsung Wind Energy,Inc 100.0
Samsung Heavy Industries Offshore 1 consulting Corporation 51.0
Samsung Heavy Industries Samsung heavy Industries Hamburg GmbH 100.0
Samsung Heavy Industries Samsung Heavy Industries India Pvt.Ltd. 100.0
Samsung Heavy Industries SAMSUNG HEAVY INDUSTRIES (M) SDN.BHD
100.0
Samsung Heavy Industries Samsung Heavy Industries (Thailand) Co.Ltd 49.0
Samsung Heavy Industries Samsung Heavy Industries (Ningbo) Co., Ltd. 100.0
Samsung Heavy Industries Samsung Heavy Industries (Rong Cheng) Co., Ltd. 100.0
Samsung Heavy Industries Rongcheng Gaya Shipbuilding 100.0
Samsung Heavy Industries Samsung Heavy Industries Trade(Shanghai) Co.,Ltd
100.0
Samsung Heavy Industries SAMSUNG HEAVY INDUSTRIES NIGERIA Co., Ltd
100.0
Samsung Heavy Industries Samsung Heavy Industries Brazil 100.0
Samsung Heavy Industries SHI BRAZIL CONSTRUCTION 100.0
Camellia Consulting Corporation Oil & Gas Solution LLC 50.0
Offshore 1 consulting Corporat AMEC Samsung Oil&Gas, LLC 51.0
Samsung Life Insurance Samsung Life Investment (Ameri 100.0
Samsung Life Insurance Samsung Life Investment (U.K.) Limited. 100.0
Samsung Life Insurance Siam Samsung Life Insurance Co 28.7
Samsung Life Insurance Samsung Air China Life 50.0
Samsung Life Insurance Beijing Samsung Real Estate Co 90.0
Samsung Asset Management Samsung Investment Management(Singapore) 100.0
Samsung Asset Management Samsung Investment Management(Hong Kong) 100.0
Cheil Industries SAMSUNG CHEIL INDUSTRIES JAPAN 100.0
Cheil Industries Cheil America Inc. 100.0
Page 30
Cheil Industries Samsung Chemical (USA), INC. 100.0
Cheil Industries Starex Compounding America Inc 100.0
Cheil Industries Samsung Fashion S.r.L 100.0
Cheil Industries Samsung Chemical Europe Gmbh 100.0
Cheil Industries Samsung Chemical Hungary Limited 100.0
Cheil Industries SAMSUNG CHEMICAL(THAILAND) CO. 59.4
Cheil Industries Samsung Fashion Trading (Shanghai) 100.0
Cheil Industries Samsung Chemical Material Trading(Shanghai) Co., Ltd.
100.0
Cheil Industries Tianjin Samsung Engineering Plastics Co., Ltd. 100.0
Cheil Industries Samsung Chemical Electronic Materials (SuZhou) Co., Ltd.
100.0
Starex Compounding America Inc. STARCOM MEXICO 100.0
Samsung Fashion S.r.L COLOMBO VIA DELLA SPIGA S.R.L 100.0
SAMSUNG CHEMICAL(THAILAND) CO. Samsung Heavy Industries (Thailand) 25.5
SAMSUNG CHEMICAL(THAILAND) CO. Samsung Thai Engineering Co., 19.0
Samsung Techwin Techwin Engineering Center Co. 100.0
Samsung Techwin Samsung Opto-Electronics America 100.0
Samsung Techwin SAMSUNG TECHWIN EUROPE LIMITED 100.0
Samsung Techwin Tianjin Samsung Techwin Opto-Electronics 95.0
Samsung Techwin Shanghai Samsung Techwin 100.0
Samsung Techwin SAMSUNG TECHWIN DO BRASIL EQUIPAMENTOS
100.0
Samsung Everland Shanghai Ever-Hongjun Business 51.0
Samsung Everland eSamsung Greater China Co., Lt 19.3
Samsung Everland iMarket Asia Co., Ltd. 19.3
Credu Language Testing International, Inc 82.4
Opentide Greater China Co., Ltd. Opentide China Co., Ltd. 100.0
Opentide Greater China Co., Ltd. OpenTide Taiwan Co., Ltd. 100.0
Opentide Greater China Co., Ltd. OpenTide Interactive Advertising Co.,Ltd 100.0
Opentide China Co., Ltd. OpenTide e-Commerce Co., Ltd. 100.0
Opentide China Co., Ltd. OpenTide Marketing Service Co., Ltd. 100.0
iMarket Asia Co., Ltd. iMarket China Co., Ltd. 80.0
Samsung Corning Precision Materials Samsung Corning Malaysia SDN. BHD. 100.0
Samsung Corning Precision Materials SSH Limited. 60.0
Samsung Corning Malaysia SDN. Samsung Corning Precision Materials(M) sdn.bhd 100.0
Samsung Petrochemical Samsung Petrochemical (Shanghai) Co., Ltd. 100.0
Samsung Fine Chemicals Samsung Fine Chemicals Trading (Shanghai) Co., Ltd
100.0
Samsung Securities Samsung Securities (America), Inc. 100.0
Samsung Securities Samsung Securities (Europe) Limited. 100.0
Samsung Securities Samsung Securities (Asia) Limited. 100.0
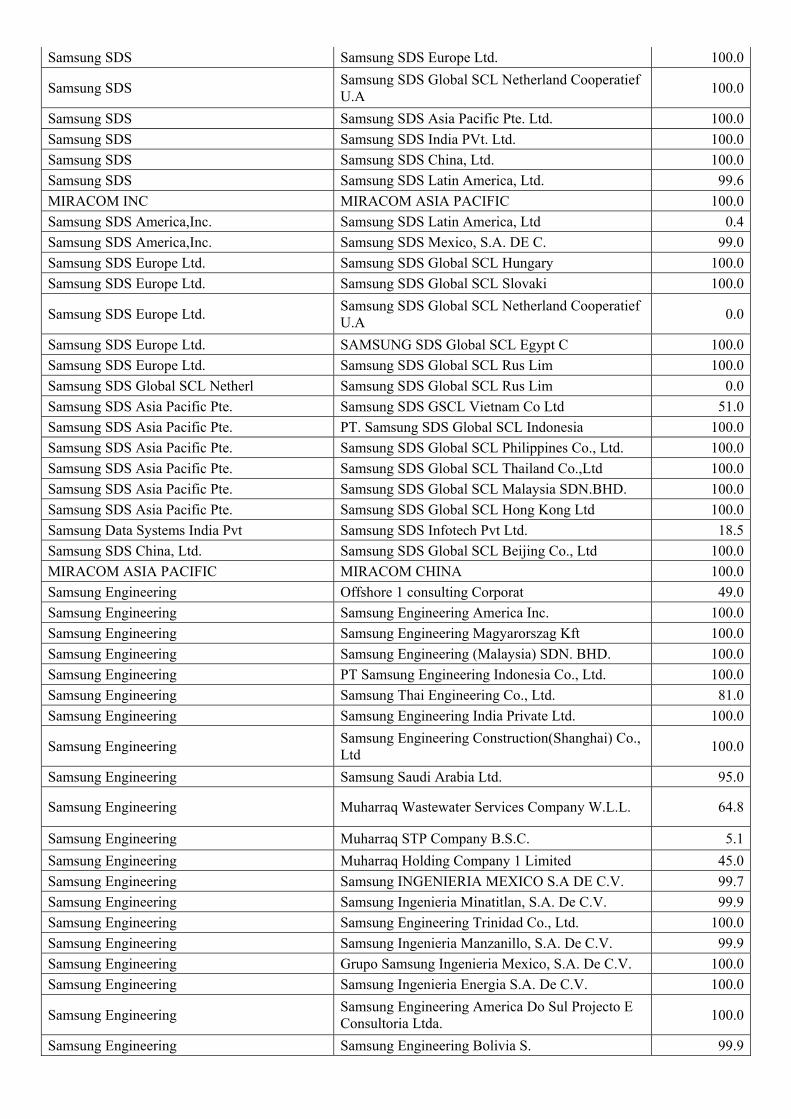
Samsung SDS Samsung SDS Infotech Pvt Ltd. 81.5
Samsung SDS eSamsung Greater China Co., Ltd. 40.6
Samsung SDS Opentide Greater China Co., Ltd. 36.7
Samsung SDS iMarket Asia Co., Ltd. 40.6
Samsung SDS Samsung SDS America, Inc. 100.0
Page 31
Samsung SDS Samsung SDS Europe Ltd. 100.0
Samsung SDS Samsung SDS Global SCL Netherland Cooperatief U.A
100.0
Samsung SDS Samsung SDS Asia Pacific Pte. Ltd. 100.0
Samsung SDS Samsung SDS India PVt. Ltd. 100.0
Samsung SDS Samsung SDS China, Ltd. 100.0
Samsung SDS Samsung SDS Latin America, Ltd. 99.6
MIRACOM INC MIRACOM ASIA PACIFIC 100.0
Samsung SDS America,Inc. Samsung SDS Latin America, Ltd 0.4
Samsung SDS America,Inc. Samsung SDS Mexico, S.A. DE C. 99.0
Samsung SDS Europe Ltd. Samsung SDS Global SCL Hungary 100.0
Samsung SDS Europe Ltd. Samsung SDS Global SCL Slovaki 100.0
Samsung SDS Europe Ltd. Samsung SDS Global SCL Netherland Cooperatief U.A
0.0
Samsung SDS Europe Ltd. SAMSUNG SDS Global SCL Egypt C 100.0
Samsung SDS Europe Ltd. Samsung SDS Global SCL Rus Lim 100.0
Samsung SDS Global SCL Netherl Samsung SDS Global SCL Rus Lim 0.0
Samsung SDS Asia Pacific Pte. Samsung SDS GSCL Vietnam Co Ltd 51.0
Samsung SDS Asia Pacific Pte. PT. Samsung SDS Global SCL Indonesia 100.0
Samsung SDS Asia Pacific Pte. Samsung SDS Global SCL Philippines Co., Ltd. 100.0
Samsung SDS Asia Pacific Pte. Samsung SDS Global SCL Thailand Co.,Ltd 100.0
Samsung SDS Asia Pacific Pte. Samsung SDS Global SCL Malaysia SDN.BHD. 100.0
Samsung SDS Asia Pacific Pte. Samsung SDS Global SCL Hong Kong Ltd 100.0
Samsung Data Systems India Pvt Samsung SDS Infotech Pvt Ltd. 18.5
Samsung SDS China, Ltd. Samsung SDS Global SCL Beijing Co., Ltd 100.0
MIRACOM ASIA PACIFIC MIRACOM CHINA 100.0
Samsung Engineering Offshore 1 consulting Corporat 49.0
Samsung Engineering Samsung Engineering America Inc. 100.0
Samsung Engineering Samsung Engineering Magyarorszag Kft 100.0
Samsung Engineering Samsung Engineering (Malaysia) SDN. BHD. 100.0
Samsung Engineering PT Samsung Engineering Indonesia Co., Ltd. 100.0
Samsung Engineering Samsung Thai Engineering Co., Ltd. 81.0
Samsung Engineering Samsung Engineering India Private Ltd. 100.0
Samsung Engineering Samsung Engineering Construction(Shanghai) Co., Ltd
100.0
Samsung Engineering Samsung Saudi Arabia Ltd. 95.0
Samsung Engineering Muharraq Wastewater Services Company W.L.L. 64.8
Samsung Engineering Muharraq STP Company B.S.C. 5.1
Samsung Engineering Muharraq Holding Company 1 Limited 45.0
Samsung Engineering Samsung INGENIERIA MEXICO S.A DE C.V. 99.7
Samsung Engineering Samsung Ingenieria Minatitlan, S.A. De C.V. 99.9
Samsung Engineering Samsung Engineering Trinidad Co., Ltd. 100.0
Samsung Engineering Samsung Ingenieria Manzanillo, S.A. De C.V. 99.9
Samsung Engineering Grupo Samsung Ingenieria Mexico, S.A. De C.V. 100.0
Samsung Engineering Samsung Ingenieria Energia S.A. De C.V. 100.0
Samsung Engineering Samsung Engineering America Do Sul Projecto E Consultoria Ltda.
100.0
Samsung Engineering Samsung Engineering Bolivia S. 99.9
Page 32
Samsung Engineering Samsung Engineering Kazakhstan LLP 100.0
Samsung Engineering America Inc SEA Construction, LLC 100.0
Samsung Engineering (Malaysia) Muharraq Wastewater Services C 0.3
Samsung Thai Engineering Co., SAMSUNG CHEMICAL(THAILAND) CO. 40.6
Samsung Engineering India Private Ltd. Samsung Saudi Arabia Ltd. 5.0
Samsung Saudi Arabia Ltd. Samsung EPC Company limited 75.0
Muharraq Holding Company 1 Lim Muharraq Holding Company 2 Lim 100.0
Muharraq Holding Company 2 Lim Muharraq STP Company B.S.C. 88.7
S1 Samsung Beijing Security Systems 100.0
Cheil Worldwide Cheil USA Inc. 100.0
Cheil Worldwide Cheil Central America Inc. 100.0
Cheil Worldwide Cheil Europe Ltd. 100.0
Cheil Worldwide Cheil Germany GmbH 100.0
Cheil Worldwide Cheil France SAS 100.0
Cheil Worldwide Cheil Nordic AB 100.0
Cheil Worldwide Cheil India Pvt. Ltd. 100.0
Cheil Worldwide Cheil (Thailand) Ltd. 100.0
Cheil Worldwide Cheil Singapore Pte. Ltd. 100.0
Cheil Worldwide Cheil Vietnam Co. Ltd. 90.0
Cheil Worldwide Cheil Integrated Marketing Philippines, Inc 100.0
Cheil Worldwide Cheil China 100.0
Cheil Worldwide Cheil Hong Kong Limited 100.0
Cheil Worldwide Bravo Asia Limited 100.0
Cheil Worldwide Bravo Asia-Shanghai 100.0
Cheil Worldwide Cheil MEA FZ-LLC 100.0
Cheil Worldwide Cheil South Africa Pty., Ltd. 100.0
Cheil Worldwide Cheil Brazil Communications Ltda. 100.0
Cheil Worldwide Cheil Mexico Inc. SA de CV 98.0
Cheil Worldwide Cheil Rus LLC 100.0
Cheil Worldwide Cheil Ukraine LLC 100.0
Cheil Worldwide Cheil Kazakhstan LLC 100.0
Hotel Shilla Samsung Hospitality America 100.0
Hotel Shilla New Jersey Int'l M.C.Inc. 100.0
Hotel Shilla SAMSUNG HOSPITALITY U.K. Limited 100.0
Hotel Shilla Shilla Travel Retail Pte.Ltd 100.0
Hotel Shilla SHILLA LIMITED 100.0
Hotel Shilla Samsung Shilla Business Service Beijing Co., Ltd. 100.0
Hotel Shilla SHILLA LIMITED 100.0
Cheil USA Inc. The Barbarian Group, LLC 75.6
Cheil USA Inc. McKinney Ventures LLC 100.0
Cheil USA Inc. Cheil India Pvt. Ltd. 0.0
Cheil USA Inc. Cheil Mexico Inc. SA de CV 2.0
Samsung Hospitality America Samsung Hospitality EUROPE 100.0
Cheil Europe Ltd. Beattie McGuinness Bungay Limited 75.3
Cheil Europe Ltd. Cheil Italia S.r.l 100.0
Cheil Europe Ltd. CHEIL SPAIN S.L 100.0
Cheil Europe Ltd. CHEIL BENELUX B.V. 100.0
Cheil Germany GmbH CHEIL AUSTRIA GMBH 100.0
Cheil (Thailand) Ltd. Samsung Heavy Industries (Thailand) Co.Ltd 25.5
Page 33
Cheil Singapore Pte. Ltd. Opentide Greater China Co., Ltd. 58.3
Cheil MEA FZ-LLC One Agency FZ LLC 100.0
Cheil MEA FZ-LLC One Agency Istanbul Advertisement, Communication & Production LLC
0.0
One Agency FZ LLC One Agency Istanbul Advertisement, Communication & Production LLC
100.0
One Agency FZ LLC One Agency Interior Design LLC 100.0
One Agency FZ LLC One Agency Printing LLC 100.0
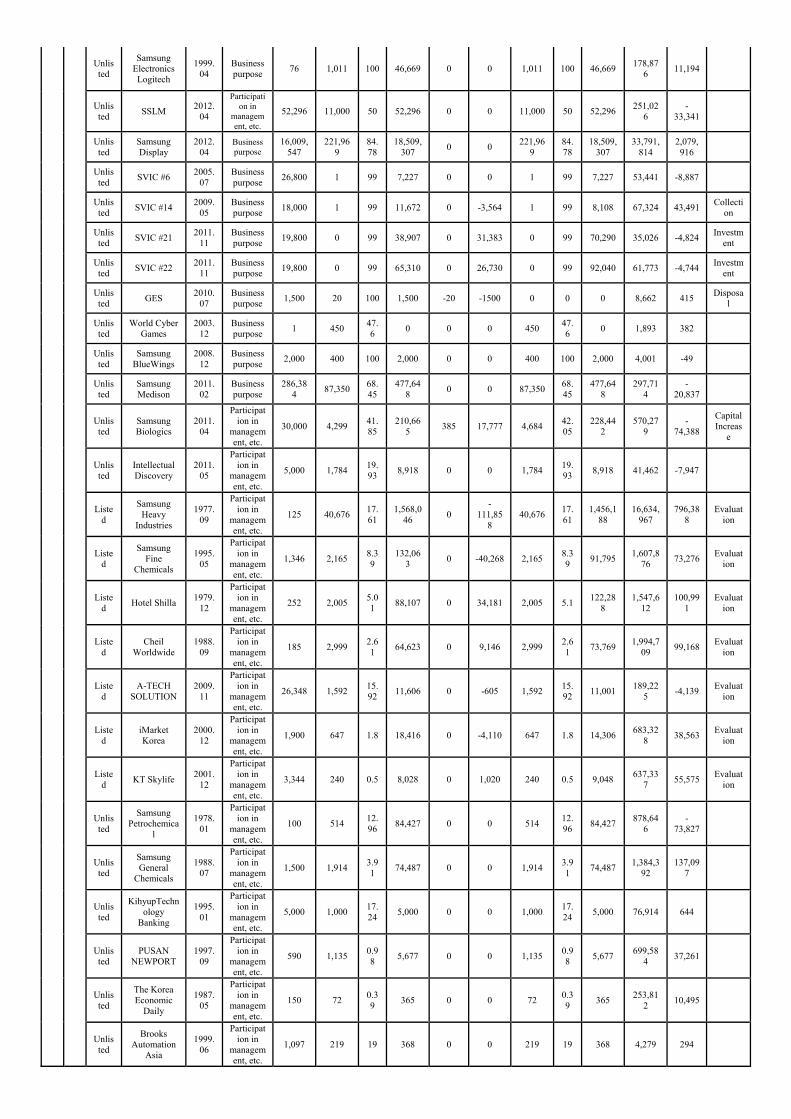
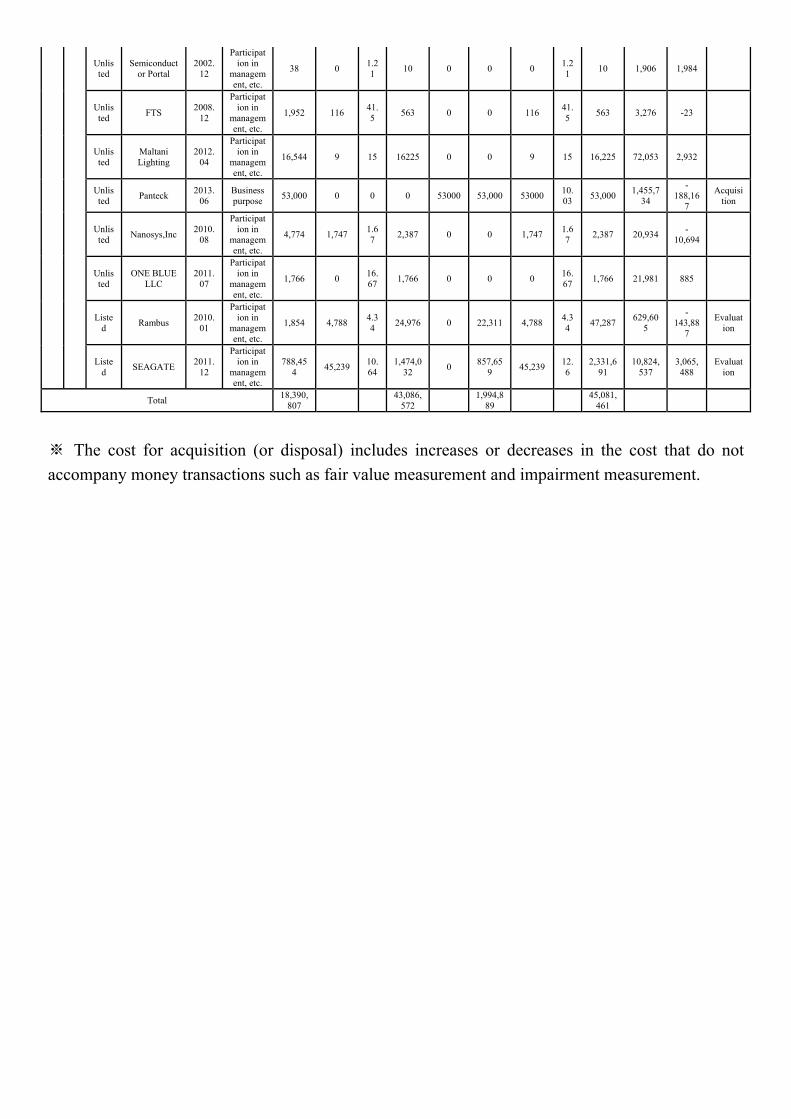
□ Equity Investments in Other Companies
As of end-1H 2013, Samsung Electronics’ equity investments in other companies amounted to KRW45,081,500,000,000 and such investments were made for business purpose, etc.
(As of June 30, 2013) (K shares, million won, %)
Account Company
name
Date of
purchase
Purpose Initial
acquisition cost
Year-beginning balance Increase/decrease Year-end balance Financial status
Note
No. of hares
Stake
Book value
No. of shares
Cost for
acquisition (or disposa
l)
No. of shares
Stake
Book value
Total asset
Net profit
Dom
estic
Available for sale securities
Listed
Samsung SDI
1977.01
Participation in
management, etc.
304 9,283 19.68
874,079
0 0 9,283 19.68
874,079
10,895,087
1,486,814
Listed
SEMCO 1977.
01
Participation in
management, etc.
250 17,69322.8
445,244
0 0 17,69322.8
445,244
6,891,464
452,006
Listed
Samsung Card
1988.12
Participation in
management, etc.
10,000 43,39337.45
1,455,485
0 0 43,39337.45
1,455,485
16,287,816
749,875
Listed
Samsung Techwin
1977.12
Participation in
management, etc.
336 13,52725.46
235,638
0 0 13,52725.46
235,638
3,240,938
131,324
Unlisted
STECO 1995.
06 Business purpose
24,000 2,448 51 32,724 0 0 2,448 51 32,724 103,64
6 3,031
Unlisted
SEMES 1992.
12 Business purpose
1,000 1,805 90.27
45,697 359 24,667 2,164 91.2
70,364 338,82
2 28,972
Acquisition
Unlisted
Samsung SNS
1996.12
Participation in
management, etc.
3,800 3,933 35.47
56,129 0 0 3,933 35.47
56,129 325,82
4 41,332
Unlisted
SERI 1991.
05
Participation in
management, etc.
320 3,576 29.8
24,942 0 0 3,576 29.8
24,942 110,26
0 174
Unlisted
Samsung SDS
1992.07
Participation in
management, etc.
6,160 15,65621.67
430,831
0 0 15,65621.67
430,831
4,465,407
407,165
Unlisted
Samsung Lions
1986.08
Participation in
management, etc.
240 55 27.5
-102 0 0 55 27.5
-102 60,964 -137
Unlisted
SECRON 1993.
11 Business purpose
1,000 745 93.09
21,147 -745 -21,147 0 0 0 126,15
4 17,274
Disposal
Unlisted
Samsung Electronics
Service
1998.01
Business purpose
30,000 6,000 99.33
48,121 0 0 6,000 99.33
48,121 292,38
7 5,735
Unlisted
MEMC Korea
1991.12
Participation in
management, etc.
36,000 3,440 20 35,286 0 0 3,440 20 35,286 275,17
6 13,404
Unlisted
Living Plaza 2000.
12 Business purpose
3,100 1,767 100247,52
3 0 0 1,767 100
247,523
514,542
7,995
Page 34
Unlisted
Samsung Electronics Logitech
1999.04
Business purpose
76 1,011 100 46,669 0 0 1,011 100 46,669 178,87
6 11,194
Unlisted
SSLM 2012.
04
Participation in
management, etc.
52,296 11,000 50 52,296 0 0 11,000 50 52,296 251,02
6 -
33,341
Unlisted
Samsung Display
2012.04
Business purpose
16,009,547
221,969
84.78
18,509,307
0 0 221,96
9 84.78
18,509,307
33,791,814
2,079,916
Unlisted
SVIC #6 2005.
07 Business purpose
26,800 1 99 7,227 0 0 1 99 7,227 53,441 -8,887
Unlisted
SVIC #14 2009.
05 Business purpose
18,000 1 99 11,672 0 -3,564 1 99 8,108 67,324 43,491Collecti
on
Unlisted
SVIC #21 2011.
11 Business purpose
19,800 0 99 38,907 0 31,383 0 99 70,290 35,026 -4,824Investm
ent
Unlisted
SVIC #22 2011.
11 Business purpose
19,800 0 99 65,310 0 26,730 0 99 92,040 61,773 -4,744Investm
ent
Unlisted
GES 2010.
07 Business purpose
1,500 20 100 1,500 -20 -1500 0 0 0 8,662 415 Disposa
l
Unlisted
World Cyber Games
2003.12
Business purpose
1 450 47.6
0 0 0 450 47.6
0 1,893 382
Unlisted
Samsung BlueWings
2008.12
Business purpose
2,000 400 100 2,000 0 0 400 100 2,000 4,001 -49
Unlisted
Samsung Medison
2011.02
Business purpose
286,384
87,35068.45
477,648
0 0 87,35068.45
477,648
297,714
-20,837
Unlisted
Samsung Biologics
2011.04
Participation in
management, etc.
30,000 4,299 41.85
210,665
385 17,777 4,684 42.05
228,442
570,279
-74,388
Capital Increas
e
Unlisted
Intellectual Discovery
2011.05
Participation in
management, etc.
5,000 1,784 19.93
8,918 0 0 1,784 19.93
8,918 41,462 -7,947
Listed
Samsung Heavy
Industries
1977.09
Participation in
management, etc.
125 40,67617.61
1,568,046
0 -
111,858
40,67617.61
1,456,188
16,634,967
796,388
Evaluation
Listed
Samsung Fine
Chemicals
1995.05
Participation in
management, etc.
1,346 2,165 8.39
132,063
0 -40,268 2,165 8.39
91,795 1,607,8
76 73,276
Evaluation
Listed
Hotel Shilla 1979.
12
Participation in
management, etc.
252 2,005 5.01
88,107 0 34,181 2,005 5.1 122,28
8 1,547,6
12 100,99
1 Evaluat
ion
Listed
Cheil Worldwide
1988.09
Participation in
management, etc.
185 2,999 2.61
64,623 0 9,146 2,999 2.61
73,769 1,994,7
09 99,168
Evaluation
Listed
A-TECH SOLUTION
2009.11
Participation in
management, etc.
26,348 1,592 15.92
11,606 0 -605 1,592 15.92
11,001 189,22
5 -4,139
Evaluation
Listed
iMarket Korea
2000.12
Participation in
management, etc.
1,900 647 1.8 18,416 0 -4,110 647 1.8 14,306 683,32
8 38,563
Evaluation
Listed
KT Skylife 2001.
12
Participation in
management, etc.
3,344 240 0.5 8,028 0 1,020 240 0.5 9,048 637,33
7 55,575
Evaluation
Unlisted
Samsung Petrochemica
l
1978.01
Participation in
management, etc.
100 514 12.96
84,427 0 0 514 12.96
84,427 878,64
6 -
73,827
Unlisted
Samsung General
Chemicals
1988.07
Participation in
management, etc.
1,500 1,914 3.91
74,487 0 0 1,914 3.91
74,487 1,384,3
92 137,09
7
Unlisted
KihyupTechnology
Banking
1995.01
Participation in
management, etc.
5,000 1,000 17.24
5,000 0 0 1,000 17.24
5,000 76,914 644
Unlisted
PUSAN NEWPORT
1997.09
Participation in
management, etc.
590 1,135 0.98
5,677 0 0 1,135 0.98
5,677 699,58
4 37,261
Unlisted
The Korea Economic
Daily
1987.05
Participation in
management, etc.
150 72 0.39
365 0 0 72 0.39
365 253,81
2 10,495
Unlisted
Brooks Automation
Asia
1999.06
Participation in
management, etc.
1,097 219 19 368 0 0 219 19 368 4,279 294
Page 35
Unlisted
Samsung Venture
Investment Corporation
1999.11
Participation in
management, etc.
4,900 980 16.33
6,053 0 0 980 16.33
6,053 62,761 4,776
Unlisted
Cyber Bank 2000.
12
Participation in
management, etc.
8,000 1,083 7.46
0 0 0 1,083 7.46
0 0 0
Unlisted
Fine Chips 2001.
12
Participation in
management, etc.
10 2 3.81
10 0 0 2 3.81
10 3,074 -415
Unlisted
SK Telink 2010.
11
Participation in
management, etc.
4,357 15 1.13
4,357 0 0 15 1.13
4,357 242,76
5 -
74,164
Unlisted
Inkel 2006.
11
Participation in
management, etc.
130 0 0 0 0 0 0 0 0 149,04
9 1,572
Unlisted
Yongpyong Resort
2007.05
Participation in
management, etc.
1,869 400 1.05
1,869 0 0 400 1.05
1,869 775,25
3 11,948
Unlisted
Scom(Previously Trigem Computer)
2007.12
Participation in
management, etc.
0 0 0.01
0 0 0 0 0.01
0 52,714-
14,059
Unlisted
Trigem Computer
(Previously TG Sambo)
2012.09
Participation in
management, etc.
0 0 0.01
0 0 0 0 0.01
0 26,367 -402
Unlisted
iCube Investment Union #1
2009.12
Participation in
management, etc.
4,000 0 16.23
4,000 0 0 0 16.23
4,000 24,164 72
Unlisted
KT WiBro Infra
2010.07
Participation in
management, etc.
60,000 600 24.2
60,000 0 0 600 24.2
60,000 259,36
8 2,635
Unlisted
Shinsung 2010.
07
Participation in
management, etc.
1 1 0.01
0 0 0 1 0.01
0 58,999 2,680
Unlisted
Woobang 2010.
07
Participation in
management, etc.
0 1 0 0 0 0 1 0 0 113,78
1 -
25,649
Unlisted
Heehoon D&G
2010.07
Participation in
management, etc.
0 2 0.02
0 0 0 2 0.02
0 42,516 -8,168
Unlisted
Daewoo Development
Co.,Ltd.- Engineering
& Construction
2012.12
Participation in
management, etc.
0 0 0.02
0 0 0 0 0.02
0 227,91
4 2,107
Unlisted
Daewoo SD Development
2012.12
Participation in
management, etc.
0 9 0.02
0 0 0 9 0.02
0 1,418,3
38 -
74,950
Unlisted
Daewoo Motor Sales
2012.12
Participation in
management, etc.
0 1 0 0 0 0 1 0 0 363,93
5 -
30,965
Unlisted
JNT (semiconduct
or fund)
2011.02
Equity investment, etc.
1,800 0 24 3,600 0 -240 0 24 3,360 16,088 1383 Capital Increas
e
Unlisted
SV (semiconduct
or fund)
2011.02
Equity investment, etc.
1,850 0 14.8
3,403 0 0 0 14.8
3,403 23,257 -352 Capital Increas
e
Unlisted
Seoul Investment
Partners
2011.1
Equity investment, etc.
1,550 0 19.4
3,100 0 -53 0 19.4
3,047 15,520 -345 Collecti
on
Unlisted
Daishin-Aju IB
(Semiconductor fund)
2011.08
Equity investment, etc.
258 0 3 750 0 1206 0 3 1956 18,437 -7766Investm
ent
Unlisted
TS (semiconduct
or fund)
2011.11
Equity investment, etc.
1,700 0 19.9
1,700 0 0 0 19.9
1,700 8,953 -376
Page 36
Unlisted
IMM (semiconduct
or fund)
2011.11
Equity investment, etc.
760 0 7.6 1581 0 908 0 7.6 2,489 19,890 -821 Investm
ent
Unlisted
L&S (semiconduct
or fund)
2012.07
Equity investment, etc.
848 0 8.1 848 0 0 0 8.1 848 9,629 -732
Unlisted
Hi Pioneer Investment
Trust #1
2011.09
Business purpose
29,244 0 100 19,470 0 0 0 100 19,470 19,498 -238
Overseas
Available for sale secu
rities
Unlisted
SECA 1992.
08
Establishment of overseas foothold
3,823 0 100 90,922 0 0 0 100 90,922 609,19
2 46,477
Unlisted
SEA 1978.
07
Establishment of overseas foothold
59,362 492 1004,705,0
37 0
156,297
492 100 4,861,3
34 11,432,
490 201,79
0 Investm
ent
Unlisted
SELA 1989.
04
Establishment of overseas foothold
319 40 100 86,962 0 0 40 100 86,962 352,77
2 -
17,071
Unlisted
SEM 1995.
07
Establishment of overseas foothold
3,032 3,173 63.58
111,697
0 0 3,173 63.58
111,697
1,291,398
37,902
Unlisted
SEASA 1996.
06
Establishment of overseas foothold
4,696 21,854 98 6,779 0 0 21,854 98 6,779 58,163 4,170
Unlisted
SEDA 1994.
01
Establishment of overseas foothold
13,224 48,643,
932 87.04
498,768
14172404
78,71562,816,
336 87.04
577,483
2,556,334
198,552
Capital Increas
e
Unlisted
SECH 2002.
12
Establishment of overseas foothold
597 0 4.1 597 0 0 0 4.1 597 478,18
8 14,895
Unlisted
Nvelo, Inc. 2012.
12
Establishment of overseas foothold
42,892 100 100 42,892 0 0 100 100 42,892 1,418 490
Unlisted
CMLA LLC 2008.
02
Participation in
management, etc.
654 0 25 4,115 0 0 0 25 4,115 11,077 -766
Unlisted
SESA 1989.
01
Establishment of overseas foothold
3,276 8,021 100142,09
1 0 0 8,021 100
142,091
836,508
46,590
Unlisted
SENA 1992.
03
Establishment of overseas foothold
392 1,000 100 69,372 0 0 1,000 100 69,372 503,65
1 48,329
Unlisted
SEH 1991.
05
Establishment of overseas foothold
1,954 753 100650,15
7 0 0 753 100
650,157
1,301,842
153,961
Unlisted
SEP 1982.
09
Establishment of overseas foothold
204 1,751 100 37,616 0 0 1,751 100 37,616 154,28
1 4,657
Unlisted
SEF 1991.
08
Establishment of overseas foothold
230 2,700 100234,11
5 0 0 2,700 100
234,115
922,036
70,367
Unlisted
SEUK 1995.
07
Establishment of overseas foothold
33,908 109,54
6 100
433,202
0 0 109,54
6 100
433,202
1,349,828
74,329
Unlisted
SEHG 1982.
02
Establishment of overseas foothold
28,042 0 100354,84
6 0 0 0 100
354,846
764,776
128,446
Unlisted
SEAG 2002.
01
Establishment of overseas foothold
40 0 100 32,162 0 0 0 100 32,162 299,97
8 41,191
Unlisted
SEI 1993.
05
Establishment of overseas foothold
862 677 100143,18
1 0 0 677 100
143,181
1,161,920
65,530
Unlisted
SEBN 1995.
07
Establishment of overseas foothold
236 388,18
3 100
693,010
90,407136,07
0 478,59
0 100
829,080
1,038,688
86,871Capital Increas
e
Unlisted
SELS 1991.
05
Establishment of overseas foothold
18,314 1,306 100 24,288 0 0 1,306 100 24,288 1,529,8
51 29,372
Page 37
Unlisted
SEPOL 1996.
04
Establishment of overseas foothold
5,462 106 100 78,267 0 0 106 100 78,267 487,34
8 39,460
Unlisted
SSA 1998.
12
Establishment of overseas foothold
263 2,000 100 32,622 0 0 2,000 100 32,622 605,06
5 -
22,905
Unlisted
SESK 2002.
06
Establishment of overseas foothold
8,976 0 55.68
263,767
0 0 0 55.68
263,767
1,696,474
147,665
Unlisted
SEEH 2008.
01
Establishment of overseas foothold
4,214 0 1001,170,0
32 0 0 0 100
1,170,032
4,377,597
7,856
Unlisted
SEO 1997.
01
Establishment of overseas foothold
120 0 100 -10,043 0 0 0 100 -10,043 143,65
7 612
Unlisted
SRSC 1997.
11
Establishment of overseas foothold
707 0 100 8,211 0 0 0 100 8,211 39,003 5,518
Unlisted
SERC 2006.
01
Establishment of overseas foothold
24,877 0 100180,07
9 0 0 0 100
180,079
1,705,108
21,832
Unlisted
SERK 2007.
07
Establishment of overseas foothold
4,600 0 100204,55
5 0 0 0 100
204,555
1,296,147
194,169
Unlisted
SEAU 1987.
11
Establishment of overseas foothold
392 53,200 100111,96
4 0 0 53,200 100
111,964
527,635
16,514
Unlisted
SEMA 1989.
09
Establishment of overseas foothold
4,378 16,247 100153,60
2 0 0 16,247 100
153,602
271,191
41,622
Unlisted
SGE 1995.
05
Establishment of overseas foothold
827 0 100 32,821 0 0 0 100 32,821 589,14
3 13,183
Unlisted
SEEG 2012.
07
Establishment of overseas foothold
23 0 0.05
23 0 0 0 0.05
23 45,446 -414
Unlisted
SEIN 1991.
08
Establishment of overseas foothold
7,463 46 99.99
118,909
0 0 46 99.99
118,909
562,515
48,398
Unlisted
SDMA 1995.
03
Establishment of overseas foothold
21,876 71,400 75244,38
2 0 0 71,400 75
244,382
860,402
85,895
Unlisted
SIEL 1995.
08
Establishment of overseas foothold
5,414 216,78
7 100 75,263 0 0
216,787
100 75,263 1,449,9
83 316,99
4
Unlisted
SISO 2005.
05
Establishment of overseas foothold
7,358 17 100 31,787 0 0 17 100 31,787 120,28
0 20,739
Unlisted
SAVINA 1995.
01
Establishment of overseas foothold
5,839 0 80 23,428 0 0 0 80 23,428 150,31
0 8,867
Unlisted
TSE 1988.
01
Establishment of overseas foothold
1,390 11,02091.83
279,163
0 0 11,02091.83
279,163
1,447,777
295,994
Unlisted
STE 1996.
01
Establishment of overseas foothold
4,206 0 49 4,474 0 0 0 49 4,474 39,605 -35
Unlisted
SEPHIL 2001.
03
Establishment of overseas foothold
12,934 9,876 100 78,919 -9876 -78919 0 0 0 133,74
9 34,646
Disposal
Unlisted
SME 2003.
05
Establishment of overseas foothold
4,796 17,100 100 7,644 0 0 17,100 100 7,644 572,46
3 31,160
Unlisted
SAPL 2006.
07
Establishment of overseas foothold
793 736,26
9 100
866,243
0 1,180 736,26
9 100
867,423
1,897,717
354 Capital Increase
Page 38
Unlisted
SEHK 1988.
09
Establishment of overseas foothold
349 274,25
0 100 79,033 0 0
274,250
100 79,033 1,294,4
73 83,950
Unlisted
SET 1994.
11
Establishment of overseas foothold
456 27,270 100112,94
9 0 0 27,270 100
112,949
2,117,243
38,298
Unlisted
SESS 1994.
12
Establishment of overseas foothold
18,875 0 100483,92
3 0 0 0 100
483,923
752,898
66,967
Unlisted
SCIC 1996.
03
Establishment of overseas foothold
23,253 0 100617,94
1 0 0 0 100
617,941
5,407,272
264,269
Unlisted
SEHZ 1992.
12
Establishment of overseas foothold
792 0 89.56
255,535
0 0 0 89.56
255,535
3,275,716
700,435
Unlisted
SSEC 1995.
04
Establishment of overseas foothold
32,128 0 69.06
130,551
0 0 0 69.06
130,551
577,834
65,593
Unlisted
TSEC 1993.
04
Establishment of overseas foothold
15,064 0 48.2
138,101
0 0 0 48.2
138,101
837,993
78,068
Unlisted
SSDP 1993.
08
Establishment of overseas foothold
4,446 0 87.1
65,319 0 0 0 87.1
65,319 721,67
8 103,50
8
Unlisted
TSTC 2001.
03
Establishment of overseas foothold
10,813 0 90490,04
1 0 0 0 90
490,041
2,234,437
551,682
Unlisted
SSTC 2001.
11
Establishment of overseas foothold
15,799 0 100 -1,186 0 0 0 100 -1,186 5,923 -4,781
Unlisted
SSET (Previously SSKMT)
2002.02
Establishment of overseas foothold
6,009 0 60102,19
6 0 19428 0 60
121,624
88,103 15,646Investm
ent
Unlisted
SESC 2002.
09
Establishment of overseas foothold
5,471 0 73.7
34,028 0 0 0 73.7
34,028 1,232,6
25 111,84
7
Unlisted
SSS 2001.
01
Establishment of overseas foothold
1,200 0 100 19,189 0 0 0 100 19,189 1,998,9
89 60,991
Unlisted
SEHF 2004.
04
Establishment of overseas foothold
17,204 0 100 85,088 0 0 0 100 85,088 109,42
3 80,579
Unlisted
SSCR 2006.
09
Establishment of overseas foothold
3,405 0 100 9,332 0 0 0 100 9,332 15,611 1,631
Unlisted
TSOE 2010.
04
Establishment of overseas foothold
33,837 167,19
9 82 93,154 0 0
167,199
82 93,154 239,26
9 40,644
Unlisted
TSLED 2012.
04
Establishment of overseas foothold
119,519
0 100119,51
9 0 0 0 100
119,519
479,900
-731
Unlisted
SCS 2012.
09
Establishment of overseas foothold
111,770
0 100382,79
6 0
785,472
0 100 1,168,2
68 424,48
7 -3,819
Capital Increas
e
Unlisted
SJC 1975.
12
Establishment of overseas foothold
273 1560 100370,64
7 0 0 1,560 100
370,647
1,570,232
26,503
Unlisted
SRJ (Previously
SYRI)
1992.08
Establishment of overseas foothold
3,120 122 100 92,582 0 0 122 100 92,582 207,79
8 4,379
Unlisted
TSST Japan 2004.
03
Participation in
management, etc.
1,639 0 49.03
11,137 0 0 0 49.03
11,137 242,63
9 -
51,433
Unlisted
SOG 2010.
04
Establishment of overseas foothold
0 0 100 0 0 0 0 100 0 0 0
Unlisted
SDIB 1996.
09
Participation in
management, etc.
3,110 586 0.08
0 0 0 586 0.08
0 45,310 144
Page 39
Unlisted
Semiconductor Portal
2002.12
Participation in
management, etc.
38 0 1.21
10 0 0 0 1.21
10 1,906 1,984
Unlisted
FTS 2008.
12
Participation in
management, etc.
1,952 116 41.5
563 0 0 116 41.5
563 3,276 -23
Unlisted
Maltani Lighting
2012.04
Participation in
management, etc.
16,544 9 15 16225 0 0 9 15 16,225 72,053 2,932
Unlisted
Panteck 2013.
06 Business purpose
53,000 0 0 0 53000 53,000 5300010.03
53,000 1,455,7
34
-188,16
7
Acquisition
Unlisted
Nanosys,Inc 2010.
08
Participation in
management, etc.
4,774 1,747 1.67
2,387 0 0 1,747 1.67
2,387 20,934-
10,694
Unlisted
ONE BLUE LLC
2011.07
Participation in
management, etc.
1,766 0 16.67
1,766 0 0 0 16.67
1,766 21,981 885
Listed
Rambus 2010.
01
Participation in
management, etc.
1,854 4,788 4.34
24,976 0 22,311 4,788 4.34
47,287 629,60
5
-143,88
7
Evaluation
Listed
SEAGATE 2011.
12
Participation in
management, etc.
788,454
45,23910.64
1,474,032
0 857,65
9 45,239
12.6
2,331,691
10,824,537
3,065,488
Evaluation
Total 18,390,
807 43,086,572 1,994,8
89 45,081,461
※ The cost for acquisition (or disposal) includes increases or decreases in the cost that do not
accompany money transactions such as fair value measurement and impairment measurement.
Page 40
IV. Management and Employees □ Employees (As of June 30, 2013)
(Person, year, million won)
Business division
No. of employees Average length of service
Total wage
Average wage per
capita /gender Regular Contract-
based Others Total
CE 14,332 519 - 14,851
9.2 3,692,819 39.7
IM 26,775 362 - 27,137
DS 39,503 256 - 39,759
Others 10,912 663 - 11,575
Total 91,522 1,800 - 93,322
Male 67,020 1,286 - 68,306 9.9 3,000,893 44.2
Female 24,502 514 - 25,016 7.2 691,927 27.6
※ The number of employees on a parent-company basis. Four executive directors excluded.
※ Total wage before income tax deduction is based on the earned income payment record submitted
to the competent district tax office in accordance with Article 20 of the Income Tax Law
※ Average wage per capita was calculated based on total average employee figure of 93,016
(male: 67,967 / female: 25,049)
□ Remuneration for the Management < Remuneration approved at shareholders’ meeting >
(100 million won)
No. of persons
Amount approved at shareholders’ meeting
Note
Executive directors
4
380
Independent directors
5 Audit Committee member included