19
| Date post: | 11-Dec-2015 |
| Category: |
Documents |
| Upload: | alec-dunman |
| View: | 219 times |
| Download: | 2 times |

2
BEC World Plc.BEC World Plc.
2006 Results Briefing
SET - Opportunity Day
March 08, 2007
Industry Overview
Financial Highlights
2007 Update
3
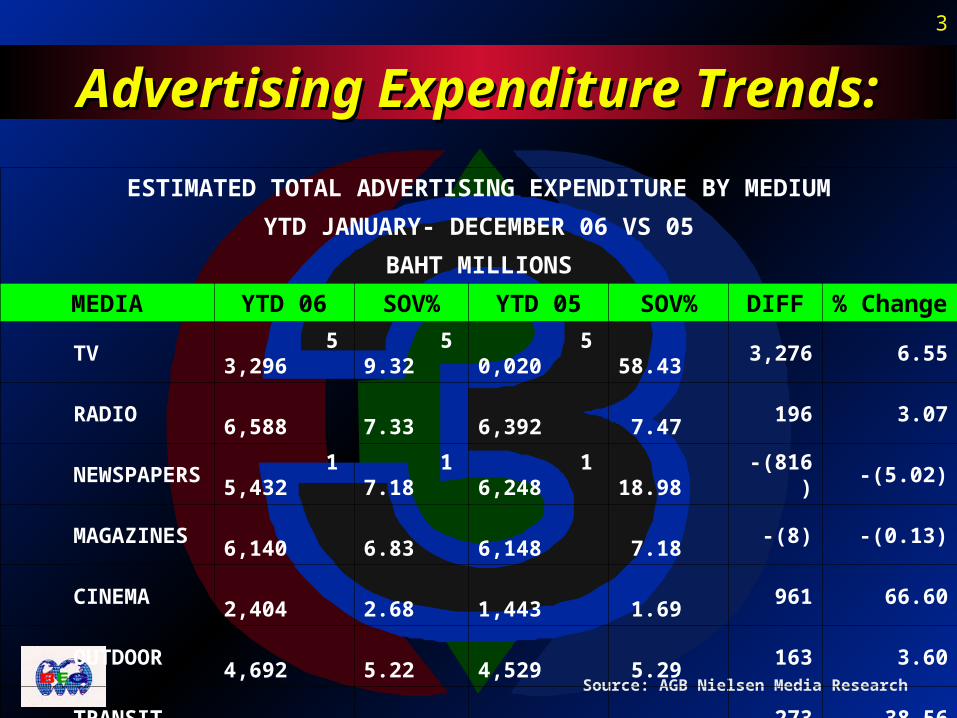
Advertising Expenditure Trends:Advertising Expenditure Trends:
Source: AGB Nielsen Media Research
ESTIMATED TOTAL ADVERTISING EXPENDITURE BY MEDIUM
YTD JANUARY- DECEMBER 06 VS 05
BAHT MILLIONS
MEDIA YTD 06 SOV% YTD 05 SOV% DIFF % Change
TV 53,296 59.32 50,020 58.43 3,276 6.55
RADIO 6,588 7.33 6,392 7.47 196 3.07
NEWSPAPERS 15,432 17.18 16,248 18.98 -(816) -(5.02)
MAGAZINES 6,140 6.83 6,148 7.18 -(8) -(0.13)
CINEMA 2,404 2.68 1,443 1.69 961 66.60
OUTDOOR 4,692 5.22 4,529 5.29 163 3.60
TRANSIT 981 1.09 708 0.83 273 38.56
IN STORE 307 0.34 114 0.13 193 169.30
TOTAL 89,839 100.00 85,602 100.0 4,237 4.95
4
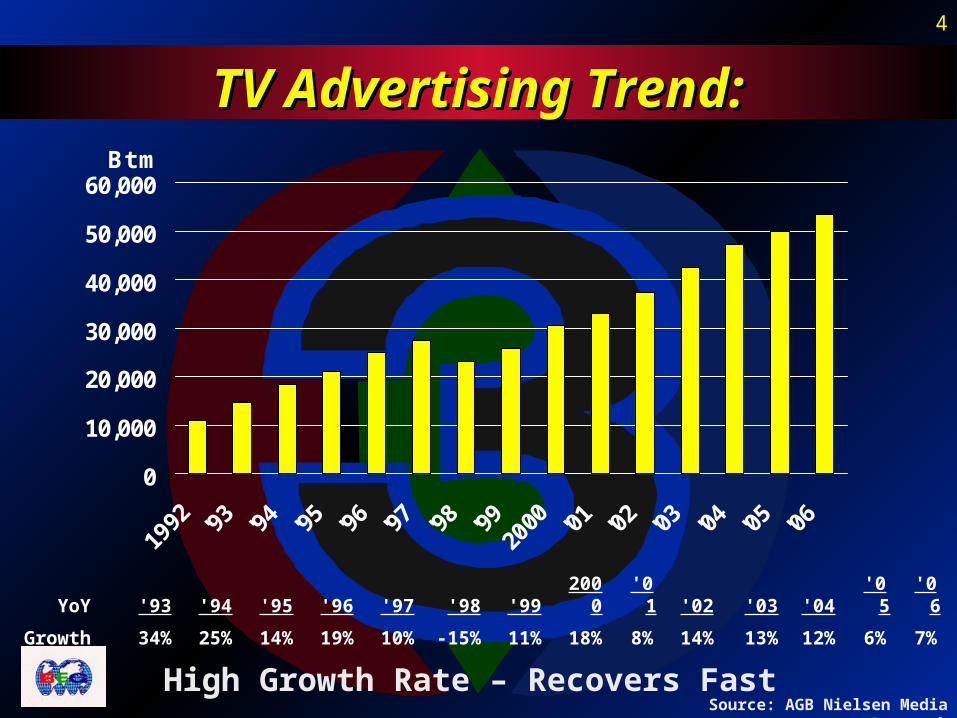
TV Advertising Trend:TV Advertising Trend:
0
10,000
20,000
30,000
40,000
50,000
60,000Bt m
High Growth Rate – Recovers FastSource: AGB Nielsen Media Research
YoY '93 '94 '95 '96 '97 '98 '99 2000 '01 '02 '03 '04 '05 '06
Growth 34% 25% 14% 19% 10% -15% 11% 18% 8% 14% 13% 12% 6% 7%
5
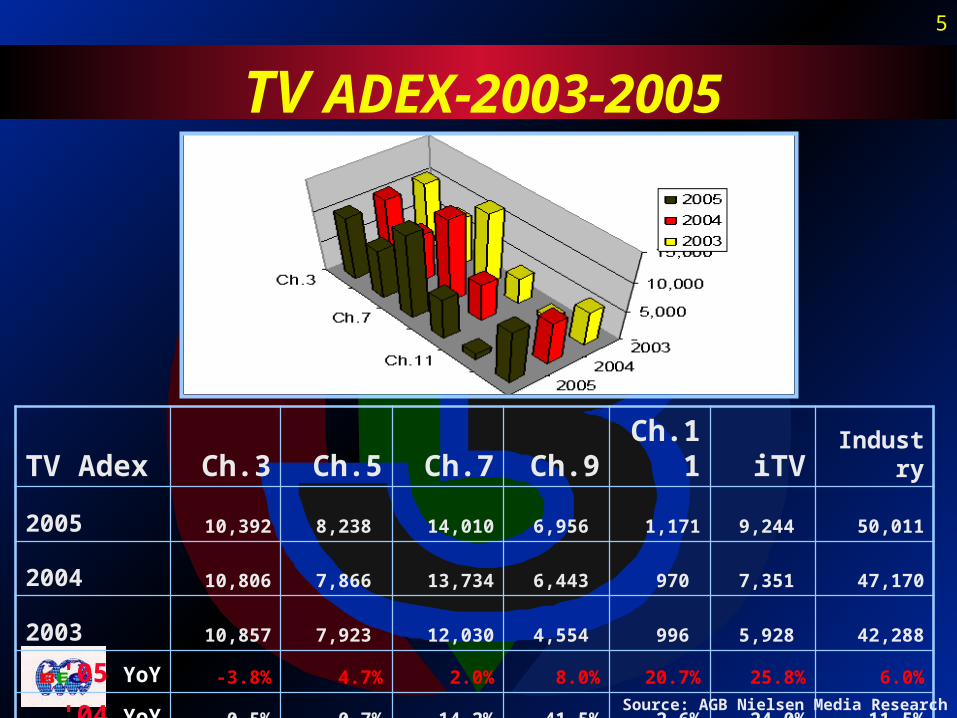
TV ADEX-2003-2005
TV Adex Ch.3 Ch.5 Ch.7 Ch.9 Ch.11 iTV Industry
2005 10,392 8,238 14,010 6,956 1,171 9,244 50,011
2004 10,806 7,866 13,734 6,443 970 7,351 47,170
2003 10,857 7,923 12,030 4,554 996 5,928 42,288
'05 YoY -3.8% 4.7% 2.0% 8.0% 20.7% 25.8% 6.0%
'04 YoY -0.5% -0.7% 14.2% 41.5% -2.6% 24.0% 11.5%
Source: AGB Nielsen Media Research
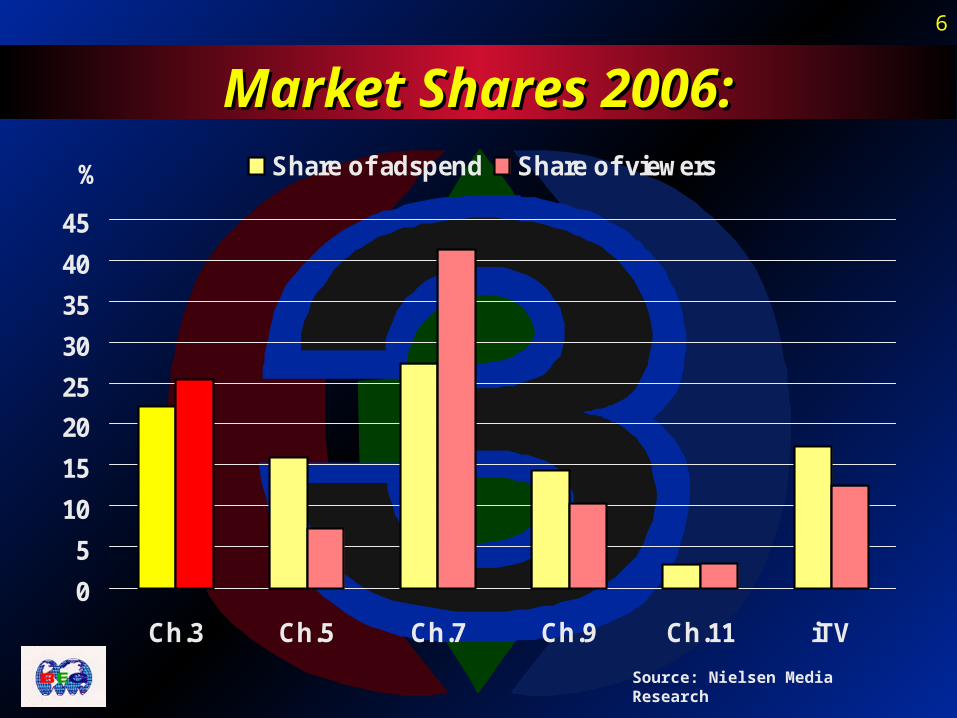
6
Market Shares 2006:Market Shares 2006:
0
5
10
15
20
25
30
35
40
45
Ch.3 Ch.5 Ch.7 Ch.9 Ch.11 iTV
% Share of adspend Share of viewers
Source: Nielsen Media Research
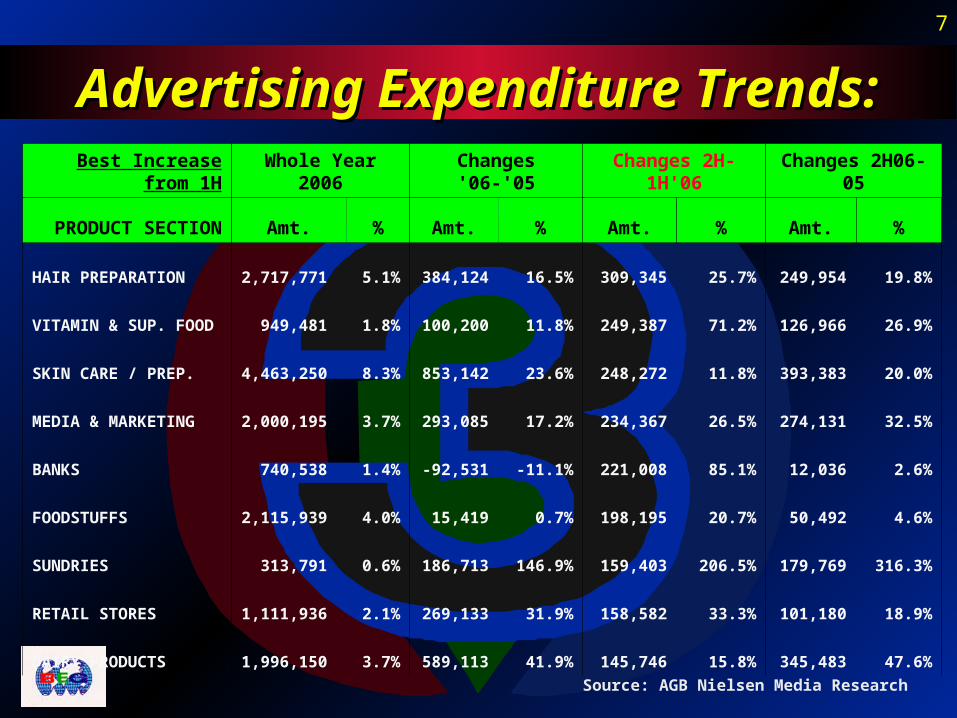
7
Advertising Expenditure Trends:Advertising Expenditure Trends:
Source: AGB Nielsen Media Research
Best Increase from 1H Whole Year 2006 Changes '06-'05 Changes 2H-1H'06 Changes 2H06-05
PRODUCT SECTION Amt. % Amt. % Amt. % Amt. %
HAIR PREPARATION 2,717,771 5.1% 384,124 16.5% 309,345 25.7% 249,954 19.8%
VITAMIN & SUP. FOOD 949,481 1.8% 100,200 11.8% 249,387 71.2% 126,966 26.9%
SKIN CARE / PREP. 4,463,250 8.3% 853,142 23.6% 248,272 11.8% 393,383 20.0%
MEDIA & MARKETING 2,000,195 3.7% 293,085 17.2% 234,367 26.5% 274,131 32.5%
BANKS 740,538 1.4% -92,531 -11.1% 221,008 85.1% 12,036 2.6%
FOODSTUFFS 2,115,939 4.0% 15,419 0.7% 198,195 20.7% 50,492 4.6%
SUNDRIES 313,791 0.6% 186,713 146.9% 159,403 206.5% 179,769 316.3%
RETAIL STORES 1,111,936 2.1% 269,133 31.9% 158,582 33.3% 101,180 18.9%
DAIRY PRODUCTS 1,996,150 3.7% 589,113 41.9% 145,746 15.8% 345,483 47.6%
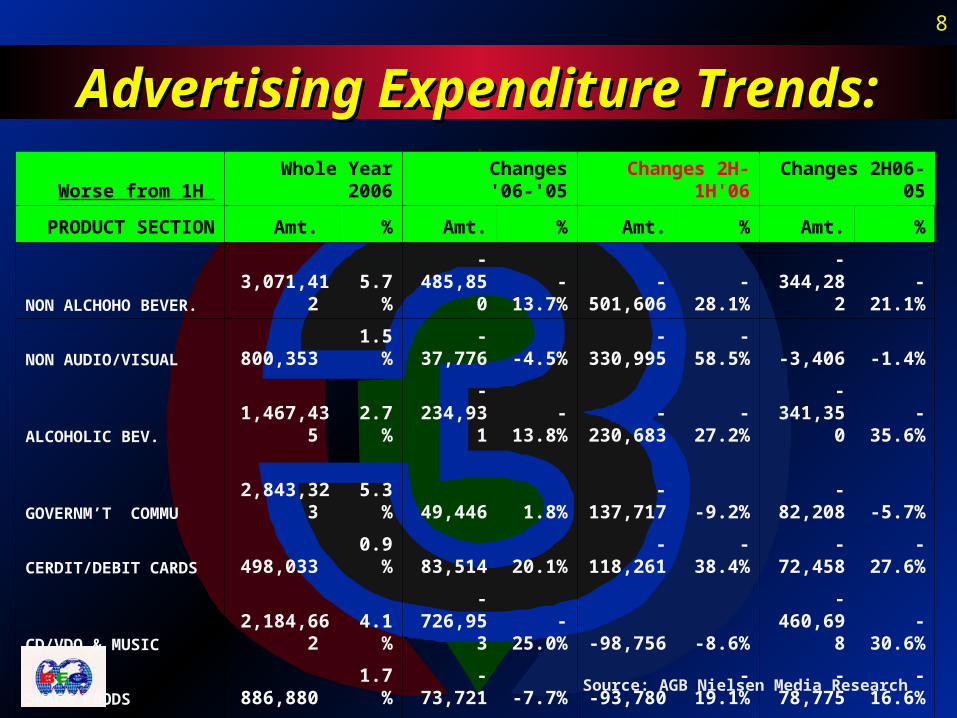
8
Advertising Expenditure Trends:Advertising Expenditure Trends:
Source: AGB Nielsen Media Research
Worse from 1H Whole Year 2006 Changes '06-'05 Changes 2H-1H'06 Changes 2H06-05
PRODUCT SECTION Amt. % Amt. % Amt. % Amt. %
NON ALCHOHO BEVER. 3,071,412 5.7% -485,850 -13.7% -501,606 -28.1% -344,282 -21.1%
NON AUDIO/VISUAL 800,353 1.5% -37,776 -4.5% -330,995 -58.5% -3,406 -1.4%
ALCOHOLIC BEV. 1,467,435 2.7% -234,931 -13.8% -230,683 -27.2% -341,350 -35.6%
GOVERNM’T COMMU 2,843,323 5.3% 49,446 1.8% -137,717 -9.2% -82,208 -5.7%
CERDIT/DEBIT CARDS 498,033 0.9% 83,514 20.1% -118,261 -38.4% -72,458 -27.6%
CD/VDO & MUSIC 2,184,662 4.1% -726,953 -25.0% -98,756 -8.6% -460,698 -30.6%
SNACK FOODS 886,880 1.7% -73,721 -7.7% -93,780 -19.1% -78,775 -16.6%
MOTOR VEHICLES 2,025,431 3.8% 388,890 23.8% -86,797 -8.2% 92,908 10.6%
TOILETRIES 2,473,670 4.6% 36,143 1.5% -85,796 -6.7% 147,576 14.1%
EDUCATION INSTITU… 190,268 0.4% 23,649 14.2% -68,138 -52.7% 304 0.5%
M.CYCLE & BICYCLE 759,759 1.4% 118,328 18.4% -64,217 -15.6% -14,673 -4.0%
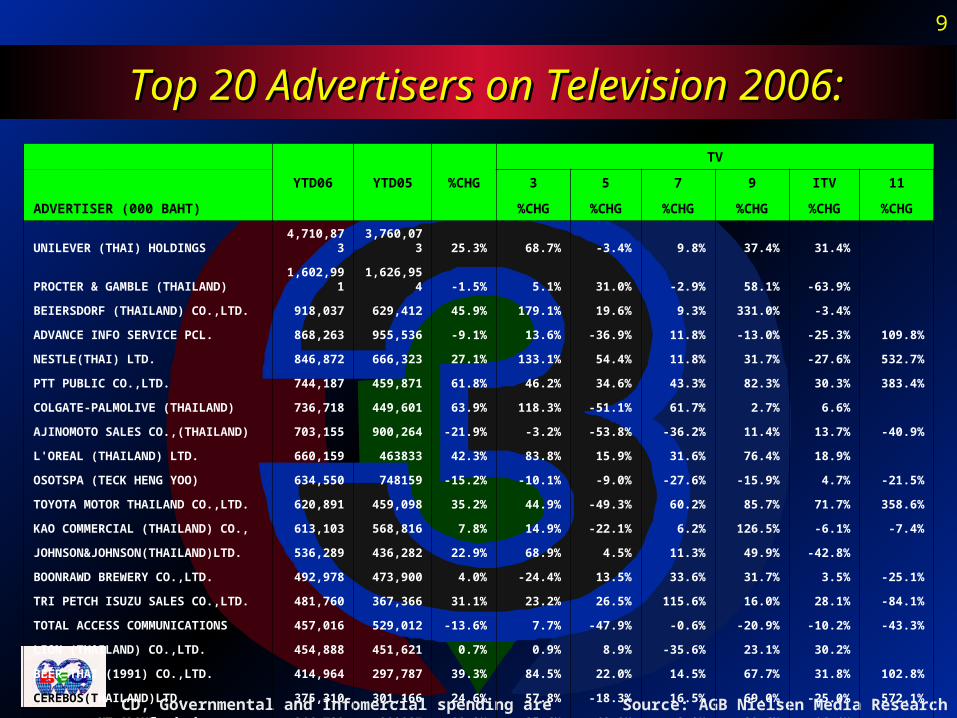
9
Top 20 Advertisers on Television 2006:Top 20 Advertisers on Television 2006:
Source: AGB Nielsen Media ResearchCD, Governmental and Infomercial spending are excluded.
YTD06 YTD05 %CHG
TV
3 5 7 9 ITV 11
ADVERTISER (000 BAHT) %CHG %CHG %CHG %CHG %CHG %CHG
UNILEVER (THAI) HOLDINGS 4,710,873 3,760,073 25.3% 68.7% -3.4% 9.8% 37.4% 31.4%
PROCTER & GAMBLE (THAILAND) 1,602,991 1,626,954 -1.5% 5.1% 31.0% -2.9% 58.1% -63.9%
BEIERSDORF (THAILAND) CO.,LTD. 918,037 629,412 45.9% 179.1% 19.6% 9.3% 331.0% -3.4%
ADVANCE INFO SERVICE PCL. 868,263 955,536 -9.1% 13.6% -36.9% 11.8% -13.0% -25.3% 109.8%
NESTLE(THAI) LTD. 846,872 666,323 27.1% 133.1% 54.4% 11.8% 31.7% -27.6% 532.7%
PTT PUBLIC CO.,LTD. 744,187 459,871 61.8% 46.2% 34.6% 43.3% 82.3% 30.3% 383.4%
COLGATE-PALMOLIVE (THAILAND) 736,718 449,601 63.9% 118.3% -51.1% 61.7% 2.7% 6.6%
AJINOMOTO SALES CO.,(THAILAND) 703,155 900,264 -21.9% -3.2% -53.8% -36.2% 11.4% 13.7% -40.9%
L'OREAL (THAILAND) LTD. 660,159 463833 42.3% 83.8% 15.9% 31.6% 76.4% 18.9%
OSOTSPA (TECK HENG YOO) 634,550 748159 -15.2% -10.1% -9.0% -27.6% -15.9% 4.7% -21.5%
TOYOTA MOTOR THAILAND CO.,LTD. 620,891 459,098 35.2% 44.9% -49.3% 60.2% 85.7% 71.7% 358.6%
KAO COMMERCIAL (THAILAND) CO., 613,103 568,816 7.8% 14.9% -22.1% 6.2% 126.5% -6.1% -7.4%
JOHNSON&JOHNSON(THAILAND)LTD. 536,289 436,282 22.9% 68.9% 4.5% 11.3% 49.9% -42.8%
BOONRAWD BREWERY CO.,LTD. 492,978 473,900 4.0% -24.4% 13.5% 33.6% 31.7% 3.5% -25.1%
TRI PETCH ISUZU SALES CO.,LTD. 481,760 367,366 31.1% 23.2% 26.5% 115.6% 16.0% 28.1% -84.1%
TOTAL ACCESS COMMUNICATIONS 457,016 529,012 -13.6% 7.7% -47.9% -0.6% -20.9% -10.2% -43.3%
LION (THAILAND) CO.,LTD. 454,888 451,621 0.7% 0.9% 8.9% -35.6% 23.1% 30.2%
BEER THAI (1991) CO.,LTD. 414,964 297,787 39.3% 84.5% 22.0% 14.5% 67.7% 31.8% 102.8%
CEREBOS(THAILAND)LTD. 375,310 301,166 24.6% 57.8% -18.3% 16.5% 69.0% -25.0% 572.1%
SIAM CEMENT GROUP 346,739 389087 -10.9% -25.6% 48.8% 3.9% -30.6% -16.4%
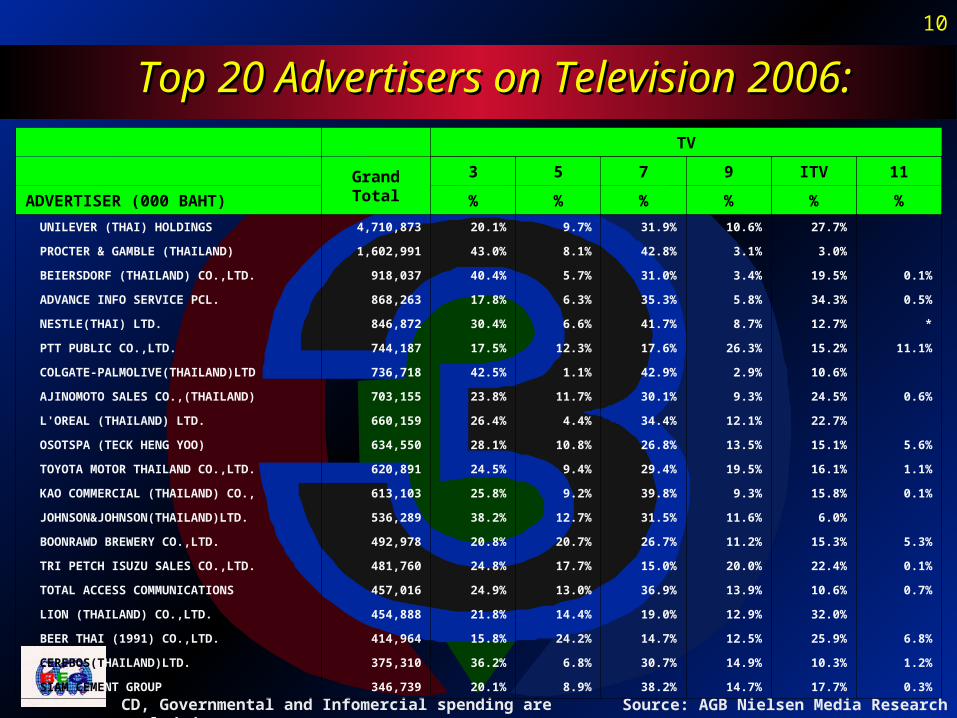
10
Top 20 Advertisers on Television 2006:Top 20 Advertisers on Television 2006:
Source: AGB Nielsen Media ResearchCD, Governmental and Infomercial spending are excluded.
TV
Grand Total
3 5 7 9 ITV 11
ADVERTISER (000 BAHT) % % % % % %
UNILEVER (THAI) HOLDINGS 4,710,873 20.1% 9.7% 31.9% 10.6% 27.7%
PROCTER & GAMBLE (THAILAND) 1,602,991 43.0% 8.1% 42.8% 3.1% 3.0%
BEIERSDORF (THAILAND) CO.,LTD. 918,037 40.4% 5.7% 31.0% 3.4% 19.5% 0.1%
ADVANCE INFO SERVICE PCL. 868,263 17.8% 6.3% 35.3% 5.8% 34.3% 0.5%
NESTLE(THAI) LTD. 846,872 30.4% 6.6% 41.7% 8.7% 12.7% *
PTT PUBLIC CO.,LTD. 744,187 17.5% 12.3% 17.6% 26.3% 15.2% 11.1%
COLGATE-PALMOLIVE(THAILAND)LTD 736,718 42.5% 1.1% 42.9% 2.9% 10.6%
AJINOMOTO SALES CO.,(THAILAND) 703,155 23.8% 11.7% 30.1% 9.3% 24.5% 0.6%
L'OREAL (THAILAND) LTD. 660,159 26.4% 4.4% 34.4% 12.1% 22.7%
OSOTSPA (TECK HENG YOO) 634,550 28.1% 10.8% 26.8% 13.5% 15.1% 5.6%
TOYOTA MOTOR THAILAND CO.,LTD. 620,891 24.5% 9.4% 29.4% 19.5% 16.1% 1.1%
KAO COMMERCIAL (THAILAND) CO., 613,103 25.8% 9.2% 39.8% 9.3% 15.8% 0.1%
JOHNSON&JOHNSON(THAILAND)LTD. 536,289 38.2% 12.7% 31.5% 11.6% 6.0%
BOONRAWD BREWERY CO.,LTD. 492,978 20.8% 20.7% 26.7% 11.2% 15.3% 5.3%
TRI PETCH ISUZU SALES CO.,LTD. 481,760 24.8% 17.7% 15.0% 20.0% 22.4% 0.1%
TOTAL ACCESS COMMUNICATIONS 457,016 24.9% 13.0% 36.9% 13.9% 10.6% 0.7%
LION (THAILAND) CO.,LTD. 454,888 21.8% 14.4% 19.0% 12.9% 32.0%
BEER THAI (1991) CO.,LTD. 414,964 15.8% 24.2% 14.7% 12.5% 25.9% 6.8%
CEREBOS(THAILAND)LTD. 375,310 36.2% 6.8% 30.7% 14.9% 10.3% 1.2%
SIAM CEMENT GROUP 346,739 20.1% 8.9% 38.2% 14.7% 17.7% 0.3%
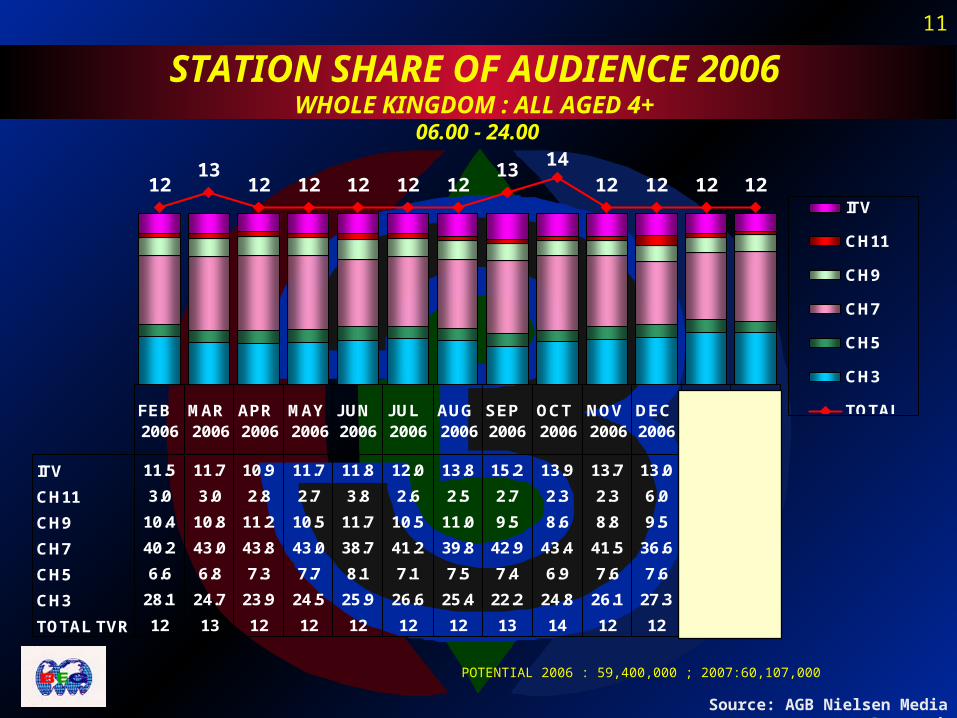
11
STATION SHARE OF AUDIENCE 2006WHOLE KINGDOM : ALL AGED 4+
06.00 - 24.00
POTENTIAL 2006 : 59,400,000 ; 2007:60,107,000
Source: AGB Nielsen Media Research
1213
12 12 12 12 1213
1412 12 12 12
ITV
CH11
CH9
CH7
CH5
CH3
TOTALTVR
ITV 11.5 11.7 10.9 11.7 11.8 12.0 13.8 15.2 13.9 13.7 13.0 11.9 10.5
CH11 3.0 3.0 2.8 2.7 3.8 2.6 2.5 2.7 2.3 2.3 6.0 2.3 2.3
CH9 10.4 10.8 11.2 10.5 11.7 10.5 11.0 9.5 8.6 8.8 9.5 9.1 9.4
CH7 40.2 43.0 43.8 43.0 38.7 41.2 39.8 42.9 43.4 41.5 36.6 38.7 40.8
CH5 6.6 6.8 7.3 7.7 8.1 7.1 7.5 7.4 6.9 7.6 7.6 7.7 6.6
CH3 28.1 24.7 23.9 24.5 25.9 26.6 25.4 22.2 24.8 26.1 27.3 30.4 30.3
TOTAL TVR 12 13 12 12 12 12 12 13 14 12 12 12 12
FEB 2006
MAR 2006
APR 2006
MAY 2006
JUN 2006
JUL 2006
AUG 2006
SEP 2006
OCT 2006
NOV 2006
DEC 2006
JAN 2007
FEB 2007
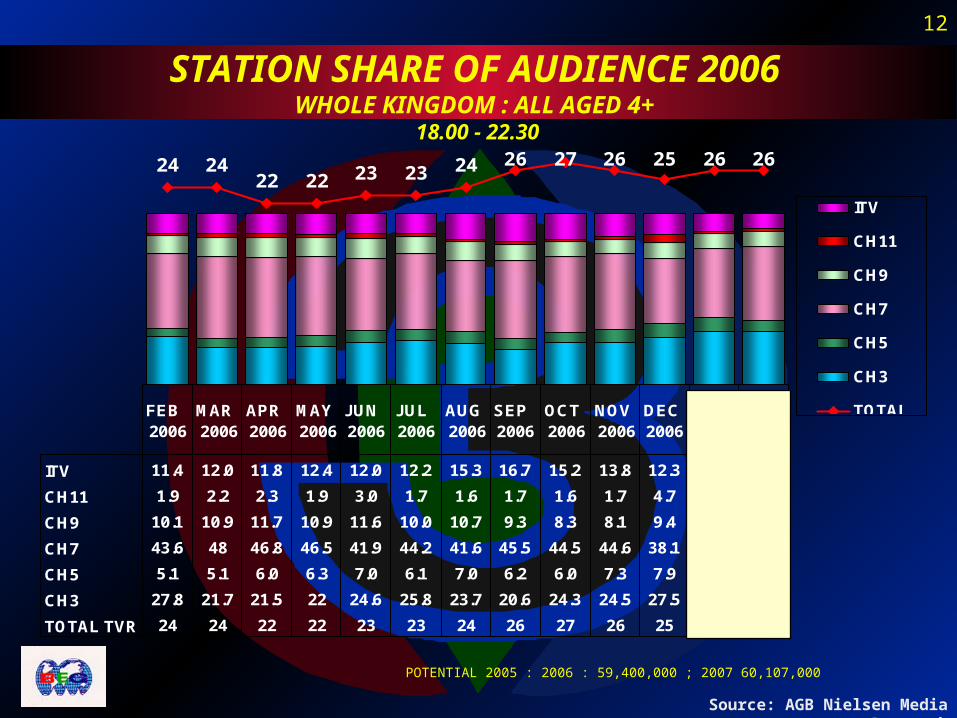
12
STATION SHARE OF AUDIENCE 2006WHOLE KINGDOM : ALL AGED 4+
18.00 - 22.30
POTENTIAL 2005 : 2006 : 59,400,000 ; 2007 60,107,000
Source: AGB Nielsen Media Research
24 2422 22 23 23 24 26 27 26 25 26 26
ITV
CH11
CH9
CH7
CH5
CH3
TOTALTVR
ITV 11.4 12.0 11.8 12.4 12.0 12.2 15.3 16.7 15.2 13.8 12.3 10.2 8.3
CH11 1.9 2.2 2.3 1.9 3.0 1.7 1.6 1.7 1.6 1.7 4.7 1.7 2.1
CH9 10.1 10.9 11.7 10.9 11.6 10.0 10.7 9.3 8.3 8.1 9.4 8.7 9.2
CH7 43.6 48 46.8 46.5 41.9 44.2 41.6 45.5 44.5 44.6 38.1 40.3 43.1
CH5 5.1 5.1 6.0 6.3 7.0 6.1 7.0 6.2 6.0 7.3 7.9 8.2 6.2
CH3 27.8 21.7 21.5 22 24.6 25.8 23.7 20.6 24.3 24.5 27.5 30.9 31.2
TOTAL TVR 24 24 22 22 23 23 24 26 27 26 25 26 26
FEB 2006
MAR 2006
APR 2006
MAY 2006
JUN 2006
JUL 2006
AUG 2006
SEP 2006
OCT 2006
NOV 2006
DEC 2006
JAN 2007
FEB 2007
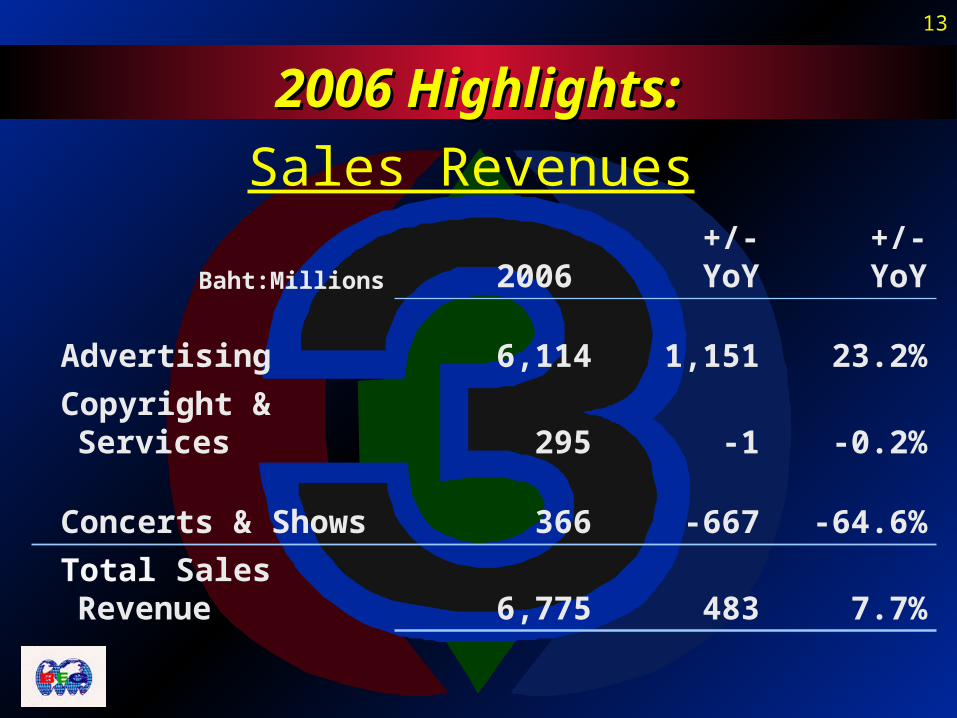
13
Baht:Millions 2006 +/- YoY +/- YoY
Advertising 6,114 1,151 23.2%
Copyright & Services 295 -1 -0.2%
Concerts & Shows 366 -667 -64.6%
Total Sales Revenue 6,775 483 7.7%
2006 Highlights:2006 Highlights:
Sales Revenues

14
Baht:Millions 2006 +/- YoY +/- YoY
Costs of Sales & Services 2,911 -14 -0.5%
Cost of Concerts & Shows 374 -605 -61.8%
Selling & Admin. Expenses 1,332 +170 +14.7%
Total Operating Costs 4,617 -449 -8.9%
2006 Highlights:2006 Highlights:
Operating Costs
15
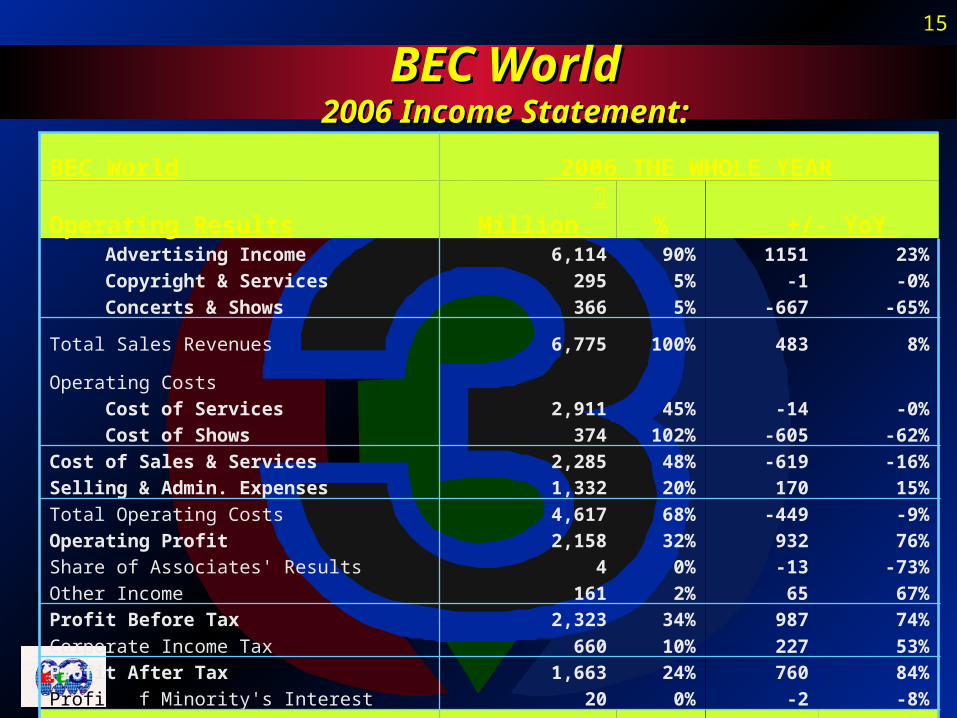
BEC World 2006 THE WHOLE YEAROperating Results ฿ Million % +/- YoY Advertising Income 6,114 90% 1151 23% Copyright & Services 295 5% -1 -0% Concerts & Shows 366 5% -667 -65%
Total Sales Revenues 6,775 100% 483 8%
Operating Costs Cost of Services 2,911 45% -14 -0% Cost of Shows 374 102% -605 -62%Cost of Sales & Services 2,285 48% -619 -16%Selling & Admin. Expenses 1,332 20% 170 15%Total Operating Costs 4,617 68% -449 -9%Operating Profit 2,158 32% 932 76%Share of Associates' Results 4 0% -13 -73%Other Income 161 2% 65 67%Profit Before Tax 2,323 34% 987 74%Corporate Income Tax 660 10% 227 53%Profit After Tax 1,663 24% 760 84%Profit of Minority's Interest 20 0% -2 -8%NET PROFIT 1,643 24% 762 86%
BEC WorldBEC World2006 Income Statement:2006 Income Statement:
16
BEC World Plc.BEC World Plc.
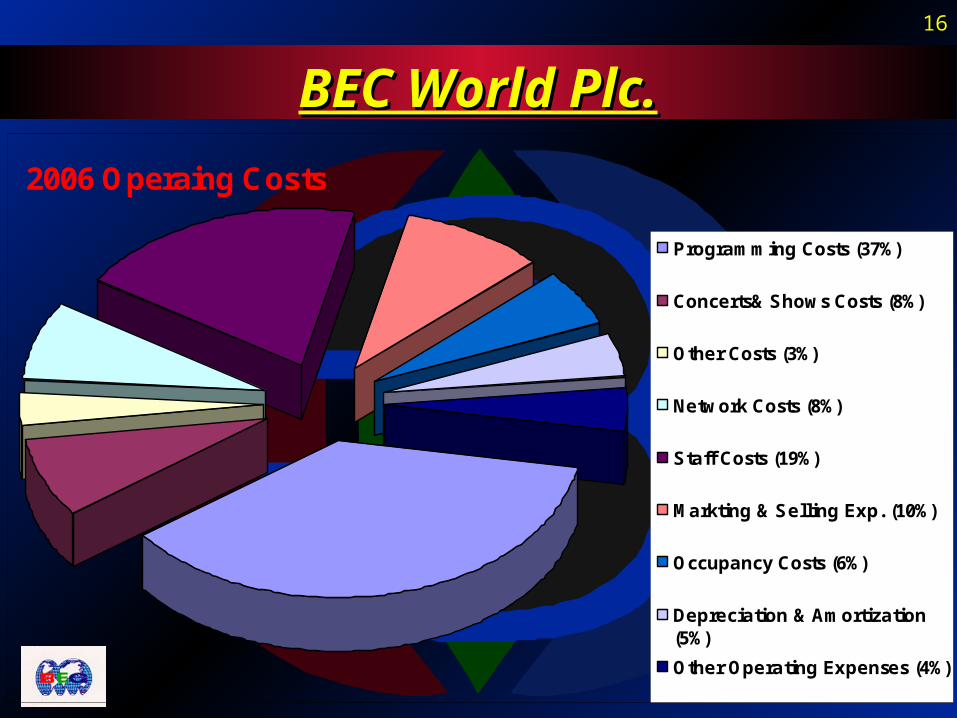
2006 Operaing Costs
Programming Costs (37%)
Concerts& Shows Costs (8%)
Other Costs (3%)
Network Costs (8%)
Staff Costs (19%)
Markting & Selling Exp. (10%)
Occupancy Costs (6%)
Depreciation & Amortization(5%)
Other Operating Expenses (4%)
17
-100
100
300
500
700
900
1100
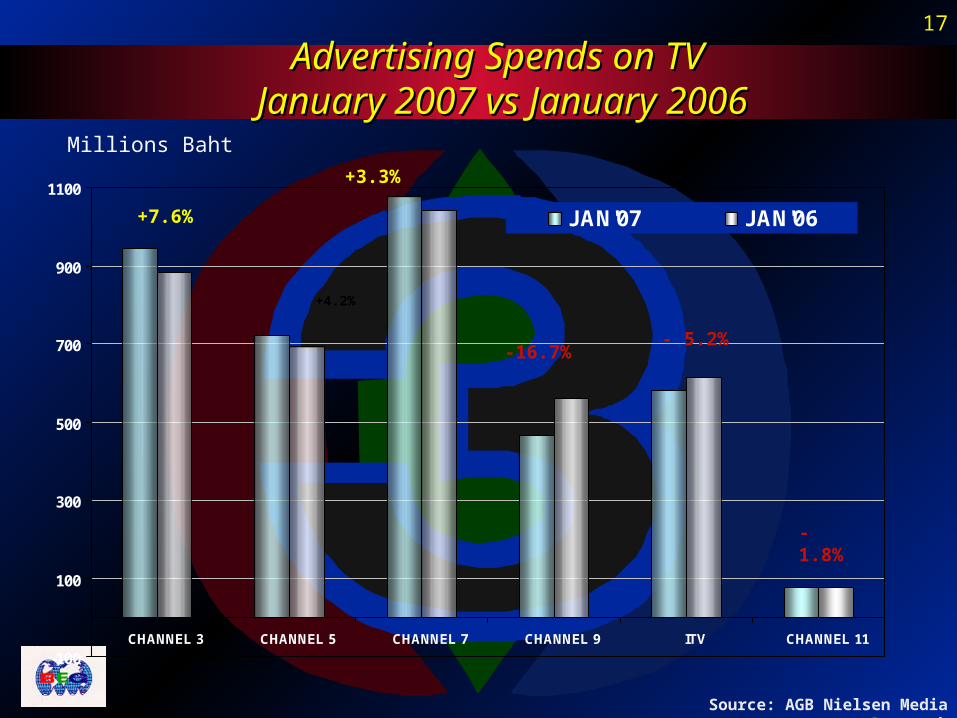
CHANNEL 3 CHANNEL 5 CHANNEL 7 CHANNEL 9 ITV CHANNEL 11
JAN'07 JAN'06
Advertising Spends on TV Advertising Spends on TV January 2007 vs January 2006January 2007 vs January 2006
Millions Baht
-1.8%
+7.6%
+4.2%
+3.3%
-16.7%- 5.2%
Source: AGB Nielsen Media Research
18
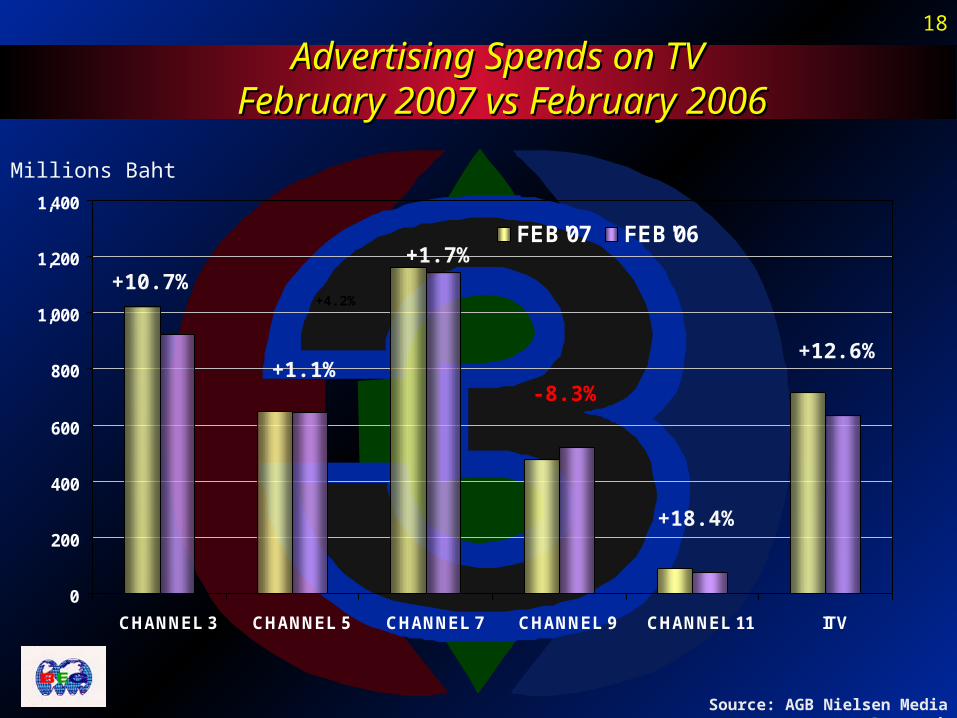
Advertising Spends on TV Advertising Spends on TV February 2007 vs February 2006February 2007 vs February 2006
Millions Baht
+4.2%
Source: AGB Nielsen Media Research
0
200
400
600
800
1,000
1,200
1,400
CHANNEL 3 CHANNEL 5 CHANNEL 7 CHANNEL 9 CHANNEL 11 ITV
FEB'07 FEB'06
+10.7%
+1.1%
+1.7%
-8.3%
+18.4%
+12.6%