THE EFFECT OF BUILDING PLANNING ASPECTS ON INDOOR AIR QUALITY
JAYASINGHE C1 & BATAGODA J
2
1Professor, Department of Civil Engineering, University of Moratuwa, Sri Lanka
2Post Graduate Researcher, Department of Civil Engineering, University of Moratuwa, Sri Lanka
ABSTRACT
It has become common knowledge that health hazards are developing due to various outdoor pollutant sources.
However, most of the people spend about 80 -90 % of their time indoors. There are a number of hazardous air pollutants
such as CO, SO2, NO2, PM10, PM2.5 (particulate matter), VOC (Volatile Organic Compounds) which could make an impact
on human health based on different concentrations present inside buildings.
CO2 concentration, although it is non toxic, can be a direct indication of the ventilation system of the building.
Longer exposure for higher CO2 concentration also can cause discomfort for the occupants. This paper presents a detail
study on how building planning aspects can affect the indoor environment of a building. The main factors considered were
the CO 2 concentration and the ventilation design of the building. Under this, area of openings (void area) of the building
was considered as a measure of ventilation. Measurements were taken in residential buildings with varying openings
(void) to wall ratios and openings (void) to floor area ratio of selected activity spaces. CO2 concentration was measured
and related with the ventilation design of the space in both free running and air conditioned buildings.
The other parameters considered in the study are the indoor SO 2 concentration, NO2 concentration, temperature
and relative humidity varying with relevant factors. The factors considered are the type of cooking fuel, vehicle emissions
coming from the nearby roads, wind speed and dilution effects of pollutants and also the effect of micro climate on indoor
thermal comfort. As the main findings the building planning aspects were found to be very important in minimizing the
bad effects of pollutants, by diluting the higher pollutant concentrations by providing openings considering wind direction
and orientation of the building. Area of openings in excess of what is provided in the building regulations can improve the
ventilation system in a free running building. The operating practices of ventilation system have to be given equal
importance as the ventilation design.
Considering cooking fuel, out of the varieties used in Sri Lanka, fire wood can produce higher SO2, NO2, and
even higher CO2 concentration at the start of the fire. If ventilation system of the kitchen is not operated properly, the
situation can become worse with higher pollutant levels persisting for a longer duration. When the coconut husk, leaves
and other plant matter is used in the cooking fire, very high SO2 and NO2 values were recorded. Therefore, it is proposed
to avoid such material used in the fire.
Although slightly high SO2 values were observed close to the roads, the dispersion rates are high so that indoor
environments are not much affected yet. However, precautions should be taken to introduce cleaner vehicle fuel since a
good outdoor air quality is essential for acceptable indoor air quality in free running buildings. It is also important to
create better micro climates around the houses not only to act as a barrier to the emissions from vehicle fuel, also it helps to
cool down the indoor environment by lowering the temperature by 1 to 2 0 C.
KEYWORDS: Indoor Air, Ventilation, Pollutant Levels
International Journal of Civil
Engineering (IJCE)
ISSN 2278-9987
Vol. 2, Issue 2, May 2013, 9-28
© IASET
10 Jayasinghe C & Batagoda J
INTRODUCTION
Planning healthy indoor environments is a main component of sustainable design. Indoor air quality and thermal
comfort are considered as major factors of indoor environment. With more and more compact house designs introduced to
the countries with tropical climatic conditions, health problems related to poor indoor environments are getting aggravated.
Therefore, in order to provide better indoor comfort for the occupants, modern building planning and operational practices
should be either modified or improved. This study was aimed at the effect of building planning aspects and ventilation
rates, on indoor environment.
There are several indoor air pollutants such as CO, CO2, NO2, SO2, PM10, PM2.5 (particulate matter) and VOCs
(volatile organic compounds). Each type of pollutant can cause different levels of health hazards for the occupants. The
acceptable concentrations of each of the indoor pollutant have been specified in USEPA (US Environmental Protection
Agency) and WHO (World Health Organization) guidelines.
When residential buildings are constructed and used, various activities can contribute to lower the quality of
indoor air. Pollution can occur during construction and in the operating phase; building materials used, cooking, burning
garbage, vehicle emissions from nearby roads, chemicals used in maintaining the houses, etc. Building ventilation system
plays a very significant role in maintaining a good indoor environment with better air quality. CO2 concentrations, although
it is non toxic, can be a direct indication of the effectiveness of the ventilation system of the building. Higher
concentrations of CO2 also cause discomfort for the occupants, when exposed over a long period of time.
The research presented in this paper includes the effects of void/wall ratio, window operating schedule, wind
speed and microclimate on indoor CO2 levels in free running residential buildings. This paper also includes a case study
carried out in an air-conditioned environment on CO2 levels and indoor comfort levels. This further includes the pollutants
generated from various types of cooking fuel used in the Sri Lankan residential sector. Further, the way that the kitchen
ventilation system facilitated the dispersion of pollutants and operating of ventilation system, using closing and opening of
windows were studied. Measurements were taken in a selected sample of houses which uses different cooking fuel types.
The effects of micro climate on indoor environment were also investigated. The sample consisted of residential
buildings at various locations which covers all the parameters considered in the study. When selecting the houses for the
sample, the random sampling technique was used since there were practical considerations like access to the indoors and
willingness of occupants to participate in the questionnaire survey on indoor comfort levels.
DIFFERENT TYPES OF POLLUTANTS IN INDOOR ENVIRONMENTS
Various pollutant sources are available in built environments which can either generate short term or long term
exposure levels for the occupants. Use of air fresheners, pesticides and cleaning chemicals can create short term exposures
where as the pollutants generated from cooking fuel, smoking, chemicals used to clean furniture, carpets, etc., can create
long term exposure levels [1], [2]. In Sri Lanka, nearly 80% of the households still rely on biomass (firewood) for energy
needed for cooking purposes. Use of fire wood together with other crop residues such as coconut husk, coconut leaves,
etc., can generate various pollutants such as SO2, NO2 and CO with high concentrations of particulate matter [3].
CO2 Concentration and Indoor Environment
CO2 is a colour-less and odor-less gas. Despite the fact that it is non toxic, if CO2 concentration is too high, it can
be unpleasant and perhaps unhealthy for the building occupants. This can also be an indicator of the quality of ventilation
and indoor air quality [4].
The Effect of Building Planning Aspects on Indoor Air Quality 11
CO2 is not considered to be an air pollutant in the usual sense since it is a normal trace component of the
atmosphere. The atmospheric CO2 levels in the range of 350 ppm do not cause any adverse effects on human health.
However, due to various human activities, increased concentration of CO2 is emitted into the air from burning fossil fuel
for energy and other industrial activities. With high CO2 levels in outdoor air, indoor CO2 concentration can be much
worse if the ventilation design of the built environment is poor. Also CO2 emissions can be increased due to indoor
activities and the occupant density.
Indoor Carbon dioxide at levels that are unusually high may cause occupants to feel drowsy, get headaches, or
function at lower activity levels. Humans are the main indoor source of carbon dioxide. Indoor CO2 levels could be an
indicator of the adequacy of outdoor air ventilation relative to indoor occupant density and metabolic activity.
The outdoor acceptable levels of CO2 are ranging from 300ppm – 500ppm (ASHRAE Standards), values over that
range indicate that the outdoor air is containing combustion or other contaminant sources. An indoor CO2 concentration of
700ppm – 1000ppm (ASHRAE Standards) could be taken as acceptable levels but the occupants will experience the
stuffiness and also may sense odours.
Carbon Monoxide
CO is a colourless, odorless and tasteless gas. Carbon Monoxide is produced as a result of incomplete
combustion. Once released to the atmosphere it can last for at least few months and will eventually oxidize into CO2.
Carbon Monoxide directly interfere with the oxygen carrying red blood cells of the human body, significantly reducing the
supply of oxygen to the heart and other organs, by creating a permanent bond with red blood cells called
Carboxyhemoglobin. Exposure to CO may contribute to cardiovascular mortality and may also an early cause of heart
attacks. Patients with coronary artery disease are considered as most sensitive to CO exposure, with aggravation of angina
occurring in patients. Exposure to CO can develop a range of symptoms, such as headaches, weakness, dizziness, nausea,
disorientation, confusion and fatigue in healthy people [7], [8]. Almost 70% of CO emissions come from highway vehicles.
CO can also be generated from the sources of, gas, wood stoves, kerosene heaters and cigarettes. The maximum CO
concentration of 9 ppm is recommended by USEPA for 8 hour exposure levels.
Nitrogen Dioxide
Concentrated NO2 is a dark brown gas with a strong odor. NO2 is mainly formed by the combustion process at
high temperatures. The largest source is combustion of certain fossil fuels, such as coal and gasoline. Most emissions
initially form NO which is readily oxidized into NO2 which in the presence of sunlight can further react with hydrocarbons
to form smog. Smog is harmful and NO2 also reacts with hydroxyl to form nitric acid (HNO3) which contributes to the
problem of acid rain. Exposure into NO2 can cause respiratory problems of various magnitudes depending on the level of
exposure. Short term exposure can cause skin and eye irritation whereas long term exposure into NO2 can affect the lungs,
chest, burning sensation, etc. Frequent exposure into high concentrations could lead to increased incidents of acute
respiratory illnesses, where the children are the main victims [9].
Sulphar Dioxide
SO2 is an acidic gaseous pollutant which is a colourless gas with a suffocating odour. It is a primary pollutant
because it is emitted directly in the form of SO2. This is a dense gas and SO2 can react with oxygen and water vapour in the
presence of sunlight and form a mist of sulfuric acid which is a secondary pollutant and is a constituent of acid rain. Since
SO2 is soluble in water, once inhaled, SO2 is dissolved and forms sulfuric acid, sulfurous acid, and bisulfate ions [10].
12 Jayasinghe C & Batagoda J
This can cause respiratory problems such as bronco-constriction. The constriction will develop almost
immediately upon exposure and it will subside when the exposure ends. However long term exposure can create major
problems. Mostly SO2 is discharged into the atmosphere by fossil fuel combustion, power plants and from vehicles. Other
sources of SO2 emissions are petroleum refining, making of cement, etc. Much lower concentrations can be expected from
burning firewood [11].
Particulate Matter
PM10 and PM2.5 particulate matter come from materials handling processes, combustion processes or gas
conversion reactions in the atmosphere. The particles with an aerodynamic diameter less than or equal to 10 micrometers is
defined as PM10 and that 2.5 micro meters is defined as PM2.5. Major sources include industrial processes, coal or oil
burning power plants and highway vehicles. Particulate matter resulting from combustion can affect the lungs directly.
Smaller particles can create more serious problems since they can penetrate deeper into the lungs. Air born
particulate matter is often generated in large quantities during construction. The outdoor air which enters the building can
also be a significant source of indoor airborne particulate matter [12], [8], [13].
Volatile Organic Compounds
Volatile Organic Compounds (VOC) are carbon containing compounds that could readily evaporate at room
temperature and are found in many house keeping products, maintenance products, and building products made with
organic chemicals.
In indoor environments, there can be many different VOC substances in varying concentrations. There are six
major classes of VOCs such as aldehides (formaldehyde), alcohols (ethanol, methanol), aliphatic hydrocarbons (propane,
butane, hexane), aromatic hydrocarbons (benzene, toluene, xylene), ketones (acetone) and halogenated hydrocarbons
(methyl chloroform, methylene chloride) [7]. Formaldehyde is highly reactive and can irritate body surfaces containing
moisture such as eyes and upper respiratory tract. Materials containing formaldehyde release formaldehyde gas into the air.
Short term effects include eye, nose, throat and skin irritation, headaches and allergic sensitization [14].
VOCs usually come from the building itself. In most instances, the VOC sources are building materials used in
the construction and decoration of the building which includes carpet, upholstery, adhesives, paint, and varnish. Other
commonly found sources are cleaning chemicals, disinfectants, and tobacco smoke etc. Many common emitters of indoor
VOC‟s are polymer materials used within buildings. For most polymer materials, the emission of VOC‟s begins at some
initial concentration that diminishes over time. Some polymer materials, like paints, initially emit VOC‟s at significantly
high rates; whereas others, such as varnishes and vinyl, have relatively low initial emission rates. The emission rates of
most volatile organic compounds have a direct relationship with changes in both relative humidity and temperature [15].
BUILDING PLANNING AND INDOOR ENVIRONMENT
Creating air tight buildings with more enclosed spaces in tropical climatic conditions is becoming common in
planning of residential buildings. Air tight buildings make heat to stay inside and poor ventilation creates problems with
thermal comfort and indoor air quality. In tropical climatic regions, the buildings with more enclosed spaces would need
active means of lighting and ventilation for thermal and visual comfort. However, active means such as air conditioning
would need significant amount of energy which would make the buildings unsustainable. Therefore, creating buildings as
free running, which rely on natural light and ventilation, would be more desirable for the tropical climates. Especially in a
developing country like Sri Lanka, free running buildings which are designed with passive features to maintain indoor
The Effect of Building Planning Aspects on Indoor Air Quality 13
thermal comfort are needed. However, with natural ventilation, providing better indoor air quality could be little
challenging since outdoor air quality also could have some influence.
When the built environment is designed as free running in tropical climates, the designers expect the external air
to penetrate indoors through the openings provided, creating natural ventilation. This needs maintaining proper wind
speeds in the indoors which enhances the comfort levels. The stagnant air collected over a period of time would create
more and more indoor pollutants and long term exposure would create health problems to the occupants [15]. When
designers create air tight buildings in tropical climates, the need for mechanical ventilation for the building is foreseeable,
where it increases the energy demand to function the building. The air tight buildings can also raise the indoor humidity,
where high humidity levels will lead to bacterial growth, building material decay and the occupants‟ discomfort. If these
microorganisms reproduce in buildings, they can adversely affect indoor air quality, create hazardous health conditions for
the occupants and contribute to the deterioration of building components.
A variety of methods have been adopted in evaluating indoor air quality and the ventilation in a building, and one
of the best techniques that is easy to analyze is the CO2 concentration in the building, but CO2 cannot be used as an
indicator of overall indoor air quality [16]. Indoor CO2 is sometimes referred to as an indicator of indoor air quality without
describing a specific association between CO2 and air quality, and number of relationships are available including the
health effect of elevated CO2 concentrations [17].
Pollutant source control is one of the strategies adopted in building design which includes careful selection of
materials based on chemical characteristics, exclusion or isolation of potential harmful pollutants generating activities and
proper design of ventilation system. Pollutant generating activities needed to be considered in the overall design of the
building including vehicle emissions from nearby roads, emissions from the cooking fuel, pollutants emitted from
equipment such as photocopiers, printers etc. The emission from such spaces should give minimum impact to the
occupants.
EXPERIMENTAL STUDY
Site Description
A random sample of residential buildings has been selected to asses the indoor environment, considering the main
parameters such as CO2, SO2, NO2, temperature, humidity and wind speed inside the activity spaces. Random sampling
method was selected due to various practical constraints such as taking measurements for a period of 3 hours with the
consent of the occupants, and to get them involved in the comfort surveys etc.
A cross section of houses (thirty for the CO 2 and ventilation and twenty three for the kitchen fuel and other
factors) was selected in urban and rural areas including the houses close to the busy highways, houses which use different
cooking fuel, houses with attached garages etc. This covered the main parameters considered in the study to a substantial
extent. In order to assess the effect of micro climate on indoor environment, houses with and without a good micro climate
have also been considered for measurements.
Measurements
The study covered in this report was mainly focused on indoor pollutants such as SO2, NO2 and CO2 levels, and
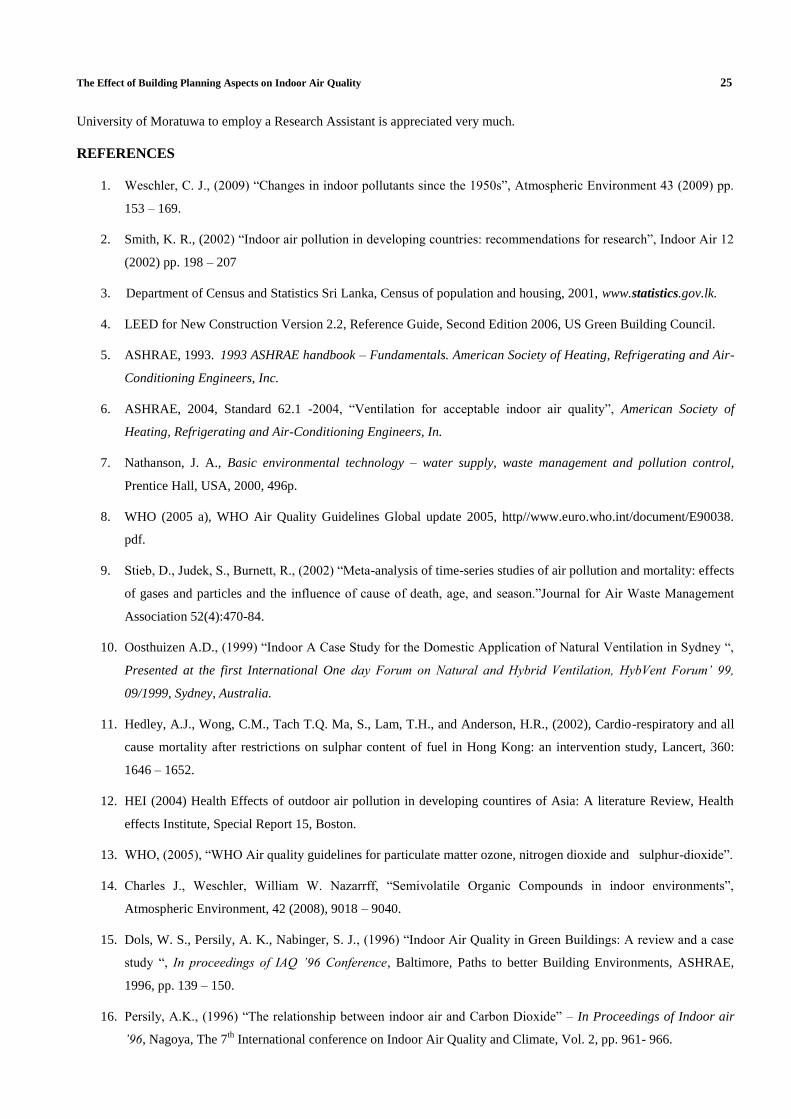
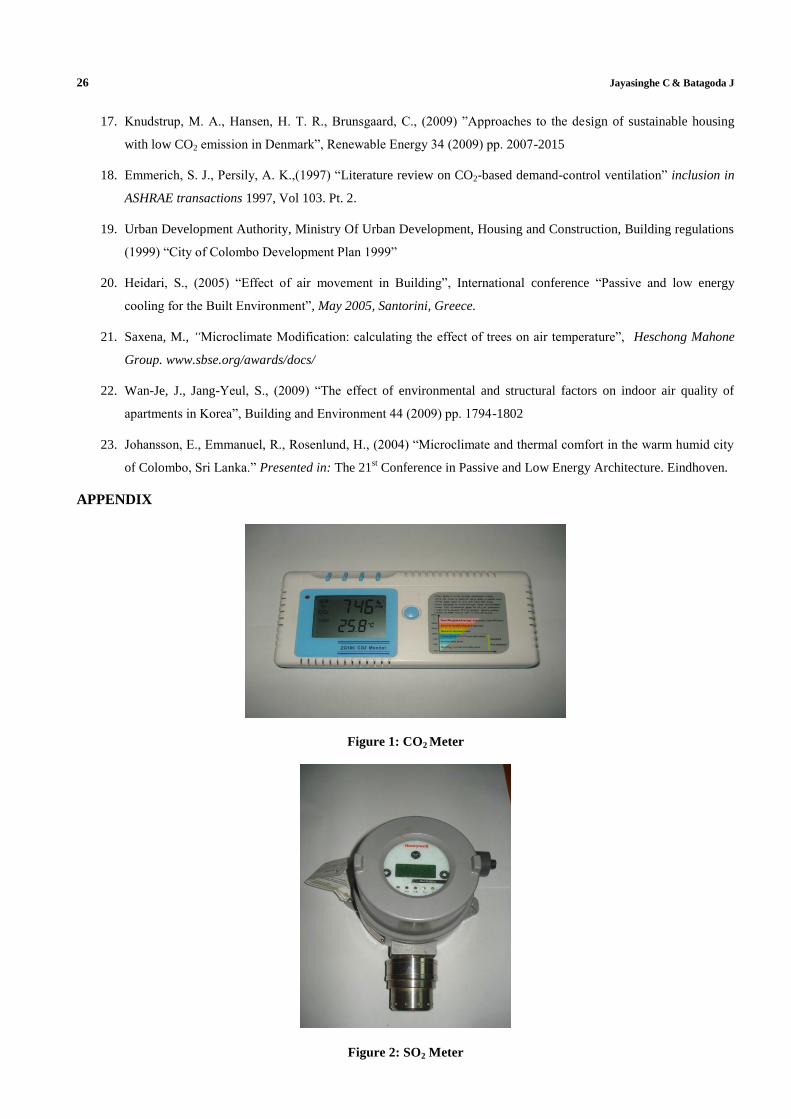
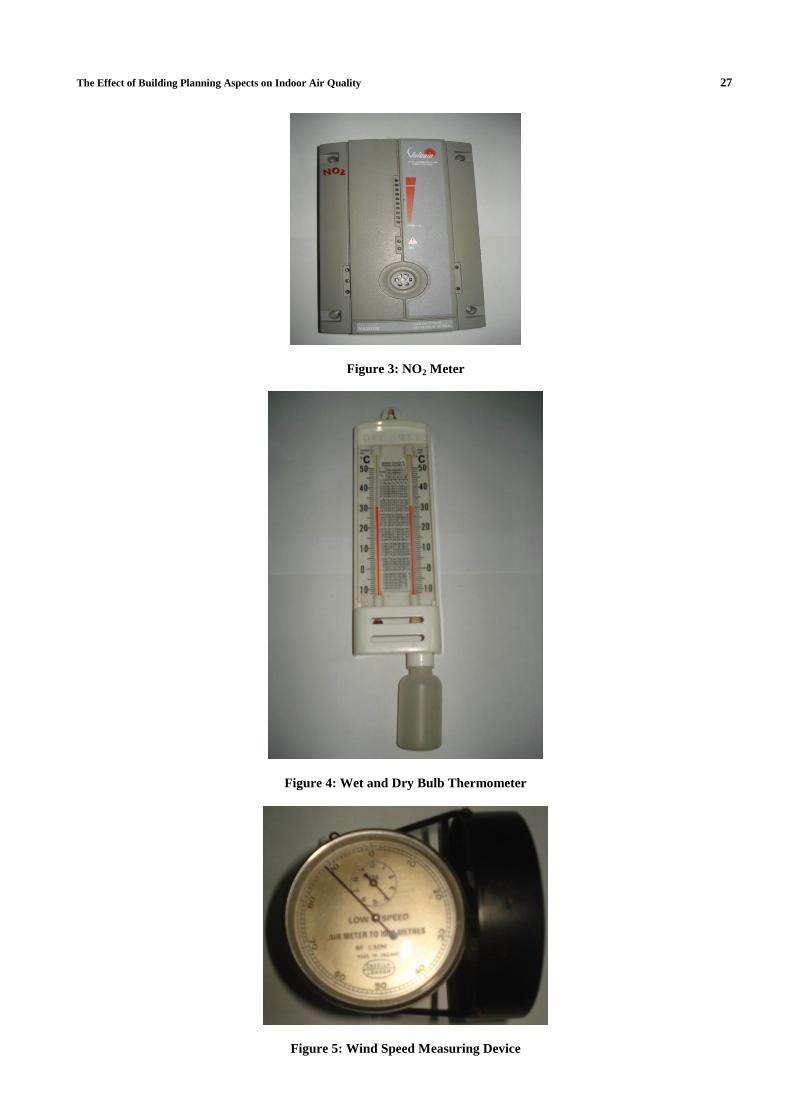
the comfort levels inside the building with indoor temperature, humidity and air flow speed. Figures 1, 2 and 3 show the
pieces of equipment used to measure CO2, SO2, NO2 concentrations respectively in the selected activity spaces of the
sample houses. Wet and dry bulb thermometer (Figure 4) was used to measure the temperature and humidity inside the
spaces. Anemometer shown in Figure 5 was used to measure the indoor wind speed. A questionnaire survey was carried
14 Jayasinghe C & Batagoda J
out at each location to investigate the planning details, operating schedule of the ventilation system of the house, any
discomfort felt by the occupants.
For each pollutant, the concentration was measured with a minimum time period of one hour outside the building
and a minimum time period of 3 hours was used in indoor measurements. The measurements were taken in steps of 15
minute time interval. The temperature, humidity and the wind speed were also measured using the same time intervals.
The instruments were kept at the center of the activity space as well as close to the pollutant source in order to get the
average values. In order to monitor the variation of CO2 concentration with different ventilation rates, CO2 measurements
were taken under following conditions:
Free running spaces and air conditioned spaces (case study)
In free running spaces, under different operating schedules of the ventilation system such as windows closed,
50% opened and 100 % opened conditions.
Measurements were taken in kitchens where different cooking fuel types are used.
Measurements were also taken in residential buildings in the same vicinity, with varying conditions of
microclimate around the houses. Here the micro climates were categorized as “poor” and “good” depending on the tree
cover and presence of plants which are observed as more than 2 m tall to act as a barrier to outdoor pollutants. The
condition of microclimate was judged as poor or good by observation and not by measuring of coverage of trees, due to
practical limitations of the study.
RESULTS AND ANALYSIS
CO2 Concentration and Ventilation Design
CO2 is not generally considered as a health concern at the concentrations usually occurs in indoor environments in
residential buildings. CO2 concentration, although it is non toxic, can be a direct indication of ventilation system of the
building. However, higher concentrations of CO2 can cause discomfort for the occupants [18].
In order to investigate the relationship between ventilation and CO2 concentration, in free running residential
buildings, CO2 levels were measured with the void/wall ratio of selected activity spaces. This was carried out at all the
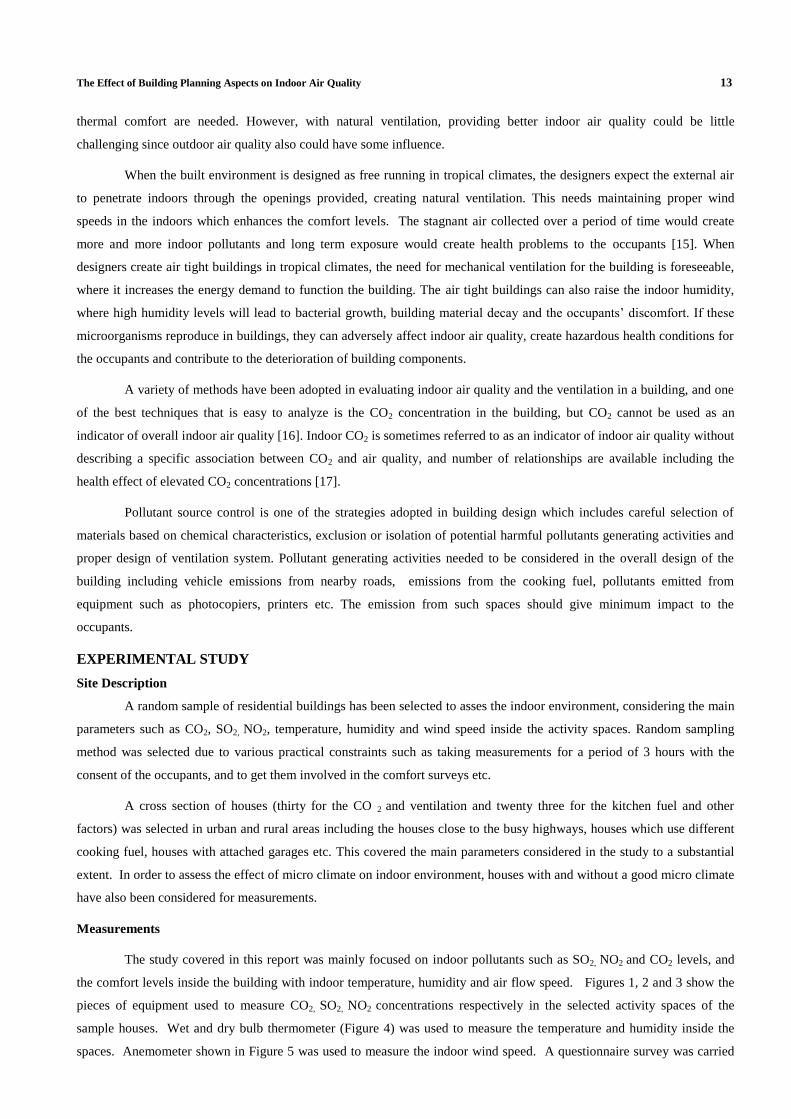
houses in the sample. Figure 1 shows the summary of results varying with void to wall ratio.
Figure 1: The Ratio of Indoor/Outdoor (I/O) Average CO2 Variation with Void to Wall (V/W) Ratio
The Effect of Building Planning Aspects on Indoor Air Quality 15
The variation of I/O ratio (Indoor / Outdoor) of CO2 concentration with void to wall ratio shown in Figure 1
clearly indicates that with higher void area, the indoor CO2 levels can become very close to the outdoor concentration,
which gives a ratio around 1. This reveals that higher void area is beneficial for a tropical country like Sri Lanka so that
the indoor and outdoor CO2 levels can be in the same range.
If the building designer can provide adequate number of windows by complying with the building regulations (in
excess of the minimum recommended) prevail in the country, a reasonable level of indoor CO2 can be maintained.
This is the minimum 1/7 of the floor area of any habitable room in Sri Lanka [19]. In order to maintain a
reasonable indoor CO2 level, the minimum void to wall ratio of an activity space (room) is proposed to be in the range of
0.15. It is preferable to have these openings in two different walls in order to facilitate cross ventilation.
Variation of CO2 Concentration with Operating Schedule of Windows in Free Running Spaces
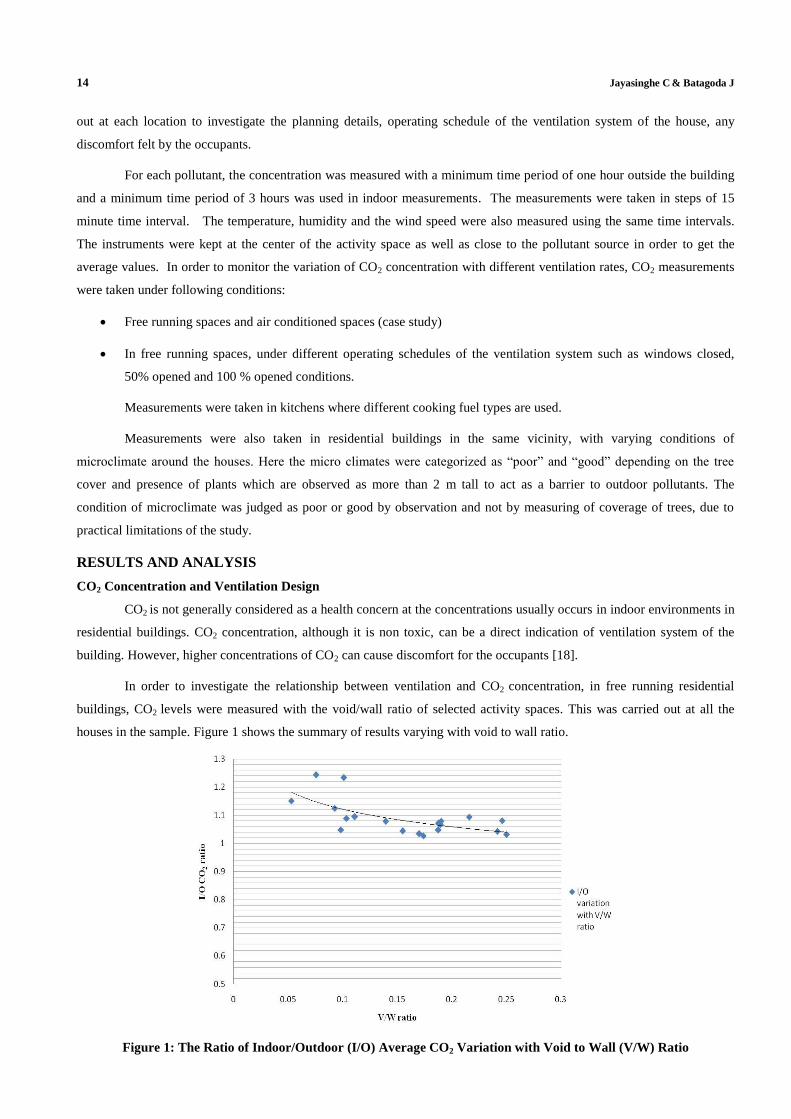
Although it is a known fact that the indoor CO2 levels can go up when the windows are closed, the magnitude of
the effect is shown in Figure 2.
Figure 2 presents the importance of operating the ventilation system properly. The windows provided by the
designer, should be opened and allow natural ventilation to happen during the operating cycle of the building. CO2
measurements were taken over a period of five hours at each house in the sample by keeping the windows opened and
closed. The I/O ratios for CO2 concentration were evaluated for both conditions in all the locations and the average values
are graphically presented in Figure 2.
It is clearly seen that indoor CO2 level can go up when the windows are kept closed. It is very close to the
outdoor CO2 concentration when the windows are properly operated. Therefore, it is very important to provide and operate
the means of natural ventilation over the entire life span of the building.
Figure 2: Variation of CO2 Concentration with Operating Practices of Free Running Ventilation
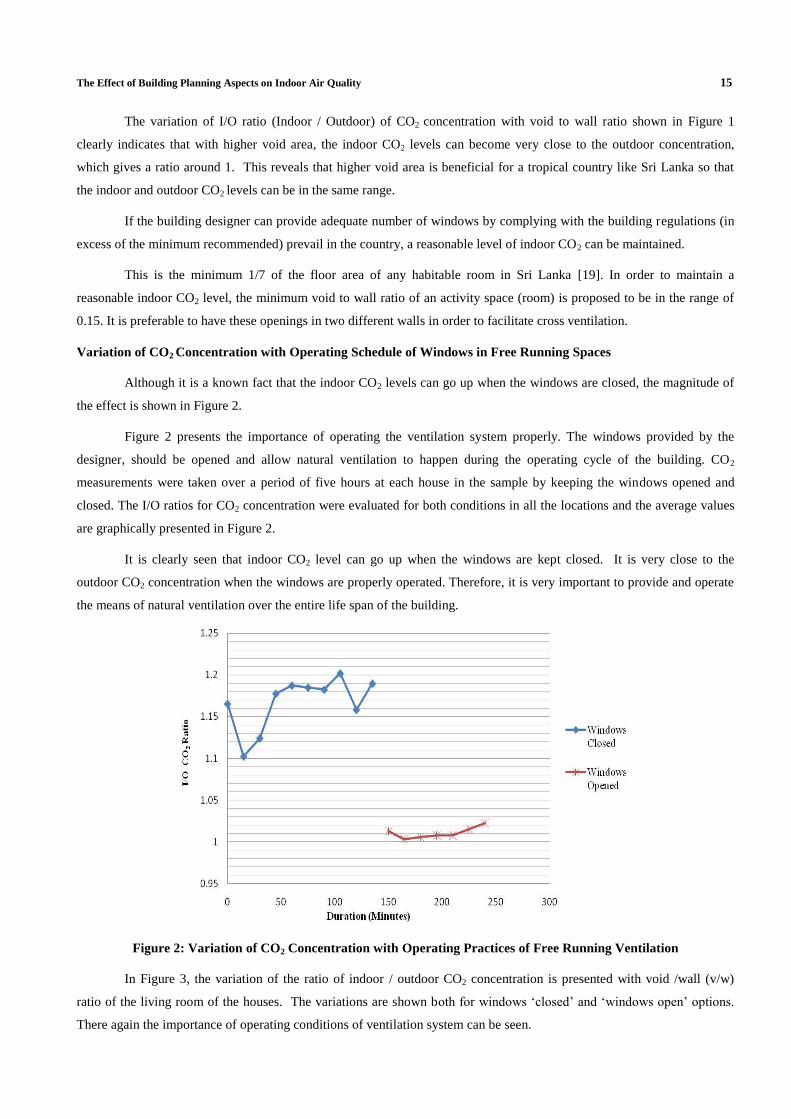
In Figure 3, the variation of the ratio of indoor / outdoor CO2 concentration is presented with void /wall (v/w)
ratio of the living room of the houses. The variations are shown both for windows „closed‟ and „windows open‟ options.
There again the importance of operating conditions of ventilation system can be seen.
16 Jayasinghe C & Batagoda J
Figure 3: Variation of CO2 (I/O Ratio) with Void to Wall (v/w) Ratio of the Activity Spaces
Variation of CO2 Concentration with the Wind Speed
The study conducted by Heidari (2005) [20], has shown that the air movement could affect the human comfort
and indoor comfort which is one of the main considerations in building design. It was found that preferred speed at 280C is
1.0 ms-1
, at 29.60C, it is 1.2 ms
-1 and at 31.3
0C, 1.6 ms
-1.
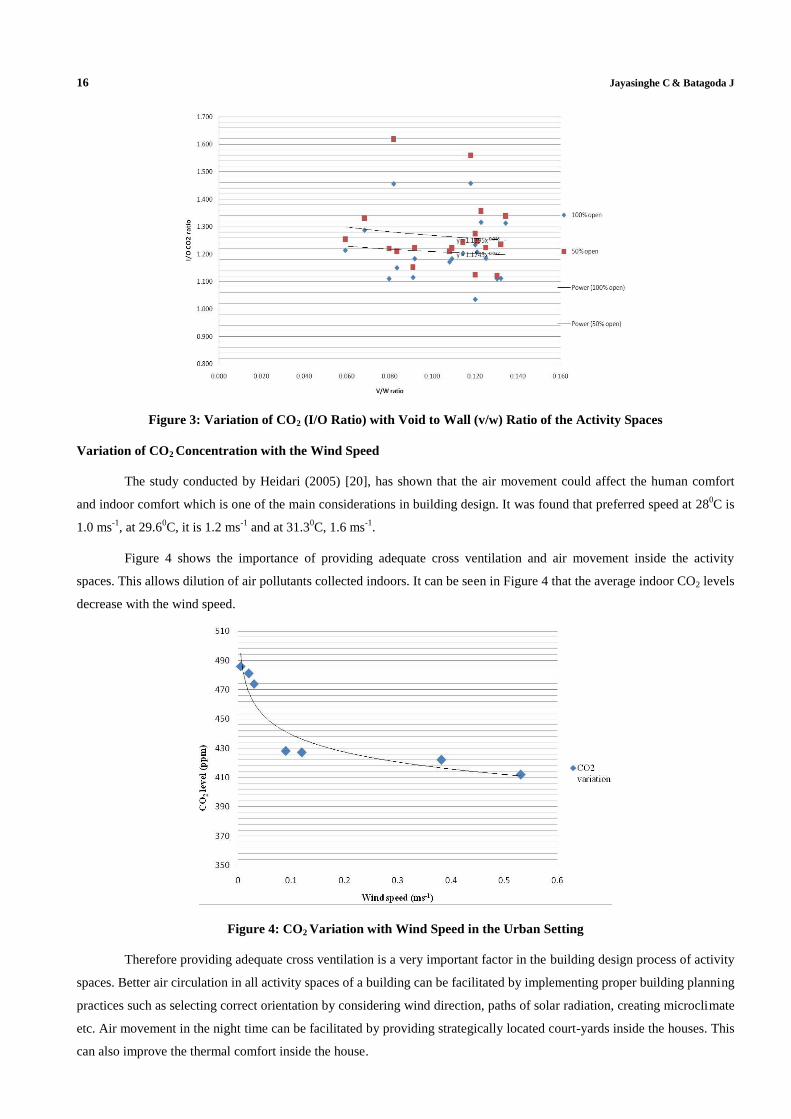
Figure 4 shows the importance of providing adequate cross ventilation and air movement inside the activity
spaces. This allows dilution of air pollutants collected indoors. It can be seen in Figure 4 that the average indoor CO2 levels
decrease with the wind speed.
Figure 4: CO2 Variation with Wind Speed in the Urban Setting
Therefore providing adequate cross ventilation is a very important factor in the building design process of activity
spaces. Better air circulation in all activity spaces of a building can be facilitated by implementing proper building planning
practices such as selecting correct orientation by considering wind direction, paths of solar radiation, creating microclimate
etc. Air movement in the night time can be facilitated by providing strategically located court-yards inside the houses. This
can also improve the thermal comfort inside the house.
The Effect of Building Planning Aspects on Indoor Air Quality 17
Effect of Micro Climate on Indoor Environment
Climate is a set of characteristic temperature, humidity, sunshine, wind, and other weather conditions that prevail
over a large area of space for long periods of time. Microclimate refers to a climate that holds over a very small area.
Microclimates usually are slight modifications of the main background climate altered by features in the landscape. The
micro-climate around the house plays a greater role in the thermal comfort and indoor air quality, where the cooling effect
on ambient air is associated with the phenomenon of evapotranspiration, and dispersion of moisture into the atmosphere. A
tree can be regarded as a natural “evaporative cooler” using 100 gallons of water a day. This rate of evapotranspiration
translates into a cooling potential of 230,000 kcal/day [21].
This cooling effect is the primary cause of 5 degrees Celsius difference in net peak noon time temperature
observed between forests and open terrain, and a 30C difference found in noontime air temperatures over irrigated fields
compared with bare ground. Temperature measurements on sub-urban areas recorded similar variation in daytime peaks of
20C to 3
0C between neighbourhoods under mature tree canopies and the areas with no trees.The shading effect created by
trees makes a perfect barrier to the direct solar radiation, preventing indoors getting heated up during mornings and
evenings which helps in achieving thermal comfort inside the building [22].
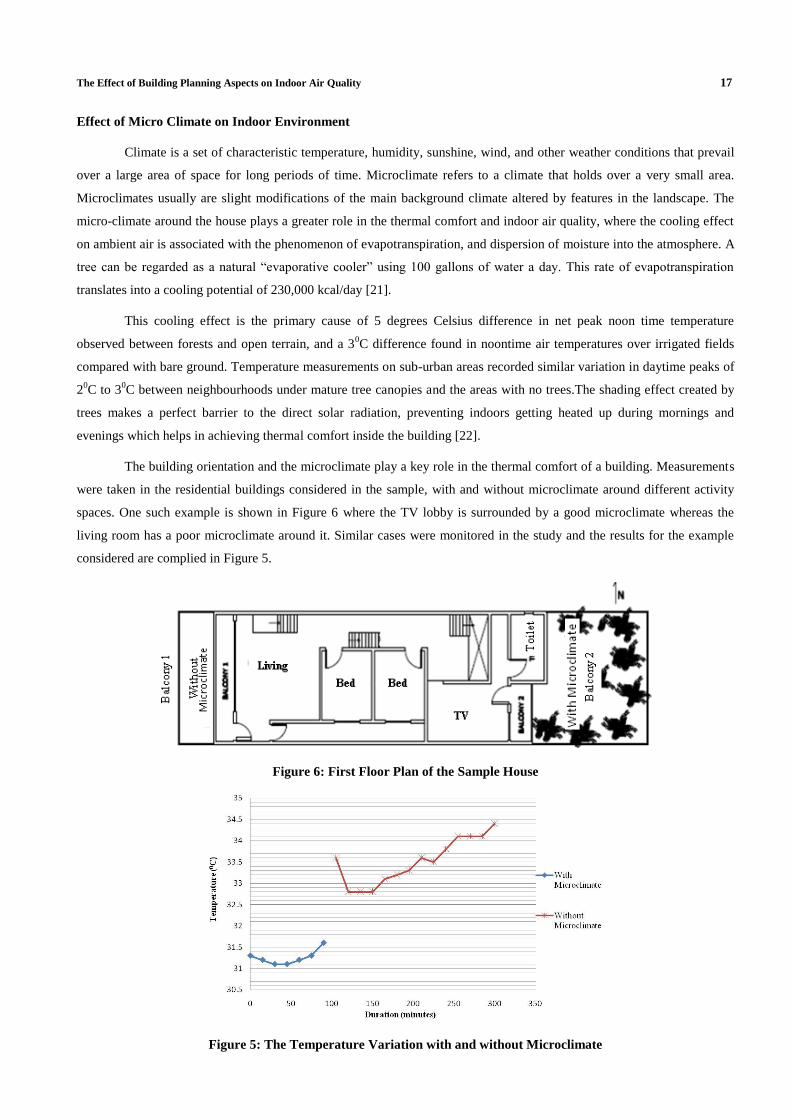
The building orientation and the microclimate play a key role in the thermal comfort of a building. Measurements
were taken in the residential buildings considered in the sample, with and without microclimate around different activity
spaces. One such example is shown in Figure 6 where the TV lobby is surrounded by a good microclimate whereas the
living room has a poor microclimate around it. Similar cases were monitored in the study and the results for the example
considered are complied in Figure 5.
Figure 6: First Floor Plan of the Sample House
Figure 5: The Temperature Variation with and without Microclimate
18 Jayasinghe C & Batagoda J
The effect of the microclimate can be clearly seen in Figure 5. The indoor temperature is reduced by 20 – 3
0C
when there is proper microclimate around the houses. The orientation of the house and locating the windows can greatly
affect the thermal comfort of the building [23]. In order to provide better outdoor comfort levels in tropical cities, it was
proposed to include shading in street canyons, covered walkways and tree plantation, since microclimate plays a very
important role in providing comfort conditions [22].
Indoor Comfort in the Kitchen Area of the Houses
Kitchen is considered as another main activity space which generates pollutants from cooking fuel. A sample of
houses which use different fuel types was monitored for the pollutant levels in the form of NO2, SO2 and CO2. Also
kitchens with and without chimneys were monitored for the same pollutants to investigate the effect of the exhaust system.
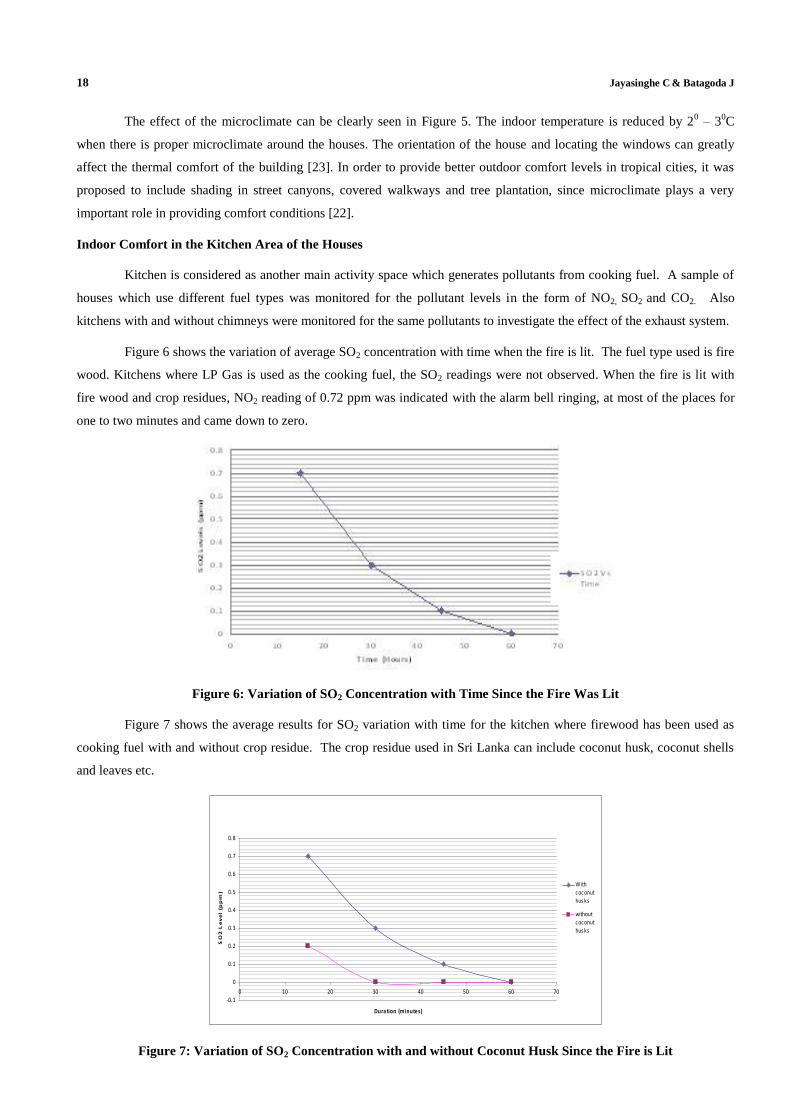
Figure 6 shows the variation of average SO2 concentration with time when the fire is lit. The fuel type used is fire
wood. Kitchens where LP Gas is used as the cooking fuel, the SO2 readings were not observed. When the fire is lit with
fire wood and crop residues, NO2 reading of 0.72 ppm was indicated with the alarm bell ringing, at most of the places for
one to two minutes and came down to zero.
Figure 6: Variation of SO2 Concentration with Time Since the Fire Was Lit
Figure 7 shows the average results for SO2 variation with time for the kitchen where firewood has been used as
cooking fuel with and without crop residue. The crop residue used in Sri Lanka can include coconut husk, coconut shells
and leaves etc.
-0.1
0
0.1
0.2
0.3
0.4
0.5
0.6
0.7
0.8
0 10 20 30 40 50 60 70
Dura tion (minutes)
SO
2 L
ev
el
(pp
m)
Withcoconuthus ks
withoutcoconuthus ks
Figure 7: Variation of SO2 Concentration with and without Coconut Husk Since the Fire is Lit
The Effect of Building Planning Aspects on Indoor Air Quality 19
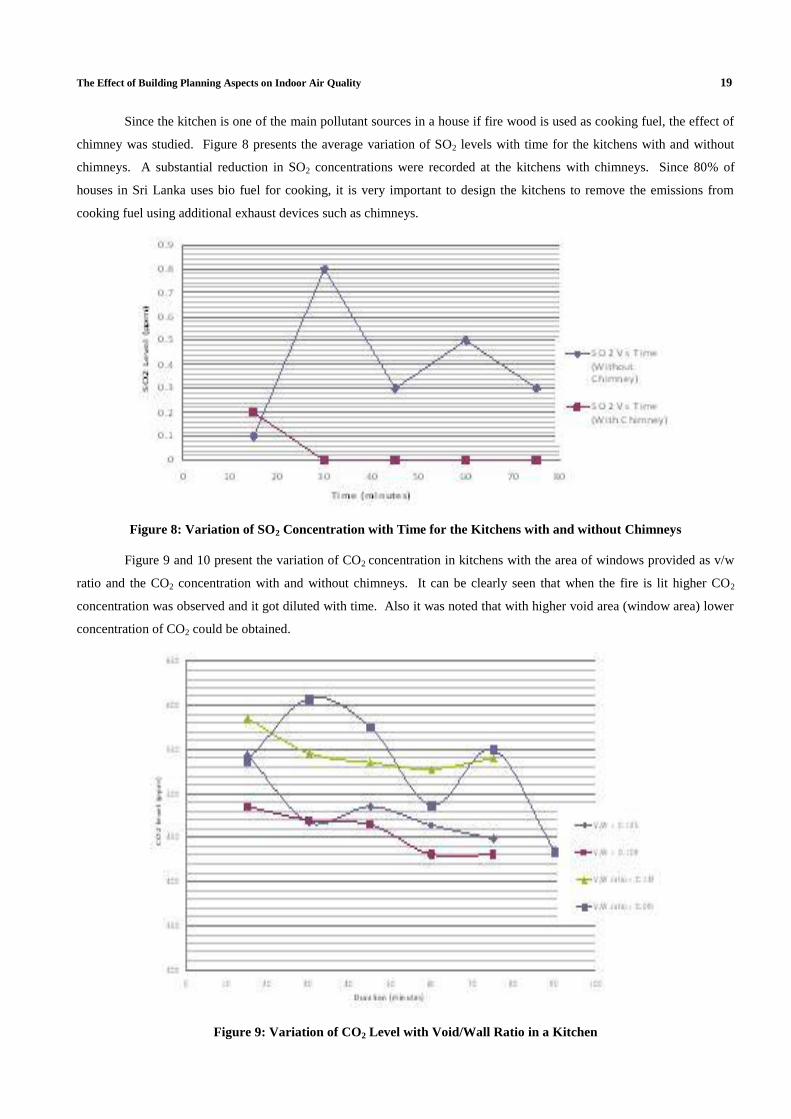
Since the kitchen is one of the main pollutant sources in a house if fire wood is used as cooking fuel, the effect of
chimney was studied. Figure 8 presents the average variation of SO2 levels with time for the kitchens with and without
chimneys. A substantial reduction in SO2 concentrations were recorded at the kitchens with chimneys. Since 80% of
houses in Sri Lanka uses bio fuel for cooking, it is very important to design the kitchens to remove the emissions from
cooking fuel using additional exhaust devices such as chimneys.
Figure 8: Variation of SO2 Concentration with Time for the Kitchens with and without Chimneys
Figure 9 and 10 present the variation of CO2 concentration in kitchens with the area of windows provided as v/w
ratio and the CO2 concentration with and without chimneys. It can be clearly seen that when the fire is lit higher CO2
concentration was observed and it got diluted with time. Also it was noted that with higher void area (window area) lower
concentration of CO2 could be obtained.
Figure 9: Variation of CO2 Level with Void/Wall Ratio in a Kitchen
20 Jayasinghe C & Batagoda J
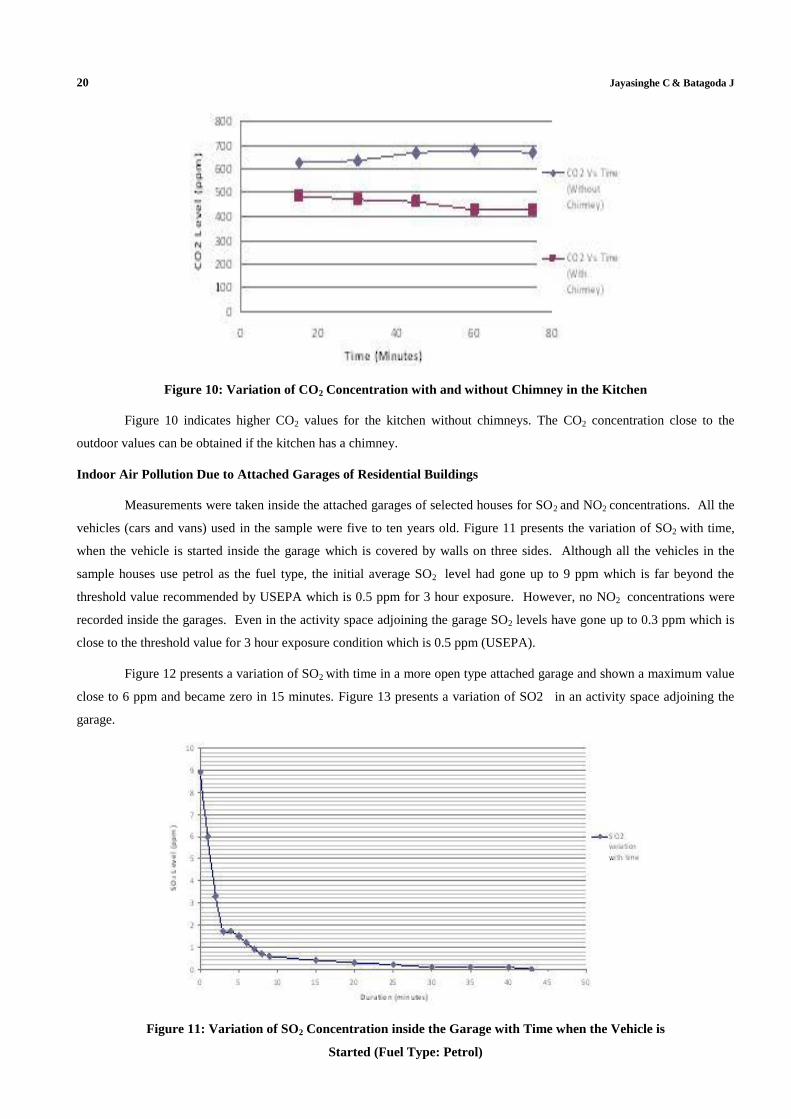
Figure 10: Variation of CO2 Concentration with and without Chimney in the Kitchen
Figure 10 indicates higher CO2 values for the kitchen without chimneys. The CO2 concentration close to the
outdoor values can be obtained if the kitchen has a chimney.
Indoor Air Pollution Due to Attached Garages of Residential Buildings
Measurements were taken inside the attached garages of selected houses for SO2 and NO2 concentrations. All the
vehicles (cars and vans) used in the sample were five to ten years old. Figure 11 presents the variation of SO2 with time,
when the vehicle is started inside the garage which is covered by walls on three sides. Although all the vehicles in the
sample houses use petrol as the fuel type, the initial average SO2 level had gone up to 9 ppm which is far beyond the
threshold value recommended by USEPA which is 0.5 ppm for 3 hour exposure. However, no NO2 concentrations were
recorded inside the garages. Even in the activity space adjoining the garage SO2 levels have gone up to 0.3 ppm which is
close to the threshold value for 3 hour exposure condition which is 0.5 ppm (USEPA).
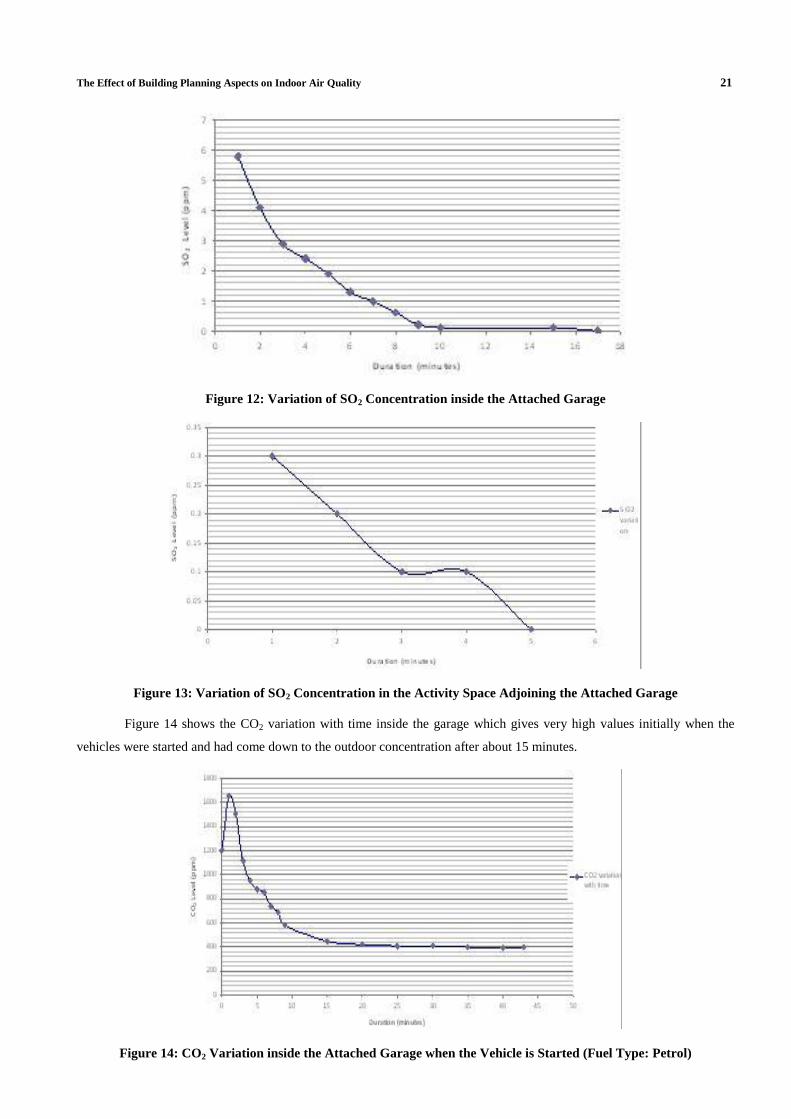
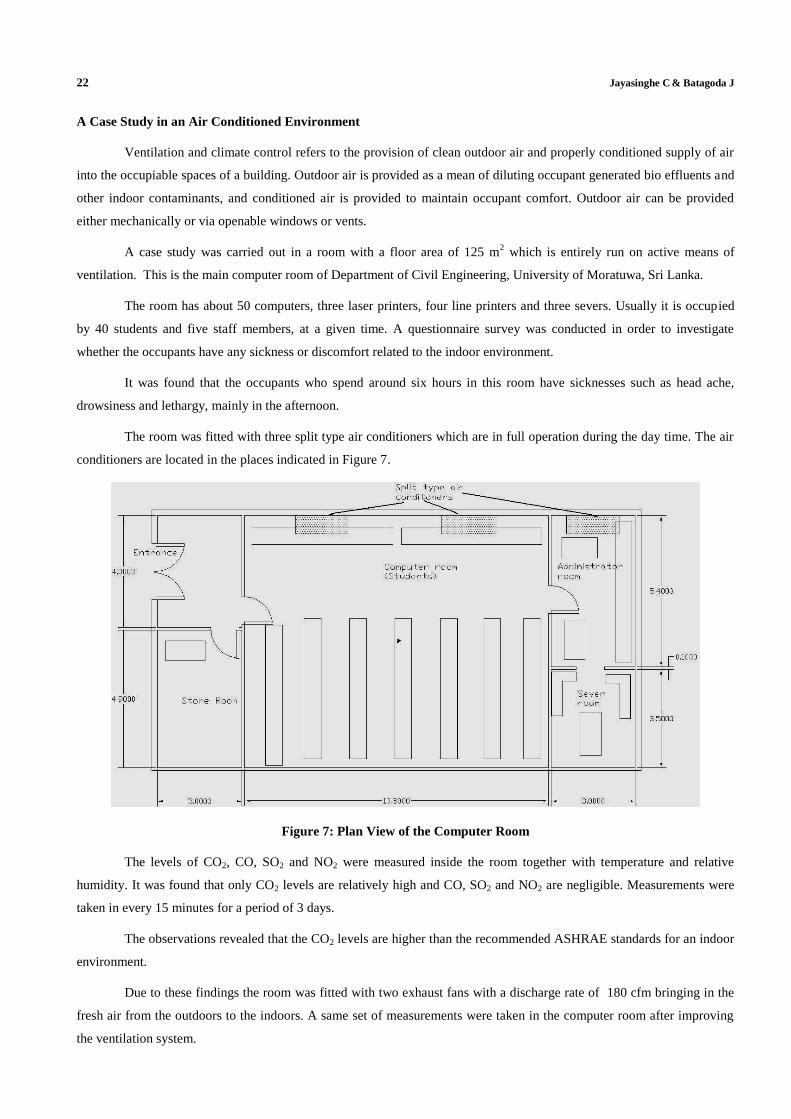
Figure 12 presents a variation of SO2 with time in a more open type attached garage and shown a maximum value
close to 6 ppm and became zero in 15 minutes. Figure 13 presents a variation of SO2 in an activity space adjoining the
garage.
Figure 11: Variation of SO2 Concentration inside the Garage with Time when the Vehicle is
Started (Fuel Type: Petrol)
The Effect of Building Planning Aspects on Indoor Air Quality 21
Figure 12: Variation of SO2 Concentration inside the Attached Garage
Figure 13: Variation of SO2 Concentration in the Activity Space Adjoining the Attached Garage
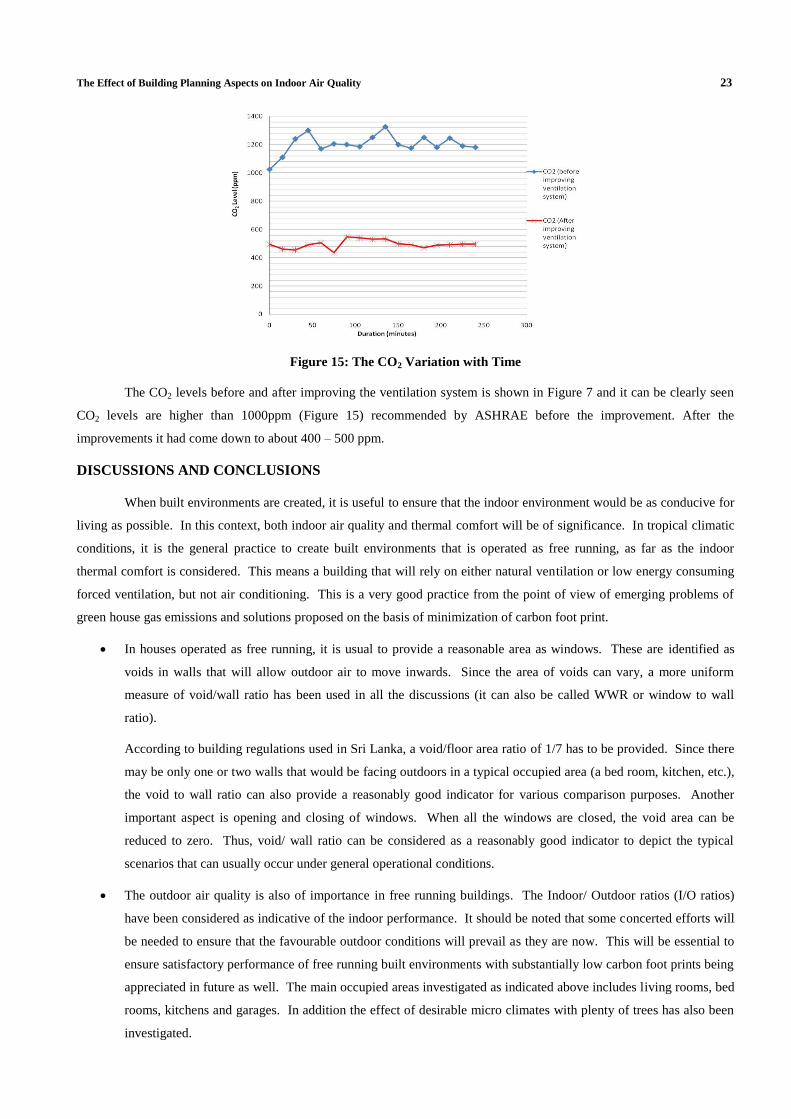
Figure 14 shows the CO2 variation with time inside the garage which gives very high values initially when the
vehicles were started and had come down to the outdoor concentration after about 15 minutes.
Figure 14: CO2 Variation inside the Attached Garage when the Vehicle is Started (Fuel Type: Petrol)
22 Jayasinghe C & Batagoda J
A Case Study in an Air Conditioned Environment
Ventilation and climate control refers to the provision of clean outdoor air and properly conditioned supply of air
into the occupiable spaces of a building. Outdoor air is provided as a mean of diluting occupant generated bio effluents and
other indoor contaminants, and conditioned air is provided to maintain occupant comfort. Outdoor air can be provided
either mechanically or via openable windows or vents.
A case study was carried out in a room with a floor area of 125 m2 which is entirely run on active means of
ventilation. This is the main computer room of Department of Civil Engineering, University of Moratuwa, Sri Lanka.
The room has about 50 computers, three laser printers, four line printers and three severs. Usually it is occupied
by 40 students and five staff members, at a given time. A questionnaire survey was conducted in order to investigate
whether the occupants have any sickness or discomfort related to the indoor environment.
It was found that the occupants who spend around six hours in this room have sicknesses such as head ache,
drowsiness and lethargy, mainly in the afternoon.
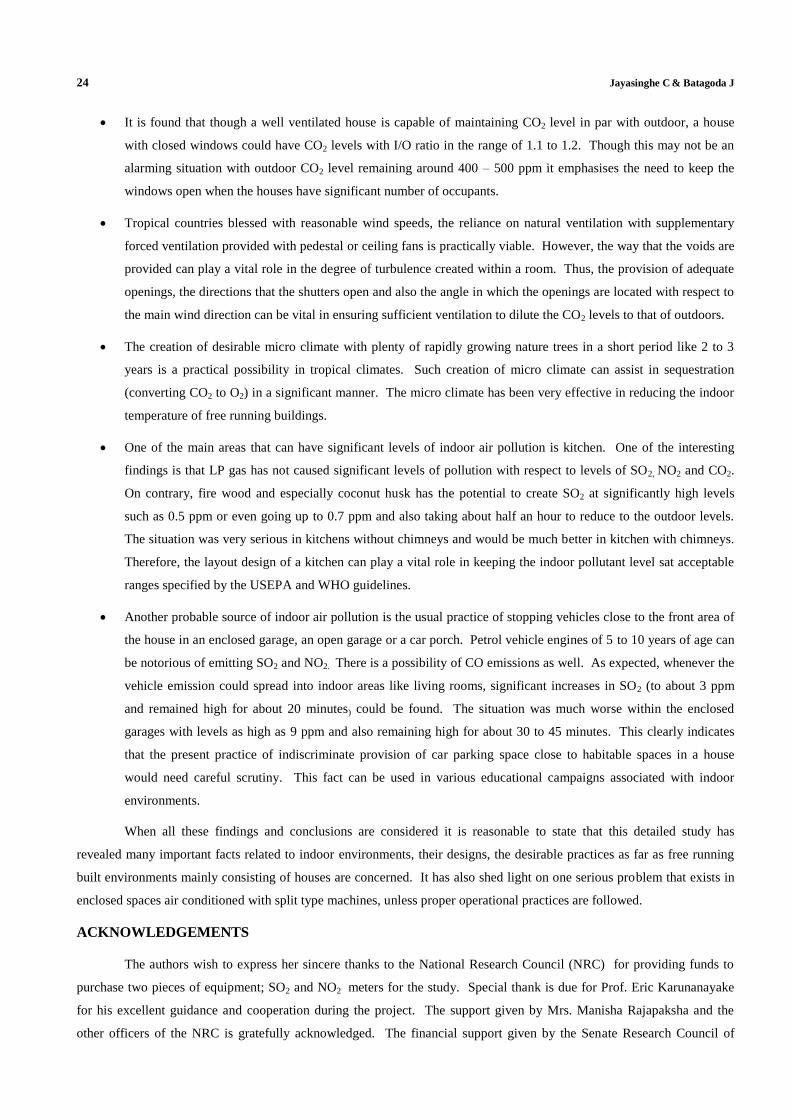
The room was fitted with three split type air conditioners which are in full operation during the day time. The air
conditioners are located in the places indicated in Figure 7.
Figure 7: Plan View of the Computer Room
The levels of CO2, CO, SO2 and NO2 were measured inside the room together with temperature and relative
humidity. It was found that only CO2 levels are relatively high and CO, SO2 and NO2 are negligible. Measurements were
taken in every 15 minutes for a period of 3 days.
The observations revealed that the CO2 levels are higher than the recommended ASHRAE standards for an indoor
environment.
Due to these findings the room was fitted with two exhaust fans with a discharge rate of 180 cfm bringing in the
fresh air from the outdoors to the indoors. A same set of measurements were taken in the computer room after improving
the ventilation system.
The Effect of Building Planning Aspects on Indoor Air Quality 23
Figure 15: The CO2 Variation with Time
The CO2 levels before and after improving the ventilation system is shown in Figure 7 and it can be clearly seen
CO2 levels are higher than 1000ppm (Figure 15) recommended by ASHRAE before the improvement. After the
improvements it had come down to about 400 – 500 ppm.
DISCUSSIONS AND CONCLUSIONS
When built environments are created, it is useful to ensure that the indoor environment would be as conducive for
living as possible. In this context, both indoor air quality and thermal comfort will be of significance. In tropical climatic
conditions, it is the general practice to create built environments that is operated as free running, as far as the indoor
thermal comfort is considered. This means a building that will rely on either natural ventilation or low energy consuming
forced ventilation, but not air conditioning. This is a very good practice from the point of view of emerging problems of
green house gas emissions and solutions proposed on the basis of minimization of carbon foot print.
In houses operated as free running, it is usual to provide a reasonable area as windows. These are identified as
voids in walls that will allow outdoor air to move inwards. Since the area of voids can vary, a more uniform
measure of void/wall ratio has been used in all the discussions (it can also be called WWR or window to wall
ratio).
According to building regulations used in Sri Lanka, a void/floor area ratio of 1/7 has to be provided. Since there
may be only one or two walls that would be facing outdoors in a typical occupied area (a bed room, kitchen, etc.),
the void to wall ratio can also provide a reasonably good indicator for various comparison purposes. Another
important aspect is opening and closing of windows. When all the windows are closed, the void area can be
reduced to zero. Thus, void/ wall ratio can be considered as a reasonably good indicator to depict the typical
scenarios that can usually occur under general operational conditions.
The outdoor air quality is also of importance in free running buildings. The Indoor/ Outdoor ratios (I/O ratios)
have been considered as indicative of the indoor performance. It should be noted that some concerted efforts will
be needed to ensure that the favourable outdoor conditions will prevail as they are now. This will be essential to
ensure satisfactory performance of free running built environments with substantially low carbon foot prints being
appreciated in future as well. The main occupied areas investigated as indicated above includes living rooms, bed
rooms, kitchens and garages. In addition the effect of desirable micro climates with plenty of trees has also been
investigated.
24 Jayasinghe C & Batagoda J
It is found that though a well ventilated house is capable of maintaining CO2 level in par with outdoor, a house
with closed windows could have CO2 levels with I/O ratio in the range of 1.1 to 1.2. Though this may not be an
alarming situation with outdoor CO2 level remaining around 400 – 500 ppm it emphasises the need to keep the
windows open when the houses have significant number of occupants.
Tropical countries blessed with reasonable wind speeds, the reliance on natural ventilation with supplementary
forced ventilation provided with pedestal or ceiling fans is practically viable. However, the way that the voids are
provided can play a vital role in the degree of turbulence created within a room. Thus, the provision of adequate
openings, the directions that the shutters open and also the angle in which the openings are located with respect to
the main wind direction can be vital in ensuring sufficient ventilation to dilute the CO2 levels to that of outdoors.
The creation of desirable micro climate with plenty of rapidly growing nature trees in a short period like 2 to 3
years is a practical possibility in tropical climates. Such creation of micro climate can assist in sequestration
(converting CO2 to O2) in a significant manner. The micro climate has been very effective in reducing the indoor
temperature of free running buildings.
One of the main areas that can have significant levels of indoor air pollution is kitchen. One of the interesting
findings is that LP gas has not caused significant levels of pollution with respect to levels of SO2, NO2 and CO2.
On contrary, fire wood and especially coconut husk has the potential to create SO2 at significantly high levels
such as 0.5 ppm or even going up to 0.7 ppm and also taking about half an hour to reduce to the outdoor levels.
The situation was very serious in kitchens without chimneys and would be much better in kitchen with chimneys.
Therefore, the layout design of a kitchen can play a vital role in keeping the indoor pollutant level sat acceptable
ranges specified by the USEPA and WHO guidelines.
Another probable source of indoor air pollution is the usual practice of stopping vehicles close to the front area of
the house in an enclosed garage, an open garage or a car porch. Petrol vehicle engines of 5 to 10 years of age can
be notorious of emitting SO2 and NO2. There is a possibility of CO emissions as well. As expected, whenever the
vehicle emission could spread into indoor areas like living rooms, significant increases in SO2 (to about 3 ppm
and remained high for about 20 minutes) could be found. The situation was much worse within the enclosed
garages with levels as high as 9 ppm and also remaining high for about 30 to 45 minutes. This clearly indicates
that the present practice of indiscriminate provision of car parking space close to habitable spaces in a house
would need careful scrutiny. This fact can be used in various educational campaigns associated with indoor
environments.
When all these findings and conclusions are considered it is reasonable to state that this detailed study has
revealed many important facts related to indoor environments, their designs, the desirable practices as far as free running
built environments mainly consisting of houses are concerned. It has also shed light on one serious problem that exists in
enclosed spaces air conditioned with split type machines, unless proper operational practices are followed.
ACKNOWLEDGEMENTS
The authors wish to express her sincere thanks to the National Research Council (NRC) for providing funds to
purchase two pieces of equipment; SO2 and NO2 meters for the study. Special thank is due for Prof. Eric Karunanayake
for his excellent guidance and cooperation during the project. The support given by Mrs. Manisha Rajapaksha and the
other officers of the NRC is gratefully acknowledged. The financial support given by the Senate Research Council of
The Effect of Building Planning Aspects on Indoor Air Quality 25
University of Moratuwa to employ a Research Assistant is appreciated very much.
REFERENCES
1. Weschler, C. J., (2009) “Changes in indoor pollutants since the 1950s”, Atmospheric Environment 43 (2009) pp.
153 – 169.
2. Smith, K. R., (2002) “Indoor air pollution in developing countries: recommendations for research”, Indoor Air 12
(2002) pp. 198 – 207
3. Department of Census and Statistics Sri Lanka, Census of population and housing, 2001, www.statistics.gov.lk.
4. LEED for New Construction Version 2.2, Reference Guide, Second Edition 2006, US Green Building Council.
5. ASHRAE, 1993. 1993 ASHRAE handbook – Fundamentals. American Society of Heating, Refrigerating and Air-
Conditioning Engineers, Inc.
6. ASHRAE, 2004, Standard 62.1 -2004, “Ventilation for acceptable indoor air quality”, American Society of
Heating, Refrigerating and Air-Conditioning Engineers, In.
7. Nathanson, J. A., Basic environmental technology – water supply, waste management and pollution control,
Prentice Hall, USA, 2000, 496p.
8. WHO (2005 a), WHO Air Quality Guidelines Global update 2005, http//www.euro.who.int/document/E90038.
pdf.
9. Stieb, D., Judek, S., Burnett, R., (2002) “Meta-analysis of time-series studies of air pollution and mortality: effects
of gases and particles and the influence of cause of death, age, and season.”Journal for Air Waste Management
Association 52(4):470-84.
10. Oosthuizen A.D., (1999) “Indoor A Case Study for the Domestic Application of Natural Ventilation in Sydney “,
Presented at the first International One day Forum on Natural and Hybrid Ventilation, HybVent Forum’ 99,
09/1999, Sydney, Australia.
11. Hedley, A.J., Wong, C.M., Tach T.Q. Ma, S., Lam, T.H., and Anderson, H.R., (2002), Cardio-respiratory and all
cause mortality after restrictions on sulphar content of fuel in Hong Kong: an intervention study, Lancert, 360:
1646 – 1652.
12. HEI (2004) Health Effects of outdoor air pollution in developing countires of Asia: A literature Review, Health
effects Institute, Special Report 15, Boston.
13. WHO, (2005), “WHO Air quality guidelines for particulate matter ozone, nitrogen dioxide and sulphur-dioxide”.
14. Charles J., Weschler, William W. Nazarrff, “Semivolatile Organic Compounds in indoor environments”,
Atmospheric Environment, 42 (2008), 9018 – 9040.
15. Dols, W. S., Persily, A. K., Nabinger, S. J., (1996) “Indoor Air Quality in Green Buildings: A review and a case
study “, In proceedings of IAQ ’96 Conference, Baltimore, Paths to better Building Environments, ASHRAE,
1996, pp. 139 – 150.
16. Persily, A.K., (1996) “The relationship between indoor air and Carbon Dioxide” – In Proceedings of Indoor air
’96, Nagoya, The 7th
International conference on Indoor Air Quality and Climate, Vol. 2, pp. 961- 966.
26 Jayasinghe C & Batagoda J
17. Knudstrup, M. A., Hansen, H. T. R., Brunsgaard, C., (2009) ”Approaches to the design of sustainable housing
with low CO2 emission in Denmark”, Renewable Energy 34 (2009) pp. 2007-2015
18. Emmerich, S. J., Persily, A. K.,(1997) “Literature review on CO2-based demand-control ventilation” inclusion in
ASHRAE transactions 1997, Vol 103. Pt. 2.
19. Urban Development Authority, Ministry Of Urban Development, Housing and Construction, Building regulations
(1999) “City of Colombo Development Plan 1999”
20. Heidari, S., (2005) “Effect of air movement in Building”, International conference “Passive and low energy
cooling for the Built Environment”, May 2005, Santorini, Greece.
21. Saxena, M., “Microclimate Modification: calculating the effect of trees on air temperature”, Heschong Mahone
Group. www.sbse.org/awards/docs/
22. Wan-Je, J., Jang-Yeul, S., (2009) “The effect of environmental and structural factors on indoor air quality of
apartments in Korea”, Building and Environment 44 (2009) pp. 1794-1802
23. Johansson, E., Emmanuel, R., Rosenlund, H., (2004) “Microclimate and thermal comfort in the warm humid city
of Colombo, Sri Lanka.” Presented in: The 21st Conference in Passive and Low Energy Architecture. Eindhoven.
APPENDIX
Figure 1: CO2 Meter
Figure 2: SO2 Meter
The Effect of Building Planning Aspects on Indoor Air Quality 27
Figure 3: NO2 Meter
Figure 4: Wet and Dry Bulb Thermometer
Figure 5: Wind Speed Measuring Device