14
| Date post: | 03-Jan-2016 |
| Category: |
Documents |
| Upload: | gregory-collins |
| View: | 214 times |
| Download: | 0 times |


2Grow
ACA’s Strategic Framework
VISION: Arizona is the best location for high-quality business growth
MISSION: Grow & diversify Arizona’s Economy & create quality jobs for its citizens by supporting and attracting businesses in targeted, high-growth clusters, with an emphasis on the base industries.
STRATEGIES:
ACTION PLAN:
Increase Awareness of Arizona’s Attractiveness
Coordinate Arizona’s Economic Development
Make Arizona a Leading Hub in High-Quality Manufacturing and Advanced Business Services
Support Employer-focused, Demand-driven Workforce
Development
Integrate All Areas of Arizona into the State’s
Growth
1Recruit 3Create
Enhance Arizona’s Competitiveness
Develop Infrastructure to Support Economic Growth
Become a Preferred Trading Partner with
Mexico and Canada
Foster Innovation and Support Entrepreneurship
Make Arizona Preferred Location for Target Industries: A&D, Semiconductors, Optics, Biosciences, Solar Energy
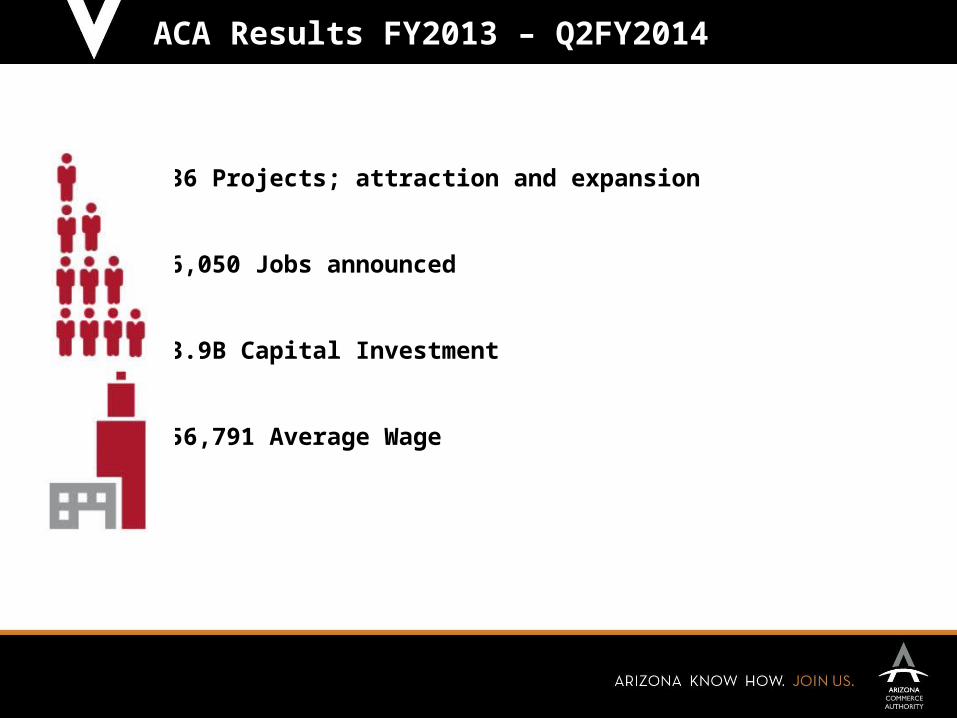
ACA Results FY2013 – Q2FY2014
136 Projects; attraction and expansion
26,050 Jobs announced
$3.9B Capital Investment
$56,791 Average Wage
ACA Results FY2013 – Q2FY2014
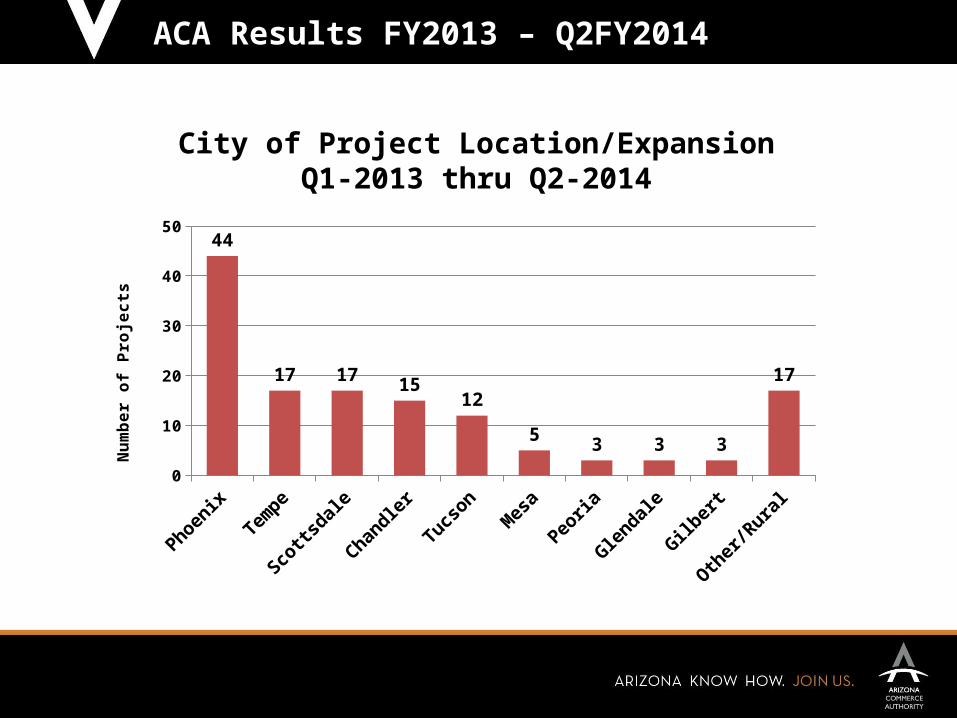
Phoenix
Tempe
Scottsdale
Chandler
Tucson
Mesa
Peoria
Gle
ndale
Gilb
ert
Oth
er/Rura
l0
10
20
30
40
5044
17 1715
12
53 3 3
17
Nu
mb
er
of
Pro
jec
ts
City of Project Location/ExpansionQ1-2013 thru Q2-2014
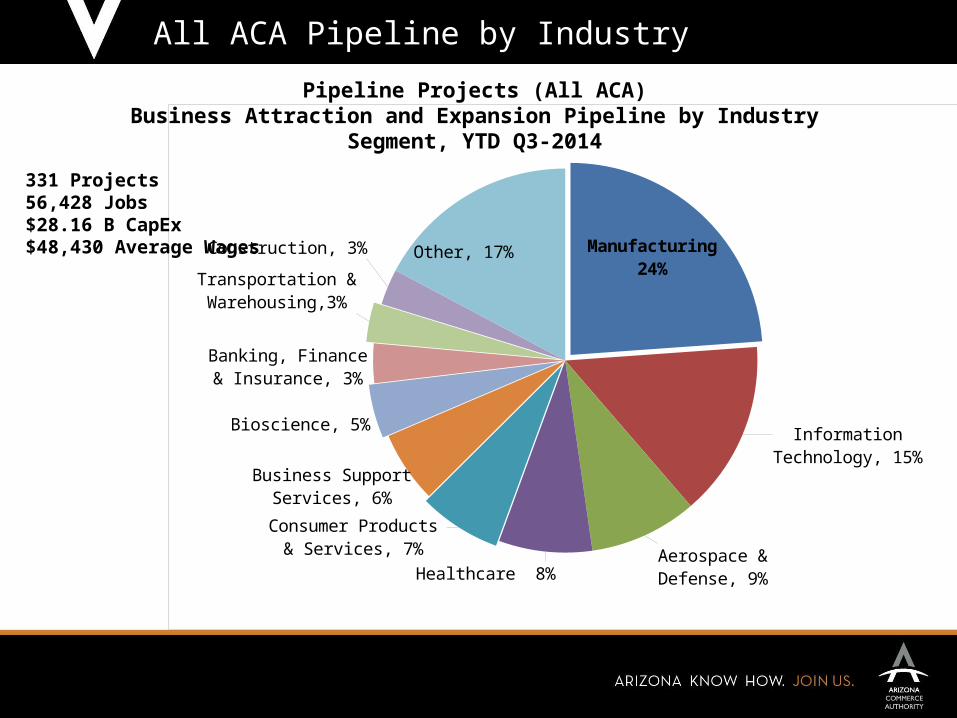
Manufacturing24%
Information Technology, 15%
Aerospace & Defense, 9%Healthcare 8%
Consumer Products & Services, 7%
Business Support Services, 6%
Bioscience, 5%
Banking, Finance & In-surance, 3%
Transportation & Warehousing,3%
Construction, 3%Other, 17%
331 Projects56,428 Jobs$28.16 B CapEx$48,430 Average Wages
All ACA Pipeline by Industry
Pipeline Projects (All ACA)Business Attraction and Expansion Pipeline by Industry Segment, YTD Q3-2014
65 to 69 years 29,925 34,903 4,978 17%60 to 64 years 36,765 40,117 3,352 9%70 to 74 years 23,005 25,798 2,793 12%25 to 29 years 29,073 30,966 1,893 7%75 to 79 years 15,881 17,744 1,863 12%55 to 59 years 37,494 38,666 1,172 3%30 to 34 years 27,167 28,336 1,169 4%20 to 24 years 39,877 40,879 1,002 3%Under 5 years 33,520 34,304 784 2%35 to 39 years 26,174 26,794 620 2%85 years and over 9,542 10,160 618 6%80 to 84 years 11,071 11,532 461 4%10 to 14 years 35,282 35,739 457 1%5 to 9 years 33,835 34,142 307 1%40 to 44 years 28,171 27,101 (1,070) (4%)50 to 54 years 36,869 35,458 (1,411) (4%)45 to 49 years 32,425 30,361 (2,064) (6%)15 to 19 years 40,115 36,784 (3,331) (8%)
Total 526,190 539,784 13,594 3%
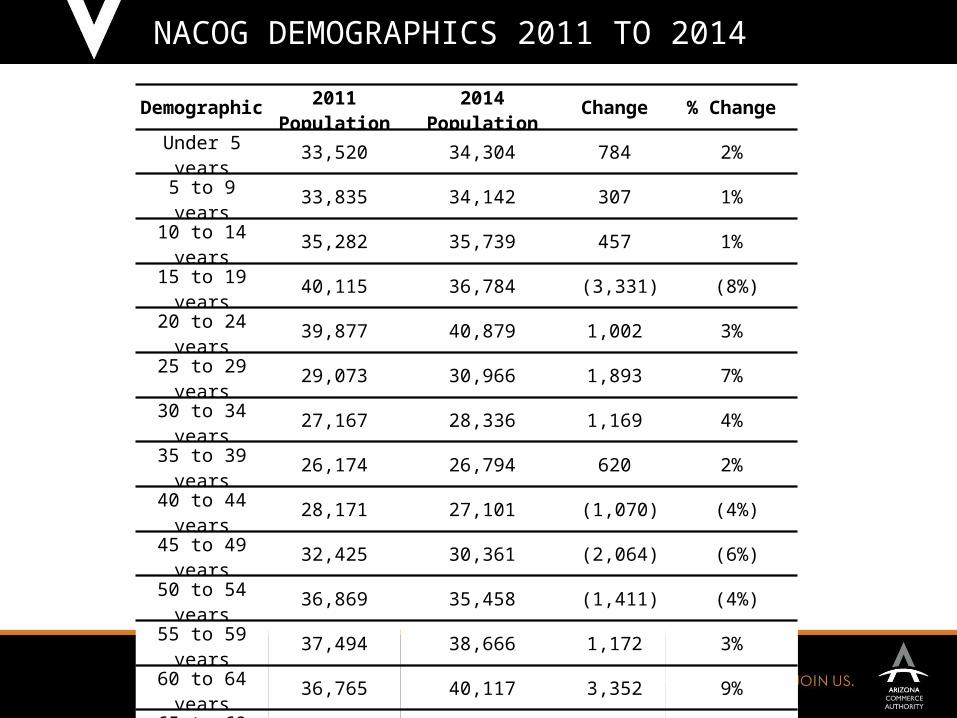
NACOG DEMOGRAPHICS 2011 TO 2014
Demographic 2011 Population 2014 Population Change % ChangeUnder 5 years 33,520 34,304 784 2%
5 to 9 years 33,835 34,142 307 1%10 to 14 years 35,282 35,739 457 1%15 to 19 years 40,115 36,784 (3,331) (8%)20 to 24 years 39,877 40,879 1,002 3%25 to 29 years 29,073 30,966 1,893 7%30 to 34 years 27,167 28,336 1,169 4%35 to 39 years 26,174 26,794 620 2%40 to 44 years 28,171 27,101 (1,070) (4%)45 to 49 years 32,425 30,361 (2,064) (6%)50 to 54 years 36,869 35,458 (1,411) (4%)55 to 59 years 37,494 38,666 1,172 3%60 to 64 years 36,765 40,117 3,352 9%65 to 69 years 29,925 34,903 4,978 17%70 to 74 years 23,005 25,798 2,793 12%75 to 79 years 15,881 17,744 1,863 12%80 to 84 years 11,071 11,532 461 4%85 years and
over 9,542 10,160 618 6%
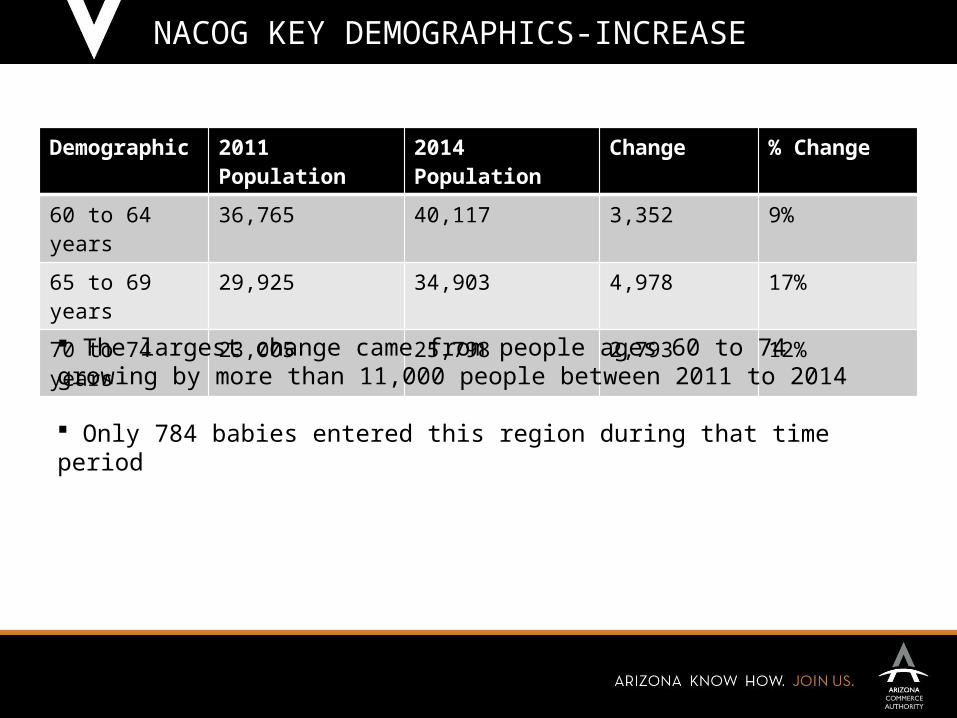
Demographic 2011 Population 2014 Population Change % Change
60 to 64 years 36,765 40,117 3,352 9%
65 to 69 years 29,925 34,903 4,978 17%
70 to 74 years 23,005 25,798 2,793 12%
The largest change came from people ages 60 to 74 growing by more than 11,000 people between 2011 to 2014
Only 784 babies entered this region during that time period
NACOG KEY DEMOGRAPHICS-INCREASE
65 to 69 years 29,925 34,903 4,978 17%60 to 64 years 36,765 40,117 3,352 9%70 to 74 years 23,005 25,798 2,793 12%25 to 29 years 29,073 30,966 1,893 7%75 to 79 years 15,881 17,744 1,863 12%55 to 59 years 37,494 38,666 1,172 3%30 to 34 years 27,167 28,336 1,169 4%20 to 24 years 39,877 40,879 1,002 3%Under 5 years 33,520 34,304 784 2%35 to 39 years 26,174 26,794 620 2%85 years and over 9,542 10,160 618 6%80 to 84 years 11,071 11,532 461 4%10 to 14 years 35,282 35,739 457 1%5 to 9 years 33,835 34,142 307 1%40 to 44 years 28,171 27,101 (1,070) (4%)50 to 54 years 36,869 35,458 (1,411) (4%)45 to 49 years 32,425 30,361 (2,064) (6%)15 to 19 years 40,115 36,784 (3,331) (8%)
Total 526,190 539,784 13,594 3%
NACOG KEY DEMOGRAPHICS-DECREASE
15 to 19 years 40 to 44 years 45 to 49 years 50 to 54 years0
5,000
10,000
15,000
20,000
25,000
30,000
35,000
40,000
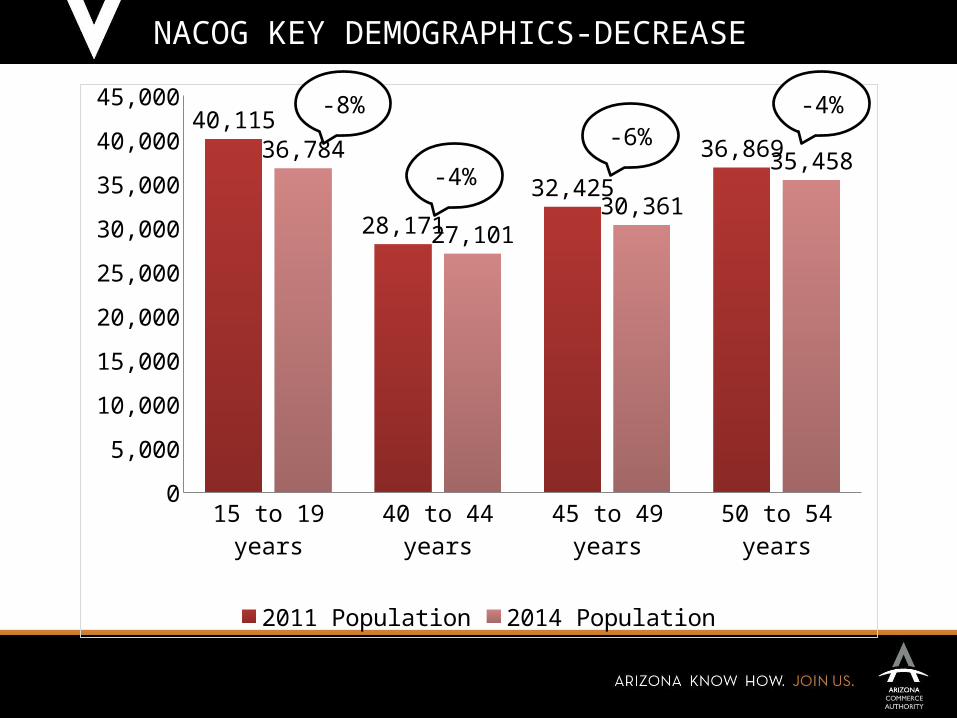
45,00040,115
28,171
32,425
36,86936,784
27,10130,361
35,458
2011 Population 2014 Population
-8%
-4%
-6%-4%
65 to 69 years 29,925 34,903 4,978 17%60 to 64 years 36,765 40,117 3,352 9%70 to 74 years 23,005 25,798 2,793 12%25 to 29 years 29,073 30,966 1,893 7%75 to 79 years 15,881 17,744 1,863 12%55 to 59 years 37,494 38,666 1,172 3%30 to 34 years 27,167 28,336 1,169 4%20 to 24 years 39,877 40,879 1,002 3%Under 5 years 33,520 34,304 784 2%35 to 39 years 26,174 26,794 620 2%85 years and over 9,542 10,160 618 6%80 to 84 years 11,071 11,532 461 4%10 to 14 years 35,282 35,739 457 1%5 to 9 years 33,835 34,142 307 1%40 to 44 years 28,171 27,101 (1,070) (4%)50 to 54 years 36,869 35,458 (1,411) (4%)45 to 49 years 32,425 30,361 (2,064) (6%)15 to 19 years 40,115 36,784 (3,331) (8%)
Total 526,190 539,784 13,594 3%
NACOG REGIONAL TRENDS
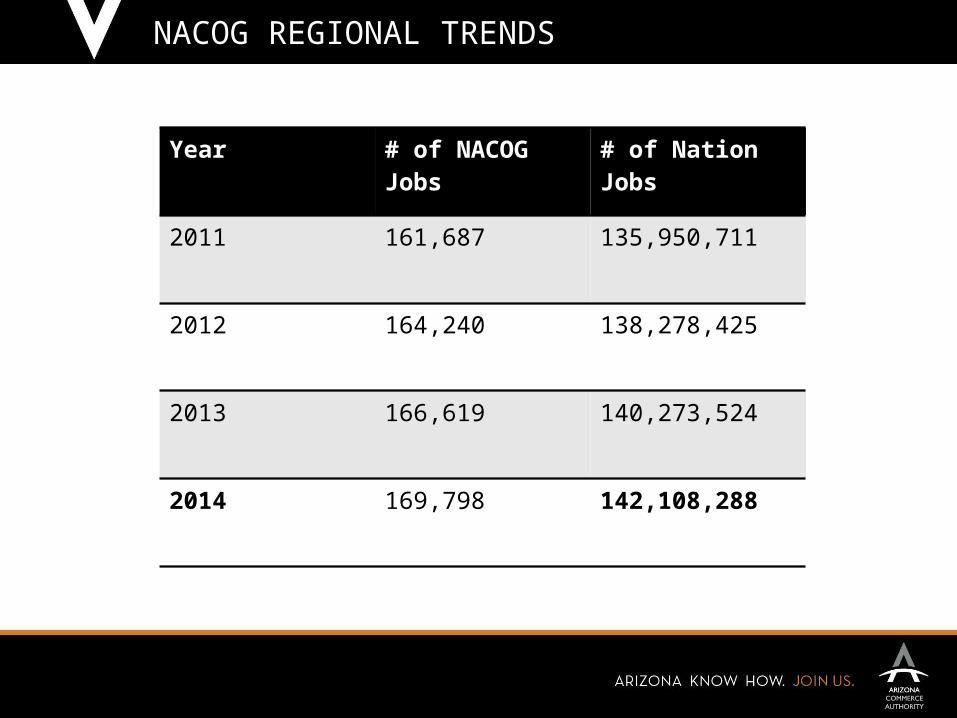
Year # of NACOG Jobs # of Nation Jobs
2011 161,687 135,950,711
2012 164,240 138,278,425
2013 166,619 140,273,524
2014 169,798 142,108,288
65 to 69 years 29,925 34,903 4,978 17%60 to 64 years 36,765 40,117 3,352 9%70 to 74 years 23,005 25,798 2,793 12%25 to 29 years 29,073 30,966 1,893 7%75 to 79 years 15,881 17,744 1,863 12%55 to 59 years 37,494 38,666 1,172 3%30 to 34 years 27,167 28,336 1,169 4%20 to 24 years 39,877 40,879 1,002 3%Under 5 years 33,520 34,304 784 2%35 to 39 years 26,174 26,794 620 2%85 years and over 9,542 10,160 618 6%80 to 84 years 11,071 11,532 461 4%10 to 14 years 35,282 35,739 457 1%5 to 9 years 33,835 34,142 307 1%40 to 44 years 28,171 27,101 (1,070) (4%)50 to 54 years 36,869 35,458 (1,411) (4%)45 to 49 years 32,425 30,361 (2,064) (6%)15 to 19 years 40,115 36,784 (3,331) (8%)
Total 526,190 539,784 13,594 3%
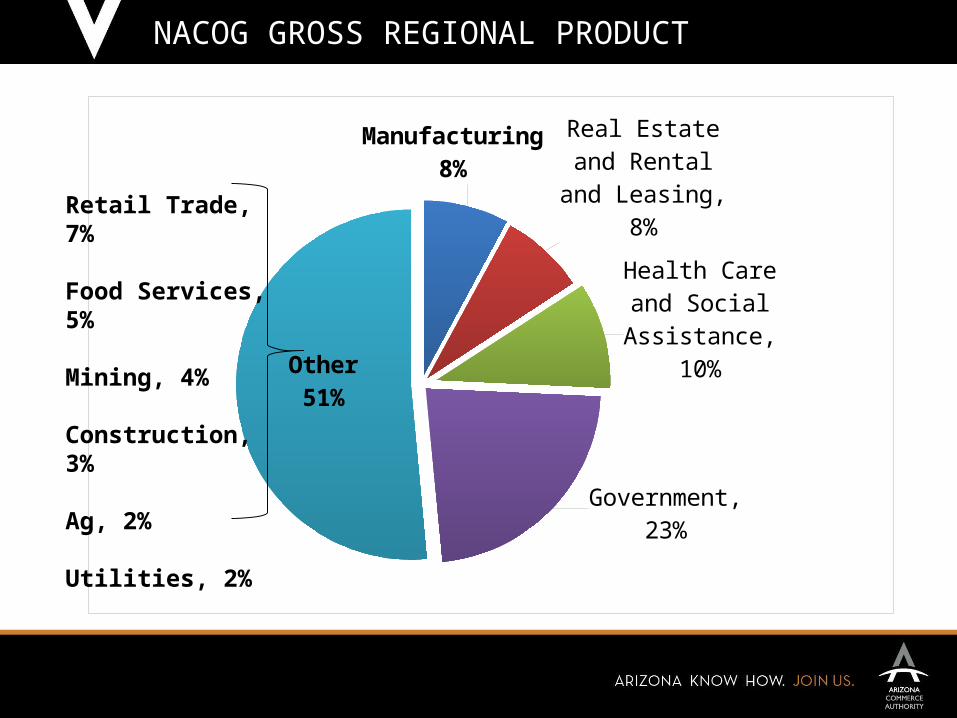
NACOG GROSS REGIONAL PRODUCT
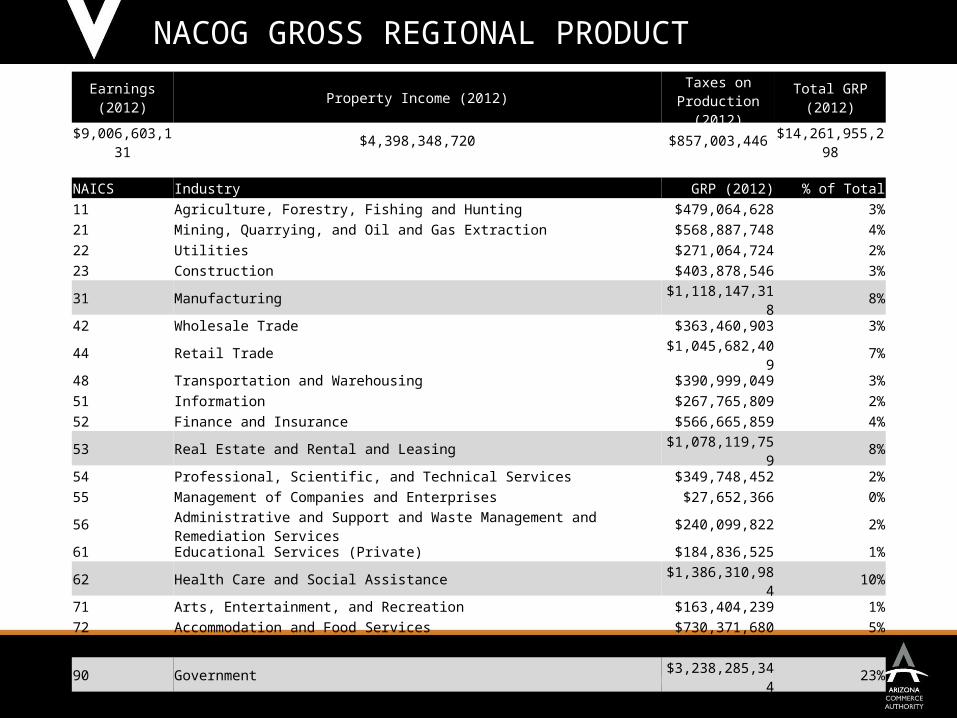
Earnings (2012) Property Income (2012) Taxes on Production (2012) Total GRP (2012)
$9,006,603,131 $4,398,348,720 $857,003,446 $14,261,955,298
NAICS Industry GRP (2012) % of Total
11 Agriculture, Forestry, Fishing and Hunting $479,064,628 3%
21 Mining, Quarrying, and Oil and Gas Extraction $568,887,748 4%
22 Utilities $271,064,724 2%
23 Construction $403,878,546 3%
31 Manufacturing $1,118,147,318 8%
42 Wholesale Trade $363,460,903 3%
44 Retail Trade $1,045,682,409 7%
48 Transportation and Warehousing $390,999,049 3%
51 Information $267,765,809 2%
52 Finance and Insurance $566,665,859 4%
53 Real Estate and Rental and Leasing $1,078,119,759 8%
54 Professional, Scientific, and Technical Services $349,748,452 2%
55 Management of Companies and Enterprises $27,652,366 0%
56 Administrative and Support and Waste Management and Remediation Services $240,099,822 2%
61 Educational Services (Private) $184,836,525 1%
62 Health Care and Social Assistance $1,386,310,984 10%
71 Arts, Entertainment, and Recreation $163,404,239 1%
72 Accommodation and Food Services $730,371,680 5%
81 Other Services (except Public Administration) $237,026,365 2%
90 Government $3,238,285,344 23%
Other non-industries $1,150,482,769 8%
NACOG GROSS REGIONAL PRODUCT
Manufacturing8% Real Estate and
Rental and Leas-ing, 8%
Health Care and Social Assis-tance, 10%
Government, 23%
Other51%
Retail Trade, 7%
Food Services, 5%
Mining, 4%
Construction, 3%
Ag, 2%
Utilities, 2%
65 to 69 years 29,925 34,903 4,978 17%60 to 64 years 36,765 40,117 3,352 9%70 to 74 years 23,005 25,798 2,793 12%25 to 29 years 29,073 30,966 1,893 7%75 to 79 years 15,881 17,744 1,863 12%55 to 59 years 37,494 38,666 1,172 3%30 to 34 years 27,167 28,336 1,169 4%20 to 24 years 39,877 40,879 1,002 3%Under 5 years 33,520 34,304 784 2%35 to 39 years 26,174 26,794 620 2%85 years and over 9,542 10,160 618 6%80 to 84 years 11,071 11,532 461 4%10 to 14 years 35,282 35,739 457 1%5 to 9 years 33,835 34,142 307 1%40 to 44 years 28,171 27,101 (1,070) (4%)50 to 54 years 36,869 35,458 (1,411) (4%)45 to 49 years 32,425 30,361 (2,064) (6%)15 to 19 years 40,115 36,784 (3,331) (8%)
Total 526,190 539,784 13,594 3%
Focus on Manufacturing
Bolster the manufacturing base via NAMP
Insist on education curriculum consistent with what industry needs
Support JTEDS
Leverage supply chain with industry
Focus on rural infrastructure, including broadband

Focus on Manufacturing cont.
Focus on rural infrastructure (incl. broadband)
Upgrades to existing systems Extensions to add supply of employment use property Be prepared-have all pre-work completed Get creative with construction funding


![ARIZONA’S NEXT CENTURY: A STRATEGIC VISION FOR … · January 2014 [ARIZONA’S NEXT CENTU RY: A STRATEGIC VISION FOR WATER SUPPLY SUSTAINABILITY] 9 EXECUTIVE SUMMARY Arizona’s](https://static.documents.pub/doc/80x56/5b1861b57f8b9a37258bd992/arizonas-next-century-a-strategic-vision-for-january-2014-arizonas-next.jpg)


