The Impact of the ACA’s Extension of Coverage to Dependents on Young Adults’ Access to Care Catalina Amuedo-Dorantes † San Diego State University Mehmet E. Yaya ‡ Eastern Michigan University September 13, 2013 Abstract We examine the impact of the ACA’s extension of coverage to dependents on that population’s uninsured rates and their access to care –as captured by their likelihood of delaying needed medical care or prescription medicines owing to their inability to afford them. Similarly, we explore how the federal mandate might have affected their ER use. Using micro-level data from the 2002 through 2011 waves of the National Health Interview Survey, we find that the federal mandates not only lowered the uninsured rates of young adults, but also facilitated their access to prescribed medicines they were unable to afford before. While the former effect took place across the board in all states, the federal mandate’s impact on young adults’ access to prescribed medicines has been concentrated in states with prior state-level mandates, possibly due to their experience in implementing and publicizing prior state-level mandates. † Professor of Economics, San Diego State University, Department of Economics, [email protected], (619) 594-1663. ‡ Assistant Professor of Economics, Eastern Michigan University, Department of Economics, [email protected], (734) 487-0007.
Transcript
The Impact of the ACA’s Extension of Coverage to Dependents on Young Adults’ Access to Care
Catalina Amuedo-Dorantes† San Diego State University
Mehmet E. Yaya‡
Eastern Michigan University
September 13, 2013
Abstract We examine the impact of the ACA’s extension of coverage to dependents on that population’s uninsured rates and their access to care –as captured by their likelihood of delaying needed medical care or prescription medicines owing to their inability to afford them. Similarly, we explore how the federal mandate might have affected their ER use. Using micro-level data from the 2002 through 2011 waves of the National Health Interview Survey, we find that the federal mandates not only lowered the uninsured rates of young adults, but also facilitated their access to prescribed medicines they were unable to afford before. While the former effect took place across the board in all states, the federal mandate’s impact on young adults’ access to prescribed medicines has been concentrated in states with prior state-level mandates, possibly due to their experience in implementing and publicizing prior state-level mandates.
† Professor of Economics, San Diego State University, Department of Economics, [email protected], (619) 594-1663. ‡ Assistant Professor of Economics, Eastern Michigan University, Department of Economics, [email protected], (734) 487-0007.
The Patient Protection and Affordable Care Act (ACA) signed into law by the
President on March 23, 2010 is expected to extend coverage to thirty-two million Americans
by 2018 (Williams et al. 2010). One group of beneficiaries is young adults ages 19-25. Until
recently, health plans could remove enrolled children usually at age 19, sometimes older for
full-time students, depending on the state (Monheit et al. 2011, Levine et al. 2011). As a
result, young adults have traditionally been the ones who are more likely to lack health
insurance. For example, 28.6 percent of young adults ages 18-24 lacked coverage in 2008
relative to less than a tenth of children under age 18 (DeNavas-Walt, Proctor and Smith 2009,
Gius 2010). As noted by Merluzzi and Nairn (1999), lack of insurance has important
consequences for access to health care, preventive care and, consequently, the future health
of this population.1
Antwi et al. (2012) and Depew (2012) examine the impact of the new federal mandate
in expanding coverage to young adults and find that the rate of young adults with health
insurance rises through the extended dependent coverage. Yet, despite the importance of
health insurance in accessing care (Nicholson et al. 2009) and the fact that young adults are
three to four times more likely to forgo needed care due to costs than their insured peers
(Callahan and Cooper 2005, Nicholson et al. 2009), we still lack an understanding of how
this new federal mandate is impacting the access to needed care and prescription medicines
by this population. Additionally, even though up to 26 percent of 18 and 19 years old
respondents reported receiving emergency department care in the last 12 months between
2005 and 2007 (Anderson et al. 2010), we still do not know if increased health insurance
rates are helping to lower young adults’ usage of emergency care –perhaps the most
expensive form of medical assistance. In this paper, we address that gap in the literature by
1 For instance, Merluzzi and Nairn (1999) argue that the lack of coverage is likely to compromise their future health by raising the rate of untreated obesity, tobacco, alcohol and other problems.
1
addressing the following questions: Is the ACA’s expansion of dependent coverage reducing
the share of young adults forgoing needed medical care or prescription medicines due to their
cost? And, related to that point, is it reducing their usage of emergency care?
To answer the aforementioned questions, we combine micro-level data from the 2002
through 2011 Household, Person, Family and Sample Adult Files of the National Health
Interview Survey (NHIS), and state-level data on the implementation of adult dependent
coverage expansions from the National Conference of State Legislatures (NCSL). We then
examine separately for two different types of states –namely states that had allowed for adult
coverage expansions prior to ACA and states that did not, changes in the access to needed
care, prescription medicines and emergency room (ER) use of age-eligible relative to that of
non-age eligible young adults before and after the ACA. As the literature examining the
impact of the new federal mandate on health care insurance coverage rates (Antwi et al.
2012, Depew 2012), we compare age-eligible young adults (those 19 to 25 years of age) to
young adults 26 to 29 years of age; although in subsequent falsification tests, we assess the
robustness of our findings to the choice of alternative age groups.
Overall, the analysis is timely and provides a new look into how the ACA’s expansion
of dependent coverage might have impacted the share of young adults forgoing needed
medical care or prescription medicines due to their cost, as well as their usage of emergency
care. Although previous researchers have looked at how state and, more recently, the federal
mandate expanding dependent coverage have affected the health insurance status of young
adults (Gius 2010, Monheit et al. 2011, Levine et al. 2011, Antwi et al. 2012, Depew 2012),
no study has yet examined the impact of the new federal mandate on young adults’ access to
needed medical care or prescriptions, or on their rates of usage of ER. These are all
important issues since they inform about the effectiveness of the ACA in facilitating the
access to needed medical care by young adults as it is being implemented.
2
II. State and Federal Expansions of Dependent Health Care Coverage
Due to unstable employment patterns, frequent job changes and part-time work,
young adults have traditionally exhibited low health insurance rates (Levy 2007). Since
January 1995, a number of states started to expand coverage to young adults (see Table 1).
The first state was Utah in 1995, followed by New Mexico in 2003. By June 2010, a total of
37 states had extended dependent coverage to young adults. Nevertheless, there was
substantial variability in the eligibility requirements. While the vast majority (a total of 30
states) did not require young adults to be students, most of them required them to be
unmarried and financially dependent on their parents (NCLS 2010). Levine et al. (2011) and
Monheit et al. (2011) exploit this variability in the extension of the age up until when young
adults can remain on their parents’ health insurance plan across states and time to examine
the impact of state-level mandates on the health insurance status of young adults between
2000 and 2008-2009. The authors conclude that state policies had a small to no impact on
young adult uninsured rates. They also hypothesize that the result may be due to a reduction
of young adult coverage through employer-sponsored insurance (ESI) or public insurance.
[TABLE 1]
After September 23, 2010, one of the provisions in the ACA required health plans to
cover children up to age 26, regardless of their marital status, residency with parents, student
or financial dependency. The provision applies to all health insurance plans created after the
enactment of the law on March 23, 2010. With all other pre-existing plans, young adults
qualify for dependent coverage if they are not eligible for employer-based health insurance
coverage themselves up until 2014, when even this exception disappears. Antwi et al. (2012)
and Depew (2012) examine the impact of the federal mandate in expanding coverage to
young adults, as well as on their labor supply patterns. Their analysis is of interest since the
ACA’s dependent coverage provision supersedes the Employee Retirement Income Security
3
Act’s preemption of large, self-insured firms from state-level dependent coverage
expansions.2 Therefore, the drop in ESI among young adults hypothetically responsible for
the apparent lack of impact of state-level mandates on young adult uninsured rates might not
be observed in the case of the federal mandate. Still, while both Antwi et al. (2012) and
Depew (2012) find that the rate of young adults with health insurance rises through the
extended dependent coverage, Antwi et al. (2012) note that, just as with the state-level
mandates, the share with individually purchased insurance or ESI decreases.
Yet, we still lack an understanding of how the new federal mandate is impacting
access to needed medical care and prescription medicines by young adults. Related to this
point, we also do not know how it may be impacting their emergency care use. Learning
about the latter is of interest given the higher rate of emergency care usage by young adults
relative to middle-age adults (Anderson et al. 2010), and the evidence on the uninsured being
more likely to seek care in the emergency department than the insured (Kwack et al. 2004).
The latter is problematic not only due to emergency care being a costly form of care, but also
because it may contribute to emergency room crowding by patients potentially not needing
emergency care (Abelson 2008, Newton et al. 2008). Anderson et al. (2010) explore how the
lack of health insurance due to the aging out for their parents’ insurance impacts the number
of visits to emergency departments and inpatient hospital admissions of young adults.3
However, they do not assess the specific impact of the ACA’s provision. We do so with an
analysis of how the new federal mandate is impacting young adults’ access to needed medical
assistance, prescription medicines, or their usage of emergency department care.
2 As noted by Monheit et al. (2010), state laws did not apply to large, self-funded employer benefit programs due to their exemption from state regulations under a provision of the 1974 Employee Retirement Income Security Act (ERISA). Such an exemption may have likely limited the reach of the state-level mandates because many large employers offer self-funded health benefits. According to the authors, data from the Medical Expenditures Panel Survey for 2009 reveal that 56.1% of private sector workers enrolled in an ESI were in a self-insured plan. That figure reached 82.9% in establishments of more than 1,000 workers. 3 Other researchers examine how Medicaid expansions impacted inpatient hospitalizations (Dafny and Gruber 2005) or how Medicare affects health care consumption (e.g. Card et al. 2008, 2009). However, as noted by Anderson et al. (2010), most of the individuals affected by such programs were not previously uninsured and a very small share of them is young adults.
4
III. Methodology
Our primary aim is to evaluate the impact of the ACA’s expanded dependent
coverage on access to needed care, prescription medicines and emergency care of young
adults. To address that purpose, we estimate the following difference-in-difference (DD)
where , i=1…n individuals, s=state, and t=year. Yist indicates whether individual
i in state s has delayed the needed care or prescription medicines at time t and, in alternative
specifications, the number of times the emergency room was used in the past year.
Additionally, with the purpose of assessing our model, we look at the impact of the ACA’s
expanded dependent coverage on the likelihood of being uninsured of young adults –a topic
previously examined by the literature. In that manner, we are able to compare our findings to
those of previous studies and, thus, partially assess the reliability of our modeling. Postt is an
indicator equal to 1 for observations collected after October 2010 and 0 otherwise. In the
latter group, we thus have individuals interviewed in February-March 2011. TGi is a dummy
variable equal to 1 for eligible youth under the ACA’s expanded dependent coverage (i.e. 19
to 25 years of age). At this point, it is worth noting that some of these young adults might
have already been insured through their parents and enjoyed access to care if they resided in
states that allowed for expanded dependent coverage and fulfilled the individual state’s
requirements. As such, we are overstating the size of the treated group.4 Note, however, that
to the extent that some of the young adults in our treated group might have already enjoyed
health care coverage through their parents, they might not have experienced much of a
4 In theory, we could identify which youth were, at a prior point in time, eligible for expanded coverage under a state-level mandate if we had information on their full-time student status and on whether they were financially dependent on their parents. Unfortunately, we lack data on such details which, unlike age, would also be endogenous to the outcome being examined.
5
change in their access to care after the introduction of the ACA’s mandate, thus
underestimating the true impact of the federal mandate on access to care.
The vector Xist includes a variety of individual level characteristics known to
influence health care access, such as age, gender, race, ethnicity, foreign-born status, marital
status, household head status, family size, educational attainment, work experience, family’s
income to poverty ratio and, whether the young adult need help or have any disability.
Likewise, the vector Zst includes a variety of state-level controls capturing the state’s
economic, demographic, political and regulatory environment, such as the state’s
unemployment rate, its share of young adults, its share of college graduates and whether the
state has a democratic governor and legislature. Perhaps most importantly, the vector Zst
includes information for whether the state in question had adult coverage expansions in place
prior to the ACA. Specifically, we control for the time passed since the enactment of such
adult coverage expansions, when present, as well as that term squared. Finally, equation (1)
also includes a battery of state fixed-effects, time fixed-effects, and state-level time trends
intended to capture idiosyncratic state-level characteristics, economy-wide shocks and time-
varying economic conditions at the state level.
For simplicity, we estimate equation (1) as a linear regression model. Linear
probability models estimated for the first three outcomes –namely being uninsured, delaying
needed medical care in the past 12 months, and delaying prescribed medicines during the past
12 months, could yield predicted probabilities that fall outside the unit circle; however, they
impose fewer restrictions on the distribution of the error term and facilitate convergence
(Wooldridge 2008). Additionally, although the preferred specification for modeling that
dependent variable would be an ordered probit given that emergency room visits are
measured in an ordinal scale, the estimates from both models are qualitatively similar (Ferrer-
i-Carbonell and Frijters 2004). We cluster standard errors at the state level and perform a
6
variety of robustness checks, some of which include falsification tests altering the timing of
the policy at hand as well as the targeted group by the policy to check for the existence of
pre-trends possibly driving our findings.
IV. Data and Descriptive Statistics
For the purpose of our analysis, we combine micro-level data from the 2002 through
2011 Household, Person, Family and Sample Adult Files of the National Health Interview
Survey (NHIS), with state-level data on the implementation of adult dependent coverage
expansions from the National Conference of State Legislatures (NCSL).5 The state-level data
allow us to distinguish between states that had implemented some kind of adult coverage
expansion before ACA and states that had not –this information is crucial in identifying the
impact of ACA from that of previous state-level mandates. Additionally, we include a
variety of time-varying state-level characteristics possibly correlated to young adults’ access
to care, prescription medicines and emergency room use. The latter include data on the
states’ population, shares of young adults and shares of college graduates from the Census
Bureau, as well as data on the political party affiliation of the states’ governors from a couple
of online sources.6
To achieve our primary aim of evaluating the impact of the ACA’s expanded
dependent coverage on access to needed care and emergency care of young adults, we work
with a sample including young adults ages 19-29. Table 2 displays some key characteristics
of our sample by age eligibility pre- vs. post-ACA. Perhaps the main differences between
19-25 and 26-29 year-olds –our treatment and control groups– refer to the higher propensity
of the latter group to be married, have children and be household heads. Additionally, older
youth display, on average, about a half more year of education and roughly 1.3 more years of
5 http://www.ncsl.org/issues-research/health/dependent-health-coverage-state-implementation.aspx 6 I.e. uselectionatas.org and politico.com.
work experience than their younger counterparts. Therefore, we control for these
characteristics in the regression analysis.
[TABLE 2]
V. On the Various Impacts of the ACA’s Young Dependent Coverage
A) Main Findings
We next proceed to the estimation of equation (1) for the various outcomes object of
analysis. Table 3 displays the results from this exercise. We estimate various model
specifications in which we progressively add more controls. Our baseline specification only
includes the key regressors being shown, along with a constant term. We then add a variety
of individual level characteristics known to impact the outcomes object of study, such as age,
gender, race, ethnicity, foreign-born status, marital status, household head status, family size,
educational attainment, work experience, family’s income to poverty ratio and, whether the
young adult need help or have any disability. Subsequently, specification (3) adds
information on time-varying state-level characteristics potentially correlated to the outcomes
object of analysis, including the state’s share of 19-29 year-olds, share of college-educated
population, unemployment rate and its political affiliation. Importantly, we control for
whether the respondent resides in a state that had expanded the insurance coverage to young
adults prior to the ACA. Two variables –one indicative of the time passed since the
enactment of such an expansion, as well as its squared term, are included. Finally, the last
column reflects the difference-in-difference estimates after adding to the list of prior controls
state fixed-effects, year fixed-effects, state-specific and treatment group-specific time trends.
State-specific time trends are particularly important to account for diverging pre-trends in the
states object of analysis not addressed with the inclusion of time-varying state-level
characteristics and, yet, potentially responsible for differences in the outcomes being
examined. Likewise, the treatment group-specific time trend addresses a key assumption of
8
the DD analysis –namely the requirement of similar pre-treatment trends in treated and
control groups. That assumption is violated if differences between eligible and non-eligible
individuals are driving the enactment of the policy. To address that concern, in addition to
state-specific time trends, we include a trend interacted with the treatment group dummy to
capture any diverging trends between eligible and non-eligible individuals.
[TABLE 3]
The results in Table 3 confirm previous findings in the literature. For instance,
according to the figures in the last column of Table 3 (our most complete specification),
young adults 19-25 are, indeed, more likely than older youth to be uninsured by
approximately 4.9 percentage points. They are also 3.6 percentage points more likely to
delay needed medical care and 4.7 percentage points more likely to not be able to afford
prescribed medicines than their older counterparts. Of greater interest to us are the
difference-in-difference estimates of the impact of ACA on the examined insurance and
health care access outcomes. According to the figures in the last column of Table 3, the ACA
has lead to a statistically significant 7.7 percentage-point reduction in the share of uninsured
young adults. Our results are comparable to those reported by Antwi et al. (2012) and
Depew (2012), who report reductions in the share of uninsured young adults in the order of
9.5 to 12 percent. Furthermore, it has lowered the share of individuals that report not being
able to afford prescribed medicines by 3.5 percentage points. However, it does not appear to
have had a significant impact on their access to needed medical care or on their ER/ED visits
over the past 12 months. In sum, the estimates in Table 3 are suggestive of the effectiveness
of the ACA, as early as one year after its implementation, in increasing insurance rates
among the young and in facilitating their acquisition of prescribed medicines.
9
B) Robustness Checks
i. Heterogeneous Impacts by the Existence and Duration of a Prior State-level Mandate
Although the estimates in Table 3 already take into account the time length, if
applicable, during which prior adult coverage expansions might have been in place in the
state, such legislative efforts might have had spillover effects, possibly providing the
infrastructure for a quicker and more organized implementation of the broader adult coverage
expansion regulated in the ACA. If so, we should observe a differential impact of the new
federal legislation across the two groups of states. As we did when examining all states, we
first look for differences in the age-eligible and non-eligible youth groups pre- vs. post-ACA
in the two groups of states –namely states with prior adult insurance coverage expansions and
states without. As shown in Table 4, there are no significant differences across the age-
eligible youth in the two groups of states. Something similar can be said with regards to the
older youth. Nevertheless, there are some general state-level differences, such as a slightly
lower share of college-educated individuals and a marginally higher unemployment rate in
states without prior adult insurance coverage expansions relative to the rest. Therefore, we
re-estimate equation (1) –this time distinguishing according to whether or not the state had
expanded insurance coverage to adult youth prior to the ACA, while still controlling for the
time that prior adult coverage expansions might have been in place when applicable.
[TABLE 4]
According to the figures in the most complete specifications (columns 4 and 8) in
Table 5, the observed reductions in the share of uninsured youth and in the share young
adults delaying the purchase of prescribed medicines are greater in states that had expanded
adult youth coverage prior to the ACA. The share of young adults ages 19-25 without
insurance coverage in those states has dropped by 8.1 percentage points pre- vs. post-ACA,
10
and by 6.4 percentage-points in other states.7 Additionally, young adults ages 19-25 in states
with prior adult coverage expansions became 4.6 percentage points less likely to forgo
prescribed medicines owing to their cost pre- vs. post-ACA, while we find no significant
change for youth residing in other states.8 In sum, the federal mandate seems to have
lowered young adults’ uninsured rates across all types of states; even though its impact on
that group’s access to prescribed medicines appears to have been geographically restricted to
states that had previously allowed for adult youth coverage expansions. As noted earlier, this
might be due to the ability to more quickly implement any broader federal mandated
coverage expansions once they have gone through that process before.
[TABLE 5]
Alternatively, one might argue that the uncovered impacts in Table 5 are simply
capturing the impact of prior state-level adult youth coverage expansions as opposed to that
of the federal ACA. After all, its impact on young adults’ access to prescribed medicines is
null in states without prior alike provisions. To separate any “added” effect of the federal
ACA from that of previous state-level mandates in states adopting such young adult coverage
expansions in the past, we re-estimate equation (2) for the two outcomes for which ACA
appears to have had a significant impact. Specifically, we do so for states with prior young
adult expansions and add interaction terms between the time passed since the enactment of
the state-level mandate (and its squared term) and the ACA’s age-eligible or treatment group
as follows:
(2) ististsstististst
iststititist
tTGtZXTGTimeTime
TGTimeTimeTGPostTGPostY
εδφδργββ
βββββα
++++++++
++++++=
*
**2
72
6
54321
The coefficient 3β measures the total change in the outcome object of analysis pre-
vs. post-ACA experienced by age-eligible youth, relative to the change experienced by their
7 These two coefficients are, however, not statistically different from each other. 8 These two coefficients are statistically different from each other at a 5 percent level.
11
non-eligible counterparts during the same period. To the extent that our data expand up until
2011, 3β is capturing the change in the dependent variable among eligible youth during the
last year of our sample. In contrast, 5β (and 7β ) measure the yearly change (and its rate of
change) in the outcome object of analysis among age-eligible youth, relative to the average
yearly change experienced by their non-eligible counterparts. Therefore, and
(
β5 *Timest + β7 *Timest2 ) should allow for a comparison of the change in the outcome of
interest experienced by age-eligible youth pre- vs. post-ACA, to the change experienced over
the time period during which the state-level mandates were, on average, in place.
Table 6 displays the results from this exercise. Overall, it becomes clear that the
reductions in the share of uninsured young adults observed pre- vs. post-ACA were not
necessarily due to the enactment of previous state-level mandates. After all, the coefficients
on the interaction terms between age-eligible youth and the number of years during which a
state-level mandate has been in place are not distinguishable from zero. In a similar vein,
although previous mandates appeared to have contributed to the reduction in the share of
young adults delaying taking prescribed medicines due to their cost by as much as 4
percentage points, the ACA appears to still have had an impact in reducing the share of
young adults delaying taking prescribed medicines due to their cost.
[TABLE 6]
In sum, the results from Table 3 confirm the findings from previous studies regarding
the role of the federal mandate in lowering the share of uninsured youth anywhere between 6
and 8 percentage points. Additionally, the mandate improved the access to prescribed
medication by that at-risk population by 4 percentage points. And, while the figures in Table
5 reveal that some of these impacts were enjoyed by eligible youth in states with prior young
adult state-level provisions, the results from Table 6 uncover the significant, despite incipient,
12
role of the federal mandate in shaping the aforementioned outcomes even in states with prior
young adult mandates.
ii. Falsification Tests
In this section we perform a couple of falsification tests to further assess the validity
of our findings. First, we worry about the possibility that the found impacts in Table 3 might
have being the artifact of the age groups being compared. To address that concern, we carry
out a falsification test that compares, instead, the impact of the new federal mandate on two
groups of non-eligible young adults, such as: 26-27 and 28-29 individuals. If the results from
equation (1) are not the byproduct of the reference or control group being chosen, the new
DD estimate should be equal to zero. That is, indeed, the case in Panel A of Table 7, where
the placebo effects are shown to be null.
Second, we explore the possibility that the policy impacts in Table 3 might be
attributable to prior trends. To assess that possibility, we move forward the passage of the
ACA so that, instead of starting in the fourth quarter of 2010, it was falsely in place starting
in the first quarter of 2010. If the key findings in Table 3 were the byproduct of prior trends,
the new DD estimate should be different from zero. However, as shown in Panel B of Table
7, the placebo effects are not statistically different from zero.9
Summarizing, the impacts reported in Table 3 do not seem to be the byproduct of the
youth groups being compared or an artifact of pre-existing trends.
[TABLE 7]
VII. Summary and Conclusions
In this paper, we combine micro-level data from the 2002 through 2011 waves of the
National Health Interview Survey and state-level data on the implementation of adult
dependent coverage expansions from the National Conference of State Legislatures to
9 We find similar results when we change the timing of the policy to a much earlier date, such as 2007. Results are available from the authors.
13
evaluate the impact that the ACA’s extension of coverage to dependents might have had on
that population’s access to care. Specifically, we focus on the impact that the federal
mandate might have had in reducing young adults’ likelihood of delaying needed medical
care or prescription medicines owing to their inability to afford them. Similarly, we look at
how the federal mandate might have affected their ER use, if at all.
The analysis reveals that young adults appear to have benefited from the federal
mandate despite its short life. Specifically, the federal mandate, which reduced their
likelihood of being uninsured anywhere between 6 and 8 percentage points as pointed out by
previous studies, has also improved their access to care by reducing young adults’ propensity
to delay their intake of prescribed medicines by approximately 4 percentage points. These
effects are robust to a series of falsification tests altering the treatment group and the timing
of the policy.
However, distinguishing between states that had extended insurance coverage to
dependents prior to the enactment of the ACA and states that did not reveals that young
adults in all states did not enjoy them equally. While the federal mandate’s impact on young
adults’ insurance rates was rather broad, its impact on their access to prescribed medicines
has been concentrated in states with prior state-level mandates. At first, these findings make
us suspicious of the role played by the federal mandate as opposed to the one played by prior
state-level mandates in lowering uninsured rates and in improving access to prescribed
medication among young adults. Nevertheless, a closer look at that group of states reveals
that the federal mandate played a significant role in shaping health insurance coverage and
access to prescribed medicines by young adults in states with prior mandates.
In sum, despite its short life, the expansion of coverage to young adults mandated by
the ACA appears to have, not only lowered the uninsured rates among young adults, but also
facilitated their access to prescribed medicines they were unable to afford before. Possibly
14
due to their experience in implementing and publicizing prior state-level mandates, the
effects of the federal mandate have been primarily observed among young adults residing in
states with prior state-level mandates. Future evaluations of the impact that the federal
mandate might have on youth are called for as its implementation matures and its effect
possibly strengthens.
15
References
Abelson, R. 2008. “Uninsured Put a Strain on Hospitals”, The New York Times. Anderson, M., C. Dobkin, and T. Gross. 2010. “The Effect of Health Insurance Coverage on the Use of Medical Services” American Economic Journal: Economic Policy, forthcoming. Antwi, Yaa Akosa, A. S. Moriya, and K. Simon. 2012. “Effects of the Federal Policy to Insure Young Adults: Evidence from the 2010 Affordable Care Act Dependent Coverage Mandate”, NBER Working Paper No. 18200. Blewett L. A., P. J. Johnson, and A. L. Mach. 2010. “Immigrant Children’s access to Health Care: Differences by global region of Birth” Journal of Health Care for the Poor and Underserved, 2: 13–31. Buchmueller, T. C., A. T. Lo Sasso, I. Lurie, and S. Dolfin. 2007. “Immigrants and Employer-Sponsored Health Insurance” Health Services Research 42, 1p1 (2): 286-310. Buettgens, M., and M. A. Hall. 2011. “Who will be uninsured after health insurance reform?” Robert Wood Johnson Foundation. Callahan, S. T., and W. O. Cooper. 2005. “Un-insurance and Health Care Access among Young Adults in the United States.” Pediatrics 116(1): 88-95. Card, D., C. Dobkin, and N. Maestas. 2009. “Does Medicare Save Lives?” Quarterly Journal of Economics, 124(2): 597-636. Card, D., C. Dobkin, and N. Maestas. 2008. “The Impact of Nearly Universal Insurance Coverage on Health Care Utilization: Evidence from Medicare” American Economic Review 98(5): 2242-2258. Collins, S. R. and J. L. Nicholson. 2010. Realizing Health Reform’s Potential: Young Adults and the Affordable Care Act of 2010. New York: The Commonwealth Fund. Cunningham P.J., J. Hibbard and C. B. Gibbons. 2011. “Raising Low 'Patient Activation' Rates Among Hispanic Immigrants May Equal Expanded Coverage In Reducing Access Disparities” Health Affairs 30(10): 1888-1894. Dafny, L. and J. Gruber. 2005. “Public Insurance and Child Hospitalizations: Access and Efficiency Effects”, Journal of Public Economics 89: 109-129. DeNavas-Walt, C., B. D. Proctor, and J. C. Smith. 2009. “Income, poverty and health insurance coverage in the United States: 2008” U. S. Census Bureau, Current Populations Reports, P60-236, U.S. Government Printing Office: Washington, DC. Depew B. 2012. “Expanded Dependent Health Insurance Coverage and the Labor Supply of Young Adults: Outcomes from State Policies and the Affordable Care Act”, mimeo, University of Arizona.
Ferrer-i-Carbonell, A. and P. Frijters. 2004. “How Important is Methodology for the Estimates of the Determinants of Happiness?” The Economic Journal 114(497): 641-59. Gius, M. 2010. “Health Insurance and Young Adults: An Analysis Using the NLSY” Atlantic Economic Journal 38(3): 381-82. Hoover, G. A., W. Enders and D. G. Freeman. 2008. “Non-White Poverty and Macroeconomy: The Impact of Growth” The American Economic Review, 98(2): 398-402. Kwack, H. et al. 2004. “Effect of Managed Care on Emergency Department use in an Uninsured Population”, Annals of Emergency Medicine 43(2): 166-173. Levine, P. B., R. McKnight, and S. Heep. 2011. “How Effective Are Public Policies to Increase Health Insurance Coverage among Young Adults?” American Economic Journal: Economic Policy, 3(1): 129–56. Levy, H. 2007. “Health Insurance and the Transition to Adulthood” in The Price of Independence: The Economics of Early Adulthood, Sheldon Danziger and Cecilia Elena Rouse (Eds.), New York, NY: Russell Sage Foundation, pp. 84-106. Lofstrom, M., S. Bohn and S. Raphael. 2011. Lessons from the 2007 Legal Arizona Workers Act. Public Policy Institute, California. Merluzzi, T.V., and R.C. Nairn. 1999. “Adulthood and aging: Transitions in health and health cognitions” in Life-span perspectives on health and illness, T.L. Whitman, T.V. Merluzzi, & R. D. White (Eds.), Erlbaum: Hillsdale, New Jersey, pp.189-206. Monheit, A., J. Cantor, D. DeLia, and D. Belloff. 2011. “How Have State Policies to Expand Dependent Coverage Affected the Health Insurance Status of Young Adults?” Health Services Research 46(1, part II): 251–67. Newton, M. F. et al. 2008. “Uninsured Adults Presenting to U.S. Emergency Departments: Assumptions versus Data”. Journal of American Medical Association 300(16): 1914-1924. Nicholson, J. L., S. R. Collins, V. B. Mahato, E. Gould, C. Schoen, and S. D. Rustgi. 2009. Rite of Passage? Why Young Adults Become Uninsured and How New Policies Can Help, August 2009 Update. New York: The Commonwealth Fund Issue Brief. Orrenius, P. M. and M. Zavodny. 2010. “Mexican Immigrant Employment Outcomes over the Business Cycle.” The American Economic Review, 100(2): 316-320. Passel, J., and D. Cohn. 2010. U.S. Unauthorized Immigration Flows Are Down Sharply Since Mid‐Decade. Washington DC: Pew Hispanic Center. Pintor, L. and L. A. Blewett. 2011. “Immigrant access to health care: Fewer resources, less political will to provide safety net service” Minnesota Physician October: 22-23. Reschovsky, J. D., J. Hadley, and L. Nichols. 2007. Why do Hispanics have so little employer-sponsored health insurance? Inquiry 44, (3) (10): 257-279,
17
Rice, J. and M. E. Yaya. 2011. “Private Insurance Consumption of Immigrants in U.S.” Working Paper. Williams, D. R., M. B. McClellan, and A. M. Rivlin. 2010. “Beyond the Affordable Care Act: Achieving Real Improvements in Americans' Health” Health Affairs 29(8): 1481-1488. Wooldridge, Jeffrey M. 2008. Introductory Econometrics: A Modern Approach (4th ed.). Ohio: South-Western Cengage Learning. Zimmerman, C. 2011. “Undocumented Immigrants, Left Out of Health Reform, Likely to Continue to Grow as a Share of the Uninsured” Changes in Health Care Financing & Organization (HCFO), Findings Brief, Vol. XIV, No. 9.
18
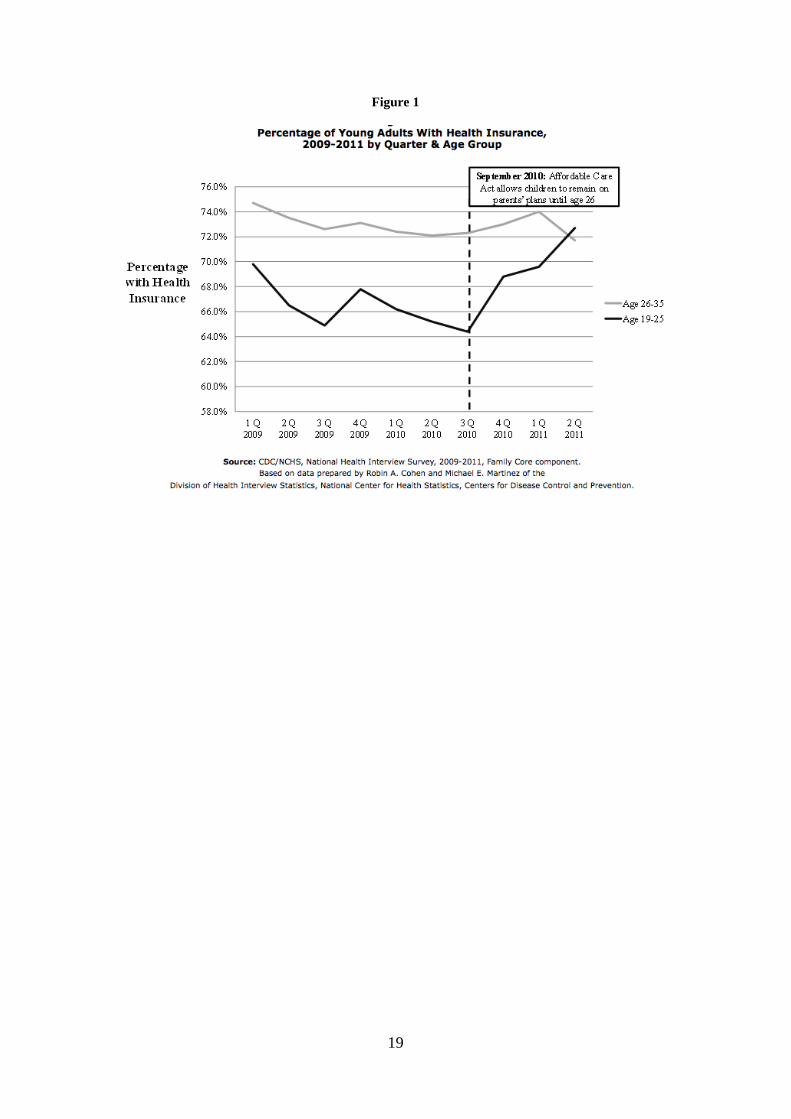
Figure 1
19
Table1: State Dependent Coverage Laws
Full Year Eligibility Criteria State Implementeda Maximum Age Student Not Married No Children
a Full Year Implemented is the first full calendar year the policy was implemented. Sources: National Conference of State Legislatures (NCSL) 2010; Nicholson et al. 2009; Levine et al. 2011; Monheit et al. 2011, Depew 2012 and our own readings of state laws.
20
Table 2: Descriptive Statistics Before and After ACA
Panel A: Treated Group, 19-25 By Treatment Date: Before ACA After ACA Mean SD Mean SD
Age 22.2561 0.0353 22.2834 0.0486 Female 0.5184 0.0053 0.5220 0.0106 White 0.7973 0.0047 0.7850 0.0079 Black 0.1372 0.0043 0.1331 0.0067 Hispanic 0.1289 0.0035 0.1424 0.0066 Immigrant 0.1080 0.0029 0.1045 0.0059 Married 0.1766 0.0046 0.1473 0.0084 Family Size 2.2492 0.0254 2.2869 0.0479 Household Head 0.5667 0.0053 0.5326 0.0117 Education 14.7460 0.0282 15.0085 0.0571 Physical Limitation 0.0470 0.0018 0.0441 0.0039 Need Help 0.0053 0.0006 0.0078 0.0017 Income to Poverty 7.3277 0.0889 7.1558 0.1411 Experience 1.3754 0.0185 1.3810 0.0340 State Population 11100000 186637 12400000 330161 Percentage Degree 27.1259 0.1097 27.7646 0.1790 Percentage Young 13.7086 0.0160 13.9139 0.0225 Republican Governor 0.5027 0.0099 0.5505 0.0177 Unemployment 0.0613 0.0004 0.0887 0.0008 Observations 20564 3576
Panel B: Control Group, All Youth 26-29 By Treatment Date: Before ACA After ACA Mean SD Mean SD
Age 27.5094 0.0114 27.5301 0.0242 Female 0.5229 0.0049 0.5042 0.0111 White 0.7863 0.0047 0.7842 0.0094 Black 0.1401 0.0039 0.1343 0.0079 Hispanic 0.1501 0.0036 0.1534 0.0067 Immigrant 0.1551 0.0037 0.1461 0.0079 Married 0.4089 0.0058 0.3766 0.0124 Family Size 2.5247 0.0177 2.5098 0.0370 Household Head 0.6750 0.0047 0.6612 0.0103 Education 15.4165 0.0361 15.6541 0.0630 Physical Limitation 0.0455 0.0020 0.0544 0.0048 Need Help 0.0061 0.0007 0.0111 0.0026 Income to Poverty 9.2370 0.0466 9.1826 0.1055 Experience 2.7088 0.0267 2.9235 0.0684 State Population 11800000 109005 13400000 246082 Percentage Degree 27.3679 0.0682 27.7386 0.1292 Percentage Young 13.7403 0.0130 13.9360 0.0225 Republican Governor 0.5147 0.0075 0.5386 0.0133 Unemployment 0.0627 0.0003 0.0905 0.0004 Observations 14151 2663
21
Table 3: Regression Based DD Estimates of the Impact of the ACA on the Following Outcomes
Notes: All regressions include a constant term, as well as age, gender, race, ethnicity, nativity, marital status, family size, experience, educational attainment, her/his family income to poverty ratio, whether the young adult has poor/fair health and whether the young adult is a household head.
22
Table 4: Descriptive Statistics Before and After ACA by Age-eligibility and by Group of States Panel A: Treated Group – All Youth 19-25
By Group of States: States w/o Adult Coverage Expansions Prior to ACA
States without Adult Coverage Expansions Prior to ACA
By Date: Pre-ACA Post-ACA Pre-ACA Post-ACA Mean SD Mean SD Mean SD Mean SD
Table 6: Distinguishing between the Impact of ACA and the Effect of Prior Young Adult Provisions
Key Regressors Uninsured Delayed Medication
Post-ACA -0.0200 0.0300 (0.0230) (0.0180) Young Adult 19-25 0.052*** 0.034*** (0.0180) (0.0130) Post-ACA*Young Adult 19-25 -0.069*** -0.061*** (0.0220) (0.0160) Number of Years since a State Young Adult Provision -0.0030 0.018** (0.0100) (0.0070) Number of Years since a State Young Adult Provision*Young Adult 19-25 0.0090 -0.016* (0.0130) (0.0090) Number of Years since a State Young Adult Provision Squared 0.0000 -0.002** (0.0020) (0.0010) Number of Years since a State Young Adult Provision Squared*Young Adult 19-25 -0.0010 0.002* (0.0020) (0.0010) Constant -2.088*** -0.649* (0.7380) (0.3430)