202
annual report 20 15 CULTIVATING GROWTH P 1

annu
al re
port 20
15CULTIVATING
GROWTH
6-A Muhammad Ali Housing Society, A Aziz Hashim Tabba StreetKarachi-75350, PakistanTel: +92-21-111-786-555, +92-21-37130123 l Fax: +92-21-34534302Email:[email protected]: www.lucky-cement.com
P 1

CULTIVATING GROWTH
For nearly two decades, Lucky Cement has accelerated towards driving positive change; a change that is rooted in our perennial commitment to boost the economic and infrastructural development of our country and elsewhere in the world.
On the cover of this year’s annual report, we celebrate the past and reiterate our dedication to the future; our agenda is to cultivate a greater opportunity of growth for everyone – that reflects our values and creates a pathway towards innovation and progress.
P 2

CONTENTSRoad to Success ............................................................. 02Vision and Mission ........................................................ 04Core Values .................................................................... 05Business Strategies ........................................................ 06Code of Conduct ............................................................ 07Company Information ................................................... 09Company at a Glance ..................................................... 10Competitive Edge .......................................................... 12Chairman’s Profile ......................................................... 14CEO’s Profile .................................................................. 16Board of Directors ......................................................... 18CEO’s Message ............................................................... 20Organogram................................................................... 22Senior Management ...................................................... 24Company Profile ............................................................ 26Group Profile ................................................................. 28Directors’ Report ........................................................... 30Six Years at a Glance ...................................................... 48Analysis of Balance Sheet .............................................. 49Analysis of Profit and Loss Account ............................... 50Financial Ratios .............................................................. 51Statement of Value Addition and Wealth Distribution .. 52Notes on Analysis .......................................................... 53Composition of Balance Sheet ...................................... 55DuPont Analysis ............................................................. 56Financials at a Glance .................................................... 57Share Price Sensitivity Analysis ..................................... 58Corporate Analysis......................................................... 59Roles of Chairman and CEO ........................................... 63Policies ........................................................................... 64
Report of the Audit Committee ..................................... 66Procedings of the last Annual General Meeting ............ 67Procedings of the last Extra Ordinary General Meeting .... 67Calendar of Major Events .............................................. 67Awards and Accolades ................................................... 68Human Resource Excellence .......................................... 70Safety & Health.............................................................. 72Sustainability ................................................................. 74Stakeholders’ Engagement ............................................ 84Statement of Compliance .............................................. 88Review Report to the Members .................................... 90Auditors’ Report to the Members ................................. 91Balance Sheet ................................................................ 92Profit and Loss Account ................................................. 93Cash Flow Statement ..................................................... 94Statement of Changes in Equity .................................... 95Notes to the Financial Statements ................................ 96Auditors’ Report on Consolidated Financial Statements ............................. 129Consolidated Balance Sheet ........................................ 130Consolidated Profit and Loss Account ......................... 131Consolidated Cash Flow Statement ............................. 132Consolidated Statement of Changes in Equity ............ 133Notes to the Consolidated Financial Statements ........ 134Pattern of Shareholding ............................................... 182Notice of 22nd Annual General Meeting ...................... 189Form of Proxy .............................................................. 191Dividend Mandate ....................................................... 193Glossary ....................................................................... 195Jama Punji Information ............................................... 196
P 01
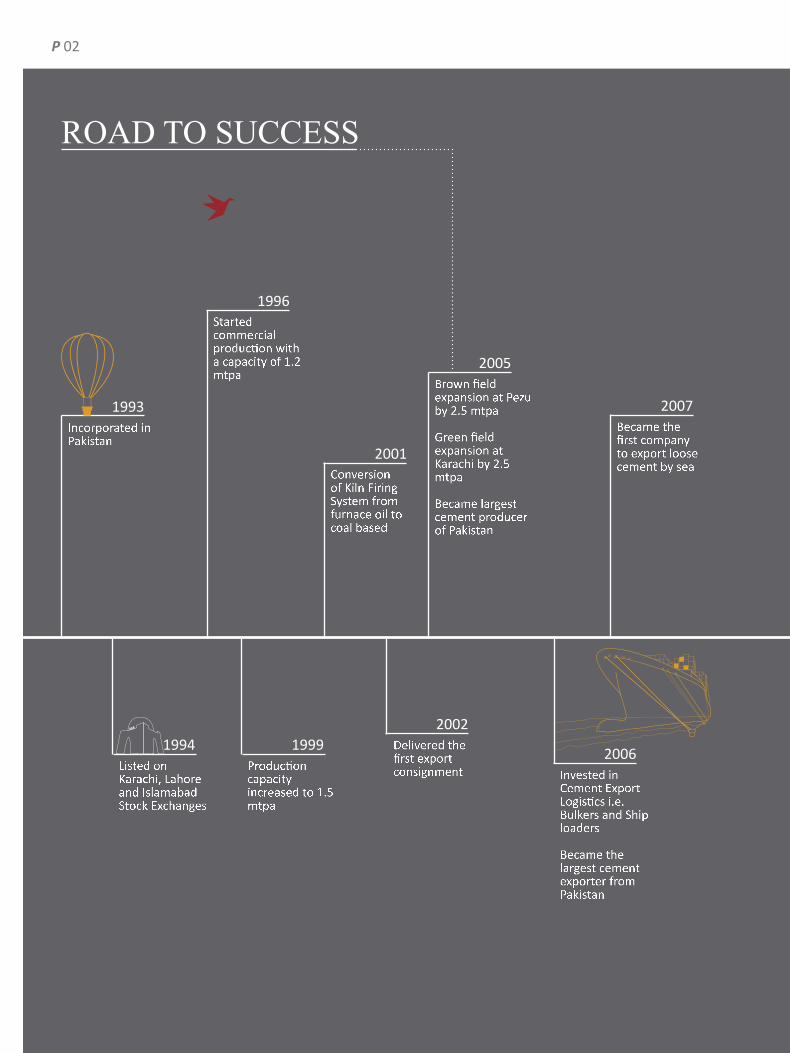
Incorporated in Pakistan
Brown field expansion at Pezu by 2.5 mtpa
Green field expansion at Karachi by 2.5 mtpa
Became largest cement producer of Pakistan
Became the first company to export loose cement by sea
Started commercial production with a capacity of 1.2 mtpa
Conversion of Kiln Firing System from furnace oil to coal based
Listed on Karachi, Lahore and Islamabad Stock Exchanges
Production capacity increased to 1.5 mtpa
Delivered the first export consignment Invested in
Cement Export Logistics i.e. Bulkers and Ship loaders
Became the largest cement exporter from Pakistan
1993
2005
2007
1996
2001
1994 19992002
2006
ROAD TO SUCCESS
P 02

Installed vertical grinding mills at the Karachi Plant
Started operations of 5 MW WHR at Karachi Power Plant
Started commercial operations of cement grinding plant in Iraq
Initiated 5MW Waste Heat Recovery Project at Karachi Power Plant
Initiated a 1 x 660 MW Coal Fuel Power Project in Karachi, Pakistan
Became the only Pakistani Company to be listed in Forbes ‘Asia‘s 200 Best Under a Billion’ list
Set up its own cement storage facility at Karachi Port Conversion of Furnace Oil Power Generation Engines to Dual Fuel Engines
Got listed on London Stock Exchange and became the first Cement company in Pakistan to issue GDRs
2015
2014
2008
Brown Field expansion at Karachi Plant by another 1.2 mtpa
2009
Invested in Waste Heat Recovery Project at both Karachi and Pezu Cement Plants
Further invested on Logistics on multi-purpose trailers
2010
Started selling electricity to HESCO
Signed LOI for supply of electricity to PESCO
Signed a joint venture agreement for cement grinding plant in Iraq
Acquired ICI Pakistan Limited
2012
Invested in Tyre Derived Fuel (TDF) Plant to use alternative fuels
Signed a joint venture agreement for setting up of cement plant in DR Congo
2011
Became the first Pakistani Company to receive A+ rating from the Global Reporting Initiative
2013
P 03

VISION
MISSION
We envision being the leader of the cement industry in Pakistan, identifying and capitalizing on new opportunities in the global market, contributing towards industrial progress and sustainable future, while being responsible corporate citizens.
Our mission is to be a premium cement manufacturer by building a professional organization, having state-of-the-art technology, identify-ing new prospects to reach globally and maintain service and quality standards to cater to the international construction needs with an environment-friendly approach.
P 04

CORE VALUESCUSTOMER FOCUSED
• Quality and Consistency• Commitment• Customer satisfaction• Fair Practices
SOCIAL RESPONSIBILITY
• Sustainable Development• Philanthropy• Community Development• Environmentally Conscious
INNOVATION
• Creative Solution• Modernization• Setting Trends
ETHICS AND INTEGRITY
• Prestige• Honesty• Uprightness• Reliability
ENTREPRENEURSHIP
• Sense of Ownership• Loyalty• Identifying and Capitalizing on Opportunities• Foresightedness• Proactive Approach• Value Addition and Creation• Business Oriented
EXCELLENCE
• Benchmark Practices• Continuous Improvement• Efficient and Effective Performance
P 05

1. Holding and growing local market share Further reinforcing our strength is what we keep in focus when designing our business strategies for the local
market.
2. Increasingourshareintheinternationalmarket Broadening our horizons, we have engaged our resources to the unconventional markets to become
accessible to the construction industry worldwide.
3. Efficiency(intermsofcost,energyandresourceutilization) Efficiency is reflected in all our business approaches, giving us an edge over our competitors in cost and
energy, by the skillful utilization of resources.
4. SustainableDevelopment(Intermsofenvironmentalandsocialresponsibility) We believe in giving back to the communities we operate in and to the society at large. We endeavor to
stimulate environmental awareness among the stakeholders and have a broad vision for the sustainable
world.
5. HR Excellence We believe in people development. Our Human Resource is our asset and an important factor in our success.
Our Intellectual Capital provides a framework that serves as a guiding force for the organization as a whole.
BUSINESS STRATEGIES
P 06

CODE OF CONDUCTIt is the fundamental policy of Lucky Cement Limited to conduct its business with honesty, integrity and in accordance with the highest ethical and legal standards. This Code is intended to provide guidance to all stake holders and applies to all Board Members, Senior Management and Employees of the Company.
PROTECTION OF PRIVACY AND CONFIDENTIALITYLucky Cement commends all its employees for keeping the exclusivity of Company’s trade secrets and personal information acquired during and after performance of their employment. Lucky Cement employees should also respect the rights of other competitors and their confidential information.
However, the Board Members and Sr. Management can disclose information as part of public domain at the time of disclosure by decision of the board/required to be disclosed in accordance with applicable laws.
CONFLICTS OF INTERESTS All Lucky Cement employees are expected not to be engaged in activities that are a subject matter of conflict of interests between their personal interests and with the interests of the Company.
Employees are expected to be honest and ethical in dealing with each other, with customers, suppliers, dealers, vendors and contractors in order to avoid compromises on the ability of transacting business on competitive basis or influence decisions to be made by the Company if any relative is a supplier or competes with the company in any manner, thereof. All Lucky Cement employees shall avoid conducting business with:
I. A relative,
II. A Private Limited Company in which he is a member or his relative is a Director,
III. A Public Limited Company, in which he or his relative(s) holds 2% or more shares or voting right; and
IV. A firm in which a relative is a partner, except with the prior approval of the CEO, and shall make proper disclosure of related party transactions.
ANTI-BRIBERY/CORRUPTION Lucky Cement employees shall not be engaged in bribery or corruption in conducting the Company’s business.
Employees must not involve in money laundering or financing of terrorism and shall not be part of any dealings with any person who is engaged or is on any sanctioned lists or practice, is subject
CORPORATE GOVERNANCE PRACTICESAll Lucky Cement employees are required to maintain and help the Company in maintaining highest degree of Corporate Governance practices.
NON-COMPLIANCEOFLAWSWe expect our employees to comply with the applicable laws and regulations. If anyone observes any kind of breaching of the law, or any areas of this code, in any area of operation should bring it under the supervisor’s notice.
We assure that no one will be subject to retaliation due to good faith communication of suspected misconduct.
TRANSACTION TRANSPARENCYLucky Cement ensures that true, fair and timely businesses transactions must be recorded by maintaining the accounting and financial reporting standards, as applicable to the company.
At the same time, authenticity and accuracy of the information must be assured.
REFRAIN FROM INSIDER TRADINGEmployees working at Lucky Cement are required to refrain from Insider Trading and shall comply with the Insider Trading Regulations as laid down by SECP.
SECONDARY EMPLOYMENT BY EMPLOYEESEmployees are expected to avoid indulging themselves in any business which consumes their time, efforts, and energy without approval of and disclosure to the Company’s management.
COMPANY ASSETS FORTIFICATIONAll employees are expected to be the guardian of the Company’s assets and should ensure its efficient use including tangible and intangible assets such as facilities, supplies, equipment, machinery, finished products, vehicles, company funds, company time, confidential information, intellectual property and information systems.
P 07

to any criminal or civil penalties related to narcotics trafficking or corruption, is politically exposed person or is engaged in any litigation or arbitral proceedings. This prohibition applies everywhere and under all circumstances.
EQUAL EMPLOYMENT OPPORTUNITYLucky Cement believes in providing equal opportunities to all its personnel. There is no discrimination of caste, religion, color, marital status, and gender at work. All the policies and practices are administered in a manner ensuring equal opportunity to the eligible candidates and all decisions are merit based.
HARASSMENTFREEWORKPLACELucky Cement strives to maintain a work environment that is free from harassment whether physical, verbal or psychological. Strict disciplinary action are taken against any person found in breach of such a rule.
BORROWINGMONEYBorrowing money from fellow colleagues or company business associates is strictly forbidden.
RECEIVINGOFGIFTS,PAYMENTSORFAVORSAll Lucky Cement employees should not receive any gifts, payments or favors, from customers or suppliers or any Company’s business associates if doing so might compromise, or appear to compromise their ability to make objective business decisions in the best interest of the Company.
However, if such a gift is received, the same will be submitted through the immediate supervisor to the Corporate Communication department for utilization of the same by the Company.
CORPORATE SOCIAL RESPONSIBILITY & HEALTH AND SAFETY MEASURESLucky Cement adheres to its CSR policy and does not compromise with health and safety measures in carring out its business.
MEDIA RELATIONS & INVOLVEMENTAll Lucky Cement employees should report and take written approval from the Corporate Communications department in order to have any contact with media in terms of acting, television appearances or writing an article for newspaper or magazine for representing the Company’s position in the industry and media.
BREACH OF IT SECURITYEmployees shall use computer resources only for business requirements and any breach of IT security protocol is prohibited.
PERSONAL USE OF TELEPHONES & COMPUTERSAll employees are expected to restrict their personal use of telephones and computers at the workplace towards urgent and unavoidable issues.
WHISTLEBLOWINGAll employees are advised to immediately report any improper, unethical or illegal conduct of any colleague or supervisor through assigned Whistle Blowing P.O BOX: 13018, Karachi, 75350 and Email address: [email protected]
P 08

BOARD OF DIRECTORS
Mr. Muhammad Yunus Tabba – Chairman Mrs. Rahila Aleem (Alternate: Mrs. Mariam Tabba Khan)
Mr. Muhammad Ali Tabba Mrs. Zulekha Tabba Maskatiya
Mr. Muhammad Sohail Tabba Mr. Muhammad Abid Ganatra
Mr. Jawed Yunus Tabba Mr. Tariq Iqbal Khan
ChiefExecutive Mr. Muhammad Ali Tabba
ExecutiveDirectors Mr. Noman HasanMr. Muhammad Faisal (Chief Strategy, Finance & Investment Officer )
ChiefOperatingOfficer Mr. Amin Ganny
CompanySecretary Mr. Fayyaz Abdul Ghaffar
BOARD COMMITTEES
AuditCommittee HumanResourceandRemunerationCommittee
• Mr. Tariq Iqbal Khan-Chairman• Mr. Muhammad Ali Tabba• Mr. Muhammad Sohail Tabba• Mr. Jawed Yunus Tabba• Mrs. Zulekha Tabba Maskatiya• Mr. Muhammad Abid Ganatra
• Mrs. Rahila Aleem-Chairperson (Alternate: Mrs. Mariam Tabba Khan)• Mr. Muhammad Ali Tabba• Mr. Muhammad Sohail Tabba• Mr. Jawed Yunus Tabba• Mrs. Zulekha Tabba Maskatiya
BudgetCommittee CorporateGovernanceCommittee
• Mr. Muhammad Sohail Tabba-Chairman• Mr. Muhammad Ali Tabba• Mr. Jawed Yunus Tabba• Mr. Muhammad Abid Ganatra
• Mr. Jawed Yunus Tabba -Chairman• Mr. Muhammad Abid Ganatra• Mrs. Rahila Aleem (Alternate: Mrs. Mariam Tabba Khan)
BANKERS
• Allied Bank Limited • Habib Metropolitan Bank Limited
• Askari Bank Limited • MCB Bank Limited
• Bank Alfalah Limited • Meezan Bank Limited
• Bank AL-Habib Limited • National Bank of Pakistan
• Barclays Bank Plc, Pakistan • NIB Bank Limited
• Citibank N.A. • Standard Chartered Bank (Pakistan) Limited
• Dubai Islamic Bank Pakistan Limited • Summit Bank Limited
• Habib Bank Limited • United Bank Limited
AUDITORS
External Auditors Cost Auditors
M/s Ernst & Young Ford Rhodes Sidat Hyder, Chartered Accountants(A member firm of Ernst & Young Global Limited)
M/s. KPMG Taseer Hadi & Co. Chartered Accountants
REGISTERED OFFICE HEAD OFFICE
Main Indus Highway, Pezu, District Lakki Marwat, Khyber Pakhtunkhwa, Pakistan
6-A, Muhammad Ali Housing Society,A.Aziz Hashim Tabba Street, Karachi – 75350UAN: (021) 111-786-555Website: www.lucky-cement.comEmail: [email protected]
PRODUCTION FACILITIES SHAREREGISTRAR/TRANSFERAGENT
1. Main Indus Highway, Pezu, District Lakki Marwat, Khyber Pakhtunkhwa, Pakistan
2. 58 Kilometers on Main Super Highway, Gadap Town, Karachi, Pakistan
Central Depository Company of Pakistan LimitedCDC House, 99-B, Block-B, S.M.C.H.SMain Shahra-e-Faisal, Karachi, Pakistan(Toll Free): 0800 23275
COMPANY INFORMATION
P 09

LuckySulphateResistantCement:
Developed specially for use along shore
lines and canal linings, Lucky SRC sells
across entire Pakistan.
LuckyBlockCement: Developed specially
for block makers with quick setting time,
Lucky Block Cement is an OPC product
which sells primarily in the Karachi market.
LuckyRaj:In order to attract the price
conscious consumer, Lucky Raj is an OPC
product introduced in Karachi markets.
CORE BRANDS
Lucky Cement aims at producing cement to suit every user. The company is producing different variations of Ordinary
Portland Cement and Sulphate Resistant Cement to meet needs of a wide range of customers. The following cement brands
are available domestically:
COMPANY AT A GLANCELucky Cement Limited is Pakistan’s premium cement manufacturer in terms of consistent quality, customer satisfaction, state-of-the-art technology and low production costs. With plants in Pakistan and Iraq and expansion plans in Africa, Lucky Cement’s customer base extends across continents.
LuckyCement(Regular): Lucky Cement
Regular is our OPC brand and sells primarily
in the North region markets of Pakistan.
LuckyStar: Lucky Star is our OPC brand
which sells primarily in the South region
markets of Pakistan.
LuckyGold:Lucky Gold is our OPC brand
which was introduced to penetrate into the
Faisalabad market, and sells primarily in
Faisalabad and surrounding areas.
P 10

LOCALANDINTERNATIONALMARKETSThe Company has a well-established distribution network
in Pakistan, making quality products of Lucky Cement
available from Karachi to Kashmir and from Gwadar to
Gilgit.
In addition to the local market, the Company has also
successfully established a well-diversified export market to
mitigate the risk of shortfall in local sales. Our high quality
cement has been exported in countries across Asia and
Africa over the years.
Our brands are well recognized and known as high quality
products amongst customers.
QUALITY ASSURANCE OF PRODUCTSLucky Cement’s product portfolio complies with a range
of standards, depending upon the geographical territory
where these are being sold. We use advance equipment
like Distributed Control System (DCS), Programmable Logic
Controllers (PLCs) and on-line X-Ray Analyzers to ensure
that the product quality is consistent. We also have one of
the best equipped laboratories, with facilities for analysis
of fuel and raw material which ensures the supply of high
quality product to the market.
Lucky Cement has been accredited by the following
international bureaus of standards over the years:
• Bureau of Indian Standards
• Kenya Bureau of Standards
• Sri Lankan Standard Institute
• Standards Organization of Nigeria
• South African Bureau of Standards
• Tanzania Bureau of Standards
Furthermore, in compliance with the South African and
Kenyan standards, a safety notice is also embossed on the
packaging of Lucky Cement’s international products.
P 11

COMPETITIVE EDGEGLOBAL PRESENCELucky Cement Limited, in line with its strategic objective
of pursuing market share growth in both local and
international markets; is the only Pakistani cement
manufacturer having a production foot-print outside
Pakistan. Lucky Cement currently has a Cement Grinding
Plant in Basra, Iraq; which is successfully operating since
February 2014. Further Lucky Cement is also currently
working on a Project to install a fully integrated cement
plant in Democratic Republic of Congo which is expected
to have commercial operations by October, 2016. The
company is constantly exploring business development
opportunities both in the domestic and international
landscape.
SAP ERP SYSTEMPursuing its core-values of innovation and excellence, Lucky
Cement is in the process of implementing full-scale SAP
on HANA database. Lucky Cement will be one of the first
cement companies in Pakistan to implement SAP and it will
prove to be a significant step towards excellence.
Lucky Cement’s mission is to adopt state-of-the-art
information technology infrastructure and ERP system to
support its domestic growth as well as global expansions
and business diversification. The implementation of SAP
will further support Lucky Cement to not only strengthen
integration of its operations and investments but also bring
about more efficiency to the given processes and value
addition for all the stakeholders.
ENERGY EFFICIENCY AND REDUCTION OF CO2
Energy efficiency has proven to be a lucrative and proficient
way to guarantee a sustainable future. Lucky Cement
pioneered the concept of energy conservation and use
of alternate fuel in the cement industry of Pakistan. The
Company has taken numerous initiatives for energy saving,
starting with fuel conversion of all its power generation
units from furnace oil to natural gas which eventually
not only reduced Company’s carbon footprint but also
decreased the cost of production. The Company further
reduced CO2 emissions by introducing Waste Heat Recovery
systems at its plants. WHR system encapsulates all the
wasted heat (which was previously being released in
the atmosphere) from the production line and uses it to
generate electricity which conserves energy and increases
process efficiency. By virtue of WHR plant the estimated
reduction in CO2 emissions at Karachi plant is 50,000 metric
tons and 29,918 metric tons at Pezu plant.
Lucky Cement has also taken another step forward with the
use of alternate energy by supplementing its manufacturing
line with Tyre Derived Fuel (TDF). By allocating resources
into TDF project, Lucky Cement is able to curb fossil fuel
cost along with paving a greener pathway by drastically
curtailing the carbon emissions. Burning shredded tyres
contains the same amount of energy as oil and 25% more
energy than coal. In the long term this implies that for each
ton of the utilized TDF we are replacing the deteriorating
impact of 1.25 tons of coal and decreasing carbon
emissions by 19%.
Besides using shredded tyres as a source of alternative fuel,
Lucky Cement is also utilizing fuels from rice husk, chickpea
and bagasse through its Refused Derived Fuel (RDF) project.
Through all such energy efficient innovations we are
now generating green energy which has surpassed our
production needs and hence, now being sold to the
National Grid (Hyderabad Electric Supply Company) with
zero interruption.
ECONOMIES OF SCALELucky Cement has an edge over its competition and
sustains overhead cost due to lower fixed-cost per ton.
Our operational processes cost are constantly reviewed to
increase efficiency and reduce cost.
LOGISTICSTERMINALATKARACHIPORTLucky Cement is the first and only cement Company that
has its own state-of-the-art infrastructure and logistics
terminal at Karachi Port. The Company runs a fleet of
specially designed cement bulkers that carry loose cement
from Karachi Plant to the terminal on the port. These
bulkers are equipped with a unique compression system
and are capable of carrying up to 75 tons of cement.
P 12

ADVANCED QUALITY CONTROLOur highly advanced quality control system guarantees
product dependability, quality, and customer service. Lucky
Cement focuses on manufacturing premium quality cement
through highly advanced quality control systems equipped
with the latest technology, such as; distributed controllers,
programmable-logic-controllers and X-Ray analyzers.
SMART LOGISTIC SET-UP AND SUPPLY-CHAIN MANAGEMENTIn our determination to make all the logistical arrangements
systematic, we have acquired multi-purpose trailers capable
of moving diverse sets of cement consignments (bagged,
raw or loose). In the first phase, 40 trailers were inducted
in our transportation fleet. Each trailer can carry goods
up to 80 tons. These trailers are used to transport bagged
cement from factory to port and also carry coal from port
to factory. Shifting to a well-synchronized transport system
does not only strengthen the overall logistical capacity of
the Company, but also cuts heavy transportation cost along
with the cost of outsourcing transport contractors.
Our integrated supply chain structure offers superior quality
and smart procurement within the shortest possible lead
time. Our supply chain process is directly beneficial for all
the stakeholders. Our combined purchase strategies give
us leverage and add to our negotiation strength. Our team
consists of dedicated people with the talent to network
and coordinate effectively with our purveyors of goods,
services, transportation and warehousing.
LARGEST PORTFOLIO OF INSTITUTIONAL CLIENTELELucky Cement is one of the largest cement producer in
Pakistan, which coupled with our trusted quality and
efficient transportation network has also bestowed the
Company with the largest pool of institutional customers.
All these customers have been retained based on timely
deliveries, excellent customer support and continued
supply of premium quality cement.
BRAND EQUITYLucky Cement has a strategic advantage in selling its
products throughout Pakistan, from Karachi to Peshawar.
Hence it enjoys being the leading cement Company fully
connected with its local market. Whether we talk about
exports, production processes, advertising or brand equity,
Lucky Cement has constantly raised the bar for competition.
P 13

CHAIRMAN
MUHAMMAD YUNUS TABBA
Mr. Yunus Tabba has taken YBG to a level which is appreciated by the local and international business communities.
Mr. Muhammad Yunus Tabba started his over forty-year long
career with Yunus Brothers Group (YBG) as one of its founding
members and has seen it progress through manufacturing, sales
management, marketing management and general management.
YBG is one of the premier business houses in Pakistan with diversified interests in Textiles, Energy, Chemicals, Cement and Real Estate Development. The Group’s annual turnover is approximately US $ 1.65 billion with annual exports of around US $ 669 million, which is a significant contribution to the overall exports of the country.
With his expertise and diversified experience, he has taken YBG
to a level which is appreciated by local and international business
communities. Muhammad Yunus Tabba has also been awarded
“Businessman of the Year” by the Chambers of Commerce several
times during his long and lustrous career.
Under Mr. Yunus Tabba’s leadership, the Group has achieved
considerable breakthroughs and has received many awards from
local and international institutions.
DIRECTORSHIPS
Lucky Cement LimitedAziz Tabba Foundation (Trustee)
Fashion Textile Mills (Private) LimitedGadoon Textile Mills Limited
LCL Holdings LimitedLCL Investment Holdings Limited
Lucky Air (Private) LimitedLucky Electric Power Company Limited
Lucky Energy (Private) LimitedLucky Textile Mills Limited
Security Electric Power Company LimitedY.B. Holdings (Private) Limited
Y.B. Pakistan LimitedYunus Energy Limited
Yunus Textile Mills Limited
P 14

MUHAMMAD YUNUS TABBAChairman
P 15

CHIEF EXECUTIVEMUHAMMAD ALI TABBA
Mr. Tabba was bestowed with the title of Young Global Leader (YGL) in recognition of his outstanding services and contributions by World Economic Forum (WEF) in 2010.Mr. Muhammad Ali Tabba is the Chief Executive of Lucky Cement, succeeding his late father in 2005. He also serves as the Chief Executive of Yunus Textile Mills Ltd (YTM), a state-of-the-art home textile mill with subsidiaries in North America and Europe. Simultaneously spearheading both these organizations, he plays a pivotal role in providing strategic vision to ICI Pakistan Ltd. as its Vice Chairman.
He started his career with Yunus Brothers Group (YBG) - a family conglomerate in 1991. Apart from the Directorships in the YB Group companies, Mr. Tabba also serves on the Board of Trade Development Authority of Pakistan (TDAP) - the premier trade organization of the country which works under the Federal Ministry of Commerce.
He is also a Trustee of the Fellowship Fund for Pakistan (FFFP) which sends a top Pakistani Scholar every year to Woodrow Wilson International Center for Scholars, a United States based think tank in Washington, D.C. Additionally, Mr. Tabba is also the board member of Pakistan Business Council (PBC), a business advocacy forum comprising of leading private sector businesses. He has been nominated on the board of Pakistan - India Joint Business council (PIJBC) which promotes trade between the two countries.
He is also serving as the Chairman of All Pakistan Cement Manufacturing Association (APCMA), a regulatory body of cement manufacturers in Pakistan, since 2013. He has also been appointed by the Government of Pakistan to serve on the Board of Directors of Oil and Gas Development Company (OGDC).
With extensive engagements in many community welfare projects, Mr. Tabba serves on the Board of Governors at numerous renowned Universities, Institutions and Foundations. He is the Vice Chairman of a not-for-Profit Organization, Aziz Tabba Foundation that is working extensively in the field of education, health and housing. The Foundation runs state-of-the-art cardiac hospitals; Tabba Heart Institute (THI) and Tabba Kidney Institute (TKI), in Karachi, Pakistan.
DIRECTORSHIPS
Lucky Cement LimitedAl Mabrooka Cement Manufacturing Company Limited
Aziz Tabba Foundation (Trustee)Fashion Textile Mills (Private) Limited
Gadoon Textile Mills LimitedICI Pakistan Limited
LCL Holdings LimitedLCL Investment Holdings Limited
Lucky Air (Private) LimitedLucky Al Shumookh Holdings LimitedLucky Commodities (Private) Limited
Lucky Electric Power Company LimitedLucky Energy (Private) Limited
Lucky Exim (Private) LimitedLucky Foods (Private) Limited
Lucky Holdings LimitedLucky Knits (Private) Limited
Lucky Landmark (Private) LimitedLucky Paragon Readymix Limited
Lucky Textile Mills LimitedLuckyone (Private) Limited
LuckyRawji Holdings LimitedNutriCo Pakistan (Private) Limited
NYUMBA YA AKIBA S.AOil and Gas Development Company Limited
Security Electric Power Company LimitedY.B. Holdings (Private) Limited
Y.B. Pakistan LimitedYunus Energy Limited
Younus Textile (Private) LimitedYunus Textile Mills Limited
In recognition of his outstanding services and contributions in the social development sector of Pakistan, World Economic Forum (WEF) in 2010 bestowed the title of Young Global Leader (YGL) on Mr. Tabba. He is also the recipient of Businessman of the Year gold medal award for 2012/2013 from Karachi Chamber of Commerce.
P 16
MUHAMMAD ALI TABBA
Chief Executive
P 17
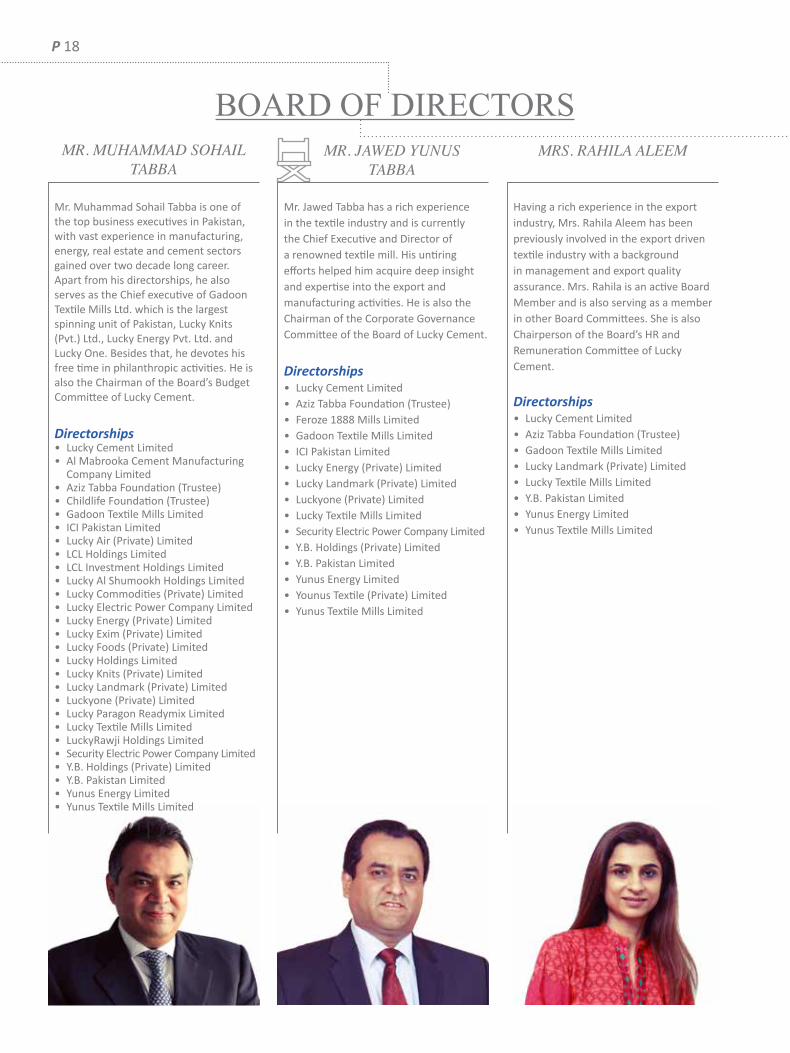
BOARD OF DIRECTORS MR. JAWED YUNUS
TABBA MR. MUHAMMAD SOHAIL
TABBAMRS. RAHILA ALEEM
Mr. Muhammad Sohail Tabba is one of the top business executives in Pakistan, with vast experience in manufacturing, energy, real estate and cement sectors gained over two decade long career. Apart from his directorships, he also serves as the Chief executive of Gadoon Textile Mills Ltd. which is the largest spinning unit of Pakistan, Lucky Knits (Pvt.) Ltd., Lucky Energy Pvt. Ltd. and Lucky One. Besides that, he devotes his free time in philanthropic activities. He is also the Chairman of the Board’s Budget Committee of Lucky Cement.
Directorships• Lucky Cement Limited• Al Mabrooka Cement Manufacturing
Company Limited• Aziz Tabba Foundation (Trustee)• Childlife Foundation (Trustee)• Gadoon Textile Mills Limited• ICI Pakistan Limited• Lucky Air (Private) Limited• LCL Holdings Limited• LCL Investment Holdings Limited• Lucky Al Shumookh Holdings Limited• Lucky Commodities (Private) Limited• Lucky Electric Power Company Limited• Lucky Energy (Private) Limited• Lucky Exim (Private) Limited• Lucky Foods (Private) Limited• Lucky Holdings Limited• Lucky Knits (Private) Limited• Lucky Landmark (Private) Limited• Luckyone (Private) Limited• Lucky Paragon Readymix Limited• Lucky Textile Mills Limited• LuckyRawji Holdings Limited• Security Electric Power Company Limited• Y.B. Holdings (Private) Limited• Y.B. Pakistan Limited• Yunus Energy Limited• Yunus Textile Mills Limited
Mr. Jawed Tabba has a rich experience in the textile industry and is currently the Chief Executive and Director of a renowned textile mill. His untiring efforts helped him acquire deep insight and expertise into the export and manufacturing activities. He is also the Chairman of the Corporate Governance Committee of the Board of Lucky Cement.
Directorships• Lucky Cement Limited• Aziz Tabba Foundation (Trustee)• Feroze 1888 Mills Limited• Gadoon Textile Mills Limited• ICI Pakistan Limited• Lucky Energy (Private) Limited• Lucky Landmark (Private) Limited• Luckyone (Private) Limited• Lucky Textile Mills Limited• Security Electric Power Company Limited• Y.B. Holdings (Private) Limited• Y.B. Pakistan Limited• Yunus Energy Limited• Younus Textile (Private) Limited• Yunus Textile Mills Limited
Having a rich experience in the export industry, Mrs. Rahila Aleem has been previously involved in the export driven textile industry with a background in management and export quality assurance. Mrs. Rahila is an active Board Member and is also serving as a memberin other Board Committees. She is also Chairperson of the Board’s HR and Remuneration Committee of Lucky Cement.
Directorships• Lucky Cement Limited• Aziz Tabba Foundation (Trustee)• Gadoon Textile Mills Limited• Lucky Landmark (Private) Limited• Lucky Textile Mills Limited• Y.B. Pakistan Limited• Yunus Energy Limited• Yunus Textile Mills Limited
P 18

MRS. ZULEKHA TABBA MASKATIYA
MR. ABID GANATRA MR. TARIQ IQBAL KHAN
Having pursued a Bachelor’s degree in Management Sciences from the University of Warwick and a Master’s degree in Management, Organizations and Governance from the London School of Economics and Political Science, Mrs. Zulekha Tabba Maskatiya has been an indispensable part of the YBG since inception. She not only holds a prestigious position within the Yunus Brothers Group but her educational background brings the values of business focus, corporate governance and social responsibility to the organization. Inaddition to this, she is also the Founder and the Creative Director of the luxury jewelry brand, Lazuli, based in Pakistan.
Directorships• Lucky Cement Limited• Aziz Tabba Foundation (Trustee)• Lucky Electric Power Company Limited• Lucky Textile Mills Limited• Y.B. Holdings (Private) Limited• Y.B. Pakistan Limited• Yunus Energy Limited• Yunus Textile Mills Limited
Mr. Abid Ganatra has been associated with the YBG since 1994. He has more than twenty years of diversified experience at senior management positions with emphasis on financial management, operational management, capital restructuring, mergers and acquisitions, corporate and legal affairs as well as taxation. Abid is a fellow member of the Institute of Chartered Accountants and Institute of Cost Management and Accountants of Pakistan. He has also gained a Master’s Degree in Economics and Bachelor’s in Law.
Directorships• Lucky Cement Limited• ICI Pakistan Limited• NutriCo Pakistan (Private) Limited• InterGro Life Limited
Mr. Tariq Iqbal Khan is one of the leading professionals in the country, having a vastexperience of the financial sector of Pakistan. Being a Fellow Member of the Institute of Chartered Accountants of Pakistan who started his career with A.F. Ferguson & Co., Chartered Accountants, Mr. Khan has been leading policy making positions in various associations and institutes in the country including Founder/Acting Director of Islamabad Stock Exchange, President Islamabad Stock Exchange, Commissioner SECP, acting Chairman SECP and Member Tax Policy and Coordination FBR. Mr. Tariq Iqbal Khan has also served as the Managing Director/Chairman at the Investment Corporation of Pakistan and the National Investment Trust Limited. He is also Chairman of Board’s Audit Committee.
Directorships• Lucky Cement Limited• Attock Refinery Limited• FFC Energy Limited• International Steel Limited• National Refinery Limited• Packages Limited• Pakistan Oil Fields Limited• Silkbank Limited
P 19

CEO’s MESSAGEDear Stakeholders,It’s a great pleasure for me; that by the grace of Almighty Allah, we have witnessed yet another top performing year in the history of Lucky Cement Limited. We have recorded the highest standalone profit after tax of PKR 12.43 billion, which is 9.6% higher compared to the previous fiscal year.
We are cultivating growth through our farsighted decisions
and technology driven operations. The steadfast commitment
of our people ensures that their distinct energies earn
an unmatched performance in the whole industry. We
continuously evaluate opportunity to expand our footprint in
the cement industry, both domestically and internationally.
Our focus on pro-environment innovations stresses key areas
of reduction in carbon footprints. We have established our
faith in continuous improvement and excellence in the arenas
of industrial growth, community development as well as our
operational framework.
During the fiscal year 2015-16, we foresee huge growth in the
domestic market whereas our exports are slowing down due to
import regulations and higher tariff on imported cement. Our
company is fully geared to take advantage of the local growth.
On the energy front again there is a big swing in crude oil prices
which have resulted in decrease in prices of HFO. Whereas
on the other hand the government has raised the gas tariff in
addition to GIDC. Hence it seems that in short term the energy
market will change and we will adapt to it accordingly.
We have continuously maintained our position as a low cost
producer through investment in technology and innovation
throughout the manufacturing process. Our debt-free financial
position and free cash-flow generating ability drives us to
smartly invest in the projects and avenues which would
continue to bring in growth in our portfolio and increase
shareholder value.
I would like to express my gratitude to all the stakeholders
who have supported us and look forward to their continued
support.
MUHAMMAD ALI TABBACEO / Director
P 20

MUHAMMAD ALI TABBA
P 21

CHIEFOPERATING
OFFICER
ORGANOGRAM
CHIEF EXECUTIVE
EXECUTIVE DIRECTOR AND
CHIEF STRATEGY, FINANCE &
INVESTMENT OFFICER
EXECUTIVEDIRECTOR
P 22
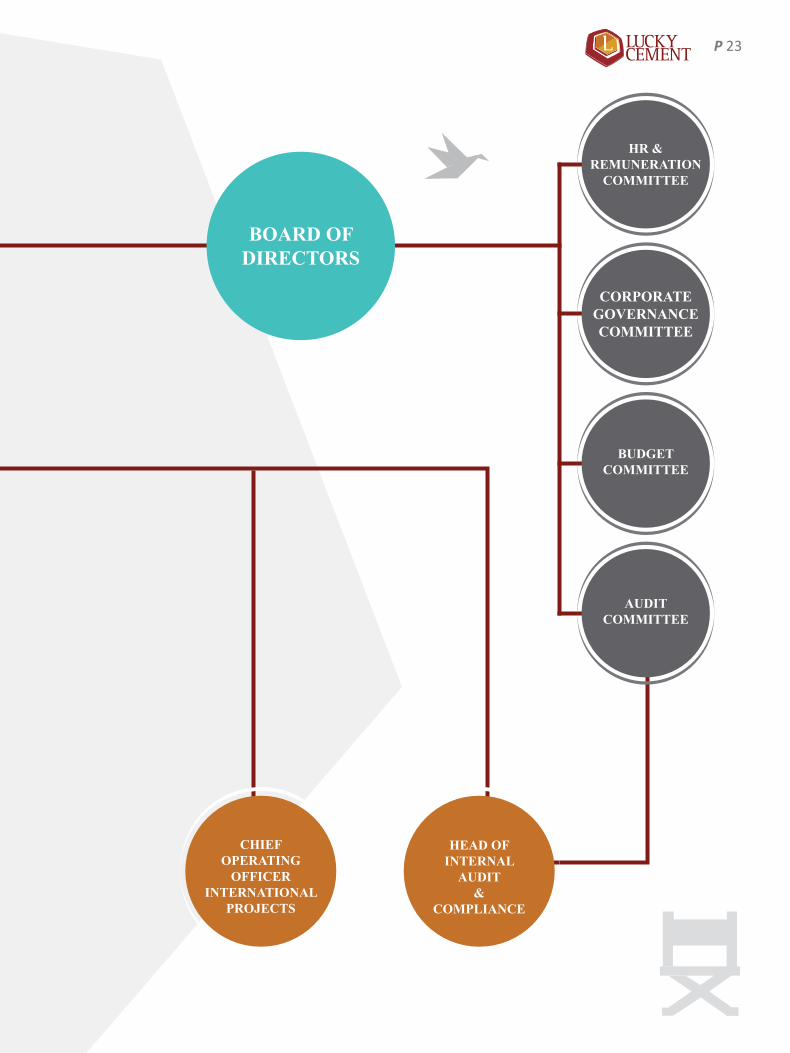
AUDITCOMMITTEE
BUDGET COMMITTEE
CORPORATE GOVERNANCE COMMITTEE
HR & REMUNERATION
COMMITTEE
CHIEF OPERATING
OFFICERINTERNATIONAL
PROJECTS
HEAD OFINTERNAL
AUDIT&
COMPLIANCE
BOARD OF DIRECTORS
P 23

MUHAMMAD SHABBIR Director Operations
ADNAN AHMEDChief Operating Officer International Projects
INTISAR-UL-HAQ-HAQQIDirector Power Generation
MASHKOOR AHMEDDirector Operations
MUHAMMAD ALI TABBAChief Executive
NOMAN HASANExecutive Director
SENIOR MANAGEMENT
MUHAMMAD FAISALExecutive Director and Chief Strategy, Finance & Investment Officer
AMIN GANNYChief Operating Officer
P 24

MUHAMMAD IQBAL GM Power Plant (Pezu)
ADNAN QAZI GM Information Technology and Systems
UZMA AMJAD ALIGM Legal and Corporate Affairs
SYED HASAN MAZHAR RIZVIGM Power Plant (Karachi)
SAIFUDDIN A. KHANGM Marketing (South)
SYED NUSRAT ALIGM Production (Karachi Plant)
KALIM MOBINDirector Marketing (North)
FAISAL MAHMOOD Head of Internal Audit & Compliance
IRFAN CHAWALAGM Finance
AMIN HUSSAINGM Supply Chain
HUMAYUN KHANGM Govt. Relations & Administration (Islamabad)
WAQAS ABRARGM Human Resource
P 25

COMPANY PROFILELuckyCementLimited
Lucky Cement Limited is the flagship company of YBG, which has a solid history of exceptional
growth performance since its inception in 1993. The shares of Lucky Cement are quoted on all
three stock exchanges in Pakistan. Lucky Cement has also issued Global Depository Receipts
(GDRs) which are listed and traded on the Professional Securities Market of the London Stock
Exchange.
Lucky Cement manufacturing plants are strategically located in both North and South regions of the country. At present,
it has a combined production capacity of 7.75 Million Tons per annum and is the market leader with almost 19.2 % share
of the Pakistan’s Cement Market (including Exports). Lucky Cement is also the only cement company to have its own loose
cement export terminal at Karachi port with storage capacity of 24,000 tons.
It strives to remain an efficient and low cost producer and was the first company to install Waste Heat Recovery Plant in
Pakistan. It also has its own captive power generation facility of 180 MW. Lucky Cement also owns a fleet of Bulkers &
Trailers which gives added advantage in terms of logistics and efficient deliveries to its customers.
LuckyHoldingsLimited
Lucky Holdings Limited (LHL) is a
75 percent owned subsidiary of
Lucky Cement Limited and was
incorporated in Pakistan in the
year 2012 as a public unlisted Company limited by shares
under the Companies Ordinance, 1984. As of June 2015;
LHL held 74.75% shares in ICI Pakistan Limited. The main
source of earning of LHL is dividend and royalty income.
ICI Pakistan Limited
Lucky Cement acquired majority
shares of ICI Pakistan Limited
through LHL in the year 2012;
the Company is engaged in the manufacture of polyester
staple fiber, POY chips, soda ash, specialty chemicals,
sodium bicarbonate and polyurethanes; marketing of
seeds, toll manufactured and imported pharmaceuticals
and animal health products; and merchandising of
general chemicals. It also acts an indenting agent and toll
manufacturer.
LCL Holdings Limited
LCL Holdings Limited (LCLHL) was
incorporated in Pakistan as a public
unlisted company in September 2014
with the objective to invest in the Coal Based Power project
to be setup by Lucky Electric Power Company Limited
(LEPCL). LCLHL owns 100% ownership interest in LEPCL.
LuckyElectricPowerCompanyLimited
LEPCL is a wholly owned subsidiary of LCLHL
and was incorporated in Pakistan in the year
2014, as a public unlisted Company. LEPCL
has been incorporated with the objective
of setting up of 660 MW super critical coal
based power project for supplying electricity to the national
grid.
P 26

LCL Investment Holdings Limited
LCL Investment Holdings
Limited (LCLIHL) is the wholly
owned subsidiary of Lucky
Cement incorporated and domiciled in Mauritius. LCLIHL
has entered into 50-50 joint venture agreements with the
following: Alshumookh Construction Materials Trading FZE,
for establishing Lucky Alhsumookh Holdings Limited for
constructing a cement grinding unit in the Republic of Iraq.
Rawsons Investment Limited, for establishing LuckyRawji
Holdings Limited for construction of a fully integrated
cement manufacturing plant in DRC.
LCLIHL holds 50 percent ownership interest in the
aforementioned joint venture.
LuckyRawjiHoldingsLimited
LuckyRawji Holdings
Limited was
incorporated in the year 2011 under a joint venture
agreement between LCLIHL and Rawsons Investments
Limited (registered in Cayman Islands) for establishing
LuckyRawji Holdings Limited for constructing a fully
integrated cement manufacturing plant in the Democratic
Republic of Congo. LCLIHL holds 50 percent ownership
interest in the aforementioned joint venture.
CIMKO/Nyumba Ya Akiba S.A.
Nyumba Ya Akiba S.A. (NYA) was
incorporated as a limited liability company
in the Democratic Republic of Congo
(DRC) and is a wholly owned subsidiary of
LuckyRawji Holdings Limited. NYA is setting
up a green field fully integrated cement plant in the Bas Congo
Province of DRC with a production capacity of 1.18 million
tons per annum. The plant is expected to start commercial
production by October 2016.
LuckyAl-ShumookhHoldingsLimited
Lucky Al-
Shumookh
Holdings Limited was incorporated in the year 2012 under a
joint venture agreement between LCLIHL and Al-Shumookh
Construction Materials Trading FZE, for constructing a
cement grinding unit in the Republic of Iraq. LCLIHL holds
50 percent ownership interest in the aforementioned joint
venture.
AlMabrookaCementManufacturingCompanyLimited
Al Mabrooka Cement Manufacturing
Company Limited (AMCMC) was
incorporated as a limited liability
company in Basra, Republic of Iraq
and is a wholly owned subsidiary of Lucky Al Shumookh
Holdings Limited. AMCMC has set up a green field cement
grinding unit in Basra, Iraq which started commercial
production in February 2014.
P 27

GROUP PROFILEThe Yunus Brothers Group (YBG) is one of the biggest conglomerates in Pakistan with diversified interests in textiles, cement and power generation. The group was established in
1962 as a trading house and then grew rapidly over the years. Currently, YBG is one of the largest export houses as well as the largest cement manufacturer in Pakistan. The Group’s annual turnover is approximately US $ 1.65 billion and the annual export turnover is around US $ 669 million. Apart from Lucky Cement Limited and ICI Pakistan, the group is also proud owner of the following companies.
YBHoldings(Private)Limited
Y.B. Holdings (Private) Limited was incorporated in Pakistan in the year 2013 as a group Holding Company. The Company is invested mainly in its group companies and has a diverse portfolio in building materials, textiles, energy, chemical,
trading and real estate.
YunusTextileMillLimited(YTML)
Yunus Textile Mills, is a vertically integrated home textile unit established in 1998, consisting of spinning, weaving, printing,
dyeing, finishing and cut & sews with a workforce of 7,500 employees. Within span of 10 years it became the no. 1 home textile exporter of Pakistan with 10% share (approx.) of all Home Textiles exported from Pakistan. The company has its international warehousing, distribution and design development offices in USA, UK and France.
GadoonTextileMillsLimited(GTM)
GTM was established in 1988 and is listed on the Karachi and Islamabad stock exchange. It is currently the largest spinning unit of the country with 250,000 spindles. GTM also
have a captive power plant with a generation capacity of 56 MW.
GTM is a pioneer in introducing new technologies in Pakistan like Compact Spinning, Murata Jet Spinning, Murata Vortex Spinning and several other innovative
technologies. It has the distinction of being the first of the only two textile mills in the world producing Compact Core Spun Yarn. Fazal Textile Mills, another wholly owned subsidiary of YB Holdings Private Limited has been merged
into GTM in the year 2014.
LuckyTextileMillsLimited(LTM)
Lucky Textile Mills was established in 1983 and has since remained one of the leading textile manufacturers in the country to-date. The Company is engaged in the activity of manufacturing
and export of fabrics, home textile and garments.
It has state-of-the-art equipment to cater to the international market. It has the capacity to process 250, 000
meters per day and over 83 million meters per annum of
fabric. LTM has its own captive power generation facility of
6.20 MW.
LuckyCommoditiesPrivateLimited(LCPL)
Lucky Commodities Private Limited (LCPL) was formed in 2013 as a trading arm of YBG. At present, it is the largest
importer of coal in Pakistan and is catering to more than 40% of the country’s coal market; ranging from cement to textile, oil & ghee, paper, chemical, steel and other sectors.
LCPL is also the preferred supplier of coal supply to major Cement companies and other Industries in Pakistan, owing
to market reputation and credibility.
P 28
YunusEnergyLimited
Yunus Energy Limited is a wholly owned subsidiary of YBG and was incorporated as a public unlisted company in the year 2011. It has initiated a project of
national importance in Pakistan which is a 50 MW wind power project. The company has already been granted a Generation License from National Electric Power Regulatory Authority (NEPRA) and the project is expected to start
commercial operations by May 2016.
AzizTabbaFoundation(ATF)
Aziz Tabba Foundation is a not for profit organization, started in 1983. It is a platform of social activities engaged in serving humanity in some crucial areas
of life. The Foundation renders its services to fulfill the need of underprivileged people by providing them Shelter, Education, Marriage and Health Care facilities to bring prosperity and change to unleash the potential to transform the Society.
The Foundation has also successfully launched the Vocational training program to polish and bring about a valuable change in the upbringing and creation of excellence in the area of its operations. The Foundation has two State of the Art Cardiac and Kidney hospitals known as Tabba Heart Institute and Tabba Kidney Institute which support in fulfilling the gap of specialized and modern
treatment of Kidney and Heart related diseases in the
country
TabbaKidneyInstitute
Tabba Kidney Institute started
its services as Aziz Tabba Kidney Centre (ATKC) in 1995
as a Hemodialysis unit with four dialysis machines. Over the years, it grew into one of the largest Hemodialysis centre in the country. In 2001, it was transformed into a complete nephrology care set-up with both inpatient and out-patient facilities. In 2010, it became an ISO certified institution, and achieved the privilege to be the only ISO 9001:2008 Certified renal care facility in Pakistan. Going forward, in the year 2012, Urology services and an Intensive Care Unit were also added to the Centre.
Aziz Tabba Foundation
Tabba Kidney Institute also serves as an excellent teaching, research and continuing educational institution for nephrology, urology and related fields. At present it is providing comprehensive care for all types of Kidney diseases of highest standard to more than 4,500 patients per month on a not-for-profit basis.
TabbaHeartInstitute(THI)
Tabba Heart Institute (THI) is a
specialty care cardiac hospital established in the year 2005 with a vision to provide quality
services and compassionate care at an affordable price. Its prime objective is to promote excellence in the field of cardiovascular health. The hospital is equipped with state-of-the-art equipment and highly qualified professionals with a proven track record, sharing the vision, passion and commitment that led to the establishment of this institution.
At present, it is a 170-bed hospital supported by Cardiac Emergency Room, Consultant Clinics, Clinical Laboratory, Pharmacy and one of its kind, Preventive Cardiology and Rehabilitation Department. With an aim to attain a trend setting image in the field of cardiac health care, the hospital has innovatively designed several preventive, rehabilitation and fitness programs so as to promote a culture of healthy
life-style.
P 29

DIRECTORS’ REPORT
The Directors of your Company have pleasure in presenting to you the results of your Company which include both, the stand-alone and consolidated audited financial statements for the fiscal year ended June 30, 2015.
P 30

IndustryOverview:Cement industry in Pakistan grew by 3.3% to 35.40 million tons during the fiscal year ended June 30, 2015 compared to
34.28 million tons of last year. While local sales volume registered a growth of 7.9% to register historically highest volumes
of 28.21 million tons during fiscal year 2014-15 compared to 26.15 million tons last year, export sales volume registered a
decline of 11.6% to 7.19 million tons during the year under review compared to 8.14 million tons of last year.
P 31

Your company was able to maintain its overall market share in the industry at 19.2% during the current fiscal year.
Your Company achieved an overall growth of 2.7% with overall sales volume at 6.79 million tons during the fiscal year 2014-15 compared to 6.62 million tons sold last year. Local sales volume registered a growth of 7.0% to 4.42 million tons during the fiscal year 2014-15 compared
Production and Sales(Tons in ‘000’)
Clinker Production Cement Production Cement Sales
0
1,000
2,000
3,000
4,000
5,000
6,000
7,000
8,000
FY 2014-15
6,3956,795 6,794
6,366
6,621 6,618
FY 2013-14
GrossProfit 20,183
ProfitafterTax 12,432
PERatio 13.5
EarningsPerShare 38.44
+8.0%
+9.6%
+15.5%
TotalRevenue 44,761
EBITDA 18,428
MarketCap. 168,032
BookValue/Share 183.3
+3.9%
+10.9%
+26.6%
+19.0% +9.6%
Your company was able to maintain its overall market share in the industry at almost similar levels i.e. 19.20 percent for the current fiscal year. It achieved
an overall growth of 2.7 percent with overall sales volume at 6.79 million tons during the fiscal year 2014-15 compared to 6.62 million tons sold last year.
BusinessPerformance:a) Production&SalesVolumePerformance
The production and sales statistics of your Company for the
fiscal year 2014-15 compared to last year are as follows:
ParticularsFY2014-15 FY2013-14
Increase/
(Decrease)
Tonsin‘000 %
Clinker Production 6,395 6,366 0.5%
Cement Production 6,795 6,621 2.6%
Cement Sales 6,794 6,618 2.7%
Directors’ Report to 4.13 million tons last year, whereas export volumes declined by 4.5% to 2.37 million tons during the fiscal year 2014-15 compared to 2.49 million tons of last year.
The standalone EPS for the year is PKR 38.44 which is 9.6% higher than the last year EPS of PKR 35.08. The EDITDA for the year has also seen an increase of 10.9% and is at PKR 18 billion compared to last year level of PKR 16 billion.
Figures in PKR Million except EPS, Market Cap and PE Ratio
P 32

A comparison of the dispatches of the industry and Lucky Cement for the fiscal year 2014-15 compared to last year is
presented below:
ParticularsFY 2014-15 FY 2013-14 Growth / (Decline)
Tons in ‘000 Tons in ‘000 %
CementIndustry
Local Sales 28,206 26,145 2,061 7.9%
Export Sales
– Bagged 6,904 7,818 (914) (11.7%)
– Loose 291 318 (27) (8.5%)
Total Exports 7,195 8,137 (941) (11.6%)
Grand Total 35,401 34,282 1,120 3.3%
LuckyIndustry
Local Sales 4,421 4,132 289 7.0%
Export Sales
– Bagged 2,082 2,168 (86) (4.0%)
– Loose 291 318 (27) (8.5%)
Total Exports 2,373 2,486 (113) (4.5%)
Grand Total 6,794 6,618 176 2.7%
The capacity utilization for Lucky Cement Limited has increased to 92.0 percent which is an increase of 3 percent from last year. The average industry
capacity utilization increased to 77.6 percent for the year as per the data provided by APCMA.
The industry sales registered an overall increase of 3.3 percent. The local sales witnessed a growth of 7.9 percent while the exports faced a decline of 11.6 percent. The decline is attributed mainly to the decline in exports
to Afghanistan which is almost 21 percent lower from last year.
P 33

Market Share
LuckyCementLimited-
Market Share
FY
2014-15
FY
2013-14
Growth/
(Decline)
Local Sales 15.7% 15.8% (0.8%)
Export Sales
Cement
– Bagged 30.2% 27.7% 8.7%
– Loose 100.0% 100.0% 0%
Total Exports 33.0% 30.6% 8.0%
Grand Total 19.2% 19.3% (0.6%)
Year Wise Lucky Cement Market Share(Percentage)
5
10
15
20
25
30
35
FY 2011 FY 2012 FY 2013 FY 2014 FY 2015
15.7% 15.5% 15.8% 15.7%
19.2%19.3%18.1%18.4%18.5%
25.0% 26.3%27.3%
30.6%
33.0%
15.0%
Export Share Total Share Local Share
A comparative year-wise analysis of market share of your Company is as under:
b) FinancialPerformance
The financial performance of our Company for the fiscal
year 2014-15 compared to the last year is presented below:
FY2014-15 FY2013-14 %Change
Revenue 44,761 43,083 3.9%
GP 20,183 18,690 8.0%
OP 16,138 14,548 10.9%
EBITDA 18,428 16,621 10.9%
NP 12,432 11,344 9.6%
EPS 38.44/share 35.08/share 9.6%
Revenues
During the fiscal year under review, your Company achieved
an overall net sales revenue growth of 3.90% as compared
to last year; which was contributed by 2.70% increase in
volume and 1.20% increase in net retention.
CostofSales
Per ton cost of sales of your Company during the period
under review decreased by 1.9% compared to the last year.
The decrease was mainly attributable to decrease in coal
and other fuel prices as well as the positive effect of the
installation of Vertical Grinding Mills and WHR in Karachi
Plant.
Other Manufacturing
Distribution of Revenue (Percentage)
Cost of Sales
Donation
Financial Charges
Govt. Levies Rebate Commission
Net Profit Operating Expenses of Other Income
45.6%
23.1%
5.2%
0.5%
24.4%
1.2% 0%Distribution of Cost of Sales(Percentage)
Fuel, Gas, Coal & Lub.
Packaging Material
Stores & Spares
Fixed Cost
Raw Material
54%
4%
5%
13%
9%
15%
Figures in PKR Million except EPS
P 34

Net Profit(PKR in Million)
0
3,000
6,000
9,000
12,000
15,000
2011 2012 2013 2014 2015
3,970
6,782
9,749
11,34412,432
EPS Trend(PKR)
10
20
30
40
FY 2011 FY 2012 FY 2013 FY 2014 FY 2015
12.28
20.97
30.15
35.08
38.44
GrossProfit
Your Company was able to achieve a gross profit margin of 45.1% for the year under review compared to 43.4% reported last year.
Profitability
Your Company was able to improve its before tax profitability by 10.07% to PKR 15,912 million during the year under review compared to PKR 14,456 million reported last year. Similarly, after tax profit improved by 9.59% to PKR12,432 million for the year under review compared to PKR 11,344 million reported last year.
Earnings per share
The earnings per share of your Company for the year ended June 30, 2015 was PKR 38.44 as compared to PKR 35.08 reported last year.
Taxation
Your Company provided for an amount of PKR 2.94 billion on account of income taxes as compared to PKR 2.89 billion provided during last year. Deferred Tax provision of PKR 538 Million has been made in the accounts during the year, making the cumulative deferred tax liability of PKR 5.32 Billion as on June 30, 2015.
ContributiontoNationalExchequer
During the year your company contributed PKR 13.5 billion (2014: PKR 12.0 billion) into the Government Treasury on account of Income taxes, excise duty, sales tax and other levies. Moreover, valuable foreign exchange to the tune of USD 138.28 million was also generated by your Company for the Country from export of cement during the year under review.
Dividend
Taking into account the current capital and equity investment plans; the board has proposed the final dividend of PKR 9/- per share for the financial year ended June 30, 2015. This approach remains in line with our commitment to consistently return sustainable value to shareholders. Movement in un-appropriated profit is as follows:
Gross Profit(PKR in Million)
0
5,000
10,000
15,000
20,000
25,000
2011 2012 2013 2014 2015
8,712
12,721
16,756
18,690 20,183
P 35
LuckyCementLimited– Stand-aloneResults PKRin‘000
NetProfitfortheYear Un-appropriated profit at the beginning of the year - Profit available for appropriation 12,431,598 12,431,598Appropriations Proposed dividend for the Financial Year 2014-15 @ PKR 9 (2,910,375) Proposed transfer to General Reserves (9,521,223) Un-appropriated profit at the end of the year - Basic and diluted earnings per share - PKR 38.44
NationalCauseDonations
Your Company has a roadmap with respect to Corporate Social Responsibility to support in the areas of education, health and environment through various welfare initiatives; which are undertaken both directly through company’s financial assistance and indirectly by patronizing country’s civil society institutions and non-government organizations geared towards creating a social impact.
CAUSES SUPPORTED FY2014-15 FY2013-14
Amount Donated (PKR In ‘000)
Educational Scholarships and
Initiatives
2,899 71,311
Health Initiative and Financial
Assistance To Patients etc.
33,442 31,745
Other Welfare causes 170,300 115,000
General Donations 37,529 56,026
TOTAL AMOUNT DONATED 244,170 274,081
TaxRefundsDuefromtheGovernment
This refers to the emphasis of a matter paragraph by the auditors in the audit report and as referred to in note 15 to the audited financial statements of the company for the year ended 30th June 2015, FBR filed representation, before the President of Pakistan against the recommendations of the FTO which were in the favor of the company, under section 32 of Federal Tax Ombudsman Ordinance, 2000. However, President of Pakistan through its order has endorsed the recommendations of FTO. Subsequent to the year end, FBR filed a writ petition before the Peshawar High Court challenging the decision of the
FTO. The Peshawar High Court suspended the operations of the orders of FTO and President of Pakistan on July 14, 2015 till further orders. The Company is in the process of challenging the stay granted by the Honorable Peshawar High Court through filing a writ petition.
SegmentalReviewofBusinessPerformanceThe acquisition of ICI Pakistan was part of the Company’s strategy to diversify the business of Lucky Cement Limited into five well-established business segments which are tabulated below:
Segment Revenue Growth
GP Margin
OP Margin
Segment Assets
(PKRBn.)
Segment Liabilities(PKRBn.)
Cement 3.90% 45.09% 36.05% 46.74 12.70
Polyester -15.75% -0.38% -2.87% 9.87 12.76
Soda Ash 12.74% 26.09% 21.41% 16.56 3.05
Life Science 17.11% 27.40% 11.31% 9.63 2.36
Chemicals -0.43% 18.39% 7.52% 3.45 0.92
Projects–NewandOngoingWasteHeatRecovery(WHR)PlantatCaptivePower Plant
5 MW WHR at PEZU Plant is expected to be completed by the end of October, 2015.
ElectricitySupplytoPESCO
Tariff petition has been filed with National Electric Power Regulatory Authority (NEPRA) which is awaiting determination. Once tariff is determined by NEPRA, an agreement for the supply of 15 MW electricity shall be signed with PESCO.
InvestmentsInvestmentin1x660MW,supercritical,coalbasedpowerproject
The Private Power and Infrastructure Board (PPIB) issued Letter of Support (LOS) to Lucky Electric Power Company Limited (LEPCL) on 8 June 2015. The target to achieve financial close is the end of May 2016.
P 36

The consolidated financial statements of the Company for the year ended 30 June, 2015 include the net assets of LEPCL which is a 100% indirect wholly owned subsidiary of the Company.
Joint Venture Investment in Cement Plant in DR Congo
The construction work at the project site is in progress to achieve planned Commercial Operations Date (COD) of October 2016.
The effect of 50% share of the net assets of the DR Congo plant have been reflected in the consolidated financial statements of the Company for year ended 30 June 2015.
EquityInvestmentinAssociatedCompanyin50MWWindFarm
The EPC Contractors have been mobilized at site and started full scale construction activities. The project is expected to be completed by the end of May 2016.
Entity’sSignificantResourcesCashFlowStrategy
Your Company has an effective cash-flow management system in place whereby cash inflows and outflows are projected and monitored on a regular basis. Working Capital Requirements are managed mainly through internal cash generation.
Our cash position is not only good enough to support our operational requirements but also gives us the freedom to capitalize on available cost-saving or investment opportunities.
The company has been continuously taking steps towards reducing cost of production and has started 5MW WHR Plant at Karachi Power Plant during the year with another 5MW WHR plant at its Pezu Power
Plant expected to be completed by the end of October 2015.
During the year under review, an amount of PKR 21.23 billion was generated from operations of the Company which was mainly allocated for long term investments amounting to PKR 2.77 billion, distribution of dividends amounting to PKR 2.89 billion and capital expenditures amounting to PKR 5.43 billion. Our investments are executed only after detailed analysis in the best selected prospects secured with all the covenants and guaranties taken in the best interest of the company and its stakeholders.
CapitalStructureandFinancialposition
Your company continued to remain equity financed in this financial year and has zero debt on its balance sheet on standalone basis. Your company’s self-generated liquidity and debt-free balance sheet is one of its biggest strength. This provides your management a possibility to capitalize on further cost-saving ventures and also gives our creditors’ confidence in doing business with us.
Our reserves increased by 20 % during the year and now stand at PKR 56 Billion. The increase is mainly attributable to improved margins and profits of the Company. There is no significant change in our capital structure and financing strategies.
P 37

Financing arrangements
Your company has working capital as well as short and long term debt facilities available from various banks in Pakistan. Currently the financing facilities are unutilized due to surplus liquidity available. In future, such financing lines, if need be, can be utilized to fulfill its cash flow requirements. Since Lucky Cement is well regarded in the market as credible and consistent player; all our creditors have full faith in our financial management.
Human capital
We firmly believe that the most significant resource of our company is its employees. From top to bottom; we have competent people who are aligned with the vision of Lucky Cement. We hire best people and provide them with growth opportunities by way of training, making them part of decision making process and giving them job rotations. Lucky Cement has a process of conducting potential assessment exercise whereby top talent is required to undergo an assessment center and evaluated by senior people having different skills set. Our people are exposed to challenging work and they are tested to their limits to unleash their ultimate potential.
ManagementObjectiveandStrategiesThe key objective of the management of your company is to sustain market leadership in Pakistan’s cement industry and increase value for all the stakeholders. All the corporate goals are targeted towards this purpose and the key performance indicators are defined to be measured in terms of company’s improved performance in all spheres of its operations.
Your company today has a global foot print and the management is set to achieve further milestones through creation of enabling environment by developing a highly competent & professional team, investing in state-of-the-art technology, striving for customer satisfaction and loyalty, identifying supply chain synergies, and contributing to the environment and communities it operates in.
The company has successfully inaugurated WHR (Waste Heat Recovery) plant of 5MW capacity at its Karachi Power
Plant in March 2015, as part of its ongoing cost reduction and sustainability objective. Another such plant is also expected to be operational by October, 2015, at our Pezu site. To further improve upon the quality of cement produced; two state-of-the-art vertical grinding mills at Karachi Plant were installed and are now operational since February 2015.
To achieve the given corporate goals; your company has taken organization wide steps involving all the employees from top to bottom in formalizing SOPs (Standard Operating Procedures) and have set individual KPIs (Key Performance Indicators) aligned with our broader corporate goals, making every employee a self-assessor with defined yearly targets and respective transparent measuring criteria. The company is also in the process of SAP implementation which is expected to further increase efficiency, simplify processes, eliminate redundancies and reduce communication gaps and information processing time. Furthermore, we have also refined and improved our human resource policies and have also successfully launched a structured management trainee program in collaboration with the leading educational institutes of the Country.
Your company’s financial performance and market leadership is a reflection of achievement of its corporate goals through all around strategic alignment.
KeyPerformanceIndicatorsThe management of your company has outlined the following Key Performance Indicators (KPIs) to gauge the achievement of the stated objectives. The objectives and KPIs were shared companywide at all levels as “Company’s9 corporate goals” to have alignment at all levels with our strategic direction.
P 38

PerformanceonFinancial&Non-FinancialMeasuresSustainable Growth
MARKETSHARE LOWCOSTPRODUCER SALES VOLUME COST REDUCTION INITIATIVES
EARNINGS PER SHARE
Maintained the market leadership by maintaining market share of 19.2% in FY
2014-15.
The cost of production per ton remains the
lowest in the industry.
Year on year, overall sales volume grew by
2.6%
5MW WHR Plant became operational at Karachi
Power Plant.
EPS is PKR 38.44 which is 9.6% higher compared to
last year EPS
Corporate & Brand Image
AWARDS BRANDAWARENESS CORPORATE COMMUNICATION INTERNATIONAL CONFERENCES
• Forbes ‘Asia’s 200 Best Under a Billion’ list 2013/14
• Corporate Excellence Award 2014 by MAP (Management Association of Pakistan)
• Brand Of The Year Award 2014
• ICAP & ICMAP Best Corporate Reports Award for the year 2014
• Green Supply Chain Award 2014
• Sponsored National Day Supplement for Sri Lanka in Business Recorder and Kenya Day
• Sponsorship for 4th CSR Summit organized by The Professionals Network.
• Silver Sponsorship for CFO Conference at Karachi and Islamabad organized by ICAP.
Continued reaching out to customers through print medium and published various articles in International Cement Review, World Cement Review and other local magazines.
Active participation in the INTERCEM conference and investors’ conferences / road shows held across Pakistan and in London, Dubai and New York.
Human Resource Development
Talentacquisition Succession planning PerformanceManagement GenderDiversity
Started its first management trainee program this year as part of its goal for best talent
acquisition and succession planning.
Developed a succession planning matrix to highlight
the high potential resources for succession along with focus on the areas where training and
development is required.
A cross functional annual performance review of
employees by senior management has been conducted ,to ensure
transparency and objective assessment.
Working towards improving gender diversity and become a well-known equal opportunity
employer in future.
• Sustainable & profitable growth in both domestic and export markets.
• Strive to remain lowest-cost producer in the Industry • Improve corporate and brand image• Attract, retain and develop Human Resources Talent • Strengthening Safety, Health & Environment culture • Increase our footprint beyond Pakistan and diversify• Upgrade in IT systems & infrastructure
• Implement Structured Risk Management program• Fulfillment of our Corporate Social Responsibility in our
operations.
The management has added to the performance measures stated in last financial year and believe that the expanded list is more relevant to the future. We have already started evaluating our last year performance through these goals.
P 39

HSE(Health,SafetyandEnvironment)
ZeroLossWorkDayInjury Compliance with NEQ Standards WHR(WasteHeatRecovery)Plant
Successfully achieved zero loss work day injury target for the year.
Positioned almost 50% above the permissible limit of NEQ standards due
to use of advanced technology and WHR plants.
Achieved carbon emissions reduction of further 7% with the start of 5MW plant at Karachi plant, compared to emissions
before this installation.
BusinessGrowth&Diversification
LuckyElectric Basra Grinding Unit DRCongoProject
Received letter of Support from Private Power & Infrastructure Board,
Government of Pakistan for setting up of 1 X 660 MW, super critical coal based power
project.
A full year of commercial operations. Financial Close achieved in November 2014. Construction in progress and commercial operations to start from October 2016.
ITInfrastructure
SAP ERP
Initiated the project of SAP HANA implementation which is expected to go live by January 2016.
Risk Management
Strategic Risks Commercial Risks OperationalRisks Financial & Compliance Risks
The strategic risks such as non- availability of gas for
power generation as well as significant increase in fuel and
power cost making cost of production substantially higher
and changing the economics of operations were considered and incorporated into the risk register. Appropriate measures are in place to counter these
situations whenever they arise to make sure that plant is up and running and company is able to continue operations
with reasonable margins.
The export markets for the Company are becoming
challenging therefore the commercial risk of declining
volume on export front is being effectively mitigated by replacing export volumes with
domestic.
Proper systems are in place to ensure that company’s
production and sales operations are not disrupted. Raw material sourcing, manpower availability,
self- sufficiency in power generations at both the plants
and efficient supply chain and logistic operations both
in-house and outsourced have enabled us mitigate operational
risk to an acceptable level.
Due to effective compliance with laws and regulations and transparent financial reporting
framework there was ‘zero’ Compliance risk posed to the Company. Further, Debt free
balance sheet and natural hedge against foreign currency transactions safeguarded the company from any significant
financial risks
CorporateSocialResponsibility
CharityandDonations EducationalScholarships MedicalAssistanceandPovertyAlleviation
Causes we care about
Continue extending donations to both individuals and
institutions providing welfare.
Continued its committed support to students at IBA, LUMS, KSBL, IoBM, IVS and various other institutions.
Continued to support initiatives of health and
economic upgradation through patronization of Aziz Tabba
Foundation.
Celebrated International Literacy Day, World
Environment Day and Dive Against Debris.
P 40

CorporateSocialResponsibilityYour Company firmly believes in the value-creation for the society it operates in. Therefore, in order to achieve sustainable success your Company has aligned its business operations with the Corporate Social Responsibility road map and continues to make interventions in the areas of education, health and environment.
Under the ambit of providing access to quality education to the deserving, your company offered merit based scholarships to a number of deserving students during the current year . Your company also provided support for the provision of recreational & sports center for healthy schooling activities for female students at an underprivileged school. Playing its part in promoting literacy amongst the masses, your company celebrated International Literacy Day by donating curriculum and literature books to underprivileged schools in Karachi and Pezu during the current year.
Your Company has taken numerous measures in its operations and production to sustain the environment. This year, your company celebrated World Environment Day on June 5th 2015 through awareness building sessions amongst employees, and tree plantation drives at the Karachi and Pezu Plants. Further streamlining its commitment to Corporate Social Responsibility, your company conducted a ‘Dive Against Debris’ for the second year in a row with the aim to clean marine debris and do our part to ‘clean the ocean’. In essence, your Company aims to reduce carbon footprint of its business operations and acknowledges its role for the greater benefit of the community and people.
Sustaining its core value of social development, your Company has devotedly participated in numerous health projects across Pakistan. This includes patronage to Aziz Tabba Foundation, a welfare entity dedicated to raising the standards of health, education, and economic wellbeing of humanity by operating a leading cardiac hospital and a leading kidney center in the country.
P 41
CodeofCorporateGovernanceThe Directors of your Company are aware of their responsibilities under the Code of Corporate Governance (the Code) incorporated in the Listing Rules of the Stock Exchanges in the country under instructions from the Securities & Exchange Commission of Pakistan. Your Company has taken all necessary steps to ensure Good Corporate Governance and full compliance of the Code.
As part of compliance of the code, we confirm the following:
• The financial statements, prepared by the management of the Company, present fairly its state of affairs, the result of its operations, cash flows and changes in equity.
• Proper books of account of the Company have been maintained.
• Appropriate accounting policies have been consistently applied in preparation of financial statements and accounting estimates are based on reasonable and prudent judgment.
• International Financial Reporting Standards, as applicable in Pakistan, have been followed in preparation of financial statements and any departures there from has been adequately disclosed and explained.
• The system of internal control is sound in design and has been effectively implemented and monitored.
• There are no significant doubts upon the company’s ability to continue as a going concern.
• There has been no material departure from the best practices of corporate governance, as detailed in the listing regulations.
• As required by the Code of Corporate Governance, we have included the following information in this report:
• Statement of pattern of shareholding has been given on page no. 182.
• Statement of shares held by associated undertakings and related persons have been given on page no. 185.
• Statement of the Board meetings held during the year and attendance by each director.
• Key operating and financial statistics for last six years have been given on page no. 48.
P 42

BoardofDirectorsBOARD OF DIRECTORS - 5 MEETINGS
S. No. NAME OF DIRECTORS DESIGNATION NO. OF MEETINGS ATTENDED
1 Mr. Muhammed Yunus Tabba (Chairman) Non-Executive Director 5
2 Mr. Muhammed Ali Tabba Executive Director 5
3 Mr. Muhammad Sohail Tabba Non-Executive Director 2
4 Mr. Jawed Yunus Tabba Non-Executive Director 5
5 Mrs. Rahila Aleem Non-Executive Director 5
6 Mrs. Zulekha Tabba Maskatiya Non-Executive Director 4
7 Mr. Muhammad Abid Ganatra Non-Executive Director 5
8 Mr. Tariq Iqbal Khan Independent Director 4
The leave of absence was granted to the Directors who could not
attend the meeting due to their preoccupation.
BOARD COMPOSITIONOur Board comprises of 1 independent, 6 non-executive directors
(including chairman) and 1 executive director. The diverse
knowledge, expertise and skills set of our Board members
enhance the effectiveness of our Board. Our Board composition
represents the interests of all the shareholders and also exhibits
gender diversity.
TRAINING OF THE BOARD The Company takes keen interest in the development of its Board
members and has also carried out training of its Board members
as per the requirements of the Code of Corporate Governance.
During the year, two of our directors Mr. Abid Ganatra and
Mrs. Rahila Aleem completed their Directors’ Training Program
certification. The remaining Directors are either exempted from
the SECP training on account of their experience or are in the
planned list of next round of training sessions.
EVALUATION CRITERIA FOR THE BOARDApart from their mandatory job requirements, the performance
of the Board of our Company is evaluated regularly along the
following parameters, both at individual and team levels.
1. Effectiveness in bringing in a mix of talents, skills and
philosophical perspectives.
2. Integrity, credibility, trustworthiness and active participation
of members.
3. Follow-up and review of annual targets set by the
management.
4. Ability to provide guidance and direction to the Company.
5. Ability to identify aspects of the organization’s performance
requiring action.
6. Review of succession planning of management.
7. Ability to assess and understand the risk exposures of the
Company.
P 43
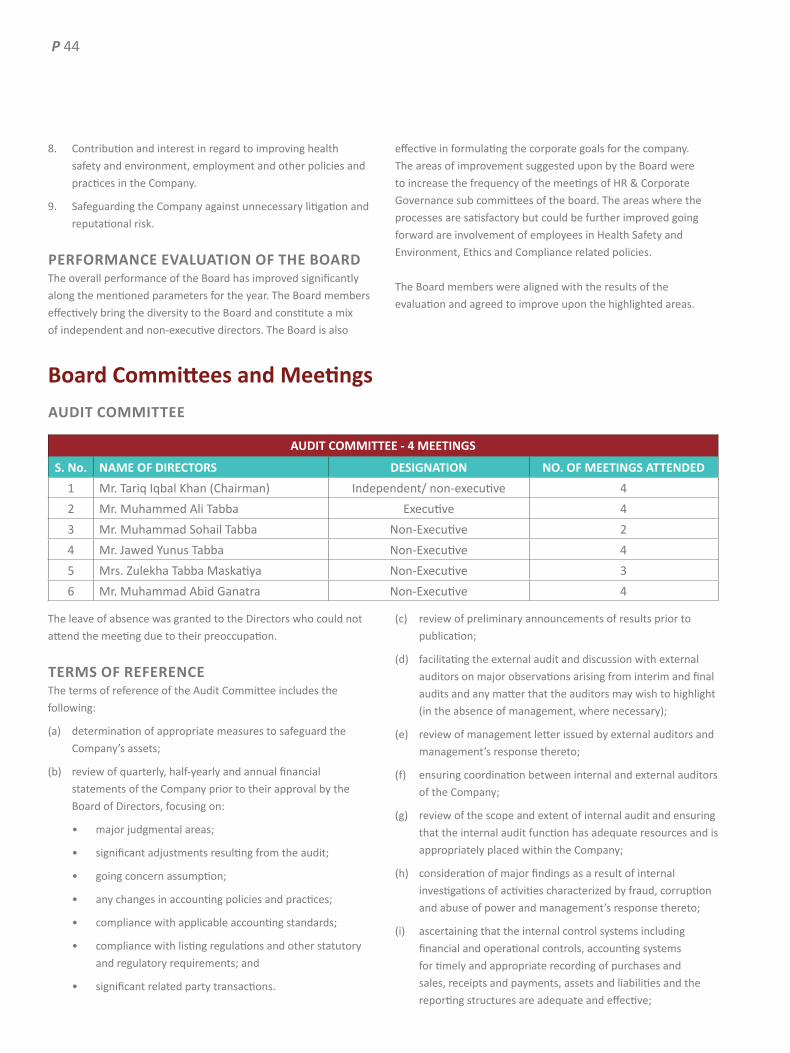
8. Contribution and interest in regard to improving health
safety and environment, employment and other policies and
practices in the Company.
9. Safeguarding the Company against unnecessary litigation and
reputational risk.
PERFORMANCE EVALUATION OF THE BOARD The overall performance of the Board has improved significantly
along the mentioned parameters for the year. The Board members
effectively bring the diversity to the Board and constitute a mix
of independent and non-executive directors. The Board is also
effective in formulating the corporate goals for the company.
The areas of improvement suggested upon by the Board were
to increase the frequency of the meetings of HR & Corporate
Governance sub committees of the board. The areas where the
processes are satisfactory but could be further improved going
forward are involvement of employees in Health Safety and
Environment, Ethics and Compliance related policies.
The Board members were aligned with the results of the
evaluation and agreed to improve upon the highlighted areas.
BoardCommitteesandMeetings
AUDIT COMMITTEE
AUDIT COMMITTEE - 4 MEETINGS
S. No. NAME OF DIRECTORS DESIGNATION NO. OF MEETINGS ATTENDED
1 Mr. Tariq Iqbal Khan (Chairman) Independent/ non-executive 4
2 Mr. Muhammed Ali Tabba Executive 4
3 Mr. Muhammad Sohail Tabba Non-Executive 2
4 Mr. Jawed Yunus Tabba Non-Executive 4
5 Mrs. Zulekha Tabba Maskatiya Non-Executive 3
6 Mr. Muhammad Abid Ganatra Non-Executive 4
The leave of absence was granted to the Directors who could not
attend the meeting due to their preoccupation.
TERMS OF REFERENCEThe terms of reference of the Audit Committee includes the
following:
(a) determination of appropriate measures to safeguard the
Company’s assets;
(b) review of quarterly, half-yearly and annual financial
statements of the Company prior to their approval by the
Board of Directors, focusing on:
• major judgmental areas;
• significant adjustments resulting from the audit;
• going concern assumption;
• any changes in accounting policies and practices;
• compliance with applicable accounting standards;
• compliance with listing regulations and other statutory
and regulatory requirements; and
• significant related party transactions.
(c) review of preliminary announcements of results prior to
publication;
(d) facilitating the external audit and discussion with external
auditors on major observations arising from interim and final
audits and any matter that the auditors may wish to highlight
(in the absence of management, where necessary);
(e) review of management letter issued by external auditors and
management’s response thereto;
(f) ensuring coordination between internal and external auditors
of the Company;
(g) review of the scope and extent of internal audit and ensuring
that the internal audit function has adequate resources and is
appropriately placed within the Company;
(h) consideration of major findings as a result of internal
investigations of activities characterized by fraud, corruption
and abuse of power and management’s response thereto;
(i) ascertaining that the internal control systems including
financial and operational controls, accounting systems
for timely and appropriate recording of purchases and
sales, receipts and payments, assets and liabilities and the
reporting structures are adequate and effective;
P 44

(j) review of the Company’s statement on internal control
systems prior to endorsement by the Board of Directors and
internal audit reports;
(k) instituting special projects, value for money studies or
other investigations on any matter specified by the Board
of Directors in consultation with the CEO and to consider
remittance of any matter to the external auditors or to any
other external body;
(l) determination of compliance with relevant statutory
requirements;
(m) monitoring compliance with the best practices of corporate
governance and identification of significant violations
thereof; and
(n) consideration of any other issue or matter as may be
assigned by the Board of Directors.
BUDGET COMMITTEE
BUDGET COMMITTEE - 1 MEETING
S. No. NAME OF DIRECTORS DESIGNATION NO. OF MEETINGS ATTENDED
1 Mr. Muhammad Sohail Tabba (Chairman) Non - Executive Director -
2 Mr. Muhammad Ali Tabba Executive Director 1
3 Mr. Jawed Yunus Tabba Non - Executive Director 1
4 Mr. Muhammad Abid Ganatra Non - Executive Director 1
The leave of absence was granted to the Chairman on account of
his preoccupation.
TERMS OF REFERENCEThe terms of reference of the Budget Committee includes the
following:
(a) To review and analyze the annual budgets for revenue
and capital expenditures as prepared by the Company and
recommend the final budget to the Board for its approval.
(b) To review and analyze any revision in the budget and suggest
such revision to the Board of Directors for its approval.
(c) To review and analyze the comparison of budget with actual
results on an annual basis and give appropriate direction for
any corrective action in case of major variances.
(d) To recommend any matter of significance to the Board of
Directors.
HR AND REMUNERATION COMMITTEE HR AND REMUNERATION COMMITTEE - 1 MEETING
S. No. NAME OF DIRECTORS DESIGNATION NO. OF MEETINGS ATTENDED
1 Mrs. Rahila Aleem (Chairperson) Non-Executive Director 1
2 Mr. Muhammed Ali Tabba Executive Director 1
3 Mr. Muhammad Sohail Tabba Non-Executive Director -
4 Mr. Jawed Yunus Tabba Non-Executive Director 1
5 Mrs. Zulekha Tabba Maskatiya Non-Executive Director -
The leave of absence was granted to the Directors who could not
attend the meeting due to their preoccupation.
TERMS OF REFERENCE The terms of reference of the Human Resource Committee
includes the following:
(a) recommending human resource management policies to the
board
(b) recommending to the board the selection, evaluation,
compensation (including retirement benefits) and succession
planning of the CEO
(c) recommending to the board the selection, evaluation,
compensation (including retirement benefits) of CFO, COO,
Company Secretary and Head of Internal Audit
(d) consideration and approval on recommendations of CEO
on such matters for key management positions who report
directly to the CEO
P 45

(e) reviewing and evaluating the HR appraisal, development
and succession planning process implemented across the
company
(f) reviewing the audit observations, if any, raised by the internal
and external auditors of the company relating to the HR
function
The TOR for Human Resource Committee has been revised during the year with the approval by the Board of Directors.
CORPORATE GOVERNANCE COMMITTEE
All issues related to Corporate Governance were discussed by the
members during the quarterly held Audit Committee meetings
and therefore no separate meetings were held by Corporate
Governance Committee.
TERMS OF REFERENCEThe terms of reference of the Corporate Governance Committee includes the following:
(a) To adopt appropriate corporate governance policies and procedures with emphasis on the following and make appropriate changes whenever necessary:
• the roles and responsibilities of the Board.
• duties and responsibilities of directors and officers.
• conflict of interest policy and procedures.
• procedures for nomination, selection, and removal of directors.
• disclosures and transparency of the above policies
(b) To provide orientation and training programs for Board members with emphasis on :
• the organization’s vision, mission and corporate strategy.
• the organization’s budget and financial statements and their analysis.
• the roles, duties and responsibilities of the Board Committees, individual Directors and other Executives.
• To review the Company’s “Statement of Compliance with the Code of Corporate Governance Practices” set out in the Company’s Annual Report before publication.
(c) Review Report to the Members on Statement of Compliance with the Best Practices of the Code of Corporate Governance issued by the Statutory auditors.
(d) To identify and assess the potential probable compliance risk and to devise measures to mitigate its impact.
(e) To recommend any matter of significance relating to the Corporate Governance to the Board of Directors.
(f) To comply with the Code of Corporate Governance prevailing in Pakistan as well as to introduce International Best Practices.
(g) To ensure disclosures and transparency of the above policies and material information to the shareholders in the timely manner.
CEOPerformanceReviewThe Board of Directors of Lucky Cement Limited regularly
evaluates performance of the CEO based on the financial and
non-financial KPIs presented by him and agreed by the Board at
the start of the year. The board has reviewed the performance of
the CEO for the current financial year and is truly satisfied with
the achievements for the year. The Board has full confidence in
his abilities to manage the affairs of the company in the most
professional and competent manner. He is also responsible for
setting the corporate objectives and its alignment with the KPIs for
his management team and regularly updates the Board about the
performance of the management team in achieving the desired
goals.
Vision,MissionandOverallCorporateStrategyApprovalbythe BoardThe board of directors has carefully reviewed and approved the
vision, mission and overall corporate strategy of your Company
and believes that it comprehensively reflects the philosophy an
ideology with which Lucky Cement Limited was incorporated.
We ensure that our vision and mission sets the direction for our
overall corporate strategy and our future journey in everything we
do at all levels. The entire organization is connected and driven by
this purpose and it serves as the main decision making criterion in
our day to day business.
QualificationofCFOandHeadofInternalAuditThe Chief Financial Officer and Head of Internal Audit possess the
requisite qualification and experience as prescribed in the Code of
Corporate Governance.
PatternofShareholdingPattern of shareholding of the Company in accordance with the
Companies Ordinance, 1984 and Code of Corporate Governance
as at June 30, 2015 is annexed at page no 182.
P 46

AuditorsThe financial statements of the company for the current year
2014-15 were audited by M/s Ernst & Young Ford Rhodes Sidat
Hyder, Chartered Accountants. The said auditors will retire at
the end of the Annual General Meeting. Being eligible, they
have offered themselves for re-appointment. The Board has
recommended the appointment of M/s Ernst & Young Ford
Rhodes Sidat Hyder, Chartered Accountants as auditors for the
ensuing year, as suggested by the Audit Committee, subject to
approval of the members in the forthcoming Annual General
Meeting.
Future OutlookThe overall future outlook for cement industry is positive. The
increase in domestic sales for the industry is attributable to large
scale infrastructure development plans under execution by the
current government, various on-going residential and commercial
construction projects by private sector and overall economic
prosperity of the country. Apart from the announced and planned
projects, the domestic demand is anticipated to increase to
meet the requirements of maintenance and reconstruction of
destruction caused by recent floods and heavy monsoon. While
the decrease in exports is because of penetration of Iranian
cement in Afghanistan market and anti-dumping duty imposed on
Pakistani cement by South Africa.
Going forward, we believe that the current industry trend will
continue with increase in domestic demand while exports
will remain under pressure. However, your company remains
optimistic about the volumetric growth in the upcoming financial
year. Your company’s strong and debt-free financial position
and free cash flow generating ability would help investing in the
projects and avenues which will bring in further efficiencies and
increase shareholder value. Anticipated improvement in local
demand on the back of infrastructure projects especially on
account of China Pakistan Economic Corridor (CPEC) and stable
coal and fuel prices in the international market will be the major
contributors for the increase in profitability of your company in
the upcoming financial year.
AcknowledgementThe Directors of the Company take this opportunity to express
their sincere gratitude for all the stakeholders for their continued
encouragement and support.
We would like to place on record our sincere appreciation for the
commitment, dedication and hard work put in by every member
of the Lucky family.
And also our shareholders, who have always shown their
confidence and faith in the Company.
On behalf of the Board
MUHAMMAD YUNUS TABBA
Chairman / Director
Karachi: September 8, 2015
P 47

FinancialPosition(PKRinmillion) 2010 2011 2012 2013 2014 2015
AssetsEmployed
Property, plant and equipment 31,378 31,705 31,017 31,008 31,937 35,019
Intangible Assets 3 2 1 5 28 42
Long term investments - - - 5,619 8,158 10,925
Long term advance 55 55 55 554 72 79
Long term deposit & deferred cost 2 3 3 3 3 3
Current assets 6,871 9,444 9,555 13,007 19,672 27,018
TotalAssets 38,310 41,210 40,631 50,196 59,870 73,086
FinancedBy
Shareholders’ Equity 25,096 27,773 33,262 41,035 49,792 59,259
Long-term liabilities
Long term finance 1,659 658 393 127 - -
Current portion of long term finance 176 265 265 265 127 -
1,834 923 658 393 127 -
Long term deposits and deferred liabilities 1,914 2,082 3,352 5,187 5,521 6,396
Current liabilities 9,642 10,697 3,624 3,846 4,556 7,431
Current portion of long term finance (176) (265) (265) (265) (127) -
9,466 10,432 3,359 3,580 4,428 7,431
TotalFundsInvested 38,310 41,210 40,631 50,196 59,870 73,086
Turnover&Profit
Turnover 24,509 26,018 33,323 37,810 43,083 44,761
Gross Profit 7,979 8,711 12,721 16,756 18,690 20,183
Operating Profit 4,243 5,161 9,010 12,412 14,548 16,138
Profit before taxation 3,418 4,321 8,324 11,746 14,456 15,912
Total comprehensive income 3,137 3,970 6,782 9,714 11,344 12,377
Cash Dividends 1,294 1,294 1,294 1,940 2,587 2,910
General Reserve 5,000 2,500 2,500 5,000 7,871 8,433
Profit carried forward 4,519 4,696 7,685 10,459 11,344 12,377
Earning per share (PKR) 9.70 12.28 20.97 30.15 35.08 38.44
CashFlowSummary
Net Cash from Operating Activities 5,267 4,074 9,375 12,246 13,566 19,009
Net Cash used in Investing Activities (2,315) (1,895) (1,030) (8,094) (4,949) (8,137)
Net Cash (Outflow) / Inflow from Financing Activities (3,529) (2,161) (7,851) (2,191) (2,833) (3,019)
(Decrease) /Increase in Cash and Cash Equivalents (577) 18 493 1,961 5,785 7,854
Cash and Cash Equivalents at beginning of the Year 911 334 351 844 2,806 8,591
Cash and Cash Equivalents at end of the Year 334 351 844 2,806 8,591 16,445
SIX YEARS AT A GLANCE
P 48

PKRin‘000 2010 2011 2012 2013 2014 2015
Share Capital & Reserves 25,095,929 27,772,829 33,261,745 41,035,443 49,792,183 59,258,770
Non Current Liabilities 3,572,624 2,740,237 3,745,172 5,314,888 5,521,483 6,396,392
Current Liabilities 9,641,691 10,696,789 3,624,324 3,845,844 4,555,965 7,430,703
TotalEquity&Liabilities 38,310,244 41,209,855 40,631,241 50,196,175 59,869,631 73,085,865
Non Current Assets 31,438,780 31,765,389 31,076,594 37,189,583 40,198,033 46,067,916
Current Assets 6,871,464 9,444,466 9,554,647 13,006,592 19,671,598 27,017,949
TotalAssets 38,310,244 41,209,855 40,631,241 50,196,175 59,869,631 73,085,865
VerticalAnalysis-%
Share Capital & Reserves 65.50 67.39 81.86 81.75 83.17 81.08
Non Current Liabilities 9.33 6.65 9.22 10.59 9.22 8.75
Current Liabilities 25.17 25.96 8.92 7.66 7.61 10.17
TotalEquity&Liabilities 100.00 100.00 100.00 100.00 100.00 100.00
Non Current Assets 82.06 77.08 76.48 74.09 67.14 63.03
Current Assets 17.94 22.92 23.52 25.91 32.86 36.97
TotalAssets 100.00 100.00 100.00 100.00 100.00 100.00
HorizontalAnalysis(i)Cumulative%
Share Capital & Reserves 100.00 10.67 32.54 63.51 98.41 136.13
Non Current Liabilities 100.00 (23.30) 4.83 48.77 54.55 79.04
Current Liabilities 100.00 10.94 (62.41) (60.11) (52.75) (22.93)
TotalEquity&Liabilities 100.00 7.57 6.06 31.03 56.28 90.77
Non Current Assets 100.00 1.04 (1.15) 18.29 27.86 46.53
Current Assets 100.00 37.44 39.05 89.28 186.28 293.19
TotalAssets 100.00 7.57 6.06 31.03 56.28 90.77
HorizontalAnalysis(ii)YearonYear% 2010 2011vs 2012vs 2013vs 2014vs 2015vs
2010 2011 2012 2013 2014
Share Capital & Reserves 100.00 10.67 19.76 23.37 21.34 19.01
Non Current Liabilities 100.00 (23.30) 36.67 41.91 3.89 15.85
Current Liabilities 100.00 10.94 (66.12) 6.11 18.46 63.10
TotalEquity&Liabilities 100.00 7.57 (1.40) 23.54 19.27 22.08
Non Current Assets 100.00 1.04 (2.17) 19.67 8.09 14.60
Current Assets 100.00 37.44 1.17 36.13 51.24 37.34
TotalAssets 100.00 7.57 (1.40) 23.54 19.27 22.08
ANALYSIS OF BALANCE SHEET
P 49

PKRin‘000 2010 2011 2012 2013 2014 2015 Turnover 24,508,793 26,017,519 33,322,535 37,810,456 43,083,169 44,761,307 Cost of Sales 16,529,932 17,306,400 20,601,261 21,054,058 24,393,064 24,578,219 GrossProfit 7,978,861 8,711,119 12,721,274 16,756,398 18,690,105 20,183,088Distribution Cost 3,433,047 3,236,425 3,236,721 3,664,019 3,382,156 3,127,018 Administrative Cost 303,244 313,389 474,135 680,347 760,269 917,635 OperatingProfit 4,242,570 5,161,305 9,010,418 12,412,032 14,547,680 16,138,435Finance Cost 569,184 517,788 253,234 75,829 34,225 25,750 (Other Income)/Charges 255,872 322,996 433,207 590,335 57,090 200,891 Profitbeforetaxation 3,417,514 4,320,521 8,323,977 11,745,868 14,456,365 15,911,794Taxation 280,057 350,121 1,541,561 1,997,106 3,111,962 3,480,196 Profitaftertaxation 3,137,457 3,970,400 6,782,416 9,748,762 11,344,403 12,431,598OtherComprehensiveIncome - - - (34,814) (663) (54,636)Total Comprehensive Income 3,137,457 3,970,400 6,782,416 9,713,948 11,343,740 12,376,962 VerticalAnalysis-% Turnover 100.00 100.00 100.00 100.00 100.00 100.00 Cost of Sales 67.44 66.52 61.82 55.68 56.62 54.91 GrossProfit 32.56 33.48 38.18 44.32 43.38 45.09Distribution Cost 14.01 12.44 9.71 9.69 7.85 6.99 Administrative Cost 1.24 1.20 1.42 1.80 1.76 2.05 OperatingProfit 17.31 19.84 27.04 32.83 33.77 36.05Finance Cost 2.32 1.99 0.76 0.20 0.08 0.06 (Other Income)/Charges 1.04 1.24 1.30 1.56 0.13 0.45 Profitbeforetaxation 13.94 16.61 24.98 31.07 33.55 35.55Taxation 1.14 1.35 4.63 5.28 7.22 7.78 Profitaftertaxation 12.80 15.26 20.35 25.78 26.33 27.77Other Comprehensive Income - - - (0.09) - (0.12)Total Comprehensive Income 12.80 15.26 20.35 25.69 26.33 27.65 HorizontalAnalysis(i)Cumulative-% Turnover 100.00 6.16 35.96 54.27 75.79 82.63 Cost of Sales 100.00 4.70 24.63 27.37 47.57 48.69 GrossProfit 100.00 9.18 59.44 110.01 134.25 152.96Distribution Cost 100.00 (5.73) (5.72) 6.73 (1.48) (8.91)Administrative Cost 100.00 3.35 56.35 124.36 150.71 202.61 OperatingProfit 100.00 21.66 112.38 192.56 242.90 280.39Finance Cost 100.00 (9.03) (55.51) (86.68) (93.99) (95.48)Other Income/Charges 100.00 26.23 69.31 130.71 (77.69) (21.49)Profitbeforetaxation 100.00 26.42 143.57 243.70 323.01 365.60Taxation 100.00 25.02 450.45 613.11 1,011.19 1,142.67 Profitaftertaxation 100.00 26.55 116.18 210.72 261.58 296.23Other Comprehensive Income 100.00 - - (100.00) (100.00) (100.00)Total Comprehensive Income 100.00 26.55 116.18 209.61 261.56 294.49 HorizontalAnalysis(ii)YearonYear% 2010 2011vs 2012vs 2013vs 2014vs 2015vs 2010 2011 2012 2013 2014 Turnover 100.00 6.16 28.08 13.47 13.95 3.90 Cost of Sales 100.00 4.70 19.04 2.20 15.86 0.76 GrossProfit 100.00 9.18 46.03 31.72 11.54 7.99Distribution Cost 100.00 (5.73) 0.01 13.20 (7.69) (7.54)Administrative Cost 100.00 3.35 51.29 43.49 11.75 20.70 OperatingProfit 100.00 21.66 74.58 37.75 17.21 10.93Finance Cost 100.00 (9.03) (51.09) (70.06) (54.87) (24.76)Other Income/Charges 100.00 26.23 34.12 36.27 (90.33) 251.88 Profitbeforetaxation 100.00 26.42 92.66 41.11 23.08 10.07Taxation 100.00 25.02 340.29 29.55 55.82 11.83 Profitaftertaxation 100.00 26.55 70.82 43.74 16.37 9.58Other Comprehensive Income 100.00 - - (100.00) (98.10) 8,140.72 Total Comprehensive Income 100.00 26.55 70.82 43.22 16.78 9.11
ANALYSIS OF PROFIT AND LOSS ACCOUNT
P 50

UoM 2010 2011 2012 2013 2014 2015
ProfitabilityRatios
Gross profit to sales percent 32.56% 33.48% 38.18% 44.32% 43.38% 45.09%
Net profit after tax to sales percent 12.80% 15.26% 20.35% 25.78% 26.33% 27.77%
EBITDA to sales percent 23.07% 25.88% 32.21% 37.81% 38.58% 41.17%
Operating Leverage percent 595.79% 351.78% 265.61% 280.31% 123.39% 280.73%
Return on Equity after tax percent 12.50% 14.30% 20.39% 23.67% 22.78% 20.89%
Return on Capital Employed percent 11.55% 14.39% 21.85% 25.97% 24.94% 22.70%
LiquidityRatios
Current ratio times 0.71 : 1 0.88 : 1 2.64 : 1 3.38 : 1 4.32 : 1 3.64 : 1
Quick/Acid test ratio times 0.23 : 1 0.18 : 1 0.80 : 1 1.66 : 1 2.62 : 1 2.75 : 1
Cash to Current Liabilities times 0.03 : 1 0.03 : 1 0.23 : 1 0.73 : 1 1.89 : 1 2.21 : 1
Cash flow from Operations to Sales times 0.21 : 1 0.16 : 1 0.28 : 1 0.32 : 1 0.31 : 1 0.42 : 1
Activity/TurnoverRatios
Inventory turnover times 3.58 2.84 2.89 3.17 3.40 3.44
No. of days in Inventory days 101.96 128.52 126.30 115.14 107.35 106.10
Debtor turnover times 23.95 37.16 39.87 27.81 23.00 21.73
No. of days in Receivables days 15.24 9.82 9.15 13.12 15.87 16.80
Creditor turnover times 5.78 4.88 5.58 6.09 6.36 4.69
No. of days in Payables days 63.15 74.80 65.41 59.93 57.39 77.83
Operating Cycle days 54.05 63.54 70.04 68.33 65.83 45.07
Total assets turnover times 0.64 0.63 0.82 0.75 0.72 0.61
Fixed assets turnover times 0.78 0.82 1.07 1.22 1.35 1.28
InvestmentValuationRatios
Earnings per share (after tax) rupees 9.70 12.28 20.97 30.15 35.08 38.44
Price / Earning ratio (after tax) times 6.40 5.77 5.50 6.96 11.70 13.52
Dividend Yield percent 6.44% 5.65% 5.20% 3.81% 2.19% 1.73%
Dividend Payout ratio percent 41.23% 32.58% 28.61% 26.54% 25.65% 23.41%
Dividend Cover ratio times 2.43 3.07 3.50 3.77 3.90 4.27
Cash Dividend per share rupees 4.00 4.00 6.00 8.00 9.00 9.00
Break up value per share rupees 77.61 85.88 102.86 126.90 153.98 183.25
Market Value Per Share as on 30th June rupees 62.14 70.84 115.39 209.72 410.30 519.62
CapitalStructureRatios
Financial leverage ratio times 0.32 : 1 0.26 : 1 0.02 : 1 0.01 : 1 0.00 : 1 0.00 : 1
Weighted Average Cost of Debt percent 6.12% 6.76% 6.42% 14.43% 13.15% 40.39%
Debt to Equity ratio times 0.07 : 1 0.02 : 1 0.01 : 1 0.00 : 1 0.00 : 1 0.00 : 1
Interest Coverage ratio times 7.45 9.97 35.58 163.68 425.06 626.74
FINANCIAL RATIOS
P 51

STATEMENT OF VALUE ADDITIONAND WEALTH DISTRIBUTION 2015 2014
PKRin‘000’ % PKRin‘000’ %
WEALTHGENERATED
Total revenue inclusive of sales tax and other income 53,919,310 51,412,926
Bought-in-material and services (20,295,589) (21,263,037)
33,623,721 100.0% 30,149,889 100.0%
WEALTHDISTRIBUTION
ToEmployees
Salaries, benefits and other costs 2,297,999 6.8% 1,848,241 6.1%
To Government
Income tax, sales tax, excise duty and others 13,502,619 40.2% 12,003,604 39.8%
ToSociety
Donation towards education, health and environment 244,170 0.7% 274,081 0.9%
ToProvidersofCapital
Dividend to shareholders 2,910,375 8.7% 2,587,000 8.6%
Markup / Interest expenses on borrowed funds 1,832 0.0% 19,920 0.1%
ToCompany
Depreciation, amortization & retained profit 14,666,726 43.6% 13,417,043 44.5%
33,623,721 100.0% 30,149,889 100.0%
Wealth Distribution 2015(Percentage)
To Government – 40.2%
To Society – 0.7%
To providers of capital – 8.7%
To Company – 43.6%
To Employees – 6.8%
Wealth Distribution 2014(Percentage)
To Government – 39.8%
To Society – 0.9%
To providers of capital – 8.7%
To Company – 44.5%
To Employees – 6.1%
P 52

NOTES ON ANALYSISComments on Six Year StatementofComprehensiveIncomeAnalysisTurnoverRevenues increased from PKR 24.5 billion in 2010 to PKR
44.8 billion in 2015 with an increase of 82.63%. This is
mainly attributed to increase in sales volume and net
retention.
CostofSalesCost increased from PKR 16.5 billion in 2010 to PKR 24.6
billion in 2015 with an increase of 48.6%. This is mainly
attributed to increase in costs of main raw material inputs
and fuel & power cost over the period.
GrossProfit(GP)GP increased from PKR 8.0 billion in 2010 to PKR 20.2
billion in 2015 with an increase of 152.9%. This is mainly
attributed to use of efficient and cost effective alternative
energy sources. Utilization of Waste Heat Recovery to
curtail power cost which contributed to decrease in cost
and attributed to increase in GP.
NetProfitNet profit increased from PKR 3.13 billion in 2010 to 12.43
billion in 2015 with an increase of 296%, attributable
mainly to increased sales and volume and continuous
strive of cost reduction initiatives.
Comments on Six Year StatementofFinancialPositionAnalysisShare Capital & ReservesShare Capital remained the same however, reserves
increased due to increase in undistributed profits kept to
utilize in new projects / investments.
NonCurrentLiabilities(NCL)There is an increase of 79.04% in NCL from 2010 to 2015,
mainly on account of Deferred Tax Liability.
NonCurrentAssets(NCA)There is an increase of 46.53% in NCA from 2010 to 2015
mainly due to capital expenditures on Alternative energy,
WHR, Ventometic Packing Plant, Vertical Grinding Mill and
equity investment in acquisition of ICI and other offshore
projects in Iraq and DR Congo.
Comments on Six Year StatementofCashFlowsAnalysisLucky Cement has a persuasive cash flow system. The
liquidity of the Company improved substantially due to
improved margins. The company has no borrowings as
of 30 June 2015 and all the projects and investments are
primarily financed by internally generated cash flows.
P 53

4th Quarter’s performance was the best in terms of Gross Profit (GP) margin of 47%, Operating Profit (OP) margin of 40% and
EBITDA Margins of 46% mainly on account of costs savings from lower coal and fuel costs, operational savings from WHR
and Vertical Cement Mills installed at the end of 3rd Quarter.
However, 3rd Quarter outperformed all the other quarters in terms of bottom-line profitability and Earnings Per Share (EPS);
which was not only on account of highest sales volumes but also due to lower effective tax rate coming from tax credits
from capitalization of major projects (like vertical cement mills and WHR plant at Karachi) during this quarter. 3rd Quarter
contributed cement sales volumes of 1.78 Million Tons and bottom-line profitability of PKR 3.7 Billion in values and 32% in
terms of Net Profit after tax margin.
AnalysisofVariationinInterimPeriodsParticulars Qtr-1 Qtr-2 Qtr-3 Qtr-4 FY2014-15
Sales Volume (in ‘000 Tons) 1,607 1,646 1,781 1,761 6,794
Sales Revenue (Net) 10,470 10,940 11,739 11,613 44,761
Cost of Goods Sold 6,058 6,074 6,340 6,105 24,578
GrossProfit 4,412 4,865 5,399 5,508 20,183
Gross Profit Margin 42% 44% 46% 47% 45%
OperatingProfit 3,335 3,765 4,373 4,665 16,138
Operating Profit Margin 32% 34% 37% 40% 36%
EBITDA 3,874 4,312 4,921 5,321 18,428
EBITDA Margin 37% 39% 42% 46% 41%
NetProfitBeforeTax 3,345 3,712 4,313 4,542 15,912
Taxation 676 780 611 1,413 3,480
NetProfitAfterTax 2,669 2,932 3,702 3,129 12,432
Net Profit After Tax Margin 25% 27% 32% 27% 28%
EPS in PKR 8.25 9.07 11.45 9.67 38.44
Amount in PKR Million (Except EPS)
P 54

COMPOSITION OF BALANCE SHEET
Equity and Liabilities – 2015(Percentage)
Share Capital & Reserves – 81%
Other Non Current Liabilities – 9%
Trade Payable and Others – 9%
Other Current Liabilities – 1%
Equity and Liabilities – 2014(Percentage)
Share Capital & Reserves – 83%
Other Non Current Liabilities – 9%
Trade Payable and Others – 7%
Other Current Liabilities – 1%
Assets – 2015(Percentage)
Property, Plant and Equipment – 48%
Trade Debts – 3%Stock in Trade – 2%
Store and Spares – 7%
Cash and Bank Balances – 22%
Other Assets – 3%
Long Term Investments – 15%
Assets – 2014(Percentage)
Property, Plant and Equipment – 54%
Trade Debts – 3%Stock in Trade – 3%
Store and Spares – 10%
Cash and Bank Balances – 14%
Other Assets – 2%
Long Term Investments – 14%
P 55
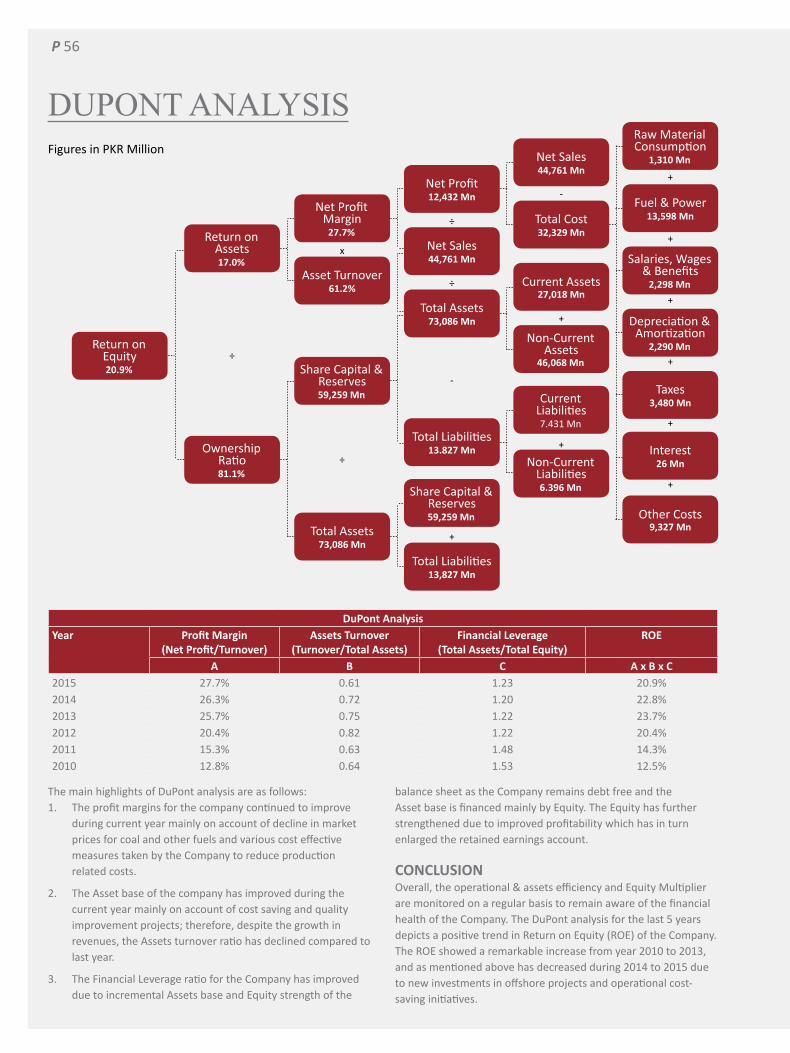
DUPONT ANALYSISRaw Material Consumption
1,310Mn
+
+
+
+
+
-
÷
x
÷
÷
÷
-
+
+
+
+
Fuel & Power13,598Mn
Net Sales44,761Mn
Net Profit12,432Mn
Return on Assets17.0%
Return on Equity20.9%
Ownership Ratio81.1%
Net Profit Margin27.7%
Share Capital & Reserves 59,259Mn
Total Assets73,086Mn
Salaries, Wages & Benefits2,298Mn
Total Cost32,329Mn
Net Sales44,761Mn
Asset Turnover61.2%
Depreciation & Amortization
2,290Mn
Current Assets27,018Mn
Total Assets73,086Mn
Taxes3,480Mn
Non-Current Assets
46,068Mn
Total Liabilities13.827Mn Interest
26Mn
Current Liabilities7.431 Mn
Share Capital & Reserves59,259Mn Other Costs
9,327Mn
Non-Current Liabilities6.396Mn
Total Liabilities13,827Mn
The main highlights of DuPont analysis are as follows:1. The profit margins for the company continued to improve
during current year mainly on account of decline in market prices for coal and other fuels and various cost effective measures taken by the Company to reduce production related costs.
2. The Asset base of the company has improved during the current year mainly on account of cost saving and quality improvement projects; therefore, despite the growth in revenues, the Assets turnover ratio has declined compared to last year.
3. The Financial Leverage ratio for the Company has improved due to incremental Assets base and Equity strength of the
DuPontAnalysisYear ProfitMargin
(NetProfit/Turnover)Assets Turnover
(Turnover/TotalAssets)Financial Leverage
(TotalAssets/TotalEquity)ROE
A B C A x B x C2015 27.7% 0.61 1.23 20.9%2014 26.3% 0.72 1.20 22.8%2013 25.7% 0.75 1.22 23.7%2012 20.4% 0.82 1.22 20.4%2011 15.3% 0.63 1.48 14.3%2010 12.8% 0.64 1.53 12.5%
balance sheet as the Company remains debt free and the Asset base is financed mainly by Equity. The Equity has further strengthened due to improved profitability which has in turn enlarged the retained earnings account.
CONCLUSIONOverall, the operational & assets efficiency and Equity Multiplier are monitored on a regular basis to remain aware of the financial health of the Company. The DuPont analysis for the last 5 years depicts a positive trend in Return on Equity (ROE) of the Company. The ROE showed a remarkable increase from year 2010 to 2013, and as mentioned above has decreased during 2014 to 2015 due to new investments in offshore projects and operational cost-saving initiatives.
Figures in PKR Million
P 56

FINANCIALS AT A GLANCECost of Sales(PKR in Million)
0
5,000
10,000
15,000
20,000
25,000
20112010 2012 2013 2014 2015
16,53017,306
20,601 21,054
24,393 24,578
Net Profit(PKR in Million)
0
3,000
6,000
9,000
12,000
15,000
20112010 2012 2013 2014 2015
3,1373,970
6,782
9,749
11,34412,432
Long Term Finance(PKR in Million)
0
500
1,000
1,500
2,000
20112010 2012 2013 2014 2015
1,659
658
393
1270 0
Sales Revenue(PKR in Million)
0
10,000
20,000
30,000
40,000
50,000
20112010 2012 2013 2014 2015
24,50926,018
33,323
37,810
43,08344,761
Gross Profit(PKR in Million)
0
5,000
10,000
15,000
20,000
25,000
20112010 2012 2013 2014 2015
7,979
8,712
12,721
16,756
18,69020,183
Shareholders’ Equity(PKR in Million)
0
10,000
20,000
30,000
40,000
50,000
60,000
20112010 2012 2013 2014 2015
25,096
27,773
33,262
41,035
49,792
59,259
P 57

SHARE PRICE SENSITIVITY ANALYSIS
Lucky Cement Limited’s Shares (LUCK) are traded on Karachi,
Lahore Islamabad and London Stock Exchanges. Our free float is
35.65% and market capitalization at the end of day of fiscal year
was PKR 168 Billion. There are many factors which might affect the
share price of our Company, few of which are listed below.
ProfitabilityImproved margins on account of lower production costs can
contribute towards improved profitability and EPS which may
increase the market share price.
CommodityPricesIncrease or decrease in major input price (coal, power and raw
material tariffs) can positively or negatively affect the margins and
increase or decrease the EPS which in turn can drive the market
share price upwards or downwards.
RegulationsandGovernmentPoliciesThe share price is also sensitive to any changes in policies by
the government and regulatory authorities; both specific to
the cement sector and overall business activities may affect the
market share prices; either positively or negatively, depending on
whether the policy is in favor of or against the industry.
CurrencyRiskThe volatility in currency exchange rates can also affect the market
share prices as Lucky Cement is engaged in both export and
import (exports of cement and import of fuels) so the margins can
be affected positively or negatively.
Market RiskApart from systematic risk, the market share price is also exposed
to all the risks of the stock exchanges it is trading on. The Beta of
Lucky Cement with respect to KSE 100 index is 0.94.
Diversification:The Company has diversified portfolio both in terms of
geographical location and nature of business. Our international
footprint also opens us to the benefits and risks of the markets
we are operating in and our business diversification affects our
consolidated earnings, which in turn also affects our EPS and
therefore can drive our share price positively or negatively.
GoodwillThe market share price can also vary with the investors’
sentiments towards the company which changes very quickly in
response to the news and events and also because of investors’
following of the general market trend.
Share Price SensitivityData Source: Karachi Stock Exchange
300
350
400
450
500
550
600
20,000
22,000
24,000
26,000
28,000
30,000
32,000
34,000
36,000
Jul-14 Aug-14 Sep-14 Oct-14 Nov-14 Dec-14 Jan-15 Feb-15 Mar-15 Apr-15 May-15 Jun-15
KSE Index-100 LUCKY Cement
Luck
y Ce
men
t Sha
re P
rice
(PKR
)
KSE
100
Inde
x (p
oint
s) P 58

CORPORATE ANALYSISLucky Cement Limited has been growing with the prime objective of maximizing value for all the stakeholders. The company uses it strengths to capitalize on opportunities, overcome its weaknesses and avert threats. Keeping this in perspective, our pursuits consist of diverse strategies having external and internal origins.
StrengthsLucky Cement, a part of YBG, is one of the largest cement
producers in Pakistan. It is not only the market leader in
Pakistan’s cement industry but it also enjoys top of the mind
recall with customers. The company is the lowest cost producer
in the industry while grossing the highest profits and highest
EPS. The capacity utilization of Lucky Cement is higher than the
industry average and its balance sheet is recognized as the most
deleveraged one in the cement industry.
The strategic plant locations both in the Northern and Southern
region of Pakistan, gives the company access to a nationwide
market and mitigates exposure to any localized risks. The
company has an extensive dealership network of more than
200 dealers and distributors. Also, the company’s smart logistic
setup and management enables it to effectively cater to both the
international as well as the domestic markets. Among Pakistan’s
cement players, Lucky Cement is the largest exporter of cement
and has the strongest international presence. It is the only cement
company in Pakistan which has silos at the Port and thus, is able to
export loose cement.
The human capital of Lucky Cement is a key asset of the company.
Mr. Muhammad Ali Tabba, the young and dynamic CEO, is
supported by a team of professionals with diverse skills set.
The company has also successfully demonstrated that it is an
environmentally responsible organization by launching eco-
friendly projects such as Waste Heat Recovery and alternate
fuels. The carbon emissions by Lucky Cement are well below the
country’s regulatory limits.
Weaknesses
Although Lucky Cement has a leadership position in Pakistan’s
cement industry, it has limited presence in some markets. It is
becoming increasingly important for company to expand into
other markets as and when opportunities are created.
OpportunitiesPakistan has a very low per Capita consumption of cement as
compared to its neighboring countries and therefore significant
growth opportunities are available for the company. The
positive demographic trends like growing population, increasing
urbanization and rising income levels are the key demand drivers.
Recent launch of China–Pakistan Economic Corridor initiative
presents a great opportunity for long term growth of the industry.
On the back of all these developments, the focus is shifting more
towards the domestic market in general and Lucky Cement in
particular.
ThreatsExports are becoming challenging due to downward trend of
commodity prices globally and devaluation of currency of key
export markets to US dollar. Local operations are becoming more
viable as compared to commercial import of cement in countries
which are the export markets for Lucky Cement. The changing
local market dynamics has mitigated this threat as the export
volumes are now getting substituted by local sales.
Risk and Management StrategiestoMitigateTheseRisksLucky Cement Limited launched the Lean Enterprise Risk
Management framework in 2014 as an on-going process
embedded across the organization. Risk management at Lucky
Cement is considered vital to the creation and enhancement
of shareholder value. The uncertainties and risks that may
influence the achievement of our corporate goals and objectives
are managed while opportunities are tapped into. Strategic,
Commercial, Operational, Financial and Compliance risks are
ranked based on their impact on Lucky Cement and probability of
occurrence. Upon identification of risks, mitigating strategies and
action plans are developed, implemented and monitored.
P 59

STRATEGICRISKS
TYPEOFRISKS MITIGATING ACTION
GasSupplyShortfallFluctuation in gas supply at production sites due to curtailment, gas reserve depletion or revision in gas allocation policy.
Liaison with the gas distribution companies results in minimal curtailment. Moreover, sufficient quantity of alternative fuel is maintained to be used in case of severe gas shortage. Lucky Cement has also installed Waste Heat Recovery units, hence reducing its current consumption of gas for generation of power.
GasTariffhike/FuelpriceincreaseininternationalmarketIncrease in gas tariffs or imported coal price resulting in higher cost of production.
Impact of gas tariff hike and fuel price increases in international market are neutralized by the cost reduction initiatives taken by the company. Coal prices in international market are observed very closely by our trade team and orders are placed either in advance or stopped keeping in view the expected pricing patterns. TDF and RDF processes are in place, reducing dependence on coal if coal prices in international market go up.
AttractingandRetainingTalentIt is critical for us to attract, develop, and retain top talent to ensure sustainable growth
Efforts are made to ensure growth and well-being of our employees. As we greatly value our intellectual capital, various programs are in place to recruit, identify and develop high potential resources. Initiatives are taken to increase workplace diversity, resulting in a more effective workforce.
COMMERCIALRISKS
TYPEOFRISKS MITIGATING ACTION
ChangeincompetitivescenarioThreat of local and foreign players causing a change in market dynamics
Lucky Cement encourages competition in the industry as it creates pressure for it to be efficient and competitive in the market to capture more market share and at the same time be a profitable company for the shareholders to get good return on investment. The company has no threat from any change of market dynamics due to the fact that the company is the low cost producer and has the strategic plant locations.
Export marketsDecline in Pakistan’s cement export dispatches due to various external challenges
The company is focusing on sustaining its export client base through providing consistent quality and brining in efficiency so that the company is either able to pass the benefit on to the customers or is able to sustain any cost pressures which could result in price hike otherwise. The company is also able to replace export volumes with the local sales due to its product quality, brand recognition, strategic plant locations, strong supply chain and logistic support.
OPERATIONALRISKS
TYPEOFRISKS MITIGATING ACTION
InformationSystemRiskLoss of data or theft thereof
Information is transmitted through secure connections and firewalls are in place to prevent any possible malicious intent.
LawandOrderuncertaintyLoss may occur due to terrorism activities and sabotage
Security system is continuously monitored and enhanced to safeguard against such threats. Moreover, Lucky Cement collaborates with the local law enforcement agencies to counter potential threats.
Maintenance RiskPossibility of production loss due to capacity or service factor
Effective technical monitoring programs with regards to predictive and preventive maintenance are in place to ensure maximum plant efficiency and capacity utilization.
P 60
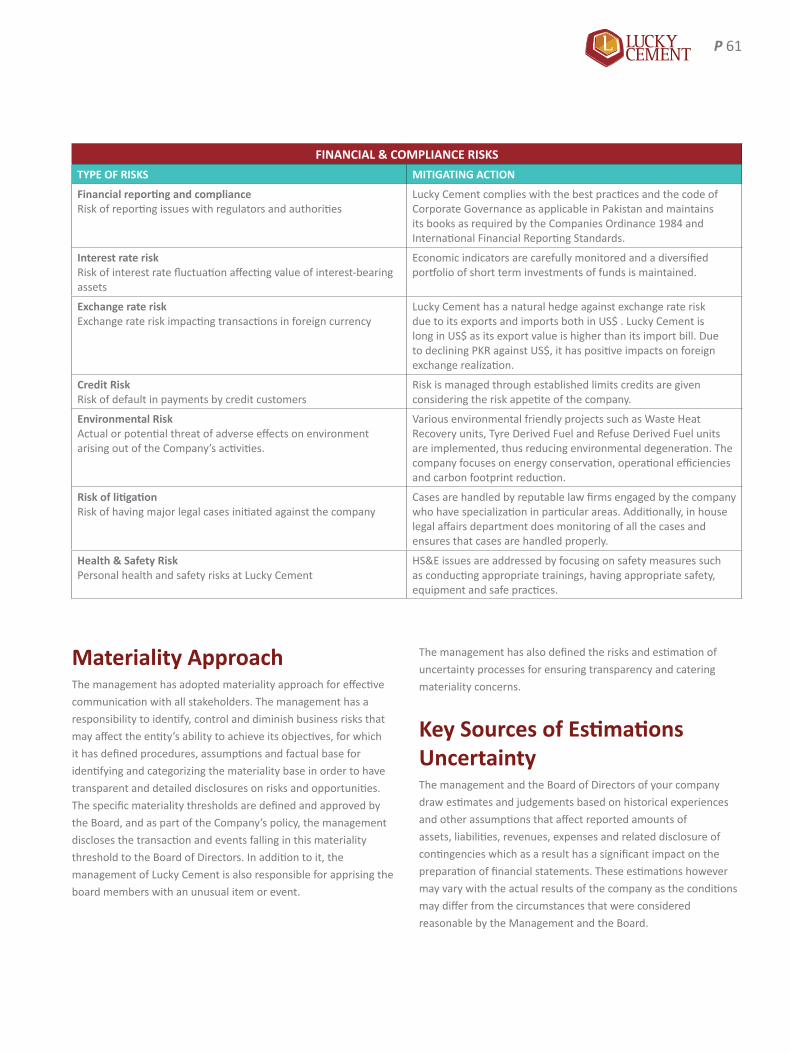
FINANCIAL&COMPLIANCERISKS
TYPEOFRISKS MITIGATING ACTION
FinancialreportingandcomplianceRisk of reporting issues with regulators and authorities
Lucky Cement complies with the best practices and the code of Corporate Governance as applicable in Pakistan and maintains its books as required by the Companies Ordinance 1984 and International Financial Reporting Standards.
Interest rate riskRisk of interest rate fluctuation affecting value of interest-bearing assets
Economic indicators are carefully monitored and a diversified portfolio of short term investments of funds is maintained.
Exchange rate risk Exchange rate risk impacting transactions in foreign currency
Lucky Cement has a natural hedge against exchange rate risk due to its exports and imports both in US$ . Lucky Cement is long in US$ as its export value is higher than its import bill. Due to declining PKR against US$, it has positive impacts on foreign exchange realization.
Credit RiskRisk of default in payments by credit customers
Risk is managed through established limits credits are given considering the risk appetite of the company.
Environmental RiskActual or potential threat of adverse effects on environment arising out of the Company’s activities.
Various environmental friendly projects such as Waste Heat Recovery units, Tyre Derived Fuel and Refuse Derived Fuel units are implemented, thus reducing environmental degeneration. The company focuses on energy conservation, operational efficiencies and carbon footprint reduction.
RiskoflitigationRisk of having major legal cases initiated against the company
Cases are handled by reputable law firms engaged by the company who have specialization in particular areas. Additionally, in house legal affairs department does monitoring of all the cases and ensures that cases are handled properly.
Health&SafetyRiskPersonal health and safety risks at Lucky Cement
HS&E issues are addressed by focusing on safety measures such as conducting appropriate trainings, having appropriate safety, equipment and safe practices.
MaterialityApproachThe management has adopted materiality approach for effective
communication with all stakeholders. The management has a
responsibility to identify, control and diminish business risks that
may affect the entity’s ability to achieve its objectives, for which
it has defined procedures, assumptions and factual base for
identifying and categorizing the materiality base in order to have
transparent and detailed disclosures on risks and opportunities.
The specific materiality thresholds are defined and approved by
the Board, and as part of the Company’s policy, the management
discloses the transaction and events falling in this materiality
threshold to the Board of Directors. In addition to it, the
management of Lucky Cement is also responsible for apprising the
board members with an unusual item or event.
The management has also defined the risks and estimation of
uncertainty processes for ensuring transparency and catering
materiality concerns.
KeySourcesofEstimationsUncertaintyThe management and the Board of Directors of your company
draw estimates and judgements based on historical experiences
and other assumptions that affect reported amounts of
assets, liabilities, revenues, expenses and related disclosure of
contingencies which as a result has a significant impact on the
preparation of financial statements. These estimations however
may vary with the actual results of the company as the conditions
may differ from the circumstances that were considered
reasonable by the Management and the Board.
P 61

Key estimates and assumptions concerning future include:
Estimatingusefullifeoffixedassets
The Company has made certain estimations with respect
to residual value, depreciation / amortization methods and
depreciable lives of assets as also disclosed in notes 4.3 to 4.7 of
the standalone & consolidated financial statements to determine
the useful lives based on usage, maintenance, rate of technical
and commercial obsolescence. These useful lives are reviewed
annually.
Valuationofcurrentassets
The management has made estimation with respect to provisions
for slow moving, damaged and obsolete items and their net
realizable values are disclosed in notes 4.7 and 4.8 of standalone
and notes 4.8 and 4.9 of consolidated financial statements
respectively.
With respect to recoverability of Trade debts and other
receivables; provisions are made and deducted against such
debts and receivables based on management’s assessment
of customer’s outstanding balances and credit worthiness as
disclosed in notes 4.9 and 4.10 of standalone and consolidated
financial statements respectively.
Taxation
Determining income tax provisions involves judgment on the tax
treatment of certain transactions. In making these estimates for
income taxes payable by the Company; the management has
considered recent Income tax laws and the decisions of appellate
authorities on certain cases issued in the past. Deferred tax is
recognized in full using the balance sheet liability method on all
temporary differences arising at the balance sheet date between
tax base of the assets and liabilities and their carrying amounts.
Staffretirementbenefits
The defined benefit obligations are based on actuarial
assumptions such as discount rate, expected rate of return on plan
assets, expected rate of growth in salaries and expected average
remaining working life of employees which are extensively
detailed in notes 20.1 and 23.1 of standalone and consolidated
financial statements respectively.
Contingencies
The management of the Company assesses contingencies based
on the availability of the latest information and estimates such
values for contingent assets and liabilities which may differ on the
occurrence / non-occurrence of the given uncertain future events.
BusinessContinuityPlanThe Board of Directors ensures that the Company has an updated
Business Continuity and Disaster Recovery plan in place for the
continuity of Company’s business and operations in the event of
occurrence of any extra ordinary circumstances.
A comprehensive plan is designed to ensure the protection of
overall company’s operations and assets along with regular
archival and system backups at remote sites.
The key highlights and actions of Lucky Cements’ Business
Continuity Plan are as follows:
• Management is responsible for the development and
execution of an effective Business Continuity Plan.
• The development of the plan is done keeping in mind the on-
going business needs and the environment it is operating in.
• The Management also ensures the training of all the
employees on how to respond in case of any unforeseen or
extra ordinary event.
• The Company has separated its production units
geographically, as well as its individuals and groups with core
skills, to reduce the exposure to localized risks and likelihood
of losing all resources assigned to a specific role.
• A company-wide and detailed Process Documentation
Activity has been done whereby all the processes are
mapped and serve as an SOP for all practices.
• Employees are imparted with multi-skill training which helps
in the continuity of business activities.
• To ensure protection of employees and asset against fire
alarm systems are installed in the premises of all of our
offices.
• The Company has also deployed adequate security staff at
both plants to ensure uninterrupted plant operations.
• The Company ensures backup of all the assets whether
physical or virtual; the physical assets are backed by
insurance whereas backup of virtual asset and data is created
on a routine basis.
It is also regularly ensured that Data Recovery processes are
operating effectively.
P 62

ROLES OF CHAIRMAN AND CEORoleofChairmanThe prime responsibility of the Chairman is the management of
the Board in all respects and in the most efficient and competent
manner. The Chairman is responsible to:
• Ensure that the Board plays its role effectively, in setting up
company’s direction and corporate strategy.
• Ensure that the Board only directs the company and does not
manage it.
• Ensure that the board composition and structure; ensuring
diversity of talent, skills and philosophical perspectives and
balance of age, experience and personality.
• Ensure integrity, credibility, trustworthiness and active
participation of Board members in key matters of the
Company.
• Manage conflict (if any) amongst the Board members and
ensure freedom of opinion.
• Review the Board performance and suggest the training and
development of Board members on individual and collective
basis.
• Receive from the management and sharing relevant and
up-to-date information with the Board members and
Shareholders.
• Promote highest moral, ethical and professional value and
good governance throughout the company.
RoleofCEOThe prime responsibility of the Chief Executive Officer of the
company is putting the strategy defined by the Board into practice,
and manage the company’s operations. The main responsibilities
are as follows:
• Develop strategies involving the executive team, for
the implementation of decisions of the Board and its
Committees.
• Maintain an effective communication with the Chairman of
the Board and bring all the important company matters to
the attention of the Board.
• Develop an adequate financial and operational plan for each
operational cycle and get it approved by the Board.
• Develop Key Performance Indicators (KPIs) for the Company
for the approval of Board and ensure the dissemination of
the same throughout the organization as the standards of
performance at both individual and collective levels.
• Work in the best interest of the Company, by achieving and
surpassing the performance targets set by the Board. Apprise
the Board on the reasons for variance in actual versus
budgeted plans of the Company and on any other significant
matter(s).
• Closely monitor the industry and prepare feasibility reports
for expansion or consolidation, mergers and acquisition, and
business diversification proposals for the Board.
• Employ the best talent at key positions and devise succession
planning of the management team.
• Promote highest moral, ethical and professional values and
good governance throughout the company.
P 63

BusinessEthicsandAnti-CorruptionPolicy
‘Ethics and Integrity’ is one of our core values, Lucky Cement
adopts zero tolerance policy against corruption. We strongly
believe in and practice highest standards of ethical behavior,
both within the organization as well as with our external
relationships. The Company has a well versed Code of Conduct
which defines the acceptable behavior for Board and other
Executives. Furthermore, the Board takes appropriate steps to
disseminate the Code of Conduct throughout the Company at
all levels. The introduction of Outside Interest Disclosure policy
by the employees is another step taken in the same direction.
The Members of the Audit Committee meet at regular intervals
during the year to review the adequacy and effectiveness of the
internal controls, including those relating to the strengthening of
the Company’s risk management policies and systems. There have
been no incidents of corruption during the year ended June 30,
2015 which is attributed to the Top Management’s commitment
to running this Organization in the most transparent and ethical
way.
WhistleBlowingPolicy
This policy is designed to enable Directors, officers and employees
of Lucky Cement, including temporary staff to raise complaints
against wrong doings they observe in the Company. The Company
is committed to achieving and maintaining the highest standards
of openness, integrity, ethical values and accountability. Hence it
expects all of its employees to do the same. In the interest of the
Company, it is the responsibility of every employee to ensure non-
occurrence of any inappropriate event does not occur.
The Company has formed an ‘Ethics Committee’ having 3
members from the management including the head of internal
audit and compliance. Complaints, if any, can reach them by
way of a dedicated PO Box or email id. The outcomes of the
proceedings of the Ethics Committee are reported to the Board
Audit Committee.
POLICIESPOLICIES
We have a comprehensive policy manual in place for the purpose of systemizing the various practices in the organization and we continuously benchmark it against some of the best standards globally. A lot of our policies have been upgraded recently to keep abreast with the best practices in the market.
P 64

ITGovernancePolicy
At Lucky Cement Limited, IT governance comprises strategies,
policies, procedures and structures to ensure strategic alignment
of IT with business goals and growth strategies. The integration
enables us to use information and communication technologies to
add value to work, maintain the security of information, improve
financial accountability and manage risks.
To ensure better IT governance, Lucky Cement has formed an IT
Steering Committee that provides strategic directions, establishes
company-wide IT priorities and oversees the policies about
Information Technology and Information Security. The IT Steering
Committee is governed by the approved terms of reference with
clear roles and responsibilities. The Committee meets on periodic
basis and focuses on:
• Setting strategic direction of the Lucky Cement in terms of
technology;
• Aligning the IT strategy with business strategy;
• Ensuring adequate information security;
• Managing business continuity, including disaster recovery;
• Mitigating risks related to the usage of information
technology systems.
PolicyforSafetyofRecords
The Company makes a conscious effort for the safety of its
records. Lucky Cement has purpose built record rooms at its
Head Office and at the Karachi and Pezu Plants for maintenance
of vital and necessary records. We have a fire proof vault for the
safekeeping of legal documents and conduct trainings to deal with
hazards.
Investors’QueriesandGrievancePolicy
At Lucky Cement, we value our relationships the most and believe
in nurturing the bonds formed at all levels. We have earned
the trust of our investors and are fully committed to sustain it.
We believe in continuous improvement through learning and
welcome all the concerns raised by our shareholders and take
this input as feedback for further improvement. The company in
alignment to its core value of ‘customer satisfaction’ has adopted
a prompt policy to redress the queries, complaints and grievances
of our investors. To ensure the safeguard of our relations with
our investors and shareholders, the company has provided
a structured communication channel for the registration of
complaints as per the following framework:
1. A designated email address company.secretary@lucky-
cement.com is created for the registration of the investor
grievances. Complaints can also be mailed at our company
head office address; addressed to the ‘Company Secretary’.
2. All the Investors’ Grievances received are acknowledged
within 7 working days from the date of receipt of grievance/
complaints as the case may be.
3. All investor complaints are addressed and resolved within
time period of 15-30 days of the receipt of the complaint.
4. All Investor Grievances (hard copy or soft copy) that are
received are incorporated in the Register of Grievance for
future reference.
5. The response/action taken to resolve the particular grievance
is also attached in the register and the senior management
reviews it on quarterly basis.
6. All queries, complaints and grievances are handled timely
and efficiently.
7. Feedback from investors on the level of satisfaction from
services received in addressing their issues is also recorded in
the Register of Grievance.
P 65
REPORT OF THE AUDIT COMMITTEEThe Audit Committee of Lucky Cement Limited has 5 non-executive directors, out of which 1 is independent director. The Chairman of the Committee, Mr. Tariq Iqbal Khan, is an independent and is a Fellow Member of Institute of Chartered Accountants of Pakistan (ICAP). Four meetings of the Audit Committee were held during the year 2014-15 which were also attended by the CFO and Head of Internal Audit. The auditors of the company also attended two of the meetings by invitation.
The Audit Committee has concluded its annual review of the conduct and operations of the Company for the year ended June 30, 2015 and reports that:
1. The Company has adhered in full, without any material departure, with both the mandatory and voluntary provisions of the listing regulations of the Karachi, Lahore and Islamabad Stock Exchanges of Pakistan, Code of Corporate Governance, the Company’s Code of Conduct and Values and the international best practices of governance throughout the year.
2. The Audit Committee reviewed quarterly, half-yearly and annual financial statements of the Company and recommended for approval to the Board of Directors. It has also reviewed preliminary announcements of results prior to publication and the internal audit reports.
3. The Company's Code of Conduct has been disseminated and placed on Company's website.
4. Appropriate accounting policies have been consistently applied. Applicable International Financial Reporting Standards were followed in the preparation of financial statements for the financial year ended June 30, 2015, which present fairly the state of affairs, results of operations, cash flows and changes in equity of the Company.
5. Accounting estimates are based on reasonable and prudent judgment. Proper accounting records have been maintained by the Company in accordance with the Companies Ordinance, 1984 and the financial reporting is consistent.
6. The CEO and the CFO have endorsed the standalone as well as consolidated financial statements of the Company. They acknowledge their responsibility for true and fair presentation of the Company's financial condition and results, compliance with regulations and applicable accounting standards and that an effective internal control system is in place.
7. The Audit Committee has reviewed the related party transactions and recommended the same for approval of the Board of Directors.
8. Closed periods were duly determined and announced by the Company, precluding the Directors, the CEO and Executives of the Company from dealing in Company shares, prior to
each Board meeting involving announcement of interim/final results, distribution of divided to the shareholders or communication of any other business decision, which could materially affect the share market price of the Company.
9. The management has effectively implemented the internal control framework through an in-house Internal Audit and Compliance function. The Company's system of internal controls is sound in design and has been effectively implemented.
10. The annual internal audit plan and findings of internal audit and management's response thereto have been reviewed. Further, it had approved the internal audit plan for 2014-15.
11. The Company’s system of internal control is sound in design and has been continually evaluated for effectiveness and control.
12. Coordination between the external and internal auditors was facilitated to ensure efficiency and contribution to the Company's objectives, including a reliable financial reporting system and compliance with laws and regulations.
13. The statutory and regulatory obligations and requirements of best practices of governance have been met.
14. No cases of material complaints regarding accounting, internal accounting controls or audit matters, or Whistle Blowing were received by the Committee.
15. The external auditors of the Company, M/s Ernst & Young Ford Rhodes Sidat Hyder, Chartered Accountants, have completed the audit of financial statements of the Company for the year ended June 30, 2015 and review of the “Statement of Compliance with the Code of Corporate Governance” for the financial year ended June 30, 2015.
16. The Audit Committee had reviewed the Management Letter of 2014 issued by the external auditors and managements response to the same.
17. The performance and independence of the external auditor was reviewed by the Audit Committee and has recommended to the Board to reappoint M/s Ernst & Young Ford Rhodes Sidat Hyder, Chartered Accountants, as external auditors for the year ending June 30, 2016 be proposed at the forthcoming Annual General Meeting for shareholders’ approval.
P 66

PROCEEDINGS OF THE LAST ANNUAL GENERAL MEETING
PROCEEDINGS OF THE LAST EXTRA ORDINARY GENERAL MEETING
The AGM started with the brief by the Chairman of the meeting about the company’s performance for the last financial year and update on the progress of on-going local and international projects. One of the shareholders raised the query about the reason behind increase in per ton cost of goods sold and the Chairman of the meeting explained that this rise was because of increase in gas tariff and price of packaging material. The shareholders were also apprised regarding the international projects and it was communicated that company’s grinding facility in Iraq has already started commercial production in February 2014, sales have picked up the momentum and the project has come into profitable operations which will be reflected in the consolidated profit for the next financial year and onwards. Further, the DR Congo plant is also expected to start commissioning by the end of CY 2016.
Another member raised the query about growth prospects of the industry and impact of capacity addition plans by other cement manufacturers on the entire industry, to which the Chairman
The EOGM started with the brief by the Chairman of the meeting about the status of investment by the Company in M/s Yunus Energy Limited (Project Company) an Associate Company for Wind Power Project of 50 MW. He briefed about the recent development and informed that Project Company has signed Energy Purchase Agreement (EPA) with National Transmission and Dispatch Company (NTDC) and has also signed Implementation
of the meeting responded that domestic demand for cement is increasing and market has huge potential because of the allocation of funds for Public Sector Development Programme (PSDP) by Federal and Provincial governments, along with increasing urbanization. The repair of the damages caused by floods and heavy rains will also raise the demand.
The members also granted the permission for increasing investment in Yunus Energy Limited (YEL), for which the site lease has been granted and the commencement of limited construction activities by Contractors. The finance and concession documents of the same were expected to be completed by November, 2014.
The members approved the re-appointment of M/s. Ernst & Young Ford Rhodes Sidat Hyder, Chartered Accountants as external auditors of the company and a final cash-dividend of 90%. Lastly the members appreciated and congratulated the management on the outstanding performance of the company and conveyed their best wishes for the future.
CALENDAR OF MAJOR EVENTSAnnual General Meeting Oct 2015Election of Directors Oct 20151st Quarterly Board of Directors’ Meeting Oct 2015Annual MENA & Frontier Markets Conference by Bank of America Merrill Lynch Nov 20152nd Quarterly Board of Directors’ Meeting Feb 2016Credit Suisse Asia Frontier Markets Conference in London & New York Feb 20163rd Quarterly Board of Directors’ Meeting Apr 2016Budget Committee Meeting Jun 2016
Agreement with Government of Pakistan through Alternative Energy Development Board. One of the shareholders raised the query about financial close date and the Chairman of the meeting informed that Project Company is in the process of negotiating Financing Documents with the consortium of leading local banks and is expected to achieve its financial close by January, 2015.
P 67

AWARDS AND ACCOLADES
FORBES ASIA’s 200 BEST UNDER A BILLIONLucky Cement Limited added another feather to its cap of accomplishments by being acknowledged as ‘200 Best under a Billion’ by Forbes Asia. Transforming into a global entity, Lucky Cement was the only Pakistani company to be ranked amongst top 200 stock-traded companies in the Asia Pacific Region. Lucky Cement is the only company representing Pakistan in the Forbes Asia list of 2013/14. The list features top companies from countries like China, Australia, India, Thailand and other countries in the Asia Pacific region. Lucky Cement has acquired the renowned status two times as it made it to the list in 2005 as well.
TRADE DEVELOPMENT AUTHORITY OF PAKISTAN’S EXPORT AND INNOVATION AWARD 2014Lucky Cement Limited was awarded the ‘Trade Development Authority of Pakistan’s Export and Innovation award’ by the Prime Minister of Pakistan, Mr. Muhammad Nawaz Sharif.
Lucky Cement was acknowledged for its innovative product range, development of new markets and being the only company in Pakistan to export loose cement.
BRAND OF THE YEAR AWARD 2014Lucky Cement Limited was declared as the Brand of the Year - 2014 in the category of cement. This award represents our increasing brand popularity, product availability, quality and consistency.
KARACHI STOCK EXCHANGE TOP 25 COMPANIES AWARD Lucky Cement Limited was recognized in the top 25 best performing companies of 2011 and was awarded ‘KSE top 25 companies Award 2011’ by the honorable Prime Minister, Mr. Nawaz Sharif at the ceremony held at PAF Museum Convention Centre, Karachi.
P 68

30TH CORPORATE EXCELLENCE AWARD 2014 BY MANAGEMENT ASSOCIATION OF PAKISTANLucky Cement Limited was ranked first in the category of Construction and Materials (cement) sector in 30th Corporate Excellence Awards held by the Management Association of Pakistan (MAP).
NATIONAL CSR AWARD 2014 Lucky Cement Limited won the prestigious National CSR 2014 Award by the CSR Association of Pakistan in the Environmental Sustainability category. The award showcases Lucky Cement’s active role in fulfilling its Corporate Social Responsibility.
GREEN SUPPLY CHAIN AWARD 2014Lucky Cement Limited has been awarded with the Green Supply Chain Award by virtue of its sustainable operations and logistics. The award was conferred by the Publicity Channel in the acknowledgment of companies that are making sustainability a core part of their supply chain strategy.
ENVIRONMENT EXCELLENCE AWARD For the 5th Year in running, Lucky Cement Limited won the ‘11th Annual Environment Excellence Award’ for its pro-environment initiatives including the installation of the Waste Heat Recovery Plant, Refused Derived Fuel and Tyre Derived Fuel projects at its production facilities. The National Forum for Environment & Health awarded Lucky Cement for its extensive participation in various community based environmental programs including the association with the President of Pakistan’s Forestation Program.
P 69

HUMAN RESOURCE EXCELLENCE
We recognize that the key factor behind our legacy of excellence is our people. Lucky Cement Limited in line with its commitment to developing its human potential knows that its future depends on finding and discovering talented and determined professionals internally and externally.
Since the last couple of years Lucky Cement is climbing radically on the ladder of growth. To stay in the lead we need to target optimum performance and excellence. Our objective is to use our talent in the best possible manner by positioning them where they own responsibility along with delivering value.
INDUCTING AND RETAINING TALENT We strive to retain and develop our employees and ensure that we maintain a pipeline of an engaged talented workforce; which is diverse and rewarded on merit. To move forward on this objective, we have introduced Engineering and Management Trainee programs where potential talent from the top universities of Pakistan were taken through a comprehensive Assessment Centre (consisting of aptitude and personality assessment, group discussions, case studies and structured panel interviews). We have also gone through a rigorous internal talent potential assessment journey to identify high potential employees currently at Lucky Cement and taken them through extensive on-the-job and classroom-based trainings and mentoring.
We believe that the eminence of our business plans has a direct link to the quality of human resource that we hire. We have also been very active in recruiting for our international operations in Iraq & DR Congo.
P 70

PERFORMANCE MANAGEMENTOur objective is to collectively align the performance of our teams and individuals towards the organizational goals. This year we witnessed further improvement in our performance management process by introducing effective and result-oriented measures and practices. We designed our systems to deliver transparency and fairness at all levels. Our managers were introduced to new tools and processes to have fair appraisals which diminish the chances of organizational bias and prejudice. At Lucky Cement we believe that for sustainable and consistent growth we need to reward our Employees not only for their performance but also for their behaviors that are aligned with the Organization’s core values and the performance management system.
SALARY SURVEYLucky Cement has participated in multiple salary surveys to align itself with the market and stand out as a competitive employer. Salary Survey benchmarks not only support us to identify gaps to align our remuneration packages with the market but also provide a guideline to bring about internal equity within the organization.
INDUSTRIAL RELATIONSWe recognize the importance of good industrial relations management and appreciate the hard work of our labor as they are the key force behind the execution of our day-to-day operations. There are dedicated IR managers in the organization, whose principal responsibility is to ensure industrial peace by ensuring fair labor practices, effective and efficient grievance handling and safeguarding labor related compliance with the statutes. The conflict Resolution Department at the Plants and HR department
in the Head Office plays a very critical part in harmonizing labor and employee relations. IR departments conciliates and arbitrates all the issues and ensures a win-win situation.
INTERNSHIP PROGRAMLucky Cement has started an extensive internship program, where it engages with business and engineering students by offering them meaningful training and a learning environment. Emphasis is laid on developing the candidate’s professional understanding of the corporate world and help them in identifying and aligning their careers in the long run. We are proud to facilitate interns from all the leading universities in Pakistan.
SUCCESSION PLANNING
Lucky Cement Limited believes in the progress and career development of its employees. With this focus, Lucky Cement has formulated a well-defined strategy to identify within the existing talent pool the resources which are high potential and routed through a process whereby their intelligence and behavioral patterns are assessed through comprehensive assessment Centre exercises.The outcome of the assessments is incorporated into the 9 box matrix approach to earmark the best talent available internally and to train them for important strategic positions in the future. New hires are also routed through this process in order to ensure that the human resource intake is appropriate and can fit into future Leadership roles.
P 71

SAFETY & HEALTHSAFETY & SECURITYLucky Cement is committed to cultivate
an environment which ensures safety and
security embedded at its core. By fortifying
our safety and security goals with the pillars
of perpetual progress, we are in pursuit of
a 100% safe & secure workplace for our
employees & all stakeholders engaged in
our business operations. Lucky Cement
efficiently implements its HSE policies &
procedures mitigating the accidental rate at
its vicinities and reducing the risks of injury
or health-hazards at the workplace. Lucky
Cement also fosters a tradition of training and
capacity-building of its employees with the
best procedures and workshops. We envision
a hazard-free setting and frequently invest in
various tools & techniques to ensure that our employees
are equipped with contemporary safety skills in their daily
operations.
CARDIOPULMONARYRESUSCITATION(CPR)–BASICLIFESUPPORT(BLS)Basic Life Support (BLS) is a first-aid resuscitation that
educates and equips individuals to recognize various life-
threatening emergencies. We conducted a comprehensive
BLS workshop to educate our employees about the
necessary safety precautions that can assist victims who
are suffering from cardiac arrest or choking incidents. By
teaching our employees the basic life support medical
practices of CPR, we are fabricating a safe and healthy work
setting.
FIREFIGHTING&MOCKDRILLS
Safety of our employees lies at the core of our operational frameworks. At Lucky Cement, we have made considerable efforts to equip our employees with fire-fighting skills to enable them to handle unforeseen emergencies. Practical demonstrations along with theoretical explanations are conducted bi-annually by skilled instructors at our factories and Head Office, so that our employees get the knowledge & confidence required to cope with such situations.
Regular mock drills are also carried out to familiarize everyone with the steps & procedures to follow in emergency situations; such knowledge & practice turns out to be lifesaving during a real situation.
OCCUPATIONAL HEALTH AND SAFETY
Being an OHSAS 18001 certified organization, we continuously implement practices that offer health and safety development of our workforce & take pride in being compliant with all applicable health & safety regulations. In this year’s OHSAS surveillance audit we have had zero major non-conformity at our plant.
Lucky Cement has taken safety measures according to the differences in the nature of the work environment at our Plant and the Corporate Head Offices. At the Plants, the Operational Heads are in charge for developing OH&S policies and their implementation, whereas at the Head Office responsibility lies with the Human Resource and Administration Department.
We keep educating our workforce with the prevailing health issues along with equipping them with modern-day safety skills at both Karachi and Pezu plants.
The workforce is provided with appropriate safety gear & personal protective equipment in line with the work zone &
P 72

nature of job being performed. The safety gear requirement for each zone has been visibly displayed at prominent locations & no one is allowed to enter without the safety prerequisites.
This year a major drive was carried out to increase traffic safety within the plant areas, segregating people & vehicles by creating walkways throughout the plant and also separating LTV from HTV by designating internal routes.
The workers are updated with the safety and health issues through regular internal communication channels such as internal newsletters, internal safety workshops and supervisor-workers meetings. Each worker is trained to follow strict guidelines and procedures in their daily activities. Standard Operating Procedure has been established to minimize accidents and provide immediate attention to hazards; other than that, we conduct on-going risk assessments to keep employees aligned with the latest safety skills and procedures practiced worldwide.
CONSUMER PROTECTION MEASURE
Lucky Cement is committed to provide topnotch quality
cement and is gravely concerned about the safety of its
customers and consumers. The manufacturing units have
cutting-edge technology and quality management systems
which enable the Company to deliver products that are
safe and which follow international standards. We also
have the services of independent parties which serve as an
additional quality check point to ensure that the cement
pertains to international benchmarks of safety and quality.
In compliance with the South African and Kenyan standards,
a safety notice is imprinted on the packaging material of
cement sold in the mentioned markets. This informs the
customers about the safety measures to be taken such as
suitable safety clothing, dust masks etc. Along with this,
we also provide Safety Data Sheet to our customers and to
ensure that they have all the necessary information about
the product usage and any additional safety precautions
that need to be taken.
P 73

SUSTAINABILITY
ENVIRONMENT POLICY:Lucky Cement Limited is committed to save human beings, fowl, fauna, soil and vegetation against environmental aspects generated through its products, activities and services.
P 74

P 75
ENVIRONMENT
Reduction in CO2 EmissionsImplementation of sustainability into its core business
operations has always been one of the major aims of
Lucky Cement. We have been successful in establishing a
leadership position in the market by completely achieving
this target through strategic orientations.
Lucky Cement is the pioneer of bringing evolution in
corporate social responsibility via the implementation of
the Dual-Fuel Conversion Project, which has helped in
the conversion of energy generation from furnace oil to
environment-friendly alternative sources. The successful
implementation of this project has enabled Lucky Cement
to reduce emission of CO2 by 29,000 metric tons per
annum.
We have taken another lead by making arrangement
for alternative fuels to Coal like Tyre Derived Fuel (TDF),
generated by burning shredded tyres and have installed
TDF plant at our Karachi Plant.
Our Dual Fuel Project also qualifies for the Clean
Development Mechanism (CDM) under the Kyoto
Protocol. The Clean Development Mechanism (CDM) is an
arrangement made under the Kyoto protocol which creates
emissions reduction credits through emissions reduction
projects in developing countries. Under this protocol pro-
environment organizations can earn Certified Emission
Reduction (CER) credits.
The Company is also active in other practices of
alternative fuel projects for achieving sustainability of the
environment, which includes: Refuse Derived Fuel (RDF)
that is making use of Municipal Solid Waste (MSW) and
Rice Husk. Lucky Cement prides itself in transforming
from a fossil-fuel based energy to alternative-energy
structure. This highlights our vital position in preserving the
ecosystem.
Acquiring Green TechnologyLucky Cement pioneered the use of Waste Heat
management projects in the Pakistani cement industry.
The company has installed a number of Waste Heat
Recovery (WHR) projects at its cement-manufacturing and
power-generation sites further reinforcing its eco-friendly
operations. The design of WHR plant hinges around the
idea of encapsulating all the wasted heat from production
system and using it to co-generate electricity.
Recently the company installed 1 x 5MW WHR project at its
Karachi Power Plant whereas another 1 X 5 MW WHR will
be implemented at Pezu Power Plant by October 2015. This
will not only help the country in curtailing the fuel cost but
will further reduce its carbon footprint.
Tree Plantation at Karachi and Pezu PlantLucky Cement has always displayed front-line demeanor
in sustaining eco-friendly practices. The company held
plantation drives in the surrounding area of our Karachi and
Pezu Plant. Lucky Cement planted over 400 saplings near
the vicinity of both the plants and the activity generated an
overwhelming response from the employees.
Reef Cleaning DriveLucky Cement has made monumental contributions in
fostering a sustainable environment. As part of Lucky
Cement’s sustainability interventions, for the second time
we have associated ourselves with the global environment
movement ‘Dive Against Debris’ run by Project Aware,
Australia.
In response to the onslaught of marine debris, Lucky
Cement sponsored scuba divers associated with the
Professional Association of Diving Instructors (PADI) who
went underwater to remove the debris at Charna Island,
a soft coral reef off Karachi Coast, while also collecting
important data to paint an accurate picture of the marine
debris issue. This unique ocean conservation project
embodied the spirit of responsible corporate citizenship of
our Company.
P 76
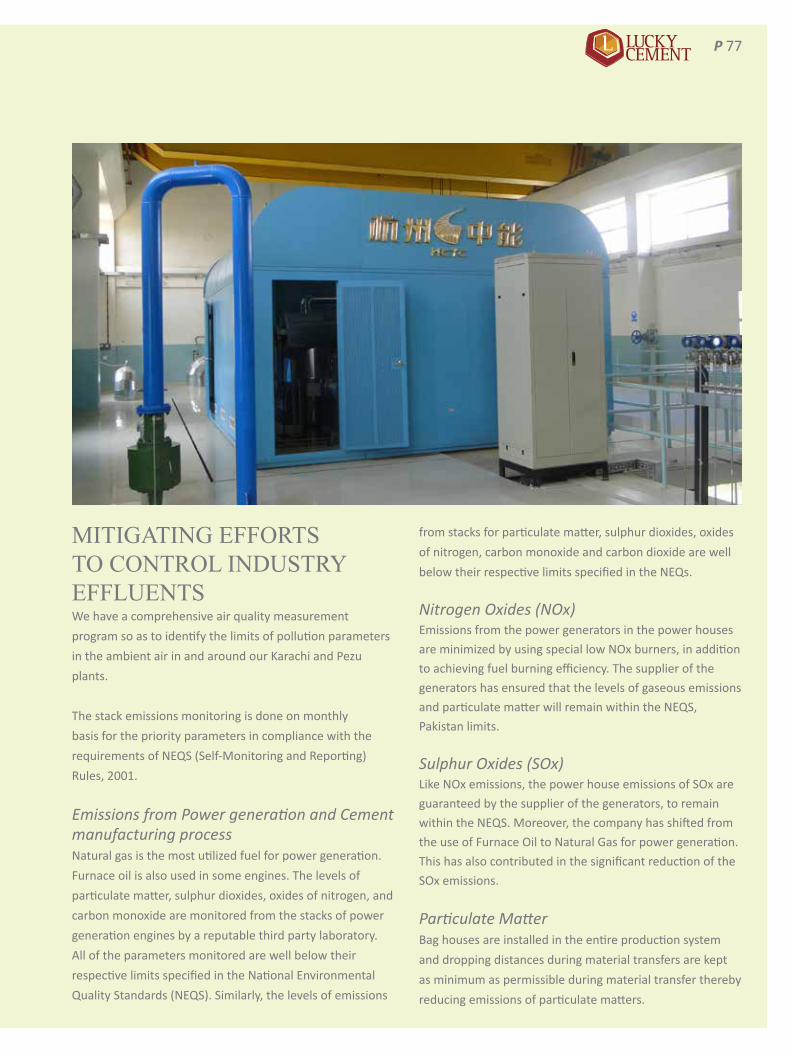
MITIGATING EFFORTS TO CONTROL INDUSTRY EFFLUENTSWe have a comprehensive air quality measurement
program so as to identify the limits of pollution parameters
in the ambient air in and around our Karachi and Pezu
plants.
The stack emissions monitoring is done on monthly
basis for the priority parameters in compliance with the
requirements of NEQS (Self-Monitoring and Reporting)
Rules, 2001.
Emissions from Power generation and Cement manufacturing processNatural gas is the most utilized fuel for power generation.
Furnace oil is also used in some engines. The levels of
particulate matter, sulphur dioxides, oxides of nitrogen, and
carbon monoxide are monitored from the stacks of power
generation engines by a reputable third party laboratory.
All of the parameters monitored are well below their
respective limits specified in the National Environmental
Quality Standards (NEQS). Similarly, the levels of emissions
from stacks for particulate matter, sulphur dioxides, oxides
of nitrogen, carbon monoxide and carbon dioxide are well
below their respective limits specified in the NEQs.
Nitrogen Oxides (NOx) Emissions from the power generators in the power houses
are minimized by using special low NOx burners, in addition
to achieving fuel burning efficiency. The supplier of the
generators has ensured that the levels of gaseous emissions
and particulate matter will remain within the NEQS,
Pakistan limits.
Sulphur Oxides (SOx)Like NOx emissions, the power house emissions of SOx are
guaranteed by the supplier of the generators, to remain
within the NEQS. Moreover, the company has shifted from
the use of Furnace Oil to Natural Gas for power generation.
This has also contributed in the significant reduction of the
SOx emissions.
Particulate Matter
Bag houses are installed in the entire production system
and dropping distances during material transfers are kept
as minimum as permissible during material transfer thereby
reducing emissions of particulate matters.
P 77

Limestone is the major
raw material used in
the cement production
process. Limestone has
high moisture content and
is hard in nature. Due to
these properties, emission
of fine limestone during the
blasting at the quarry is very
low. Additionally, splinters
generated during blasting are
quite large and resultantly
they do not fly over longer
distances.
Coal transport from supply
point to the factory and
handling at the plant are other big sources of Particulate
Matter emissions all along the roads used for transport
and at the plant. Imported coal from Karachi sea port is
transported by trucks. In order to minimize fugitive coal
dust on the way, these trucks have special covers. This
drastically cuts the fugitive coal dust on the way to the
plant site.
Noise PollutionThe designing of the plants at Karachi and Pezu have been
done while taking into account that the noise levels remain
within the acceptable limits of the NEQS. Regular repair and
maintenance of the plant guarantees compliance of noise
levels with the NEQS.
The plant site at Pezu is surrounded by high hills in a semi-
circle on its North-East side. These hills are additionally
good barrier for noise cut off to the environment.
Monitoring for noise levels was carried out at different
points at Karachi and Pezu plant site and limestone and clay
quarries. Similarly, monitoring for noise levels was carried
out at different points on the boundary walls of the plant
site where minimal instances of excursions were witnessed.
WasteAll of the waste generated at the plant sites is managed
in an environmentally sustainable manner. We are in the
process of locating scrap purchasers who are certified by
Environmental Protection Agency (EPA) to dispose off the
scrap through proper methods.
SewageAll sewage from our plants is treated to bring its pollution
load within the specified values of the NEQS, Pakistan for
the applicable parameters before its end use for irrigation
of vegetation and trees within the plant boundaries.
Resultantly, ambient environment is not affected in any way
due to sewage.
Solid wasteSolid waste is generated from the plant operations at
various points. Bag houses are among the major collectors
of solid wastes in the form of Particulate Matter. This is
used as a useful additive in the cement.
Raw MaterialsRaw materials/raw mix and reject of preheater are recycled
by putting them on limestone piles. The small quantity of
this raw material, rich in limestone, does not affect the
quality of limestone piles.
P 78

Used oil and lubricants Used oil, lubricants and very small quantity of greases are
transferred to the furnace oil decanting point where they
are mixed with furnace oil and used as fuel of calciner /
burner.
Furnace oil sludgeFurnace oil sludge generated from the power house and
cement plant is used as fuel in the kiln. In case of it being
unfit for use, it is sold to the contractors for appropriate
disposal.
Paper bags Bursted paper bags from cement packing process are sold
in the market where they are reused either for paper pulp
manufacture or other packing materials.
Bricks wasteBrick waste from the lining of the kiln is also sold to the
contractors for reuse in small scale kilns for ceramic ,
acid proof bricks and such other refractory materials
manufacture.
Medical wasteMedical waste collected from the medical centre is burnt in
the kiln / precalciner.
Metal / wooden wasteSolid metal and wooden waste generated from the
mechanical workshop and civil areas is collected in drums
and burnt in the kiln / precalciner.
Waste from Quality ControlCement cubes (broken by strength determination),
cement, pieces of cement pellets, daily analyzed samples
of limestone, shale, iron ore, sand, gypsum, raw mix, kiln
feed and clinker is transferred to clinker storage yard. The
quantity of these materials is very low thus there is no
impact on the quality of clinker.
Empty drums and containers Empty drums and containers are returned to the suppliers
of the chemicals in them for recycling and reuse at their
end. However, if cleaned adequately they have great
market demand in the open market as well.
P 79

Cotton ragsCotton rag waste generated after cleaning of equipment is
burnt in the kiln / calciner.
Grinding mediaThe used grinding media of cement mill is sold in the
market through contractor for its reuse on small scale
manufacturing.
Miscellaneous wasteMiscellaneous solid waste includes tyres, tubes, batteries,
belts, nylon strips, filters and scrap wood. These are sold in
the market through contractors.
Although the company maintains the record of all disposals by type and disposal method, but there is no system available to reliably estimate the total weight of all the disposals including discharged water. While disposing any waste material, all environmental aspects/impacts of such waste are communicated clearly to the concerned contractor. Record of all such sales is maintained for later use if and when required.
EMPLOYEEVOLUNTEERISMLucky Cement takes pride in its employees and wants to develop a corporate culture that promotes social responsibility and welfare. Building on this practice, Lucky
Cement collaborated with Indus Hospital to conduct a blood drive on account of Employee volunteer Day. By giving our employees a platform to be a part of this noble cause, we were able to collect adequate amount of blood which can help save 50 lives at Indus Hospital and elsewhere.
EducationLucky Cement actively pursues CSR as a core-value and has sustained its goal of promoting quality education in the country by granting several merit-based scholarships to students of different institutes of Pakistan.
Scholarships/ Financial AssistanceLucky Cement has partnered with various prestigious institutes of Pakistan providing educational assistance to deserving and bright students. The primary aim is to make education accessible and affordable to talented students regardless of their financial position.
Institute Of Business Management (IoBM)Lucky Cement has joined hands with the Creek High School & Creek College (IoBM Campus) for providing scholarships to the deserving and bright students. In this context in the year 2014, Lucky Cement awarded 62 scholarships to the students at Creek High School, taking forward its mission of making quality education accessible to the bright minds of Pakistan irrespective of their financial status.
P 80

Indus Valley School of Arts and ArchitectureLucky Cement lays strong emphasis over the promotion
of Arts and Architecture in our society. In this connection,
Lucky Cement is providing a helping hand to the students
striving to choose Arts or Architecture as a profession by
providing them with merit-cum-scholarships from the start
till the culmination of their degree program.
Lahore University of Management SciencesLucky Cement strongly believes that the youth of today are
the leaders of tomorrow. Sowing the seeds of a brighter
future, Lucky Cement generously granted 15 annual
scholarships to deserving students with an aim of improving
the standard of education provided to them.
Institute of Business AdministrationLucky Cement has partnered with Institute of Business
Administration (IBA), to provide educational assistance to
49 students in pursuit of quality education from IBA.
Foreign ScholarshipsLucky Cement also provides scholarships to the meritorious
students of Pakistan seeking further education in world-
class foreign universities. In this context, Lucky Cement has
granted sponsorships to the students of St. John’s College,
Cambridge – UK and various other universities.
International Literacy DayLiteracy is one of the fundamental elements needed to
promote sustainable development in our society. In efforts
to empower the local community, Lucky Cement played
its role in celebrating International Literacy Day, globally
held by UNESCO, to sow the seeds of a prosperous society.
For the second time in a row, this year Lucky Cement has
donated approximately 500 books (literature + curriculum)
to two underprivileged schools namely, Hilal Public School,
Nooriabad and Higher Secondary School, Yarak (Dist. Lakki
Marwat).
P 81

HEALTH AND OTHER COMMUNITY PROJECTS
Health ProjectsLucky Cement actively partnered with various healthcare
institutions for better, efficient and accessible medical
treatments to general public.
SindhInstituteofUrologyandTransplantation(SIUT)Lucky Cement has been contributing generous amounts to
the Sindh Institute of Urology and Transplantation (SIUT) to
alleviate deprived patients suffering from various diseases.
TabbaHeartInstituteTabba Heart Institute, a state-of-the-art, yet not-for-
profit cardiac hospital, was established with the aim to
provide quality services and compassionate care at an
affordable cost. Devoted to the cause of community welfare
development, Lucky Cement has generously contributed
to Tabba Heart Institute in its struggle to make health care
more accessible to the masses.
PakistanAssociationoftheBlindPakistan Association of the Blind is an NGO providing
services of Education and Rehabilitation for the Blind
People in Sindh. Lucky Cement generously offered financial
assistance to alleviate needy patients.
SpecialOlympicsPakistanLucky Cement firmly advocates the belief that the key
to longevity lies in an active lifestyle. For this purpose,
Lucky Cement co-sponsored an Annual Event of Special
Olympics Pakistan, a non-profit organization, working with
people of intellectual disabilities to develop their skills and
capabilities through sports training.
ChildLifeFoundationChild Life Foundation (CLF) is one of the largest non-profit
organizations in Pakistan dedicated to saving pediatric lives.
Lucky Cement donated generous amount with an aim of
providing medical facilities and treatments for the needy
children.
AzizTabbaKidneyCentreLucky Cement fervently supports organizations that are
dedicated to patient care without any discrimination. Aziz
Tabba Kidney Centre is a center of excellence that provides
cost-effective and state-of-the-art dialysis facilities to the
underprivileged section of the society. Acknowledging ATKC
efforts, Lucky Cement has generously donated funds to
support their humble cause.
RURAL DEVELOPMENT PROGRAMSLucky Cement realizes that we are under an obligation to give back to the local community that helped us reach the pinnacle of success. To play its part in mitigating the hardships faced by displaced people, the company set up a ration distribution point in Pezu for the Internally Displaced Persons (IDPs) and local community.
Instilling the core value of social responsibility among our employees, Lucky Cement in collaboration with Fatmid Foundation, conducted a blood drive at its Pezu Plant. A total of 50 volunteers donated blood which accounted towards collection of 40 pints of blood.
Furthermore, Lucky Cement has renovated ‘Lucky Welfare Dispensary’ located in Pezu, Khyber Pakhtunkhwa with an aim to provide medical facilities and treatments for the underprivileged patients at subsidized rates. The dispensary has been equipped with advanced facilities and provides accessible quality healthcare to the local employees and residents.
Lucky Cement firmly advocates the belief that key to longevity lies in an active lifestyle. A Sports Gala was held at Pezu where district-level teams were seen participating enthusiastically. The promotion of sports events educates the local masses about the health benefits associated with
engaging in physical activities.
P 82
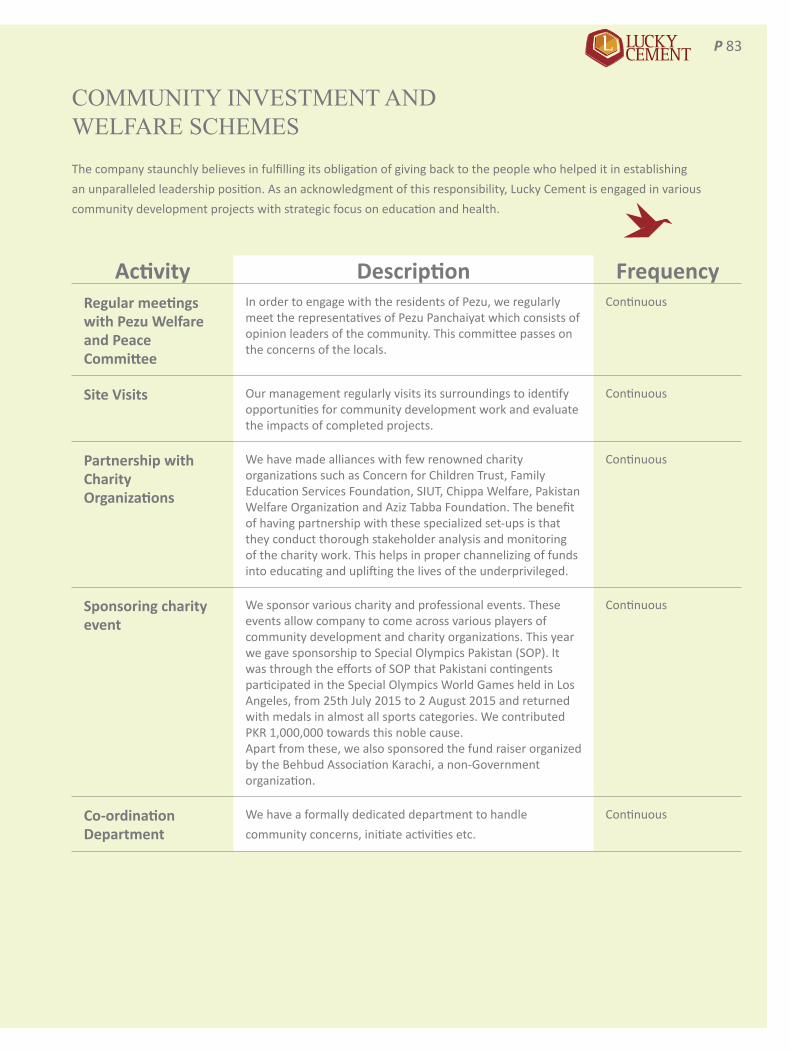
COMMUNITY INVESTMENT AND WELFARE SCHEMES The company staunchly believes in fulfilling its obligation of giving back to the people who helped it in establishing
an unparalleled leadership position. As an acknowledgment of this responsibility, Lucky Cement is engaged in various
community development projects with strategic focus on education and health.
Activity Description FrequencyRegularmeetingswithPezuWelfareand Peace Committee
In order to engage with the residents of Pezu, we regularly meet the representatives of Pezu Panchaiyat which consists of opinion leaders of the community. This committee passes on the concerns of the locals.
Continuous
Site Visits Our management regularly visits its surroundings to identify opportunities for community development work and evaluate the impacts of completed projects.
Continuous
Partnership with CharityOrganizations
We have made alliances with few renowned charity organizations such as Concern for Children Trust, Family Education Services Foundation, SIUT, Chippa Welfare, Pakistan Welfare Organization and Aziz Tabba Foundation. The benefit of having partnership with these specialized set-ups is that they conduct thorough stakeholder analysis and monitoring of the charity work. This helps in proper channelizing of funds into educating and uplifting the lives of the underprivileged.
Continuous
Sponsoringcharityevent
We sponsor various charity and professional events. These events allow company to come across various players of community development and charity organizations. This year we gave sponsorship to Special Olympics Pakistan (SOP). It was through the efforts of SOP that Pakistani contingents participated in the Special Olympics World Games held in Los Angeles, from 25th July 2015 to 2 August 2015 and returned with medals in almost all sports categories. We contributed PKR 1,000,000 towards this noble cause.Apart from these, we also sponsored the fund raiser organized by the Behbud Association Karachi, a non-Government organization.
Continuous
Co-ordinationDepartment
We have a formally dedicated department to handle
community concerns, initiate activities etc.
Continuous
P 83
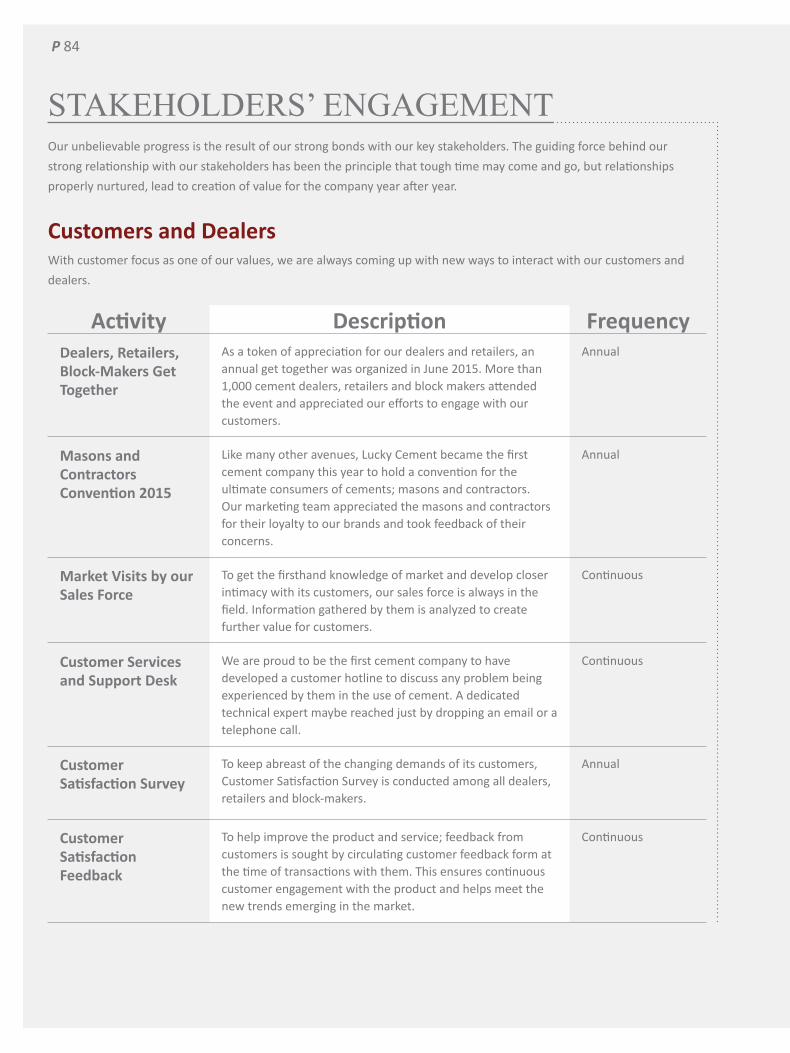
Our unbelievable progress is the result of our strong bonds with our key stakeholders. The guiding force behind our
strong relationship with our stakeholders has been the principle that tough time may come and go, but relationships
properly nurtured, lead to creation of value for the company year after year.
Customers and DealersWith customer focus as one of our values, we are always coming up with new ways to interact with our customers and
dealers.
STAKEHOLDERS’ ENGAGEMENT
Activity Description FrequencyDealers,Retailers,Block-Makers Get Together
As a token of appreciation for our dealers and retailers, an annual get together was organized in June 2015. More than 1,000 cement dealers, retailers and block makers attended the event and appreciated our efforts to engage with our customers.
Annual
Masons and Contractors Convention2015
Like many other avenues, Lucky Cement became the first cement company this year to hold a convention for the ultimate consumers of cements; masons and contractors. Our marketing team appreciated the masons and contractors for their loyalty to our brands and took feedback of their concerns.
Annual
MarketVisitsbyourSales Force
To get the firsthand knowledge of market and develop closer intimacy with its customers, our sales force is always in the field. Information gathered by them is analyzed to create further value for customers.
Continuous
Customer Services and Support Desk
We are proud to be the first cement company to have developed a customer hotline to discuss any problem being experienced by them in the use of cement. A dedicated technical expert maybe reached just by dropping an email or a telephone call.
Continuous
Customer SatisfactionSurvey
To keep abreast of the changing demands of its customers, Customer Satisfaction Survey is conducted among all dealers, retailers and block-makers.
Annual
Customer SatisfactionFeedback
To help improve the product and service; feedback from customers is sought by circulating customer feedback form at the time of transactions with them. This ensures continuous customer engagement with the product and helps meet the new trends emerging in the market.
Continuous
P 84

MediaWe recognize that being the leader of cement industry, we should engage more frequently with the external world.
Thus, we are making all possible efforts to disseminate our news and happenings to external stakeholders through active
interaction with the media. We continuously engage with media through:
• Issuing press releases, briefings and presentations
• Corporate communications department which is staffed with highly qualified professionals
We are continuously exploring new opportunities to create further value for our shareholders and investors to give them a
better return on their investments.
RegulatorsWe believe in strict compliance of applicable laws and regulations. To maintain this compliance, we promptly and regularly
file all the applicable statutory returns and forms with various regulatory bodies. We have an open-door policy towards all
the regulators
With its footprint and customers spread across and beyond Pakistan, Lucky Cement values its relationships with its
investors and ensure the engagement with its shareholders all year round through following activities.
Investors and Shareholders
Activity Description FrequencyAnnual General Meeting
The Company convenes AGM in accordance with the Companies Ordinance, 1984. The AGM serves as an interactive platform to engage with the shareholders and listen to their views and valuable suggestions
Annual
Quarterly,Half-yearlyandAnnualReports
The company, in compliance with applicable laws, periodically sends out its quarterly, half-yearly and annual reports to its shareholders as well as uploads them on its website. The Company being, listed, also communicates its results to all the stock exchanges where the company is listed.
As per applicable laws
Press Releases The company updates its shareholders on various issues of potential interests through press releases.
As and when need arises
InvestorsRelations The Company ensures its presence in road shows and investors’ conferences held in Pakistan and abroad. During the financial year 2014-15, Company had participated in Asia Frontier Markets Conference organized by Credit Suisse, held in London & New York, Frontier Market Investor Conference organized by Morgan Stanley and Auerbach Grayson in New York, and MENA & Frontier Markets Conference organized by Merrill Lynch in DubaiThe Company also interacts with other potential local and international investors on their request by way of 1 x 1 sessions to apprise them about the success story of the Company which helps them make their investment decisions in Company’s shares.
As and when need arises
P 85

P 86

Unconsolidated Financial Statements
For the year ended June 30, 2015
P 87
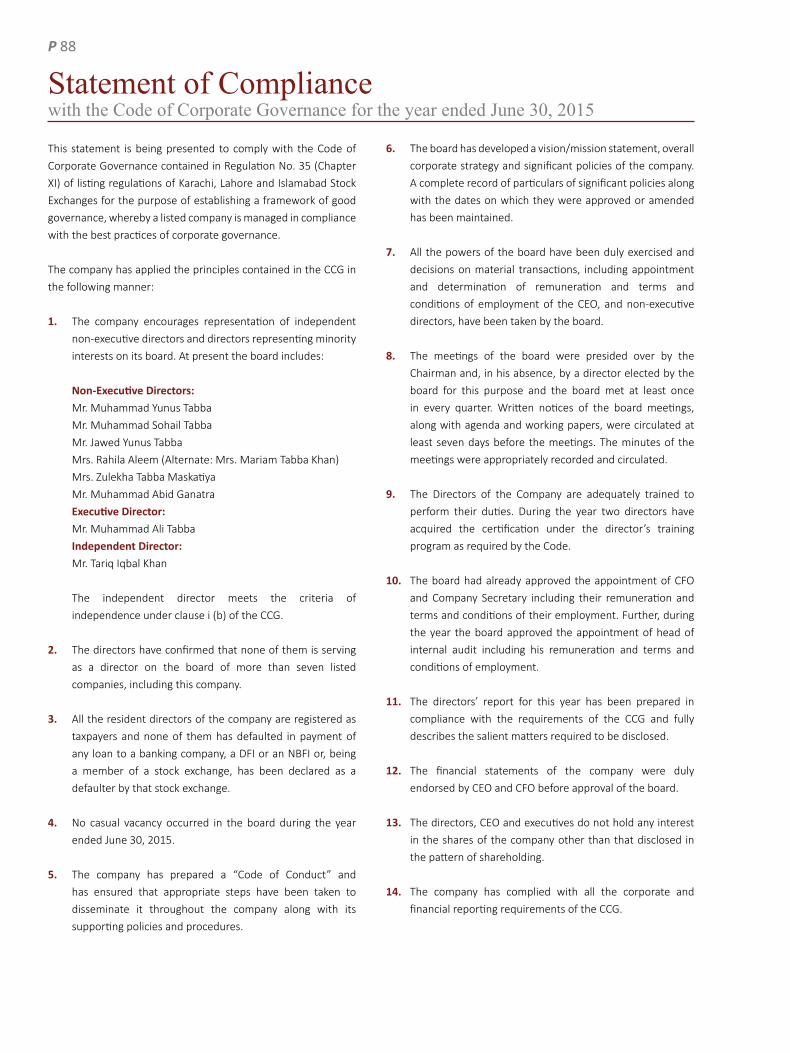
This statement is being presented to comply with the Code of
Corporate Governance contained in Regulation No. 35 (Chapter
XI) of listing regulations of Karachi, Lahore and Islamabad Stock
Exchanges for the purpose of establishing a framework of good
governance, whereby a listed company is managed in compliance
with the best practices of corporate governance.
The company has applied the principles contained in the CCG in
the following manner:
1. The company encourages representation of independent
non-executive directors and directors representing minority
interests on its board. At present the board includes:
Non-ExecutiveDirectors: Mr. Muhammad Yunus Tabba
Mr. Muhammad Sohail Tabba
Mr. Jawed Yunus Tabba
Mrs. Rahila Aleem (Alternate: Mrs. Mariam Tabba Khan)
Mrs. Zulekha Tabba Maskatiya
Mr. Muhammad Abid Ganatra
ExecutiveDirector: Mr. Muhammad Ali Tabba
IndependentDirector: Mr. Tariq Iqbal Khan
The independent director meets the criteria of
independence under clause i (b) of the CCG.
2. The directors have confirmed that none of them is serving
as a director on the board of more than seven listed
companies, including this company.
3. All the resident directors of the company are registered as
taxpayers and none of them has defaulted in payment of
any loan to a banking company, a DFI or an NBFI or, being
a member of a stock exchange, has been declared as a
defaulter by that stock exchange.
4. No casual vacancy occurred in the board during the year
ended June 30, 2015.
5. The company has prepared a “Code of Conduct” and
has ensured that appropriate steps have been taken to
disseminate it throughout the company along with its
supporting policies and procedures.
6. The board has developed a vision/mission statement, overall
corporate strategy and significant policies of the company.
A complete record of particulars of significant policies along
with the dates on which they were approved or amended
has been maintained.
7. All the powers of the board have been duly exercised and
decisions on material transactions, including appointment
and determination of remuneration and terms and
conditions of employment of the CEO, and non-executive
directors, have been taken by the board.
8. The meetings of the board were presided over by the
Chairman and, in his absence, by a director elected by the
board for this purpose and the board met at least once
in every quarter. Written notices of the board meetings,
along with agenda and working papers, were circulated at
least seven days before the meetings. The minutes of the
meetings were appropriately recorded and circulated.
9. The Directors of the Company are adequately trained to
perform their duties. During the year two directors have
acquired the certification under the director’s training
program as required by the Code.
10. The board had already approved the appointment of CFO
and Company Secretary including their remuneration and
terms and conditions of their employment. Further, during
the year the board approved the appointment of head of
internal audit including his remuneration and terms and
conditions of employment.
11. The directors’ report for this year has been prepared in
compliance with the requirements of the CCG and fully
describes the salient matters required to be disclosed.
12. The financial statements of the company were duly
endorsed by CEO and CFO before approval of the board.
13. The directors, CEO and executives do not hold any interest
in the shares of the company other than that disclosed in
the pattern of shareholding.
14. The company has complied with all the corporate and
financial reporting requirements of the CCG.
Statement of Compliance with the Code of Corporate Governance for the year ended June 30, 2015
P 88

15. The board has formed an Audit Committee. It comprises 6
members, of whom 5 are non-executive directors and the
chairman of the committee is an independent director.
16. The meetings of the audit committee were held at least
once every quarter prior to approval of interim and final
results of the company and as required by the CCG. The
terms of reference of the committee have been formed and
advised to the committee for compliance.
17. The board has formed a Human Resource and Remuneration
Committee. It comprises 5 members, of whom 4 are non-
executive directors and the chairperson of the committee is
non-executive director.
18. The board has set up an effective internal audit function
managed by qualified and experienced professionals who
are conversant with the policies and procedures of the
company and industry best practices. They are involved in
the internal audit function on a full time basis. The head of
Internal Audit department functionally reports to the Audit
Committee.
19. The statutory auditors of the company have confirmed
that they have been given a satisfactory rating under the
quality control review program of the Institute of Chartered
Accountants of Pakistan (ICAP), that they or any of the
partners of the firm, their spouses and minor children do
not hold shares of the company and that the firm and all its
partners are in compliance with International Federation of
Accountants (IFAC) guidelines on code of ethics as adopted
by the ICAP.
20. The statutory auditors or the persons associated with them
have not been appointed to provide other services except
in accordance with the listing regulations and the auditors
have confirmed that they have observed IFAC guidelines in
this regard.
21. The ‘closed period’, prior to the announcement of interim
and final results, and business decisions, which may
materially affect the market price of company’s securities,
was determined and intimated to directors, CEO, CFO, Head
of Internal Audit, other Executives and stock exchanges.
22. Material or price sensitive information has been
disseminated among all market participants at once through
stock exchanges.
23. We confirm that all other material principles enshrined in
the CCG have been complied with.
MUHAMMADYUNUSTABBA MUHAMMADALITABBAChairman/Director Chief Executive/Director
P 89
Review Report to the Members on Statement of Compliance with the Code of Corporate Governance
We have reviewed the enclosed Statement of Compliance with the best practices contained in the Code of Corporate Governance (the
Code) prepared by the Board of Directors of Lucky Cement Limited (the Company) for the year ended 30 June 2015 to comply with the
requirements of Listing Regulation No. 35 Chapter XI of Karachi Stock Exchange Limited, Listing Regulation No. 35 Chapter XI of Lahore
Stock Exchange Limited and Listing Regulation No. 35 Chapter XI of Islamabad Stock Exchange Limited, where the Company is listed.
The responsibility for compliance with the Code is that of the Board of Directors of the Company. Our responsibility is to review, to the
extent where such compliance can be objectively verified, whether the Statement of Compliance reflects the status of the Company’s
compliance with the provisions of the Code and report if it does not and to highlight any non-compliance with the requirements of the
Code. A review is limited primarily to inquiries of the Company’s personnel and review of various documents prepared by the Company
to comply with the Code.
As part of our audit of financial statements we are required to obtain an understanding of the accounting and internal control systems
sufficient to plan the audit and develop an effective audit approach. We are not required to consider whether the Board of Directors’
statement on internal control covers all risks and controls or to form an opinion on the effectiveness of such internal controls, the
Company’s corporate governance procedures and risks.
The Code requires the Company to place before the Audit Committee, and upon recommendation of the Audit Committee, place before
the Board of Directors for their review and approval its related party transactions distinguishing between transactions carried out on
terms equivalent to those that prevail in arm‘s length transactions and transactions which are not executed at arm’s length price and
recording proper justification for using such alternate pricing mechanism. We are only required and have ensured compliance of this
requirement to the extent of the approval of the related party transactions by the Board of Directors upon recommendation of the Audit
Committee. We have not carried out any procedures to determine whether the related party transactions were undertaken at arm’s
length price or not.
Based on our review, nothing has come to our attention which causes us to believe that the Statement of Compliance does not
appropriately reflect the Company’s compliance, in all material respects, with the best practices contained in the Code as applicable to
the Company for the year ended 30 June 2015.
CharteredAccountantsDate: 08 September 2015
Place: Karachi
P 90

Auditors’ Report to the Members
We have audited the annexed balance sheet of Lucky Cement Limited (the Company) as at 30 June 2015 and the related profit and loss
account, cash flow statement and statement of changes in equity together with the notes forming part thereof, for the year then ended
and we state that we have obtained all the information and explanations which, to the best of our knowledge and belief, were necessary
for the purposes of our audit.
It is the responsibility of the Company’s management to establish and maintain a system of internal control, and prepare and present the
above said statements in conformity with the approved accounting standards and the requirements of the Companies Ordinance, 1984.
Our responsibility is to express an opinion on these statements based on our audit.
We conducted our audit in accordance with the auditing standards as applicable in Pakistan. These standards require that we plan and
perform the audit to obtain reasonable assurance about whether the above said statements are free of any material misstatement. An
audit includes examining on a test basis, evidence supporting the amounts and disclosures in the above said statements. An audit also
includes assessing the accounting policies and significant estimates made by management, as well as, evaluating the overall presentation
of the above said statements. We believe that our audit provides a reasonable basis for our opinion and, after due verification, we report
that:
a) in our opinion, proper books of account have been kept by the Company as required by the Companies Ordinance, 1984;
b) in our opinion:
i) the balance sheet and profit and loss account together with the notes thereon have been drawn up in conformity with the
Companies Ordinance, 1984, and are in agreement with the books of account and are further in accordance with accounting
policies consistently applied, except for the changes as stated in note 4.2 to the accompanying financial statements, with
which we concur;
ii) the expenditure incurred during the year was for the purpose of the Company’s business; and
iii) the business conducted, investments made and the expenditure incurred during the year were in accordance with the objects
of the Company;
c) in our opinion and to the best of our information and according to the explanations given to us, the balance sheet, profit and
loss account, cash flow statement and statement of changes in equity together with the notes forming part thereof conform with
approved accounting standards as applicable in Pakistan, and, give the information required by the Companies Ordinance, 1984, in
the manner so required and respectively give a true and fair view of the state of the Company’s affairs as at 30 June 2015 and of the
profit, its cash flows and changes in equity for the year then ended; and
d) in our opinion Zakat deductible at source under the Zakat and Usher Ordinance, 1980 (XVIII of 1980), was deducted by the Company
and deposited in the Central Zakat Fund established under section 7 of that Ordinance.
We draw attention to the contents of note 15 to the accompanying financial statements in respect of tax refunds due from the
Government amounting to PKR 538.812 million. Our opinion is not qualified in respect of this matter.
CharteredAccountantsAudit Engagement Partner: Riaz A. Rehman Chamdia
Date: 08 September 2015
Place: Karachi
P 91

Balance Sheetas at June 30, 2015
Note 2015 2014 PKR in ‘000’
ASSETS NON-CURRENTASSETS Fixed assets Property, plant and equipment 5 35,018,819 31,937,211 Intangible assets 6 41,921 27,652
35,060,740 31,964,863 Long-term investments 7 10,925,020 8,157,550 Long-term loans and advances 8 78,981 72,445 Long-term deposits 3,175 3,175
46,067,916 40,198,033 CURRENTASSETS Stores and spares 9 4,995,423 6,078,915 Stock-in-trade 10 1,580,745 1,638,984 Trade debts 11 2,042,199 2,077,714 Loans and advances 12 253,350 161,625 Trade deposits and short-term prepayments 13 50,688 57,699 Accrued mark-up 79,257 71,512 Other receivables 14 1,032,853 455,540 Tax refunds due from the Government 15 538,812 538,812 Cash and bank balances 16 16,444,622 8,590,797 27,017,949 19,671,598 TOTALASSETS 73,085,865 59,869,631 EQUITYANDLIABILITIES SHARECAPITALANDRESERVES Share capital 17 3,233,750 3,233,750 Reserves 18 56,025,020 46,558,433
59,258,770 49,792,183 NON-CURRENTLIABILITIES Long-term deposits 19 69,246 67,971 Deferred liabilities 20 6,327,146 5,453,512 6,396,392 5,521,483 CURRENTLIABILITIES Trade and other payables 21 6,382,372 4,167,970 Taxation - net 1,048,331 257,446 Accrued mark-up - 3,051 Current portion of long-term finance - 127,498 7,430,703 4,555,965 CONTINGENCIESANDCOMMITMENTS 22 - -
TOTALEQUITYANDLIABILITIES 73,085,865 59,869,631 The annexed notes from 1 to 39 form an integral part of these financial statements.
MuhammadYunusTabbaChairman/Director
MuhammadAliTabbaChiefExecutive
P 92

Profit and Loss AccountFor the year ended June 30, 2015
Note 2015 2014 PKR in ‘000’ Grosssales 23 53,919,310 51,412,926 Less: Sales tax and federal excise duty 8,487,245 7,708,848 Rebates and commission 670,758 620,909
9,158,003 8,329,757 Netsales 44,761,307 43,083,169 Cost of sales 24 (24,578,219) (24,393,064)
Grossprofit 20,183,088 18,690,105
Distribution costs 25 (3,127,018) (3,382,156)Administrative expenses 26 (917,635) (760,269)Finance costs 27 (25,750) (34,225)Other expenses 28 (1,442,341) (1,035,032)Other income 29 1,241,450 977,942
Profitbeforetaxation 15,911,794 14,456,365 Taxation - current (2,942,130) (2,890,619) - deferred (538,066) (221,343)
30 (3,480,196) (3,111,962)
Profitaftertaxation 12,431,598 11,344,403 Othercomprehensiveincome:
Other comprehensive income not to be reclassified to profit and loss account in subsequent periods:
Loss on remeasurements of post retirement benefit obligations (71,594) (912) Deferred taxation 16,958 249
(54,636) (663)
Totalcomprehensiveincomefortheyear 12,376,962 11,343,740 (PKR) Earningspershare-basicanddiluted 31 38.44 35.08
The annexed notes from 1 to 39 form an integral part of these financial statements.
MuhammadYunusTabbaChairman/Director
MuhammadAliTabbaChiefExecutive
P 93

Cash Flow StatementFor the year ended June 30, 2015
Note 2015 2014 PKR in ‘000’
CASHFLOWSFROMOPERATINGACTIVITIES Cashgeneratedfromoperations 32 21,234,242 15,987,264 Finance costs paid (28,801) (39,336) Income tax paid (2,151,235) (2,347,076) Gratuity paid (45,996) (45,353)
(2,226,032) (2,431,765) Long-term deposits 1,275 10,846
Netcashgeneratedfromoperatingactivities 32.1 19,009,485 13,566,345 CASHFLOWSFROMINVESTINGACTIVITIES Fixed capital expenditure (5,427,225) (3,072,211) Long-term investments 7 (2,767,470) (2,538,550) Long-term loans and advances (6,536) 481,860 Investments - 110,062 Sale proceeds on disposal of property, plant and equipment 64,415 69,958
Netcashusedininvestingactivities (8,136,816) (4,948,881) CASHFLOWSFROMFINANCINGACTIVITIES Repayment of long-term finance (127,498) (265,400) Dividends paid (2,891,346) (2,567,107)
Netcashusedinfinancingactivities (3,018,844) (2,832,507)Netincreaseincashandcashequivalents 7,853,825 5,784,957
Cash and cash equivalents at the beginning of the year 8,590,797 2,805,840
Cash and cash equivalents at the end of the year 16 16,444,622 8,590,797 The annexed notes from 1 to 39 form an integral part of these financial statements.
MuhammadYunusTabbaChairman/Director
MuhammadAliTabbaChiefExecutive
P 94

Statement of Changes in EquityFor the year ended June 30, 2015
Issued, Capital subscribed reserve Revenue reserves Total Total and paid up Share General Unappropriated reserves equity capital premium reserves profit PKR in ‘000’
BalanceasatJuly01,2013 3,233,750 7,343,422 20,000,000 10,458,271 37,801,693 41,035,443 Transfer to general reserve – – 7,871,271 (7,871,271) – –Final dividend at the rate of PKR 8/-per ordinary share of PKR 10/- each for the year ended June 30, 2013 – – – (2,587,000) (2,587,000) (2,587,000) Profit after taxation – – – 11,344,403 11,344,403 11,344,403 Other comprehensive income for the year – – – (663) (663) (663)Total comprehensive income for the year – – – 11,343,740 11,343,740 11,343,740
BalanceasatJune30,2014 3,233,750 7,343,422 27,871,271 11,343,740 46,558,433 49,792,183 Transfer to general reserve – – 8,433,365 (8,433,365) – –Final dividend at the rate of PKR 9/- per ordinary share of PKR 10/-each for the year ended June 30, 2014 – – – (2,910,375) (2,910,375) (2,910,375) Profit after taxation – – – 12,431,598 12,431,598 12,431,598 Other comprehensive income for the year – – – (54,636) (54,636) (54,636)
Total comprehensive income for the year – – – 12,376,962 12,376,962 12,376,962
BalanceasatJune30,2015 3,233,750 7,343,422 36,304,636 12,376,962 56,025,020 59,258,770
The annexed notes from 1 to 39 form an integral part of these financial statements.
MuhammadYunusTabbaChairman/Director
MuhammadAliTabbaChiefExecutive
P 95

1 THECOMPANYANDITSOPERATION
1.1 Lucky Cement Limited (the Company) was incorporated in Pakistan on September 18, 1993 under the Companies Ordinance,
1984 (the Ordinance). The shares of the Company are quoted on all the three stock exchanges in Pakistan. The Company has
also issued Global Depository Receipts (GDRs) which are listed and traded on the Professional Securities Market of the London
Stock Exchange. The principal activity of the Company is manufacturing and marketing of cement. The registered office of the
Company is located at Pezu, District Lakki Marwat in Khyber Pakhtunkhwa. The Company has two production facilities at Pezu,
District Lakki Marwat in Khyber Pakhtunkhwa and at Main Super Highway in Karachi, Sindh.
1.2 These financial statements are the separate financial statements of the Company in which investment in subsidiaries has been
accounted for at cost less accumulated impairment losses, if any.
2 STATEMENTOFCOMPLIANCE
These financial statements have been prepared in accordance with approved accounting standards as applicable in Pakistan.
Approved accounting standards comprise of such International Financial Reporting Standards (IFRSs) issued by the International
Accounting Standards Board (IASB) and Islamic Financial Accounting Standards (IFAS) issued by the Institute of Chartered
Accountants of Pakistan (ICAP) as are notified under the Companies Ordinance, 1984, provisions of and directives issued under
the Companies Ordinance, 1984. In case requirements differ, the provisions or directives of the Companies Ordinance, 1984
shall prevail.
3 SIGNIFICANTACCOUNTINGJUDGMENTS,ESTIMATESANDASSUMPTIONS
The preparation of financial statements in conformity with approved accounting standards requires the use of certain critical
accounting estimates. It also requires management to exercise its judgment in the process of applying the Company’s accounting
policies. Estimates and judgments are continually evaluated and are based on historic experience and other factors, including
expectations of future events that are believed to be reasonable under the circumstances. Revision to accounting estimates
are recognised in the period in which the estimate is revised and in any future periods affected. In the process of applying the
Company’s accounting policies, management has made the following estimates and judgments which are significant to these
financial statements:
Property,plantandequipment
The Company has made certain estimations with respect to residual value, depreciation method and depreciable lives of
property, plant and equipments as disclosed in note 4.3 to these financial statements. Further, the Company reviews the value
of assets for possible impairment on each reporting period.
Provisionforstoresandsparesandstock-in-trade
The Company has made estimation with respect to provision for slow moving, damaged and obsolete items and their net
realizable value as disclosed in note 4.7 and 4.8 to these financial statements.
Provisionfordoubtfuldebtsandotherreceivables
The Company reviews the recoverability of its trade debts and other receivables, to assess the amount required for provision
for doubtful debts as disclosed in note 4.9 to these financial statements.
Staffretirementbenefits
Certain actuarial assumptions have been adopted as disclosed in note 20.1.5 to these financial statements for valuation of
present value of defined benefit obligations.
Notes to the Financial StatementsFor the year ended June 30, 2015
P 96

Incometaxes
In making the estimates for income taxes payable by the Company, the management considers current Income Tax law and the
decisions of appellate authorities on certain cases issued in the past.
Futureestimationofexportsales
Deferred tax calculation has been based on estimate of future ratio of export and local sales.
Contingencies
The assessment of the contingencies inherently involves the exercise of significant judgment as the outcome of the future
events cannot be predicted with certainty. The Company, based on the availability of the latest information, estimates the value
of contingent assets and liabilities which may differ on the occurrence / non occurrence of the uncertain future events.
4 SUMMARYOFSIGNIFICANTACCOUNTINGPOLICIES
4.1 Accountingconvention
These financial statements have been prepared under the historical cost convention except for:
– Investments which are carried at fair value in accordance with IAS 39 “Financial Instruments: Recognition and
measurement”; and
– Defined benefit obligations which are stated at present value in accordance with the requirements of IAS 19 “Employee
Benefits”, as disclosed in note 20.1.
4.2 Standards,interpretationsandamendmentstoapprovedaccountingstandardsthatbecameeffectiveduringtheyear:
The accounting policies adopted in the preparation of these financial statements are consistent with those of the previous
financial year except as described below:
New/RevisedStandards,InterpretationsandAmendments
The Company has adopted the following revised standards, amendments and interpretations of IFRSs which became effective
for the current year:
IAS 19 Employee Benefits - (Amendment) - Defined Benefit Plans: Employee Contributions
IAS 32 Financial Instruments : Presentation – (Amendment) -Offsetting Financial Assets and Financial Liabilities
IAS 36 Impairment of Assets – (Amendment) -Recoverable Amount Disclosures for Non-Financial Assets
IAS 39 Financial Instruments: Recognition and Measurement – (Amendment) - Novation of Derivatives and Continuation of
Hedge Accounting
IFRIC 21 Levies
ImprovementstoAccountingStandardsIssuedbytheIASB
IFRS 2 Share-based Payment - Definitions of vesting conditions
IFRS 3 Business Combinations – Accounting for contingent consideration in a business combination
IFRS 3 Business Combinations - Scope exceptions for joint ventures
IFRS 8 Operating Segments – Aggregation of operating segments
IFRS 8 Operating Segments - Reconciliation of the total of the reportable segments’ assets to the entity’s assets
IFRS 13 Fair Value Measurement - Scope of paragraph 52 (portfolio exception)
IAS 16 Property, Plant and Equipment and IAS 38 Intangible Assets – Revaluation method – proportionate restatement of
accumulated depreciation / amortisation
P 97

IAS 24 Related Party Disclosures - Key management personnel
IAS 40 Investment Property - Interrelationship between IFRS 3 and IAS 40 (ancillary services)
The adoption of the above amendments, improvements to accounting standards and interpretations did not have any effect
on the financial statements.
4.3 Property,plantandequipment
These are stated at cost less accumulated depreciation / amortization and impairment losses, if any, except for freehold land
and capital work-in-progress which are stated at cost less impairment losses, if any. Cost in relation to certain operating fixed
assets, including capital work-in-progress, signifies historical cost and financial charges on borrowings as stated in note 4.18 to
these financial statements.
Except for plant and machinery and generators, depreciation / amortization is charged to profit and loss account applying the
straight line method at the rates mentioned in note 5.1 to these financial statements. On plant and machinery and generators
depreciation is charged on units of production method (UPM) based on higher of estimated life or production. Depreciation on
additions is charged from the date of acquisition / transfer of asset, whereas depreciation on disposals is charged till the date
of disposal.
Assets’ residual values, the method of depreciation and useful lives are reviewed and adjusted, if appropriate, at each balance
sheet date.
Maintenance and normal repairs are charged to profit and loss account as and when incurred. Major renewals and
improvements which increase the assets’ remaining useful economic life or the performance beyond the current estimated
levels are capitalized and the assets so replaced, if any, are retired.
Gains and losses on disposal of operating fixed assets, if any, are included in profit and loss account.
4.4 Intangibleassets
These are stated at cost less accumulated amortization and impairment losses, if any.
Amortization is charged to profit and loss account applying the straight line method.
4.5 Investmentsinsubsidiaries
Investments in subsidiaries are stated at cost less impairment losses, if any.
4.6 Investmentsatfairvaluethroughprofitorloss
An investment is classified at fair value through profit or loss if it is held for trading or is designated as such upon initial recognition.
Financial instruments are classified as held for trading if they are acquired for the purpose of selling and repurchasing in near
term. These assets are acquired principally for the purpose of generating a profit from short-term fluctuation in price. Financial
instruments are designated at fair value through profit or loss if the Company manages such investments and makes sales and
purchase decisions based on their fair value in accordance with the Company’s investment strategy.
All investments classified as investments at fair value through profit or loss are initially measured at cost being fair value
of consideration given. All transaction costs are recognised directly in profit and loss account. At subsequent dates these
investments are measured at fair value with any resulting gain or loss recognised directly in the profit and loss account.
Notes to the Financial StatementsFor the year ended June 30, 2015
P 98
4.7 Storesandspares
These are valued at lower of weighted average cost and net realizable value, except items in transit, which are stated at cost.
Provision for slow moving, damaged and obsolete items are charged to profit and loss account. Value of items is reviewed at
each balance sheet date to record provision for any slow moving items, damaged and obsolete items.
Net realizable value signifies the selling price in the ordinary course of business less costs necessary to be incurred in order to
make the sale, which is generally equivalent to the estimated replacement cost.
4.8 Stock-in-trade
These are stated at the lower of cost and net realizable value. The methods used for the calculation of cost are as
follows:
i) Raw and packing material at weighted average cost comprising of quarrying / purchase price, transportation,
government levies and other overheads. ii) Work-in-process and finished goods at weighted average cost comprising direct cost of raw material, labour and
other manufacturing overheads.
Net realizable value signifies the estimated selling price in the ordinary course of business less estimated costs necessary to
make the sale.
4.9 Tradedebtsandotherreceivables
Trade debts and other receivables are stated at original invoice amount less provision for doubtful debts, if any. Provision
for doubtful debts / receivables is based on the management’s assessment of customers’ outstanding balances and
creditworthiness. Bad debts are written-off when identified.
4.10 Cashandcashequivalents
Cash and cash equivalents are stated at cost. For the purpose of cash flow statement, cash and cash equivalents comprise of
cash and cheques in hand and current and deposit accounts with commercial banks.
4.11 Long-termandshort-termborrowings
Finance costs are accounted for on accrual basis and are disclosed as accrued interest / mark-up to the extent of the amount
remaining unpaid.
4.12 Staffretirementbenefits
The Company operates an unfunded gratuity scheme covering all permanent employees. Contribution is made to this
scheme on the basis of actuarial recommendations. The actuarial valuation is carried out using the Projected Unit Credit
Method.
Staff retirement benefits are payable to staff on completion of prescribed qualifying period of service under the
scheme.
4.13 Compensatedabsences
The Company accounts for compensated absences in the accounting period in which these are accrued.
4.14 Tradeandotherpayables
Liabilities for trade and other amounts payable are carried at cost which is the fair value of the consideration to be paid in
future for goods and services received, whether or not invoiced to the Company.
P 99

4.15 Provisions
Provisions are recognized in the balance sheet when the Company has a legal or constructive obligation as a result of a past
event, it is probable that an outflow of economic benefits will be required to settle the obligation and a reliable estimate of
the amount of obligation can be made. However, provisions are reviewed at each balance sheet date and adjusted to reflect
current best estimate.
4.16 Taxation
Current
The charge for current taxation is based on taxable income at the current rates of taxation in accordance with Income Tax
Ordinance, 2001.
Deferred
Deferred tax is provided in full using the balance sheet liability method on all temporary differences arising at the balance sheet
date, between the tax bases of the assets and the liabilities and their carrying amounts. Deferred tax liabilities are recognized
for all taxable temporary differences and deferred tax assets are recognized for all deductible temporary differences, unused
tax losses and unused tax credits to the extent that it is probable that future taxable profits will be available against which these
can be utilized.
Deferred tax is calculated at the rates that are expected to apply to the period when the differences reverse, based on tax rates
that have been enacted or substantively enacted by the balance sheet date. In this regard, the effects on deferred taxation of
the portion of income expected to be subject to final tax regime is adjusted in accordance with the requirement of Accounting
Technical Release - 27 of the Institute of Chartered Accountants of Pakistan.
4.17 Revenuerecognition
Revenue is recognized to the extent that it is probable that the economic benefits will flow to the Company and revenue can be
measured reliably. Revenue is measured at fair value of the consideration received or receivable, excluding discounts, rebates
and government levies.
4.17.1 Saleofgoods
Revenue from sale of goods is recognized when the significant risks and rewards of ownership of the goods have passed to the
buyer, usually on dispatch of the goods to customers.
4.17.2 Otherincome
Revenue from the sale of electricity is recorded based on the output delivered and capacity available at the rates as specified
under Power Purchase Agreement.
Return on bank deposits is recognized on a time proportion basis on the principal amount outstanding and at the rate
applicable.
Dividend income is recognized when the right to receive such payment is established.
4.18 Borrowingcosts
Borrowing and other related costs directly attributable to the acquisition, construction or production of qualifying assets,
which are assets that necessarily take a substantial period of time to get ready for their intended use, are added to the cost
of those assets, until such time as the assets are substantially ready for their intended use. All other borrowing costs are
recognized as an expense in the period in which they are incurred.
Notes to the Financial StatementsFor the year ended June 30, 2015
P 100

4.19 Foreigncurrencytranslations
Foreign currency transactions are translated into Pakistani Rupee using the exchange rates ruling at the dates of the
transactions. Monetary assets and liabilities in foreign currencies are re-translated into Pakistani Rupee using the exchange
rate ruling at the balance sheet date. Foreign exchange gains and losses resulting from the settlement of such transactions and
from the translations at the year end exchange rates of monetary assets and liabilities denominated in foreign currencies are
recognized in the profit and loss account.
4.20 Financialassetsandliabilities
Financial assets and liabilities are initially measured at cost, which is the fair value of the consideration given and received
respectively. These financial assets and liabilities are subsequently remeasured to fair value, amortized cost or cost as the case
may be. Any gain or loss on the recognition and de-recognition of the financial assets and liabilities is included in the profit and
loss account for the period in which it arises.
Financial assets and financial liabilities are recognised at the time when the Company becomes a party to the contractual
provisions of the instrument. Financial assets are derecognized when the Company loses control of the contractual rights
that comprise the financial asset. Financial liabilities are removed from the balance sheet when the obligation is extinguished,
discharged, cancelled or expired.
Assets or liabilities that are not contractual in nature and that are created as a result of statutory requirements imposed by the
Government are not the financial instruments of the Company.
4.21 Offsetting
A financial asset and financial liability is off-set and the net amount is reported in the balance sheet when a legal enforceable
right to set-off the transactions is available and also there is an intention to settle on a net basis or to realize the asset and settle
the liability simultaneously.
4.22 Impairment
At each balance sheet date, the carrying amount of assets are reviewed to determine whether there is any indication that
those assets have suffered an impairment loss. Such indication exists, the recoverable amount of the asset is estimated in
order to determine the extent of the impairment loss, if any. Impairment losses are recognized as expense in the profit and
loss account.
4.23 Dividendandappropriationtoreserves
Dividend and appropriation to reserves are recognized in the financial statements in the period in which these are
approved.
4.24 Functionalandpresentationcurrency
These financial statements are presented in Pakistani Rupee, which is the Company’s functional and presentation
currency.
P 101

4.25 Standards,interpretationsandamendmentstoapprovedaccountingstandardsthatarenotyeteffective
The following amendments and interpretations with respect to the approved accounting standards as applicable in Pakistan
would be effective from the dates mentioned below against the respective standard or interpretation:
Effectivedate (annualperiodsbeginning StandardorInterpretation onorafter)
IFRS 10 – Consolidated Financial Statements 01 January 2015 IFRS 10 Consolidated Financial Statements, IFRS 12 Disclosure of Interests in Other Entities and IAS 27 Separate Financial Statements – Investment Entities (Amendment) 01 January 2015 IFRS 10 Consolidated Financial Statements, IFRS 12 Disclosure of Interests in Other Entities and IAS 27 Separate Financial Statements – Investment Entities: Applying the Consolidation Exception (Amendment) 01 January 2016 IFRS 10 Consolidated Financial Statements and IAS 28 Investment in Associates and Joint Ventures - Sale or Contribution of Assets between an Investor and its Associate or Joint Venture (Amendment) 01 January 2016 IFRS 11 – Joint Arrangements 01 January 2015 IFRS 11 Joint Arrangements - Accounting for Acquisition of Interest in Joint Operation (Amendment) 01 January 2016 IFRS 12 – Disclosure of Interests in Other Entities 01 January 2015 IFRS 13 – Fair Value Measurement 01 January 2015 IAS 1 – Presentation of Financial Statements - Disclosure Initiative (Amendment) 01 January 2016 IAS 16 Property, Plant and Equipment and IAS 38 intangible assets - Clarification of Acceptable Method of Depreciation and Amortization (Amendment) 01 January 2016 IAS 16 Property, Plant and Equipment IAS 41 Agriculture - Agriculture: Bearer Plants (Amendment) 01 January 2016 IAS 27 – Separate Financial Statements – Equity Method in Separate Financial Statements (Amendment) 01 January 2016
In addition to the above standards and amendments, improvements to various accounting standards have also been issued
by the IASB. Such improvements are generally effective for accounting periods beginning on or after 01 January 2016. The Company expects that such improvements to the standards will not have any material impact on the Company’s financial statements in the period of initial application.
Further, following new standards have been issued by IASB which are yet to be notified by the Securities and Exchange
Commission of Pakistan (SECP) for the purpose of applicability in Pakistan.
Effectivedate (annualperiodsbeginning StandardorInterpretation onorafter)
IFRS 9 – Financial Instruments: Classification and Measurement 01 January 2018 IFRS 14 – Regulatory Deferral Accounts 01 January 2016 IFRS 15 – Revenue from Contracts with Customers 01 January 2018
The Company expects that the adoption of the above standards and interpretations will not have material effect on the Company’s financial statements in the period of initial application except for IFRS 9 - Financial Instruments: Classification and Measurement, IFRS 10 - Consolidated Financial Statements, IFRS 11 - Joint Arrangements, IFRS 12 - Disclosure of Interests in Other Entities and IFRS 13 - Fair Value Measurement, which may affect certain disclosures.
Notes to the Financial StatementsFor the year ended June 30, 2015
P 102
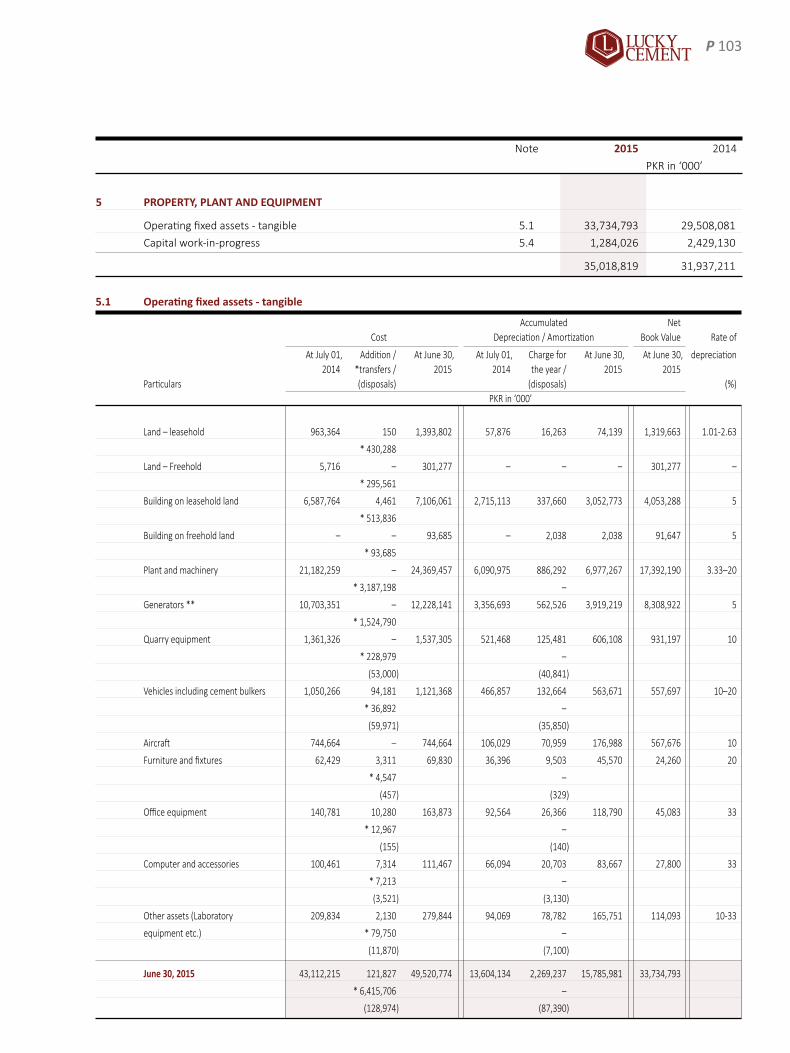
Note 2015 2014
PKR in ‘000’
5 PROPERTY,PLANTANDEQUIPMENT
Operating fixed assets - tangible 5.1 33,734,793 29,508,081
Capital work-in-progress 5.4 1,284,026 2,429,130
35,018,819 31,937,211
5.1 Operatingfixedassets-tangible
Accumulated Net Cost Depreciation / Amortization Book Value Rate of
At July 01, Addition / At June 30, At July 01, Charge for At June 30, At June 30, depreciation 2014 *transfers / 2015 2014 the year / 2015 2015 Particulars (disposals) (disposals) (%) PKR in ‘000’
Land – leasehold 963,364 150 1,393,802 57,876 16,263 74,139 1,319,663 1.01-2.63
* 430,288
Land – Freehold 5,716 – 301,277 – – – 301,277 –
* 295,561
Building on leasehold land 6,587,764 4,461 7,106,061 2,715,113 337,660 3,052,773 4,053,288 5
* 513,836
Building on freehold land – – 93,685 – 2,038 2,038 91,647 5
* 93,685
Plant and machinery 21,182,259 – 24,369,457 6,090,975 886,292 6,977,267 17,392,190 3.33–20
* 3,187,198 –
Generators ** 10,703,351 – 12,228,141 3,356,693 562,526 3,919,219 8,308,922 5
* 1,524,790
Quarry equipment 1,361,326 – 1,537,305 521,468 125,481 606,108 931,197 10
* 228,979 –
(53,000) (40,841)
Vehicles including cement bulkers 1,050,266 94,181 1,121,368 466,857 132,664 563,671 557,697 10–20
* 36,892 –
(59,971) (35,850)
Aircraft 744,664 – 744,664 106,029 70,959 176,988 567,676 10
Furniture and fixtures 62,429 3,311 69,830 36,396 9,503 45,570 24,260 20
* 4,547 –
(457) (329)
Office equipment 140,781 10,280 163,873 92,564 26,366 118,790 45,083 33
* 12,967 –
(155) (140)
Computer and accessories 100,461 7,314 111,467 66,094 20,703 83,667 27,800 33
* 7,213 –
(3,521) (3,130)
Other assets (Laboratory 209,834 2,130 279,844 94,069 78,782 165,751 114,093 10-33
equipment etc.) * 79,750 –
(11,870) (7,100)
June30,2015 43,112,215 121,827 49,520,774 13,604,134 2,269,237 15,785,981 33,734,793
* 6,415,706 –
(128,974) (87,390)
P 103

Accumulated Net Cost Depreciation / Amortization Book Value Rate of
At July 01, Addition / At June 30, At July 01, Charge for At June 30, At June 30, depreciation 2013 *transfers / 2014 2013 the year / 2014 2014 Particulars (disposals) (disposals) (%) PKR in ‘000’
Land – leasehold 963,364 – 963,364 46,153 11,723 57,876 905,488 1.01-1.89
Land – Freehold 5,716 – 5,716 – – – 5,716 –
Building on leasehold land 6,559,956 – 6,587,764 2,386,525 328,588 2,715,113 3,872,651 5
* 27,808
Plant and machinery 20,988,499 – 21,182,259 5,270,727 825,437 6,090,975 15,091,284 3.33–20
* 232,376 –
(38,616) (5,189)
Generators ** 10,692,205 – 10,703,351 2,821,660 535,033 3,356,693 7,346,658 5
* 11,146
Quarry equipment 1,087,322 – 1,361,326 402,546 119,382 521,468 839,858 10
* 274,523 –
(519) (460)
Vehicles including cement bulkers 894,460 190,485 1,050,266 382,846 111,517 466,857 583,409 10–20
* 5,544 –
(40,223) (27,506)
Aircraft 744,664 – 744,664 35,070 70,959 106,029 638,635 10
Furniture and fixtures 52,779 6,973 62,429 29,260 7,625 36,396 26,033 20
* 3,338 –
(661) (489)
Office equipment 124,142 8,949 140,781 73,823 19,156 92,564 48,217 33
* 8,220 –
(530) (415)
Computer and accessories 85,993 9,305 100,461 51,625 17,943 66,094 34,367 33
* 8,963 –
(3,800) (3,474)
Other assets (Laboratory 189,460 2,428 209,834 77,505 16,696 94,069 115,765 10-33
equipment etc.) * 18,409 –
(463) (132)
June 30, 2014 42,388,560 218,140 43,112,215 11,577,740 2,064,059 13,604,134 29,508,081
* 590,327 –
(84,812) (37,665)
** The carrying value of major spare parts and stand by equipment included in generators amount to PKR 452.744 million (2014: PKR 503.606 million).
5.2 Depreciation / amortization charged for the year has been allocated as follows:
Note 2015 2014 PKR in ‘000’
Cost of sales 24 1,929,062 1,750,528
Distribution costs 25 80,693 78,393
Administrative expenses 26 156,105 132,982
Cost of sale of electricity 103,377 102,156
Total 2,269,237 2,064,059
Notes to the Financial StatementsFor the year ended June 30, 2015
P 104

5.3 The details of operating fixed assets disposed off during the year are as follows:
Particulars Cost Accumulated Net Book Sale Gain / Mode of Particulars of Buyers
Depreciation Value Proceeds (Loss) Disposal
PKR in ‘000’
TOYOTA PRADO - BF-3366 23,239 8,493 14,746 22,000 7,254 Insurance Claim M/s EFU General Insurance Ltd
TOYOTA COROLLA - BBC-139 1,968 549 1,419 1,900 481 Insurance Claim M/s EFU General Insurance Ltd
HONDA CG-125 - ABL - 577 100 32 68 80 12 Insurance Claim M/s EFU General Insurance Ltd
HONDA CITY - PV-259 1,264 1,090 174 1,087 913 Negotiation Mr. Nasrrullah (Employee)
TOYOTA COROLLA - JV-531 1,436 1,354 82 769 687 Negotiation Mr. M. Shabbir (Employee)
SUZUKI CULTUS - ASE-309 807 656 151 725 574 Negotiation Mr. Asif Raza Khan (Employee)
SUZUKI CULTUS - ATH-694 868 704 164 730 566 Negotiation Mr. Tanveer Iftikhar (Employee)
TOYOTA COROLLA - ARH-029 1,467 1,305 162 725 563 Negotiation Mr. Mashkoor Ahmed (Employee)
TOYOTA VITZ - ARD-946 782 618 164 625 461 Negotiation Mr. Naseer Meghani (Employee)
SUZUKI CULTUS - ARD-372 613 497 116 550 434 Negotiation Mr. Abdul Qadir Khan (Employee)
TOYOTA COROLLA - BAQ-155 1,939 582 1,357 1,451 94 Negotiation Mr. Faiz Durrani (Ex-employee)
HONDA CITY - AZA-305 1,526 564 962 1,046 84 Negotiation Mr. Zafar Iqbal (Ex-employee)
SUZUKI CULTUS - AYH-468 983 478 505 860 355 Tender Mr. Abdul Waqas
SUZUKI CULTUS - AWF-693 951 652 299 762 463 Tender Mr. Abdul Waqas
HONDA CITY - ATZ-699 1,286 934 352 1,207 855 Tender Mr. Ali Akber Khan
SUZUKI CULTUS - AWP-387 970 554 416 857 441 Tender Mr. Hameed Tabba
HONDA CITY - VE-784 1,426 833 593 1,341 748 Tender Mr. M. Usman Khan
HONDA CITY - QW-708 1,295 1,026 269 1,282 1,013 Tender Mr. M. Usman Khan
TOYOTA COROLLA - AKS-895 1,309 1,196 113 716 603 Tender Mr. M.Imran Younas
TOYOTA COROLLA - ARX-097 1,423 1,275 148 1,027 879 Tender Mr. M.Yasin, Karachi
SUZUKI CULTUS - AQE-013 626 571 55 555 500 Tender Mr. Anis-ud-din, Karachi
SUZUKI CULTUS - AVE-529 936 606 330 856 526 Tender Mr. Azmat Ali Siddique
SUZUKI CULTUS - MV-730 624 550 74 678 604 Tender Mr. Kashif Ghafoor
TOYOTA HILUX - MNS-440 862 623 239 395 156 Tender Mr. Muhammad Aslam Khan
SUZUKI CULTUS - ARE-488 613 521 92 546 454 Tender Mr. Noman Iqbal
HONDA CITY - ALG-605 914 850 64 682 618 Tender Mr. Nusrat Iqbal
SUZUKI CULTUS - AVW-938 928 640 288 754 466 Tender Mr. Syed Adil Ali
TOYOTA COROLLA - ARY-709 1,454 1,185 269 1,080 811 Tender Mr. Syed Muqeem Uddin
DOZER 8,870 8,627 243 2,100 1,857 Tender M/s Zam traders Pezu
DOZER 8,870 8,624 246 2,100 1,854 Tender M/s Zam traders Pezu
Air compressor 4,584 2,935 1,649 3,223 1,574 Tender M/s Zam traders Pezu
Dumper 4,226 2,853 1,373 750 (623) Tender M/s Zam traders Pezu
Dumper 4,226 2,853 1,373 750 (623) Tender M/s Zam traders Pezu
Dumper 4,226 2,853 1,373 750 (623) Tender M/s Zam traders Pezu
Dumper 4,226 2,853 1,373 750 (623) Tender M/s Zam traders Pezu
Dumper 4,226 2,853 1,373 750 (623) Tender M/s Zam traders Pezu
Dumper 2,500 1,635 865 1,000 135 Tender M/s Zam traders Pezu
Dumper - Body (Bucket) 1,409 951 458 250 (208) Tender M/s Zam traders Pezu
Dumper - Body (Bucket) 1,409 951 458 250 (208) Tender M/s Zam traders Pezu
Dumper - Body (Bucket) 1,409 951 458 250 (208) Tender M/s Zam traders Pezu
Dumper - Body (Bucket) 1,409 951 458 250 (208) Tender M/s Zam traders Pezu
Dumper - Body (Bucket) 1,409 951 458 250 (208) Tender M/s Zam traders Pezu
LAPTOP 167 80 87 65 (22) Negotiation Mr. Moez Narsi (Ex-employee)
Items having book value less than
PKR 50,000 each 23,199 17,531 5,668 5,641 (27) - Various
Total 128,974 87,390 41,584 64,415 22,831
2014 84,812 37,665 47,147 69,958 22,811
P 105

5.4 The following is the movement in capital work-in-progress during the year:
Transferred
Opening to operating Closing balance
balance Additions fixed assets 2015 2014
PKR in ‘000’
Land - leasehold - 430,288 430,288 - -
Land - Freehold - 295,561 295,561 - -
Building on leasehold land 262,430 382,722 513,836 131,316 262,430
Building on freehold land - 93,685 93,685 - -
Plant and machinery 1,807,819 1,381,444 3,187,198 2,065 1,807,819
Generators 271,096 2,388,432 1,524,790 1,134,738 271,096
Quarry equipment - 228,979 228,979 - -
Vehicles including cement bulkers - 36,892 36,892 - -
Furniture and fixtures - 4,547 4,547 - -
Office equipment - 12,967 12,967 - -
Computer and accessories - 7,213 7,213 - -
Other assets 87,785 7,872 79,750 15,907 87,785
2,429,130 5,270,602 6,415,706 1,284,026 2,429,130
6 INTANGIBLEASSETS
Represents various computer software amortized on the straight line basis over the period of 36 months. Movement during
the year is as follows:
Note 2015 2014 PKR in ‘000’
Balance as at July 01 27,652 4,711
Add: Additions during the year 34,796 32,185
62,448 36,896
Less:Amortization charge for the year 26 (20,527) (9,244)
41,921 27,652
7 LONG-TERMINVESTMENTS-atcost Subsidiaries Lucky Holdings Limited 7.1 5,619,000 5,619,000
LCL Investment Holdings Limited 7.2 4,580,500 2,537,800
LCL Holdings Limited 7.3 521,155 -
10,720,655 8,156,800
Associate
Yunus Energy Limited 7.4 204,365 750
10,925,020 8,157,550
7.1 Lucky Holdings Limited (LHL) is a public unlisted company incorporated in Pakistan. As of the balance sheet date, the Company
owns 75 percent shareholding of LHL. As of the balance sheet date, LHL held 74.75 percent shares of ICI Pakistan Limited. The said acquisition was made as per the
share purchase agreement with ICI Omicron B.V. a wholly owned subsidiary of Akzo Noble N.V. Netherlands.
Notes to the Financial StatementsFor the year ended June 30, 2015
P 106

7.2 The Company has made an investment in LCL Investment Holdings Limited (LCLIHL), a wholly owned subsidiary of the Company, incorporated and domiciled in Mauritius. During the year, the Company has subscribed 20,000,000 ordinary shares of LCLIHL @ US$1/- and concluded a joint venture agreement with Al-Shumookh Construction Materials Trading FZE, United Arab Emirates for establishing Lucky Al-Shumookh Holdings Limited for constructing a cement grinding unit in the Republic of Iraq. LCLIHL holds 50 percent ownership interest in the aforementioned Joint Venture.
LCLIHL has also entered into a joint venture agreement with Rawsons Investments Limited (registered in Cayman Islands) for
establishing LuckyRawji Holdings Limited for constructing a fully integrated cement manufacturing unit in the Democratic Republic of Congo. LCLIHL holds 50 percent ownership interest in the aforesaid Joint Venture.
7.3 During the year, the Company has made an equity investment in LCL Holdings Limited (LCLHL), a wholly owned subsidiary of the Company, incorporated in Pakistan, of 2,026,500 ordinary shares @ PKR 10/- each out of which 1,926,500 shares were issued at a premium of PKR 260/- each. As of the balance sheet date, LCLHL owns 100 percent shares in Lucky Electric Power Company Limited.
7.4 Represents 20% equity investment in Yunus Energy Limited comprising 20,361,500 shares @ PKR 10/- each made during the
year.
Note 2015 2014 PKR in ‘000’
8 LONG-TERMLOANSANDADVANCES
Loans and advances to: Employees 8.1 31,975 28,506 Executives 8.1&8.2 30,138 26,578 62,113 55,084 Less: Recoverable within one year shown under current assets 12 (38,505) (38,012) 23,608 17,072 Other advances 8.3 55,373 55,373
78,981 72,445
8.1 Loans given to executives and employees are in accordance with the Company policy. These loans are interest free and are
secured against the gratuity of respective employees. These loans are carried at cost due to practicality and materiality of the amounts involved. The maximum aggregate balance due from executives at the end of any month during the year was PKR
30.138 million (2014: PKR 26.578 million).
2015 2014 PKR in ‘000’
8.2 Reconciliationofcarryingamountofloantoexecutives(keymanagementpersonnel) Balance as of July 01 26,578 18,416 Disbursements during the year 26,111 30,771 Repayments during the year (22,551) (22,609)
30,138 26,578
8.3 This represents advance given to Sui Southern Gas Company Limited in respect of additional gas line which will be adjusted
after the commissioning of gas line in 48 equal monthly installments.
P 107

Note 2015 2014 PKR in ‘000’
9 STORESANDSPARES
Stores 9.1 1,521,539 2,960,886 Spares 9.2 3,703,957 3,323,102 5,225,496 6,283,988 Less: Provision for slow moving spares 9.3 230,073 205,073
4,995,423 6,078,915
9.1 This includes stores in transit mainly coal amounting to PKR 171.216 million (2014:PKR 472.172 million) as of the balance sheet
date. 9.2 This includes spares in transit of PKR 60.186 million (2014: PKR 64.037 million) as of the balance sheet date.
Note 2015 2014 PKR in ‘000’
9.3 Movement in provision for slow moving spares: Balance as of July 01 205,073 195,073 Provision during the year 24 25,000 10,000
Closing balance 230,073 205,073
10 STOCK-IN-TRADE
Raw and packing materials 556,766 554,593 Work-in-process 614,096 628,533 Finished goods 439,883 455,858 1,610,745 1,638,984 Less: Provision for slow moving packing material 24 30,000 -
1,580,745 1,638,984
11 TRADEDEBTS-consideredgood
Bills receivable - secured 1,093,858 1,351,017 Others - unsecured 956,633 726,697 2,050,491 2,077,714 Less: Provision for doubtful debts 25 8,292 -
2,042,199 2,077,714
11.1 TheageingoftradedebtsasatJune30isasfollows:
Neither past due nor impaired 2,042,199 2,077,714
12 LOANSANDADVANCES-secured,consideredgood
Current portion of long term loan and advances to employees & executives 8 38,505 38,012 Advances to suppliers and others 214,845 123,613
253,350 161,625
Notes to the Financial StatementsFor the year ended June 30, 2015
P 108
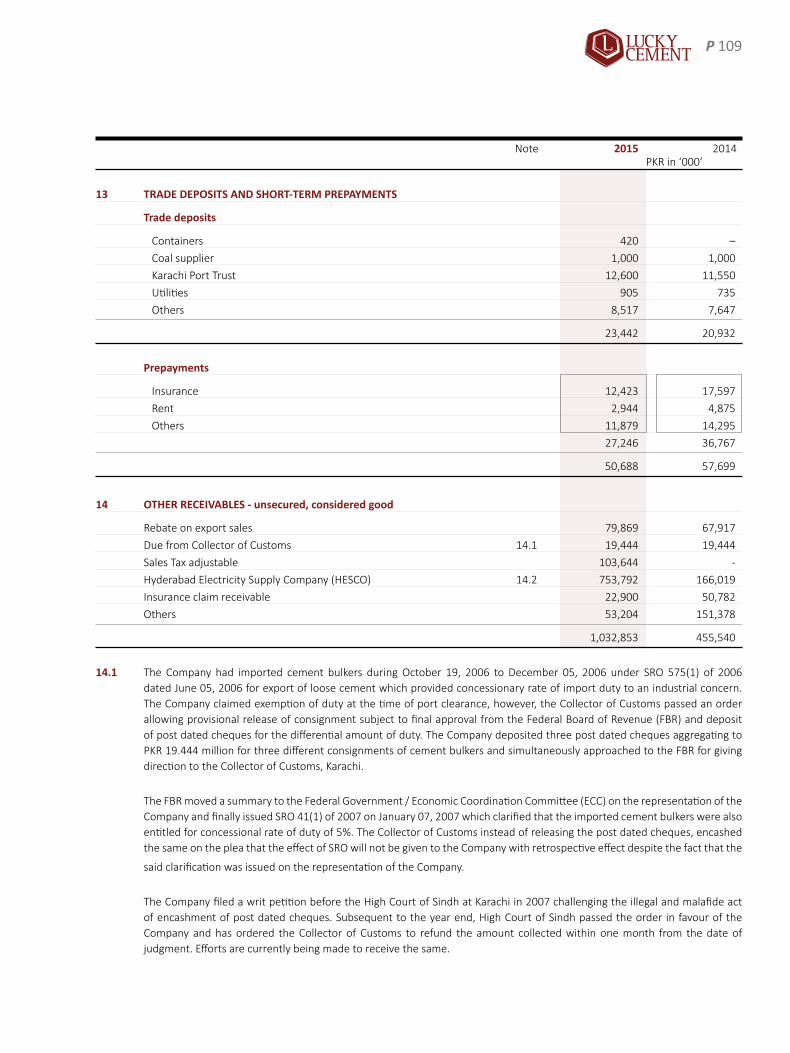
Note 2015 2014 PKR in ‘000’
13 TRADEDEPOSITSANDSHORT-TERMPREPAYMENTS
Tradedeposits
Containers 420 –
Coal supplier 1,000 1,000
Karachi Port Trust 12,600 11,550
Utilities 905 735
Others 8,517 7,647
23,442 20,932
Prepayments
Insurance 12,423 17,597
Rent 2,944 4,875
Others 11,879 14,295
27,246 36,767
50,688 57,699
14 OTHERRECEIVABLES-unsecured,consideredgood
Rebate on export sales 79,869 67,917
Due from Collector of Customs 14.1 19,444 19,444
Sales Tax adjustable 103,644 -
Hyderabad Electricity Supply Company (HESCO) 14.2 753,792 166,019
Insurance claim receivable 22,900 50,782
Others 53,204 151,378
1,032,853 455,540
14.1 The Company had imported cement bulkers during October 19, 2006 to December 05, 2006 under SRO 575(1) of 2006
dated June 05, 2006 for export of loose cement which provided concessionary rate of import duty to an industrial concern. The Company claimed exemption of duty at the time of port clearance, however, the Collector of Customs passed an order allowing provisional release of consignment subject to final approval from the Federal Board of Revenue (FBR) and deposit of post dated cheques for the differential amount of duty. The Company deposited three post dated cheques aggregating to PKR 19.444 million for three different consignments of cement bulkers and simultaneously approached to the FBR for giving direction to the Collector of Customs, Karachi.
The FBR moved a summary to the Federal Government / Economic Coordination Committee (ECC) on the representation of the
Company and finally issued SRO 41(1) of 2007 on January 07, 2007 which clarified that the imported cement bulkers were also entitled for concessional rate of duty of 5%. The Collector of Customs instead of releasing the post dated cheques, encashed the same on the plea that the effect of SRO will not be given to the Company with retrospective effect despite the fact that the
said clarification was issued on the representation of the Company.
The Company filed a writ petition before the High Court of Sindh at Karachi in 2007 challenging the illegal and malafide act
of encashment of post dated cheques. Subsequent to the year end, High Court of Sindh passed the order in favour of the Company and has ordered the Collector of Customs to refund the amount collected within one month from the date of judgment. Efforts are currently being made to receive the same.
P 109

14.2 The balance represents receivable from HESCO which is overdue but not impaired and pertains to electricity supplied for the period from February to June 2015. The Company has filed a writ petition in Sindh High Court against HESCO for non- payment of its overdues.
15 TAXREFUNDSDUEFROMTHEGOVERNMENT
A dispute with respect to the calculation of excise duty on retail price of cement arose between the Company and the Federal Board of Revenue (FBR) from the very first day the Company started sale of cement in 1996. The FBR’s point of view was that excise duty be calculated on the declared retail price, inclusive of excise duty whereas the Company contended that the excise duty would not be included in retail price for the calculation of the excise duty payable to the Government. On June 2, 1997, the Company filed a writ petition before the Peshawar High Court seeking judgment on this matter. The dispute related to the period from June 26, 1996 to April 19, 1999 after which the FBR changed the mechanism of levying excise duty from percentage of retail price to a fixed amount of duty at the rate of PKR 1,400 per ton. The Peshawar High Court after hearing both the parties issued a detailed judgment, operating paragraph of which is reproduced as follows:
“For the reasons we accept the petitions declare, that present system of realization of duties of excise on the “Retail
Price” inclusive of excise duty is illegal and without lawful authority, the duties of excise on cement must not form part of retail price and the petitioners are not liable to pay duties of excise forming part of the retail price of cement.”
Simultaneously, a similar nature of dispute arose between various beverage companies operating in the provinces of Sindh and Punjab and accordingly they also filed petitions before the Honourable High Courts of Sindh and Lahore respectively. Both the Courts also decided the case against the method of calculation of excise duty as interpreted by the FBR.
The FBR preferred an appeal before the Honourable Supreme Court of Pakistan against the judgments of all three High Courts
of the country. A full bench of the Honourable Supreme Court of Pakistan heard the legal counsel of all the parties and finally announced the judgment on April 14, 2007, upholding the judgments of the High Courts and dismissed the appeal of the FBR.
As a result of the full bench judgment of the Honourable Supreme Court of Pakistan, the Company filed a refund claim of PKR
538.812 million on May 08, 2007 with the Collector of Central Excise and Sales Tax, Peshawar, who had earlier collected the same due to incorrect interpretation of law. The Company on the basis of legal opinions obtained, recognised this refund claim in the financial statements for the year ended June 30, 2007.
A review petition was also filed by the Federal Board of Revenue (FBR) in the Honourable Supreme Court of Pakistan. The
Honourable Supreme Court of Pakistan vide its order dated January 27, 2009 dismissed the review petition filed by the FBR and upheld its earlier decision which was in favour of the Company.
While verifying the refund claim, the Collector of Excise and Sales Tax Peshawar issued show cause notice to the Company,
raising certain objections against the release of said refund including an objection that the burden of this levy has been passed on to the end consumer. The Company challenged this show cause notice in the Honourable Peshawar High Court and took the stance that this matter has already been dealt with at the Honourable Supreme Court of Pakistan level, based on the doctrine of res judicata. The Honourable Peshawar High Court granted a stay order to the Company against any adverse proceeding by the FBR in this case.
During the year ended June 30, 2013, the Company filed a complaint before the Federal Tax Ombudsman (FTO) with a request
that the FBR may be directed for early issuance of refund along-with the compensation for the delayed refund. The FTO directed the FBR to verify the claim of the Company and submit a report in the matter. Subsequently, the FBR on the basis of audit conducted submitted a report to the FTO. However, the Company did not agree to the findings of the department and argued before the FTO that the report submitted by the department is not based on the facts of the case.
After hearing the arguments of both the parties, the FTO forwarded its recommendations/findings to the Secretary, Revenue
Division, Islamabad through its order dated November 22, 2013. FBR filed representation, before the President of Pakistan against the recommendations of the FTO under section 32 of Federal
Tax Ombudsman Ordinance, 2000. However, President of Pakistan through its order has endorsed the recommendations of FTO. Subsequent to the year end, FBR filed a writ petition before the Peshawar High Court challenging the decision of the FTO.
Notes to the Financial StatementsFor the year ended June 30, 2015
P 110

The Peshawar High Court has suspended the operations of the orders of FTO and President of Pakistan on July 14, 2015 till further orders. The Company is in the process of challenging the stay granted by the Honorable Peshawar High Court through filing a writ petition. Pending a final decision in this matter, tax refunds from the Government have not been adjusted in these financial statements.
Note 2015 2014 PKR in ‘000’
16 CASHANDBANKBALANCES
Sales collection in transit 892,404 627,781
Cash at bank - on current accounts 208,613 248,064
- on deposit accounts 16.1 15,341,868 7,712,309
15,550,481 7,960,373
Cash in hand 1,737 2,643
16,444,622 8,590,797
16.1 These carry profit at the rate ranging from 5% to 10.25% (2014: from 6% to 10.25%) per annum.
2015 2014 PKR in ‘000’
17 SHARECAPITAL
Authorizedcapital
500,000,000 (2014: 500,000,000)
Ordinary shares of PKR 10/- each 5,000,000 5,000,000
Issued,subscribedandpaid-upcapital
305,000,000 (2014: 305,000,000) Ordinary
shares of PKR 10/- each issued for cash 3,050,000 3,050,000
18,375,000 (2014: 18,375,000) Ordinary
shares of PKR 10/- each issued as bonus shares 183,750 183,750
3,233,750 3,233,750
17.1 During the year ended June 30, 2008, the Company was admitted to the official list of the Financial Services Authority and to
the London Stock Exchange for trading of the Global Depository Receipts (GDRs) issued by the Company on the Professional
Securities Market of the London Stock Exchange. The GDR issue constituted an offering to qualified institutional buyers in the
United States under Rule 144A and to non US persons outside the United States (US) under Regulation - S of the US Securities
Act of 1933. The GDRs have also been included for trading on the International Order Book system of the London Stock
Exchange, which will make the GDRs issued under Rule 144A to become eligible for trading by qualified institutional buyers
in the Portal Market; a subsidiary of the NASDAQ Stock Market, Inc in the United States. The Company had issued 15,000,000
GDRs each representing four ordinary equity shares at an offer price of US$ 7.2838 per GDR (total receipt being US$. 109.257
million). Accordingly, based on an exchange rate of PKR 65.90 = US$ 1.00 (which was the exchange rate on the date of final
offering circular relating to the GDR issue made by the Company) 60,000,000 ordinary equity shares of a nominal value of PKR
10 each of the Company were issued at a premium of PKR 110 per ordinary equity share (total premium amount being PKR
6,600 million).
P 111

The holders of GDRs are entitled, subject to the provisions of the Deposit Agreement, to receive dividend, if any and rank
pari passu with other equity shareholders in respect of dividend. However, the holders of GDRs have no voting rights or other
direct rights of shareholders with respect to the equity shares underlying such GDRs. Subject to the terms and restrictions set
out in the offering circular dated May 08, 2008, the deposited equity shares in respect of which the GDRs were issued may be
withdrawn from the depository facility. Upon withdrawal, the holders will rank pari passu with other equity shareholders in
respect of dividend, voting and other direct rights of shareholders.
Note 2015 2014 PKR in ‘000’
18 RESERVES
Capitalreserve Share premium 7,343,422 7,343,422
Revenuereserves
General reserve 36,304,636 27,871,271
Unappropriated profit 12,376,962 11,343,740
48,681,598 39,215,011
56,025,020 46,558,433
19 LONG-TERMDEPOSITS Cement stockists 19.1 27,966 29,691
Transporters 19.2 40,000 37,000
Others 1,280 1,280
69,246 67,971
19.1 These represent interest-free security deposits received from stockists and are repayable on cancellation or withdrawal of
stockist arrangement and are also adjustable against unpaid amount of sales.
19.2 These represent interest-free security deposits received from transporters and are repayable on cancellation or withdrawal of
contracts.
Note 2015 2014 PKR in ‘000’
20 DEFERREDLIABILITIES
Staff gratuity 20.1 1,006,711 654,195
Deferred tax liability 20.2 5,320,435 4,799,317
6,327,146 5,453,512
20.1 The amounts recognized in the balance sheet, based on the recent actuarial valuation carried on June 30, 2015, are as
follows:
Notes to the Financial StatementsFor the year ended June 30, 2015
P 112

Note 2015 2014 PKR in ‘000’
20.1.1 Present value of defined benefit obligation 1,006,711 654,195
20.1.2 Changes in the present value of defined benefit obligation are as follows:
Balance as at July 01 654,195 552,042
Charge for the year 20.1.3 326,918 146,594
Actuarial loss recognised in other comprehensive income 71,594 912
1,052,707 699,548
Payments made during the year (45,996) (45,353)
1,006,711 654,195
20.1.3 Charge for the year recognised in the profit and loss account is as follows:
Current service cost 95,416 85,776 Interest cost 91,857 60,818 Past service cost 139,645 -
326,918 146,594
20.1.4 The charge for the year has been allocated as follows:
Cost of sales 24 235,247 112,119 Distribution costs 25 5,179 6,013 Administrative expenses 26 86,492 28,462
326,918 146,594
2015 2014 20.1.5 Principal actuarial assumptions used are as follows:
Expected rate of increase in salary level 12.00% 11.00% Valuation discount rate 10.50% 13.50% 20.1.6 Sensitivityanalysis
A sensitivity analysis for the above principal actuarial assumptions as of the balance sheet date showing how the defined benefit obligation would have been affected by changes in the said assumptions is as follows:
2015 PKR in ‘000’
Discount rate +1% (97,018)
Discount rate -1% 114,907
Long term salary increases +1% 117,998
Long term salary increases -1% (101,204)
P 113

2015 PKR in ‘000’
20.1.7 Maturity profile of the defined benefit obligation:
Weighted average duration - in number of years 6.93
The retirement will at most continue - year 2029
20.1.8 DescriptionoftheriskstotheCompany
The defined benefit plan exposes the Company to the following risks: Mortality risks - The risk that the actual mortality experience is different. The effect depends on the beneficiaries’ service/age
distribution and the benefit. Final salary risks - The risk that the final salary at the time of cessation of service is greater than what was assumed. Since the
benefit is calculated on the final salary, the benefit amount increases similarly. Withdrawal risks – The risk of higher or lower withdrawal experience than assumed. The final effect could go either way
depending on the beneficiaries’ service/age distribution and the benefit. Note 2015 2014 PKR in ‘000’
20.2 Deferredtaxliability
This comprises of the following: - Difference in tax and accounting bases of fixed assets 5,652,783 5,079,314 - Provisions (332,348) (279,997)
5,320,435 4,799,317
21 TRADEANDOTHERPAYABLES
Creditors 667,479 759,118 Bills payable 395,104 – Accrued liabilities 21.1 3,122,755 2,282,542 Customers running account 700,392 394,174 Retention money 28,750 21,339 Sales tax payable – 67,152 Excise and other government levies 354,927 256,489 Unclaimed and unpaid dividend 98,421 79,392 Workers’ Profit Participation Fund (WPPF) payable 21.2 719,553 297,660 Workers’ Welfare Fund (WWF) payable 293,719 – Others 1,272 10,104
6,382,372 4,167,970
21.1 It includes PKR 332.766 million in respect of accrual of gas charges (2014: PKR 380.608 million).
Notes to the Financial StatementsFor the year ended June 30, 2015
P 114
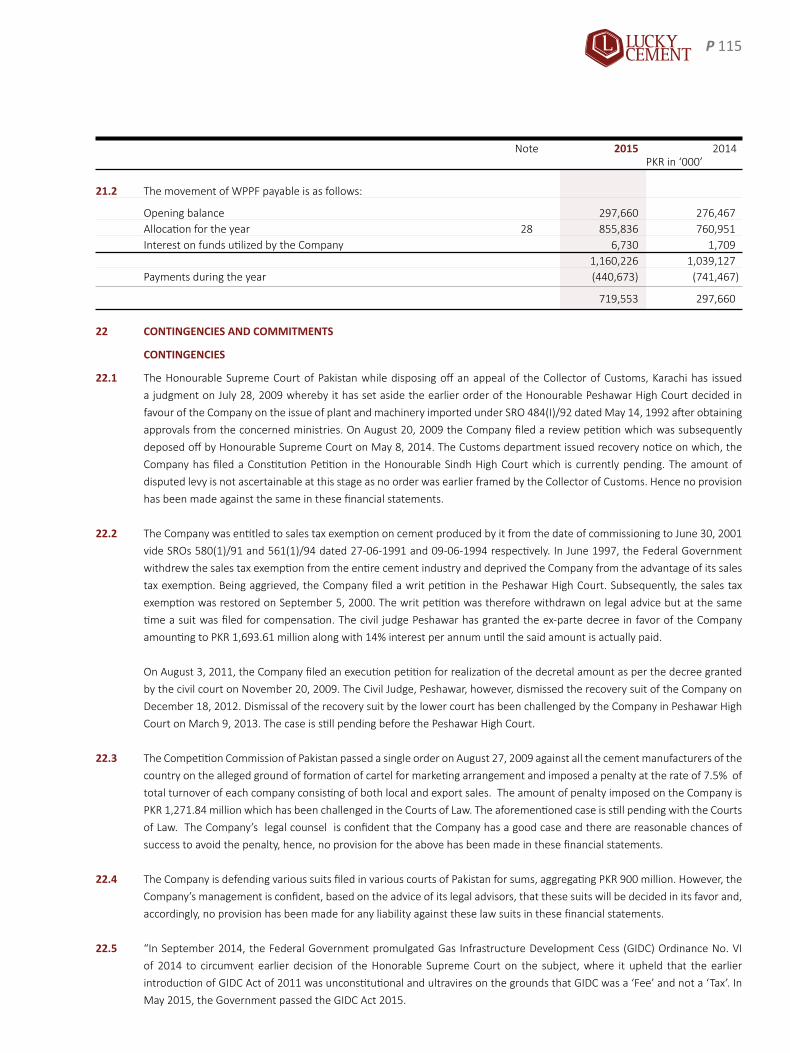
Note 2015 2014 PKR in ‘000’
21.2 The movement of WPPF payable is as follows:
Opening balance 297,660 276,467 Allocation for the year 28 855,836 760,951 Interest on funds utilized by the Company 6,730 1,709 1,160,226 1,039,127 Payments during the year (440,673) (741,467)
719,553 297,660
22 CONTINGENCIESANDCOMMITMENTS
CONTINGENCIES
22.1 The Honourable Supreme Court of Pakistan while disposing off an appeal of the Collector of Customs, Karachi has issued
a judgment on July 28, 2009 whereby it has set aside the earlier order of the Honourable Peshawar High Court decided in
favour of the Company on the issue of plant and machinery imported under SRO 484(I)/92 dated May 14, 1992 after obtaining
approvals from the concerned ministries. On August 20, 2009 the Company filed a review petition which was subsequently
deposed off by Honourable Supreme Court on May 8, 2014. The Customs department issued recovery notice on which, the
Company has filed a Constitution Petition in the Honourable Sindh High Court which is currently pending. The amount of
disputed levy is not ascertainable at this stage as no order was earlier framed by the Collector of Customs. Hence no provision
has been made against the same in these financial statements.
22.2 The Company was entitled to sales tax exemption on cement produced by it from the date of commissioning to June 30, 2001
vide SROs 580(1)/91 and 561(1)/94 dated 27-06-1991 and 09-06-1994 respectively. In June 1997, the Federal Government
withdrew the sales tax exemption from the entire cement industry and deprived the Company from the advantage of its sales
tax exemption. Being aggrieved, the Company filed a writ petition in the Peshawar High Court. Subsequently, the sales tax
exemption was restored on September 5, 2000. The writ petition was therefore withdrawn on legal advice but at the same
time a suit was filed for compensation. The civil judge Peshawar has granted the ex-parte decree in favor of the Company
amounting to PKR 1,693.61 million along with 14% interest per annum until the said amount is actually paid.
On August 3, 2011, the Company filed an execution petition for realization of the decretal amount as per the decree granted
by the civil court on November 20, 2009. The Civil Judge, Peshawar, however, dismissed the recovery suit of the Company on
December 18, 2012. Dismissal of the recovery suit by the lower court has been challenged by the Company in Peshawar High
Court on March 9, 2013. The case is still pending before the Peshawar High Court.
22.3 The Competition Commission of Pakistan passed a single order on August 27, 2009 against all the cement manufacturers of the
country on the alleged ground of formation of cartel for marketing arrangement and imposed a penalty at the rate of 7.5% of
total turnover of each company consisting of both local and export sales. The amount of penalty imposed on the Company is
PKR 1,271.84 million which has been challenged in the Courts of Law. The aforementioned case is still pending with the Courts
of Law. The Company’s legal counsel is confident that the Company has a good case and there are reasonable chances of
success to avoid the penalty, hence, no provision for the above has been made in these financial statements.
22.4 The Company is defending various suits filed in various courts of Pakistan for sums, aggregating PKR 900 million. However, the
Company’s management is confident, based on the advice of its legal advisors, that these suits will be decided in its favor and,
accordingly, no provision has been made for any liability against these law suits in these financial statements.
22.5 “In September 2014, the Federal Government promulgated Gas Infrastructure Development Cess (GIDC) Ordinance No. VI
of 2014 to circumvent earlier decision of the Honorable Supreme Court on the subject, where it upheld that the earlier
introduction of GIDC Act of 2011 was unconstitutional and ultravires on the grounds that GIDC was a ‘Fee’ and not a ‘Tax’. In
May 2015, the Government passed the GIDC Act 2015.
P 115

The Company has challenged GIDC Act, 2015 and filed writ petition in the Peshawar High Court (PHC) and Sindh High Court
(SHC) including retrospective treatment of the provision of the GIDC Act. The Court has granted stay against charging of the GIDC Act, 2015. The Company has not recorded GIDC amounting to PKR 760.3 million in these financial statements as it is confident that the decision of the case will be in its favor.
22.6 Also refer to notes 14.1, 14.2 and 15 to these financial statements.
2015 2014 PKR in ‘000’
COMMITMENTS
22.7 Capitalcommitments
Plant and machinery under letters of credit 50,583 1,667,530
22.8 Othercommitments
Stores, spares and packing material under letters of credit 2,162,633 1,870,971
Stand by Letter of Credit issued by the Company 500,000 –
Bank guarantees issued on behalf of the Company 1,073,288 942,233
Post dated cheques 450,436 555,150 23 GROSSSALES
Local 39,940,189 36,178,158 Export 13,979,121 15,234,768
53,919,310 51,412,926
Notes to the Financial StatementsFor the year ended June 30, 2015
P 116

Note 2015 2014 PKR in ‘000’
24 COSTOFSALES
Salaries, wages and benefits 24.1 1,751,070 1,448,779 Raw material consumed 1,310,576 1,166,151 Packing material 24.2 3,076,061 2,875,786 Fuel and power 13,598,105 14,830,391 Stores and spares consumed 2,097,793 1,913,893 Repairs and maintenance 164,210 152,330 Depreciation / amortization 5.2 1,929,062 1,750,528 Insurance 81,628 68,652 Provision for slow moving spares 9.3 25,000 10,000 Provision for slow moving packing material 10 30,000 – Earth moving machinery 224,473 213,034 Vehicle running and maintenance 53,966 53,818 Communication 13,953 13,345 Mess subsidy 47,507 39,514 Transportation 24,652 17,029 Travelling and conveyance 5,730 7,787 Inspection fee for electrical installation 1,279 1,279 Rent, rates and taxes 3,345 4,824 Printing and stationery 1,523 3,356 Other manufacturing expenses 107,874 99,349
24,547,807 24,669,845 Work-in-process: Opening 628,533 373,356 Closing (614,096) (628,533)
14,437 (255,177)
Costofgoodsmanufactured 24,562,244 24,414,668 Finished goods: Opening 455,858 434,254 Closing (439,883) (455,858)
15,975 (21,604)
24,578,219 24,393,064
24.1 These include sum of PKR 235.247 million (2014: PKR 112.119 million) in respect of staff retirement benefits.
24.2 These are net of duty draw back on export sales amounting to PKR 65.264 million (2014: PKR 67.531 million).
P 117
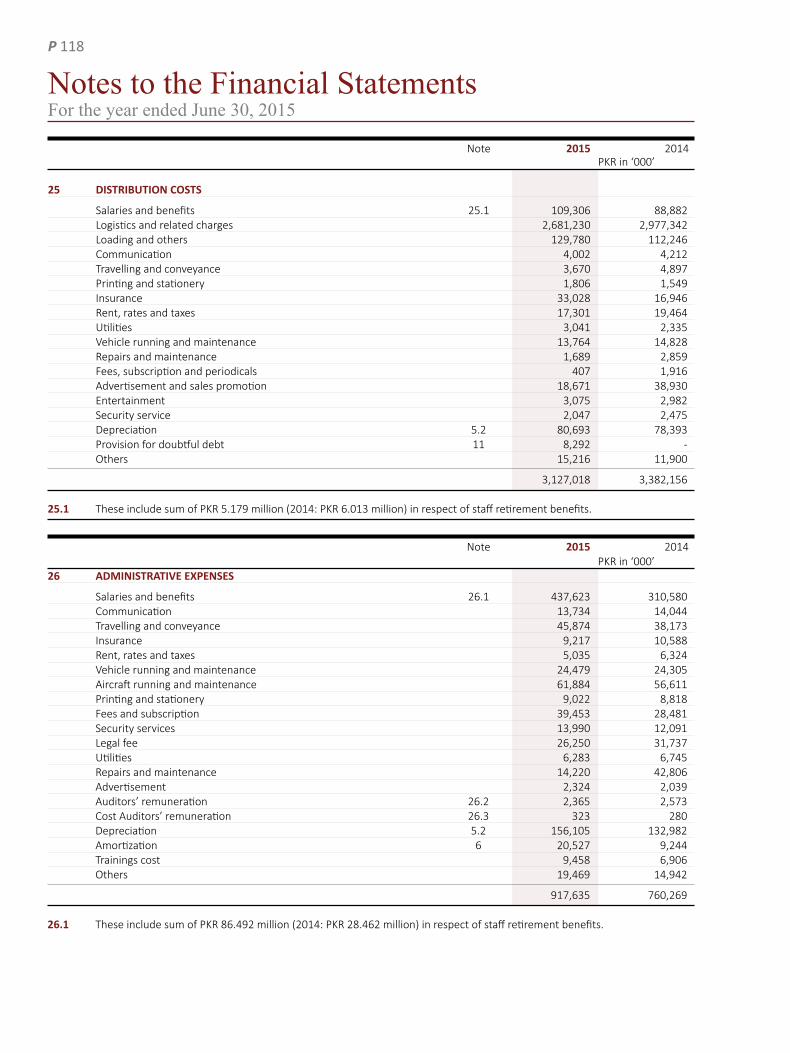
Note 2015 2014 PKR in ‘000’
25 DISTRIBUTIONCOSTS
Salaries and benefits 25.1 109,306 88,882 Logistics and related charges 2,681,230 2,977,342 Loading and others 129,780 112,246 Communication 4,002 4,212 Travelling and conveyance 3,670 4,897 Printing and stationery 1,806 1,549 Insurance 33,028 16,946 Rent, rates and taxes 17,301 19,464 Utilities 3,041 2,335 Vehicle running and maintenance 13,764 14,828 Repairs and maintenance 1,689 2,859 Fees, subscription and periodicals 407 1,916 Advertisement and sales promotion 18,671 38,930 Entertainment 3,075 2,982 Security service 2,047 2,475 Depreciation 5.2 80,693 78,393 Provision for doubtful debt 11 8,292 - Others 15,216 11,900
3,127,018 3,382,156 25.1 These include sum of PKR 5.179 million (2014: PKR 6.013 million) in respect of staff retirement benefits.
Note 2015 2014 PKR in ‘000’26 ADMINISTRATIVEEXPENSES
Salaries and benefits 26.1 437,623 310,580 Communication 13,734 14,044 Travelling and conveyance 45,874 38,173 Insurance 9,217 10,588 Rent, rates and taxes 5,035 6,324 Vehicle running and maintenance 24,479 24,305 Aircraft running and maintenance 61,884 56,611 Printing and stationery 9,022 8,818 Fees and subscription 39,453 28,481 Security services 13,990 12,091 Legal fee 26,250 31,737 Utilities 6,283 6,745 Repairs and maintenance 14,220 42,806 Advertisement 2,324 2,039 Auditors’ remuneration 26.2 2,365 2,573 Cost Auditors’ remuneration 26.3 323 280 Depreciation 5.2 156,105 132,982 Amortization 6 20,527 9,244 Trainings cost 9,458 6,906 Others 19,469 14,942
917,635 760,269 26.1 These include sum of PKR 86.492 million (2014: PKR 28.462 million) in respect of staff retirement benefits.
Notes to the Financial StatementsFor the year ended June 30, 2015
P 118
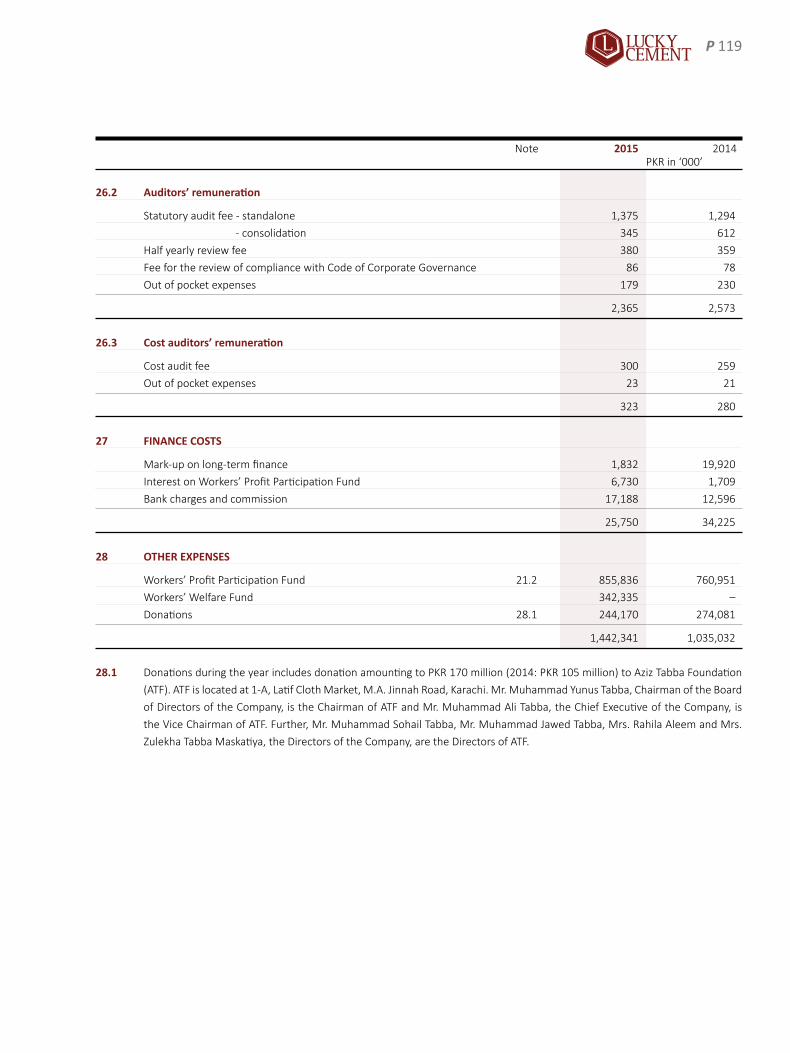
Note 2015 2014 PKR in ‘000’
26.2 Auditors’remuneration
Statutory audit fee - standalone 1,375 1,294
- consolidation 345 612
Half yearly review fee 380 359
Fee for the review of compliance with Code of Corporate Governance 86 78
Out of pocket expenses 179 230
2,365 2,573
26.3 Costauditors’remuneration
Cost audit fee 300 259
Out of pocket expenses 23 21
323 280
27 FINANCECOSTS
Mark-up on long-term finance 1,832 19,920
Interest on Workers’ Profit Participation Fund 6,730 1,709
Bank charges and commission 17,188 12,596
25,750 34,225
28 OTHEREXPENSES
Workers’ Profit Participation Fund 21.2 855,836 760,951
Workers’ Welfare Fund 342,335 –
Donations 28.1 244,170 274,081
1,442,341 1,035,032
28.1 Donations during the year includes donation amounting to PKR 170 million (2014: PKR 105 million) to Aziz Tabba Foundation
(ATF). ATF is located at 1-A, Latif Cloth Market, M.A. Jinnah Road, Karachi. Mr. Muhammad Yunus Tabba, Chairman of the Board
of Directors of the Company, is the Chairman of ATF and Mr. Muhammad Ali Tabba, the Chief Executive of the Company, is
the Vice Chairman of ATF. Further, Mr. Muhammad Sohail Tabba, Mr. Muhammad Jawed Tabba, Mrs. Rahila Aleem and Mrs.
Zulekha Tabba Maskatiya, the Directors of the Company, are the Directors of ATF.
P 119

Note 2015 2014 PKR in ‘000’
29 OTHERINCOME
Incomefromnon-financialassets Gain on disposal of property, plant and equipment 5.3 22,831 22,811
Sale of electricity 1,910,280 1,682,520 Cost of sale of electricity (1,738,305) (1,501,218)
171,975 181,302 Exchange gain / (loss) - net 78,347 32,339 Others 15,147 27,312 288,300 263,764 Incomefromfinancialassets Mutual Fund Dividend income – 10,072 Capital gain / (loss) on sale of investments 32,319 (991)
32,319 9,081 Interest income on deposit accounts 920,831 705,097
1,241,450 977,942
30 TAXATION
30.1 Relationship between income tax expense and accounting profit.
2015 2014 PKR in ‘000’ Profit before taxation 15,911,794 14,456,365
Tax at the applicable tax rate of 33% (2014: 34%) 5,250,892 4,915,164 Tax effect under lower rate of tax (1,361,346) (1,337,459) Others (409,350) (465,743)
Total 3,480,196 3,111,962
Effective tax rate 22% 22% 30.2 The tax assessments of the Company have been finalized upto and including the tax year 2014. 31 EARNINGSPERSHARE-basicanddiluted
There is no dilutive effect on the basic earnings per share of the Company, which is based on:
2015 2014 Profit after taxation (PKR in thousands) 12,431,598 11,344,403 Weighted average number of ordinary shares (in thousands) 323,375 323,375 Basic and diluted earnings per share - (PKR) 38.44 35.08
Notes to the Financial StatementsFor the year ended June 30, 2015
P 120

33 REMUNERATIONOFCHIEFEXECUTIVE,DIRECTORSANDEXECUTIVES
33.1 Aggregate amounts charged in these financial statements are as follows :
Chief Executive Director(s) Executives Total
Particulars 2015 2014 2015 2014 2015 2014 2015 2014
PKR in ‘000’ Remuneration 39,000 28,000 933 1,600 382,678 294,911 422,611 324,511 House rent allowance 15,600 11,200 373 640 172,251 132,745 188,224 144,585 Utility allowance 3,900 2,800 94 160 38,264 29,488 42,258 32,448 Conveyance allowance - - - - 38,264 29,488 38,264 29,488 Charge for defined benefit obligation 18,500 3,500 - 200 89,983 34,599 108,483 38,299
77,000 45,500 1,400 2,600 721,440 521,231 799,840 569,331
Number of persons 1 1 1 1 293 219 295 221
Note 2015 2014 PKR in ‘000’
32 CASHGENERATEDFROMOPERATIONS
Profit before taxation 15,911,794 14,456,365 Adjustments for non cash charges and other items Depreciation / amortization 5.2 2,269,237 2,064,059 Amortization on intangible assets 6 20,527 9,244 Provision for slow moving spares 9.3 25,000 10,000 Provision for slow moving packing material 10 30,000 – Provision for doubtful debts 11 8,292 – Gain on disposal of property, plant and equipment 5.3 (22,831) (22,811) Provision for staff gratuity 20.1.3 326,918 146,594 Finance costs 27 25,750 34,225
Profit before working capital changes 18,594,687 16,697,676 (Increase)/decreaseincurrentassets Stores and spares 1,058,492 (909,860) Stock-in-trade 28,239 (207,827) Trade debts 27,223 (409,415) Loans and advances (91,725) 91,641 Trade deposits and short-term prepayments 7,011 (15,885) Accrued mark-up (7,745) (57,915) Other receivables (577,313) 223,054
444,182 (1,286,207) Increaseincurrentliabilities Trade and other payables 2,195,373 575,795
21,234,242 15,987,264 32.1 CASHFLOWSFROMOPERATINGACTIVITIES(Directmethod)
Collections from customers 53,275,775 50,460,689 Receipts from other income 572,953 1,057,287 Payments to suppliers and service providers (21,827,967) (25,870,609) Payments to employees (2,297,999) (1,668,362) Payments relating to income taxes (2,151,235) (2,347,076) Payments relating to post retirement benefits - net (45,996) (45,353) Payments relating to indirect taxes (8,487,245) (7,980,895) Payment of finance costs (28,801) (39,336)
Net cash generated from operating activities 19,009,485 13,566,345
P 121

33.2 In addition to the above, Chief Executive, Director and some Executives are provided with Company maintained cars and other benefits as per Company policy.
33.3 An amount of PKR 550,000/- was paid to 6 non executive directors and PKR 220,000/- was paid to 2 executive directors
during the year as fee for attending board meetings (2014: 6 non executive directors were paid PKR 200,000/- and 2 executive directors were paid PKR 80,000/-).
34 TRANSACTIONSWITHRELATEDPARTIES
34.1 Related parties comprise subsidiaries, associated entities, entities with common directorship, directors and key management personnel. Details of transactions with related parties during the year, other than those which have been disclosed elsewhere in these financial statements, are as follows:
2015 2014 PKR in ‘000’
Subsidiaries LuckyHoldingsLimited Loss claimed during the period 300,101 – Cash given against loss claimed 102,034 – LCLHoldingsLimited Investment made during the year 521,155 – LCLInvestmentHoldingsLimited Investment made during the year 2,042,700 2,537,800 ICIPakistanLimited Sales 38,336 13,227 Purchases 1,533 –
Directors Purchase of Land & Building 599,379 – Sales 2,561 –
AssociatedCompanies YunusEnergyLimited Investment made during the year 203,615 750 LuckyParagonReadyMixLimited Sales 386,879 250,665 FazalTextileMillsLimited Sales 4,623 12,331 YunusTextileMillsLimited Sales 18,142 60,336 LuckyTextileMills Sales 92,743 29,854 GadoonTextileMillsLimited Sales 3,171 22,692 AzizTabbaFoundation Sales 2,522 1,995 Donation 170,000 105,000 LuckyOne(Pvt)Limited Sales 123,315 172,855 LuckyCommodities Sales – 229,494 LuckyKnits(Pvt)Limited Sales 24,472 – Feroze1888MillsLimited Sales 21,490 – InternationalSteelsLimited Sales 17,218 – LuckyAir(Pvt)Limited Services 22,587 20,882
34.2 There are no transactions with key management personnel other than under the terms of employment.
Notes to the Financial StatementsFor the year ended June 30, 2015
P 122
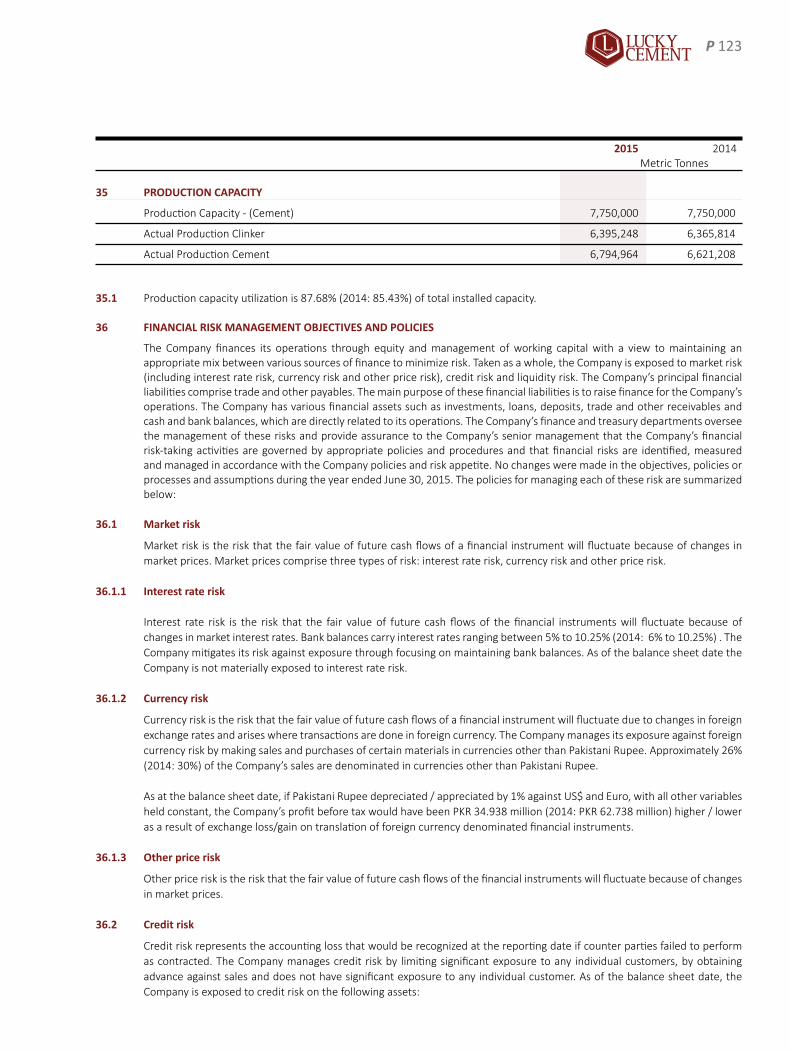
2015 2014 Metric Tonnes
35 PRODUCTIONCAPACITY
Production Capacity - (Cement) 7,750,000 7,750,000
Actual Production Clinker 6,395,248 6,365,814
Actual Production Cement 6,794,964 6,621,208 35.1 Production capacity utilization is 87.68% (2014: 85.43%) of total installed capacity. 36 FINANCIALRISKMANAGEMENTOBJECTIVESANDPOLICIES
The Company finances its operations through equity and management of working capital with a view to maintaining an appropriate mix between various sources of finance to minimize risk. Taken as a whole, the Company is exposed to market risk (including interest rate risk, currency risk and other price risk), credit risk and liquidity risk. The Company’s principal financial liabilities comprise trade and other payables. The main purpose of these financial liabilities is to raise finance for the Company’s operations. The Company has various financial assets such as investments, loans, deposits, trade and other receivables and cash and bank balances, which are directly related to its operations. The Company’s finance and treasury departments oversee the management of these risks and provide assurance to the Company’s senior management that the Company’s financial risk-taking activities are governed by appropriate policies and procedures and that financial risks are identified, measured and managed in accordance with the Company policies and risk appetite. No changes were made in the objectives, policies or processes and assumptions during the year ended June 30, 2015. The policies for managing each of these risk are summarized below:
36.1 Marketrisk
Market risk is the risk that the fair value of future cash flows of a financial instrument will fluctuate because of changes in market prices. Market prices comprise three types of risk: interest rate risk, currency risk and other price risk.
36.1.1 Interestraterisk Interest rate risk is the risk that the fair value of future cash flows of the financial instruments will fluctuate because of
changes in market interest rates. Bank balances carry interest rates ranging between 5% to 10.25% (2014: 6% to 10.25%) . The Company mitigates its risk against exposure through focusing on maintaining bank balances. As of the balance sheet date the Company is not materially exposed to interest rate risk.
36.1.2 Currencyrisk
Currency risk is the risk that the fair value of future cash flows of a financial instrument will fluctuate due to changes in foreign exchange rates and arises where transactions are done in foreign currency. The Company manages its exposure against foreign currency risk by making sales and purchases of certain materials in currencies other than Pakistani Rupee. Approximately 26% (2014: 30%) of the Company’s sales are denominated in currencies other than Pakistani Rupee.
As at the balance sheet date, if Pakistani Rupee depreciated / appreciated by 1% against US$ and Euro, with all other variables
held constant, the Company’s profit before tax would have been PKR 34.938 million (2014: PKR 62.738 million) higher / lower as a result of exchange loss/gain on translation of foreign currency denominated financial instruments.
36.1.3 Otherpricerisk
Other price risk is the risk that the fair value of future cash flows of the financial instruments will fluctuate because of changes in market prices.
36.2 Creditrisk
Credit risk represents the accounting loss that would be recognized at the reporting date if counter parties failed to perform as contracted. The Company manages credit risk by limiting significant exposure to any individual customers, by obtaining advance against sales and does not have significant exposure to any individual customer. As of the balance sheet date, the Company is exposed to credit risk on the following assets:
P 123

Note 2015 2014 PKR in ‘000’
Long-term deposits 3,175 3,175 Trade debts 11 2,042,199 2,077,714 Loans and advances 12 38,505 38,012 Trade deposits 13 23,442 20,932 Accrued mark-up 79,257 71,512 Other receivables 14 829,896 418,961 Bank balances 16 16,442,885 8,516,439
19,459,359 11,146,745
Creditqualityoffinancialassets
The credit quality of financial assets that are neither past due nor impaired can be assessed by reference to external credit rating agencies or the historical information about counter party default rates as shown below:
2015 2014 PKR in ‘000’
Tradedebts Neither past due nor impaired 2,042,199 2,077,714 Bankbalances A1+ 16,442,725 8,437,211 A1 160 150,943
16,442,885 8,588,154 Financial assets other than trade debts and bank balances are not exposed to any material credit risk.
36.3 Liquidityrisk
Liquidity risk reflects the Company’s inability in raising funds to meet commitments. Management closely monitors the Company’s liquidity and cash flow position. This includes maintenance of balance sheet liquidity ratios, debtors and creditors concentration both in terms of the overall funding mix and avoidance of undue reliance on large individual customer. As of the balance sheet date, the Company has unavailed credit facilities aggregating to PKR 16,825 million (2014: PKR 16,825 million).
The table below summarizes the maturity profile of the Company’s financial liabilities based on contractual undiscounted
payments.
On Less than 3 to 12 1 to 5 Total
demand 3 months months years
PKR in ‘000’
June30,2015 Long–term deposit – – – 69,246 69,246 Trade and other payables 1,471,367 3,510,260 1,395,878 – 6,377,505
1,471,367 3,510,260 1,395,878 69,246 6,446,751 June 30, 2014 Long–term finance – 104,203 23,295 – 127,498 Long–term deposit – – – 67,971 67,971 Trade and other payables 714,840 2,214,812 222,843 – 3,152,495 Accrued mark–up – 3,051 – – 3,051 714,840 2,322,066 246,138 67,971 3,351,015
Notes to the Financial StatementsFor the year ended June 30, 2015
P 124
36.4 Fairvaluesoffinancialassetsandliabilities
Fair value is the amount for which an asset could be exchanged, or a liability can be settled, between knowledgeable willing
parties in an arm’s length transaction. As of the balance sheet date, the carrying value of all financial assets and liabilities
reflected in the financial statements approximate to their fair values.
36.5 Capitalriskmanagement
The primary objective of the Company’s capital management is to maintain healthy capital ratios, strong credit rating and
optimal capital structures in order to ensure ample availability of finance for its existing and potential investment projects, to
maximise shareholder value and reduce the cost of capital.
The Company manages its capital structure and makes adjustment to it, in light of changes in economic conditions. In order to
maintain or adjust the capital structure, the Company may adjust the amount of dividends paid to shareholders, return capital
to shareholders or issue new shares. No changes were made in the objectives, policies and processes during the year ended
June 30, 2015.
The Company monitors capital using a gearing ratio, which is net debt divided by total capital plus net debt. The Company
includes within net debt, interest bearing loans and borrowings including any finance cost thereon less cash and bank balances.
Capital signifies equity as shown in the balance sheet plus net debt.
During the year, the Company’s strategy was to minimize leveraged gearing. The Company finances its expansion projects
through equity, borrowings and management of its working capital with a view to maintaining an appropriate mix between
various sources of finance to minimise risk. As of the balance sheet date the Company has no gearing (gearing ratio – 2014:
Nil).
37 DATEOFAUTHORISATIONFORISSUE
These financial statements were authorised for issue on September 08, 2015 by the Board of Directors of the Company.
38 NUMBEROFEMPLOYEES
The number of persons employed as on the balance sheet date was 2,350 (2014: 2,299) and the average number of employees
during the year was 2,325 (2014: 2,254).
39 GENERAL
39.1 The Board of Directors in their meeting held on September 08, 2015 (i) approved the transfer of PKR 9,521.223 million (2014:
PKR 8,433.365 million) from un-appropriated profit to general reserve; and (ii) proposed final dividend of PKR 9/- per ordinary
share for the year ended June 30, 2015 amounting to PKR 2,910.375 million (2014: PKR 2,910.375 million) for approval of
the members at the Annual General Meeting to be held on October 31, 2015. These financial statements do not reflect this
appropriation and the proposed dividend payable.
P 125

Notes to the Financial StatementsFor the year ended June 30, 2015
39.2 The Finance Act, 2015 introduced a tax on every public company at the rate of 10% of such undistributed reserve which
exceeds the amount of its paid up capital. However, this tax shall not apply in case of a public company which distributes cash
dividend equal to atleast either 40% of its after tax profits or 50% of its paid up capital, within the prescribed time after the
end of the relevant tax year.
Based on the fact that the Board of Directors of the Company has proposed 90% dividend for the financial and tax year 2015
which exceeds the prescribed minimum dividend requirement as aforesaid, the Company believes that it would not eventually
be liable to pay tax on its undistributed reserves as of 30 June 2015.
39.3 For better presentation certain prior year’s figures have been reclassified consequent to certain changes in the current year’s
presentation.
39.4 Figures have been rounded off to the nearest thousand of PKR, unless otherwise stated.
MuhammadYunusTabbaChairman/Director
MuhammadAliTabbaChiefExecutive
P 126

Consolidated Financial Statements
For the year ended June 30, 2015
P 127

P 128

Auditors’ Reporton consolidated financial statements to the members
We have audited the annexed consolidated financial statements comprising consolidated balance sheet of Lucky Cement Limited (the
Holding Company) and its subsidiary companies namely Lucky Holdings Limited (LHL), LCL Investment Holdings Limited (LCLIHL) and
LCL Holdings Limited (LCLHL) as at 30 June 2015 and the related consolidated profit and loss account, consolidated cash flow statement
and consolidated statement of changes in equity together with the notes forming part thereof, for the year then ended. We have also
expressed separate opinion on the financial statements of the Holding Company and its subsidiary companies LHL and LCLHL. The
financial statements of LCLIHL were audited by other firms of auditors whose reports have been furnished to us and our opinion, in
so far as it relates to the amounts included for such subsidiary companies, is based solely on the reports of such other auditors. These
consolidated financial statements are the responsibility of the Holding Company’s management. Our responsibility is to express an
opinion on these consolidated financial statements based on our audit.
Our audit was conducted in accordance with the International Standards on Auditing and accordingly included such tests of accounting
records and such other auditing procedures as we considered necessary in the circumstances.
In our opinion, the consolidated financial statements present fairly the financial position of the Holding Company and its subsidiary
companies as at 30 June 2015 and the results of their operations for the year then ended.
We draw attention to the contents of note 17 to the accompanying consolidated financial statements in respect of tax refunds due from
the Government amounting to PKR 538.812 million. Our opinion is not qualified in respect of this matter.
Chartered AccountantsAudit Engagement Partner: Riaz A. Rehman Chamdia
Date: 08 September 2015
Place: Karachi
P 129

Consolidated Balance Sheetas at June 30, 2015
Note 2015 2014 PKR in ‘000’
ASSETS NON-CURRENT ASSETS Fixed assets Property, plant and equipment 6 49,900,183 44,063,423 Intangible assets 7 7,360,811 7,741,210
57,260,994 51,804,633 Long-term investments 8 10,007,198 1,714,879 Long-term loans and advances 9 405,496 1,711,839 Long-term deposits and prepayments 10 33,952 31,018
67,707,640 55,262,369 CURRENT ASSETS Stores, spares and consumables 11 5,921,887 6,952,502 Stock-in-trade 12 6,524,154 6,246,200 Trade debts 13 3,473,293 2,961,424 Loans and advances 14 578,609 354,625 Trade deposits and short-term prepayments 15 464,392 278,010 Accrued mark-up 79,257 81,483 Other receivables 16 2,023,466 2,114,473 Tax refunds due from the Government 17 538,812 538,812 Taxation - net 997,518 1,502,916 Cash and bank balances 18 18,155,599 11,723,248 38,756,987 32,753,693
TOTAL ASSETS 106,464,627 88,016,062 EQUITY AND LIABILITIES SHARE CAPITAL AND RESERVES Share capital 19 3,233,750 3,233,750 Reserves 20 58,190,818 47,145,858
Attributable to the owners of the Holding Company 61,424,568 50,379,608 Non-controlling interests 7,071,234 6,204,663
Total equity 68,495,802 56,584,271 NON-CURRENT LIABILITIES Long-term finance 21 8,854,165 9,983,078 Long-term deposits 22 69,246 67,971 Deferred liabilities 23 9,430,707 8,655,713
18,354,118 18,706,762 CURRENT LIABILITIES Trade and other payables 24 15,819,145 10,900,436 Accrued mark-up 25 165,210 223,656 Short-term borrowings and running finance 26 1,833,247 437,368 Current portion of long-term finance 21 1,797,105 1,163,569
19,614,707 12,725,029 CONTINGENCIES AND COMMITMENTS 27
TOTAL EQUITY AND LIABILITIES 106,464,627 88,016,062 The annexed notes from 1 to 46 form an integral part of these consolidated financial statements.
Muhammad Yunus TabbaChairman / Director
Muhammad Ali TabbaChief Executive
P 130

Consolidated Profit and Loss AccountFor the year ended June 30, 2015
Muhammad Yunus TabbaChairman / Director
Muhammad Ali TabbaChief Executive
Note 2015 2014 PKR in ‘000’ Turnover 29.1 96,474,922 94,098,358
Less: Sales tax and excise duty 11,209,856 10,288,921
Rebates and commission 3,147,264 2,661,218
14,357,120 12,950,139
Net sales 82,117,802 81,148,219
Cost of turnover 29.2 (56,430,360) (58,021,048)
Gross profit 25,687,442 23,127,171
Distribution cost 31 (4,653,188) (4,638,361)
Administrative expenses 32 (1,984,165) (1,700,316)
Finance cost 33 (1,016,406) (1,074,705)
Other expenses 34 (1,667,303) (1,207,059)
Other income 35 1,341,310 1,285,256
17,707,690 15,791,986
Share of gain / (loss) in equity-accounted investments 8.1 & 8.2 & 8.3 718,039 (18,583)
Profit before taxation 18,425,729 15,773,403 Taxation 36 (3,770,485) (3,199,639)
Profit after taxation 14,655,244 12,573,764
Attributable to: Owners of the Holding Company 13,757,976 11,892,359
Non-controlling interests 897,268 681,405
14,655,244 12,573,764
Other comprehensive income: Items not to be reclassified to profit and loss account in subsequent periods :
Gain on remeasurements of post retirement benefit obligations 95,850 52,002 Deferred taxation (32,853) (17,213)
62,997 34,789
Items to be reclassified to profit and loss account in subsequent periods :
Foreign exchange differences on translation of foreign operations 65,408 (63,554)
Total comprehensive income for the year 14,783,649 12,544,999
Attributable to:
Owners of the Holding Company 13,834,692 11,848,180
Non-controlling interests 948,957 696,819
14,783,649 12,544,999
(PKR)
Earnings per share - basic and diluted 37 42.54 36.78 The annexed notes from 1 to 46 form an integral part of these consolidated financial statements.
P 131

Consolidated Cash Flow StatementFor the year ended June 30, 2015
Note 2015 2014 PKR in ‘000’
CASH FLOWS FROM OPERATING ACTIVITIES Cash generated from operations 38 28,580,585 21,924,209 Finance costs - net (1,154,109) (1,080,552) Income tax paid (2,884,804) (2,921,356) Staff retirement benefits paid (112,565) (117,336) (4,151,478) (4,119,243) Long term loans and advances 1,301,879 (905,164) Long-term deposits and prepayments (2,934) 5,495 Net cash generated from operating activities 25,728,052 16,905,296
CASH FLOWS FROM INVESTING ACTIVITIES Fixed capital expenditure (9,857,216) (5,602,715) Additions to intangibles (44,421) – Proceeds from disposal of shares in ICI 243,897 97,149 Investment in joint ventures and unquoted entity (7,945,104) (1,731,700) Dividend from associate 454,379 – Investments - net – 110,062 Sale proceeds from disposal of operating fixed assets 76,411 77,585 Net cash used in investing activities (17,072,054) (7,049,619) CASH FLOWS FROM FINANCING ACTIVITIES Long-term finance - net (504,786) 3,004,979 Dividends paid to owners of holding company (2,910,375) (2,678,040) Dividends paid to NCI (205,640) – Long term deposits - net 1,275 10,846 Additions / (Repayment) of short-term borrowings and running finance 1,395,879 (2,217,181)Net cash used in financing activities (2,223,647) (1,879,396)Net increase in cash and cash equivalents 6,432,351 7,976,280Cash and cash equivalents at the beginning of the year 11,723,248 3,746,968
Cash and cash equivalents at the end of the year 18,155,599 11,723,248 The annexed notes from 1 to 46 form an integral part of these consolidated financial statements.
Muhammad Yunus TabbaChairman / Director
Muhammad Ali TabbaChief Executive
P 132

Consolidated Statement of Changes in EquityFor the year ended June 30, 2015
––– Attributable to the equity owners of the Holding Company ––– Issued, Capital subscribed reserve Revenue reserves Total Non Total and paid up Share General Foreign Unappropriated reserves controlling equity capital premium reserves currency profit interests translation reserve PKR in ‘000’
Balance as at June 30, 2013 3,233,750 7,343,422 20,000,000 – 10,552,319 37,895,741 5,490,672 46,620,163 Transfer to general reserves – – 7,871,271 – (7,871,271) – – – Final dividend at the rate of PKR 8/- per ordinary share of PKR 10/– each for the year ended June 30, 2013 – – – – (2,587,000) (2,587,000) – (2,587,000)Dividends paid to non–controlling interests of ICI – – – – – – (91,040) (91,040)Decrease in ownership interest in ICI – – – – (11,063) (11,063) 108,212 97,149 Profit after taxation – – – – 11,892,359 11,892,359 681,405 12,573,764 Other comprehensive income – – – (63,554) 19,375 (44,179) 15,414 (28,765)Total comprehensive income for the year – – – (63,554) 11,911,734 11,848,180 696,819 12,544,999 Balance as at June 30, 2014 3,233,750 7,343,422 27,871,271 (63,554) 11,994,719 47,145,858 6,204,663 56,584,271
Transfer to general reserves – – 8,433,365 – (8,433,365) – – – Final dividend at the rate of PKR 9/- per ordinary share of PKR 10/- each for the year ended June 30, 2014 – – – – (2,910,375) (2,910,375) – (2,910,375)Dividends paid to non–controlling interests of ICI – – – – – – (205,640) (205,640)Decrease in ownership interest in ICI – – – – 120,643 120,643 123,254 243,897 Profit after taxation – – – – 13,757,976 13,757,976 897,268 14,655,244 Other comprehensive income – – – 65,408 11,308 76,716 51,689 128,405
Total comprehensive income for the year – – – 65,408 13,769,284 13,834,692 948,957 14,783,649 Balance as at June 30, 2015 3,233,750 7,343,422 36,304,636 1,854 14,540,906 58,190,818 7,071,234 68,495,802 The annexed notes from 1 to 46 form an integral part of these consolidated financial statements.
Muhammad Yunus TabbaChairman / Director
Muhammad Ali TabbaChief Executive
P 133

1 THE GROUP AND ITS OPERATIONS
The Group consists of Lucky Cement Limited (“the Holding Company”) and its subsidiary companies LCL Investment Holdings Limited, Lucky Holdings Limited, ICI Pakistan Limited, ICI Pakistan PowerGen Limited, Lucky Electric Power Company Limited and LCL Holdings Limited. Brief profiles of the Holding company and its subsidiary companies are as follows :
1.1 Lucky Cement Limited
The Holding Company was incorporated in Pakistan on September 18, 1993 under the Companies Ordinance, 1984 (the Ordinance). The shares of the Holding Company are quoted on all the three stock exchanges in Pakistan. The Holding Company has also issued Global Depository Receipts (GDRs) which are listed and traded on the Professional Securities Market of the London Stock Exchange. The principal activity of the Holding Company is manufacturing and marketing of cement. The registered office of the Holding Company is located at Pezu, District Lakki Marwat in Khyber Pakhtunkhwa. The Holding Company has two production facilities at Pezu, District Lakki Marwat in Khyber Pakhtunkhwa and at Main Super Highway in Karachi, Sindh.
1.2 LCL Investment Holdings Limited
The Holding Company has made an investment in LCL Investment Holdings Limited (LCLIHL), a wholly owned subsidiary of the Holding Company, incorporated and domiciled in Mauritius. LCLIHL has concluded a joint venture agreement with Al-Shumookh Construction Materials Trading FZE, United Arab Emirates, for establishing Lucky Al-Shumookh Holdings Limited, for constructing a cement grinding unit in the Republic of Iraq. LCLIHL holds 50 percent ownership interest in the aforementioned joint venture.
LCLIHL has also entered into a joint venture agreement with Rawsons Investments Limited (registered in Cayman Islands) for
establishing LuckyRawji Holdings Limited for constructing a fully integrated cement manufacturing unit in the Democratic Republic of Congo. LCLIHL holds 50 percent ownership interest in the aforementioned joint venture.
1.3 Lucky Holdings Limited
Lucky Holdings Limited (LHL) was incorporated in Pakistan on September 6, 2012 as a public unlisted Company limited by
shares under the Companies Ordinance, 1984. The registered office of LHL is located at Main Indus Highway, Pezu, District Lakki Marwat in the province of Khyber Pakhtunkhwa. As of the balance sheet date, LHL held 74.75% (2014: 75.36%) shares in ICI Pakistan Limited. The main source of earning is dividend and royalty income.
1.4 ICI Pakistan Limited
ICI Pakistan Limited (ICI) was incorporated in Pakistan and is listed on the Karachi, Lahore and Islamabad Stock Exchanges. The
Company is engaged in the manufacture of polyester staple fiber, POY chips, soda ash, specialty chemicals, sodium bicarbonate and polyurethanes; marketing of seeds, toll manufactured and imported pharmaceuticals and animal health products; and merchanting of general chemicals. It also acts as indenting agent and toll manufacturer. The registered office of ICI is situated at 5 West Wharf, Karachi.
1.5 ICI Pakistan PowerGen Limited
ICI Pakistan PowerGen Limited (ICI PowerGen) was incorporated in Pakistan as an unlisted public company and is a wholly owned subsidiary company of ICI. ICI PowerGen is engaged in generating, selling and supplying electricity to the ICI. The registered office of ICI PowerGen is situated at 5 West Wharf, Karachi.
1.6 LCL Holdings Limited
During the year, the Holding Company formed a new wholly owned subsidiary by the name of LCL Holdings Limited (LCLHL) with the objective to invest in the Coal Based Power project to be setup by Lucky Electric Power Company Limited (LEPCL).
1.7 Lucky Electric Power Company Limited
Lucky Electric Power Company Limited (LEPCL) was incorporated in Pakistan on June 13, 2014, as a public unlisted company. LEPCL is a wholly owned subsidiary of LHL. The operations of LEPCL have not yet started. LEPCL will invest in setting up a 660
Notes to the Consolidated Financial StatementsFor the year ended June 30, 2015
P 134

MW coal based power project in Karachi. Its registered office is situated at 6-A, Muhammad Ali Society, A. Aziz Hashim Tabba Street, Karachi in the province of Sindh.
2 STATEMENT OF COMPLIANCE
These consolidated financial statements have been prepared in accordance with approved accounting standards as applicable in Pakistan. Approved accounting standards comprise of such International Financial Reporting Standards (IFRSs) issued by the International Accounting Standards Board (IASB) and Islamic Financial Accounting Standards (IFAS) issued by the Institute of Chartered Accountants of Pakistan (ICAP) as are notified under the Companies Ordinance, 1984, provisions of and directives issued under the Companies Ordinance, 1984. In case requirements differ, the provisions or directives of the Companies Ordinance, 1984 shall prevail.
3 BASIS OF CONSOLIDATION
These consolidated financial statements include the financial statements of the Holding Company and its subsidiary companies, here-in-after referred to as “the Group”.
A company is a subsidiary, if an entity (the Holding Company) directly or indirectly controls, beneficially owns or holds more than
fifty percent of its voting securities or otherwise has power to elect and appoint more than fifty percent of its directors. Subsidiaries are consolidated from the date on which the Group obtains control, and continue to be consolidated until the date
when such control ceases. The financial statements of the subsidiaries are prepared for the same reporting year as the Holding Company, using consistent
accounting policies. The accounting policies of the subsidiaries have been changed to conform with accounting policies of the Group, where required.
All intra-group balances, transactions and unrealised gains and losses resulting from intra-group transactions and dividends are
eliminated in full. Where the ownership of a subsidiary is less than 100% and therefore, a non controlling interest (NCI) exists, the NCI is allocated
its share of the total comprehensive income of the period, even if that results in a deficit balance. A change in the ownership interest of a subsidiary, without a loss of control, is accounted for as an equity transaction. If
the Group loses control over a subsidiary, it derecognises the assets (including goodwill) and liabilities of the subsidiary, carrying amount of any NCI, cumulative translation differences recognised in equity, and recognises fair value of consideration received, any investment retained, surplus or deficit in profit and loss account, and reclassifies the Holding Company share of components previously recognised in other comprehensive income to profit and loss account or retained earnings, as appropriate.
The assets, liabilities, income and expenses of subsidiary companies are consolidated on a line by line basis and carrying value
of investments held by the Holding Company is eliminated against the subsidiary companies’ shareholders’ equity in the consolidated financial statements.
The presentation and functional currency of the Holding Company and subsidiaries other than LCLIHL are Pakistani Rupee
and the functional currency of LCLIHL is US Dollar. For the purpose of consolidation, the financial statements of the LCLIHL are translated to presentation / functional currency of the Holding Company.
4 SUMMARY OF SIGNIFICANT ACCOUNTING POLICIES
4.1 Accounting convention
These consolidated financial statements have been prepared under the historical cost convention except for:
– Investments which are carried at fair value in accordance with IAS-39 “Financial Instruments: Recognition and measurement”; and
P 135

– Defined benefit obligations which are stated at present value in accordance with the requirements of IAS-19 “Employee Benefits”.
4.2 Standards, interpretations and amendments to approved accounting standards that became effective during the year
The accounting policies adopted in the preparation of these consolidated financial statements are consistent with those of the previous financial year except as described below:
New / revised standards, interpretations and amendments
The Group has adopted the following revised standards, amendments and interpretations of IFRSs which became effective for the current year:
IAS 19 Employee Benefits - (Amendment) - Defined Benefit Plans: Employee Contributions IAS 32 Financial Instruments : Presentation – (Amendment) -Offsetting Financial Assets and Financial Liabilities IAS 36 Impairment of Assets – (Amendment) -Recoverable Amount Disclosures for Non-Financial Assets IAS 39 Financial Instruments: Recognition and Measurement – (Amendment) - Novation of Derivatives and Continuation of Hedge Accounting IFRIC 21 Levies Improvements to Accounting Standards Issued by the IASB
IFRS 2 Share-based Payment - Definitions of vesting conditions IFRS 3 Business Combinations – Accounting for contingent consideration in a business combination IFRS 3 Business Combinations - Scope exceptions for joint ventures IFRS 8 Operating Segments – Aggregation of operating segments IFRS 8 Operating Segments - Reconciliation of the total of the reportable segments’ assets to the entity’s assets IFRS 13 Fair Value Measurement - Scope of paragraph 52 (portfolio exception) IAS 16 Property, Plant and Equipment and IAS 38 Intangible Assets – Revaluation method – proportionate restatement of
accumulated depreciation / amortisation IAS 24 Related Party Disclosures - Key management personnel IAS 40 Investment Property - Interrelationship between IFRS 3 and IAS 40 (ancillary services) The adoption of the above amendments, improvements to accounting standards and interpretations did not have any effect
on these consolidated financial statements. 4.3 Property, plant and equipment
These are stated at cost less accumulated depreciation / amortization and impairment losses, if any, except for freehold land and capital work-in-progress which are stated at cost less impairment losses, if any. Cost in relation to certain operating fixed assets, including capital work-in-progress, signifies historical cost and financial charges on borrowings as stated in note 4.18 to these consolidated financial statements.
Except for plant and machinery and generators, depreciation / amortization is charged to profit and loss account applying the
straight line method at the rates mentioned in note 6.1 to these consolidated financial statements. On plant and machinery and generators depreciation is charged on units of production method (UPM) based on higher of estimated life or production. Depreciation on additions is charged from the date of acquisition / transfer of asset, whereas depreciation on disposals is charged till the date of disposal.
Assets’ residual values, the method of depreciation and useful lives are reviewed and adjusted, if appropriate, at each balance
sheet date. Maintenance and normal repairs are charged to profit and loss account as and when incurred. Major renewals and
improvements which increase the assets’ remaining useful economic life or the performance beyond the current estimated levels are capitalized and the assets so replaced, if any, are retired.
Gains and losses on disposal of operating fixed assets, if any, are included in profit and loss account.
Notes to the Consolidated Financial StatementsFor the year ended June 30, 2015
P 136

4.4 Intangible assets
Intangible assets other than goodwill, distribution relationship, principal relationship and product rights are stated at cost less accumulated amortization and accumulated impairment losses, if any. Distribution relationship, principal relationship and product rights are stated at cost less accumulated impairment losses, if any, as their useful life is indefinite. However, these assets are tested for impairment annually.
Amortization is charged to the profit and loss account applying the straight line method, whereby, the cost of intangible asset
is written off over its useful economic life. The useful lives of the intangible assets are stated in note 7 to these consolidated financial statements. Full month’s amortization is charged in the month of addition, whereas, amortization on disposals is charged upto the month in which the disposal takes place.
4.5 Goodwill
Goodwill is initially measured as of the acquisition date, being the excess of (a) the aggregate of the consideration transferred, the amount of any non-controlling interest in the acquiree; and (b) the net of the acquisition date amount of the identifiable assets acquired and the liabilities assumed.
In case the fair value attributable to the Group’s interest in the identifiable net assets exceeds the fair value of consideration, the Group recognizes the resulting gain in the profit and loss account on the acquisition date.
Goodwill acquired in a business combination is measured, subsequent to initial recognition, at cost less accumulated impairment losses, if any.
For the purpose of impairment testing, goodwill is allocated to each of the Group’s cash generating unit (or the groups of cash
generating unit) that are expected to benefit from the synergies of the operations irrespective of whether other assets or liabilities of the acquiree are assigned to these units or group of units.
A cash generating unit to which goodwill has been allocated is tested for impairment annually, or more frequently when there
is an indication that the unit may be impaired. If the recoverable amount of the cash generating unit is less than its carrying amount, the impairment loss is allocated first to reduce the carrying amount of any goodwill allocated to the unit and then to the other assets of the units on pro rata based on the carrying amount of each asset in the unit. Any impairment loss for goodwill is recognized directly in profit and loss account. An impairment loss recognized for goodwill is not reversed in subsequent periods.
On disposal of the relevant cash generating unit, the attributable amount of goodwill is included in the determination of the
profit or loss on disposal.
4.6 Investments at fair value through profit or loss
An investment is classified at fair value through profit or loss if it is held for trading or is designated as such upon initial recognition. Financial instruments are classified as held for trading if they are acquired for the purpose of selling and repurchasing in near term. These assets are acquired principally for the purpose of generating a profit from short-term fluctuation in price. Financial instruments are designated at fair value through profit or loss if the Group manages such investments and makes sales and purchase decisions based on their fair value in accordance with the Group’s investment strategy.
All investments classified as investments at fair value through profit or loss are initially measured at cost being fair value
of consideration given. All transaction costs are recognised directly in profit and loss account. At subsequent dates these investments are measured at fair value with any resulting gain or loss recognised directly in the profit and loss account.
4.7 Investment in associates / joint ventures
Investments in associates / joint ventures are accounted for using the equity method, whereby the investment is initially recorded at cost and adjusted thereafter for the post acquisition change in the Group’s share of the net assets of the associates / joint ventures. The consolidated profit and loss account reflects the Group’s share of the results of the operations of the associates / joint ventures.
P 137

The Group determines at each reporting date whether there is any objective evidence that the investment in the associates / joint ventures is impaired. If this is the case, the Group calculates the amount of impairment as the difference between the recoverable amount of the associate / joint venture and its carrying value and recognises the same in the profit and loss account.
4.8 Stores and spares
These are valued at lower of weighted average cost and net realizable value, except items in transit, which are stated at cost. Provision for slow moving, damaged and obsolete items are charged to profit and loss account. Value of items is reviewed at each balance sheet date to record provision for any slow moving, damaged and obsolete item.
Items in transit are valued at cost comprising invoice value plus other charges incurred thereon upto the balance sheet
date.
Net realizable value signifies the selling price in the ordinary course of business less costs necessary to be incurred in order to make the sale, which is generally equivalent to the estimated replacement cost.
4.9 Stock-in-trade
These are stated at the lower of cost and net realizable value. The methods used for the calculation of cost are as
follows:
i) Raw and packing material At weighted average cost comprising of quarrying / purchase price, transportation, government levies and other overheads.
ii) Work-in-process and finished goods At weighted average cost comprising direct cost of raw material, labour and
other manufacturing overheads. Items in transit are valued at cost comprising invoice value plus other charges incurred thereon upto the balance sheet
date. Net realizable value signifies the estimated selling price in the ordinary course of business less estimated costs necessary to
make the sale. 4.10 Trade debts and other receivables
Trade debts and other receivables are stated at original invoice amount less provision for doubtful debts, if any. Provision for doubtful debts / receivables is based on the management’s assessment of customers’ outstanding balances and creditworthiness. Bad debts are written-off when identified.
4.11 Cash and cash equivalents
Cash and cash equivalents are stated at cost. For the purpose of cash flow statement, cash and cash equivalents comprise of cash and cheques in hand and current and deposit accounts with commercial banks.
4.12 Long-term and short-term borrowings
These are recorded at the proceeds received. Finance costs are accounted for on accrual basis and are disclosed as accrued interest / mark-up to the extent of the amount remaining unpaid.
4.13 Staff retirement benefits
The Group’s retirement benefit plans comprise of provident funds, pensions, gratuity schemes and a medical scheme for eligible retired employees.
Notes to the Consolidated Financial StatementsFor the year ended June 30, 2015
P 138

Defined benefit plans
The Group recognises staff retirement benefits expense in accordance with IAS 19 “Employee Benefits”. An actuarial valuation of all defined benefit schemes is conducted every year. The valuation uses the Projected Unit Credit method.
The Group operates an unfunded gratuity scheme covering all permanent employees of the Holding Company. Contribution is
made to this scheme on the basis of actuarial recommendations. Staff retirement benefits are payable to staff on completion of prescribed qualifying period of service under the scheme.
The Group operates a funded pension scheme and a funded gratuity scheme for the management staff of its subsidiary
companies (ICI and ICI PowerGen). The pension and gratuity schemes are salary schemes providing pension and lump sums, respectively. Pension and gratuity schemes for ICI’s management staff are invested through two approved trust funds. The Group also operates unfunded gratuity scheme for non-management staff and the unfunded pensioners’ medical scheme for its subsidiary companies (ICI and ICI PowerGen). The pension and gratuity plans are final salary plans. The pensioners’ medical plan reimburses actual medical expenses to pensioners as per entitlement.
Defined contributory plans
The Group operates two registered contributory provident funds for entire staff of its subsidiary companies (ICI and ICI PowerGen) and a registered defined contribution superannuation fund for management staff of its subsidiary companies (ICI and ICI PowerGen), who have either opted for this fund by July 31, 2004 or have joined ICI after April 30, 2004. In addition to this, the Group also provides group insurance to all employees of its subsidiary companies (ICI and ICI PowerGen).
4.14 Compensated absences
The Group accounts for compensated absences in the accounting period in which these are accrued. 4.15 Trade and other payables
Liabilities for trade and other amounts payable are carried at cost which is the fair value of the consideration to be paid in future for goods and services received, whether or not invoiced to the Group.
4.16 Provisions
Provisions are recognized in the balance sheet when the Group has a legal or constructive obligation as a result of a past event; it is probable that an outflow of economic benefits will be required to settle the obligation and a reliable estimate of the amount of obligation can be made. However, provisions are reviewed at each balance sheet date and adjusted to reflect current best estimate.
4.17 Taxation
Current
The charge for current taxation is based on taxable income at the current rates of taxation in accordance with Income Tax Ordinance, 2001.
Deferred
Deferred tax is provided in full using the balance sheet liability method on all temporary differences arising at the balance sheet date, between the tax bases of the assets and the liabilities and their carrying amounts. Deferred tax liabilities are recognized for all taxable temporary differences and deferred tax assets are recognized for all deductible temporary differences, unused tax losses and unused tax credits to the extent that it is probable that future taxable profits will be available against which these can be utilized.
Deferred tax is calculated at the rates that are expected to apply to the period when the differences reverse, based on tax rates
that have been enacted or substantively enacted by the balance sheet date. In this regard, the effects on deferred taxation of the portion of income expected to be subject to final tax regime is adjusted in accordance with the requirement of Accounting Technical Release - 27 of the Institute of Chartered Accountants of Pakistan.
P 139

4.18 Revenue recognition
Revenue is recognized to the extent that it is probable that the economic benefits will flow to the Group and the revenue can be measured reliably. Revenue is measured at the fair value of the consideration received or receivable, excluding discounts, rebates and government levies.
4.18.1 Sale of goods and toll manufacturing
Revenue from sale of goods is recognized when the significant risks and rewards of ownership of the goods have passed to the buyer, usually on dispatch of the goods to customers. For those products which are often sold with a right of return, accumulated experience is used to estimate and provide for such returns at the time of sale.
Toll manufacturing income is recognised when services are rendered. 4.18.2 Other income
Revenue from the sale of electricity is recorded based on the output delivered and capacity available at the rates as specified under Power Purchase Agreement.
Return on bank deposits is recognized on a time proportion basis on the principal amount outstanding and at the rate
applicable. Commission income is recognised on date of shipment from suppliers. Dividend income is recognised when the right to receive dividend is established. 4.19 Borrowing costs
Borrowing and other related costs directly attributable to the acquisition, construction or production of qualifying assets, which are assets that necessarily take a substantial period of time to get ready for their intended use, are added to the cost of those assets, until such time as the assets are substantially ready for their intended use. All other borrowing costs are recognized as an expense in the period in which they are incurred.
4.20 Foreign currency translations
Foreign currency transactions are translated into Pakistani Rupee using the exchange rates ruling at the dates of the transactions. Monetary assets and liabilities in foreign currencies are re-translated into Pakistani Rupee using the exchange rate ruling at the balance sheet date. Foreign exchange gains and losses resulting from the settlement of such transactions and from the translations at the year end exchange rates of monetary assets and liabilities denominated in foreign currencies are recognized in the profit and loss account.
On consolidation, the assets and liabilities of foreign operations are retranslated into presentation currency i.e. Pakistani Rupee
at the rate of exchange prevailing at the balance sheet date and their income and expenses are translated using the average of exchange rates for the period. The exchange differences arising on such translations are recognised in other comprehensive income.
4.21 Financial assets and liabilities
Financial assets and liabilities are initially measured at cost, which is the fair value of the consideration given and received respectively. These financial assets and liabilities are subsequently remeasured to fair value, amortized cost or cost as the case may be. Any gain or loss on the recognition and de-recognition of the financial assets and liabilities is included in the profit and loss account for the period in which it arises.
Financial assets and financial liabilities are recognised at the time when the Group becomes a party to the contractual
provisions of the instrument. Financial assets are derecognized when the Group loses control of the contractual rights that comprise the financial asset. Financial liabilities are removed from the balance sheet when the obligation is extinguished, discharged, cancelled or expired.
Notes to the Consolidated Financial StatementsFor the year ended June 30, 2015
P 140

Assets or liabilities that are not contractual in nature and that are created as a result of statutory requirements imposed by the Government are not the financial instruments of the Group.
4.22 Offsetting
A financial asset and financial liability is off-set and the net amount is reported in the balance sheet when a legal enforceable right to set-off the transactions is available and also there is an intention to settle on a net basis or to realize the asset and settle the liability simultaneously.
4.23 Impairment
At each balance sheet date, the carrying amount of assets are reviewed to determine whether there is any indication that those assets have suffered an impairment loss. Such indication exists, the recoverable amount of the asset is estimated in order to determine the extent of the impairment loss, if any. Impairment losses are recognized as expense in the profit and loss account.
4.24 Dividend and appropriation to reserves
Dividend and appropriation to reserves are recognized in the consolidated financial statements in the period in which these are approved.
4.25 Segment reporting
Segment reporting is based on the operating (business) segments of the Group. An operating segment is a component of the Group that engages in business activities from which it may earn revenues and incur expenses, including revenues and expenses that relate to transactions with any of the Group’s other components. An operating segment’s operating results are reviewed regularly by the Chief Executive Officer (the CEO) to make decisions about resources to be allocated to the segment and assess its performance, and for which discrete financial information is available.
Segment results that are reported to the CEO include items directly attributable to a segment as well as those that can be
allocated on a reasonable basis. Unallocated items comprise mainly corporate assets, income tax assets, liabilities and related income and expenditure. Segment capital expenditure is the total cost incurred during the year to acquire property, plant and equipment.
The business segments are engaged in providing products or services which are subject to risks and rewards which differ from
the risk and rewards of other segments. Segments reported are Cement, Polyester, Soda Ash, Life Sciences, Chemicals and others (LCLIHL / ICI PowerGen), which also reflects the management structure of the Group.
4.26 Derivative financial instruments
The Group uses derivative financial instruments to hedge its exposure to foreign exchange and interest rate risks arising from operational, financing and investment activities. In accordance with its treasury policy, the Group does not hold or issue derivative financial instruments for trading purposes. Derivatives qualifying for hedge accounting are accounted for accordingly whereas, derivatives that do not qualify for hedge accounting are accounted for as held for trading instruments. All changes in the fair value are recognized in the profit and loss account.
4.27 Operating leases / Ijarah contracts
Leases, other than those under Ijarah contracts, in which a significant portion of the risks and rewards of ownership are retained by the lessor, are classified as operating leases. Ijarah contracts are classified as operating leases irrespective of whether significant portion of the risks and rewards of ownership are retained by lessor. Payments made under operating leases and Ijarah contracts (net of any incentives received from the lessor) are charged to the profit and loss account on a straight-line basis over the period of the lease.
P 141

4.28 Earnings per share
The Group presents basic and diluted earnings per share (EPS) data for its ordinary shares. Basic EPS is calculated by dividing the profit after tax attributable to ordinary shareholders of the Holding Company by the weighted average number of ordinary shares outstanding during the period.
4.29 Standards, interpretations and amendments to approved accounting standards that are not yet effective
The following amendments and interpretations with respect to the approved accounting standards as applicable in Pakistan would be effective from the dates mentioned below against the respective standard or interpretation:
Effective date (annual periods beginning Standard or Interpretation on or after)
IFRS 10 – Consolidated Financial Statements 01 January 2015 IFRS 10 – Consolidated Financial Statements, IFRS 12 – Disclosure of Interests in Other Entities and IAS 27 Separate Financial Statements – Investment Entities (Amendment) 01 January 2015 IFRS 10 – Consolidated Financial Statements, IFRS 12 – Disclosure of Interests in Other Entities and IAS 27 Separate Financial Statements – Investment Entities: Applying the Consolidation Exception (Amendment) 01 January 2016 IFRS 10 – Consolidated Financial Statements and IAS 28 – Investment in Associates and Joint Ventures - Sale or Contribution of Assets between an Investor and its Associate or Joint Venture (Amendment) 01 January 2016 IFRS 11 – Joint Arrangements 01 January 2015 IFRS 11 – Joint Arrangements - Accounting for Acquisition of Interest in Joint Operation (Amendment) 01 January 2016 IFRS 12 – Disclosure of Interests in Other Entities 01 January 2015 IFRS 13 – Fair Value Measurement 01 January 2015 IAS 1 – Presentation of Financial Statements - Disclosure Initiative (Amendment) 01 January 2016 IAS 16 – Property, Plant and Equipment and IAS 38 – intangible assets - Clarification of Acceptable Method of Depreciation and Amortization (Amendment) 01 January 2016 IAS 16 – Property, Plant and Equipment IAS 41 – Agriculture - Agriculture: Bearer Plants (Amendment) 01 January 2016 IAS 27 – Separate Financial Statements – Equity Method in Separate Financial Statements (Amendment) 01 January 2016 In addition to the above standards and amendments, improvements to various accounting standards have also been issued by
the IASB. Such improvements are generally effective for accounting periods beginning on or after 01 January 2016. The Group expects that such improvements to the standards will not have any material impact on the Group’s financial statements in the period of initial application.
Further, following new standards have been issued by IASB which are yet to be notified by the Securities and Exchange
Commission of Pakistan (SECP) for the purpose of applicability in Pakistan.
Notes to the Consolidated Financial StatementsFor the year ended June 30, 2015
P 142

Effective date (annual periods beginning Standard or Interpretation on or after)
IFRS 9 – Financial Instruments: Classification and Measurement 01 January 2018 IFRS 14 – Regulatory Deferral Accounts 01 January 2016 IFRS 15 – Revenue from Contracts with Customers 01 January 2018
The Group expects that the adoption of the above standards and interpretations will not have material effect on the Group’s
financial statements in the period of initial application except for IFRS 9 - Financial Instruments: Classification and Measurement, IFRS 10 - Consolidated Financial Statements, IFRS 11 - Joint Arrangements, IFRS 12 - Disclosure of Interests in Other Entities and IFRS 13 - Fair Value Measurement, which may affect certain disclosures.
5 Business combinations
Acquisitions of businesses are accounted for using the acquisition method. The consideration transferred in a business combination is measured at fair value, which is calculated as the sum of the acquisition-date fair values of the assets transferred by the Group, liabilities incurred by the Group to the former owners of the acquiree and the equity interests issued by the Group in exchange for control of the acquiree. Acquisition-related costs are generally recognised in profit or loss as incurred.
Goodwill is measured as the excess of the sum of the consideration transferred, the amount of any non-controlling interests in the acquiree, and the fair value of the acquirer’s previously held equity interest in the acquiree (if any) over the net of the acquisition-date amounts of the identifiable assets acquired and the liabilities assumed. If, after reassessment, the net of the acquisition-date amounts of the identifiable assets acquired and liabilities assumed exceeds the sum of the consideration transferred, the amount of any non-controlling interests in the acquiree and the fair value of the acquirer’s previously held interest in the acquiree (if any), the excess is recognised immediately in profit and loss as a bargain purchase gain.
Non-controlling interests that are present ownership interests and entitle their holders to a proportionate share of the
entity’s net assets in the event of liquidation may be initially measured either at fair value or at the non-controlling interests’ proportionate share of the recognised amounts of the acquiree’s identifiable net assets.
Note 2015 2014 PKR in ‘000’
6 PROPERTY, PLANT AND EQUIPMENT
Operating fixed assets - tangible 6.1 46,737,710 40,734,338 Capital work-in-progress 6.4 3,162,473 3,329,085
49,900,183 44,063,423
P 143
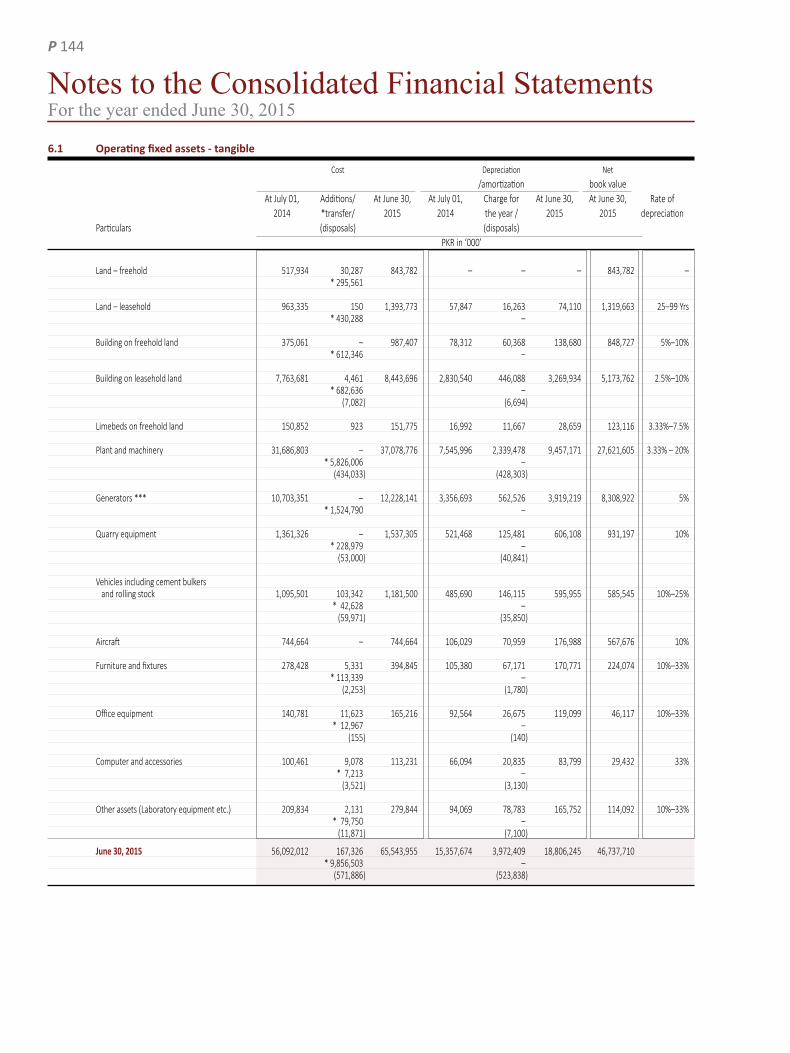
6.1 Operating fixed assets - tangible
Cost Depreciation Net
/amortization book value At July 01, Additions/ At June 30, At July 01, Charge for At June 30, At June 30, Rate of 2014 *transfer/ 2015 2014 the year / 2015 2015 depreciation Particulars (disposals) (disposals) PKR in ‘000’
Land – freehold 517,934 30,287 843,782 – – – 843,782 – * 295,561
Land – leasehold 963,335 150 1,393,773 57,847 16,263 74,110 1,319,663 25–99 Yrs * 430,288 –
Building on freehold land 375,061 – 987,407 78,312 60,368 138,680 848,727 5%–10% * 612,346 –
Building on leasehold land 7,763,681 4,461 8,443,696 2,830,540 446,088 3,269,934 5,173,762 2.5%–10% * 682,636 – (7,082) (6,694)
Limebeds on freehold land 150,852 923 151,775 16,992 11,667 28,659 123,116 3.33%–7.5%
Plant and machinery 31,686,803 – 37,078,776 7,545,996 2,339,478 9,457,171 27,621,605 3.33% – 20% * 5,826,006 – (434,033) (428,303)
Generators *** 10,703,351 – 12,228,141 3,356,693 562,526 3,919,219 8,308,922 5% * 1,524,790 –
Quarry equipment 1,361,326 – 1,537,305 521,468 125,481 606,108 931,197 10% * 228,979 – (53,000) (40,841)
Vehicles including cement bulkers and rolling stock 1,095,501 103,342 1,181,500 485,690 146,115 595,955 585,545 10%–25% * 42,628 – (59,971) (35,850)
Aircraft 744,664 – 744,664 106,029 70,959 176,988 567,676 10%
Furniture and fixtures 278,428 5,331 394,845 105,380 67,171 170,771 224,074 10%–33% * 113,339 – (2,253) (1,780)
Office equipment 140,781 11,623 165,216 92,564 26,675 119,099 46,117 10%–33% * 12,967 – (155) (140)
Computer and accessories 100,461 9,078 113,231 66,094 20,835 83,799 29,432 33% * 7,213 – (3,521) (3,130)
Other assets (Laboratory equipment etc.) 209,834 2,131 279,844 94,069 78,783 165,752 114,092 10%–33% * 79,750 – (11,871) (7,100)
June 30, 2015 56,092,012 167,326 65,543,955 15,357,674 3,972,409 18,806,245 46,737,710 * 9,856,503 – (571,886) (523,838)
Notes to the Consolidated Financial StatementsFor the year ended June 30, 2015
P 144

Cost Depreciation Net
/amortization book value At July 01, Additions/ At June 30, At July 01, Charge for At June 30, At June 30, Rate of 2013 *transfer/ 2014 2013 the year / 2014 2014 depreciation Particulars (disposals) (disposals) PKR in ‘000’
Land – freehold 421,797 24,890 517,934 – – – 517,934 * 71,247 –
Land – leasehold 963,364 ** (29) 963,335 46,153 11,694 57,847 905,488 25–99 Yrs Building on freehold land 369,656 – 375,061 27,946 50,396 78,312 296,749 5%–10% * 92,816 – ** (87,351) – (60) (30) Building on leasehold land 7,209,586 – 7,763,681 2,396,590 437,750 2,830,540 4,933,141 2.5%–10% * 471,404 – ** 86,751 – (4,060) (3,800)
Limebeds on freehold land 139,968 * 10,899 150,852 5,443 11,549 16,992 133,860 3.33%–7.5% ** (15)
Plant and machinery 28,135,701 – 31,686,803 5,644,531 1,954,419 7,545,996 24,140,807 3.33% – 20% * 3,678,688 – ** (25,043) – (102,543) (52,954)
Generators *** 10,692,205 – 10,703,351 2,821,660 535,033 3,356,693 7,346,658 5% * 11,146 – Quarry equipment 1,087,322 – 1,361,326 402,546 119,382 521,468 839,858 10% * 274,523 – (519) (460)
Vehicles including cement bulkers and rolling stock 913,270 196,575 1,095,501 388,691 126,247 485,690 609,811 10%–25% * 5,544 – ** 26,777 – (46,665) (29,248) Aircraft 744,664 – 744,664 35,070 70,959 106,029 638,635 10% Furniture and fixtures 260,861 23,663 278,428 53,091 64,824 105,380 173,048 10%–33% * 50,251 – ** (43,085) – (13,262) (12,535)
Office equipment 124,142 8,949 140,781 73,823 19,156 92,564 48,217 10%–33% * 8,220 – (530) (415)
Computer and accessories 85,993 9,305 100,461 51,625 17,943 66,094 34,367 33% * 8,963 – (3,800) (3,474)
Other assets (Laboratory equipment etc.) 189,460 2,428 209,834 77,505 16,696 94,069 115,765 10%–33% * 18,409 – (463) (132) June 30, 2014 51,337,989 265,810 56,092,012 12,024,674 3,436,048 15,357,674 40,734,338 * 4,702,110 – ** (41,995) – (171,902) (103,048) *** The carrying value of major spare parts and stand by equipment included in generators amount to PKR 452.744 million (2014: PKR 503.606 million).
P 145

6.2 Depreciation / amortization charged for the year has been allocated as follows:
Note 2015 2014 PKR in ‘000’
Cost of turnover 30 3,573,195 3,060,351 Distribution costs 31 95,530 92,215 Administrative expenses 32 200,307 181,326 Cost of sale of electricity 103,377 102,156
Total 3,972,409 3,436,048
6.3 The details of operting fixed assets disposed off during the year are as follows:
Particulars Cost Accumulated Net Book Sale Gain / Mode of Particulars of Buyers
Depreciation Value Proceeds (Loss) Disposal
PKR in ‘000’
TOYOTA PRADO - BF-3366 23,239 8,493 14,746 22,000 7,254 Insurance Claim M/s EFU General Insurance Ltd TOYOTA COROLLA - BBC-139 1,968 549 1,419 1,900 481 Insurance Claim M/s EFU General Insurance Ltd HONDA CG-125 - ABL - 577 100 32 68 80 12 Insurance Claim M/s EFU General Insurance Ltd HONDA CITY - PV-259 1,264 1,090 174 1,087 913 Negotiation Mr. Nasrrullah (Employee) TOYOTA COROLLA - JV-531 1,436 1,354 82 769 687 Negotiation Mr. M. Shabbir (Employee) SUZUKI CULTUS - ASE-309 807 656 151 725 574 Negotiation Mr. Asif Raza Khan (Employee) SUZUKI CULTUS - ATH-694 868 704 164 730 566 Negotiation Mr. Tanveer Iftikhar (Employee) TOYOTA COROLLA - ARH-029 1,467 1,305 162 725 563 Negotiation Mr. Mashkoor Ahmed (Employee) TOYOTA VITZ - ARD-946 782 618 164 625 461 Negotiation Mr. Naseer Meghani (Employee) SUZUKI CULTUS - ARD-372 613 497 116 550 434 Negotiation Mr. Abdul Qadir Khan (Employee) TOYOTA COROLLA - BAQ-155 1,939 582 1,357 1,451 94 Negotiation Mr. Faiz Durrani (Ex-employee) HONDA CITY - AZA-305 1,526 564 962 1,046 84 Negotiation Mr. Zafar Iqbal (Ex-employee) SUZUKI CULTUS - AYH-468 983 478 505 860 355 Tender Mr. Abdul Waqas SUZUKI CULTUS - AWF-693 951 652 299 762 463 Tender Mr. Abdul Waqas HONDA CITY - ATZ-699 1,286 934 352 1,207 855 Tender Mr. Ali Akber Khan SUZUKI CULTUS - AWP-387 970 554 416 857 441 Tender Mr. Hameed Tabba HONDA CITY - VE-784 1,426 833 593 1,341 748 Tender Mr. M. Usman Khan HONDA CITY - QW-708 1,295 1,026 269 1,282 1,013 Tender Mr. M. Usman Khan TOYOTA COROLLA - AKS-895 1,309 1,196 113 716 603 Tender Mr. M.Imran Younas TOYOTA COROLLA - ARX-097 1,423 1,275 148 1,027 879 Tender Mr. M.Yasin, Karachi SUZUKI CULTUS - AQE-013 626 571 55 555 500 Tender Mr. Anis-ud-din, Karachi SUZUKI CULTUS - AVE-529 936 606 330 856 526 Tender Mr. Azmat Ali Siddique SUZUKI CULTUS - MV-730 624 550 74 678 604 Tender Mr. Kashif Ghafoor TOYOTA HILUX - MNS-440 862 623 239 395 156 Tender Mr. Muhammad Aslam Khan SUZUKI CULTUS - ARE-488 613 521 92 546 454 Tender Mr. Noman Iqbal HONDA CITY - ALG-605 914 850 64 682 618 Tender Mr. Nusrat Iqbal SUZUKI CULTUS - AVW-938 928 640 288 754 466 Tender Mr. Syed Adil Ali TOYOTA COROLLA - ARY-709 1,454 1,185 269 1,080 811 Tender Mr. Syed Muqeem Uddin DOZER 8,870 8,627 243 2,100 1,857 Tender M/s Zam traders Pezu DOZER 8,870 8,624 246 2,100 1,854 Tender M/s Zam traders Pezu Air compressor 4,584 2,935 1,649 3,223 1,574 Tender M/s Zam traders Pezu Dumper 4,226 2,853 1,373 750 (623) Tender M/s Zam traders Pezu Dumper 4,226 2,853 1,373 750 (623) Tender M/s Zam traders Pezu Dumper 4,226 2,853 1,373 750 (623) Tender M/s Zam traders Pezu Dumper 4,226 2,853 1,373 750 (623) Tender M/s Zam traders Pezu Dumper 4,226 2,853 1,373 750 (623) Tender M/s Zam traders Pezu Dumper 2,500 1,635 865 1,000 135 Tender M/s Zam traders Pezu Dumper - Body (Bucket) 1,409 951 458 250 (208) Tender M/s Zam traders Pezu Dumper - Body (Bucket) 1,409 951 458 250 (208) Tender M/s Zam traders Pezu Dumper - Body (Bucket) 1,409 951 458 250 (208) Tender M/s Zam traders Pezu Dumper - Body (Bucket) 1,409 951 458 250 (208) Tender M/s Zam traders Pezu Dumper - Body (Bucket) 1,409 951 458 250 (208) Tender M/s Zam traders Pezu Laptop 167 80 87 65 (22) Negotiation Mr. Moez Narsi (Ex-employee) Boiler, Deaerator and other assets 47,390 43,634 3,756 2,124 (1,632) Tender Hanif Ghouri Malakwal Distt Mandi Bahauddin Laptops 250 107 143 155 12 Tender PICIC Insurance Furniture 499 288 211 89 (122) Tender Anjum Wood Craft Khewra Items having book value less than PKR 50,000 each 417,972 409,950 8,022 15,269 7,247 - Various
Total 571,886 523,838 48,048 76,411 28,363
2014 171,902 103,048 68,854 77,585 8,731
Notes to the Consolidated Financial StatementsFor the year ended June 30, 2015
P 146
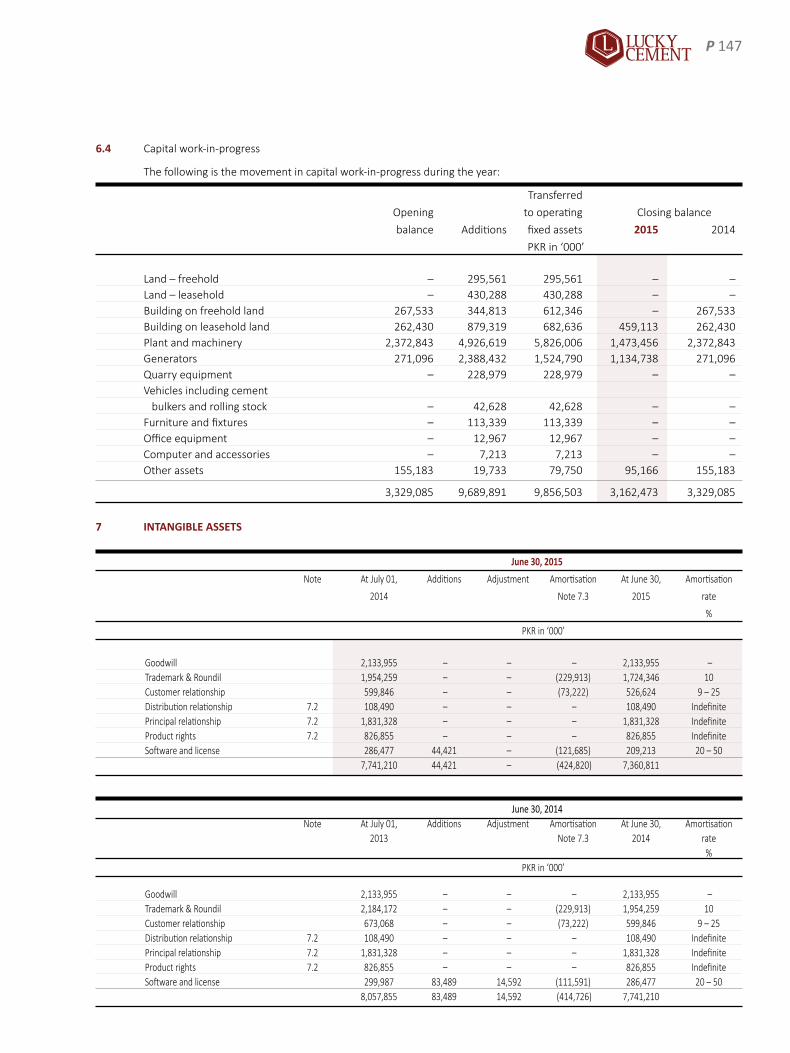
6.4 Capital work-in-progress
The following is the movement in capital work-in-progress during the year:
Transferred
Opening to operating Closing balance
balance Additions fixed assets 2015 2014
PKR in ‘000’
Land – freehold – 295,561 295,561 – – Land – leasehold – 430,288 430,288 – – Building on freehold land 267,533 344,813 612,346 – 267,533 Building on leasehold land 262,430 879,319 682,636 459,113 262,430 Plant and machinery 2,372,843 4,926,619 5,826,006 1,473,456 2,372,843 Generators 271,096 2,388,432 1,524,790 1,134,738 271,096 Quarry equipment – 228,979 228,979 – – Vehicles including cement bulkers and rolling stock – 42,628 42,628 – – Furniture and fixtures – 113,339 113,339 – – Office equipment – 12,967 12,967 – – Computer and accessories – 7,213 7,213 – – Other assets 155,183 19,733 79,750 95,166 155,183
3,329,085 9,689,891 9,856,503 3,162,473 3,329,085
7 INTANGIBLE ASSETS
June 30, 2015 Note At July 01, Additions Adjustment Amortisation At June 30, Amortisation
2014 Note 7.3 2015 rate
%
PKR in ‘000’
Goodwill 2,133,955 – – – 2,133,955 – Trademark & Roundil 1,954,259 – – (229,913) 1,724,346 10 Customer relationship 599,846 – – (73,222) 526,624 9 – 25 Distribution relationship 7.2 108,490 – – – 108,490 Indefinite Principal relationship 7.2 1,831,328 – – – 1,831,328 Indefinite Product rights 7.2 826,855 – – – 826,855 Indefinite Software and license 286,477 44,421 – (121,685) 209,213 20 – 50 7,741,210 44,421 – (424,820) 7,360,811
June 30, 2014 Note At July 01, Additions Adjustment Amortisation At June 30, Amortisation 2013 Note 7.3 2014 rate % PKR in ‘000’
Goodwill 2,133,955 – – – 2,133,955 – Trademark & Roundil 2,184,172 – – (229,913) 1,954,259 10 Customer relationship 673,068 – – (73,222) 599,846 9 – 25 Distribution relationship 7.2 108,490 – – – 108,490 Indefinite Principal relationship 7.2 1,831,328 – – – 1,831,328 Indefinite Product rights 7.2 826,855 – – – 826,855 Indefinite Software and license 299,987 83,489 14,592 (111,591) 286,477 20 – 50 8,057,855 83,489 14,592 (414,726) 7,741,210
P 147

7.2 These have been recognised on the acquisition of ICI by LHL. These intangible assets have been treated as having an indefinite useful life because it is expected to contribute to net cash inflows indefinitely based on the analysis of various economic factors prepared by the management of the Group which indicated that there is no limit to the period these assets would contribute to the net cash inflows and, consequently, the said intangibles will not be amortised until their useful life is determined to be finite.
7.3 The amortization charge for the year has been allocated as follows:
Note 2015 2014 PKR in ‘000’
Cost of turnover 30 337,366 336,761 Distribution costs 31 9,097 6,396 Administrative expenses 32 78,357 71,569 424,820 414,726 7.4 At June 30, 2015, the management of the Group carried out an impairment testing of its intangible assets including goodwill
recorded in the consolidated financial statements at the time of acquisition of ICI Pakistan Limited (ICI). Based on the said testing, the value-in-use of intangible assets was an excess of their respective carrying amounts as at June 30, 2015. Accordingly, no impairment in the carrying value of goodwill is identified as of the balance sheet date.
7.5 Impairment testing of goodwill
For impairment testing, goodwill has been allocated to the following segments which are Cash Generating Units (CGUs) based on their operating results at the acquisition date:
1. Soda Ash; 2. Chemicals; 3. Life Sciences
The recoverable amount of all CGUs has been determined based on value-in-use calculations. The management has used the Income Approach - Discounted Cash Flow Method (DCF) to determine the value-in-use of the operating segments. The financial projections used have been prepared by the management of ICI and approved by its Board of Directors covering a five-year period. Cash flows beyond the five-year period are extrapolated using the estimated growth rates stated below.
Key assumptions used in value-in-use calculation
The calculation of value-in-use is most sensitive to the following assumptions: (a) Discount rates
Discount rates reflect management estimates of the rate of return required for each business. The management used the Weighted Average Cost of Capital (WACC) to determine the cost of capital rate. The cost of equity has been computed through the “Capital Asset Pricing Model”.
The following discount rates have been used which are based on the WACC of that CGU: Discount rate %
Soda Ash 11.87 Chemicals 14.44 Life sciences 13.12 A terminal growth rate of 4% has been used, which is the management’s estimate of sustainable growth in revenue and long
term industry growth.
Notes to the Consolidated Financial StatementsFor the year ended June 30, 2015
P 148

(b) Key commercial assumptions
The valuation is based on the key commercial assumptions that revenue growth, contribution margins, customer demands in
the products of the CGUs etc. would be achieved.
7.6 Impairment testings of other intangibles acquired through business combination
The recoverable amount of intangibles have been determined based on value-in-use calculations. The value-in-use has been determined on the following basis:
Intangibles Basis of valuation
Brand - Trademark and roundil Income Approach - Relief from Royalty Method Customer relationship Income Approach - Multi-Period Excess Earnings Method Distribution relationship Income Approach - Multi-Period Excess Earnings Method Principal relationship Income Approach - Multi-Period Excess Earnings Method Product rights Income Approach - Multi-Period Excess Earnings Method
Key assumptions used in value-in-use calculation
The following key assumptions have been made by the management for the intangibles: Growth/ Discount Attrition royalty rate rate rate % % %
Brand - Trademark and roundil 1.5 13.45 N/A Customer relationship 5 - 10 11.87 - 14.44 7.96 - 15.51 Distribution relationship 5 - 19 14.44 N/A Principal relationship 8 - 25 11.69 - 14.62 N/A Product rights 15 and 30 11.90 and 14.62 N/A A terminal growth rate of 4-5% has been used, which is the management’s estimate of sustainable growth in revenue and long
term industry growth. Note 2015 2014 PKR in ‘000’
8 LONG-TERM INVESTMENTS
Equity accounted investment Joint ventures Lucky Al Shumookh Holdings Limited 8.1 2,157,856 1,711,234 LuckyRawji Holdings Limited 8.2 6,870,253 395
9,028,109 1,711,629 Associate
NutriCo Pakistan (Pvt) Limited 8.3 772,224 - Yunus Energy Limited 8.4 204,365 750 976,589 750
10,004,698 1,712,379
Unquoted
Equity security available-for-sale Arabian Sea Country Club Limited (250,000 ordinary shares of PKR 10 each) 2,500 2,500
10,007,198 1,714,879
P 149

2015 2014 PKR in ‘000’
8.1 Lucky Al Shumookh Holdings Limited
Investment at cost 1,729,081 1,729,081 Investments made during the year 183,202 - Share of loss - opening balance (18,583) - Share of profit / (loss) for the year 515,626 (18,583) Dividend income (304,379) - Foreign currency translation reserve 52,909 736
2,157,856 1,711,234 Lucky Al Shumookh Holdings Limited (LASHL) is a joint venture between the Group and Al Shumookh Group. LASHL was
incorporated as an offshore company with limited liability in Jebel Ali Free Zone, United Arab Emirates. The Group holds 50 percent ownership interest in LASHL.
The Group’s interest in LASHL’s assets and liabilities is as follows:
2015 2014 PKR in ‘000’
Non-current assets 3,280,673 3,515,450 Current assets excluding cash and cash equivalents 1,107,674 402,708 Cash and cash equivalents 230,922 253,208 Liabilities (301,060) (746,475)
Net assets (100%) 4,318,209 3,424,891 Company’s share of net assets (50%) 2,159,105 1,712,446 Less: Share of pre-acquisition loss (1,249) (1,212)
2,157,856 1,711,234 The Group’s share in LASHL’s profit and loss account is as follows: Revenue 5,889,224 1,186,339 Cost of sales (4,773,535) (1,170,702) General and administrative expenses (73,910) (41,429) Selling and distribution expenses (10,528) (12,164) Interest income - 790 Net profit / (loss) (100%) 1,031,251 (37,166)
Company’s share of net profit / (loss) (50%) 515,626 (18,583)
Note 2015 2014 PKR in ‘000’
8.2 LuckyRawji Holdings Limited
Investment at cost 395 395 Investments made during the year 6,869,655 - Share of profit for the year 189 - Foreign currency translation reserve 14 -
6,870,253 395
Notes to the Consolidated Financial StatementsFor the year ended June 30, 2015
P 150

LuckyRawji Holdings Limited (LRHL) is a joint venture between the Group and Rawsons Investments Limited. LRHL was incorporated with limited liability under the laws of British Virgin Islands. The Group holds 50 percent ownership interest in LRHL. No activity affecting the profit and loss account of LRHL has been carried out as of the balance sheet date.
The Group’s interest in LRHL’s assets and liabilities is as follows: 2015 2014 PKR in ‘000’
Non-current assets 5,402,428 1,628,488
Current assets excluding cash and cash equivalents 7,056,502 124,275
Cash and cash equivalents 1,453,642 1,018,740
Liabilities (172,066) (2,770,713)
Net assets (100%) 13,740,506 790
Company’s share of net assets (50%) 6,870,253 395
8.3 NutriCo Pakistan (Pvt) Limited
Investment made during the year 720,000 -
Share of profit for the year 202,224 -
Dividend income (150,000) -
772,224 -
The Group has a 30% interest in NutriCo Pakistan (Private) Limited (the associate), which is involved in marketing and
distribution of infant milk and nutritional products.
8.4 Represents 20% equity investment in Yunus Energy Limited comprising 20,361,500 shares @ PKR 10/- each made during the year.
P 151

Note 2015 2014 PKR in ‘000’
9 LONG-TERM LOANS AND ADVANCES
Considered good
due from executives and employees 9.1 350,123 273,597
Advances 9.2 55,373 1,438,242
405,496 1,711,839
9.1 Due from executives and employees
Due from executives 9.1.1 & 9.1.2 275,680 231,590
Less: Receivable within one year
shown under current assets 72,095 72,308
203,585 159,282
Due from employees 198,661 156,850
Less: Receivable within one year shown under current assets 52,123 42,535
146,538 114,315
350,123 273,597
Outstanding for period:
- less than three years but over one year 141,087 172,605
- more than three years 209,036 100,992
350,123 273,597
9.1.1 Loans given to executives and employees are in accordance with the Group policy. These loans are interest free and are
secured against the gratuity of respective employees. These loans are carried at cost due to practicality and materiality of the
amounts involved.
9.1.2 Reconciliation of the carrying amount of loans to executives (key management personnel):
Note 2015 2014 PKR in ‘000’
As at July 01 231,590 205,346 Disbursements during the year 134,265 154,760 Repayments during the year (90,175) (128,516) 9.1.3 275,680 231,590
9.1.3 The maximum aggregate amount of loans due from the Executives at the end of any month during the year was PKR 275.68
million (2014: PKR 221.590 million).
9.2 This represents advance given to Sui Southern Gas Company Limited in respect of additional gas line which will be adjusted
after the commissioning of gas line in 48 equal monthly installments.
Notes to the Consolidated Financial StatementsFor the year ended June 30, 2015
P 152

Note 2015 2014 PKR in ‘000’
10 LONG-TERM DEPOSITS AND PREPAYMENTS
Deposits 30,498 28,854 Prepayments 3,454 2,164
33,952 31,018 11 STORES, SPARES AND CONSUMABLES
Stores 11.1 1,585,196 2,999,946 Spares 11.2 4,467,607 4,044,950 Consumables 114,201 112,679
6,167,004 7,157,575 Less: Provision for slow moving spares 11.3 245,117 205,073
5,921,887 6,952,502
11.1 This includes stores in transit, mainly coal, of PKR 171.216 mllion (2014: PKR 472.172 million) as at the balance sheet date.
11.2 This includes spares in transit of PKR 92.626 million (2014: PKR 81.543 million) as at the balance sheet date.
Note 2015 2014 PKR in ‘000’
11.3 Movement in provision for slow moving spares is as follows:
Opening balance 205,073 195,073 Provision during the year 30 & 32 40,044 10,000
245,117 205,073
12 STOCK-IN-TRADE
Raw and packing material 12.1 & 12.2 2,648,792 2,927,290 Work-in-process 710,130 793,875 Finished goods 3,322,299 2,537,832
6,681,221 6,258,997 Less: Provision for slow moving and obsolete stocks - Raw and packing material 43,659 8,771 - Finished goods 113,408 4,026 157,067 12,797
6,524,154 6,246,200 12.1 This includes raw and packing material in transit amounting to PKR 433.803 million (2014: PKR 791.850 million) as at the
balance sheet date. 12.2 Raw and packing materials held with various toll manufacturers amounts to PKR 556.110 million (2014: PKR 423.255
million).
P 153

Note 2015 2014 PKR in ‘000’
13 TRADE DEBTS
Considered good Bills receivable - secured 1,262,581 1,512,183 Others - unsecured 13.1 2,422,359 1,618,673
3,684,940 3,130,856 Considered doubtful 49,279 93,664
3,734,219 3,224,520 Less: Provision for - Doubtful debts 13.2 49,279 93,664 - Discounts payable on sales 211,647 169,432 260,926 263,096
3,473,293 2,961,424
13.1 The above balances include amounts due from the following associated undertakings:
Yunus Textile Mills Limited 15,190 26,397
Lucky Textile Mills Limited 4,231 1,162
Lucky Knits (Private) Limited 499 3,340
NutriCo Pakistan (Private) Limited 11,095 -
Feroze 1888 Mills Limited 377 -
31,392 30,899
13.2 Movement in provision for doubtful debts is as follows:
Opening balance 93,664 94,802
Provision during the year 31 & 32 34,487 1,556
Write-off during the year (78,872) (194)
Reversal during the year - (2,500)
49,279 93,664
14 LOANS AND ADVANCES
Considered good
Current portion of loans and advances due from:
Employees 52,227 42,535
Executives 78,308 72,308
130,535 114,843
Advances to suppliers and others 448,074 239,782
578,609 354,625
Considered doubtful - 7,292
578,609 361,917
Less: Provision for doubtful loans and advances - 7,292
578,609 354,625
Notes to the Consolidated Financial StatementsFor the year ended June 30, 2015
P 154

Note 2015 2014 PKR in ‘000’
15 TRADE DEPOSITS AND SHORT-TERM PREPAYMENTS
Trade Deposits
Containers 420 - Coal supplier 1,000 1,000 Karachi Port Trust 12,600 11,550 Utilities 905 735 Others 36,916 33,655
51,841 46,940 Prepayments
Insurance 12,423 17,597 Rent 2,944 4,875 Others 397,184 208,598 412,551 231,070
464,392 278,010 16 OTHER RECEIVABLES - unsecured
Considered good Duties, sales tax and octroi refunds due 373,717 287,020 Commission and discounts receivable 25,002 22,612 Receivable from principal 16.1 483,504 1,068,427 Rebate on export sales 79,869 67,917 Due from Collector of Customs 16.2 19,444 19,444 Sales Tax adjustable 103,644 - Hyderabad Electricity Supply Company (HESCO) 16.3 753,792 166,019 Insurance claim receivable 22,900 50,782 Others 161,594 432,252
2,023,466 2,114,473 Considered doubtful 1,622 20,237
2,025,088 2,134,710 Less: Provision for doubtful receivables 16.4 1,622 20,237
2,023,466 2,114,473 16.1 This includes receivable amounting to PKR 401.706 million (2014: PKR 1,019.8 million) from foreign vendor in relation to
margin support guarantee. 16.2 The Holding Company imported cement bulkers during October 19, 2006 to December 05, 2006 under SRO 575(1) of 2006
dated June 05, 2006 for export of loose cement which provided concessionary rate of import duty to an industrial concern. The Holding Company claimed exemption of duty at the time of port clearance, however, the Collector of Customs passed order allowing provisional release of consignment subject to final approval from the Federal Board of Revenue (FBR) and deposit of post dated cheques for the differential amount of duty. The Holding Company deposited three post dated cheques aggregating to PKR 19.444 million for three different consignments of cement bulkers and simultaneously approached the FBR for giving direction to the Collector of Customs, Karachi.
The FBR moved a summary to the Federal Government / ECC on the representation of the Holding Company and finally issued
SRO 41(1) of 2007 on January 07, 2007 which clarified that the imported cement bulkers were also entitled for concessional rate of duty of 5%. The Collector of Customs instead of releasing the post dated cheques, encashed the same on the plea that the effect of SRO will not be given to the Holding Company with retrospective effect despite the fact that the said classification was issued on the representation of the Holding Company.
P 155

Notes to the Consolidated Financial StatementsFor the year ended June 30, 2015
The Holding Company filed a writ petition before the High Court of Sindh at Karachi in 2007 challenging the illegal and malafide act of encashment of post dated cheques. Subsequent to the year end, High Court of Sindh passed the order in favour of the Holding Company and has ordered the Collector of Customs to refund the amount collected within one month from the date of judgment. Efforts are currently being made to receive the same.
16.3 The balance represents receivable from HESCO which is overdue but not impaired and pertains to electricity supplied for the period from February to June 2015. The Holding Company has filed a writ petition in Sindh High Court against HESCO for non- payment of its overdues.
2015 2014
PKR in ‘000’
16.4 Movement in provision for doubtful receivables is as follows:
Opening balance 20,237 57,312
Reversal for the year (18,615) (37,075)
1,622 20,237
17 TAX REFUNDS DUE FROM THE GOVERNMENT
A dispute with respect to the calculation of excise duty on retail price of cement arose between the Holding Company and the Federal Board of Revenue (FBR) from the very first day the Holding Company started sales of cement in 1996. The FBR’s point of view was that excise duty be calculated on the declared retail price, inclusive of excise duty whereas the Holding Company contended that the excise duty would not be included in retail price for the calculation of the excise duty payable to the Government. In June 2, 1997, the Holding Company filed a writ petition before the Peshawar High Court seeking judgment on this matter. The dispute related to the period from June 26, 1996 to April 19, 1999 after which the FBR changed the mechanism of levying excise duty from percentage of retail price to a fixed amount of duty at the rate of PKR 1,400 per ton. The Peshawar High Court after hearing both the parties issued a detailed judgment, operating paragraph of which is reproduced as follows:
“For the reasons we accept the petitions declare, that present system of realization of duties of excise on the “Retail
Price” inclusive of excise duty is illegal and without lawful authority, the duties of excise on cement must not form part of retail price and the petitioners are not liable to pay duties of excise forming part of the retail price of cement.”
Simultaneously, a similar nature of dispute arose between various beverage companies operating in the provinces of Sindh and Punjab and accordingly they also filed petitions before the Honourable High Courts of Sindh and Lahore respectively. Both the Courts also decided the case against the method of calculation of excise duty as interpreted by the FBR.
The FBR preferred an appeal before the Honourable Supreme Court of Pakistan against the judgments of all three High Courts
of the country. A full bench of the Honourable Supreme Court of Pakistan heard the legal counsel of all the parties and finally announced the judgment on April 14, 2007, upholding the judgments of the High Courts and dismissed the appeal of the FBR.
As a result of the full bench judgment of the Honourable Supreme Court of Pakistan, the Holding Company filed a refund claim
of PKR 538.812 million on May 08, 2007 with the Collector of Central Excise and Sales Tax, Peshawar, who had earlier collected the same due to incorrect interpretation of law. The Holding Company on the basis of legal opinions obtained, recognised this refund claim in the consolidated financial statements for the year ended June 30, 2007.
A review petition was also filed by the Federal Board of Revenue (FBR) in the Honourable Supreme Court of Pakistan. The
Honourable Supreme Court of Pakistan vide its order dated January 27, 2009 dismissed the review petition filed by the FBR and upheld its earlier decision which was in favour of the Holding Company.
While verifying the refund claim, the Collector of Excise and Sales Tax Peshawar issued show cause notice to the Holding
Company, raising certain objections against the release of said refund including an objection that the burden of this levy has been passed on to the end consumer. The Holding Company challenged this show cause notice in the Honourable Peshawar High Court and took the stance that this matter has already been dealt with at the Honourable Supreme Court of Pakistan level, based on the doctrine of res judicata. The Honourable Peshawar High Court granted a stay order to the Holding Company
P 156

against any adverse proceeding by the FBR in this case. During the year ended June 30, 2013, the Holding Company filed a complaint before the Federal Tax Ombudsman (FTO) with
a request that the FBR may be directed for early issuance of refund along-with the compensation for the delayed refund. The FTO directed the FBR to verify the claim of the Holding Company and submit a report in the matter. Subsequently, the FBR on the basis of audit conducted submitted a report to the FTO. However, the Holding Company did not agree to the findings of the department and argued before the FTO that the report submitted by the department is not based on the facts of the case.
After hearing the arguments of both the parties, the FTO forwarded its recommendations/findings to the Secretary, Revenue
Division, Islamabad through its order dated November 22, 2013. FBR filed representation, before the President of Pakistan against the recommendations of the FTO under section 32 of Federal
Tax Ombudsman Ordinance, 2000. However, President of Pakistan through its order has endorsed the recommendations of FTO. Subsequent to the year end, FBR filed a writ petition before the Peshawar High Court challenging the decision of the FTO. The Peshawar High Court has suspended the operations of the orders of FTO and President of Pakistan on July 14, 2015 till further orders. The Holding Company is in the process of challenging the stay granted by the Honorable Peshawar High Court through filing a writ petition. Pending a final decision in this matter, tax refunds from the Government have not been adjusted in these consolidated financial statements.
Note 2015 2014 PKR in ‘000’
18 CASH AND BANK BALANCES
Sales collection in transit 892,404 556,066
Cash at bank - on current accounts 1,607,364 3,177,473
- on deposit accounts 18.1 15,648,690 7,979,069
17,256,054 11,156,542
Cash in hand 7,141 10,640
18,155,599 11,723,248
18.1 Includes security deposits from customer that are placed with various banks at pre-agreed rate maturing at various dates. The mark-up on deposit accounts ranges between 5% to 10.25% (2014: 8% to 9%) and these deposits are readily encashable without any penalty.
Note 2015 2014
PKR in ‘000’
19 SHARE CAPITAL
Authorised capital
500,000,000 (2014: 500,000,000) Ordinary shares of PKR 10/- each 5,000,000 5,000,000 Issued, subscribed and paid-up capital 305,000,000 (2014: 305,000,000) Ordinary shares of PKR 10/- each issued for cash 19.1 3,050,000 3,050,000 18,375,000 (2014: 18,375,000) Ordinary shares of PKR 10/- each issued as bonus shares 183,750 183,750
3,233,750 3,233,750
P 157

19.1 During the year ended June 30, 2008, the Holding Company was admitted to the official list of the Financial Services Authority and to the London Stock Exchange for trading of Global Depository Receipts (GDRs) issued by the Holding Company on the Professional Securities Market of the London Stock Exchange. The GDR issue constituted an offering to qualified institutional buyers in the United States under Rule 144A and to non US persons outside the United States (US) under Regulation - S of the US Securities Act of 1933. The GDRs have also been included for trading on the International Order Book system of the London Stock Exchange, which will make the GDRs issued under Rule 144A to become eligible for trading by qualified institutional buyers in the Portal Market; a subsidiary of the NASDAQ Stock Market, Inc in the United States. The Holding Company has issued 15,000,000 GDRs each representing four ordinary equity shares at an offer price of US$. 7.2838 per GDR (total receipt being US$. 109.257 million). Accordingly, based on an exchange rate of PKR 65.90 = US$ 1.00 (which was the exchange rate on the date of final offering circular relating to the GDR issue made by the Holding Company) 60,000,000 ordinary equity shares of a nominal value of PKR 10 each of the Holding Company were issued at a premium of PKR 110 per ordinary equity share (total premium amount being PKR 6,600 million).
The holders of GDRs are entitled, subject to the provisions of the Deposit Agreement, to receive dividend, if any and rank
pari passu with other equity shareholders in respect of dividend. However, the holders of GDRs have no voting rights or other direct rights of shareholders with respect to the equity shares underlying such GDRs. Subject to the terms and restrictions set out in the offering circular dated May 08, 2008, the deposited equity shares in respect of which the GDRs were issued may be withdrawn from the depository facility. Upon withdrawal, the holders will rank pari passu with other equity shareholders in respect of dividend, voting and other direct rights of shareholders.
Note 2015 2014 PKR in ‘000’
20 RESERVES
Capital reserve
Share premium 7,343,422 7,343,422 Revenue reserves
General reserve 36,304,636 27,871,271 Foreign currency translation reserve 1,854 (63,554) Unappropriated profit 14,540,906 11,994,719
50,847,396 39,802,436
58,190,818 47,145,858
Notes to the Consolidated Financial StatementsFor the year ended June 30, 2015
P 158

Installments Note 2015 2014 PKR in ‘000’
21 LONG-TERM FINANCE
Secured
From banking companies / financial institutions: Long-term finance utilized under mark-up arrangements from the following: Allied Bank Limited 16 quarters - 80,912 Allied Bank Limited 16 quarters - 46,586 Faysal Bank Limited 14 semi annual - 343,591 Habib Bank Limited 14 semi annual - 543,435 Standard Chartered Bank (Pakistan) Limited - Islamic finance 6 semi annual 21.1 400,000 800,000 Meezan Bank Limited - Islamic finance 12 quarters 21.2 277,778 500,000 Allied Bank Limited 16 quarters 21.3 750,001 1,000,000 United Bank Limited 40 quarters 21.4 221,719 - United Bank Limited 20 quarters 21.5 800,000 - Bank Al Habib Limited 20 quarters 21.6 900,000 1,000,000 Meezan Bank Limited 10 semi annual 21.6 1,800,000 2,000,000 Habib Bank Limited 20 quarters 21.6 699,300 777,000 Soneri Bank limited 10 semi annual 21.7 450,000 500,000 Bank Alfalah Limited 20 quarters 21.7 1,350,000 1,500,000 Foreign currency loan 21.8 3,002,472 2,055,123
10,651,270 11,146,647 Less : Current portion of long-term finance (1,797,105) (1,163,569)
8,854,165 9,983,078
21.1 The Group has obtained long-term loan of PKR 1,000 million in June 2013 from Standard Chartered Bank (Pakistan) Limited
under Islamic Diminishing Musharaka for a period of 3 years (including 6 month grace period). Repayment of PKR 400 million was made during the current year. The rental payment is charged at relevant KIBOR plus 0.25% p.a. payable on semi-annual basis. This facility is secured by a ranking charge which is to replaced by a first pari passu hypothecation charge on the present and future fixed assets of the Group’s Polyester Business located at Sheikhupura.
21.2 The Group has obtained long-term finance for PKR 500 million from Meezan Bank Limited under Islamic Diminishing Musharaka
for a period of 3 years (including 9 months grace period). The rental payment is charged at relevant KIBOR plus 0.25% p.a. payable on a quarterly basis. This facility is secured by a first pari passu hypothecation charge on the present and future Plant, Machinery and Equipment of the Group’s Soda Ash Business located at Khewra.
21.3 The Group has obtained long-term loan of PKR 1,000 million from Allied Bank Limited for a period of 4 years (including 1 year grace period). The rental payment is charged at relevant KIBOR plus 0.25% p.a. payable on a quarterly basis. This facility is secured by a first pari passu hypothecation charge on the present and future Plant, Machinery and Equipment of the Group’s Soda Ash Business located at Khewra.
21.4 The Group has obtained Long-Term Finance Facility (LTFF) for plant and machinery from United Bank Limited of PKR 221.719 million (limit: PKR 1,500 million) for a period of 10 years (including 2 years grace period), with the principal payable on quarterly basis. The mark-up is chargeable at fixed rate of 5% payable on quarterly basis. This facility is secured against first specific charge on the Property, Plant and Equipment of the Group’s Soda Ash Business located at Khewra. The loan has been refinanced by the State Bank of Pakistan under LTFF for Export Oriented Projects. The group repaid its previous LTFF’s from HBL and FBL in the last quarter of financial year 2015.
P 159

21.5 During the year, the Group has obtained long-term finance of PKR 800 million from United Bank Limited for a period of 5 years (including 2 years grace period). The interest payment is charged at relevant KIBOR plus 0.25% p.a. payable on quarterly basis. This facility is initially secured by a ranking charge to be subsequently replaced by the first pari passu hypothecation charge on present and future Plant, Machinery and Equipment of the Group’s Polyester Business located at Sheikhupura.
21.6 The facility is secured against joint exclusive pari passu letter of hypothecation over specific fixed assets of Yunus Textile Mills Limited (an associated undertaking) amounting to PKR 5.333 billion.
21.7 The facility is secured against exclusive joint pari passu letter of hypothecation amounting to PKR 2.667 billion of Plant, Machinery
and Equipment in favour of the banks to be created by Lucky Textile Mills Limited (an associated undertaking). 21.8 Represents aggregate of outstanding principal on un secured medium-term offshore facilities from a bank. At 30 June 2015 the
facilities bear interest at 3-month LIBOR plus a margin of 3.65% per annum (30 June 2014: 3-month LIBOR plus a margin of 3% per annum).
Note 2015 2014 PKR in ‘000’
22 LONG-TERM DEPOSITS
Cement stockists 22.1 27,966 29,691 Transporters 22.2 40,000 37,000 Others 1,280 1,280
69,246 67,971
22.1 These represent interest-free security deposits received from stockists and are repayable on cancellation or withdrawal of
stockist arrangement and are also adjustable against unpaid amount of sales. 22.2 These represent interest-free security deposits received from transporters and are repayable on cancellation or withdrawal of
contracts.
Note 2015 2014
PKR in ‘000’
23 DEFERRED LIABILITIES
Staff gratuity 23.1 1,094,133 732,276 Deferred tax liability 23.3 8,336,574 7,923,437
9,430,707 8,655,713
Notes to the Consolidated Financial StatementsFor the year ended June 30, 2015
P 160

23.1 The amounts recognized in the balance sheet, based on the recent actuarial valuation carried on June 30, 2015, are as follows:
2015 2014 Funded Unfunded Funded Unfunded Pension Gratuity Total Pension Gratuity Total PKR in ‘000’
23.1.1 Present value of defined benefit obligation 1,094,133 732,276 23.1.2 Movement in the liability recognized in the balance sheet are as follows:
Opening balance (301,428) 196,734 (104,694) 732,276 732,276 (225,777) 190,112 (35,665) 631,959 631,959 Actuarial (gain) / loss recognised in other comprehensive income (87,275) (83,617) (170,892) 75,042 75,042 (68,533) 9,942 (58,591) 6,589 6,589 Net (reversal) / charge for the year (21,625) 60,048 38,423 338,593 338,593 (7,118) 59,858 52,740 147,888 147,888
(410,328) 173,165 (237,163) 1,145,911 1,145,911 (301,428) 259,912 (41,516) 786,436 786,436 Payments made during the year - (60,787) (60,787) (51,778) (51,778) - (63,178) (63,178) (54,160) (54,160)
Closing balance (410,328) 112,378 (297,950) 1,094,133 1,094,133 (301,428) 196,734 (104,694) 732,276 732,276 23.1.3 The amount recognized in the profit and loss account is as follows:
Current service cost 16,808 37,678 54,486 98,666 98,666 17,153 32,702 49,855 89,067 89,067 Interest cost 113,592 69,378 182,970 101,312 101,312 102,896 54,286 157,182 68,936 68,936 Expected return on plan assets (152,025) (48,038) (200,063) - - (127,167) (37,245) (164,412) - - Past service cost - - - 139,645 139,645 - 10,115 10,115 (10,115) (10,115) - 1,030 1,030 (1,030) (1,030) - - - - -
(21,625) 60,048 38,423 338,593 338,593 (7,118) 59,858 52,740 147,888 147,888
2015 2014
23.1.4 Principal actuarial assumptions used are as follows:
Expected rate of increase in salary level 12.00% 11.00% Valuation discount rate 10.50% 13.50%
23.1.5 Sensitivity analysis
A sensitivity analysis for the above principal actuarial assumptions as of the balance sheet date showing how the defined benefit obligation would have been affected by changes in the said assumptions is as follows:
Increase Decrease by 1 % by 1 % Expected rate of increase in salary level 182,831 109,104 Valuation discount rate (184,388) (138,326)
P 161

Notes to the Consolidated Financial StatementsFor the year ended June 30, 2015
23.1.6 Description of the risks to the Group
The defined benefit plan exposes the Group to the following risks:
Mortality risks - The risk that the actual mortality experience is different. The effect depends on the beneficiaries’ service/age distribution and the benefit.
Final salary risks - The risk that the final salary at the time of cessation of service is greater than what was assumed. Since the benefit is calculated on the final salary, the benefit amount increases similarly.
Withdrawal risks - The risk of higher or lower withdrawal experience than assumed. The final effect could go either way
depending on the beneficiaries’ service / age distribution and the benefit.
2015 2014
(Unaudited)
PKR in ‘000’
23.2 Provident fund
Size of the fund 1,018,560 1,269,506 Cost of investments made 969,253 1,127,747 Percentage of investments made 95% 89% Fair value of investments 994,698 1,192,093
23.2.1 Break-up of investments of provident fund
Break-up of investments in terms of amount and percentage of the size of the provident fund are as follows: 2015 2014 (Unaudited) (Unaudited) Investment % of Investment Investment % of Investment as size of the fund as size of the fund PKR in ‘000’ PKR in ‘000’
On fair value
Pakistan Investment Bonds 581,239 58% 854,999 72% Treasury Bill 8,552 1% 49,604 4% Short Term Deposit Account 18,000 2% - 0% Mutual Funds 97,346 10% 81,682 7% Shares 289,561 29% 196,142 16% Term Finance Certificates - 0% 9,666 1%
994,698 100% 1,192,093 100% Investments out of provident fund have been made in accordance with the provisions of the section 227 of the Companies
Ordinance, 1984 and the rules formulated for this purpose. 2015 2014 PKR in ‘000’
23.3 Deferred tax liability
This comprises of the following: - Difference in tax and accounting bases of fixed assets 8,914,361 8,528,034 - Provisions (577,787) (604,597) 8,336,574 7,923,437
P 162

Note 2015 2014 PKR in ‘000’
24 TRADE AND OTHER PAYABLES
Creditors 24.1 1,891,677 3,175,551 Bills payable 3,360,031 2,338,350 Accrued liabilities 24.2 6,833,037 3,264,426 Customers running account 700,392 322,459 Retention money 28,750 21,339 Sales tax payable 338 71,638 Excise and other government levies 354,927 256,489 Unclaimed and unpaid dividend 161,223 128,084 Workers’ profit participation fund (WPPF) payable 24.3 872,006 412,217 Workers’ welfare fund (WWF) payable 401,808 51,539 Distributors’ security deposits - payable on termination of distributorship 24.4 104,761 106,142 Advances from customers 24.5 155,339 223,874 Contractors’ earnest / retention money 10,946 9,809 Payable for capital expenditure 812,437 329,509 Provision for compensated absences 24.6 31,249 31,249 Others 100,224 157,761
15,819,145 10,900,436
24.1 This includes PKR 3.380 million (2014: PKR Nil) on account of exchange gain / loss on forward exchange contracts. 24.2 It includes PKR 332.766 million (2014: PKR 380.608 million) in respect of accrual of gas charges.
Note 2015 2014 PKR in ‘000’
24.3 The movement of WPPF payable is as follows:
Opening balance 412,217 348,914 Allocation for the year 34 1,003,466 872,386 Interest on funds utilized by the Group 33 9,534 5,109
1,425,217 1,226,409 Payments during the year (553,211) (814,192)
872,006 412,217
24.4 Interest on security deposits from certain distributors is payable at 10% (2014: 8.8%) per annum.
24.5 It includes amounts due to the following associated undertakings (related parties):
2015 2014 PKR in ‘000’ Gadoon Textile Mills Limited 238 27,910 Yunus Textile Mills Limited 267 197 Fazal Textile Mills Limited 342 764
847 28,871 24.6 This figure is based on actuarial valuation and estimation.
P 163

Note 2015 2014 PKR in ‘000’
25 ACCRUED MARK-UP
Long-term finance - 3,051 Short-term borrowings and running finance 165,210 217,453 Accrued interest on expansion project - 3,152
165,210 223,656 26 SHORT-TERM BORROWINGS AND RUNNING FINANCE
Foreign currency loan - 267,368 Running finance 26.1 1,591,285 - Export refinance 26.2 241,962 170,000
1,833,247 437,368
26.1 Short-term borrowings and running finance from various banks aggregated to PKR 5,196 million (2014: PKR Nil) and carry mark-up during the year ranging from relevant KIBOR + 0.10% to 1.00% per annum with an average mark-up rate of relevant KIBOR + 0.28% on utilized limits (2014: relevant KIBOR + 0.20% to 1.00% per annum with an average mark-up rate of relevant KIBOR + 0.20% on utilized limits). These facilities are secured by hypothecation charge over the present and future stock-in-trade and book debts of the Group.
26.2 The Group has export refinance facility of upto PKR 800 million (2014: PKR 200 million) available from Faysal Bank Limited as at
June 30, 2015 out of which PKR 242 million was utilized (2014: PKR 170 million). The above export refinance facility is secured by first pari passu hypothecation charge. The export refinance facility carries mark-up at State Bank of Pakistan rate (currently 5%) + 0.25% per annum (2014: SBP rate 8.4% + 0.25% per annum).
27 CONTINGENCIES AND COMMITMENTS CONTINGENCIES 27.1 The Honourable Supreme Court of Pakistan while disposing off an appeal of the Collector of Customs, Karachi has issued
a judgment on July 28, 2009 whereby it has set aside the earlier order of the Honourable Peshawar High Court decided in favour of the Holding Company on the issue of plant and machinery imported under SRO 484(I)/92 dated May 14, 1992 after obtaining approvals from the concerned ministries. On August 20, 2009 the Holding Company filed a review petition which was subsequently deposed off by Honourable Supreme Court on May 8, 2014. The Customs department issued recovery notice on which, the Holding Company has filed a Constitution Petition in the Honourable Sindh High Court which is currently pending. The amount of disputed levy is not ascertainable at this stage as no order was earlier framed by the Collector of Customs. Hence, no provision has been made against the same in these consolidated financial statements.
27.2 The Holding Company was entitled to sales tax exemption on cement produced by it from the date of commissioning to
June 30, 2001 vide SROs 580(1)/91 and 561(1)/94 dated 27-06-1991 and 09-06-1994 respectively. In June 1997, the Federal Government withdrew the sales tax exemption from the entire cement industry and deprived the Holding Company from the advantage of its sales tax exemption. Being aggrieved, the Holding Company filed a writ petition in the Peshawar High Court. Subsequently, the sales tax exemption was restored on September 5, 2000. The writ petition was therefore withdrawn on legal advice but at the same time a suit was filed for compensation. The Civil Judge, Peshawar, has granted the ex-parte decree in favor of the Holding Company amounting to PKR 1,693.61 million along with interest of 14% per annum until the said amount is actually paid.
On August 3, 2011, the Holding Company filed an execution petition for realization of the decretal amount as per the decree
granted by the civil court on November 20, 2009. The Civil Judge, Peshawar, however, dismissed the recovery suit of the Holding Company on December 18, 2012. Dismissal of the recovery suit by the lower court has been challenged by the Holding Company in Peshawar High Court on March 9, 2013. The case is still pending before the Peshawar High Court.
Notes to the Consolidated Financial StatementsFor the year ended June 30, 2015
P 164

27.3 The Competition Commission of Pakistan passed a single order on August 27, 2009 against all the cement manufacturers of the country on the alleged ground of formation of cartel for marketing arrangement and imposed a penalty at the rate of 7.5% of total turnover of each company consisting of both local and export sales. The amount of penalty imposed on the Holding Company is PKR 1,271.84 million which has been challenged in the Courts of Law. The aforementioned case is still pending with the Courts of Law. The Holding Company’s legal counsel is confident that the Holding Company has a good case and there are reasonable chances of success to avoid the penalty, hence, no provision for the above has been made in these consolidated financial statements.
27.4 The Collectorate of Customs has raised an additional demand of PKR 71.938 million against a Subsidiary Company (ICI) on the ground that the Subsidiary Company is classifying two of its imported product in wrong PCT Heading. The Subsidiary Company has taken up the matter in high court as well as with Custom authorities considering that the same HS Code is being used globally as per manufacturer’s product specification. Further, also on the basis of an independent laboratory report the Subsidiary Company is confident that there is no merit in the claim and is expecting favorable decision, therefore no provision has been made in this respect in these consolidated financial statements.
27.5 The Holding Company is defending various suits filed in various courts of Pakistan for sums, aggregating PKR 900 million.
However, the Holding Company’s management is confident, based on the advice of its legal advisors, that these suits will be decided in its favor and, accordingly, no provision has been made for any liability against these law suits in these consolidated financial statements.
27.6 In September 2014, the Federal Government promulgated Gas Infrastructure Development Cess (GIDC) Ordinance No. VI of 2014 to circumvent earlier decision of the Honorable Supreme Court on the subject, where it upheld that the earlier introduction of GIDC Act of 2011 was unconstitutional and ultravires on the grounds that GIDC was a ‘Fee’ and not a ‘Tax’. In May 2015, the Government passed the GIDC Act 2015.
The Holding Company has challenged GIDC Act, 2015 and filed writ petition in the Peshawar High Court (PHC) and Sindh High Court (SHC) including retrospective treatment of the provision of the GIDC Act. The Court has granted stay against charging of the GIDC Act, 2015. The Holding Company has not recorded GIDC amounting to PKR 760.3 million in these consolidated financial statements as it is confident that the decision of the case will be in its favor.
27.7 Also refer to notes 16.1, 16.3, 17 and 43 to these consolidated financial statements for income tax contingencies.
2015 2014
PKR in ‘000’
COMMITMENTS
27.8 Capital commitments
Plant and machinery under letters of credit 2,780,083 2,840,266 27.9 Other commitments
Stores, spares and packing material under letters of credit 2,162,633 1,870,971
Stand by Letter of Credit issued by the Holding Company 500,000 - Bank guarantees issued on behalf of the Holding Company and its subsidiaries 1,073,288 942,233
Post dated cheques 450,436 555,150
P 165

27.9.1 During the year, the Group invested PKR 720 million in the NutriCo Pakistan (Private) Limited (Morinaga business) out of total commitment of PKR 960 million as reported earlier through signing of shareholders and share subscription agreements with Unibrands. At the Balance sheet date PKR 240 million remains as a commitment.
27.9.2 Commitments for rentals under operating lease / Ijarah contracts in respect of vehicles amounting to PKR 134.316 million (2014: PKR 155.610 million) are as follows:
Year 2015 2014 PKR in ‘000’
2014 - 15 - 62,223 2015 - 16 57,839 49,215 2016 - 17 45,988 34,969 2017 - 18 23,848 9,203 2018 - 19 6,641 -
134,316 155,610 Payable not later than one year 57,839 62,223 Payable later than one year but not later than five years 76,477 93,387
134,316 155,610
27.9.3 Outstanding foreign exchange contracts as at June 30, 2015 entered into by the Group amounted to PKR 383 million (2014: PKR Nil).
Notes to the Consolidated Financial StatementsFor the year ended June 30, 2015
P 166

28
OPER
ATIN
G SE
GMEN
T RES
ULTS
Cem
ent
Polye
ster
Soda
Ash
Lif
e Scie
nces
Ch
emica
ls
LCLIH
L/IC
I Pow
erGe
n/Ot
hers
Grou
p Gr
oup
No
te
2015
20
14
2015
20
14
2015
20
14
2015
20
14
2015
20
14
2015
20
14
2015
20
14
PKR i
n ‘00
0’
Gr
oss s
ales
Ex
ports
13
,979,1
21
15,23
4,768
–
–
82
1,695
50
5,250
–
–
4,
755
52,76
8 –
–
14
,805,5
71
15,79
2,786
Inter
–seg
men
t
–
–
–
–
–
–
–
–
14,66
2 5,
857
829,3
02
1,06
8,140
84
3,964
1,
073,9
97
Lo
cal
39,94
0,189
36
,178,1
58
16,67
3,511
19
,667,4
33
11,38
5,584
10
,427,9
43
9,10
6,882
7,
504,5
84
4,54
9,642
4,
479,0
76
–
–
81,65
5,808
78
,257,1
94
53,91
9,310
51
,412,9
26
16,67
3,511
19
,667,4
33
12,20
7,279
10
,933,1
93
9,10
6,882
7,
504,5
84
4,569
,059
4,537
,701
829,3
02
1,06
8,140
97
,305,3
43
95,12
3,977
Com
miss
ion /
toll i
ncom
e
–
–
–
–
–
–
–
– 51
,879
61,60
5 –
–
51
,879
61,60
5
Tu
rnov
er
53,91
9,310
5
1,412
,926
16,6
73,51
1 1
9,667
,433
12,2
07,27
9 1
0,933
,193
9,10
6,882
7,
504,5
84
4,62
0,938
4,
599,3
06
829
,302
1,06
8,140
97
,357,2
22
95,1
85,58
2
Sales
tax a
nd ex
cise d
uty
8
,487,2
45
7,70
8,848
32
6,967
38
5,692
1,
658,4
39
1,51
8,523
12
5,378
40
,978
491,3
30
479,6
80
120,4
97
155,2
00
11,20
9,856
10
,288,9
21
Reba
tes a
nd co
mm
ission
670,7
58
620,9
09
472,3
58
439,3
58
414,1
20
425,1
96
1,24
7,771
85
9,787
34
2,257
31
5,968
-
-
3,
147,2
64
2,66
1,218
9,15
8,003
8,
329,7
57
799
,325
825,0
50
2,07
2,559
1,
943,7
19
1,37
3,149
90
0,765
83
3,587
79
5,648
12
0,497
15
5,200
14
,357,1
20
12,95
0,139
44,7
61,30
7 43
,083,1
69
15,8
74,18
6 18
,842,3
83
10,13
4,720
8,
989,4
74
7,73
3,733
6,
603,8
19
3,78
7,351
3,
803,6
58
708,8
05
912
,940
83,0
00,10
2 8
2,235
,443
Co
st of
turn
over
30
24
,578,2
19
24,39
3,064
15
,934,5
90
19,20
9,115
7,
490,8
88
6,81
7,158
5,
614,3
47
4,79
2,331
3,
090,7
28
3,11
3,459
60
5,628
78
3,145
57
,312,6
60
59,10
8,272
Gr
oss p
rofit
20,1
83,08
8 18
,690,1
05
(60,4
04)
(366
,732)
2,
643,8
32
2,17
2,316
2,
119,3
86
1,81
1,488
69
6,623
69
0,199
10
3,177
12
9,795
25
,687,4
42
23,12
7,171
Di
stribu
tion c
osts
31
3,12
7,018
3,
382,1
56
79,62
7 70
,575
177,0
73
149,0
63
1,01
9,421
82
6,232
25
0,049
21
0,335
-
-
4,
653,1
88
4,63
8,361
Adm
inistr
ative
expe
nses
32
91
7,635
76
0,269
31
6,308
31
8,942
29
6,525
27
9,521
22
4,975
20
6,668
16
1,810
12
5,604
67
,152
9,31
2 1,
984,1
65
1,70
0,316
Op
eratin
g res
ult
16
,138,4
35
14,54
7,680
(4
56,33
9)
(756
,249)
2,
170,2
34
1,74
3,732
8
74,99
0 77
8,588
28
4,764
35
4,260
36
,025
120
,483
19,05
0,089
16
,788,4
94 28
.1 Se
gmen
t asse
ts 29
.3 46
,739,7
20
43,92
8,057
9,
872,2
30
7,64
3,268
16
,559,6
07
15,88
8,823
9,
632,1
54
7,04
6,119
3,
450,5
34
3,19
1,493
57
6,212
2,
716,9
91
79,73
1,964
76
,819,1
98
28.2
Unall
ocate
d asse
ts
26,65
3,404
11
,196,8
64
106,3
85,36
8 88
,016,0
62
28.3
Segm
ent li
abiliti
es
29.4
12,69
9,507
9,
620,7
89
12,75
6,801
11
,336,3
35
3,05
4,489
4,
389,7
91
2,35
6,695
2,
555,6
58
918,4
28
1,02
4,907
18
6,164
1,
092,8
23
25,40
5,051
19
,847,7
76
28.4
Unall
ocate
d liab
ilities
12,48
4,517
11
,584,0
15
37,88
9,568
31
,431,7
91
28.5
Inter
unit
curre
nt ac
coun
t bala
nces
of re
spec
tive b
usine
sses
have
been
elim
inate
d fro
m th
e tot
al.
28.6
Depr
eciati
on an
d amo
rtisa
tion
2,
289,7
64
2,07
3,303
78
8,164
68
0,968
1,
152,1
17
963,1
51
28,95
6 29
,134
83,45
1 47
,309
54,77
7 56
,909
4,39
7,229
3,
850,7
74
28.7
Capit
al ex
pend
iture
5,42
7,224
3,
072,2
10
1,86
9,978
1,
627,5
33
2,22
4,678
80
3,035
87
,956
43,00
8 29
,492
35,23
2 48
,969
21,69
5 9,
688,2
97
5,60
2,713
28.8
Inter
–seg
ment
prici
ng
Tra
nsac
tions
amon
g the
busin
ess s
egm
ents
are r
ecor
ded a
t arm
’s len
gth p
rices
using
adm
issibl
e valu
ation
met
hods
.
28.9
Ther
e wer
e no m
ajor c
usto
mer
of th
e Gro
up w
hich f
orm
ed pa
rt of
10%
or m
ore o
f the
Gro
up’s
reve
nue.
P 167

Note 2015 2014 PKR in ‘000’
29 RECONCILIATIONS OF REPORTABLE SEGMENT TURNOVER, COST OF SALES, ASSETS AND LIABILITIES
29.1 Turnover
Total turnover for reportable segments 28 97,357,222 95,185,582 Elimination of inter-segment turnover (38,336) (19,084) Elimination of inter-segment turnover from subsidiary (843,964) (1,068,140)
96,474,922 94,098,358 29.2 Cost of turnover
Total cost of turnover for reportable segments 30 57,312,660 59,108,272 Elimination of inter-segment purchases (38,336) (19,084) Elimination of inter-segment purchases from subsidiaries (843,964) (1,068,140)
56,430,360 58,021,048 29.3 Assets
Total assets for reportable segments 28 79,731,964 76,819,198 Unallocated assets included in: - taxation - net 997,518 1,502,916 - bank deposits 18 15,648,690 7,979,069 - long term investments 8 10,007,197 1,714,879
106,385,369 88,016,062
29.4 Liabilities
Total liabilities for reportable segments 28 25,405,051 19,847,776 Unallocated liabilities included in: - short-term borrowings and running finance 26 1,833,247 437,368 - long-term finance 21 10,651,270 11,146,647
37,889,568 31,431,791
Notes to the Consolidated Financial StatementsFor the year ended June 30, 2015
P 168

30 C
OST O
F TUR
NOVE
R
Cem
ent
Polye
ster
Soda
Ash
Lif
e Scie
nces
Ch
emica
ls
LCLIH
L/IC
I Pow
erGe
n/Ot
hers
Grou
p Gr
oup
No
te
2015
20
14
2015
20
14
2015
20
14
2015
20
14
2015
20
14
2015
20
14
2015
20
14
PKR i
n ‘00
0’
Sa
laries
, wag
es an
d ben
efits
30.1
1,75
1,070
1,
448,7
79
396,1
14
347,9
03
742,2
19
645,7
47
5,58
5 2,
832
49,00
5 44
,669
18,65
4 18
,725
2,96
2,647
2,
508,6
55
Ra
w m
ater
ial co
nsum
ed
1,
310,5
76
1,16
6,151
13
,023,7
30
15,18
2,224
2,
286,9
66
2,15
6,381
1,
815,2
24
1,87
6,164
1,
659,1
58
1,73
7,840
46
2,568
63
5,407
20
,558,2
22
22,75
4,167
Pack
ing m
ater
ial
30.2
3,07
6,061
2,
875,7
86
-
-
-
-
-
-
-
-
- -
3,07
6,061
2,
875,7
86
Fu
el an
d pow
er
13
,598,1
05
14,83
0,391
1,
328,1
46
1,89
0,218
2,
882,5
48
2,71
3,782
-
-
14
,434
12,48
1 33
,259
41,94
8 17
,856,4
92
19,48
8,820
Stor
es an
d spa
res c
onsu
med
2,09
7,793
1,
913,8
93
190,0
05
183,2
51
122,9
65
104,4
15
2
-
14,82
9 7,
697
27,02
5 17
,615
2,45
2,619
2,
226,8
71
Co
nver
sion f
ee pa
id to
cont
ract
man
ufac
ture
rs -
-
-
-
-
-
39
9,695
39
6,884
10
,554
10,05
6 -
-
41
0,249
40
6,940
Repa
irs an
d main
tena
nce
16
4,210
15
2,330
6,
587
4,59
6 85
6 89
1 29
0 60
8 5,
269
4,67
8 12
0 12
0 17
7,332
16
3,223
Depr
eciati
on /
amor
tizati
on
6.2 &
7.3
1,92
9,062
1,
750,5
28
748,4
43
644,9
33
1,11
7,460
92
3,435
83
4 26
2 61
,068
21,04
5 53
,694
56,90
9 3,
910,5
61
3,39
7,112
Insur
ance
81
,628
68,65
2 16
,772
24,03
1 25
,957
27,98
9 14
-
1,
894
1,11
0 1,
183
1,39
5 12
7,448
12
3,177
Writ
e-off
s
-
-
-
1,
708
-
20,70
6 -
-
-
75
1 -
82
-
23
,247
Pr
ovisi
on fo
r slow
mov
ing sp
ares
11
.3 25
,000
10,00
0 -
-
-
-
-
-
-
-
-
-
25
,000
10,00
0
Prov
ision
for s
low m
oving
pack
ing m
ater
ial
30,00
0 -
-
-
-
-
-
-
-
-
-
-
30
,000
-
Ea
rth m
oving
mac
hiner
y
224,4
73
213,0
34
-
-
-
-
-
-
-
-
-
-
224,4
73
213,0
34
Ve
hicle
runn
ing an
d main
tena
nce
53
,966
53,81
8 -
-
-
-
-
-
-
-
-
-
53
,966
53,81
8
Com
mun
icatio
n
13,95
3 13
,345
-
-
-
-
-
-
-
-
-
-
13,95
3 13
,345
M
ess s
ubsid
y
47,50
7 39
,514
-
-
-
-
-
-
-
-
-
-
47,50
7 39
,514
Tra
nspo
rtatio
n
24,65
2 17
,029
-
-
-
-
-
-
-
-
-
-
24,65
2 17
,029
Tra
vellin
g and
conv
eyan
ce
5,
730
7,78
7 -
-
-
-
-
-
-
-
-
-
5,
730
7,78
7
Inspe
ction
fee f
or el
ectri
cal in
stalla
tion
1,
279
1,27
9 -
-
-
-
-
-
-
-
-
-
1,
279
1,27
9
Rent
, rat
es an
d tax
es
3,
345
4,82
4 1,
008
936
1,18
5 1,
098
4,00
0 -
18
,369
14,32
1 42
0 42
0 28
,327
21,59
9
Printi
ng an
d sta
tione
ry
1,
523
3,35
6 -
-
-
-
-
-
-
-
-
-
1,
523
3,35
6
Excis
e dut
y
-
-
-
-
-
-
-
-
-
- 7,
171
9,32
1 7,
171
9,32
1
Tech
nical
fees
-
-
-
-
-
- 1,
386
1,02
0 2,
793
2,80
7 -
-
4,
179
3,82
7
Roya
lty
-
-
-
-
-
-
2,63
5 1,
629
-
-
-
-
2,63
5 1,
629
Ot
her m
anuf
actu
ring e
xpen
ses
10
7,874
99
,349
179,1
96
166,7
39
169,3
04
168,2
50
1,11
5 2,
887
17,36
7 17
,027
1,53
4 1,
203
474,6
50
455,4
55
24,54
7,807
24
,669,8
45
15,89
0,001
18
,446,5
39
7,34
9,460
6,
762,6
94
2,23
0,780
2,
282,2
86
1,85
4,740
1,
874,4
82
605,6
28
783,1
45
52,47
6,676
54
,818,9
91
W
ork-i
n-pr
oces
s:
Open
ing
628,5
33
373,3
56
143,3
43
170,5
16
-
-
16,44
7 59
,475
5,55
1 2,
850
-
-
793,8
74
606,1
97
Clo
sing
(614
,096)
(6
28,53
3)
(72,1
37)
(143
,343)
-
-
(1
3,391
) (1
6,447
) (1
0,506
) (5
,551)
-
-
(7
10,13
0)
(793
,874)
14,43
7 (2
55,17
7)
71,20
6 27
,173
-
-
3,05
6 43
,028
(4,95
5)
(2,70
1)
-
-
83,74
4 (1
87,67
7)
Co
st of
good
s man
ufactu
red
24
,562,2
44
24,41
4,668
15
,961,2
07
18,47
3,712
7
,349,4
60
6,76
2,694
2
,233,8
36
2,32
5,314
1
,849,7
85
1,87
1,781
60
5,628
78
3,145
52
,560,4
20
54,63
1,314
Finish
ed go
ods:
Op
ening
45
5,858
43
4,254
39
5,205
99
4,304
24
,303
78,76
7 1,
291,8
36
793,5
60
366,6
03
404,4
76
-
-
2,53
3,805
2,
705,3
61
Pu
rchas
es
- -
62,56
0 13
6,304
29
9,155
-
3,
780,8
29
2,97
7,682
1,
320,7
82
1,20
3,805
-
-
5,
463,3
26
4,31
7,791
Closin
g
(4
39,88
3)
(455
,858)
(4
84,38
2)
(395
,205)
(1
82,03
0)
(24,3
03)
(1,66
8,871
) (1
,291,8
36)
(433
,725)
(3
66,60
3)
-
-
(3,20
8,891
) (2
,533,8
05)
Pr
ovisi
on
-
-
-
-
- -
(23,2
83)
(12,3
89)
(12,7
17)
-
-
-
(36,0
00)
(12,3
89)
15,97
5 (2
1,604
) (2
6,617
) 73
5,403
14
1,428
5
4,464
3,
380,5
11
2,46
7,017
1,
240,9
43
1,24
1,678
-
-
4,
752,2
40
4,47
6,958
24,57
8,219
24
,393,0
64
15,93
4,590
19
,209,1
15
7,49
0,888
6,
817,1
58
5,61
4,347
4,
792,3
31
3,09
0,728
3,
113,4
59
605,6
28
783,1
45
57,31
2,660
59
,108,2
72
30.1
Thes
e inc
lude s
um of
PKR 2
65.41
9 milli
on (2
014:
PKR 1
43.70
4 milli
on) in
resp
ect o
f sta
ff re
tirem
ent b
enefi
ts.
30.2
Thes
e are
net o
f dut
y dra
w ba
ck on
expo
rt sa
les am
ounti
ng to
PKR 6
5.264
milli
on (2
014:
PKR 6
7.531
milli
on).
30.3
Includ
ed he
rein
is an
amou
nt PK
R 1.74
0 milli
on (2
014:
PKR 1
.740 m
illion
) cha
rged
with
in th
e Gro
up fo
r cer
tain
adm
inistr
ative
serv
ice ch
arge
s in a
ccor
danc
e with
the s
ervic
e lev
el ag
reem
ent w
hich h
as be
en el
imina
ted f
rom
the t
otal.
P 169

Cem
ent
Polye
ster
Soda
Ash
Lif
e Scie
nces
Ch
emica
ls
LCLIH
L/IC
I Pow
erGe
n/Ot
hers
Grou
p Gr
oup
No
te
2015
20
14
2015
20
14
2015
20
14
2015
20
14
2015
20
14
2015
20
14
2015
20
14
PKR i
n ‘00
0’
31
DIST
RIBUT
ION
COST
Sa
laries
and b
enefi
ts
31.1
109,3
06
88,88
2 51
,474
42,01
0 36
,762
24,62
4 49
0,878
33
1,964
95
,828
68,24
0 -
-
78
4,248
55
5,720
Logis
tics a
nd re
lated
char
ges
2,
681,2
30
2,97
7,342
7,
405
2,75
1 11
6,473
81
,359
89,80
5 61
,650
74,54
4 66
,133
-
-
2,96
9,457
3,
189,2
35
Lo
ading
and o
ther
s
129,7
80
112,2
46
-
-
-
-
-
-
-
-
-
-
129,7
80
112,2
46
Co
mm
unica
tion
4,
002
4,21
2 1,
166
1,15
5 1,
388
1,19
1 19
,917
17,98
2 3,
577
3,42
5 -
-
30
,050
27,96
5
Trave
lling a
nd co
nvey
ance
3,67
0 4,
897
9,62
1 7,
415
3,24
9 3,
138
144,1
24
116,5
45
21,20
0 16
,408
-
-
181,8
64
148,4
03
Pr
inting
and s
tatio
nery
1,80
6 1,
549
-
-
-
-
-
-
-
-
-
-
1,80
6 1,
549
Ins
uran
ce
33,02
8 16
,946
-
-
317
370
9,76
7 7,
238
2,69
5 2,
264
-
-
45,80
7 26
,818
Re
nt, r
ates
and t
axes
17,30
1 19
,464
416
400
2,29
4 3,
015
8,54
6 7,
936
1,22
7 1,
225
-
-
29,78
4 32
,040
Uti
lities
3,
041
2,33
5 11
8 10
7 2,
227
1,86
2 3,
709
3,33
6 7,
780
6,29
2 -
-
16
,875
13,93
2
Vehic
le ru
nning
and m
ainte
nanc
e
13,76
4 14
,828
-
-
-
-
-
-
-
-
-
-
13,76
4 14
,828
Re
pairs
and m
ainte
nanc
e
1,68
9 2,
859
97
155
2,08
7 1,
810
4,74
0 2,
828
2,54
5 2,
491
-
-
11,15
8 10
,143
Fe
es, s
ubsc
riptio
n and
perio
dicals
407
1,91
6 -
-
-
-
-
-
-
-
-
-
40
7 1,
916
Ad
verti
sem
ent a
nd sa
les pr
omoti
on
18
,671
38,93
0 2,
544
1,10
3 6,
473
15,40
9 14
3,544
11
8,980
7,
331
5,34
7 -
-
17
8,563
17
9,769
Ente
rtainm
ent
3,
075
2,98
2 -
-
-
-
-
-
-
-
-
-
3,
075
2,98
2
Secu
rity s
ervic
e
2,04
7 2,
475
-
-
-
-
-
-
-
-
-
-
2,04
7 2,
475
De
prec
iation
/ am
ortiz
ation
6.2
& 7.
3 80
,693
78,39
3 -
76
9 92
2,
454
16,10
7 11
,739
7,73
5 5,
256
-
-
104,6
27
98,61
1
Prov
ision
for d
oubtf
ul de
bt
13.2
8,29
2 -
-
-
-
-
-
-
-
-
-
-
8,
292
-
W
rite-
offs
-
-
-
-
-
-
-
862
-
-
-
-
-
862
Ot
her g
ener
al ex
pens
es
15
,216
11,90
0 6,
786
14,71
0 5,
711
13,83
1 88
,284
145,1
72
25,58
7 33
,254
-
-
141,5
84
218,8
67
3,12
7,018
3,
382,1
56
79,62
7 70
,575
177,0
73
149,0
63
1,01
9,421
82
6,232
25
0,049
21
0,335
-
-
4,
653,1
88
4,63
8,361
31.1
Thes
e inc
lude s
um of
PKR 1
6.937
milli
on (2
014:
PKR 1
9.789
milli
on) in
resp
ect o
f sta
ff re
tirem
ent b
enefi
ts.
32
ADM
INIST
RATIV
E EXP
ENSE
S
Sa
laries
and b
enefi
ts
32.1
437,6
23
310,5
80
178,6
63
186,1
82
165,3
83
168,0
80
118,1
39
111,9
69
82,95
2 78
,635
1,77
7 1,
379
984,5
37
856,8
25
Co
mm
unica
tion
13
,734
14,04
4 3,
179
3,27
6 2,
899
3,15
4 2,
648
2,93
5 1,
481
1,70
7 43
-
23
,984
25,11
6
Trave
lling a
nd co
nvey
ance
45,87
4 38
,173
7,78
4 7,
872
5,29
9 4,
753
6,75
9 7,
113
4,73
9 4,
109
-
-
70,45
5 62
,020
Ins
uran
ce
9,21
7 10
,588
596
1,31
0 71
3 1,
567
4,82
4 2,
793
227
426
-
-
15,57
7 16
,684
Re
nt, r
ates
and t
axes
5,03
5 6,
324
9,04
1 5,
645
7,16
4 2,
986
2,73
1 96
5 1,
548
645
-
-
25,51
9 16
,565
Ve
hicle
runn
ing an
d main
tena
nce
24
,479
24,30
5 -
-
-
-
-
-
-
-
-
-
24
,479
24,30
5
Aircr
aft ru
nning
and m
ainte
nanc
e
61,88
4 56
,611
-
-
-
-
-
-
-
-
-
-
61,88
4 56
,611
Pr
inting
and s
tatio
nery
9,02
2 8,
818
-
-
-
-
-
-
-
-
-
5
9,02
2 8,
823
Fe
es an
d sub
scrip
tion
39
,453
28,48
1 -
-
-
-
-
-
-
-
1,
678
780
41,13
1 29
,261
Se
curit
y ser
vices
13,99
0 12
,091
-
-
-
-
-
-
-
-
-
-
13,99
0 12
,091
Le
gal fe
e
26
,250
9,47
5 -
-
-
-
-
-
-
-
12
0 2,
680
26,37
0 12
,155
Pr
ofes
siona
l and
advis
ory s
ervic
es
-
22
,262
-
-
-
-
-
-
-
-
-
-
-
22,26
2
Trans
porta
tion a
nd fr
eight
-
868
-
-
-
-
-
-
-
-
-
-
-
868
Uti
lities
6,
283
6,74
5 5,
625
6,24
1 3,
984
4,90
5 10
,849
9,11
8 86
1 1,
060
-
-
27,60
2 28
,069
Re
pairs
and m
ainte
nanc
e
14,22
0 42
,806
3,08
9 4,
235
3,60
1 3,
470
5,97
0 4,
732
1,13
3 1,
185
-
-
28,01
3 56
,428
Ad
verti
sem
ent
2,
324
2,03
9 1,
781
5,05
7 1,
915
5,77
8 96
7 1,
915
457
1,24
9 -
-
7,
444
16,03
8
Audit
ors’
rem
uner
ation
32
.1 2,
365
2,27
3 1,
844
1,98
1 1,
793
857
687
618
394
384
2,45
3 97
9,
536
6,21
0
Othe
r aud
itors’
rem
uner
ation
32
.2 32
3 28
0 -
-
-
-
-
-
-
-
-
-
32
3 28
0
Depr
eciati
on /
amor
tizati
on
6.2 &
7.3
176,6
32
142,2
26
39,72
1 35
,266
34,56
5 37
,262
12,01
5 17
,133
14,64
8 21
,008
1,08
3 -
27
8,664
25
2,895
Writ
e-off
s
-
-
-
99
3 -
1,
188
-
667
-
448
-
-
-
3,29
6
Prov
ision
for d
oubtf
ul de
bts
13.2
-
-
2,95
6 -
-
-
2,
218
1,55
6 21
,021
-
-
-
26,19
5 1,
556
Pr
ovisi
on fo
r slow
mov
ing an
d obs
olete
stoc
ks
-
-
-
-
-
-
23
,283
12,38
9 12
,717
-
-
-
36,00
0 12
,389
Pr
ovisi
on fo
r slow
mov
ing sp
ares
11
.3 -
-
-
-
15
,044
52
-
102
-
-
-
-
15,04
4 15
4
Traini
ng co
st
9,
458
6,90
6 -
-
-
-
-
-
-
-
-
-
9,
458
6,90
6
Othe
r gen
eral
expe
nses
32
.3 19
,469
14,37
4 62
,029
60,88
4 54
,165
45,46
9 33
,885
32,66
3 19
,632
14,74
8 59
,998
4,37
1 24
8,938
17
2,509
91
7,635
76
0,269
31
6,308
31
8,942
29
6,525
27
9,521
22
4,975
20
6,668
16
1,810
12
5,604
67
,152
9,31
2 1,
984,1
65
1,70
0,316
32
.1 Th
ese i
nclud
e sum
of PK
R 95.1
42 m
illion
(201
4: PK
R 40.7
36 m
illion
) in re
spec
t of s
taff
retir
emen
t ben
efits.
Notes to the Consolidated Financial StatementsFor the year ended June 30, 2015
P 170

2015 2014 PKR in ‘000’
32.1 Auditors’ remuneration
Statutory audit fee of the Holding Company’s - standalone financial statements 1,375 1,294 - consolidated financial statements 345 312 Audit fee of the subsidiary companies 7,171 3,937 Half yearly review fee 380 359 Fee for the review of Code of Corporate Governance 86 78 Out of pocket expenses 179 230
9,536 6,210
32.2 Cost auditors’ remuneration
Cost audit fee 300 259 Out of pocket expenses 23 21
323 280
32.3 Included herein is an amount PKR 0.240 million (2014: PKR Nil) charged within the Group for certain administrative service
charges in accordance with the service level agreement which has been eliminated from the total.
Note 2015 2014
PKR in ‘000’
33 FINANCE COSTS
Mark-up on long-term finance 637,027 650,590 Mark-up on short-term borrowings and running finance 292,444 327,724 Interest on workers’ profit participation fund 24.3 9,534 5,109 Discounting charges on receivables 59,230 46,292 Bank charges and commission 18,121 18,429 Guarantee fee and others 50 26,561
1,016,406 1,074,705
34 OTHER EXPENSES
Workers’ Profit Participation Fund 24.3 1,003,466 872,386 Workers’ Welfare Fund 399,522 43,140 Donations 34.1 & 34.2 264,315 291,533
1,667,303 1,207,059
34.1 Included herein is donation amounting to PKR 170 million (2014: PKR 105 million) to Aziz Tabba Foundation (ATF). ATF is
located at 1-A, Latif Cloth Market, M.A. Jinnah Road, Karachi. Mr. Muhammad Yunus Tabba, Chairman of the Board of Directors of the Holding Company, is the Chairman of ATF and Mr. Muhammad Ali Tabba, the Chief Executive of the Holding Company, is the Vice Chairman of ATF. Further, Mr. Muhammad Sohail Tabba, Mr. Muhammad Jawed Tabba, Mrs. Rahila Aleem and Mrs. Zulekha Tabba Maskatiya, the Directors of the Company, are the Directors of ATF.
34.2 Represent provision in respect of donation to ICI Pakistan Foundation (Head office, Karachi). Mr. Asif Jooma, Director of a
Subsidiary Company (ICI), Mr. Suhail Aslam Khan, Mr. Asif Malik, Ms. Saima Kamila Khan and Ms. Fathema Zuberi, Executives of the Subsidiary Company (ICI) are amongst the Trustees of the Foundation. No amount has been paid during the current year and corresponding year.
P 171

Note 2015 2014 PKR in ‘000’
35 OTHER INCOME
Income from non-financial assets Gain on disposal of operating fixed assets 6.3 28,363 8,731 Sale of electricity 1,910,280 1,682,520 Cost of sale of electricity (1,738,305) (1,501,218)
171,975 181,302 Scrap sales 69,252 67,994 Exchange gain - net 30,157 132,338 Provisions and accruals no longer required written back 10,097 138,552 Others 17,089 36,412 326,933 565,329 Income from financial assets Capital gain / (loss) on sale of investments 32,319 (991) Dividend income 40,000 10,072 Interest income on deposit accounts 942,058 710,846
1,014,377 719,927
1,341,310 1,285,256
36 TAXATION
Current 3,390,211 3,103,748 Deferred 380,274 95,891
3,770,485 3,199,639 36.1 Relationship between income tax expense and accounting profit:
Tax at the applicable tax rate of 33% (2014: 34%) 6,080,491 5,362,957 Tax impact on profit of the ICI PowerGen (32,467) (45,186) Tax impact on share of profit of associate (51,734) - Effect of prior year change (2,574) (103,571) Tax impact due to change of FTR ratio (51,183) - Effect of credit under section 65B (245,834) (316,690) Effect of change in tax rate on begining deferred tax balance (36,922) (127,362) Tax effect of dividend (taxed at 10% instead of 33%) (9,200) - Tax effects of items not deductible for tax purposes 5,410 7,278 Tax effect under lower rate of tax (1,473,729) (1,248,425) Foreign tax credit (20,672) - Others (391,101) (329,362)
3,770,485 3,199,639 36.2 The tax assessments of the Holding Company have been finalized upto and including the tax year 2014.
Notes to the Consolidated Financial StatementsFor the year ended June 30, 2015
P 172

37 EARNINGS PER SHARE - basic and diluted
There is no dilutive effect on the basic earnings per share of the Holding Company, which is based on:
2015 2014
Profit attributable to owners of the Holding Company (PKR in thousands) 13,757,976 11,892,359 Weighted average number of ordinary shares (in thousands) 323,375 323,375 Basic and diluted earnings per share - (PKR) 42.54 36.78
Note 2015 2014 PKR in ‘000’
38 CASH GENERATED FROM OPERATIONS
Profit before taxation 18,425,729 15,773,403 Adjustments for non cash charges and other items: Depreciation / amortization 6.2 3,972,409 3,436,048 Amortization on intangible assets 7.3 424,820 414,726 Provision for slow moving spares 11.3 40,044 10,000 Provision for slow moving and obselete stocks 66,000 12,389 Provision for doubtful debts 13.2 34,487 - Gain on disposal of operating fixed assets 6.3 (28,363) (8,731) Assets written-off - 27,403 Reversal of provision for doubtful receivables (18,615) - Provision for staff gratuity 23.1.3 377,016 200,628 Share of (gain) / loss in equity-accounted investments (718,039) 18,582 Finance costs 33 1,016,406 1,079,480 Profit before working capital changes 23,591,894 20,963,928 (Increase) / decrease in current assets Stores, spares and consumables 990,571 (911,745) Stock-in-trade (343,954) (232,555) Trade debts (546,356) (401,939) Loans and advances (223,984) 66,013 Trade deposits and short-term prepayments (186,382) (5,597) Other receivables 190,530 (306,532) (119,575) (1,792,355) Increase in current liabilities Trade and other payables 5,108,266 2,752,635
28,580,585 21,924,208
P 173

Notes to the Consolidated Financial StatementsFor the year ended June 30, 2015
39 REMUNERATION OF CHIEF EXECUTIVE, DIRECTORS AND EXECUTIVES
39.1 Aggregate amounts charged in these consolidated financial statements are as follows :
Chief Executive Director(s) Executives Total Particulars 2015 2014 2015 2014 2015 2014 2015 2014 PKR in ‘000’
Remuneration 39,000 28,000 933 1,600 1,192,524 991,133 1,232,457 1,020,733 House rent allowance 15,600 11,200 373 640 381,192 309,902 397,165 321,742 Utility allowance 3,900 2,800 94 160 91,183 74,051 95,177 77,011 Conveyance allowance – – – – 38,264 29,488 38,264 29,488 Charge for defined benefit obligation 18,500 3,500 – 200 259,361 181,047 277,861 184,747 Group insurance – – – – 4,321 4,503 4,321 4,503 Medical expenses – – – – 36,202 31,339 36,202 31,339 77,000 45,500 1,400 2,600 2,003,047 1,621,463 2,081,447 1,669,563
Number of persons 1 1 1 1 818 670 820 672
39.2 In addition to the above, chief executive, director(s) and some executives are provided with the Group maintained cars and
other benefits as per the Group policy. 39.3 An amount of PKR 550,000/- was paid to 6 non executive directors and PKR 220,000/- was paid to 2 executive directors during
the year as fee for attending board meetings (2014: 6 non executive directors were paid PKR 200,000/- and 2 executive directors were paid PKR 80,000/-).
40 TRANSACTIONS WITH RELATED PARTIES
40.1 Related parties comprise associated entities, entities with common directorship, directors and key management personnel. Details of transactions with related parties during the year, other than those which have been disclosed elsewhere in these consolidated financial statements, are as follows:
2015 2014 PKR in ‘000’
Directors Purchase of Land & Building 599,379 - Sales 2,561 - Associates Lucky Paragon ReadyMix Limited Sales 386,879 250,665 Fazal Textile Mills Limited Sales 320,001 302,051 Yunus Textile Mills Limited Sales 85,362 181,242 Lucky Textile Mills Limited Sales 101,034 35,007 Dividend 45,695 - Gadoon Textile Mills Limited Sales 1,055,147 1,249,358 Dividend 53,828 - Aziz Tabba Foundation Sales 2,522 1,995 Donation 170,000 105,000 Lucky One (Pvt) Limited Sales 123,315 172,855 Lucky Commodities Sales - 229,494 Lucky Air (Pvt) Limited Services 22,587 20,882 Yunus Energy Limited Investment 203,615 750 Arabian Sea Country Club Limited Purchase of goods, materials and services 122 127 Lucky Knits (Pvt) Ltd Sales 30,120 3,745 Feroze 1888 Mills Limited Sales 29,199 - International Steel Limited Sales 17,218 -
P 174

2015 2014 PKR in ‘000’
NIB Bank Loan interest 14,717 - Jubilee Life Insurance Company Limited Insurance premium 12,923 - Pakistan Business Council Membership fee 1,500 - Nutrico Pakistan (Private) Limited Reimbursement of expenses 43,197 - 40.2 There are no transactions with key management personnel other than under the terms of employment.
41 PRODUCTION CAPACITY
In metric tonnes except PowerGen which is thousand of Megawatt hours:
Note 2015 2014 Annual Production Annual Production Name plate Name plate
Capacity Capacity
Cement 41.1 7,750,000 6,794,964 7,750,000 6,621,208 Clinker - 6,395,248 - 6,365,814 Polyester 41.2 122,250 115,711 122,000 109,810 Soda Ash 41.2 350,000 308,499 350,000 287,445 Chemicals 41.3 - 13,299 - 15,643 Sodium Bicarbonate 26,000 27,840 26,000 27,000
PowerGen 41.4 122,640 40,059 122,640 42,873
41.1 Production capacity utilization is 87.68% (2014: 85.43%) of total installed capacity. The shortfall is due to low demand.
41.2 Production of Soda Ash as compared to last year was greater as coal fired boilers operated during the year at full capacity. Overall production of Soda Ash and Polyester is lower due to market demand as compared to capacity.
41.3 The capacity of Chemicals is indeterminable because these are multi-product plants.
41.4 Electricity by PowerGen is produced as per demand of the Polyester division.
42 FINANCIAL RISK MANAGEMENT OBJECTIVES AND POLICIES
The Group finances its operations through equity, borrowings and management of working capital with a view to maintaining an appropriate mix between various sources of finance to minimize risk. Taken as a whole, the Group is exposed to market risk (including interest rate risk, currency risk and other price risk), credit risk and liquidity risk. The Group’s principal financial liabilities comprise long-term finance, long-term deposits, short-term borrowings and running finance and trade and other payables. The main purpose of these financial liabilities is to raise finance for the Group’s operations. The Group has various financial assets such as investments, loans, deposits, trade and other receivables and cash and bank balances, which are directly related to its operations. The Group’s finance and treasury departments oversee the management of these risks and provide assurance to the Group’s senior management that the Group’s financial risk-taking activities are governed by appropriate policies and procedures and that financial risks are identified, measured and managed in accordance with group policies and risk appetite. No changes were made in the objectives, policies or processes and assumptions during the year ended June 30, 2015. The policies for managing each of these risks are summarized below:
P 175

42.1 Market risk
Market risk is the risk that the fair value of future cash flows of a financial instrument will fluctuate because of changes in market prices. Market prices comprise three types of risk: interest rate risk, currency risk and other price risk. Financial instruments susceptible to market risk include deposits, loans and borrowings. The sensitivity analysis in the following sections relate to the position as at June 30, 2015 and 2014.
42.1.1 Interest rate risk
Interest rate risk is the risk that the fair value of future cash flows of the financial instruments will fluctuate because of changes in market interest rates. Bank balances carry interest rates between 5% and 10.25% (2014: 6% and 10.25%). The Group mitigates its risk against exposure through focusing on short term borrowings that are available at lower rates to the Group and maintaining bank balances. As of the balance sheet date, the Group is not materially exposed to interest rate risk.
42.1.2 Currency risk
Currency risk is the risk that the fair value of future cash flows of a financial instrument will fluctuate due to changes in foreign exchange rates and arises where transactions are done in foreign curreny. The Group manages its exposure against foreign currency risk by making sales and purchases of certain materials in currencies other than Pakistani Rupee. Approximately 15% (2014: 17%) of the Group’s sales are denominated in foreign currency. When the management expects future depreciation of Pak PKR, the Group enters into forward foreign exchange contracts in accordance with State Bank of Pakistan instructions.
As at the balance sheet date, if Pak Rupee depreciated / appreciated by 1% against USD, Euro, GBP and JPY, with all other
variables held constant, the Group’s profit before tax would have been PKR 64.619 million (2014: PKR 86.418 million) higher / lower as a result of exchange gain / (loss) on translation of foreign currency denominated financial instruments.
42.1.3 Other price risk
Other price risk is the risk that the fair value of future cash flows of the financial instruments will fluctuate because of changes in market prices.
42.2 Credit risk
42.2.1 Credit risk represents the accounting loss that would be recognized at the reporting date if counter parties failed to perform as
contracted. The Group manages credit risk by limiting significant exposure to any individual customers, by obtaining advance against sales and developing a formal approval process whereby credit limits are applied to its customer. The management also continuously monitors the credit exposure towards the customers and makes provision against those balances considered doubtful of recovery. To mitigate the risk, the Group has a system of assigning credit limits to its customers based on an extensive evaluation based on customer profile and payment history. Outstanding customer receivables are regularly monitored. Some customers are also secured, where possible, by way of inland letters of credit, cash security deposit, bank guarantees and insurance guarantees. The Group does not have significant exposure to any individual customer. As of the balance sheet date, the Group is exposed to credit risk on the following assets:
Note 2015 2014 PKR in ‘000’ Long-term loans 9 350,123 273,597 Long-term deposits 10 30,498 28,854 Trade debts 13 3,473,293 2,961,424 Short-term loans 14 130,535 114,843 Trade deposits 15 51,841 46,940 Other receivables 16 2,023,466 2,114,473 Bank balances 18 18,155,599 11,723,248
24,215,355 17,263,379
Notes to the Consolidated Financial StatementsFor the year ended June 30, 2015
P 176

Credit quality of financial assets
The credit quality of financial assets can be assessed by reference to external credit rating agencies or the historical information about counter party default rates as shown below:
The ageing of trade debts and loans at the reporting date is as follows:
2015 2014 PKR in ‘000’
Not past due 3,837,794 3,000,251 Past due but not Impaired: Not more than three months 120,055 106,392 Past due and Impaired: More than three months and not more than one year 12,214 48,507 More than one year 26,850 138,242
159,119 293,141 Less: Provision for: - Doubtful debts 49,279 93,664 - Doubtful loans and advances - 7,292
49,279 100,956 3,947,634 3,192,436 Bank balances A1+ 18,155,439 11,561,665 A1 160 150,943
18,155,599 11,712,608
Finanacial assets other than trade debts, loans and bank balances are not exposed to any material credit risk.
P 177

42.3 Liquidity risk
Liquidity risk reflects the Group’s inability in raising funds to meet commitments. Management closely monitors the Group’s liquidity and cash flow position. This includes maintenance of balance sheet liquidity ratios, debtors and creditors concentration both in terms of the overall funding mix and avoidance of undue reliance on large individual customers.
The table below summarizes the maturity profile of the Group’s financial liabilities based on contractual undiscounted
payments.
Less than 1 to 5 year Total one year PKR in ‘000’
June 30, 2015 Long-term finance 1,797,105 8,854,165 10,651,270 Long-term deposit - 69,246 69,246 Short-term borrowings and running finance 1,833,247 - 1,833,247 Trade and other payables 15,819,145 - 15,819,145 Accrued mark-up 165,210 - 165,210
19,614,707 8,923,411 28,538,118 June 30, 2014 Long-term finance 1,163,569 9,983,078 11,146,647 Long-term deposit - 67,971 67,971 Short-term borrowings and running finance 437,368 - 437,368 Trade and other payables 10,900,436 - 10,900,436 Accrued mark-up 223,656 - 223,656
12,725,029 10,051,049 22,776,078
42.4 Fair values of financial assets and liabilities
Fair value is the amount for which an asset could be exchanged, or a liability can be settled, between knowledgeable willing parties in an arm’s length transaction. As of the balance sheet date, the carrying value of all financial assets and liabilities reflected in the consolidated financial statements approximate to their fair values.
42.5 Capital management
The primary objective of the Group’s capital management is to maintain healthy capital ratios, strong credit rating and optimal capital structures in order to ensure ample availability of finance for its existing and potential investment projects, to maximise shareholder value and reduce the cost of capital.
The Group manages its capital structure and makes adjustment to it, in light of changes in economic conditions. In order to
maintain or adjust the capital structure, the Group may adjust the amount of dividends paid to shareholders, return capital to shareholders or issue new shares. No changes were made in the objectives, policies and processes during the year ended June 30, 2015.
The Group monitors capital using a gearing ratio, which is net debt divided by total capital plus net debt. The Group includes
within net debt, interest bearing loans and borrowings including any finance cost thereon, trade and other payables, less cash and bank balances. Capital signifies equity as shown in the balance sheet plus net debt.
Notes to the Consolidated Financial StatementsFor the year ended June 30, 2015
P 178
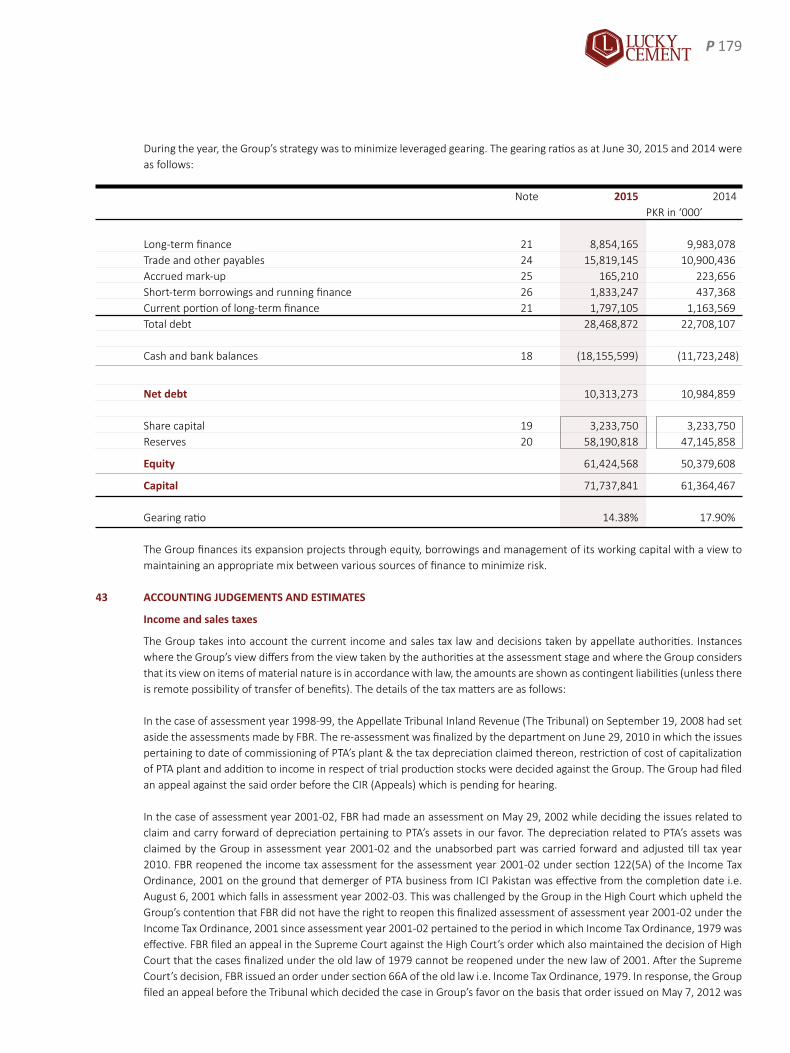
During the year, the Group’s strategy was to minimize leveraged gearing. The gearing ratios as at June 30, 2015 and 2014 were as follows:
Note 2015 2014 PKR in ‘000’
Long-term finance 21 8,854,165 9,983,078 Trade and other payables 24 15,819,145 10,900,436 Accrued mark-up 25 165,210 223,656 Short-term borrowings and running finance 26 1,833,247 437,368 Current portion of long-term finance 21 1,797,105 1,163,569 Total debt 28,468,872 22,708,107 Cash and bank balances 18 (18,155,599) (11,723,248)
Net debt 10,313,273 10,984,859 Share capital 19 3,233,750 3,233,750 Reserves 20 58,190,818 47,145,858
Equity 61,424,568 50,379,608
Capital 71,737,841 61,364,467 Gearing ratio 14.38% 17.90%
The Group finances its expansion projects through equity, borrowings and management of its working capital with a view to maintaining an appropriate mix between various sources of finance to minimize risk.
43 ACCOUNTING JUDGEMENTS AND ESTIMATES
Income and sales taxes
The Group takes into account the current income and sales tax law and decisions taken by appellate authorities. Instances where the Group’s view differs from the view taken by the authorities at the assessment stage and where the Group considers that its view on items of material nature is in accordance with law, the amounts are shown as contingent liabilities (unless there is remote possibility of transfer of benefits). The details of the tax matters are as follows:
In the case of assessment year 1998-99, the Appellate Tribunal Inland Revenue (The Tribunal) on September 19, 2008 had set
aside the assessments made by FBR. The re-assessment was finalized by the department on June 29, 2010 in which the issues pertaining to date of commissioning of PTA’s plant & the tax depreciation claimed thereon, restriction of cost of capitalization of PTA plant and addition to income in respect of trial production stocks were decided against the Group. The Group had filed an appeal against the said order before the CIR (Appeals) which is pending for hearing.
In the case of assessment year 2001-02, FBR had made an assessment on May 29, 2002 while deciding the issues related to
claim and carry forward of depreciation pertaining to PTA’s assets in our favor. The depreciation related to PTA’s assets was claimed by the Group in assessment year 2001-02 and the unabsorbed part was carried forward and adjusted till tax year 2010. FBR reopened the income tax assessment for the assessment year 2001-02 under section 122(5A) of the Income Tax Ordinance, 2001 on the ground that demerger of PTA business from ICI Pakistan was effective from the completion date i.e. August 6, 2001 which falls in assessment year 2002-03. This was challenged by the Group in the High Court which upheld the Group’s contention that FBR did not have the right to reopen this finalized assessment of assessment year 2001-02 under the Income Tax Ordinance, 2001 since assessment year 2001-02 pertained to the period in which Income Tax Ordinance, 1979 was effective. FBR filed an appeal in the Supreme Court against the High Court’s order which also maintained the decision of High Court that the cases finalized under the old law of 1979 cannot be reopened under the new law of 2001. After the Supreme Court’s decision, FBR issued an order under section 66A of the old law i.e. Income Tax Ordinance, 1979. In response, the Group filed an appeal before the Tribunal which decided the case in Group’s favor on the basis that order issued on May 7, 2012 was
P 179

barred by time. FBR filed an appeal in the High Court in 2013 against the decision of the Tribunal which is pending for hearing. In the meanwhile, FBR also issued an order through which Tribunal’s order has been given effect and Group’s position has been accepted.
In the case of assessment year 2002-03, on receipt of notice under section 62 of the Income Tax Ordinance, 1979, the Group
had filed a writ petition in the Supreme Court, after it being dismissed by the Sindh High Court on maintainability, challenging FBR’s notice which stated that the effective date of PTA’s demerger was August 6, 2001 (falling in assessment year 2002-03) rather than the effective date given in the Scheme of Arrangement as October 1, 2000 (which falls in assessment year 2001-02). The notice had raised certain issues relating to vesting of PTA assets by the Group. On March 18, 2015, the Supreme Court has passed an interim order stating that this case has nexus with the case of assessment year 2001-02 and hearing will take place once the High Court decides the case in assessment year 2001-02.
In the case of Tax Years 2003, 2004, 2005, 2006, 2007, 2008, 2009 and 2010, FBR had made disallowances on the matters
related to provisions charged under various heads, financial charges, gain on disposal of fixed assets, exchange loss, proration of expenses against capital gains and interest free loans offered to employees. The CIR (Appeals) has allowed all the issues in Tax Years 2003 to 2010 in our favor (except 2 issues in tax year 2003 and 2010) against which appeals have been filed by FBR in the Tribunal. On the 2 issues pertaining to tax year 2003 and 2010 decided against us, we have filed an appeal in the Tribunal against CIR (Appeals)’s decision. No hearings have yet taken place.
In course of conducting a sales tax audit for the period July 2012 to June 2013, DCIR of FBR raised certain issues with respect
to exemption and zero-rating / reduced rate benefit available to the Group on its sales. On September 12, 2014 the Group received an order in which demand of PKR 952 million was raised. An appeal was filed with CIR(A) which was decided against the Group however directions were given to DCIR to amend the original order if the returns are revised by the Group subject to approval of FBR itself. The application for revision of return filed by the Group is pending with FBR. The Group being aggrieved has filed a suit in the Sindh High Court for relief in which the Court has granted ad-interim relief till the next date of hearing which is yet to take place. The Group is confident that there is no merit in this claim of FBR regarding revenue loss and hence, considering no probability that the case would be decided against the Group, no provision in respect of this has been made in these consolidated financial statements.
Pension and Gratuity
Certain actuarial assumptions have been adopted as disclosed in note 23.1 to the consolidated financial statements for valuation of present value of defined benefit obligations and fair value of plan assets. Any changes in these assumptions in future years might affect gains and losses in those years.
Property, plant and equipment
The estimates for revalued amounts, if any, of different classes of property, plant and equipment, are based on valuation performed by external professional valuer and recommendation of technical teams of the Group. The said recommendations also include estimates with respect to residual values and depreciable lives. Further, the Group reviews the value of the assets for possible impairment on an annual basis. The future cash flows used in the impairment testing of assets is based on management’s best estimates which may change in future periods. Any change in the estimates in future years might affect the carrying amounts of the respective items of property, plant and equipments with a corresponding affect on the depreciation charge and impairment.
Provision for stores and spares and stock-in-trade
The Group has made estimation with respect to provision for slow moving, damaged and obsolete items and their net realizable value.
Provision for doubtful debts and other receivables
The Group reviews the recoverability of its trade debts and other receivables, to assess the amount required for provision for doubtful debts and other receivables as disclosed in these consolidated financial statements.
Notes to the Consolidated Financial StatementsFor the year ended June 30, 2015
P 180

Future estimation of export sales
Deferred tax calculation has been based on estimate of future ratio of export and local sales. Contingencies
The assessment of the contingencies inherently involves the exercise of significant judgment as the outcome of the future events cannot be predicted with certainty. The Group, based on the availability of the latest information, estimates the value of contingent assets and liabilities which may differ on the occurrence / non occurrence of the uncertain future events.
Impairment of goodwill and intangibles with indefinite lives
Impairment testing involves a number of judgemental areas which are subject to inherent significant uncertainity, including the preparation of cash flow forecasts for periods that are beyond the normal requirements of management reporting and the assessment of the discount rate appropriate to the business. The detail assumptions underlying impairment testing of goodwill and intangibles with indefinite lives are given in note 7.5 and 7.6 to these consolidated financial statements.
44 DATE OF AUTHORISATION FOR ISSUE
These consolidated financial statements were authorised for issue on 08 September, 2015 by the Board of Directors of the Holding Company.
45 NUMBER OF EMPLOYEES
The number of persons employed as on the balance sheet date was 3,610 (2014: 3,454) and the average number of employees during the year was 3,548 (2014: 3,356).
46 GENERAL
46.1 The Board of Directors in their meeting held on September 08, 2015 (i) approved the transfer of PKR 9,521.223 million (2014: PKR 8,433.365 million) from un-appropriated profit to general reserve; and (ii) proposed final dividend of PKR 9/- per ordinary share for the year ended June 30, 2015 amounting to PKR 2,910.375 million (2014: PKR 2,910.375 million) for approval of the members at the Annual General Meeting to be held on October 31, 2015. These consolidated financial statements do not reflect this appropriation and the proposed dividend payable.
46.2 The Finance Act, 2015 introduced a new tax under Section 5A of the Income Tax Ordinance, 2001 on every public company
other than a scheduled bank or modaraba, that derives profits for tax year and does not distribute cash dividend within six months of the end of said tax year or distribute dividends to such an extent, after such distribution, are in excess of 100% of its paid up capital. However, this tax on undistributed reserves is not applicable to a public company which distributes profit equal to either 40% of its after tax profits or 50% of its paid up capital, whichever is less, within six months of the end of the tax year.
The Board of Directors in their meeting held on September 08, 2015 has proposed sufficient cash dividend for the year
ended June 30, 2015 (refer note 46.1) which complies with the above stated requirements. Accordingly, no provision of tax on undistributed reserves has been recognized in these consolidated financial statements for the year ended June 30, 2015.
46.3 For better presentation certain prior year’s figures have been reclassified consequent to certain changes in the current year’s
presentation. 46.4 Figures have been rounded off to the nearest thousand of PKR, unless otherwise stated.
Muhammad Yunus TabbaChairman / Director
Muhammad Ali TabbaChief Executive
P 181

No of. Shareholdings Total Shareholders From To Shares hold
1526 1 100 65,740
1105 101 500 347,118
2695 501 1000 1,569,205
649 1001 5000 1,533,489
161 5001 10000 1,186,671
71 10001 15000 884,686
56 15001 20000 993,692
32 20001 25000 726,499
26 25001 30000 713,029
15 30001 35000 493,422
15 35001 40000 577,809
7 40001 45000 299,034
17 45001 50000 837,128
5 50001 55000 266,532
7 55001 60000 413,208
11 60001 65000 695,166
6 65001 70000 406,100
3 70001 75000 220,894
6 75001 80000 474,134
2 80001 85000 165,000
5 85001 90000 439,631
4 90001 95000 372,000
4 95001 100000 394,654
3 100001 105000 307,300
3 105001 110000 325,322
2 110001 115000 225,200
3 115001 120000 353,900
2 120001 125000 243,900
2 125001 130000 258,000
1 135001 140000 138,700
3 140001 145000 430,100
8 145001 150000 1,183,944
2 155001 160000 318,800
1 160001 165000 162,900
1 170001 175000 171,010
2 175001 180000 356,525
2 180001 185000 362,878
3 185001 190000 562,891
1 190001 195000 190,100
1 195001 200000 200,000
3 200001 205000 609,200
2 205001 210000 417,200
1 215001 220000 215,684
3 220001 225000 670,581
6 225001 230000 1,361,300
1 230001 235000 232,700
1 240001 245000 243,000
2 245001 250000 491,900
Pattern of ShareholdingAs at June 30, 2015
P 182

No of. Shareholdings Total Shareholders From To Shares hold
2 250001 255000 505,973
1 255001 260000 259,000
1 260001 265000 260,500
3 265001 270000 805,800
2 280001 285000 566,900
3 285001 290000 865,818
1 290001 295000 294,800
3 295001 300000 895,406
2 300001 305000 608,000
2 310001 315000 625,500
1 325001 330000 328,200
1 340001 345000 341,451
2 345001 350000 694,087
4 350001 355000 1,412,410
1 360001 365000 363,200
1 370001 375000 373,025
2 380001 385000 766,033
1 395001 400000 400,000
1 400001 405000 404,200
1 405001 410000 408,958
1 415001 420000 417,006
1 425001 430000 429,500
4 450001 455000 1,815,500
1 465001 470000 469,418
1 480001 485000 485,000
3 485001 490000 1,463,417
1 505001 510000 508,700
1 515001 520000 517,925
1 520001 525000 524,600
1 525001 530000 526,392
1 530001 535000 532,200
1 560001 565000 564,700
1 615001 620000 620,000
2 625001 630000 1,254,217
1 630001 635000 634,800
1 640001 645000 645,000
1 665001 670000 668,600
1 675001 680000 675,615
1 680001 685000 685,000
1 685001 690000 687,946
1 720001 725000 722,335
1 745001 750000 746,500
1 780001 785000 782,531
1 805001 810000 805,700
1 830001 835000 830,258
1 915001 920000 916,191
1 930001 935000 934,400
1 1000001 1005000 1,004,300
1 1035001 1040000 1,039,300
P 183

No of. Shareholdings Total Shareholders From To Shares hold
1 1050001 1055000 1,050,256
1 1065001 1070000 1,067,700
1 1080001 1085000 1,080,500
1 1150001 1155000 1,151,502
1 1170001 1175000 1,173,200
1 1180001 1185000 1,182,298
1 1190001 1195000 1,194,800
1 1205001 1210000 1,205,200
1 1235001 1240000 1,237,960
1 1285001 1290000 1,287,440
1 1290001 1295000 1,291,600
1 1295001 1300000 1,297,400
1 1385001 1390000 1,386,672
1 1460001 1465000 1,463,818
1 1610001 1615000 1,613,500
1 1685001 1690000 1,688,235
2 1825001 1830000 3,652,241
1 1890001 1895000 1,894,500
2 1925001 1930000 3,858,900
1 2370001 2375000 2,372,080
1 2590001 2595000 2,590,200
1 2685001 2690000 2,687,500
1 2855001 2860000 2,855,500
1 3095001 3100000 3,097,250
2 3115001 3120000 6,232,242
1 3185001 3190000 3,188,400
3 3215001 3220000 9,658,000
1 3275001 3280000 3,278,750
1 3295001 3300000 3,298,598
1 3745001 3750000 3,747,400
1 3975001 3980000 3,977,500
1 4365001 4370000 4,365,962
1 4835001 4840000 4,837,500
1 4850001 4855000 4,854,879
3 5370001 5375000 16,125,000
1 5680001 5685000 5,680,412
2 6065001 6070000 12,140,000
1 6560001 6565000 6,560,550
1 7510001 7515000 7,510,275
1 7560001 7565000 7,560,275
1 8155001 8160000 8,158,700
1 8955001 8960000 8,958,351
1 10540001 10545000 10,541,000
1 11480001 11485000 11,482,875
1 13590001 13595000 13,591,550
1 21445001 21450000 21,446,283
2 22800001 22805000 45,606,058
6613 323,375,000
Pattern of ShareholdingAs at June 30, 2015
P 184

Number of Number PercentageShareholders’ Category Shareholders Share Held %
Directors, Chief Executive Officer and their spouse and minor children 20 75,539,317 23.36
Associated Companies, Undertakings and related parties 4 40,205,256 12.43
NIT and ICP 3 179,306 0.06
Public Sector Companies and Corporations 9 1,157,188 0.36
Banks, Development Financial Institutions, Non Banking Financial Institutions 21 3,999,018 1.24
Insurance Companies 10 2,184,200 0.68
Modarabas and Mutual Funds 79 18,545,188 5.73
Share holders holding 10% or more: 0 0 -
General Public a. Local 6125 46,636,175 14.42
b. Foreign 126 127,055,574 39.29
Other (to be specified) 216 7,873,778 2.43
6613 323,375,000 100.00
P 185
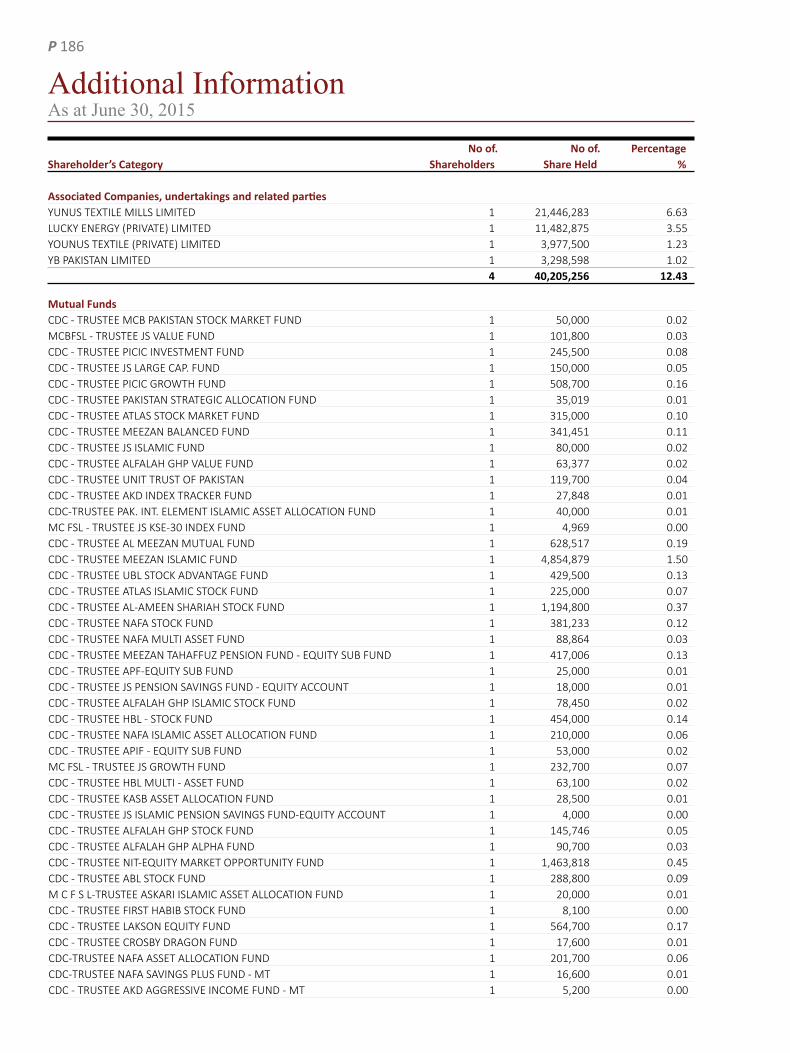
No of. No of. PercentageShareholder’s Category Shareholders Share Held % Associated Companies, undertakings and related parties YUNUS TEXTILE MILLS LIMITED 1 21,446,283 6.63 LUCKY ENERGY (PRIVATE) LIMITED 1 11,482,875 3.55 YOUNUS TEXTILE (PRIVATE) LIMITED 1 3,977,500 1.23 YB PAKISTAN LIMITED 1 3,298,598 1.02 4 40,205,256 12.43
Mutual Funds CDC - TRUSTEE MCB PAKISTAN STOCK MARKET FUND 1 50,000 0.02 MCBFSL - TRUSTEE JS VALUE FUND 1 101,800 0.03 CDC - TRUSTEE PICIC INVESTMENT FUND 1 245,500 0.08 CDC - TRUSTEE JS LARGE CAP. FUND 1 150,000 0.05 CDC - TRUSTEE PICIC GROWTH FUND 1 508,700 0.16 CDC - TRUSTEE PAKISTAN STRATEGIC ALLOCATION FUND 1 35,019 0.01 CDC - TRUSTEE ATLAS STOCK MARKET FUND 1 315,000 0.10 CDC - TRUSTEE MEEZAN BALANCED FUND 1 341,451 0.11 CDC - TRUSTEE JS ISLAMIC FUND 1 80,000 0.02 CDC - TRUSTEE ALFALAH GHP VALUE FUND 1 63,377 0.02 CDC - TRUSTEE UNIT TRUST OF PAKISTAN 1 119,700 0.04 CDC - TRUSTEE AKD INDEX TRACKER FUND 1 27,848 0.01 CDC-TRUSTEE PAK. INT. ELEMENT ISLAMIC ASSET ALLOCATION FUND 1 40,000 0.01 MC FSL - TRUSTEE JS KSE-30 INDEX FUND 1 4,969 0.00 CDC - TRUSTEE AL MEEZAN MUTUAL FUND 1 628,517 0.19 CDC - TRUSTEE MEEZAN ISLAMIC FUND 1 4,854,879 1.50 CDC - TRUSTEE UBL STOCK ADVANTAGE FUND 1 429,500 0.13 CDC - TRUSTEE ATLAS ISLAMIC STOCK FUND 1 225,000 0.07 CDC - TRUSTEE AL-AMEEN SHARIAH STOCK FUND 1 1,194,800 0.37 CDC - TRUSTEE NAFA STOCK FUND 1 381,233 0.12 CDC - TRUSTEE NAFA MULTI ASSET FUND 1 88,864 0.03 CDC - TRUSTEE MEEZAN TAHAFFUZ PENSION FUND - EQUITY SUB FUND 1 417,006 0.13 CDC - TRUSTEE APF-EQUITY SUB FUND 1 25,000 0.01 CDC - TRUSTEE JS PENSION SAVINGS FUND - EQUITY ACCOUNT 1 18,000 0.01 CDC - TRUSTEE ALFALAH GHP ISLAMIC STOCK FUND 1 78,450 0.02 CDC - TRUSTEE HBL - STOCK FUND 1 454,000 0.14 CDC - TRUSTEE NAFA ISLAMIC ASSET ALLOCATION FUND 1 210,000 0.06 CDC - TRUSTEE APIF - EQUITY SUB FUND 1 53,000 0.02 MC FSL - TRUSTEE JS GROWTH FUND 1 232,700 0.07 CDC - TRUSTEE HBL MULTI - ASSET FUND 1 63,100 0.02 CDC - TRUSTEE KASB ASSET ALLOCATION FUND 1 28,500 0.01 CDC - TRUSTEE JS ISLAMIC PENSION SAVINGS FUND-EQUITY ACCOUNT 1 4,000 0.00 CDC - TRUSTEE ALFALAH GHP STOCK FUND 1 145,746 0.05 CDC - TRUSTEE ALFALAH GHP ALPHA FUND 1 90,700 0.03 CDC - TRUSTEE NIT-EQUITY MARKET OPPORTUNITY FUND 1 1,463,818 0.45 CDC - TRUSTEE ABL STOCK FUND 1 288,800 0.09 M C F S L-TRUSTEE ASKARI ISLAMIC ASSET ALLOCATION FUND 1 20,000 0.01 CDC - TRUSTEE FIRST HABIB STOCK FUND 1 8,100 0.00 CDC - TRUSTEE LAKSON EQUITY FUND 1 564,700 0.17 CDC - TRUSTEE CROSBY DRAGON FUND 1 17,600 0.01 CDC-TRUSTEE NAFA ASSET ALLOCATION FUND 1 201,700 0.06 CDC-TRUSTEE NAFA SAVINGS PLUS FUND - MT 1 16,600 0.01 CDC - TRUSTEE AKD AGGRESSIVE INCOME FUND - MT 1 5,200 0.00
Additional InformationAs at June 30, 2015
P 186

No of. No of. Percentage Shareholder’s Category Shareholders Share Held %
CDC-TRUSTEE HBL ISLAMIC STOCK FUND 1 80,700 0.02 CDC - TRUSTEE PICIC STOCK FUND 1 48,000 0.01 CDC - TRUSTEE HBL IPF EQUITY SUB FUND 1 9,300 0.00 CDC - TRUSTEE HBL PF EQUITY SUB FUND 1 9,200 0.00 CDC - TRUSTEE ALFALAH GHP INCOME FUND - MT 1 2,000 0.00 CDC - TRUSTEE KSE MEEZAN INDEX FUND 1 188,990 0.06 CDC-TRUSTEE FIRST HABIB ISLAMIC BALANCED FUND 1 2,000 0.00 MCBFSL - TRUSTEE ABL ISLAMIC STOCK FUND 1 524,600 0.16 CDC - TRUSTEE UBL ASSET ALLOCATION FUND 1 62,000 0.02 CDC - TRUSTEE PIML STRATEGIC MULTI ASSET FUND 1 9,800 0.00 CDC - TRUSTEE FIRST CAPITAL MUTUAL FUND 1 17,900 0.01 CDC - TRUSTEE AL-AMEEN ISLAMIC ASSET ALLOCATION FUND 1 66,100 0.02 CDC - TRUSTEE NAFA ISLAMIC PRINCIPAL PROTECTED FUND - I 1 107,100 0.03 CDC - TRUSTEE PIML ISLAMIC EQUITY FUND 1 5,700 0.00 CDC - TRUSTEE FAYSAL SAVINGS GROWTH FUND - MT 1 20,800 0.01 CDC-TRUSTEE AL-AMEEN ISLAMIC RET. SAV. FUND-EQUITY SUB FUND 1 59,000 0.02 CDC - TRUSTEE UBL RETIREMENT SAVINGS FUND - EQUITY SUB FUND 1 41,000 0.01 CDC - TRUSTEE PICIC ISLAMIC STOCK FUND 1 47,500 0.01 CDC - TRUSTEE NAFA ISLAMIC PRINCIPAL PROTECTED FUND - II 1 138,700 0.04 CDC - TRUSTEE ABL ISLAMIC PENSION FUND - EQUITY SUB FUND 1 3,200 0.00 CDC - TRUSTEE ABL PENSION FUND - EQUITY SUB FUND 1 4,800 0.00 CDC - TRUSTEE NAFA ISLAMIC STOCK FUND 1 142,600 0.04 CDC - TRUSTEE PAKISTAN SARMAYA MEHFOOZ FUND 1 32,000 0.01 CDC - TRUSTEE NAFA INCOME OPPORTUNITY FUND - MT 1 62,400 0.02 CDC - TRUSTEE PIML VALUE EQUITY FUND 1 15,700 0.00 CDC - TRUSTEE FIRST HABIB INCOME FUND - MT 1 500 0.00 CDC - TRUSTEE NIT ISLAMIC EQUITY FUND 1 805,700 0.25 CDC-TRUSTEE NITIPF EQUITY SUB-FUND 1 5,000 0.00 CDC-TRUSTEE NITPF EQUITY SUB-FUND 1 5,000 0.00 CDC - TRUSTEE NATIONAL INVESTMENT (UNIT) TRUST 1 1,688,235 0.52 73 18,498,402 5.72
Directors and their spouse(s) and minor children MR. MUHAMMAD YUNUS TABBA (DIRECTOR) 2 9,839,300 3.04 MRS. KHAIRUNNISA (SPOUSE) 2 8,062,500 2.49 MR. MUHAMMAD ALI TABBA (DIRECTOR) 2 9,446,140 2.92 MRS. FEROZA TABBA (SPOUSE) 1 645,000 0.20 MR. MUHAMMAD SOHAIL TABBA (DIRECTOR) 2 12,397,775 3.83 MRS. SAIMA SOHAIL TABBA (SPOUSE) 1 6,070,000 1.88 MR. JAWED YUNUS TABBA (DIRECTOR) 2 18,966,550 5.87 MRS. RAHILA ALEEM (DIRECTOR) 2 5,045,571 1.56 MRS. ZULEKHA TABBA MASKATIYA (DIRECTOR) 2 5,045,571 1.56 MR. TARIQ IQBAL KHAN (DIRECTOR) 1 1,000 0.00 MR. MUHAMMAD ABID GANATRA (DIRECTOR) 2 4,910 0.00 MRS. SAMINA ABID GANATRA 1 15,000 0.00 20 75,539,317 23.36
P 187

Executives 17 6,672 0.00
Public Sector Companies and Corporations 9 1,157,188 0.36
Banks, development finance institutions, non-banking finance companies, insurance companies, takaful, modarabas and pension funds: Banks, development finance institutions,non-banking finance companies 21 3,999,018 1.24 Insurance companies 10 2,184,200 0.68 Takaful 2 5,200 0.00 Modarabas 6 46,786 0.01 Pension funds 25 1,571,178 0.49 64 7,806,382 2.41
Share holders holding 5% or more JAWED YUNUS TABBA - DIRECTOR 2 18,966,550 5.87 YUNUS TEXTILE MILLS LIMITED - ASSOCIATED COMPANY 1 21,446,283 6.63 KENZO HOLDINGS LIMITED - FOREIGNER 1 22,803,029 7.05 ROSSNEATH INVESTMENTS LIMITED - FOREIGNER 1 22,803,029 7.05 5 86,018,891 26.60
Details of trading in the shares by the Directors, Executives and their spouses and minor children: None of the Directors, Executives and their spouses and minor Children has traded in the shares of the Company during the year of the company, except the following:
BUY SELL Gift Received Gift Given
Mr. Muhammad Ali Tabba - Chief Executive / Director 2,211,635 Mrs. Rahila Aleem - Director 269,091 Mrs. Zulekha Tabba Maskatiya - Director 1,629,409 Mr. Muhammad Faisal - ED / CFO 2,500 12,500 Syed Noman Hassan - Executive Director 1,000 Mr. Amin Ganny - COO 1,500 Mrs. Samina Abid Ganatra - Spouse of Mr. Muhammad Abid Ganatra 15,000
No of. No of. Percentage Shareholder’s Category Shareholders Share Held %
Additional InformationAs at June 30, 2015
P 188
Notice of 22nd Annual General MeetingNotice is hereby given that the 22nd Annual General Meeting of the members of Lucky Cement Limited will be held on Saturday, October 31, 2015 at 10:30 a.m., at the registered office of the Company situated at factory premises Pezu, District Lakki Marwat, Khyber Pakhtunkhwa to transact the following businesses:
ORDINARY BUSINESS:
1. To confirm the minutes of Extraordinary General Meeting held on December 27, 2014.
2. To receive, consider and adopt the audited financial statements for the year ended June 30, 2015 together with the Board of Directors’ and Auditors’ reports thereon.
3. To approve and declare cash dividend @ 90% i.e. PKR 9/- per share for the year ended June 30, 2015, as recommended by the Board of Directors.
4. To appoint Auditors and fix their remuneration for the year ending 30 June 2016. The present Auditors, Messrs Ernst and Young Ford Rhodes Sidat Hyder, Chartered Accountants, retire and being eligible, offer themselves for reappointment.
5. To elect eight Directors of the Company as fixed by the Board of Directors in accordance with the provisions of the Companies Ordinance, 1984 for a period of three years commencing from October 31, 2015. The names of retiring Directors are as follows:
1. Mr. Muhammad Yunus Tabba 5. Mrs. Rahila Aleem 2. Mr. Muhammad Ali Tabba 6. Mrs. Zulekha Tabba Maskatiya 3. Mr. Muhammad Sohail Tabba 7. Mr. Tariq Iqbal Khan 4. Mr. Jawed Yunus Tabba 8. Mr. Muhammad Abid Ganatra
SPECIAL BUSINESS:
6. To approve and adopt a new set of Articles of Association and for this purpose to pass the following resolution as a Special Resolution:
RESOLVED as and by way of Special Resolution THAT the regulations contained in the printed document submitted to this meeting, and for the purpose of identification subscribed by the Chairman hereof, be approved and adopted as the Articles of Association of the Company, in substitution for, and to the exclusion of, all the existing Articles thereof.
7. To transact any other business with the permission of the Chair.
A statement as required by Section 160(1)(b) of the Companies Ordinance 1984 in respect of the special business to be considered at the meeting is being sent to the Members, along with a copy of this notice.
By Order of the Board
Fayyaz Abdul GhaffarKarachi: October 9, 2015 Company Secretary
Notes:
1. The Share Transfer Books of the Company will remain closed from Saturday, October 17, 2015 to Saturday, October 31, 2015 (both days inclusive). Transfers received in order at our Share Registrar/Transfer Agent M/s. Central Depository Company of Pakistan Limited, CDC House, 99-B, Block ‘B’, S.M.C.H.S., Main Shahrah-e-Faisal, Karachi-74400 at the close of business on Friday, October 16, 2015 will be treated in time for the purpose of Annual General Meeting and payment of cash dividend, if approved by the shareholders.
2. A member entitled to attend and vote may appoint another member as his/her proxy to attend and vote instead of him/her.
3. Nomination from shareholders for the office of Director must be received at least 14 days before the time of meeting at the Registered Office of the Company.
4. An individual beneficial owner of shares must bring his/her original CNIC or Passport, Account and Participant’s I.D. numbers to prove his/her identity. A representative of corporate members, must bring the Board of Directors’ Resolution and/or Power of Attorney and the specimen signature of the nominee. CDC account holders will further have to follow the guidelines as laid down in Circular No. 1 dated January 26, 2000 issued by the Securities and Exchange Commission of Pakistan.
P 189
5. (i) The Government of Pakistan through Finance Act, 2014 has made certain amendments in section 150 of the Income Tax Ordinance, 2001 whereby different rates are prescribed for deduction of withholding tax on the amount of dividend paid by the Companies. These tax rates are as under:
a) For filers of income tax returns: 12.50%
b) For non-filers of income tax returns: 17.50%
To enable the Company to make tax deduction on the amount of cash dividend @ 12.50% instead of 17.50%, all the shareholders whose names are not entered into the Active Tax Payer List (ATL) provided on the website of FBR, despite the fact that they are filers, are advised to make sure that their names are entered into ATL before the date for payment of the cash dividend i.e. 16th November, 2015 otherwise tax on their cash dividend will be deducted @ 17.50% instead of 12.5%.
(ii) For any query/problem/information, the investors may contact the Company and/or the Share Registrar: The Manager, Share Registrar Department, Central Depository Company Pakistan Limited, Telephone Number: 0800-23275 (Toll Free), email address: [email protected] and/ or The Manager Corporate Affairs, Telephone Number: 111-786-555 Ext: 2231 email address: [email protected]
(iii) The corporate shareholders having CDC accounts are required to have their National Tax Number (NTN) updated with their respective participants, whereas corporate physical shareholders should send a copy of their NTN certificate to the Company or its Share Registrar i.e. /Transfer Agent M/s. Central Depository Company of Pakistan Limited. The shareholders while sending NTN or NTN Certificates, as the case may be, must quote Company name and their respective folio numbers.
6. In accordance with the notification of the Securities and Exchange Commission of Pakistan (SECP) vide SRO 779(1)/2011 dated August 18, 2011 and SRO 83(1)/2012 dated July 5, 2012, dividend warrants should bear CNIC number of the registered member or the authorized person, except in case of minor(s) and corporate members. Accordingly, Members who have not yet submitted copy of their valid CNIC or NTN in case of corporate entities are requested to submit the same to the Company’s Shares Registrar. In case of non-compliance, the Company may withhold dispatch of dividend warrants under intimation to regulator till such time they provide the valid copy of their CNIC as per law.
7. The directive of SECP contained in SRO 787/(I)/2014 dated September 08, 2014, whereby SECP has allowed companies to circulate annual balance sheet, profit and loss account, auditor’s report and directors’ report etc. (Audited Financial Statements) alongwith notice of annual general meeting (Notice) to its members through email. Members are requested to provide their email addresses on registered address of the company.
8. The members are requested to notify change in their address, if any, at our Share Registrar/Transfer Agent M/s. Central Depository Company of Pakistan Limited, CDC House, 99-B, Block ‘B’, S.M.C.H.S., Main Shahrah-e-Faisal, Karachi-74400.
Statement as required by section 160(1)(b) of the Companies Ordinance, 1984 in respect of the Special Business to be considered at the Annual General Meeting is appended below:
Alterations in the Articles of Association of the Company:
The Board of Directors has recommended that the Company’s Articles of Association be substituted for, and to the exclusion, of all the existing articles by a new set of articles of association. The new set of the articles of association updates the Company’s existing Articles of Association by taking into account the several changes made in the Companies Ordinance, 1984 since the time that the Articles were last amended. These alterations, inter alia, enable the Company, with the approval of a special resolution to purchase its own shares, and to create a share premium account. The other alterations made are to reflect the changes in procedure incorporated into the Company Law, including submission of quarterly accounts and holding of Board Meetings through electronic communication.
A copy of the new set of Articles of Association is attached.
The resolution required for the above purpose is set forth in the notice convening the Annual General Meeting and that resolution will be proposed and passed as a Special Resolution.
P 190

I/We
of (full address)
being a member of Lucky Cement Limited hereby appoint
of (full address)
or failing him / her
or (full address)
who is also a member of Lucky Cement Limited, as my / our proxy in my / our absence to attend and vote for me / and on my / our
behalf at the 22nd Annual General Meeting the Company to be held on October 31, 2015 and / or any adjournment thereof.
Signature this (day) (date, month)
Signature of Member:
Folio / CDC Number :
Number of shares held:
CNIC No.:
Signatures, name and addresses of winesses
1.
2.
Important:
1. In order to be effective, this Proxy Form duly completed, signed and witnessed along with Power of Attorney, or other instruments (if any,) must be deposited at the registered office of the Company at factory premises Pezu, District Lakki Marwat, Khybar Pakhtunkhwa at least 48 hours before the time of the meeting.
2. If a member appoints more than one Proxy and more than one form of Proxy are deposited by a member with the Company all such forms of Proxy shall be rendered invalid.
3. In case of Proxy for an individual beneficial owner of shares from CDC, attested copies of beneficial owner’s Computerised National Identity Card or Passport, Account and Participant’s ID Numbers must be deposited along with the form of Proxy. In case of Proxy for representative of corporate members from CDC, Board of Directors’ resolution and / or Power of Attorney with the specimen signature of the nominee must be deposited along with the form of Proxy. The Proxy shall produce his / her original Computerised National Identity Card or Passport at the time of the meeting.
Signature and Company seal
Please affixrevenuestamp
Year 2015
Form of Proxy
P 191

P 192
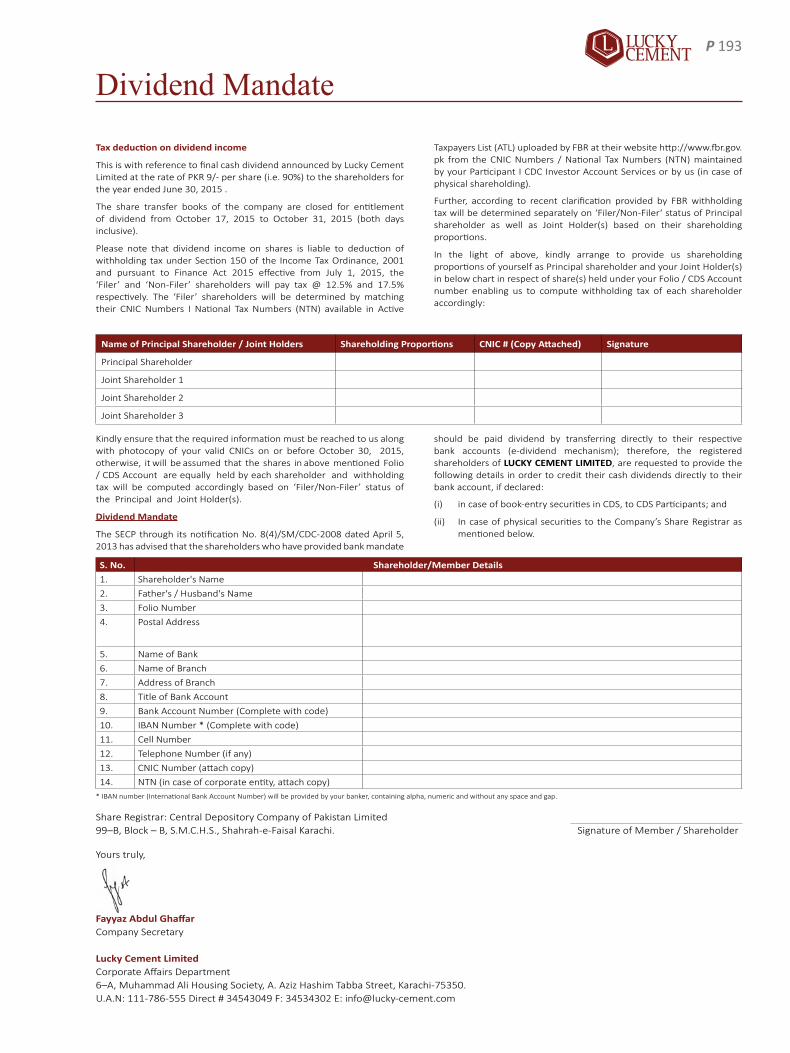
Dividend Mandate
should be paid dividend by transferring directly to their respective bank accounts (e-dividend mechanism); therefore, the registered shareholders of LUCKY CEMENT LIMITED, are requested to provide the following details in order to credit their cash dividends directly to their bank account, if declared:
(i) in case of book-entry securities in CDS, to CDS Participants; and
(ii) In case of physical securities to the Company’s Share Registrar as mentioned below.
Share Registrar: Central Depository Company of Pakistan Limited 99–B, Block – B, S.M.C.H.S., Shahrah-e-Faisal Karachi. Signature of Member / Shareholder
Yours truly,
Fayyaz Abdul GhaffarCompany Secretary
Lucky Cement LimitedCorporate Affairs Department6–A, Muhammad Ali Housing Society, A. Aziz Hashim Tabba Street, Karachi-75350.U.A.N: 111-786-555 Direct # 34543049 F: 34534302 E: [email protected]
S. No. Shareholder/Member Details1. Shareholder's Name
2. Father's / Husband's Name
3. Folio Number
4. Postal Address
5. Name of Bank
6. Name of Branch
7. Address of Branch
8. Title of Bank Account
9. Bank Account Number (Complete with code)
10. IBAN Number * (Complete with code)
11. Cell Number
12. Telephone Number (if any)
13. CNIC Number (attach copy)
14. NTN (in case of corporate entity, attach copy)* IBAN number (International Bank Account Number) will be provided by your banker, containing alpha, numeric and without any space and gap.
Tax deduction on dividend income
This is with reference to final cash dividend announced by Lucky Cement Limited at the rate of PKR 9/- per share (i.e. 90%) to the shareholders for the year ended June 30, 2015 .
The share transfer books of the company are closed for entitlement of dividend from October 17, 2015 to October 31, 2015 (both days inclusive).
Please note that dividend income on shares is liable to deduction of withholding tax under Section 150 of the Income Tax Ordinance, 2001 and pursuant to Finance Act 2015 effective from July 1, 2015, the ‘Filer’ and ‘Non-Filer’ shareholders will pay tax @ 12.5% and 17.5% respectively. The ‘Filer’ shareholders will be determined by matching their CNIC Numbers I National Tax Numbers (NTN) available in Active
Taxpayers List (ATL) uploaded by FBR at their website http://www.fbr.gov.pk from the CNIC Numbers / National Tax Numbers (NTN) maintained by your Participant I CDC Investor Account Services or by us (in case of physical shareholding).
Further, according to recent clarification provided by FBR withholding tax will be determined separately on ‘Filer/Non-Filer‘ status of Principal shareholder as well as Joint Holder(s) based on their shareholding proportions.
In the light of above, kindly arrange to provide us shareholding proportions of yourself as Principal shareholder and your Joint Holder(s) in below chart in respect of share(s) held under your Folio / CDS Account number enabling us to compute withholding tax of each shareholder accordingly:
Name of Principal Shareholder / Joint Holders Shareholding Proportions CNIC # (Copy Attached) Signature
Principal Shareholder
Joint Shareholder 1
Joint Shareholder 2
Joint Shareholder 3
Kindly ensure that the required information must be reached to us along with photocopy of your valid CNICs on or before October 30, 2015, otherwise, it will be assumed that the shares in above mentioned Folio / CDS Account are equally held by each shareholder and withholding tax will be computed accordingly based on ‘Filer/Non-Filer’ status of the Principal and Joint Holder(s).
Dividend Mandate
The SECP through its notification No. 8(4)/SM/CDC-2008 dated April 5, 2013 has advised that the shareholders who have provided bank mandate
P 193

P 194

Derivative Financial Instruments.Transactions used to manage interest rate and/or currency risks
Dividend Payout Ratio.The dividend payout ratio is the ratio between the dividend for the fiscal year and the earnings per share
EBIT.Earnings Before Interest and Taxes. EBIT represents the results of operations
EBITDA.Earnings Before Interest, Taxes, Depreciation and Amortization
EPS.Earnings Per Share
Gearing Ratio.The Gearing ratio represents the net indebtedness divided by total equity, expressed as a percentage.
Hedging.Securing a transaction against risks, such as fluctuations in exchange or interest rates, by entering into an offsetting hedge transaction, typically in the form of a forward contract
HESCO.Hyderabad Electric Supply Corporation
PESCO.Peshawar Electric Supply Corporation
IAS.International Accounting Standards (Accounting standards of the IASB)
IASB.International Accounting Standards Board (The authority that defines the International Financial Reporting Standards)
IFRIC.International Financial Reporting Interpretations Committee (predecessor of the International Financial Reporting Standards Interpretations Committee, IFRSC IC).
IFRS. International Financial Reporting Standards. (The accounting standards of IASB)
IFRS IC.International Financial Reporting Standards Interpretations Committee. The body that determines appropriate accounting treatment in the context of existing IFRS and IAS.
LCL.Lucky Cement Limited
LHL.Lucky Holdings Limited
Net Indebtedness.The net amount of interest bearing financial liabilities as recognized in the balance sheet, cash and cash equivalents, the positive fair values of the derivative instruments as well as other interest bearing investments
mtpa.million tons per annum
NEPRA.National Electric & Power Regulatory Authority
OPC.Ordinary Portland cement
Operating Assets.Operating assets are the assets less liabilities as reported in the balance sheet, without recognizing the net indebtedness, discounted trade bills, deferred tax assets, income tax receivable and payable, as well as other financial assets and debts.
Operating Lease.A form of lease that is largely similar to rental. Leased assets are recognized in the lessor’s balance sheet and capitalized
PESCO.Peshawar Electric Supply Corporation
RDF.Refuse Derived Fuel
ROCE.Return On Capital Employed. We define ROCE as the ratio of EBIT to average operating assets for the fiscal year
SIC.Standing Interpretations Committee (predecessor to the IFRIC)
SRC.Sulphate Resistant Cement
TDF.Tyre Derived Fuel
WHR.Waste Heat Recovery
YBG.Yunus Brother Group
Glossary P 195

P 196

Notes
P 197

Notes
P 198

HeadOffice6-A Muhammad Ali Housing Society, A. Aziz Hashim Tabba Street, Karachi-75350, Pakistan. UAN: (+92-21) 111-786-555 Fax: (+92-21) 34534302 Email: [email protected]
LiaisonOffices
IslamabadH. No: 12, Street No: 35, Sector: F-7/1, Islamabad, Pakistan.UAN: (+92-51) 111 786 555 Tel: (+92-51)2609424-30 Fax: (+92-51)2609432E-mail : [email protected]
MultanOffice Number 607, 6th Floor, The United Mall, Abdali Road, Multan (near Ramada Inn Hotel) Tel: (+92-61) 4540556-7, Fax: (+92-61)-4540558 Email: [email protected]
Lahore17-C/3, Gulberg III, near Hussain Chowk, Lahore.UAN: (+92-42) 111-786-555 Tel: (+92-42) 35772508 Fax: (+92-42) 35772512 Email: [email protected]
PeshawarSyed Tower, Room No. 5, 6 & 7, 3rd Floor Opposite Custom House, University Road, Peshawar.UAN: (+92-91) 111-786-555 Tel: (+92-91) 5844903 Fax: (+92-91) 5850969 Email: [email protected]
QuettaF1, First Floor, Institute of Engineers Building,Zarghoon Road, Quetta.Tel: (+92-81) 2837583 Fax: (+92-81) 2829267 Email: [email protected]
DeraIsmailKhan2nd Floor, State Life Building, East Circular Road, DI Khan Telephone: (+92-966) 717313 Fax: (92-966)717315
Plants
PezuPlantMain Indus Highway, Pezu, Distt. Lakki Marwat, Khyber PakhtunkhawaTel: (+92-969) 580123-5 Fax: (+92-969) 580122
KarachiPlant104 km milestone from Karachi to Hyderabad (58 km towards Karachi)Fax: (+92-21)35206421
P 87

annu
al re
port 20
15CULTIVATING
GROWTH
6-A Muhammad Ali Housing Society, A Aziz Hashim Tabba StreetKarachi-75350, PakistanTel: +92-21-111-786-555, +92-21-37130123 l Fax: +92-21-34534302Email:[email protected]: www.lucky-cement.com


