(Including Enterprise Zone Act)LB 1124, LB 608Quality Jobs Act
LB 829Rural Economic Opportunities Act
LB 936 Invest Nebraska Act
LB 620
2004Annual Report
This booklet was prepared by the Nebraska Department of Revenue pursuant to Section 77-1704.01, R.R.S. 2003, for distribution to Nebraska taxpayers.
Section One contains a schedule for each of the 93 counties which lists the political subdivisions receiving state aid. Each schedule includes the net amount of property taxes levied in 2003 for collection in 2004, and the amount of general fund aid from various state sources for fiscal year 2003-04. Net property taxes are total property taxes levied less homestead exemptions. Additional 2003-04 allocations to political subdivisions of each county for which detailed information was not available are listed separately.
Section Two includes a tabulation of specific aid programs funded by the Legislature from state revenue sources and a summary of the state aid paid to the political subdivisions within each county. Also included is a table of tangible property taxes levied from 1978 to 2003.
This report is one of the department’s publications available on the Internet at www.revenue.state.ne.us. If, after reviewing this report, you have any questions concerning its content or any related area, please feel free to contact Research Services, Nebraska Department of Revenue at (402) 471-5699.
Employment and Investment Growth Act,LB 775, as amended
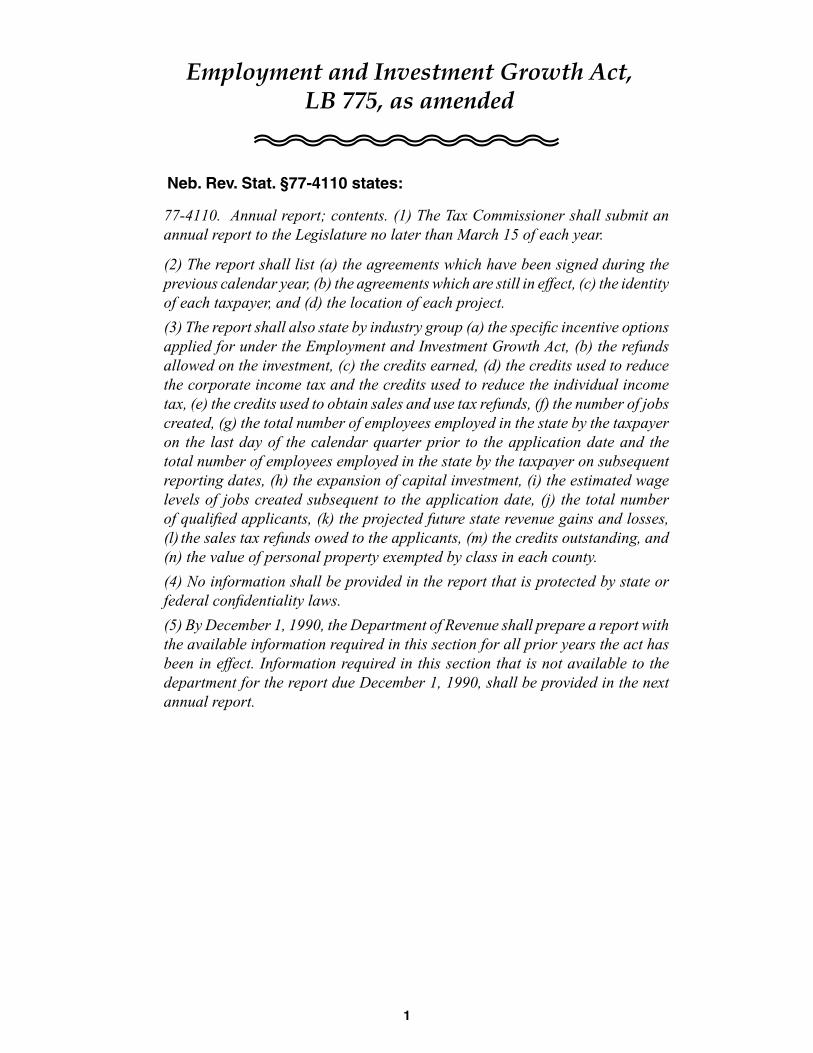
77-4110. Annual report; contents. (1) The Tax Commissioner shall submit an annual report to the Legislature no later than March 15 of each year.
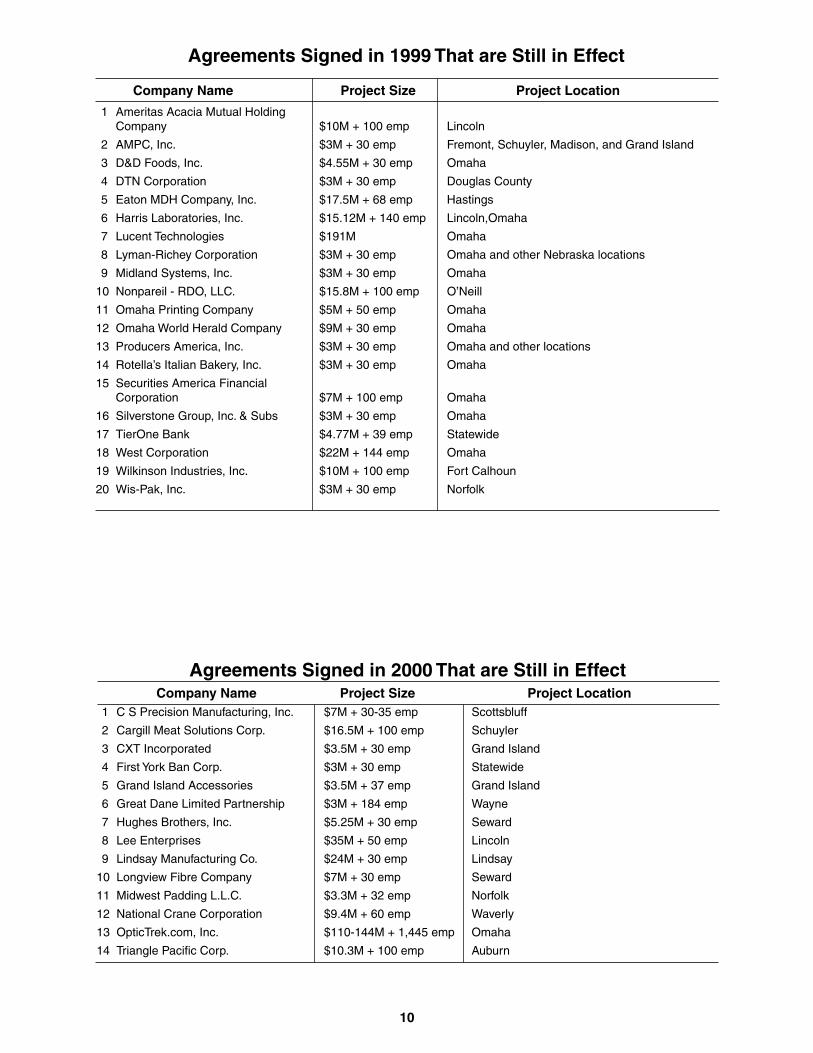
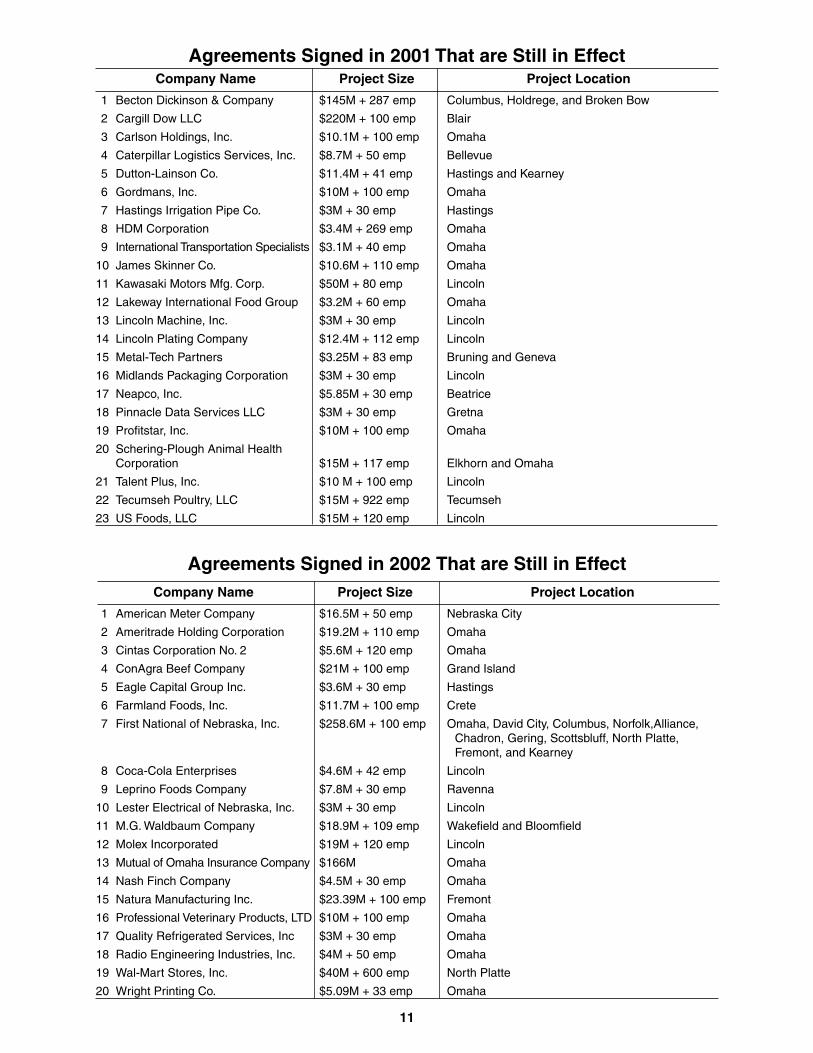
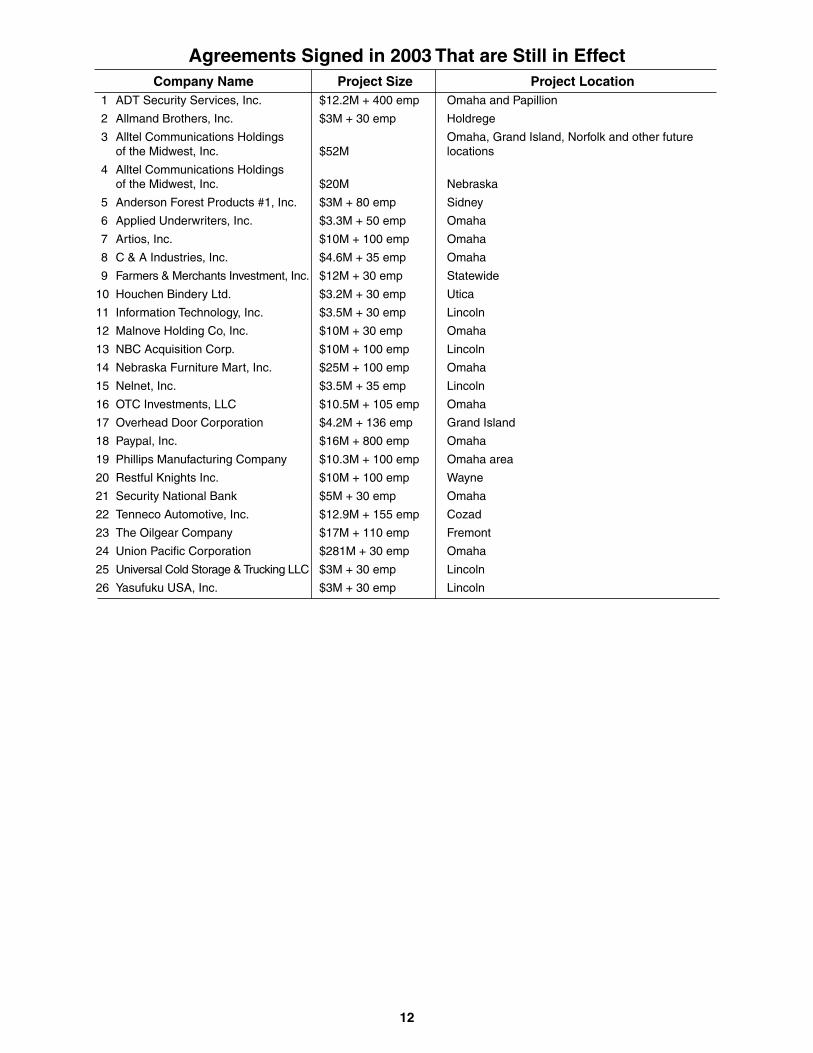
(2) The report shall list (a) the agreements which have been signed during the previous calendar year, (b) the agreements which are still in effect, (c) the identity of each taxpayer, and (d) the location of each project.
(3) The report shall also state by industry group (a) the specific incentive options applied for under the Employment and Investment Growth Act, (b) the refunds allowed on the investment, (c) the credits earned, (d) the credits used to reduce the corporate income tax and the credits used to reduce the individual income tax, (e) the credits used to obtain sales and use tax refunds, (f) the number of jobs created, (g) the total number of employees employed in the state by the taxpayer on the last day of the calendar quarter prior to the application date and the total number of employees employed in the state by the taxpayer on subsequent reporting dates, (h) the expansion of capital investment, (i) the estimated wage levels of jobs created subsequent to the application date, (j) the total number of qualified applicants, (k) the projected future state revenue gains and losses, (l) the sales tax refunds owed to the applicants, (m) the credits outstanding, and (n) the value of personal property exempted by class in each county.
(4) No information shall be provided in the report that is protected by state or federal confidentiality laws.
(5) By December 1, 1990, the Department of Revenue shall prepare a report with the available information required in this section for all prior years the act has been in effect. Information required in this section that is not available to the department for the report due December 1, 1990, shall be provided in the next annual report.
To earn the credits provided by LB 775, the investment must be made and the jobs created during the “attainment period,” which includes the year of the application and the succeeding six tax years. Three hundred and sixty projects have reached the minimum required levels and qualified to receive credits and/or sales and use tax refunds. Eighty-seven of these projects have received all expected benefits and are completed.
A company has to file an application with the Nebraska Department of Revenue describing their project and stating the planned amount of investment and additional employment. The applications are reviewed, and if approved, the Nebraska Department of Revenue and the applicant enter into a written agreement. An application or an agreement can be withdrawn. Also, an application or agreement may be deleted for failure to meet the required levels within the time allowed.
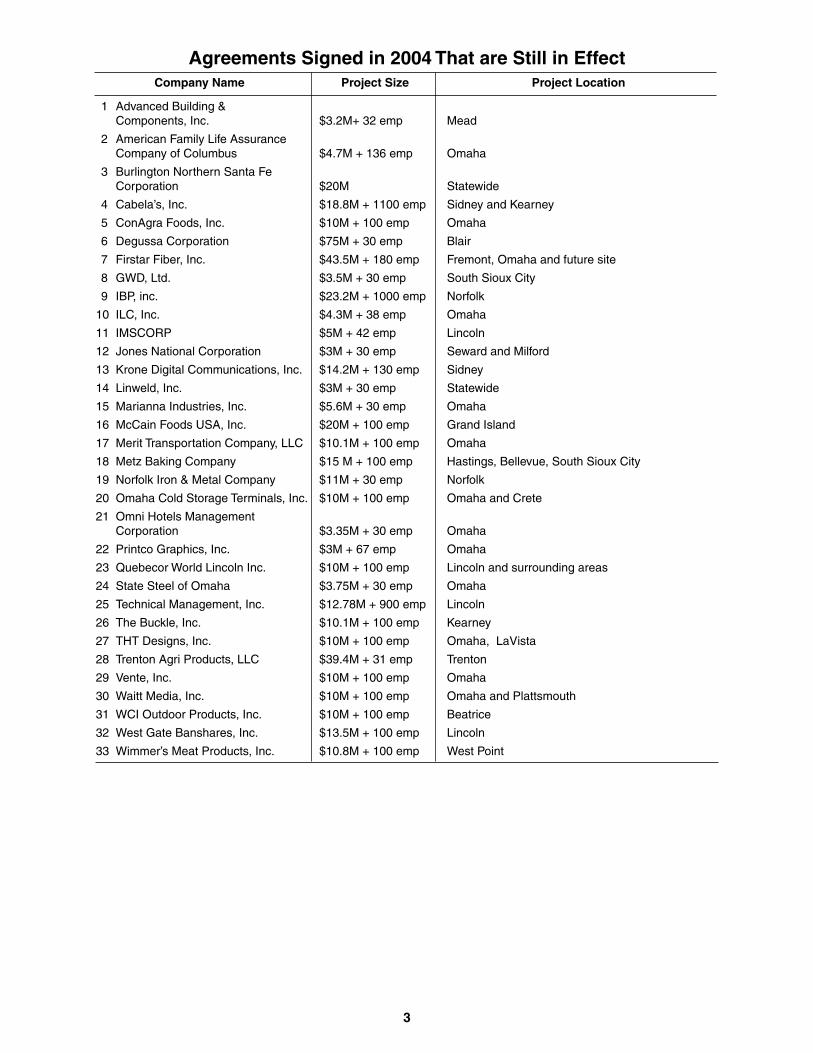
30 Waitt Media, Inc. $10M + 100 emp Omaha and Plattsmouth
31 WCI Outdoor Products, Inc. $10M + 100 emp Beatrice
32 West Gate Banshares, Inc. $13.5M + 100 emp Lincoln
33 Wimmer’s Meat Products, Inc. $10.8M + 100 emp West Point
4
Agreements Signed in 1987 That are Still in Effect Company Name Project Size Project Location 1 Central States Health & Life Company of Omaha $10M + 135 emp Greater Omaha Metropolitan Area
2 ConAgra Foods, Inc. $10M + 100 emp In or around metropolitan Omaha
3 Crete Carrier Corporation $3M + 30 emp Omaha, Lincoln, York, Crete, and Norfolk
4 Marianna Industries, Inc. $3M + 30 emp Greater Omaha Metropolitan Area
5 U S West, Inc. $60M + 150 emp Omaha area
6 Werner Enterprises, Inc. & Subs. $11M + 190 emp Douglas and Sarpy Counties
7 West Corporation $15M + 1,000 emp Greater Omaha Metropolitan Area
Agreements Signed in 1988 That are Still in Effect
19 Streck Laboratories, Inc. $3.7M + 61 emp Greater Omaha Metropolitan Area
20 Time Warner Entertainment-Advance/ Newhouse Partnership $30M + 40 emp Lincoln, Lancaster County, Crete, Auburn, Nebraska City, Tecumseh, Table Rock, Pawnee City, Humboldt, Omaha, Fairbury, Superior, York, David City, Seward, Fremont, Dodge County, Inglewood, Douglas County, and other locations
21 Walker Manufacturing Co. $4M + 45 emp Seward
22 Wilkinson Industries, Inc. $4.4M + 35 emp Fort Calhoun
Company Name Project Size Project Location
5
1 Appleton Electric LLC $3M + 30 emp Columbus
2 Clean Harbors, Inc. $35.8M + 40 emp Kimball
3 Coleman Powermate, Inc. $3M + 206 emp Hastings and Kearney
4 Community First National Bank $3.5M + 30 emp Alliance, Merriman, Chadron, Gordon, Mullen, Thedford, Valentine, Cody, Bridgeport, Hemingford, and Hyannis
5 IBP, inc. $77.5M + 1200 emp Lexington
6 ITI Marketing Services, Inc. $3.7M + 310 emp Greater Omaha Metropolitan Area
7 Omni Holding Company $3.8M + 34 emp Omaha, Douglas and Sarpy Counties
9 Principal Financial Group Life Insurance Company $6.2M + 100 emp Grand Island
10 Tri-Con Industries, LTD $9.7M + 85 emp Lincoln
11 Yasufuku USA, Inc. $3.5M + 36 emp Lincoln
Company Name Project Size Project Location
Agreements Signed in 1989 That are Still in Effect
Agreements Signed in 1990 That are Still in Effect
1 Alliant Exchange, Inc. $3M + 30 emp Douglas County
2 Alltel Communications Holdings of
the Midwest, Inc. $10M + 31 emp Grand Island, Hastings, Kearney, York, North Platte, Lexington, Brady, Paxton, Ogallala, Seward, Norfolk, Columbus, Fremont, Sidney, Scottbluff, Beatrice, Ashland, O’Neill, Ord, and other locations
3 Brunswick Corporation $3M + 30 emp Lancaster County
19 Wilkinson Industries, Inc. $10M + 100 emp Fort Calhoun
20 Wis-Pak, Inc. $3M + 30 emp Norfolk
Company Name Project Size Project Location
Agreements Signed in 2000 That are Still in Effect Company Name Project Size Project Location 1 C S Precision Manufacturing, Inc. $7M + 30-35 emp Scottsbluff
4 ConAgra Beef Company $21M + 100 emp Grand Island
5 Eagle Capital Group Inc. $3.6M + 30 emp Hastings
6 Farmland Foods, Inc. $11.7M + 100 emp Crete
7 First National of Nebraska, Inc. $258.6M + 100 emp Omaha, David City, Columbus, Norfolk,Alliance, Chadron, Gering, Scottsbluff, North Platte, Fremont, and Kearney
8 Coca-Cola Enterprises $4.6M + 42 emp Lincoln
9 Leprino Foods Company $7.8M + 30 emp Ravenna
10 Lester Electrical of Nebraska, Inc. $3M + 30 emp Lincoln
11 M.G. Waldbaum Company $18.9M + 109 emp Wakefield and Bloomfield
12 Molex Incorporated $19M + 120 emp Lincoln
13 Mutual of Omaha Insurance Company $166M Omaha
14 Nash Finch Company $4.5M + 30 emp Omaha
15 Natura Manufacturing Inc. $23.39M + 100 emp Fremont
16 Professional Veterinary Products, LTD $10M + 100 emp Omaha
18 Radio Engineering Industries, Inc. $4M + 50 emp Omaha
19 Wal-Mart Stores, Inc. $40M + 600 emp North Platte
20 Wright Printing Co. $5.09M + 33 emp Omaha
12
Agreements Signed in 2003 That are Still in Effect Company Name Project Size Project Location 1 ADT Security Services, Inc. $12.2M + 400 emp Omaha and Papillion
2 Allmand Brothers, Inc. $3M + 30 emp Holdrege
3 Alltel Communications Holdings Omaha, Grand Island, Norfolk and other future of the Midwest, Inc. $52M locations
4 Alltel Communications Holdings of the Midwest, Inc. $20M Nebraska
5 Anderson Forest Products #1, Inc. $3M + 80 emp Sidney
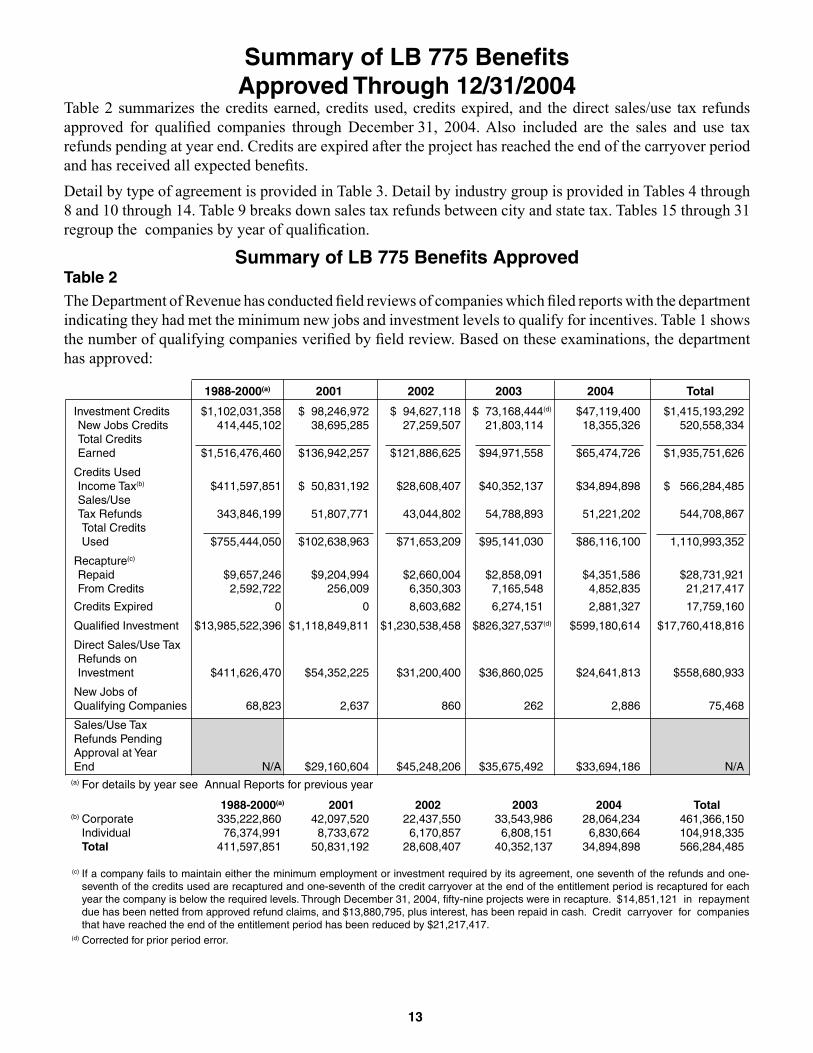
Summary of LB 775 BenefitsApproved Through 12/31/2004
Table 2 summarizes the credits earned, credits used, credits expired, and the direct sales/use tax refunds approved for qualified companies through December 31, 2004. Also included are the sales and use tax refunds pending at year end. Credits are expired after the project has reached the end of the carryover period and has received all expected benefits. Detail by type of agreement is provided in Table 3. Detail by industry group is provided in Tables 4 through 8 and 10 through 14. Table 9 breaks down sales tax refunds between city and state tax. Tables 15 through 31 regroup the companies by year of qualification.
Summary of LB 775 Benefits ApprovedTable 2The Department of Revenue has conducted field reviews of companies which filed reports with the department indicating they had met the minimum new jobs and investment levels to qualify for incentives. Table 1 shows the number of qualifying companies verified by field review. Based on these examinations, the department has approved:
13
1988-2000(a) 2001 2002 2003 2004 Total
Investment Credits $1,102,031,358 $ 98,246,972 $ 94,627,118 $ 73,168,444(d) $47,119,400 $1,415,193,292 New Jobs Credits 414,445,102 38,695,285 27,259,507 21,803,114 18,355,326 520,558,334 Total Credits Earned $1,516,476,460 $136,942,257 $121,886,625 $94,971,558 $65,474,726 $1,935,751,626
Credits Used Income Tax(b) $411,597,851 $ 50,831,192 $28,608,407 $40,352,137 $34,894,898 $ 566,284,485 Sales/Use Tax Refunds 343,846,199 51,807,771 43,044,802 54,788,893 51,221,202 544,708,867 Total Credits Used $755,444,050 $102,638,963 $71,653,209 $95,141,030 $86,116,100 1,110,993,352
Direct Sales/Use Tax Refunds on Investment $411,626,470 $54,352,225 $31,200,400 $36,860,025 $24,641,813 $558,680,933
New Jobs of Qualifying Companies 68,823 2,637 860 262 2,886 75,468
Sales/Use Tax Refunds Pending Approval at Year End N/A $29,160,604 $45,248,206 $35,675,492 $33,694,186 N/A
(a) For details by year see Annual Reports for previous year
1988-2000(a) 2001 2002 2003 2004 Total (b) Corporate 335,222,860 42,097,520 22,437,550 33,543,986 28,064,234 461,366,150 Individual 76,374,991 8,733,672 6,170,857 6,808,151 6,830,664 104,918,335 Total 411,597,851 50,831,192 28,608,407 40,352,137 34,894,898 566,284,485 (c) If a company fails to maintain either the minimum employment or investment required by its agreement, one seventh of the refunds and one-
seventh of the credits used are recaptured and one-seventh of the credit carryover at the end of the entitlement period is recaptured for each year the company is below the required levels. Through December 31, 2004, fifty-nine projects were in recapture. $14,851,121 in repayment due has been netted from approved refund claims, and $13,880,795, plus interest, has been repaid in cash. Credit carryover for companies that have reached the end of the entitlement period has been reduced by $21,217,417.
(d) Corrected for prior period error.
14
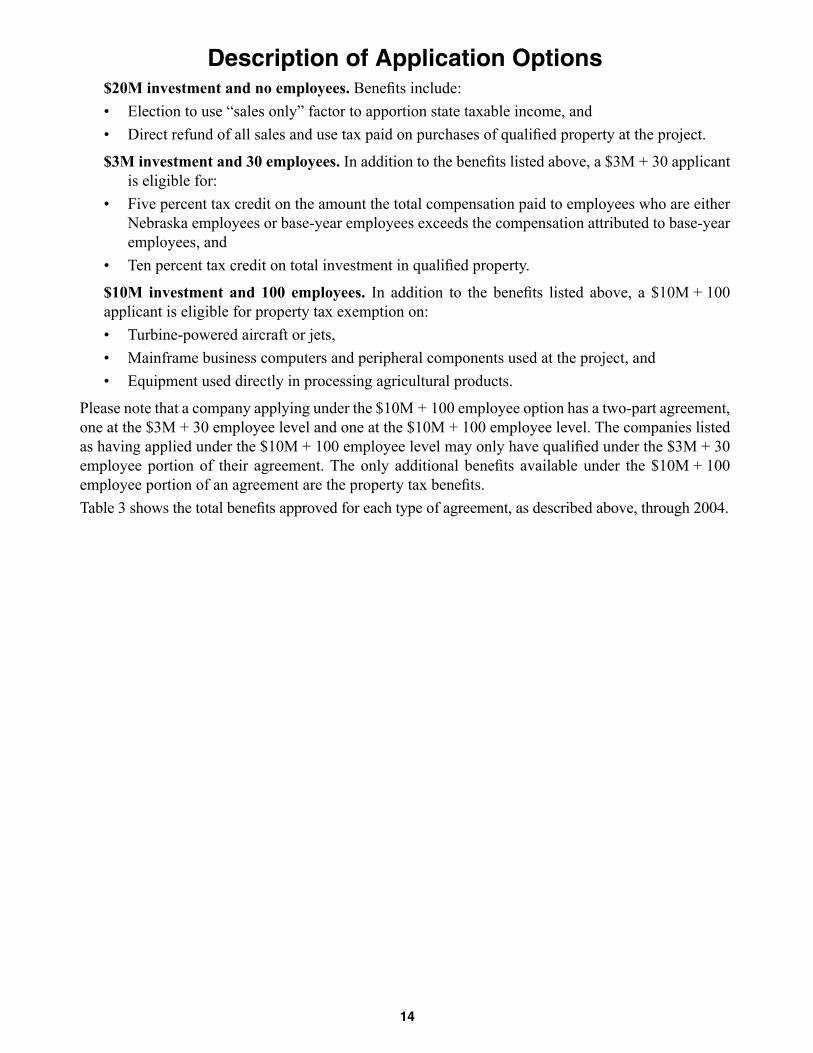
Description of Application Options $20M investment and no employees. Benefits include: • Election to use “sales only” factor to apportion state taxable income, and • Direct refund of all sales and use tax paid on purchases of qualified property at the project.
$3M investment and 30 employees. In addition to the benefits listed above, a $3M + 30 applicant is eligible for:
• Five percent tax credit on the amount the total compensation paid to employees who are either Nebraska employees or base-year employees exceeds the compensation attributed to base-year employees, and
• Ten percent tax credit on total investment in qualified property.
$10M investment and 100 employees. In addition to the benefits listed above, a $10M + 100 applicant is eligible for property tax exemption on:
• Turbine-powered aircraft or jets, • Mainframe business computers and peripheral components used at the project, and • Equipment used directly in processing agricultural products.
Please note that a company applying under the $10M + 100 employee option has a two-part agreement, one at the $3M + 30 employee level and one at the $10M + 100 employee level. The companies listed as having applied under the $10M + 100 employee level may only have qualified under the $3M + 30 employee portion of their agreement. The only additional benefits available under the $10M + 100 employee portion of an agreement are the property tax benefits.Table 3 shows the total benefits approved for each type of agreement, as described above, through 2004.
15
$20 Million $3 Million $10 Million 0 Employees 30 Employees 100 Employees Total
Total Credits Earned N/A $774,585,790 $1,161,165,836 $1,935,751,626 Credits Used Income Tax N/A $230,081,225 $336,203,260 $ 566,284,485 Sales/Use Tax Refunds N/A 177,077,067 367,631,800 544,708,867
Total Credits Used N/A $407,158,292 $703,835,060 $1,110,993,352 Credits Expired N/A $1,693,543 $16,065,617 $17,759,160 Direct Sales/Use Tax Refunds on Investment $131,211,395 $153,244,316 $274,225,222 $558,680,933 Qualified Investment $3,608,486,150 $5,711,635,241 $8,440,297,425 $17,760,418,816 New Jobs of Qualifying Companies N/A 28,952 46,516 75,468 Sales/Use Tax Refunds Pending Approval at Year End (12-31-04) $302,177 $13,205,330 $20,186,679 $33,694,186
Analysis of Benefits Approved by Type of Agreement(Cumulative Through 2004)
Table 3
LB 775 Companies Whose QualificationsHave Been Approved As Of 12/31/2004
Table 4
16
Option Under Category PBA, Major Industry Group Titles Which Applied
Construction, Utilities and 22, 23, 327 Construction, Electric and Gas, Stone, 3M + 30 emp Nonmetallic Mineral Products Clay, Glass and Concrete Products 10M + 100 emp Manufacturing
Table 4 shows the types of companies that are included in each industry group. All industry groups include a minimum of three (3) companies. The options under which companies in each industrial group have qualified are shown in the last column. The industry groupings are based on the Principal Business Activity codes currently being used by the Internal Revenue Service.
Classification Into Industry Group byPrincipal Business Activity (PBA) Codes
and Option Under Which Applied
LB 775 INDUSTRY GROUP DETAIL
Analysis of CreditsTables 5 and 6 show an analysis of credits earned and used in 2004 and cumulative through 2004 by industry group. Total credits earned consist of both investment and employment credits. Both types of credits go into a credit pool and can be used to offset corporate or individual income tax liability and to receive a refund of otherwise non-refundable sales or use tax paid on purchases at the project.
Credits distributed to either corporate or individual shareholders or partners totaled $112,047,494 in 1988-2000, $8,235,539 in 2001, $5,783,012 in 2002, $8,558,812 in 2003 and $5,226,408 in 2004. Distributed credits may only be used to offset corporate or individual income tax liabilities.
17
Table 5
CREDITS USED
Income Tax Sales TaxIndustry Group
Total Credits Earned
CreditsRecaptured
CreditsExpired
Construction, Electric and Gas, Stone, Clay, Glass and Concrete Products $ 1,427,472 $ 1,790,401 $ 236,199 $ (599,128)
Meat and Food Products 6,133,897 5,223,300 7,351,634 $ 319,224 $2,827,835 (9,588,096) Printing, Paper, Chemical, Plastics, Rubber, Textile and Other Non-Durable Products 9,781,161 778,862 8,503,837 325,365 142,103 30,994 Primary and Fabricated Metals and Wood
Product Manufacturing 971,295 336,200 440,334 194,761 Machinery, Electronic and Other Electrical
Total $65,474,726 $34,894,898 $51,221,202 $4,852,835 $2,881,327 $(28,375,536)
Analysis of Credits by Industry Group(2004)
Current Year Change to
Credit Balance
LB 775 INDUSTRY GROUP DETAIL
Analysis of Credits by Industry Group(Cumulative Through 2004)
18
Table 6
CREDITS USED
Income Tax Sales TaxIndustry Group
Total Credits Earned
CreditsRecaptured
CreditExpired
Construction, Electric and Gas, Stone, Clay, Glass and Concrete Products $ 39,772,950 $ 29,329,586 $ 5,053,322 $ 0 $ 0 $ 5,390,042 Meat and Food Products 282,574,848 83,448,332 99,796,633 1,569,060 8,271,325 89,489,498 Printing, Paper, Chemical, Plastics, Rubber, Textile and Other Non-Durable Products 273,393,654 20,430,469 68,274,290 670,169 5,929,650 178,089,076 Primary and Fabricated Metals and Wood Product Manufacturing 36,799,516 17,099,770 7,222,216 590,373 0 11,887,157 Machinery, Electronic and Other Electrical Equipment, Computer, Furniture, Transportation Equipment, Instruments and Miscellaneous Manufacturing 211,297,343 49,420,651 95,323,783 1,351,269 1,478,974 63,722,666 Durable and Non-Durable Goods 83,279,894 32,724,439 17,976,676 3,393,154 0 29,185,625 Railroads, Trucking, Air Transportation and Warehousing 319,132,295 87,511,724 45,803,657 5,801,902 707,582 179,307,430 Publishing, Communications, Information and Data Processing Services 211,663,345 85,564,233 31,413,818 3,975,648 0 90,709,646 Depository Institutions and Non-depository Credit Institutions, Security and Commodity Brokers, Insurance Carriers, Insurance Agents and Brokers 327,174,870 99,528,500 138,889,389 3,865,842 0 84,891,139 Engineering, Business, Management, Scientific, Repair, Sanitary and Miscellaneous Services 150,662,911 61,226,781 34,955,083 0 1,371,629 53,109,418 Total $1,935,751,626 $566,284,485 $544,708,867 $21,217,417 $17,759,160 $785,781,697
CreditBalance
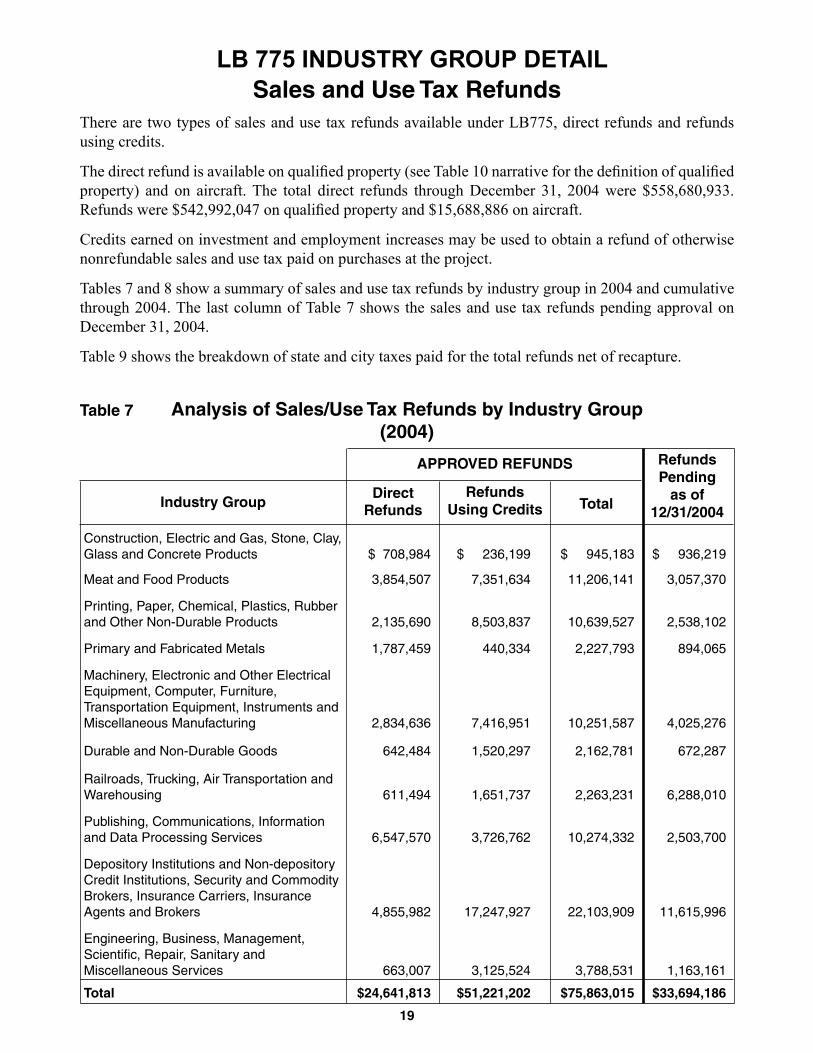
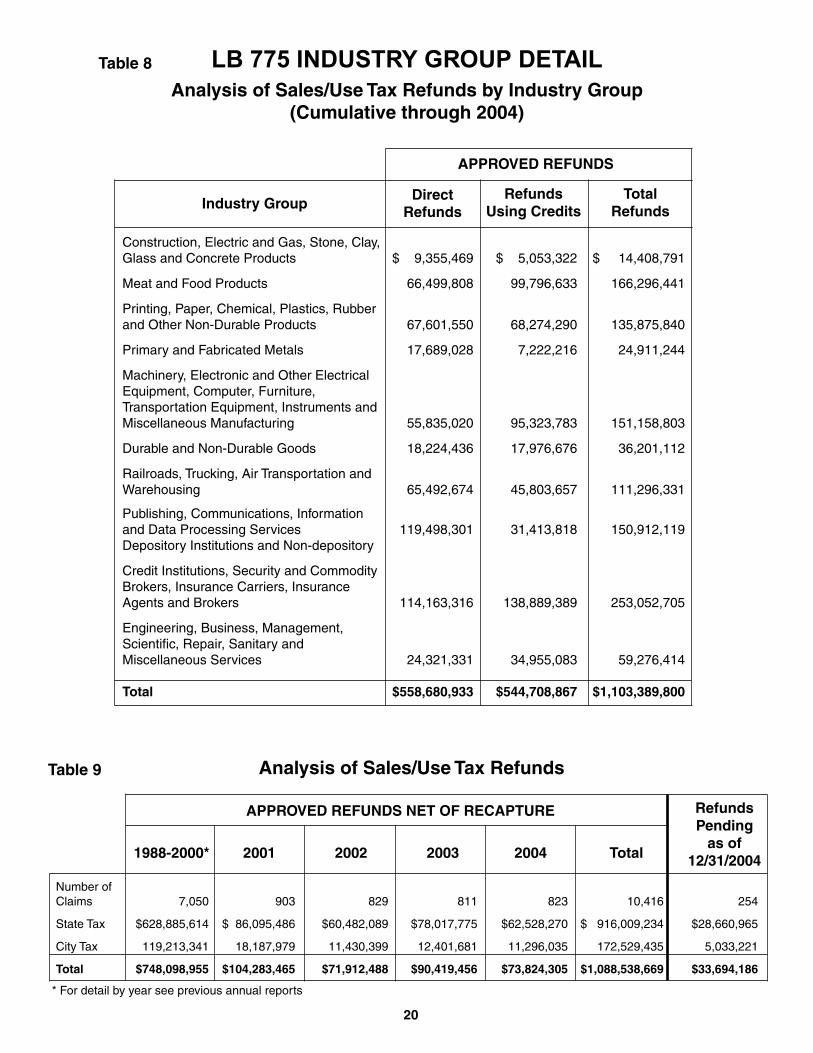
LB 775 INDUSTRY GROUP DETAILSales and Use Tax Refunds
There are two types of sales and use tax refunds available under LB775, direct refunds and refunds using credits.
The direct refund is available on qualified property (see Table 10 narrative for the definition of qualified property) and on aircraft. The total direct refunds through December 31, 2004 were $558,680,933. Refunds were $542,992,047 on qualified property and $15,688,886 on aircraft.
Credits earned on investment and employment increases may be used to obtain a refund of otherwise nonrefundable sales and use tax paid on purchases at the project.
Tables 7 and 8 show a summary of sales and use tax refunds by industry group in 2004 and cumulative through 2004. The last column of Table 7 shows the sales and use tax refunds pending approval on December 31, 2004.
Table 9 shows the breakdown of state and city taxes paid for the total refunds net of recapture.
19
Industry GroupDirect
RefundsRefunds
Using Credits
RefundsPending
as of12/31/2004
APPROVED REFUNDS
Analysis of Sales/Use Tax Refunds by Industry Group(2004)
Table 7
Total
Construction, Electric and Gas, Stone, Clay, Glass and Concrete Products $ 708,984 $ 236,199 $ 945,183 $ 936,219
Meat and Food Products 3,854,507 7,351,634 11,206,141 3,057,370
Printing, Paper, Chemical, Plastics, Rubber and Other Non-Durable Products 2,135,690 8,503,837 10,639,527 2,538,102
Primary and Fabricated Metals 1,787,459 440,334 2,227,793 894,065
Machinery, Electronic and Other Electrical Equipment, Computer, Furniture, Transportation Equipment, Instruments and Miscellaneous Manufacturing 2,834,636 7,416,951 10,251,587 4,025,276
Durable and Non-Durable Goods 642,484 1,520,297 2,162,781 672,287
Railroads, Trucking, Air Transportation and Warehousing 611,494 1,651,737 2,263,231 6,288,010
Publishing, Communications, Information and Data Processing Services 6,547,570 3,726,762 10,274,332 2,503,700
Depository Institutions and Non-depository Credit Institutions, Security and Commodity Brokers, Insurance Carriers, Insurance Agents and Brokers 4,855,982 17,247,927 22,103,909 11,615,996
City Tax 119,213,341 18,187,979 11,430,399 12,401,681 11,296,035 172,529,435 5,033,221
Total $748,098,955 $104,283,465 $71,912,488 $90,419,456 $73,824,305 $1,088,538,669 $33,694,186
* For detail by year see previous annual reports
21
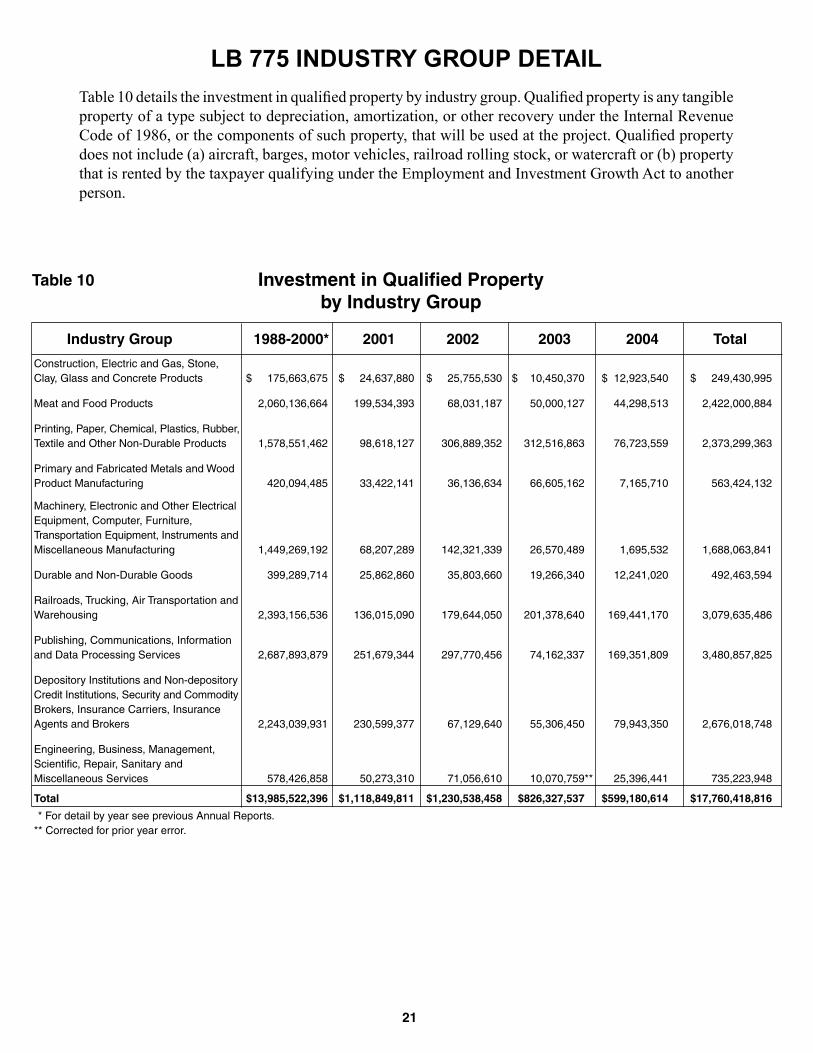
LB 775 INDUSTRY GROUP DETAILTable 10 details the investment in qualified property by industry group. Qualified property is any tangible property of a type subject to depreciation, amortization, or other recovery under the Internal Revenue Code of 1986, or the components of such property, that will be used at the project. Qualified property does not include (a) aircraft, barges, motor vehicles, railroad rolling stock, or watercraft or (b) property that is rented by the taxpayer qualifying under the Employment and Investment Growth Act to another person.
Investment in Qualified Propertyby Industry Group
Table 10
Construction, Electric and Gas, Stone, Clay, Glass and Concrete Products $ 175,663,675 $ 24,637,880 $ 25,755,530 $ 10,450,370 $ 12,923,540 $ 249,430,995
Meat and Food Products 2,060,136,664 199,534,393 68,031,187 50,000,127 44,298,513 2,422,000,884
Printing, Paper, Chemical, Plastics, Rubber, Textile and Other Non-Durable Products 1,578,551,462 98,618,127 306,889,352 312,516,863 76,723,559 2,373,299,363
Primary and Fabricated Metals and Wood Product Manufacturing 420,094,485 33,422,141 36,136,634 66,605,162 7,165,710 563,424,132
Machinery, Electronic and Other Electrical Equipment, Computer, Furniture, Transportation Equipment, Instruments and Miscellaneous Manufacturing 1,449,269,192 68,207,289 142,321,339 26,570,489 1,695,532 1,688,063,841
Durable and Non-Durable Goods 399,289,714 25,862,860 35,803,660 19,266,340 12,241,020 492,463,594
Railroads, Trucking, Air Transportation and Warehousing 2,393,156,536 136,015,090 179,644,050 201,378,640 169,441,170 3,079,635,486
Publishing, Communications, Information and Data Processing Services 2,687,893,879 251,679,344 297,770,456 74,162,337 169,351,809 3,480,857,825
Depository Institutions and Non-depository Credit Institutions, Security and Commodity Brokers, Insurance Carriers, Insurance Agents and Brokers 2,243,039,931 230,599,377 67,129,640 55,306,450 79,943,350 2,676,018,748
Total $13,985,522,396 $1,118,849,811 $1,230,538,458 $826,327,537 $599,180,614 $17,760,418,816
* For detail by year see previous Annual Reports.** Corrected for prior year error.
Industry Group 1988-2000* 2001 2002 2003 2004 Total
Overview of Employment by Industry TablesTables 11 through 14 provide information by industry group on employment for projects which have met the minimum required levels of employment and/or investment necessary to qualify for benefits. For each year of the entitlement period, the qualified $3 million and 30 full-time equivalent employee projects report information on full-time equivalent employee growth, average salaries and total Nebraska employment. The $20 million investment projects do not report the full-time equivalent employee growth because it is not a requirement for qualification.
The full-time equivalent employee calculation reported in Table 11 is based on the number of hours paid at the project divided by 40 times the number of weeks in the year. An employee with 60 hours worked in each week of the year would be counted as 1.5 FTE employees. This same computation is done in the current year and the tax year prior to the year of application. The increase or decrease in FTE employees is calculated by subtracting the FTE employees at the project in the tax year prior to the year of application from the number of FTE employees in the reporting tax year.
The total number of people employed at the quarter prior to date of application and at the most recent reporting period reported in Table 12 includes all employees of the taxpayer statewide on a specific date without regard to the number of hours those people have worked. In this case, the person who works 60 hours each week of the year would be reported as long as they were employed at the specific reporting date. The total number of people employed at the measuring points would also include any part-time, seasonal workers or non-project employees in Nebraska as long as they were employed in Nebraska by the taxpayer at the specific reporting date.
The numbers reported in Tables 11 and 12 are not comparable for the following reasons:
• The number of people employed for Table 12 is not measured the same as the number of full-time equivalent (FTE) employees shown in Table 11. The numbers shown in Table 12 are the number of people employed by the qualified LB 775 applicants statewide in Nebraska on a specific date, without regard to the number of hours those people worked.
• Table 11 does not include any information related to the $20 million dollar projects while Table 12 does report change in total employment for these projects.
• Table 11 includes the full-time equivalent growth only for the project as defined while Table 12 includes total statewide employment.
• Table 11’s total column reports cumulative FTE growth for all qualified projects since the enactment of LB775, including projects which are beyond the end of their entitlement period, while Table 12 only includes information for projects which are currently in their entitlement period.
22
23
LB 775 INDUSTRY GROUP DETAILNumber of New Jobs Created
Table 11 shows the number of new full-time equivalent (FTE) employees at the projects as compared to the prior year. The amount shown in the columns for each individual year is the increase or decrease from the previous year and does not represent the total change from the base year.The total column represents the full-time equivalent growth during the entitlement period for each project that has met the $3 million investment and 30 full-time equivalent employees since the enactment of the Employment and Investment Growth Act, LB775.A company is required to maintain a minimum of 30 FTE employee increase to avoid recapture. Please note: • A company that previously showed a FTE employee increase of 80 could fall back to a 30 FTE
employee increase without going into recapture. In this situation, the decrease of 50 FTE would be included in the current year column and the net increase of 30 would remain in the total column.
• If the company that previously showed a FTE employee increase of 80 ceased operations in Nebraska during the entitlement period, they would be in recapture. The decrease of 80 FTE would be included in the current year column and there would be zero FTE’s represented in the total column.
This year Table 11 has two industry groups where the change in FTE reported in 2003 as compared to the previous reported year is negative. There were companies in these industry groups which reported employment growth, however the overall industry total of all companies reporting was a negative number. The companies reporting a decline in employment would not be in recapture unless the full-time equivalent employment growth for the term of the project is below 30 FTE.
Number of Jobs Created by Industry GroupFull-Time Equivalent (FTE) Employees
Table 11
Industry Group 2001 2002 2003 2004 Total1988-2000*
Construction, Electric and Gas, Stone, Clay, Glass and Concrete Products 1,030 157 116 0 (22) 1,281
Meat and Food Products 15,326 595 311 208 570 17,010
Printing, Paper, Chemical, Plastics, Rubber and Other Non-Durable Products 4,817 81 124 162 221 5,405
Primary and Fabricated Metals 1,180 324 (113) 10 (28) 1,373
Machinery, Electronic and Other Electrical Equipment, Computer, Furniture, Transportation Equipment, Instruments and Miscellaneous Manufacturing 9,303 288 378 (461) 10 9,518
Durable and Non-Durable Goods 4,434 (41) (41) (10) 277 4,619
Railroads, Trucking, Air Transportation and Warehousing 6,010 (99) (448) (25) 267 5,705
Publishing, Communications, Information and Data Processing Services 3,701 318 (433) (177) 601 4,010
Depository Institutions and Non-depository Credit Institutions, Security and Commodity Brokers, Insurance Carriers, Insurance Agents and Brokers 12,441 (32) 243 227 223 13,102
Total Number of People Employedby Qualified LB 775 Applicants
by Industry Group
Industry Group
24
End of Quarter Prior to Date of
Application
Most Recent Reporting
DateIncrease
(Decrease)
Total Number of People Employed in Nebraskaby Qualified LB 775 Applicants
Table 12 shows a comparison of the total number of people employed in Nebraska by the qualified LB 775 applicants at the end of the quarter prior to the date of application with the total number of people employed in Nebraska on the most recent reporting date. No information is included for projects which are beyond the end of the seven-year entitlement period and are no longer earning new benefits. The total employment numbers for the projects which have selected and attained the $20 million investment level are included in Table 12.
Table 12
Construction, Electric and Gas, Stone, Clay, Glass and Concrete Products 2,262 2,577 315
Meat and Food Products 13,394 16,312 2,918
Printing, Paper, Chemical, Plastics, Rubber and Other Non-Durable Products 3,938 3,919 (19)
Primary and Fabricated Metals 1,519 1,688 169
Machinery, Electronic and Other Electrical Equipment, Computer, Furniture, Transportation Equipment, Instruments and Miscellaneous Manufacturing 10,605 7,323 (3,282)
Durable and Non-Durable Goods 4,114 5,585 1,471
Railroads, Trucking, Air Transportation and Warehousing 10,762 11,923 1,161
Publishing, Communications, Information and Data Processing Services 4,605 6,093 1,488
Depository Institutions and Non-depository Credit Institutions, Security and Commodity Brokers, Insurance Carriers, Insurance Agents and Brokers 11,300 11,940 640
*110,757,300 / 3,793 = 29,200 (Negative FTE and Adjustments excluded)
25
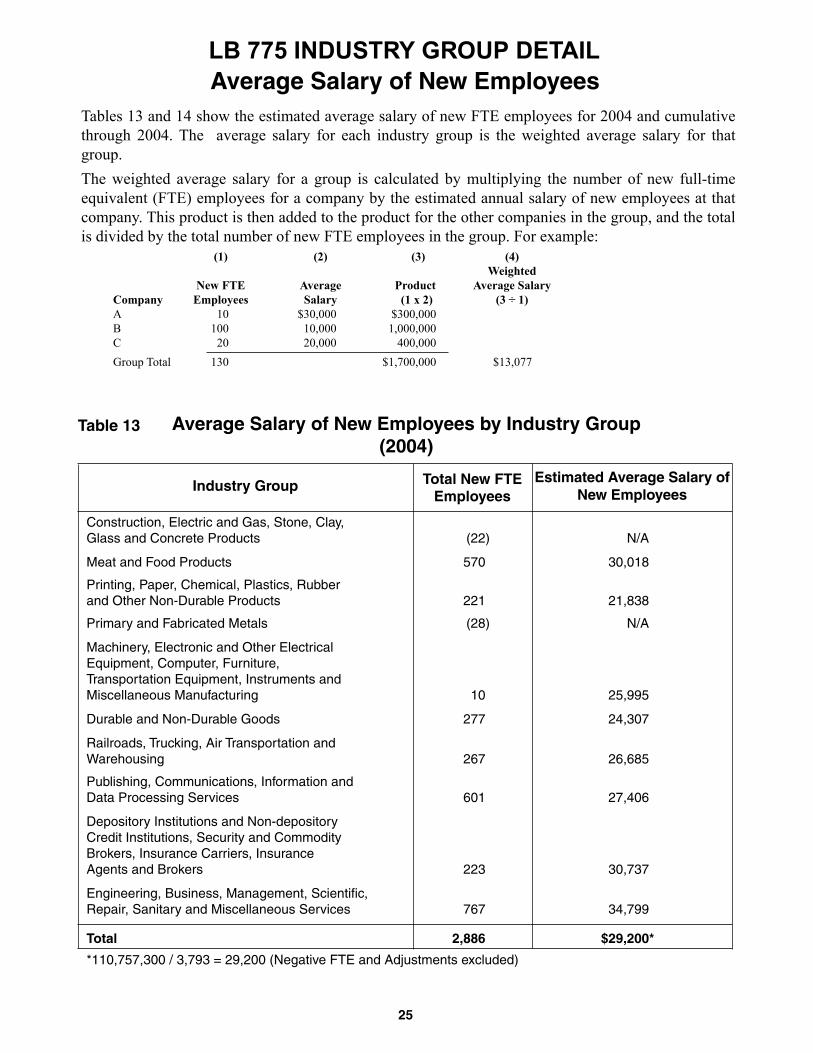
Table 13
Tables 13 and 14 show the estimated average salary of new FTE employees for 2004 and cumulative through 2004. The average salary for each industry group is the weighted average salary for that group.The weighted average salary for a group is calculated by multiplying the number of new full-time equivalent (FTE) employees for a company by the estimated annual salary of new employees at that company. This product is then added to the product for the other companies in the group, and the total is divided by the total number of new FTE employees in the group. For example: (1) (2) (3) (4) Weighted New FTE Average Product Average Salary Company Employees Salary (1 x 2) (3 ÷ 1) A 10 $30,000 $300,000 B 100 10,000 1,000,000 C 20 20,000 400,000 Group Total 130 $1,700,000 $13,077
Construction, Electric and Gas, Stone, Clay, Glass and Concrete Products 1,281 34,579
Meat and Food Products 17,010 23,745
Printing, Paper, Chemical, Plastics, Rubber and Other Non-Durable Products 5,405 27,153
Primary and Fabricated Metals 1,373 28,320
Machinery, Electronic and Other Electrical Equipment, Computer, Furniture, Transportation Equipment, Instruments and
Miscellaneous Manufacturing 9,518 28,395
Durable and Non-Durable Goods 4,619 28,167Railroads, Trucking, Air Transportation and Warehousing 5,705 38,766
Publishing, Communications, Information and Data Processing Services 4,010 26,636
Depository Institutions and Non-depository Credit Institutions, Security and Commodity Brokers, Insurance Carriers, Insurance Agents and Brokers 13,102 31,638
Total 75,468 28,347** **2,139,319,907 / 75,468 = 28,347
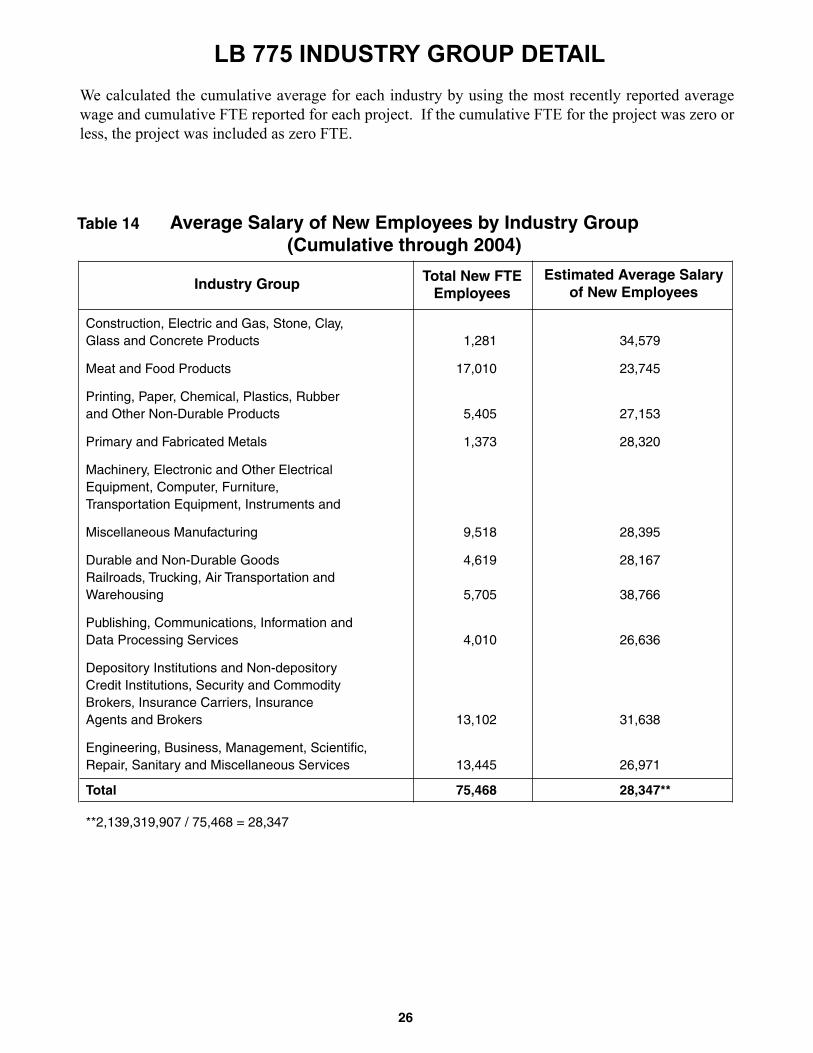
LB 775 INDUSTRY GROUP DETAIL
Average Salary of New Employees by Industry Group(Cumulative through 2004)
Industry GroupEstimated Average Salary
of New EmployeesTotal New FTE
Employees
26
Table 14
We calculated the cumulative average for each industry by using the most recently reported average wage and cumulative FTE reported for each project. If the cumulative FTE for the project was zero or less, the project was included as zero FTE.
27
Summary of Benefits by Year Qualification VerifiedTables 15-31 separate the data for the three hundred and sixty projects that have qualified for benefits by the end of 2004 into groups based on the year the department originally verified the company had qualified for benefits. In 2004, 240 companies had previously reached the end of their entitlement period and were no longer eligible to earn credits.
When a company qualifies for benefits under LB 775, the Department of Revenue will verify its eligibility for initial credits and sales and use tax refunds as soon as the company has the necessary documentation prepared. In following years, the taxpayer files its Form 775N with its Nebraska income tax return to claim additional credits.
In some instances, a fiscal year taxpayer that qualified in one year may not have filed its income tax return for the subsequent year until after the end of the next calendar year. For example, if a taxpayer qualified at the end of its June 30, 2002 tax year, the department might have verified its qualification in 2002. However, the company’s tax return, including its Form 775N, for the tax year ended June 30, 2003, might not have been filed until April 15, 2004. While the data for 2003 would show no additional credits for the company, any credits used or direct refunds of sales and use tax approved or pending would be included in the 2003 data.
For this reason only 13 of the 14 companies verified as qualifying in 2003 filed a Form 775N claiming additional credits in 2004. This pattern occurred in the prior years also.
Summary of Benefits by Year(Companies Verified as Qualifying in 1988)
Table 15
1988-2000* 2001 2002 2003 2004 Total
Number of Companies Reporting N/A 0 0 0 0 **
Investment Credits $41,798,873 0 0 0 0 $41,798,873 New Jobs Credits 22,938,078 0 0 0 0 22,938,078 Total Credits Earned $64,736,951 0 0 0 0 $64,736,951
Credits Used Income Tax $15,454,001 $ 515,032 $ 0 0 0 $15,969,033 Sales/Use Tax Refunds 45,922,109 485,780 23,968 0 0 46,431,857 Total Credits Used $61,376,110 $1,000,812 23,968 0 0 $62,400,890
Direct Sales/Use Tax Refunds on Investment $36,233,715 0 $127,743 0 $642,882 $37,004,340
New Jobs of Qualifying Companies 9,814 (56) 0 0 0 9,758
Pending Sales/Use Tax Refunds as of 12/31 N/A $1,295,766 $661,541 $892,979 $30,480 N/A
1989-2000* 2001 2002 2003 2004 Total
* For detail by year see previous Annual Reports.
** All projects approved in 1989 are past the end of their entitlement period. However, taxpayer amendments and audit adjustments to previous credits allowed or benefits received may still be reflected in current year credits earned.
* For detail by year see previous Annual Reports.
** All projects approved in 1990 are past the end of their entitlement period. However, taxpayer amendments and audit adjustments to previous credits allowed or benefits received may still be reflected in current year credits earned.
29
Summary of Benefits by Year(Companies Verified as Qualifying in 1991)
Summary of Benefits by Year(Companies Verified as Qualifying in 1992)
Table 18
Table 19
1991-2000* 2001 2002 2003 2004 Total
Number of Companies Reporting N/A 0 0 0 0 **
Investment Credits $43,711,262 0 $112,332 0 0 $43,823,594 New Jobs Credits 42,630,753 0 (6,193) 0 0 42,624,560 Total Credits Earned $86,342,015 0 $106,139 0 0 $86,448,154
Credits Used Income Tax $33,447,797 $ 538,144 $ 102,083 $1,752,733 $ 364,581 $36,205,338 Sales/Use Tax Refunds 25,706,435 2,007,210 1,541,068 2,020,488 877,124 32,152,325 Total Credits Used $59,154,232 $2,545,354 $1,643,151 $3,773,221 $1,241,705 $68,357,663
Direct Sales/Use Tax Refunds on Investment $28,873,444 0 $54,944 $1,470 0 $28,929,858
New Jobs of Qualifying Companies 7,147 270 0 0 0 $7,417
Pending Sales/Use Tax Refunds as of 12/31 N/A $681,648 $228,960 $357,181 $286,352 N/A * For detail by year see previous Annual Reports.
** All projects approved in 1991 are past the end of their entitlement period. However, taxpayer amendments and audit adjustments to previous credits allowed or benefits received may still be reflected in current year credits earned.
1992-2000* 2001 2002 2003 2004 Total
Number of Companies Reporting N/A 1 1 0 0 **
Investment Credits $32,362,207 $8,476 $536,668 $ (307,004) $(41,918) $32,558,429 New Jobs Credits 16,338,673 (527) 0 (1,718,777) (2,483) 14,616,886 Total Credits Earned $48,700,880 $7,949 $536,668 $(2,025,781) $(44,401) $47,175,315
Credits Used Income Tax $15,929,318 $1,305,143 $ 513,908 $ 690,677 $ 225,959 $18,665,005 Sales/Use Tax Refunds 16,253,009 1,402,774 1,455,662 1,152,193 1,064,359 21,327,997 Total Credits Used $32,182,327 $2,707,917 $1,969,570 $1,842,870 $1,290,318 $39,993,002
Direct Sales/Use Tax Refunds on Investment $13,136,216 0 0 $(68,457) 0 $13,067,759
New Jobs of Qualifying Companies 2,117 532 0 0 0 2,649
Pending Sales/Use Tax Refunds as of 12/31 N/A $408,227 $333,216 $363,175 $288,965 N/A * For detail by year see previous Annual Reports.
** All projects approved in 1992 are past the end of their entitlement period. However, taxpayer amendments and audit adjustments to previous credits allowed or benefits received may still be reflected in current year credits earned.
30
1994-2000* 2001 2002 2003 2004 Total
Number of Companies Reporting N/A 2 0 0 0 **
Investment Credits $76,678,701 $185,626 0 $(6,443,002) $(2,508,745) $67,912,580 New Jobs Credits 18,820,714 495,023 0 (178,825) 8,316 19,145,228 Total Credits Earned $95,499,415 $680,649 0 $(6,621,827) $(2,500,429) $87,057,808
Credits Used Income Tax $ 7,861,318 $ 865,818 $ 512,416 $1,101,312 $ 658,040 $10,998,904 Sales/Use Tax Refunds 10,760,118 3,918,990 2,237,106 1,047,389 6,591,438 24,555,041 Total Credits Used $18,621,436 $4,784,808 $2,749,522 $2,148,701 $7,249,478 $35,553,945
Direct Sales/Use Tax Refunds on Investment $24,860,113 $268,127 0 0 0 $25,128,240
New Jobs of Qualifying Companies 4,544 0 0 0 0 4,544
Pending Sales/Use Tax Refunds as of 12/31 N/A $372,089 $3,624,734 $261,853 $4,173,349 N/A * For detail by year see previous Annual Reports.
** All projects approved in 1993 are past the end of their entitlement period. However, taxpayer amendments and audit adjustments to previous credits allowed or benefits received may still be reflected in current year credits earned.
* For detail by year see previous Annual Reports.
** All projects approved in 1994 are past the end of their entitlement period. However, taxpayer amendments and audit adjustments to previous credits allowed or benefits received may still be reflected in current year credits earned.
31
1995-2000* 2001 2002 2003 2004 Total Number of Companies Reporting N/A 19 4 4 0 **
Investment Credits $174,399,339 $17,449,126 $25,339,681 $675,300 $(420,665) $217,442,781 New Jobs Credits 50,873,913 9,098,865 2,507,395 (21,010) (430,135) 62,029,028 Total Credits Earned $225,273,252 $26,547,991 $27,847,076 $654,290 $(850,800) $279,471,809
Credits Used Income Tax $56,070,590 $16,353,115 $ 3,659,974 $ 5,410,201 $ 2,986,396 $84,480,276 Sales/Use Tax Refunds 33,201,559 6,817,372 6,453,458 13,498,008 14,193,496 74,163,893 Total Credits Used $89,272,149 $23,170,487 $10,113,432 $18,908,209 $17,179,892 $158,644,169
Direct Sales/Use Tax Refunds on Investment $22,633,929 $6,866,379 $2,239,137 $978,046 $521,701 $33,239,192
New Jobs of Qualifying Companies 8,338 896 (22) (51) 0 9,161
Pending Sales/Use Tax Refunds as of 12/31 N/A $4,074,345 $4,102,748 $1,190,464 $2,396,484 N/A
* For detail by year see previous Annual Reports.
** All projects approved in 1995 are past the end of their entitlement period. However, taxpayer amendments and audit adjustments to previous credits allowed or benefits received may still be reflected in current year credits earned.
* For detail by year see previous Annual Reports.
** All projects approved in 1996 are past the end of their entitlement period. However, taxpayer amendments and audit adjustments to previous credits allowed or benefits received may still be reflected in current year credits earned.
32
Summary of Benefits by Year(Companies Verified as Qualifying in 1998)
Table 25
1998-2000* 2001 2002 2003 2004 Total
Number of Companies Reporting N/A 17 16 12 12 **
Investment Credits $26,536,446 $4,145,285 $4,755,285 $4,303,370 $1,246,119 $40,986,505 New Jobs Credits 6,650,659 2,458,230 2,530,974 2,780,500 1,013,298 15,433,661 Total Credits Earned $33,187,105 $6,603,515 $7,286,259 $7,083,870 $2,259,417 $56,420,166
Credits Used Income Tax $6,278,405 $4,302,197 $2,560,810 $ 597,872 $1,104,168 $14,843,452 Sales/Use Tax Refunds 2,735,091 949,407 758,764 755,361 1,596,539 6,795,162 Total Credits Used $9,013,496 $5,251,604 $3,319,574 $1,353,233 $2,700,707 $21,638,614
Direct Sales/Use Tax Refunds on Investment $51,921,773 $15,518,664 $14,281,845 $6,161,742 $765,157 $88,649,181
New Jobs of Qualifying Companies 5,232 348 (1,043) (185)** 124 4,476
Pending Sales/Use Tax Refunds as of 12/31 N/A $9,249,533 $5,119,592 $2,249,535 $4,328,207 N/A
Summary of Benefits by Year(Companies Verified as Qualifying in 1997)
* For detail by year see previous Annual Reports. ** Correction made to previous Annual Report. *** 25 companies had previously reached the end of their entitlement period and were no longer eligible to earn credits.
* For detail by year see previous Annual Reports. ** Eight companies had previously reached the end of their entitlement period and were no longer eligible to earn credits.
33
Summary of Benefits by Year(Companies Verified as Qualifying in 1999)
Table 26
Summary of Benefits by Year(Companies Verified as Qualifying in 2000)
Table 27
1999-2000* 2001 2002 2003 2004 Total
Number of Companies Reporting N/A 17 20 20 20 **
Investment Credits $22,900,176 $5,791,043 $11,146,419 $3,438,556 $2,300,043 $45,576,237 New Jobs Credits 5,895,114 2,790,963 3,464,230 3,408,249 3,554,343 19,112,899 Total Credits Earned $28,795,290 $8,582,006 $14,610,649 $6,846,805 $5,854,386 $64,689,136
Credits Used Income Tax $6,308,651 $4,015,692 $2,749,371 $3,686,724 $4,805,847 $21,566,285 Sales/Use Tax Refunds 1,613,974 1,714,173 899,177 2,352,962 3,280,195 9,860,481 Total Credits Used $7,922,625 $5,729,865 $3,648,548 $6,039,686 $8,086,042 $31,426,766
Direct Sales/Use Tax Refunds on Investment $10,892,426 $6,266,313 $2,826,685 $9,819,190 $1,668,775 $31,473,389
New Jobs of Qualifying Companies 1,192 11 87 214 412 1,916
Pending Sales/Use Tax Refunds as of 12/31 $2,338,005 $1,325,861 $6,032,435 $3,145,788 $2,989,818 N/A
* For detail by year see previous Annual Reports. ** Three companies had previously reached the end of their entitlement period and were no longer eligible to earn credits.
2000 2001 2002 2003 2004 Total
34
Summary of Benefits by Year(Companies Verified as Qualifying in 2002)
Table 29
Summary of Benefits by Year(Companies Verified as Qualifying in 2001)
Table 28
2002 2003 2004 Total
Number of Companies Reporting 18 8 15 *
Investment Credits $21,999,971 $2,037,994 $2,527,465 $26,565,430 New Jobs Credits 4,164,393 1,321,232 2,686,489 8,172,114 Total Credits Earned $26,164,364 $3,359,226 $5,213,954 $34,737,544
Credits Used Income Tax $743,502 $382,547 $3,175,658 $4,301,707 Sales/Use Tax Refunds 6,156 467,714 2,045,281 2,519,151 Total Credits Used $749,658 $850,261 $5,220,939 $6,820,858
Direct Sales/Use Tax Refunds on Investment $7,341 $2,418,973 $2,853,339 $5,279,653
New Jobs of Qualifying Companies 1,595 37 (202) 1,430
Pending Sales/Use Tax Refunds as of 12/31 $1,075,304 $2,123,691 $780,739 N/A * Two companies had previously reached the end of their entitlement period and were no longer eligible to earn credits.
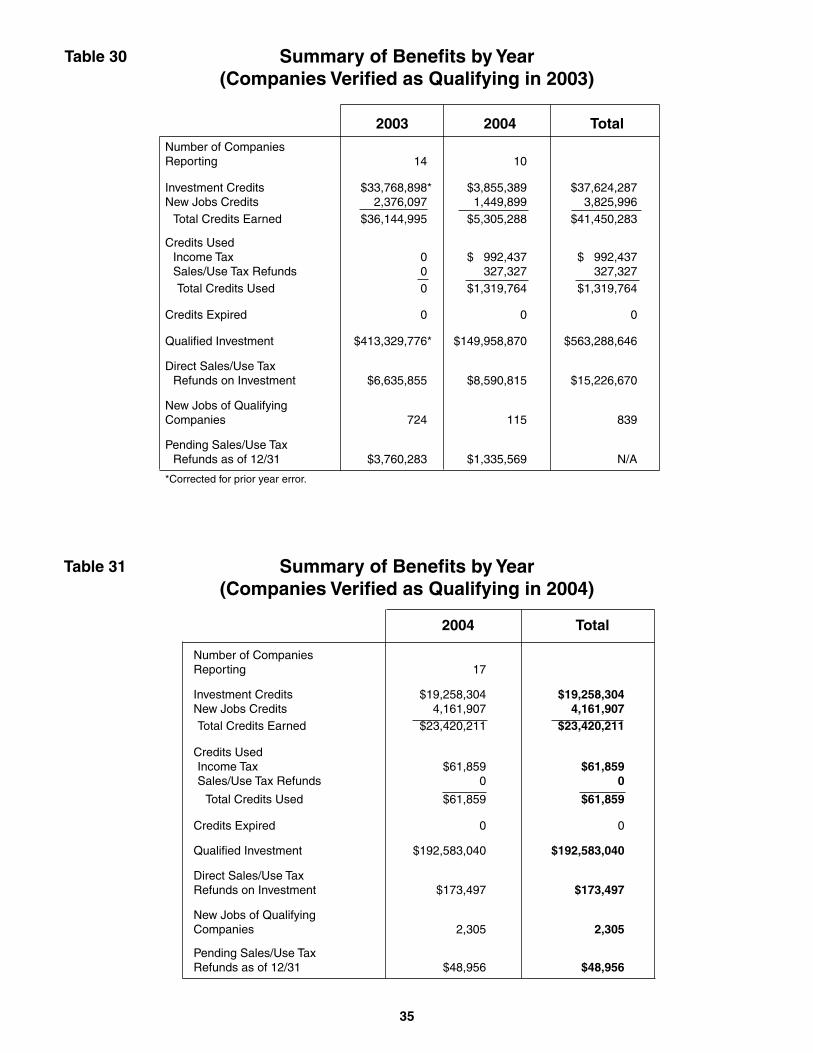
Number of Companies Reporting 16 6 12 14
Investment Credits $17,323,696 $3,100,980 $3,781,509 $3,328,043 $27,534,228 New Jobs Credits 2,294,786 782,348 2,057,378 1,999,771 7,134,283 Total Credits Earned $19,618,482 $3,883,328 $5,838,887 $5,327,814 $34,668,511
Credits Used Income Tax $1,077,604 $5,180,996 $2,421,865 $2,562,261 $11,242,726 Sales/Use Tax Refunds 103,594 417,902 1,595,498 1,171,928 3,288,922 Total Credits Used $1,181,198 $5,598,898 $4,017,363 $3,734,189 $14,531,648
Direct Sales/Use Tax Refunds on Investment $6,635,855 $8,590,815 $15,226,670
New Jobs of Qualifying Companies 724 115 839
Pending Sales/Use Tax Refunds as of 12/31 $3,760,283 $1,335,569 N/A
*Corrected for prior year error.
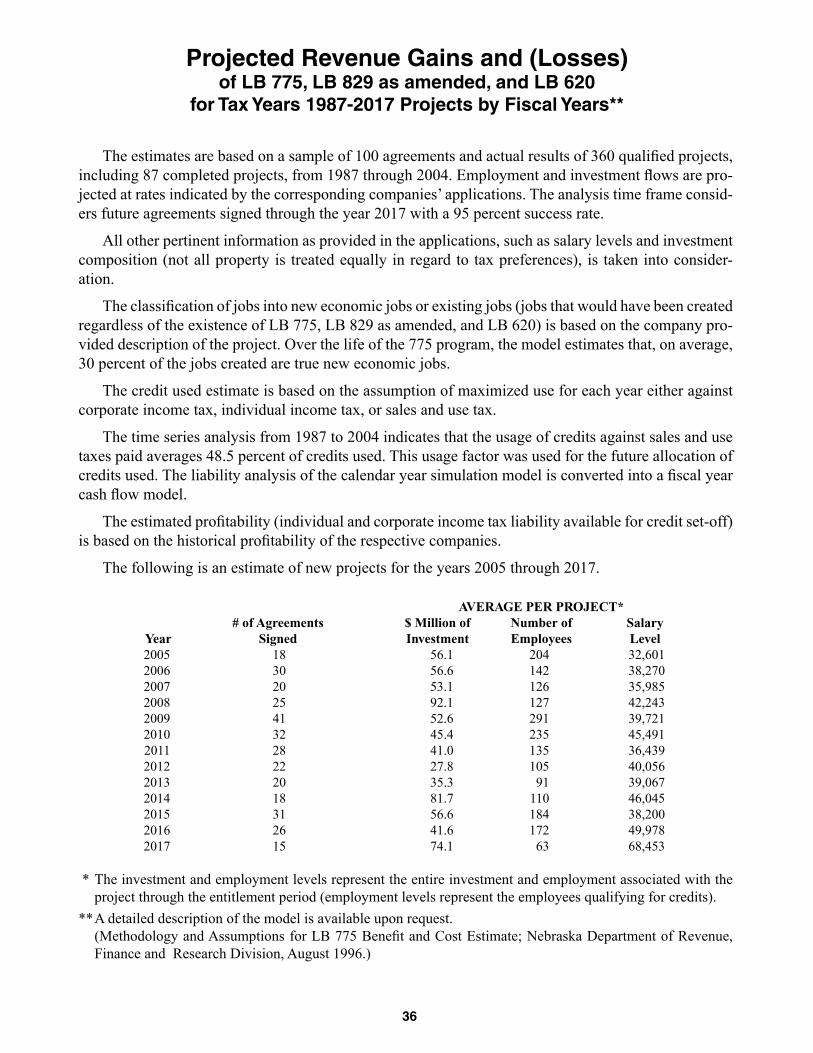
The estimates are based on a sample of 100 agreements and actual results of 360 qualified projects, including 87 completed projects, from 1987 through 2004. Employment and investment flows are pro-jected at rates indicated by the corresponding companies’ applications. The analysis time frame consid-ers future agreements signed through the year 2017 with a 95 percent success rate.
All other pertinent information as provided in the applications, such as salary levels and investment composition (not all property is treated equally in regard to tax preferences), is taken into consider-ation.
The classification of jobs into new economic jobs or existing jobs (jobs that would have been created regardless of the existence of LB 775, LB 829 as amended, and LB 620) is based on the company pro-vided description of the project. Over the life of the 775 program, the model estimates that, on average, 30 percent of the jobs created are true new economic jobs.
The credit used estimate is based on the assumption of maximized use for each year either against corporate income tax, individual income tax, or sales and use tax.
The time series analysis from 1987 to 2004 indicates that the usage of credits against sales and use taxes paid averages 48.5 percent of credits used. This usage factor was used for the future allocation of credits used. The liability analysis of the calendar year simulation model is converted into a fiscal year cash flow model.
The estimated profitability (individual and corporate income tax liability available for credit set-off) is based on the historical profitability of the respective companies.
The following is an estimate of new projects for the years 2005 through 2017.
AVERAGE PER PROJECT* # of Agreements $ Million of Number of Salary Year Signed Investment Employees Level 2005 18 56.1 204 32,601 2006 30 56.6 142 38,270 2007 20 53.1 126 35,985 2008 25 92.1 127 42,243 2009 41 52.6 291 39,721 2010 32 45.4 235 45,491 2011 28 41.0 135 36,439 2012 22 27.8 105 40,056 2013 20 35.3 91 39,067 2014 18 81.7 110 46,045 2015 31 56.6 184 38,200 2016 26 41.6 172 49,978 2017 15 74.1 63 68,453
* The investment and employment levels represent the entire investment and employment associated with the project through the entitlement period (employment levels represent the employees qualifying for credits).
** A detailed description of the model is available upon request. (Methodology and Assumptions for LB 775 Benefit and Cost Estimate; Nebraska Department of Revenue,
Finance and Research Division, August 1996.)
36
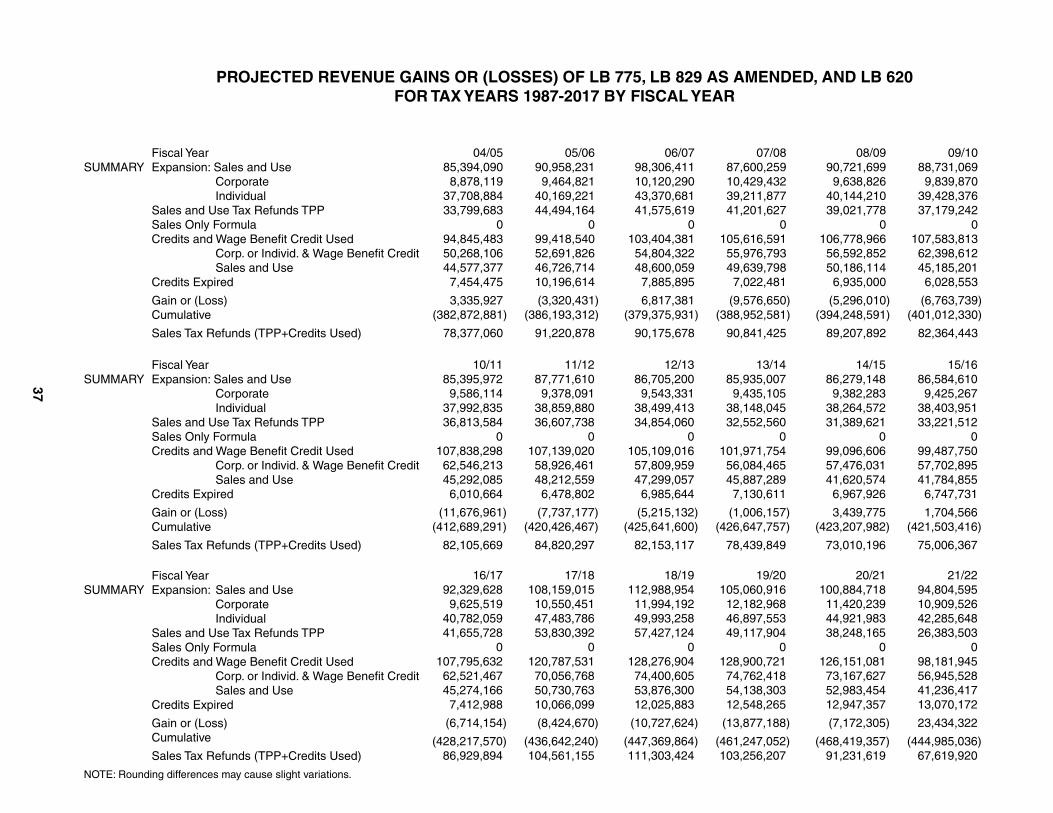
Projected Revenue Gains and (Losses)of LB 775, LB 829 as amended, and LB 620
for Tax Years 1987-2017 Projects by Fiscal Years**
37
PROJECTED REVENUE GAINS OR (LOSSES) OF LB 775, LB 829 AS AMENDED, AND LB 620 FOR TAX YEARS 1987-2017 BY FISCAL YEAR
Fiscal Year SUMMARY Expansion: Sales and Use Corporate Individual Sales and Use Tax Refunds TPP Sales Only Formula Credits and Wage Benefit Credit Used Corp. or Individ. & Wage Benefit Credit Sales and Use Credits Expired
Gain or (Loss) Cumulative
Sales Tax Refunds (TPP+Credits Used)
Fiscal Year SUMMARY Expansion: Sales and Use Corporate Individual Sales and Use Tax Refunds TPP Sales Only Formula Credits and Wage Benefit Credit Used Corp. or Individ. & Wage Benefit Credit Sales and Use Credits Expired
Gain or (Loss) Cumulative
Sales Tax Refunds (TPP+Credits Used) Fiscal Year SUMMARY Expansion: Sales and Use Corporate Individual Sales and Use Tax Refunds TPP Sales Only Formula Credits and Wage Benefit Credit Used Corp. or Individ. & Wage Benefit Credit Sales and Use Credits Expired
Gain or (Loss) Cumulative
Sales Tax Refunds (TPP+Credits Used)
NOTE: Rounding differences may cause slight variations.
Estimate of Personal Property Valuation ExemptedUnder LB 775 By Class In Each County
(Tax Year 2004)The following tables show the value of personal property exempted for 2004 and cumulative for tax years 1988-2004. When a company applies for LB 775 benefits under the $10 million investment and 100 employees option, a personal property tax exemption is available for ●• Turbine-powered aircraft used in connection with the project.The Department of Revenue conducts field reviews to verify that the companies have met the minimum of $10 million investment and 100 employees to qualify for property tax exemption on the following property used in connection with the project: ●• Mainframe business computers plus certain peripheral components connected to such computers, ●• Personal property, which is business equipment located in a single project involved directly in
the manufacture or processing of agricultural products.
Computer Business County Airplanes Equipment Equipment Total
Total .................... $535,371,009 $2,186,064,644 $4,955,557,475 $7,676,993,128
* Centrally assessed property with value distributed throughout the state. These figures represent our estimates of the values exempted.
Neb. Rev. Stat. §77-4933 states:
The Department of Revenue shall submit an annual report to the Legislature no later than March 15 each year. The report shall list (a) the agreements which have been signed during the previous calendar year, (b) the agreements which are still in effect, (c) the identity of each company, and (d) the location of each project.
The report shall also state by industry group (a) the amount of wage benefit credits allowed under the Quality Jobs Act, (b) the number of direct jobs created at the project, (c) the amount of direct capital investment under the act, (d) the estimated wage levels of jobs created by the companies at the projects, (e) the estimated indirect jobs and investment created on account of the projects, and (f) the projected future state and local revenue gains and losses from all revenue sources on account of the direct and indirect jobs and investment created on account of the project.
No information shall be provided in the report that is protected by state or federal confidentiality laws.
Quality Jobs Act LB 829(as amended by LB 1368)
40
The Quality Jobs Act, LB 829, requires a separate application subject to approval by the Quality Jobs Board. The members of the board are the Governor, the State Treasurer, and the chairperson of the Nebraska Investment Council. A qualifying business must invest at least $50 million in qualified prop-erty and hire at least 500 new employees or invest at least $100 million in qualified property and hire at least 250 new employees. If the company reaches and maintains these levels, they are eligible for a wage benefit credit. The company is to expend at least the value of the wage benefit credit for company training programs, employee benefit programs, educational institution training programs or workplace safety programs. There are five, active agreements signed under LB 829. The agreement specifies whether the com-pany has elected to use the credit against the company’s income tax or has elected to retain a portion of the Nebraska individual income tax withholding as designated by the employees. Wage benefit credits were allowed in 1998 through 2004, however due to confidentiality no informa-tion is reported. No new LB829 applications may be filed after February 1, 2000 without further authorization of the Legislature.
Agreements Signed in 1996 That are Still in Effect Company Name Project Type Project Location
1. Union Pacific Railroad Company $100M + 250 emp Omaha
LB 829 (as amended by LB 1368)Qualified Activity Reported in 2004
41
Agreements Signed in 1997 That are Still in Effect
Company Name Project Type Project Location
1. First Data Corporation $60M + 2000 emp Omaha
Agreements Signed in 1998 That are Still in Effect Company Name Project Type Project Location
1. Caterpillar Claas America LLC $60M + 500 emp Omaha Metro
2. Nebraska Beef, Ltd. $69M + 936 emp Omaha
Agreements Signed in 2000 That are Still in Effect
Company Name Project Type Project Location
1. Becton Dickinson and Company $146M + 287 emp Columbus, Broken Bow, and Holdrege
Neb. Rev. Stat. §77-27,195 states: (prior to amendment by LB 608 in 2003)
Report; contents. (1) The Tax Commissioner shall prepare a report identifying the amount of investment in this state and the number of equivalent jobs created by each taxpayer claiming a credit pursuant to the Employment Expansion and Investment Incentive Act. The report shall include the amount of credits claimed in the aggregate. The report shall be issued on or before March 15 of each year, beginning with March 15, 1988, for all credits allowed during the previous calendar year.
(2) In the report for any year in which a taxpayer located in an enterprise zone designated pursuant to the Enterprise Zone Act claimed a credit pursuant to subsection (3) of section 77-27,188, the Tax Commissioner shall identify (a) the amount of investment made in each enterprise zone by all taxpayers claiming credits, (b) the number of jobs created in each enterprise zone by all taxpayers claiming credits, (c) the number of jobs created in each enterprise zone by all taxpayers claiming credits held by residents of the enterprise zone, and (d) the average wage on an hourly basis or the average annual salary of new jobs created in each enterprise zone by all taxpayers claiming credits.
A separate application process is not required for this incentive program. The number of credits earned, jobs created, and investment made is reported by the filing a Nebraska Employment and Investment Credit Computation, Form 3800N, with a tax return. In order to earn credits, a company must be in a qualifying business and within the taxable year have an increase of $75,000 in qualifying investment and two new full-time equivalent employees. For five years after the initial year of qualification, the business may re-ceive additional credits for new employees without any additional investment. This report includes 1996 through 2003 tax returns processed during 2004. A total of 1,364 separate businesses have filed for benefits under LB 1124 through 2004. In 2004, the department approved 215 returns from businesses, 81 of which reported new investment made and/or employees hired. These 81 returns reflected the following: • Net new investment of $93,793,170 • New full-time jobs of 559 • Credits of $2,022,370, excluding the Enterprise Zone credits Seventy-seven returns processed in 2004 showed maintenance of past levels of employment and in-vestment. If a taxpayer fails to maintain the required levels of investment and employment for at least two years after the year for which the credit was first allowed, part of the used and unused credits are subject to recapture. During the subsequent two years, the taxpayer must repay to the state one-third of the amount of the credit subject to recapture for each year that the taxpayer did not maintain the required levels. Fifty-seven returns processed in 2004 reported recapture of past credits. Credits may be carried over and used for the five immediately succeeding taxable years. Any credit carryover remaining at the end of the fifth year expires.
Legislative Change: LB 608 was passed during the 2003 legislative session. LB 608 changed the provisions of the Employ-ment Expansion and Investment Incentive Act, the Act. The provisions of the Act, as described at the top of this page, are effective for tax years before 2004. For tax years beginning on or after January 1, 2004, the provisions of LB 608 must be met in order to earn credits under the Act. A company which created credits in tax years before 2004 may use these credits during its five year carryover period. The company must file to show maintenance of the required investment and employment levels for two years.
LB 1124, LB 270, as amendedQualified Activity Reported in 2004
44
Business Activity Summary
Processed Processed Processed Processed Processed 1988-2000(a) In 2001 In 2002 In 2003 In 2004 Total
Credits Expired $809,410 $90,430 $45,016 $33,404 $21,234 $999,494 (a) For detail by year see previous Annual Reports
(b) LB886 which was passed in 1997 changed the definition of a new employee from a full-time employee to a full-time equivalent employee operative for tax years beginning on or after January 1, 1998. This employee number includes full-time employees for 1997 and earlier.
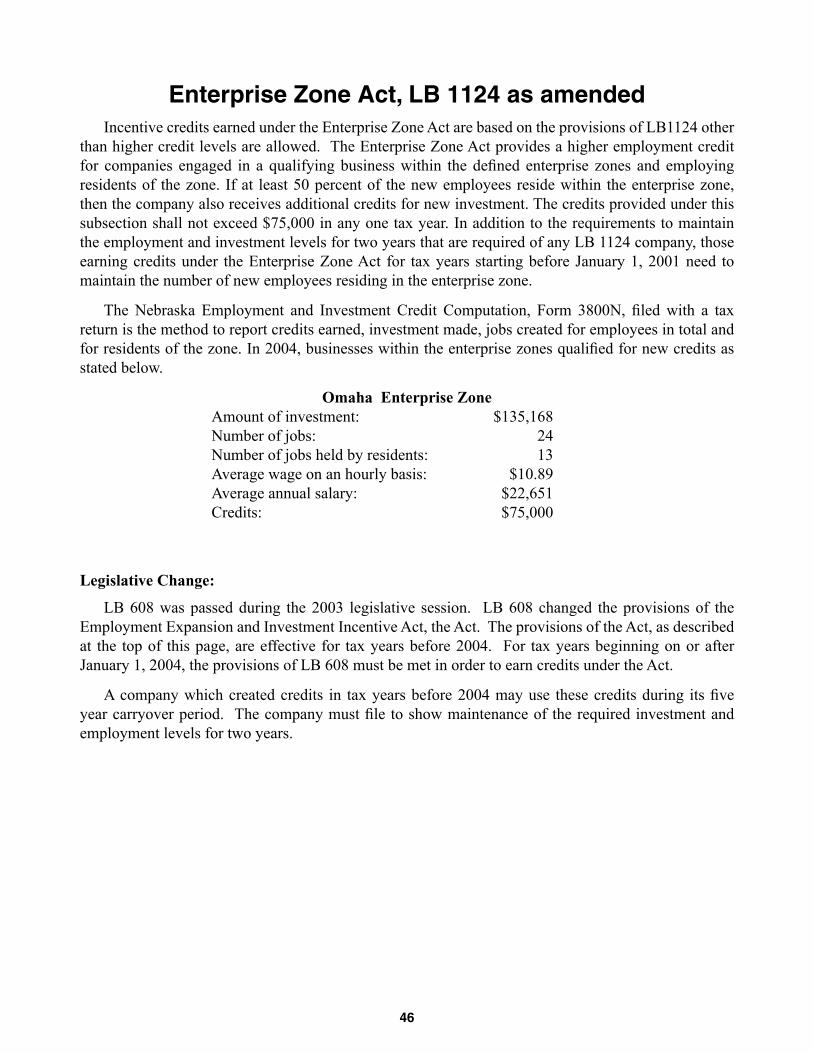
Enterprise Zone Act, LB 1124 as amended Incentive credits earned under the Enterprise Zone Act are based on the provisions of LB1124 other than higher credit levels are allowed. The Enterprise Zone Act provides a higher employment credit for companies engaged in a qualifying business within the defined enterprise zones and employing residents of the zone. If at least 50 percent of the new employees reside within the enterprise zone, then the company also receives additional credits for new investment. The credits provided under this subsection shall not exceed $75,000 in any one tax year. In addition to the requirements to maintain the employment and investment levels for two years that are required of any LB 1124 company, those earning credits under the Enterprise Zone Act for tax years starting before January 1, 2001 need to maintain the number of new employees residing in the enterprise zone.
The Nebraska Employment and Investment Credit Computation, Form 3800N, filed with a tax return is the method to report credits earned, investment made, jobs created for employees in total and for residents of the zone. In 2004, businesses within the enterprise zones qualified for new credits as stated below.
Omaha Enterprise Zone Amount of investment: $135,168 Number of jobs: 24 Number of jobs held by residents: 13 Average wage on an hourly basis: $10.89 Average annual salary: $22,651 Credits: $75,000
Legislative Change:
LB 608 was passed during the 2003 legislative session. LB 608 changed the provisions of the Employment Expansion and Investment Incentive Act, the Act. The provisions of the Act, as described at the top of this page, are effective for tax years before 2004. For tax years beginning on or after January 1, 2004, the provisions of LB 608 must be met in order to earn credits under the Act.
A company which created credits in tax years before 2004 may use these credits during its five year carryover period. The company must file to show maintenance of the required investment and employment levels for two years.
Neb. Rev. Stat. 77-5412. States: The Tax Commissioner shall submit an annual report to the Legislature no later than June 30 of each year.
The report shall state by industry group (a) the credits earned, (b) the credits used to reduce the corporate income tax and the credits used to reduce the individual income tax, (c) the number of jobs created, (d) the total number of employees employed by taxpayers at qualifying projects on the last day of the calendar quarter prior to the application date and the total number of employees employed by the taxpayers for the projects on subsequent reporting dates, (e) the expansion of capital investment, (f) the estimated wage levels of jobs created subsequent to the application date, (g) the total number of qualified applicants, (h) the projected future state revenue gains and losses, and (i) the credits outstanding.
No information shall be provided in the report that is protected by state or federal confidentiality laws.
49
LB936Qualified Activity Reported in 2004
The Rural Economic Opportunities Act, LB936, requires a separate application with the Nebraska Department of Revenue which states the planned employment, investment, and wages. The minimum required levels of investment, wages and employment vary by county and must meet the following re-quirements: • A full-time equivalent employment increase of at least one half of one percent of the county labor
force, • Investment of $100,000 times the number of required employees if the county labor force is
more than 3,000 and $50,000 times the number of required employees if the county labor force is 3,000 or less and
• Average annual wage equal to or greater than the average wage in the county or the region. The Rural Economic Opportunities Act expired as of July 1, 2004 without any applications being filed.
50
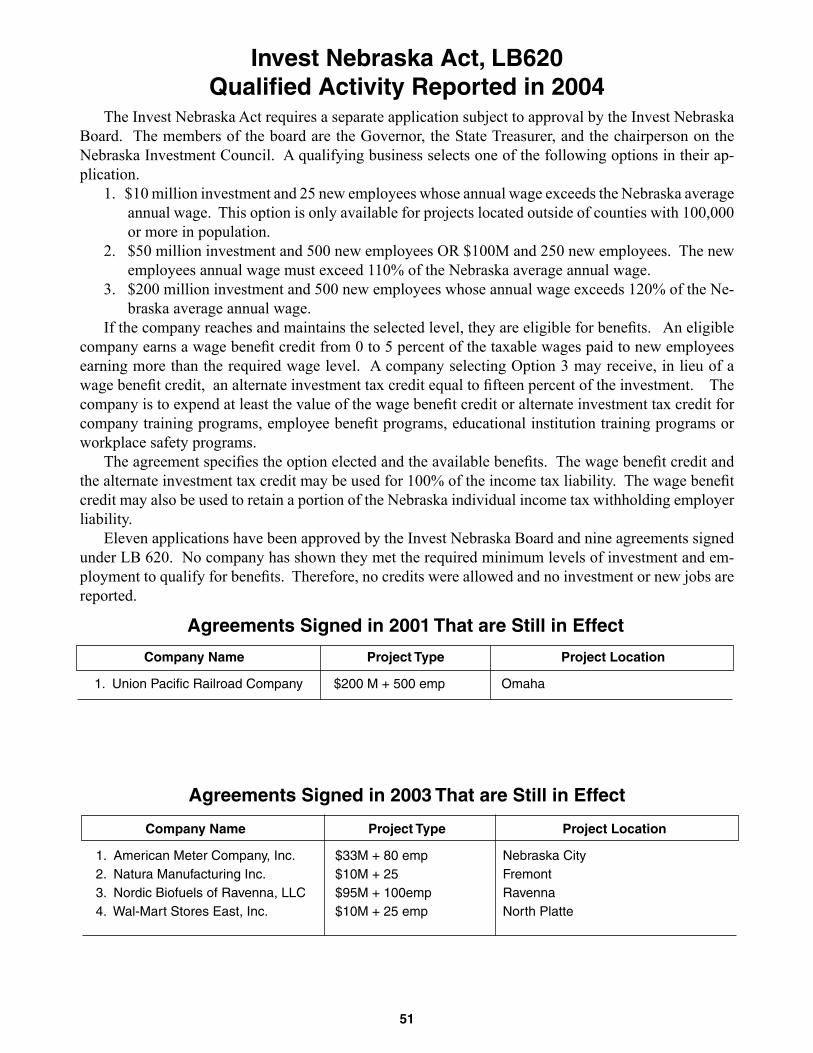
Invest Nebraska Act, LB 620, as amended
Neb. Rev. Stat. 77-5542 States:
(1) The Department of Revenue shall submit an annual report to the Legislature no later than March 15 each year. The report shall list (a) the agreements which have been signed during the previous calendar year, (b) the agreements which are still in effect, (c) the identity of each company, and (d) the location of each project. (2) The report shall also state by industry group (a) the amount of wage benefit credits and investment tax credits allowed under the Invest Nebraska Act, (b) the number of direct jobs created at the projects, (c) the amount of direct capital investment under the act, (d) the estimated wage levels of jobs created by the companies at the projects, (e) the estimated indirect jobs and investment created on account of the projects, and (f) the projected future state and local revenue gains and losses from all revenue sources on account of the direct and indirect jobs and investment created on account of the projects. (3) No information shall be provided in the report that is protected by state or federal confidentiality laws.
51
Invest Nebraska Act, LB620Qualified Activity Reported in 2004
The Invest Nebraska Act requires a separate application subject to approval by the Invest Nebraska Board. The members of the board are the Governor, the State Treasurer, and the chairperson on the Nebraska Investment Council. A qualifying business selects one of the following options in their ap-plication. 1. $10 million investment and 25 new employees whose annual wage exceeds the Nebraska average
annual wage. This option is only available for projects located outside of counties with 100,000 or more in population.
2. $50 million investment and 500 new employees OR $100M and 250 new employees. The new employees annual wage must exceed 110% of the Nebraska average annual wage.
3. $200 million investment and 500 new employees whose annual wage exceeds 120% of the Ne-braska average annual wage.
If the company reaches and maintains the selected level, they are eligible for benefits. An eligible company earns a wage benefit credit from 0 to 5 percent of the taxable wages paid to new employees earning more than the required wage level. A company selecting Option 3 may receive, in lieu of a wage benefit credit, an alternate investment tax credit equal to fifteen percent of the investment. The company is to expend at least the value of the wage benefit credit or alternate investment tax credit for company training programs, employee benefit programs, educational institution training programs or workplace safety programs. The agreement specifies the option elected and the available benefits. The wage benefit credit and the alternate investment tax credit may be used for 100% of the income tax liability. The wage benefit credit may also be used to retain a portion of the Nebraska individual income tax withholding employer liability. Eleven applications have been approved by the Invest Nebraska Board and nine agreements signed under LB 620. No company has shown they met the required minimum levels of investment and em-ployment to qualify for benefits. Therefore, no credits were allowed and no investment or new jobs are reported.
Agreements Signed in 2001 That are Still in Effect
Company Name Project Type Project Location
1. Union Pacific Railroad Company $200 M + 500 emp Omaha
Agreements Signed in 2003 That are Still in Effect
Company Name Project Type Project Location
1. American Meter Company, Inc. $33M + 80 emp Nebraska City 2. Natura Manufacturing Inc. $10M + 25 Fremont 3. Nordic Biofuels of Ravenna, LLC $95M + 100emp Ravenna 4. Wal-Mart Stores East, Inc. $10M + 25 emp North Platte
52
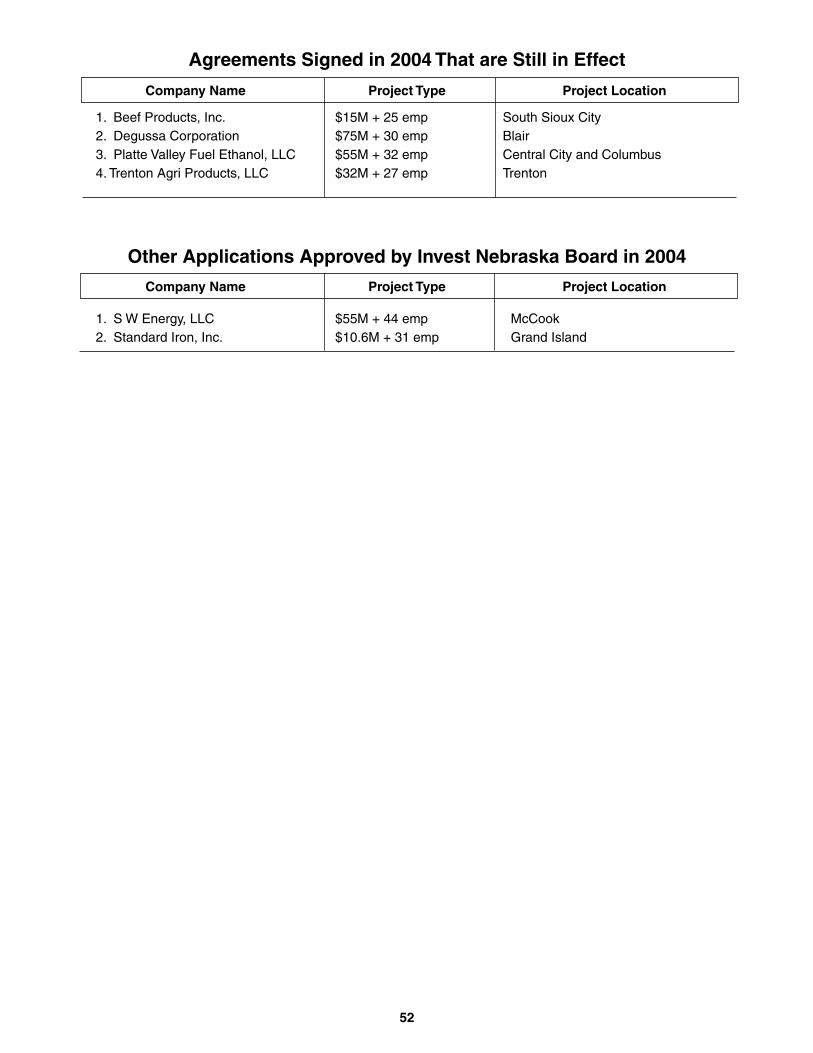
Other Applications Approved by Invest Nebraska Board in 2004
Company Name Project Type Project Location
1. S W Energy, LLC $55M + 44 emp McCook 2. Standard Iron, Inc. $10.6M + 31 emp Grand Island
Agreements Signed in 2004 That are Still in Effect
Company Name Project Type Project Location
1. Beef Products, Inc. $15M + 25 emp South Sioux City 2. Degussa Corporation $75M + 30 emp Blair 3. Platte Valley Fuel Ethanol, LLC $55M + 32 emp Central City and Columbus 4. Trenton Agri Products, LLC $32M + 27 emp Trenton
53
Employment Expansion and Investment Incentive Act, LB 608
Neb Rev. Stat. 77-27,195 states: The Tax Commissioner shall prepare a report identifying the amount of investment in this state and the number of equivalent jobs created by each taxpayer claiming a credit pursuant to the Employment Expansion and Investment Incentive Act. The report shall include the amount of credits claimed in the aggregate. The report shall be issued on or before March 15 of each year beginning with March 15, 1988, for all credits allowed during the previous calendar year.
54
Employment Expansion and Investment Incentive Act, LB 608 Qualifying Activity Reported in 2004
The Employment Expansion and Investment Incentive Act, as amended by LB 608, requires a quali-fying business to file an application with the Nebraska Department of Revenue. The first applications under LB608 could be filed for tax years beginning on or after January 1, 2004. The application must contain a plan of expansion that includes a minimum of five (5) new full-time equivalent Nebraska em-ployees who will be paid above the minimum required wage, and $250,000 of net new investment. The expansion must occur in a county with a population of less than twenty-five thousand inhabitants or in an enterprise zone. The application may be filed on or after the first day of the tax year and must request the total amount of desired benefits for additional investment and employment for the year the application is filed and the following tax year. There is a statutory limit on the total of benefits that may be approved for a year. The requested benefits are applied to the limit in the order in which the complete applications were filed. If the company reaches and maintains the required levels of investment and employment, they are eligible for a $3,000 credit for each new full-time equivalent Nebraska employee and a $2,750 credit for each $50,000 net gain in qualified investment.
Approved Application Activity
Year Number of Applicants Total Requested Benefits Statutory Limit on Benefits
2004 12 $713,000 $2,500,000
As of December 31, 2004, there have been no credits approved under LB608.