35
2007 General Market Reward Information Services Catalog Your guide to the industry’s most comprehensive total rewards benchmark information

2007 General MarketReward Information Services Catalog
Your guide to the industry’s most comprehensivetotal rewards benchmark information
Hay Group Reward Information Services for the General Market
On behalf of Hay Group’s General Market team, we invite you to join many of the world’s
leading organizations who are already members of our comprehensive information service.
Hay Group Reward Information Services helps clients in more than 60 countries utilize
compensation and benefits information. We understand reward information, design
individualized solutions, and put clients in control of the information they need whenever they
need it. Here we have outlined an overview of our services to the General Market, including:
� Hay Group’s broad and deep database of executive, professional/managerial, and non-
exempt positions covering a wide variety of compensation and benefits data, policies
and practices, and topics for the General Market; and
� Innovative approaches to areas such as market data analysis and applications.
We are committed to expanding our robust database and services, delivering solutions
that meet the specific needs of our clients. Clients have expressed tremendous interest
in rigorously managing their compensation expenses as they navigate a challenging
economy. Hay Group’s deep knowledge of the reward systems, combined with the
quality and completeness of our data, work measurement methodologies, and analytical
tools, will give you the confidence to make the best decisions regarding your
compensation programs.
No business is immune from the pressures of globalization. Whether you are
multinational or focused on a single market, your business needs to be able to see the big
picture to stay competitive. Hay Group PayNet provides you with a unique global
perspective on compensation and benefits. Our industry-leading methodologies ensure
consistent and comparable data, meaning we can help you understand what is happening
anywhere in the world.
This brochure describes our services in detail, and will acquaint you with the quality
organizations with whom we partner, the jobs, roles, components of pay covered in our
database, and the comprehensiveness of our offerings. We want to provide you with the
most current, accurate, and complete information in a timely and convenient format. We
hope that you will take advantage of our services and look forward to working with you.
Please contact the General Market team to participate or for more information.
Best regards,
Reward Information Services Hay Group, Inc.
General Market Sector
1-800-716-4HAY
http://www.haygroup.com/us/Expertise/index.asp?id=938

General Market Compensation Survey Catalog
i
Table of Contents
General Market Survey Participants ........................................................ii
Hay Group Reward Information Services
Key Differentiators .................................................................................1
General Market Team .............................................................................1
Hay Group Expertise in Measuring Job Content ......................................2
Hay Group Market Offerings ...................................................................2
Database Overview ................................................................................3
General Market Job Pricing Source ........................................................4
Surveyed Jobs ..........................................................................................5
Sample Report ..........................................................................................7
General Market Executive Compensation Report ....................................8
Surveyed Jobs ..........................................................................................9
Sample Reports ......................................................................................10
General Market Compensation Planning Guide .....................................12
Sample Report ........................................................................................13
Hay Group Local Area Pay Report ........................................................14
Hay Group Local Area Pay Report - PLUS ............................................15
Metropolitan Areas ..................................................................................16
Surveyed Jobs ........................................................................................17
Market Data Management.....................................................................18
Special Analysis ...................................................................................19
Hay Group Industry Reports .................................................................20
Benefits Prevalence Report ..................................................................21
Total Remuneration: Hay Group Solutions.............................................21
Hay Group PayNet ...............................................................................22
Hay Group Consulting Capabilities .......................................................23
About Hay Group ..............................................................back of catalog
For more information on Hay
Group’s consult ing services
for the general market,
please contact the
general market team at
(800) 716-4HAY.

General Market Compensation Survey Catalog
ii
General Market Survey Participants
For more information on Hay
Group’s consult ing services
for the general market,
please contact the
general market team at
(800) 716-4HAY.
A & N Electric Cooperative
ABB
ABD Insurance and Financial
Services
Abercrombie & Fitch
Ace Hardware
ACUITY
Admiral Insurance
Advance Auto Parts
Advantica
AEGON
Aeropostale
Aetna
AFC Enterprises
AGL Resources
Agrium U.S.
Ahold USA -- Stop & Shop
Supermarket
Air Liquide America
Air Products & Chemicals
Akzo Nobel
Alabama Electric Cooperative
Alcan
Alcon Laboratories
Alegent Health
Alex Lee
Alfa Insurance
All Seasons Services
Allegheny Energy
Allianz Life Insurance Company
of North America
Allied Domecq Dunkin' Brands
Altana
Altria Group -- Philip Morris
USA Operations
Amcor PET Packaging NA
America's Collectibles Network -
Jewelry Television
American Century Investments
American Century Investments
American Crystal Sugar
American Eagle Outfitters
American Family Insurance
Group
American Foundation for the
Blind
American International Group
American National Insurance
American Republic Insurance
Amerigroup
Ameriprise Financial
Ameritas Acacia
AmeriTrade Holding
AmSouth Bank
Amsted Industries
Amsted Industries -
ASF- Keystone
Amsted Industries - Baltimore
Aircoil
Amsted Industries - Brenco
Amsted Industries - Burgess
Norton
Amsted Industries -
Consolidated Metco
Amsted Industries -- Diamond
Chain
Amsted Industries - Griffin Pipe
Amsted Industries - Griffin
Wheel
Amsted Industries -- Means
Industries
Andersons
Andersons
Anheuser-Busch
Ann Taylor Stores
Apex/Cooper Power Tools
Applebee's International
Applebee's International
Aqua America
ARAMARK
Aramark
Arch Chemicals
Archer Daniels Midland
Archon Group
Arctic Slope Regional
Arctic Slope Regional - ARSC
Energy Services
Arctic Slope Regional - ASRC
Federal Holding
Arctic Slope Regional - Petro
Star
Arctic Slope Regional -
SKW/Eskimos
Argonne National Laboratory
Arkansas Blue Cross and Blue
Shield
Arkema
ArvinMeritor Inc.
Ascendia Company - Lander
Company
Ashland
Ashland - Ashland Distribution
Ashland - Ashland Specialty
Chemical
Ashland - Valvoline
Associated Materials
Assurant - Assurant Health
AT&T
Atmos Energy
Austin Commercial
AutoZone
Axalto
Axcan Pharma
B. E. Aerospace
Bacardi Limited - Bacardi
Bacardi Limited - Bacardi
Bottling
Baker Petrolite
Bally Management - Bally
Showroom
BAM International
Bank of America
Bank of Montreal - Harris
Bancorp
Barry Callebaut USA
Basell USA
BASF
Bayer MaterialScience
BBA Fiberweb America
Bechtel Bettis Atomic Power
Lab
Behr Industries Corporation
Bekaert
Belden -- Electronics cdt
Belden CDT
Belk
BellSouth
Berkshire Life Insurance
Best Buy
BJ's Restaurants
Blue Cross and Blue Shield
of Alabama
Blue Cross and Blue Shield
of Florida
Blue Cross and Blue Shield
of Kansas
Blue Cross and Blue Shield
of Kansas City, MO
Blue Cross and Blue Shield of
Massachusetts
Blue Cross and Blue Shield
of Rhode Island
Blue Cross Blue Shield
of Illinois
Blue Cross Blue Shield
of North Carolina
Blue Cross Blue Shield
of South Carolina
Bob Evans Farms -- Bob Evans
Restaurants
Boddie-Noell Enterprises
Boddie-Noell Enterprises -
Hardee's
Boddie-Noell Enterprises -
General Market Compensation Survey Catalog
iii
Texas Steakhouse & Saloon
BoJangles' Restaurants
BOK Financial
(Bank of Oklahoma)
Boston Beer
Boston Financial Data Services
BP America
Bramco
Bridgestone - Bridgestone
Americas Holding
Brinker International
Brinker International -- Chili's
Brinker International - Macaroni
Grill
Brinker International -
Maggiano's
Brinker International -
On the Border
Brookhaven National Laboratory
Brown & Sharpe
Brown - Forman
Brown Shoe Company
Buca
Buckman Laboratories
Buffalo Wild Wings
Buffet Partners - Furr's
Family Dining
Buffets
Buffets - Tahoe Joe's Steakhouse
Burger King
Burlington Northern and Santa
Fe Railway
Cabot
CACI International
California Independent System
Operator
Campbell Soup
Capital Blue Cross
Captain D's
CareFirst Blue Cross Blue Shield
Cargill
Caribou Coffee
Carlson Restaurants Worldwide
Carlson Restaurants Worldwide -
Pick Up Stix
Carlson Restaurants Worldwide -
TGI Friday's
Carolina Care Plan
CarrAmerica Realty
Carrols Holdings -- Pollo
Tropical
Carter's
Carus Chemical
Caterpillar
Caterpillar -- Solar Turbines
CBRL Group -- Cracker Barrel
Old Country Store
CBRL Group -- Cracker Barrel
Old Country Store
CEC Entertainment
Centene
CenterPoint Energy
Central Bancompany
CH Energy Group
Champion Technologies
Chantelle
Charles Schwab
Checkers Drive-In Restaurants -
Checkers/Rally's
Checks in the Mail
Cheddar's Restaurants
Cheesecake Factory
Chemtura
Chep USA
Chester County Intermediate
Unit
Chico's FAS
Children's Place
Chipotle Mexican Grill
CHS
CHS - Ag Business
CHS - Energy
CHS - Processing
Church & Dwight
Church & Dwight Co., Inc.
Ciba Specialty Chemicals
CIGNA
CIGNA
City National Bank
City of Arlington
City of Philadelphia -
Philadelphia Gas Works
CKE Restaurants
Claim Jumper Restaurants
Clariant
Clement Pappas
CNH Global
Coach
Coca-Cola
Coca-Cola Bottling
Coca-Cola Enterprises
Coffeyville Resources
Coffeyville Resources - Crude
Transportation
Coffeyville Resources -
Nitrogen Fertilizers
Coffeyville Resources -
Refining and Marketing
Coffeyville Resources - Terminal
Cognis
Colgate-Palmolive
Collin County
Colonial Banc Group
Comcast Cable Communications
Comerica
Commerce Bancshares
Commerce Insurance
Compass Group NAD
Computerized Medical Systems
ConAgra Foods
ConnectiCare
Connetics Corporation
Constellation Brands - Barton
Convergys
Cooper Industries
Cooper Industries - B-Line
Cooper Industries - Bussmann
Cooper Industries - Cooper
Hand Tools
Cooper Industries - Cooper Tools
Cooper Industries -
Crouse-Hinds ECM
Cooper Industries - Lighting
Cooper Industries -
Power Systems
Cooper Industries -
Wiring Devices
Copaken White & Blitt
Cosi
Costco Wholesale
COUNTRY Insurance &
Financial
Coventry Health Care
Cox Enterprises
Culvers Franchising System
CUNA Mutual
CVS
CYRO Industries
Cytec Industries
D&B
Daiichi Sankyo, Inc.
Dallas Morning News
Darden Restaurants
Darden Restaurants -
Bahama Breeze
Darden Restaurants -
Olive Garden
Darden Restaurants -
Red Lobster
Darden Restaurants -
Smokey Bones
Datascope
For more information on Hay
Group’s consult ing services
for the general market,
please contact the
general market team at
(800) 716-4HAY.
General Market Survey Participants (continued)

General Market Compensation Survey Catalog
iv
Dave & Buster's
Dave & Buster's -
Dave & Buster's
Day & Zimmerman
Deere
Deere -
John Deere Credit
Degussa
Del Monte Foods
Delaware North
Dell
Denny's - Denny's Restaurants
Des Moines Water Works
Diageo North America
Dick's Sporting Goods
Diversified Investment Advisors
Dofasco - Dofasco Tubular
Products
Dofasco - Dofasco Tubular
Products Mechanical
Dollar General
Dollar Tree Stores
Dominion Resources
Dominion Resources --
Dominion Delivery
Dominion Resources --
Dominion Energy
Dominion Resources --
Dominion Exploration &
Production
Dominion Resources -
Dominion Generation
Domino's Pizza
Donatos Pizza
Dow Chemical
Dow Reichhold Specialty Latex
DSM Nutritional Products
DSM Resins - DSM Chemicals
DuPage County Government
E & J Gallo
E*TRADE Financial
E. I. du Pont de Nemours -
Execs
E. I. du Pont de Nemours -
Exempts
E. I. du Pont de Nemours -
Pioneer Hi-Bred International
Eastman Chemical
Eastman Kodak - Imaging
Eaton
Eaton - Automotive Components
Eaton - Truck Components
Eaton Corporation - Eaton
Electrical
Eaton Corporation - Fluid Power
Edison International - Edison
Mission
Edward Jones
EFD Induction
Eisai
El Pollo Loco
ElectriCities of North Carolina
Electronic Data Systems
Elekta
Elkay Manufacturing
Elkay Manufacturing -
Mastercraft
Elkay Manufacturing -
Medallion Cabinets
Elkay Manufacturing -
Plumbing Division
Elkay Manufacturing -
Yorktowne Cabinets
Embry-Riddle Aeronautical
University
EMC National Life
EMD Chemicals
Ensign-Bickford Industries
Enzon Pharmaceuticals
Erie Insurance Group
Ernie Green Industries
Ernie Green Industries -
Florida Production Engineering
Esurance
Fabri-Kal Corporation
Falconbridge Limited -
Noranda Aluminum Group
Falconbridge Limited -
Noranda Primary
Falconbridge Limited -Noranda
Limited USA
Family Dollar Stores
Famous Dave's of America
FANUC America
Farmland Foods
FBL Financial Group
Federal Reserve Bank of Atlanta
Federal Reserve Bank of Dallas
Federal Reserve Bank of
St. Louis
Federated Department Stores
Federated Department Stores -
(North)
Federated Department Stores -
Bloomingdale's
Federated Department Stores -
Lord & Taylor
Federated Department Stores -
Macy's (East)
Federated Department Stores -
Macy's (Florida)
Federated Department Stores -
Macy's (Home Store)
Federated Department Stores -
Macy's (Midwest)
Federated Department Stores -
Macy's (Northwest)
Federated Department Stores -
Macy's (South)
Federated Department Stores -
Macy's (West)
Federated Department Stores,
Inc. - Bloomingdales.com
Federated Department Stores,
Inc. - Macys.com
FedEx
FedEx -- FedEx Express
FedEx -- FedEx Kinko's Office
and Print Services
Fidelity Investments
Fired Up, Inc. -- Johnny Carino's
Italian
Fireman's Fund Insurance
First Citizens Bancshares
First Data
FM Global
FM Global
FMC
Focused Health Solution
Foreign Affairs Norway
Formosa Plastics
Fortune Brands -- Beam Global
Spirits & Wine
Fosbel Inc.
Foster's Group Limited -
Foster's Wine Estates Americas
FPL Group - Florida Power &
Light
Friendly Ice Cream - Friendly
Family Restaurant
Frisch's Restaurants
Fuji Film Medical Systems
Fuller (H.B.)
G.D. Group
Galderma Laboratories
Gambrinus
Gap
Gap -- Banana Republic
Gap -- Forth and Towne
Gap -- Gap Brand
Gap -- Gap Inc. Direct
Gap -- Gap International
Gap -- Gap Outlet
Gap -- Old Navy
For more information on Hay
Group’s consult ing services
for the general market,
please contact the
general market team at
(800) 716-4HAY.
General Market Survey Participants (continued)

General Market Compensation Survey Catalog
v
Garden Fresh Restaurant -
Garden Fresh Restaurants
Gate Gourmet
GATX
GATX -- Rail
GCA Services Group
GE -- GE Equipment Services,
Modular Space
General Electric - GE Equipment
Services, Trailer Fleet Svcs
General Electric -- Medical
Systems
General Electric -- Medical
Systems
General Mills
Georgia Baptist Foundation
Georgia Gulf
Gerber Life Insurance
Girl Scouts of the USA
Global Cash Access
Golden Corral
Goodrich
Gorton's
GrafTech International
Grainger (W.W.)
Griffith Laboratories USA
Group Health Cooperative
Grupo Bimbo -
Bimbo Bakeries USA
GuideOne Insurance
GuideStone Financial Resources
of the Southern Baptist Conve
Hagemeyer North America
Hallmark Cards
Hallmark Cards - Retail
Hanson - Aggregate Products
Hanson - Brick & Tile
Hanson - Building Products
Hanson - Pipe & Products
Hanson Building Materials
America
Hard Rock Cafe
Harleysville Group
Harris Teeter
Hartford Insurance
Harvard Pilgrim
Harvard Vanguard Medical
Associates
Health Care Service
Health Net
Health Partners
HealthPartners
Heineken USA
Heinz (H.J.) - Heinz North
America
Helzberg Diamonds
Hercules
Hershey Foods
Hexion Specialty Chemicals
Hillsborough County Civil
Service Office
Hillwood Development
Hilti - U.S.
HIP Health Plan of New York
HMS Host
Hoeganaes
Home Depot
Hooters of America
Horizon Blue Cross Blue Shield
of New Jersey
Hormel Foods
HSBC Bank USA
Huber (J.M.)
Hudson City Bancorp
Huhtamaki
Hurco
Hutton Communications
IBERIABANK
ICOS
IHOP
Illinois Municipal Retirement
Fund
In-N-Out Burger
InBev - Inbev USA
Independence Blue Cross
Infineum USA
Ingersoll - Rand
Ingersoll - Rand Company
Limited - Climate Control
Ingersoll - Rand Company
Limited - Industrial
Technologies
Ingersoll - Rand Company
Limited - Security Technologies
Innophos
Institute of Nuclear Power
Operations
International Copper Association
International Dairy Queen -
Dairy Queen
International Flavors &
Fragrances
INVISTA
Irex
Iroquois Pipeline
J. C. Penney
J.Crew
Jack in The Box
Jack in the Box - Qdoba
Restuarant Group
Japan Tobacco - JT International
USA
Jewelers Mutual Insurance
John D. and Catherine T.
MacArthur Foundation
John H. Harland
John H. Harland Company -
Harland Printed Products
Joy Global - Joy Mining
Machinery
Joy Global, Inc.
JPI Partners
K & W Cafeterias
Kaiser Foundation Health Plan
Kaiser Permanente Colorado
Kaiser Permanente Northern
California
Kaiser Permanente Northwest
Region
Kansas City Life Insurance
Kellogg
Kennametal
Kimberly-Clark
Kinder Morgan
King Pharmaceuticals
Kinross Gold USA
Kohl's
La Madeleine de Corps
Lands' End
Latin American Argribusiness
Development
Legal Seafood
Lennox International
Liberty Mutual Insurance
LifeWay Christian Resources
Limited Brands
Limited Brands - Bath & Body
Works
Limited Brands -- Express
Limited Brands -- Henri Bendel
Limited Brands -- Limited Stores
Limited Brands - Victoria's
Secret Direct
Limited Brands -- Victoria's
Secret Stores
LIMRA International
Lincoln National
Linde AG - Selas Fluid
Processing
Linens 'n Things
Little Caesar Enterprises - Little
Caesar Pizza
For more information on Hay
Group’s consult ing services
for the general market,
please contact the
general market team at
(800) 716-4HAY.
General Market Survey Participants (continued)
General Market Compensation Survey Catalog
vi
Liz Claiborne
LOMA
Lonza
Loop - Logan Aluminum
Louisiana Pigment
Louisiana Workers'
Compensation
Lowe's
Lubrizol
Lucite International
LVMH Moet Hennessy Louis
Vuitton - Moet Hennessy USA
Lyondell Chemical
M&T Bank
MacDermid
Main Street Restaurant Group
Maritrans
Marmon Group - Union Tank
Car
Marshall & Ilsley
Marshall & Ilsley - Metavante
Massachusetts Mutual Life
Insurance
MassMutual Life Insurance -
OppenheimerFunds
Mattel
Mattel - American Girl Place
Matthews International
Mayne Pharma (USA)
McCormick & Company
McDonald's
McDonald's - Boston Market
McGraw-Hill
MeadWestvaco - Consumer &
Office Products
MeadWestvaco - Consumer
Solutions
MeadWestvaco - Corporate
MeadWestvaco - Packaging &
Paperboard
MeadWestvaco - Paper
MeadWestvaco - Pulp Sales
MeadWestvaco - Specialty
Chemicals
Medco Health Solutions
MedImmune
MedPlans Partners
MedPointe Pharmaceuticals, Inc.
Meijer
Merrill Lynch - US Private
Client Services
Mervyns
MetLife
Metromedia Restaurant Group
Metromedia Restaurant Group -
Bennigan's
Metromedia Restaurant Group -
Ponderosa
Metromedia Restaurant Group -
Steak & Ale
Metso Minerals Industries
Michaels Stores
Michelin North America
Mid-Carolina Electric
Cooperative
Mid-Continent Research for
Education and Learning
Midland Cogeneration Venture
Midwest Independent
Transmission System Operator
Minnkota Power Cooperative
Mirant
Mitsubishi International
Mitsubishi Polycrystalline
Silicon America
Mittal Steel
Modine Manufacturing
Montana Dakota Utility
Moog
Morton's Restaurant Group -
Morton's of Chicago
Mosaic
Mutual Federal Savings Bank
Mutual of America
MVP Health Care
Nabi Biopharmaceuticals
NACCO Materials Handling
Nashville Electric Service
National City
National Fuel Gas
National Western Life
Nationwide Mutual Insurance
Nature's Path Foods
NCCI Holdings
Neighborhood Health Plan
Neiman Marcus Group
Neiman Marcus Group -
Bergdorf Goodman
Nestle USA
New Jersey Economic
Development Authority
New Jersey Transit
New York & Company
New York Power Authority
NewAlliance Bancshares
Newark InOne
NewMarket
Nordstrom
Northrop Grumman - Newport
News
NOVA Chemicals
Novelis
Noveon
Novo Nordisk Pharmaceuticals
NPC - Pizza Hut
Nuclear Management
O'Charley's
O'Charley's - Ninety Nine
Restaurant & Pub
O'Charley's - O'Charley's
O'Charley's - Stoney River
Occidental Petroleum -
Occident Chemical
Ocean Spray Cranberries
Office Depot
OfficeMax
Ohio Casualty Group
Orange County Transportation
Orbital Sciences
Organon USA
OSI Restaurant Partners
OSI Restaurant Partners -
Bonefish Grill
OSI Restaurant Partners -
Carrabba's Italian Grill
OSI Restaurant Partners -
Cheeseburger in Paradise
OSI Restaurant Partners -
Fleming's Prime Steakhouse
OSI Restaurant Partners -
Lee Roy Selmon's
OSI Restaurant Partners -
Outback Steakhouse
OSI Restaurant Partners -
Roy's
P.F. Chang's China Bistro
P.F. Chang's China Bistro -
P.F. Chang's
P.F. Chang's China Bistro -
Pei Wei
Pacific Sunwear of California
Panda Restaurant Group
Panera Bread - Panera Bread
Papa Gino's
Papa John's International -
Papa John's Pizza
Par Pharmaceuticals
Partnership HealthPlan of
California
Patheon Pharmaceuticals
Pathmark Stores
Payless ShoeSource
Penn National Insurance
For more information on Hay
Group’s consult ing services
for the general market,
please contact the
general market team at
(800) 716-4HAY.
General Market Survey Participants (continued)

General Market Compensation Survey Catalog
vii
Penske Truck Leasing
Pepsi Bottling Group
Perfetti Van Melle USA
Perkins Restaurant & Bakery
Pernod Ricard SA -
Pernod Ricard USA
Petro-Canada
PETsMART
Philips Electronics -
North America
Philips Electronics -
Philips Medical Systems
Philips Electronics -
Philips Medical Systems
Phillips-Van Heusen
Physicians Mutual Insurance
Piaggio
Piccadilly Restaurants
Pier 1 Imports
Pilgrim's Pride Corporation
Pilkington
PJM Interconnection
Polo Ralph Lauren
Port Authority of New York
and New Jersey
Potash Corporation of
Saskatchewan
Potbelly Sandwich Works
PPG Industries
PPG Industries - Chemicals
PPG Industries - Coatings
& Resins
PPG Industries - Glass
PPG Industries - Transitions
Optical
PRA International
Praxair
Premera Blue Cross
Premier
Principal Financial Group
Private Healthcare Systems
Procter & Gamble
Professional Services
Progress Energy
Project HOPE
Property Casualty Insurers
Association Of America
Public Works Commission of
Fayetteville, North Carolina
Pulte Homes
Pulte Mortgage
Quiznos Sub
RadioShack Corporation
Ranbaxy Pharmaceuticals
Rare Hospitality
Rare Hospitality - Bugaboo
Creek Steak House
Rare Hospitality - Capital Grille
Rare Hospitality - Longhorn
Steaks
Real Mex Restaurants
Real Mex Restaurants - Chevys
Real Mex Restaurants - El Torito
Red Robin Gourmet Burgers
Regence Group
Remy Cointreau USA
Rhodia
Richemont North America
Riverain Medical
Riverstone Resources, Inc.
RLI
Roadhouse Grill
Roche Diagnostics
Rock Bottom Restaurants
Rock Bottom Restaurants -
Brewery Division
Rock Bottom Restaurants -
Old Chicago
Rohm and Haas
Rose Hills Company
Round Table Pizza
Ruby Tuesday
Ruth's Chris Steak House
RWE Thames Water -
American Water Works
Ryan's Family Steak House
SABMiller -- Miller Brewing
Sacramento Municipal Utilities
District
Safe Auto Insurance Company
Saint-Gobain -- Abrasives
Saint-Gobain -- Calmar
Saint-Gobain -- Ceramics
Saint-Gobain -- Containers
Saint-Gobain -- Delegation
Saint-Gobain -- Vetrotex
Saint-Gobain Corporation -
Certain Teed
Saks
Sanmina-SCI Corporation
Sara Lee - Branded Apparel
Sasol North America
Save Mart Supermarkets
Sazerac
Schefenacker
Schwarz Pharma
Scottrade
Scotts Miracle-Gro
Sears Holding -
Sears, Roebuck and Co.
Sears Holding Corporation
Sears Holdings - Kmart
Securian
Security Mutual Life Insurance
of New York
Seed Restaurant - Fazoli's
Sentara Healthcare
Sepracor
Serono
Severstal North America
Shelter Insurance
Shepherd Chemical Company
Shoney's
ShopKo Stores - ShopKo Stores
Siegwerk USA Inc.
Siemens -- Siemens
Medical Systems
Sierra Southwest Co-Op
Services
SKD Automotive Group
Smart & Final
Sodexho Alliance -- Sodexho
Solvay America
Solvay America - Engineered
Polymers
Solvay America - Solvay
Advanced Polymers
Solvay America - Solvay
Chemicals
Solvay America - Solvay
Pharmaceuticals
Solvay America - Solvay
Pharmaceuticals
Solvay America -
Solvay Solexis
Sonnenschein Nath & Rosenthal
SonoSite
South Jersey Industries
South Jersey Industries - South
Jersey Gas
Southern Chemical Corporation
Southern Company
Southern Minnesota Municipal
Power Agency
Southern Star Concrete
Southern Union
Southern Union -
Missouri Gas Energy
Southern Union -
Panhandle Energy
Southwest Gas
Spacelabs Medical, Inc.
For more information on Hay
Group’s consult ing services
for the general market,
please contact the
general market team at
(800) 716-4HAY.
General Market Survey Participants (continued)

General Market Compensation Survey Catalog
viii
Springs Industries
Stage Stores - Bealls
Stage Stores - Palais Royal
Stage Stores - Peebles
Stage Stores - Stage
Stage Stores, Inc.
Stanadyne
Staples
Starbucks Coffee
State Farm Insurance - State
Farm Investment Mgmt
Steak n Shake
Sterling Chemicals
STRs Ohio
SUEZ Energy
Sun Life Financial
Sunoco - Chemical
SuperValu
Supresta
Swarovski (D.) - Swarovski
North America
Syntroleum Corporation
SYSCO
T. Rowe Price
T.D. Williamson
Taco John's International -
Taco John's
TAL International Container
Target
Tarrant County
Tasty Baking Company
Tate & Lyle Americas
Tate & Lyle Americas -
Ingredients Americas
Tate & Lyle Americas -
Tate & Lyle Sucralos
TD Banknorth
Telvent
Texas Christian University
Texas Gas Transmission
Texas Mutual Insurance
Texas Society of Certified
Public Accountants
Texas United Bancshares
The Bon-Ton Stores
The Home Depot -
Hughes Supply
The Jacmar Companies -
Shakey's USA
Thermadyne
Thomas & King
TIAA-Cref
TJX
Tommy Hilfiger
Tomotherapy
Too
Toshiba America Medical
Systems
TOTAL S.A. - Total
Petrochemicals USA
Totes Isotoner
Toyota Material Handling, USA
Toys R Us
Toys R Us - Babies R Us
Toys R Us - Toys R Us
Travis County Human Resources
Management Department
Triarc Restaurant Group - Arby's
Tronox
Tufts Health Plan
TXU
Tyson Foods
UGI
Umicore
Unilever US
Union Pacific
Uniqema Americas
Unisource Worldwide
United Health Care
United Space Alliance
United States Steel
United Stationers Inc.
United Supermarkets
United Water
Unitil
Universal Parks & Resorts -
Universal Orlando
Universal Parks & Resorts -
Universal Studios Hollywood
Universal Underwriters
University of Dayton
University of Southern
California
University of Texas Medical
Branch at Galveston
Uno Restaurant Holding -
Pizzeria Uno
Valero Energy
Valley Services
Valmont - International
Valmont - Tubing
Valmont - Utilities
Valmont Industries
Valmont Industries - Coatings
Valmont Industries - Irrigation
Valmont Industries - Structures
Division
Vanguard Group
Varian Medical Systems
Vectren
Vicorp Restaurants
VICORP Restaurants -
Village Inn
Visit Britain
Voith Fabrics
Wachovia
Wackenhut Services
Wal-Mart Stores
Wal-Mart Stores - Sam's Club
Wal-Mart Stores - Stores and
Super Stores
Walt Disney - Walt Disney
World
Walt Disney Company, The
Watson Pharmaceuticals
Welch Allyn, Inc.
Wellmark Blue Cross
Blue Shield
Wellpoint - WellPoint Health
Networks
Wells Fargo -- Private Client
Services
Wendy's
Wendy's - Wendy's
Western Health Advantage
Western Southern Life Insurance
Western Southern Life Insurance
Company
Westfield Group
Westlake Chemical
Whataburger
Whirlpool - Maytag Corporation
White Castle System
Wienerberger - General Shale
Brick
William L. Bonnell
Williams Companies
Williams-Sonoma
Williams-Sonoma - Outlet Stores
Williams-Sonoma - Pottery Barn
Williams-Sonoma - Pottery Barn
Kids Store
Williams-Sonoma - West Elm
Williams-Sonoma -
Williams-Sonoma Home
Williams-Sonoma -
Williams-Sonoma Stores
Wills Group
Winterthur North America
Wolverine Worldwide
Women's Integrated Network
Workers Compensation Fund
For more information on Hay
Group’s consult ing services
for the general market,
please contact the
general market team at
(800) 716-4HAY.
General Market Survey Participants (continued)
General Market Compensation Survey Catalog
ix
World Bank Group
World Insurance
World Insurance
World Society for the Protection
of Animals USA
WPS Resources
Xerox
Yum!
Yum! - YRI
Yum! - KFC
Yum! - Long John Silver's
Yum! - Pizza Hut
Yum! - Taco Bell
Yves Rocher
ZF North American Operations
For more information on Hay
Group’s consult ing services
for the general market,
please contact the
general market team at
(800) 716-4HAY.
General Market Survey Participants (continued)

General Market Compensation Survey Catalog
1
For more information on Hay
Group’s consult ing services
for the general market,
please contact the
general market team at
(800) 716-4HAY.
Hay Group Reward Information Services Key Differentiators
� Hay Group expertise in measuring job content
� Global coverage
� Participants
� Job coverage
� Remuneration variables
� Hay Group team
General Market Team
Hay Group provides you with the highest level of customer support.
As a subscriber to Reward Information Services for the general market, you receive a team
of Hay Group support staff. They will always respond to your inquiries or requests within
24 hours or sooner.
The industry team is comprised of industry experts who are available to assist
you in any of the following areas:
� Data submission assistance
� Explanation of results
� Training for PayNet® subscribers
� Total remuneration assistance
� Benefits assistance
� Technical assistance
Please call the General Market Hotline at (800) 716-4HAY (press 7) to contact members
of the general market team.
General Market Compensation Survey Catalog
2
Hay Group Expertise in Measuring Job Content
Traditional compensation benchmarking surveys provide organizations with only a limited
amount of the information needed to make consistent, high quality pay decisions.
Many of our clients report that they are able to match only about 50% of their positions to
survey job descriptions.
Hay Group’s proprietary process of Job Mapping provides a solution which allows database
subscribers to confidently price all jobs, not just those with a survey match. Job Mapping focuses
not on job title, but on the content of the job. Hay Group’s job content expertise is what truly
differentiates the Hay Group service and database.
Job Mapping is our globally consistent process for building our databases. It allows clients
to access markets by:
� Specific position
� Job content level within a function
Whether you are salary planning, market pricing or reviewing internal equity, the Hay Group
database allows you to make confident decisions based upon data of the highest quality.
Hay Group General Market Offerings
Hay Group offers a wide range of products and services to meet the compensation and
benefits needs of our clients. From our standard industry reports to customized human
resources solutions, Hay Group will provide your team with the highest quality market
pay data.
For more information on Hay
Group’s consult ing services
for the general market,
please contact the
general market team at
(800) 716-4HAY.

General Market Compensation Survey Catalog
3
Database Overview
At the core of Hay Group Reward Information Services is our robust database, which
is refreshed throughout the year to ensure that the most up-to-date information is
available for clients.
The Hay Group U.S. database contains pay data for more than 650,000 employees,
representing more than 1,900 organizations.
Pages i-xx detail the full list of General Market companies in the Hay Group U.S. database.
Please contact Hay Group for details on participants in Hay Group databases in more
than 60 countries.
For more information on Hay
Group’s consult ing services
for the general market,
please contact the
general market team at
(800) 716-4HAY.
Argentina
Australia
Austria
Belgium
Brazil
Bulgaria
Canada
Chile
China
Colombia
Costa Rica
Czech Republic
Denmark
Dominican Republic
Egypt
Estonia
Finland
France
Germany
Greece
Guatemala
Hong Kong
Hungary
India
Indonesia
Ireland
Italy
Japan
Latvia
Lithuania
Luxembourg
Malaysia
Mexico
Netherlands
New Zealand
Norway
Peru
Philippines
Poland
Portugal
Romania
Russia
Saudi Arabia
Singapore
Slovakia
South Africa
South Korea
Spain
Sweden
Switzerland
Thailand
Turkey
Ukraine
United Arab Emirates
United Kingdom
United States
Venezuela
Vietnam

General Market Compensation Survey Catalog
4
For more information on Hay
Group’s consult ing services
for the general market,
please contact the
general market team at
(800) 716-4HAY.
General Market Job Pricing Source
Pay Information for almost 300 professional and managerial positions
across 14 benchmark job families
� Remuneration Variables – The survey collects individual incumbent data records
that cover the full range of total direct compensation components for the jobholder,
including:
— Base Salary Midpoint
— Base Salary
— Bonus $ (All)
— Bonus % (All)
— Total Cash (All)
— Bonus $ (Where Received)
— Bonus % (Where Received)
— Total Cash (Where Received)
— Target Bonus $
— Target Bonus %
— Target Total Cash
— Hay Points
� Results and Delivery – The survey report includes full compensation data by job,
characteristics of survey participants, and a same company analysis to display year-
over-year trends. Results are available online in both Microsoft Excel and Adobe
Acrobat PDF format. Visit www.haygroup.com for a sample report. (A sample
also appears on page 20 of this catalog.)
� Schedule
— Data Collection February to April
— Data Analysis and Quality Control May to June
— Preparation of Results June to July
— Delivery of Results July
� Pricing
— $2,500 (for survey participants)
— $250 extra charge for a printed copy of the report
— Discounts available for multi-report orders

General Market Compensation Survey Catalog
5
Finance andAccountingAccountant I
Accountant II
Accountant III
Accountant IV
Accountant V
Accounting Supervisor I
Accounting Supervisor II
Assistant Controller
Assistant Treasurer
Audit Manager
Auditor I
Auditor II
Auditor III
Bookkeeper
Cash Manager
Credit Analyst/Representative
Credit Manager
EDP Auditor
Financial Analyst I
Financial Analyst II
Financial Analyst III
Insurance and Risk Manager
Manager—Cost Accounting
Manager—EDP Auditing
Manager—Financial Planning
Manager—General Accounting
Manager—Statements/ Consolidations
Payroll Coordinator
Payroll Manager
Senior Manager Tax Compliance
Site/Plant Controller
Tax Accountant I
Tax Accountant II
Tax Advisor I
Tax Advisor II
Tax Analyst I
Tax Analyst II
Tax Manager
IT &TelecommunicationsApplications Architect
Associate Programmer
Associate Software Programmer
Business Analyst
Business Process Consultant
Business Process Manager
Computer Services Manager
Computer Shift Coordinator
Data Mining Specialist
Data Modeler
Data Security Specialist
Data Warehouse Director
Database Administrator
Database Analyst I
Database Analyst II
Database Analyst III
Director, Data Center Operations
Director of Applications Development
Director, Technical Support Services
ERP Configurer
Group Ware Specialist
Head of Technology Research
Information Center Analyst/ Help Desk—Coordinator
Information Center Consultant
Information Center Specialist
IT Project Leader
IT Quality Assurance Analyst
IT Quality Assurance Manager
Manager of Applications Development
Manager, Database
Manager, Information Center
Manager, Software
Network Administrator (LAN)
Network Administrator (Multiple Platform LAN/WAN)
Network Administrator (Single Platform LAN/WAN)
Network Architect
Network Integrator (LAN/WAN)
Network Operations Manager
Network Planning Analyst
PC Maintenance Technician
Programmer
Programmer Analyst
Programming Consultant
Senior Information Center Analyst
Senior Network Planning Analyst
Senior Programmer
Senior Programmer Analyst
Senior Shift Leader
Senior Software Programmer
Senior Systems Analyst
Senior Telecommunications Specialist
Shift Leader
Software Consultant
Software Programmer
Support Assistant
Systems Analyst
Systems Architect
Technology Research Specialist
TelecommunicationsOperations Manager
Telecommunications Specialist
Telecommunications Technician
Web Site Engineer
Human ResourcesBenefits Manager
Benefits Specialist II
Benefits Specialist III
Compensation and Benefits Manager
Compensation Manager
Compensation Specialist II
Compensation Specialist III
Employee Relations/Labor Relations Manager
Employee Relations/Labor Relations Representative III
HRIS Manager
HRIS Specialist
Human Resources Assistant
Human Resources Generalist I
Human Resources Generalist II
Human Resources Generalist III
Human Resources Generalist IV
Human Resources/Manpower Planning Manager
Human Resources/Manpower Planning Officer
Internal Human Resources Consultant
Recruiter
Recruitment Manager
Site/Plant Human Resources Manager
Training and Development Manager
Training and Development Specialist I
Training and Development Specialist II
LegalAttorney I
Attorney II
Attorney III
Attorney IV
Expert Attorney
Legal Assistant
Paralegal I
Paralegal II
Paralegal III
Paralegal Supervisor/Manager
Supervisor
MarketingAssistant Brand/Product
Manager
Brand/Product Manager I
Brand/Product Manager II
Brand/Product Manager III
Brand/Product Manager IV
Business/Product Manager
Director Community Outreach
Director of Media
Director of Promotions
Director of Sports Marketing
Ethnic Marketing Manager
Group Product/Brand Manager I
Group Product/Brand Manager II
Manager of Promotions
Market Analyst/Business Development Officer I
Market Analyst/Business Development Officer II
Market Analyst/Business Development Officer III
Market Communications Representative
Pricing Director
Supervisor, Market Research
Job Pricing SourceSurveyed Jobs

General Market Compensation Survey Catalog
6
Web Content DirectorSales
Business Segment Manager
Category Manager
Channel Manager
District Sales Manager
National/Key Accounts Associate
National/Key Accounts Executive I
National/Key Accounts Executive II
National/Key Accounts General Manager
Regional Sales Manager
Sales Planning Analyst
Sales Planning Manager
Sales Representative I
Sales Representative II
Sales Representative III
Sales Representative IV
Sales Service Manager
Technical Sales Specialist I
Technical Sales Specialist II
Technical Sales Specialist III
Telesales Representative
Telesales Supervisor
Customer ServiceCustomer Service
Representative I
Customer Service Representative II
Customer Service Representative III
Customer Service Team Leader
Manager Customer Service
Technical Customer Service Representative I
Technical Customer Service Representative II
Technical Customer Service Team Leader
Research andDevelopmentArea Research and
Development Manager
Research and Development Team/Project Leader
Scientist/Researcher—Senior Technician
Scientist/Researcher—Technician
Scientist/Researcher I
Scientist/Researcher II
Scientist/Researcher III
Scientist/Researcher IV
Scientist/Researcher V
Scientist/Researcher VI
Technician Supervisor
EngineeringEngineer I
Engineer II
Engineer III
Engineer IV
Engineer V
Engineer VI
Engineering Aide
Engineering Supervisor
Engineering Technician
Engineering Technician Supervisor
Manager—Engineering
Manager—Process Engineering
Principal Engineer
Logistics/SupplyChainBuyer I
Buyer II
Inventory Control Manager
Logistics Specialist
Manager, Logistics Operations
Manager, Order Fulfillment
Manager, Production Control
Materials Manager
Production Planner
Production Scheduler
Purchasing Agent
Purchasing Manager
Traffic Manager
Transportation Negotiator
Transportation Planning Analyst
Warehouse Manager
Warehouse Supervisor
ProductionGeneral Maintenance
Supervisor I
General Maintenance Supervisor II
General Superintendent I
General Superintendent II
General Supervisor I
General Supervisor II
HVAC Technician
Maintenance Machinist
Maintenance Mechanic
Maintenance Mechanic, Multi-Skilled
Maintenance Superintendent I
Maintenance Superintendent II
Maintenance Unit Supervisor I
Maintenance Unit Supervisor II
Maintenance Unit Supervisor III
Maintenance Unit Supervisor IV
Manager—Plant/Site Engineering and/or Maintenance
Plant Manager I
Plant Manager II
Plant Manager III
Plant Manager IV
Plant Manager V
Superintendent I
Superintendent II
Unit Supervisor I
Unit Supervisor II
Unit Supervisor III
Quality AssuranceQuality Control/Quality Assurance Manager I
Quality Control/Quality Assurance Manager II
Quality Control/Quality Assurance Manager III
Quality Control/Quality Assurance Supervisor I
Quality Control/Quality Assurance Supervisor II
Quality Control/Quality Assurance Supervisor III
Administration/Support/ServiceAdministrative Assistant I
Administrative Assistant II
Administrative Assistant III
Desktop Publisher I
Desktop Publisher II
Electronic Imaging and System Specialist
Electronic Output Specialist
Electronic Publishing Specialist II
Graphics Artist II
Graphics Artist III
Office Manager I
Office Manager II
Secretary I
Secretary II
Secretary III
Secretary IV
Secretary V
Secretary VI
Supervisor Graphics Communications
Corporate Affairs
Government Relations Representative
Head of Internal Communications
Internal Communications Specialist
Public Relations Assistant
Public Relations Representative I
Public Relations Representative II
Technical Writer
Health andEnvironmentEmployee Safety/Health
Manager
Environmental Manager
Environmental Professional I
Environmental Professional II
Environmental Professional III
Environmental Professional IV
Industrial Nurse
Safety Professional I
Safety Professional II
Safety Professional III
Safety Professional IV
Toxicologist I
Toxicologist II
Toxicologist III
Toxicologist IV
Job Pricing SourceSurveyed Jobs

General Market Compensation Survey Catalog
7
Job Pricing SourceSample Report
Hay Information ServicesProprietary
Hay Compensation Report: Job Pricing SourceGeneral Market
Accountants (0006, 0005, 0004, 0003, 0002)
Percentile
Annual Dollars ($000)
TotalPoints
BaseSalary
MidpointBase
SalaryBonus
(All)
Bonus(Where
Received)TotalCash
Total Cash(Bonus
Received)P90 95.7Accountant V (0006) 90.5 14.1 15.2 106.7542 108.3P75 87.7 Number of Incumbents - 661 Average Bonus % 84.7 10.4 11.6 96.5464 99.9
Median 76.9 Organizations - 80 All - 8.4% 77.8 6.3 8.0 83.4464 88.6
P25 67.1 Where Received - 10.9% 68.2 0.6 4.7 71.9464 75.8
P10 59.9 Where Eligible - 10.3%Average - Weighted By
63.9 0.0 2.2 62.0464 67.7
Incumbent 77.3% Receiving Bonus - 77% NA 6.7 8.6 84.0475 87.8
Organization 75.6% Eligible for Bonus - 82% 77.6 6.3 8.4 81.9475 83.5
P90 80.4Accountant IV (0005) 77.6 10.5 12.1 87.5404 89.5P75 71.2 Number of Incumbents - 1368 Average Bonus % 72.7 7.5 10.2 79.9404 81.4
Median 64.5 Organizations - 152 All - 7.4% 65.9 3.8 5.7 69.1404 73.5
P25 56.9 Where Received - 10.4% 61.1 0.0 3.4 59.4404 62.8
P10 51.2 Where Eligible - 8.9%Average - Weighted By
54.5 0.0 2.0 53.1393 55.2
Incumbent 65.0% Receiving Bonus - 71% NA 4.9 7.0 69.9404 73.1
Organization 63.8% Eligible for Bonus - 83% 66.6 3.8 6.0 67.6404 70.8
P90 69.9Accountant III (0004) 66.8 8.0 9.5 74.2380 78.2P75 62.8 Number of Incumbents - 1914 Average Bonus % 62.7 4.6 7.2 66.6332 70.9
Median 55.5 Organizations - 200 All - 4.7% 57.4 0.6 4.4 58.4332 64.1
P25 49.0 Where Received - 8.8% 53.2 0.0 2.6 50.0332 56.5
P10 43.3 Where Eligible - 7.4%Average - Weighted By
49.1 0.0 1.0 44.3332 49.4
Incumbent 56.1% Receiving Bonus - 53% NA 2.7 5.1 58.8337 63.9
Organization 55.3% Eligible for Bonus - 63% 57.9 2.1 4.2 57.4335 60.6
P90 59.1Accountant II (0003) 60.1 6.3 6.9 62.6312 64.4P75 53.0 Number of Incumbents - 1948 Average Bonus % 55.4 4.0 5.9 57.6275 58.8
Median 48.6 Organizations - 207 All - 4.7% 51.1 1.5 3.7 50.3275 53.7
P25 42.5 Where Received - 8.3% 46.6 0.0 2.3 44.0275 47.2
P10 37.9 Where Eligible - 7.3%Average - Weighted By
42.0 0.0 1.2 38.8275 42.3
Incumbent 48.4% Receiving Bonus - 57% NA 2.3 4.1 50.7281 53.5
Organization 48.3% Eligible for Bonus - 64% 51.0 2.0 3.6 50.3281 52.1
*Insufficient data to report III - 27
General Market Compensation Survey Catalog
8
For more information on Hay
Group’s consult ing services
for the general market,
please contact the
general market team at
(800) 716-4HAY.
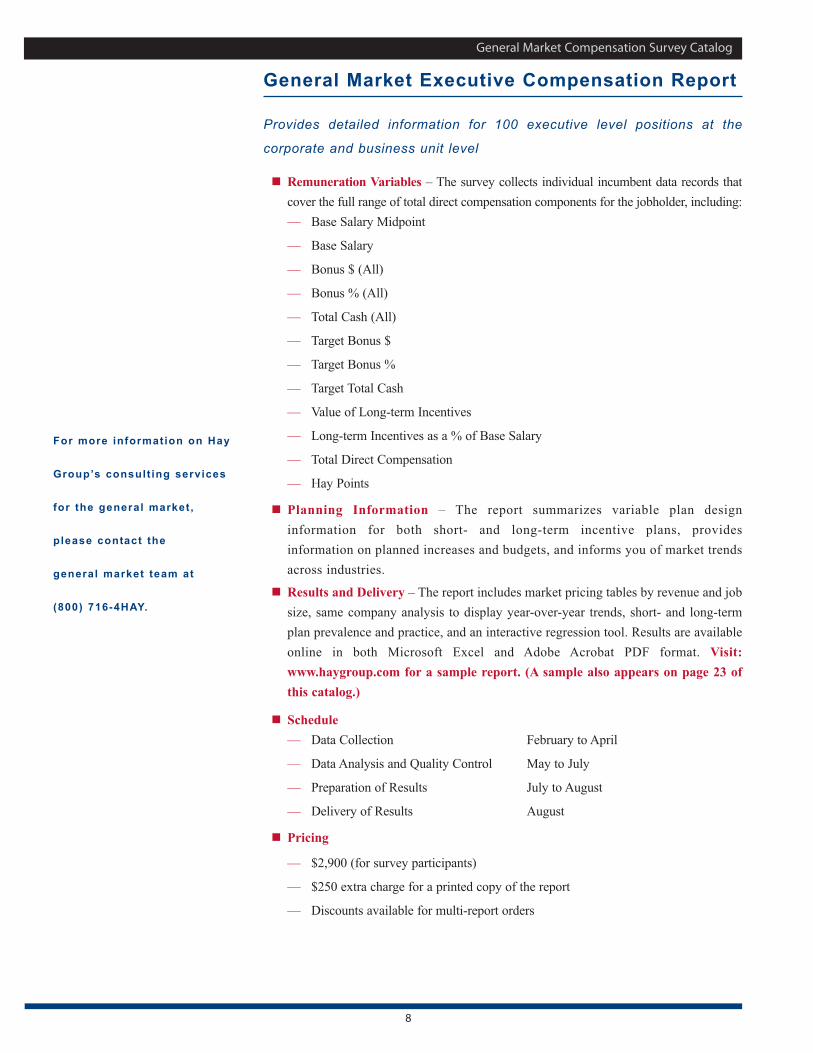
General Market Executive Compensation Report
Provides detailed information for 100 executive level positions at the
corporate and business unit level
� Remuneration Variables – The survey collects individual incumbent data records that
cover the full range of total direct compensation components for the jobholder, including:
— Base Salary Midpoint
— Base Salary
— Bonus $ (All)
— Bonus % (All)
— Total Cash (All)
— Target Bonus $
— Target Bonus %
— Target Total Cash
— Value of Long-term Incentives
— Long-term Incentives as a % of Base Salary
— Total Direct Compensation
— Hay Points
� Planning Information – The report summarizes variable plan design
information for both short- and long-term incentive plans, provides
information on planned increases and budgets, and informs you of market trends
across industries.
� Results and Delivery – The report includes market pricing tables by revenue and job
size, same company analysis to display year-over-year trends, short- and long-term
plan prevalence and practice, and an interactive regression tool. Results are available
online in both Microsoft Excel and Adobe Acrobat PDF format. Visit:
www.haygroup.com for a sample report. (A sample also appears on page 23 of
this catalog.)
� Schedule
— Data Collection February to April
— Data Analysis and Quality Control May to July
— Preparation of Results July to August
— Delivery of Results August
� Pricing
— $2,900 (for survey participants)
— $250 extra charge for a printed copy of the report
— Discounts available for multi-report orders

General Market Compensation Survey Catalog
9
ExecutiveManagementChief Executive Officer
Chief Executive Officer— Foreign Owned
Group Head
Division Head
Chief Operating Officer/ Managing Director
Business Unit ChiefOperating Officer
Chief Administrative Officer
Business Unit Chief Administrative Officer
Head of Strategic Planning
Business Unit Head of Strategic Planning
Head of Acquisitions and Mergers
Head of Aviation
Business Unit Head ofAviation
Finance andAccountingChief Financial Officer
Business Unit Head ofFinance
Treasurer
Business Unit Treasurer
Controller
Business Unit Controller
Head of Internal Audit
Business Unit Head ofInternal Audit
Head of Tax
Business Unit Head of Tax
Head of ShareholderRelations
Head of Risk Management
Business Unit Head ofRisk Management
Head of Sarbanes-Oxley (SOX) Compliance
IT &TelecommunicationsChief Information Officer
Head of InformationTechnology
Business Unit Head ofInformation Technology
Head of InformationTechnology—Applications
Business Unit Head ofInformation Technology—Applications
Head of InformationTechnology—Systems
Business Unit Head ofInformation Technology—
Systems
Head of InformationTechnology—Operations
Business Unit Head ofInformation Technology—Operations
Human ResourcesHead of Human Resources
Business Unit Head ofHuman Resources
Head of Training andDevelopment
Business Unit Head of Training and Development
Head of Compensation andBenefits
Business Unit Head of Compensation and Benefits
Head of Compensation
Business Unit Head ofCompensation
Head of Benefits
Business Unit Head ofBenefits
Head of Recruiting
Business Unit Head ofRecruiting
Head of OrganizationDevelopment
Business Unit Head ofOrganization Development
Head of Labor Relations
Business Unit Head of Labor Relations
LegalHead of Law/Legal Executive
Business Unit Head of Law
General Patent Counsel
Business Unit General PatentCounsel
Assistant General Counsel
MarketingHead of Marketing and Sales
Business Unit Head of Marketing and Sales
Head of Marketing
Business Unit Head of Marketing
Head of Consumer Insight
Business Unit Head ofConsumer Insight
Head of E-Commerce
Business Unit Head of E-Commerce
SalesHead of Sales
Business Unit Head of Sales
Head of Channel Management
Business Unit Head ofChannel Management
Research andDevelopmentHead of Research and
Development
Business Unit Head ofResearch and Development
Head of Research
Business Unit Head ofResearch
Head of Development
Business Unit Head ofDevelopment
Engineering
Head of Engineering/ Engineering Executive
Business Unit Head ofEngineering
Logistics/SupplyChainHead of Logistics/Supply
Chain
Business Unit Head ofLogistics/Supply Chain
Head of Purchasing/Procurement
Business Unit Head ofPurchasing/Procurement
Head of Distribution/Transportation/Logistics Executive
Business Unit Head of Distribution/Transportation /Logistics Executive
Head of Transportation
Business Unit Head of Transportation
Director of Materials
Business Unit Director of Materials
PropertyManagementHead of Property Development
Business Unit Head of Property Development
Head of Real Estate
Business Unit Head of Real Estate
Head of Construction
Business Unit Head ofConstruction
Head of Energy and FacilityManagement
Business Unit Head of Energy andFacility Management
ProductionHead of Manufacturing
Business Unit Head ofManufacturing
Head of Operations(Non-Manufacturing)
Business Unit Head of Operations(Non-Manufacturing)
Site Manager
Quality AssuranceHead of Quality Assurance/
Quality Control
Business Unit Head of Quality Assurance/Quality Control
Corporate AffairsHead of Corporate Affairs
Head of Government Affairs
Business Unit Head of Government Affairs
Head of Communications
Business Unit Head of Communications
Health andEnvironmentHead of Safety, Health, and
Environmental Affairs
Business Unit Head of Safety, Health, and Environmental Affairs
Executive Compensation ReportSurveyed Jobs
General Market Compensation Survey Catalog
10
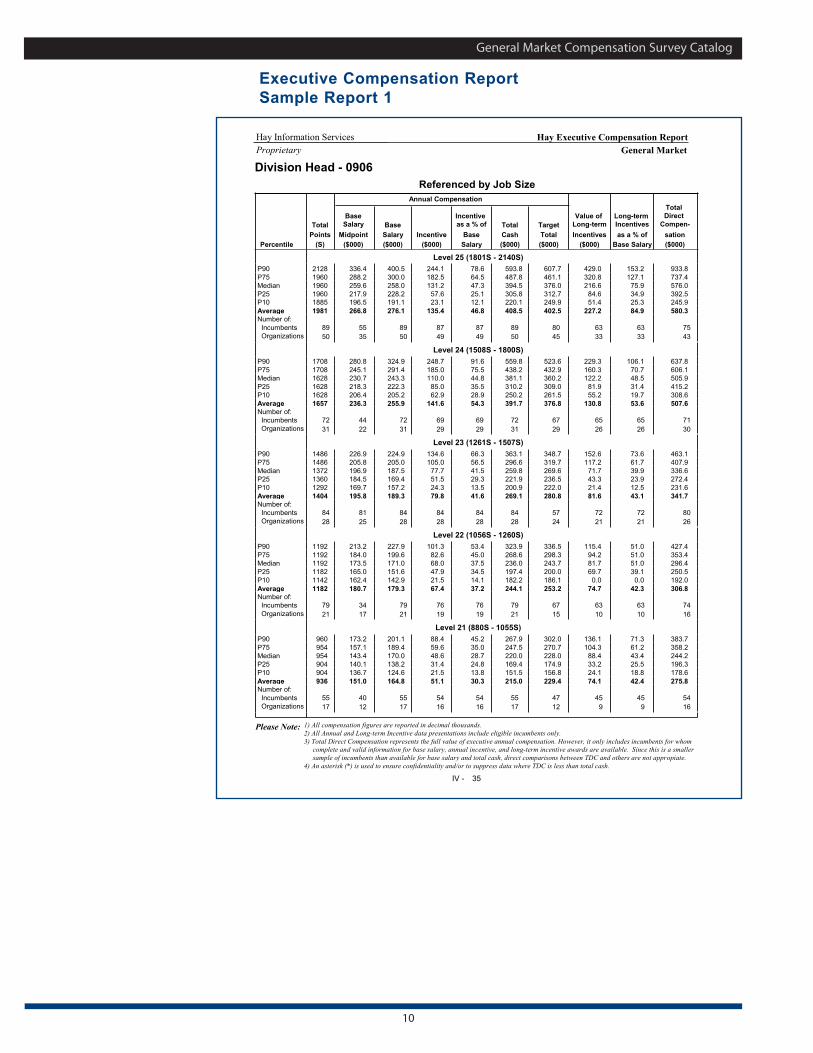
Executive Compensation ReportSample Report 1
Hay Information Services
ProprietaryHay Executive Compensation Report
General Market
Division Head - 0906
Referenced by Job Size
Percentile
Annual Compensation
Total
Points
(S)
Base Salary
Midpoint
($000)
Base
Salary
($000)
Incentive
($000)
Incentive as a % of
Base
Salary
Total
Cash
($000)
Value of Long-term
Incentives
($000)
Long-term Incentives
as a % of
Base Salary
Total Direct
Compen-
sation
($000)
Target
Total
($000)
Level 25 (1801S - 2140S)
P90 400.51 336.4 244.1 78.6 593.8 429.02128 153.2 933.8607.7
P75 300.02 288.2 182.5 64.5 487.8 320.81960 127.1 737.4461.1
Median 258.03 259.6 131.2 47.3 394.5 216.61960 75.9 576.0376.0
P25 228.24 217.9 57.6 25.1 305.8 84.61960 34.9 392.5312.7
P10 191.15 196.5 23.1 12.1 220.1 51.41885 25.3 245.9249.9
Average 276.16 266.8 135.4 46.8 408.5 227.21981 84.9 580.3402.5Number of:
Incumbents
Organizations
89 55 89 87 87 89 63 63 75
35 50 49 49 50 33 33 4350
80
45
Level 24 (1508S - 1800S)
P90 324.91 280.8 248.7 91.6 559.8 229.31708 106.1 637.8523.6
P75 291.42 245.1 185.0 75.5 438.2 160.31708 70.7 606.1432.9
Median 243.33 230.7 110.0 44.8 381.1 122.21628 48.5 505.9360.2
P25 222.34 218.3 85.0 35.5 310.2 81.91628 31.4 415.2309.0
P10 205.25 206.4 62.9 28.9 250.2 55.21628 19.7 308.6261.5
Average 255.96 236.3 141.6 54.3 391.7 130.81657 53.6 507.6376.8Number of:
Incumbents
Organizations
72 44 72 69 69 72 65 65 71
22 31 29 29 31 26 26 3031
67
29
Level 23 (1261S - 1507S)
P90 224.91 226.9 134.6 66.3 363.1 152.61486 73.6 463.1348.7
P75 205.02 205.8 105.0 56.5 296.6 117.21486 61.7 407.9319.7
Median 187.53 196.9 77.7 41.5 259.8 71.71372 39.9 336.6269.6
P25 169.44 184.5 51.5 29.3 221.9 43.31360 23.9 272.4236.5
P10 157.25 169.7 24.3 13.5 200.9 21.41292 12.5 231.6222.0
Average 189.36 195.8 79.8 41.6 269.1 81.61404 43.1 341.7280.8Number of:
Incumbents
Organizations
84 81 84 84 84 84 72 72 80
25 28 28 28 28 21 21 2628
57
24
Level 22 (1056S - 1260S)
P90 227.91 213.2 101.3 53.4 323.9 115.41192 51.0 427.4336.5
P75 199.62 184.0 82.6 45.0 268.6 94.21192 51.0 353.4298.3
Median 171.03 173.5 68.0 37.5 236.0 81.71192 51.0 296.4243.7
P25 151.64 165.0 47.9 34.5 197.4 69.71182 39.1 250.5200.0
P10 142.95 162.4 21.5 14.1 182.2 0.01142 0.0 192.0186.1
Average 179.36 180.7 67.4 37.2 244.1 74.71182 42.3 306.8253.2Number of:
Incumbents
Organizations
79 34 79 76 76 79 63 63 74
17 21 19 19 21 10 10 1621
67
15
Level 21 (880S - 1055S)
P90 201.11 173.2 88.4 45.2 267.9 136.1960 71.3 383.7302.0
P75 189.42 157.1 59.6 35.0 247.5 104.3954 61.2 358.2270.7
Median 170.03 143.4 48.6 28.7 220.0 88.4954 43.4 244.2228.0
P25 138.24 140.1 31.4 24.8 169.4 33.2904 25.5 196.3174.9
P10 124.65 136.7 21.5 13.8 151.5 24.1904 18.8 178.6156.8
Average 164.86 151.0 51.1 30.3 215.0 74.1936 42.4 275.8229.4Number of:
Incumbents
Organizations
55 40 55 54 54 55 45 45 54
12 17 16 16 17 9 9 1617
47
12
Please Note: 1) All compensation figures are reported in decimal thousands.2) All Annual and Long-term Incentive data presentations include eligible incumbents only.3) Total Direct Compensation represents the full value of executive annual compensation. However, it only includes incumbents for whom complete and valid information for base salary, annual incentive, and long-term incentive awards are available. Since this is a smaller sample of incumbents than available for base salary and total cash, direct comparisons between TDC and others are not appropiate.4) An asterisk (*) is used to ensure confidentiality and/or to suppress data where TDC is less than total cash.
IV - 35
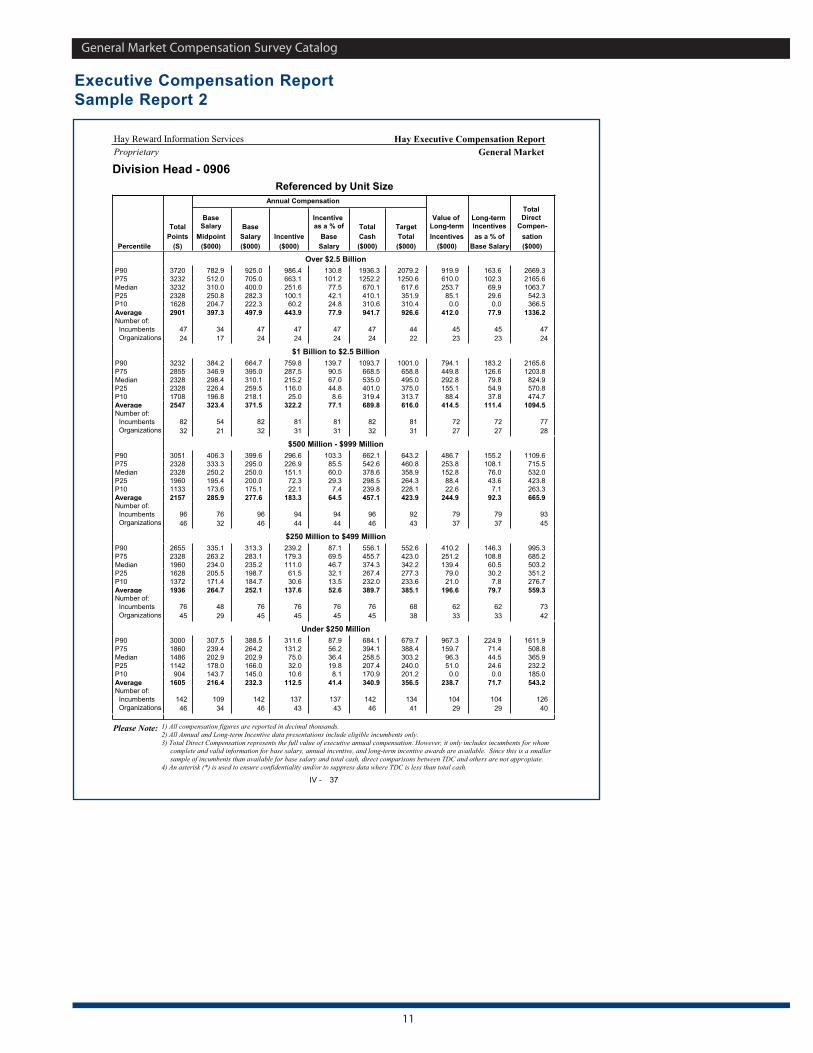
General Market Compensation Survey Catalog
11
Hay Reward Information ServicesProprietary
Hay Executive Compensation ReportGeneral Market
Division Head - 0906Referenced by Unit Size
Percentile
Annual Compensation
TotalPoints
(S)
Base Salary
Midpoint($000)
BaseSalary($000)
Incentive($000)
Incentive as a % of
BaseSalary
TotalCash($000)
Value of Long-termIncentives
($000)
Long-term Incentivesas a % of
Base Salary
Total Direct
Compen-sation($000)
TargetTotal($000)
Over $2.5 BillionP90 925.01 782.9 986.4 130.8 1936.3 919.93720 163.6 2669.32079.2P75 705.02 512.0 663.1 101.2 1252.2 610.03232 102.3 2165.61250.6Median 400.03 310.0 251.6 77.5 670.1 253.73232 69.9 1063.7617.6P25 282.34 250.8 100.1 42.1 410.1 85.12328 29.6 542.3351.9P10 222.35 204.7 60.2 24.8 310.6 0.01628 0.0 366.5310.4Average 497.96 397.3 443.9 77.9 941.7 412.02901 77.9 1336.2926.6Number of:
IncumbentsOrganizations
47 34 47 47 47 47 45 45 4717 24 24 24 24 23 23 2424
4422
$1 Billion to $2.5 BillionP90 664.71 384.2 759.8 139.7 1093.7 794.13232 183.2 2165.61001.0P75 395.02 346.9 287.5 90.5 668.5 449.82855 126.6 1203.8658.8Median 310.13 298.4 215.2 67.0 535.0 292.82328 79.8 824.9495.0P25 259.54 226.4 116.0 44.8 401.0 155.12328 54.9 570.8375.0P10 218.15 196.8 25.0 8.6 319.4 88.41708 37.8 474.7313.7Average 371.56 323.4 322.2 77.1 689.8 414.52547 111.4 1094.5616.0Number of:
IncumbentsOrganizations
82 54 82 81 81 82 72 72 7721 32 31 31 32 27 27 2832
8131
$500 Million - $999 MillionP90 399.61 406.3 296.6 103.3 662.1 486.73051 155.2 1109.6643.2P75 295.02 333.3 226.9 85.5 542.6 253.82328 108.1 715.5460.8Median 250.03 250.2 151.1 60.0 378.6 152.82328 76.0 532.0358.9P25 200.04 195.4 72.3 29.3 298.5 88.41960 43.6 423.8264.3P10 175.15 173.6 22.1 7.4 239.8 22.61133 7.1 263.3228.1Average 277.66 285.9 183.3 64.5 457.1 244.92157 92.3 665.9423.9Number of:
IncumbentsOrganizations
96 76 96 94 94 96 79 79 9332 46 44 44 46 37 37 4546
9243
$250 Million to $499 MillionP90 313.31 335.1 239.2 87.1 556.1 410.22655 146.3 995.3552.6P75 283.12 263.2 179.3 69.5 455.7 251.22328 108.8 685.2423.0Median 235.23 234.0 111.0 46.7 374.3 139.41960 60.5 503.2342.2P25 198.74 205.5 61.5 32.1 267.4 79.01628 30.2 351.2277.3P10 184.75 171.4 30.6 13.5 232.0 21.01372 7.8 276.7233.6Average 252.16 264.7 137.6 52.6 389.7 196.61936 79.7 559.3385.1Number of:
IncumbentsOrganizations
76 48 76 76 76 76 62 62 7329 45 45 45 45 33 33 4245
6838
Under $250 MillionP90 388.51 307.5 311.6 87.9 684.1 967.33000 224.9 1611.9679.7P75 264.22 239.4 131.2 56.2 394.1 159.71860 71.4 508.8388.4Median 202.93 202.9 75.0 36.4 258.5 96.31486 44.5 365.9303.2P25 166.04 178.0 32.0 19.8 207.4 51.01142 24.6 232.2240.0P10 145.05 143.7 10.6 8.1 170.9 0.0904 0.0 185.0201.2Average 232.36 216.4 112.5 41.4 340.9 238.71605 71.7 543.2356.5Number of:
IncumbentsOrganizations
142 109 142 137 137 142 104 104 12634 46 43 43 46 29 29 4046
13441
Please Note: 1) All compensation figures are reported in decimal thousands.2) All Annual and Long-term Incentive data presentations include eligible incumbents only.3) Total Direct Compensation represents the full value of executive annual compensation. However, it only includes incumbents for whom complete and valid information for base salary, annual incentive, and long-term incentive awards are available. Since this is a smaller sample of incumbents than available for base salary and total cash, direct comparisons between TDC and others are not appropiate.4) An asterisk (*) is used to ensure confidentiality and/or to suppress data where TDC is less than total cash.
IV - 37
Executive Compensation ReportSample Report 2
General Market Compensation Survey Catalog
12
For more information on Hay
Group’s consult ing services
for the general market,
please contact the
general market team at
(800) 716-4HAY.
General Market Compensation Planning Guide
Pay information using Hay Point Levels with reference to benchmark jobs
� Remuneration Variables – Market pricing tables are displayed by job size levels
with reference to benchmark jobs that cover the full range of total direct compensation
components including:
— Base Salary Midpoint
— Base Salary
— Bonus $ (All)
— Bonus % (All)
— Total Cash (All)
— Bonus $ (Where Received)
— Bonus % (Where Received)
— Total Cash (Where Received)
— Target Bonus %
— Target %
— Target Total Cash
— Hay Points
� Planning Information – This report presents key findings on pay policies and
practices, economic and salary trends and forecasts, salary administration practices,
and market practice (chart/line) analyses.
� Results and Delivery – The report includes compensation data and short-term
incentive practice tables for entry-level professionals through executives; job tables,
market charts, and formulas based on all organizations and organizations with revenue
exceeding $1 billion. Results are available online in both Microsoft Excel and Adobe
Acrobat PDF format. Visit www.haygroup.com for a sample report. (A sample also
appears on page 26 of this catalog.)
� Schedule
— Data Collection February to April
— Data Analysis and Quality Control May to July
— Preparation of Results August to September
— Delivery of Results September
� Pricing
— $2,500 (for survey participants)
— $250 extra charge for a printed copy of the report
— Discounts available for multi-report orders
General Market Compensation Survey Catalog
13
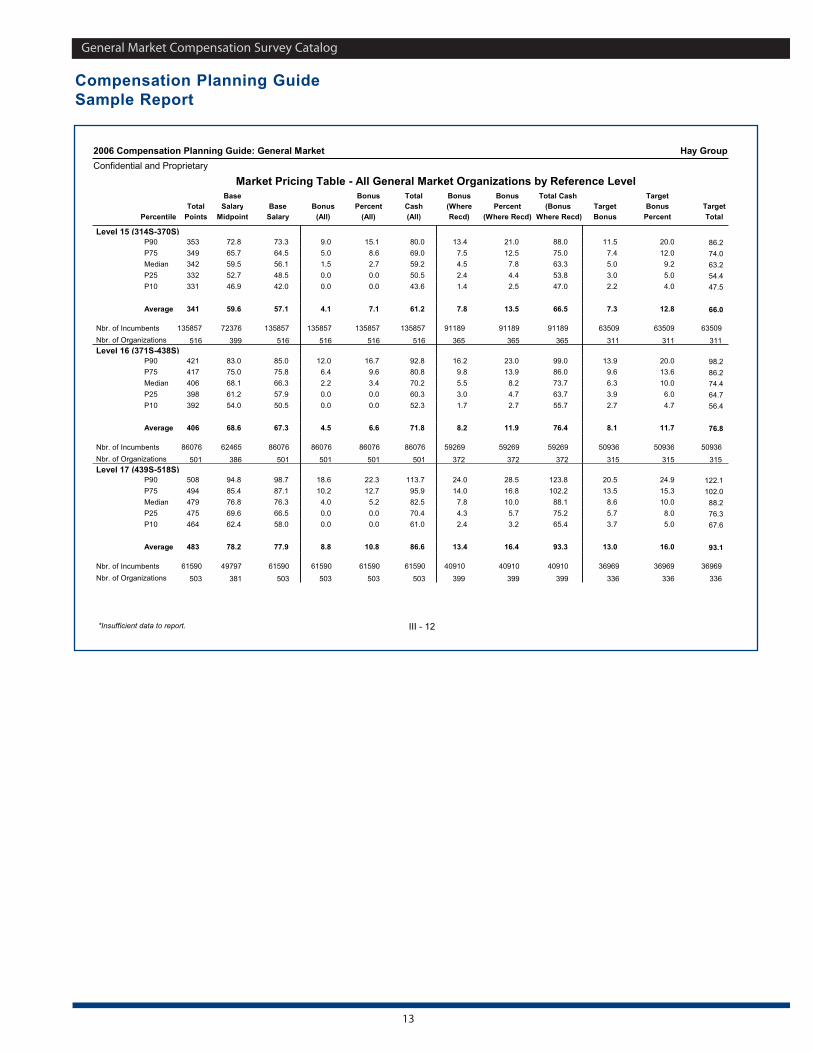
Compensation Planning GuideSample Report
2006 Compensation Planning Guide: General MarketConfidential and Proprietary
Hay Group
Market Pricing Table - All General Market Organizations by Reference Level
PercentileTotal
Points
BaseSalary
MidpointBase
SalaryBonus
(All)
BonusPercent
(All)
Bonus(WhereRecd)
BonusPercent
(Where Recd)
Total Cash(Bonus
Where Recd)TargetBonus
TargetBonus
PercentTargetTotal
TotalCash(All)
Level 15 (314S-370S)P90 73.372.8 9.0 15.1 80.0 13.4353 21.0 88.0 11.5 20.0 86.2P75 64.565.7 5.0 8.6 69.0 7.5349 12.5 75.0 7.4 12.0 74.0Median 56.159.5 1.5 2.7 59.2 4.5342 7.8 63.3 5.0 9.2 63.2P25 48.552.7 0.0 0.0 50.5 2.4332 4.4 53.8 3.0 5.0 54.4P10 42.046.9 0.0 0.0 43.6 1.4331 2.5 47.0 2.2 4.0 47.5
Average 57.159.6 4.1 7.1 61.2 7.8341 13.5 66.5 7.3 12.8 66.0
Nbr. of IncumbentsNbr. of Organizations
135857 72376 135857 135857 135857 135857 91189 91189 91189
399 516 516 516 516 365 365 365516
63509
311
63509
311
63509
311Level 16 (371S-438S)
P90 85.083.0 12.0 16.7 92.8 16.2421 23.0 99.0 13.9 20.0 98.2P75 75.875.0 6.4 9.6 80.8 9.8417 13.9 86.0 9.6 13.6 86.2Median 66.368.1 2.2 3.4 70.2 5.5406 8.2 73.7 6.3 10.0 74.4P25 57.961.2 0.0 0.0 60.3 3.0398 4.7 63.7 3.9 6.0 64.7P10 50.554.0 0.0 0.0 52.3 1.7392 2.7 55.7 2.7 4.7 56.4
Average 67.368.6 4.5 6.6 71.8 8.2406 11.9 76.4 8.1 11.7 76.8
Nbr. of IncumbentsNbr. of Organizations
86076 62465 86076 86076 86076 86076 59269 59269 59269
386 501 501 501 501 372 372 372501
50936
315
50936
315
50936
315Level 17 (439S-518S)
P90 98.794.8 18.6 22.3 113.7 24.0508 28.5 123.8 20.5 24.9 122.1P75 87.185.4 10.2 12.7 95.9 14.0494 16.8 102.2 13.5 15.3 102.0Median 76.376.8 4.0 5.2 82.5 7.8479 10.0 88.1 8.6 10.0 88.2P25 66.569.6 0.0 0.0 70.4 4.3475 5.7 75.2 5.7 8.0 76.3P10 58.062.4 0.0 0.0 61.0 2.4464 3.2 65.4 3.7 5.0 67.6
Average 77.978.2 8.8 10.8 86.6 13.4483 16.4 93.3 13.0 16.0 93.1
Nbr. of IncumbentsNbr. of Organizations
61590 49797 61590 61590 61590 61590 40910 40910 40910
381 503 503 503 503 399 399 399503
36969
336
36969
336
36969
336
*Insufficient data to report. III - 12

General Market Compensation Survey Catalog
14
For more information on Hay
Group’s consult ing services
for the general market,
please contact the
general market team at
(800) 716-4HAY.
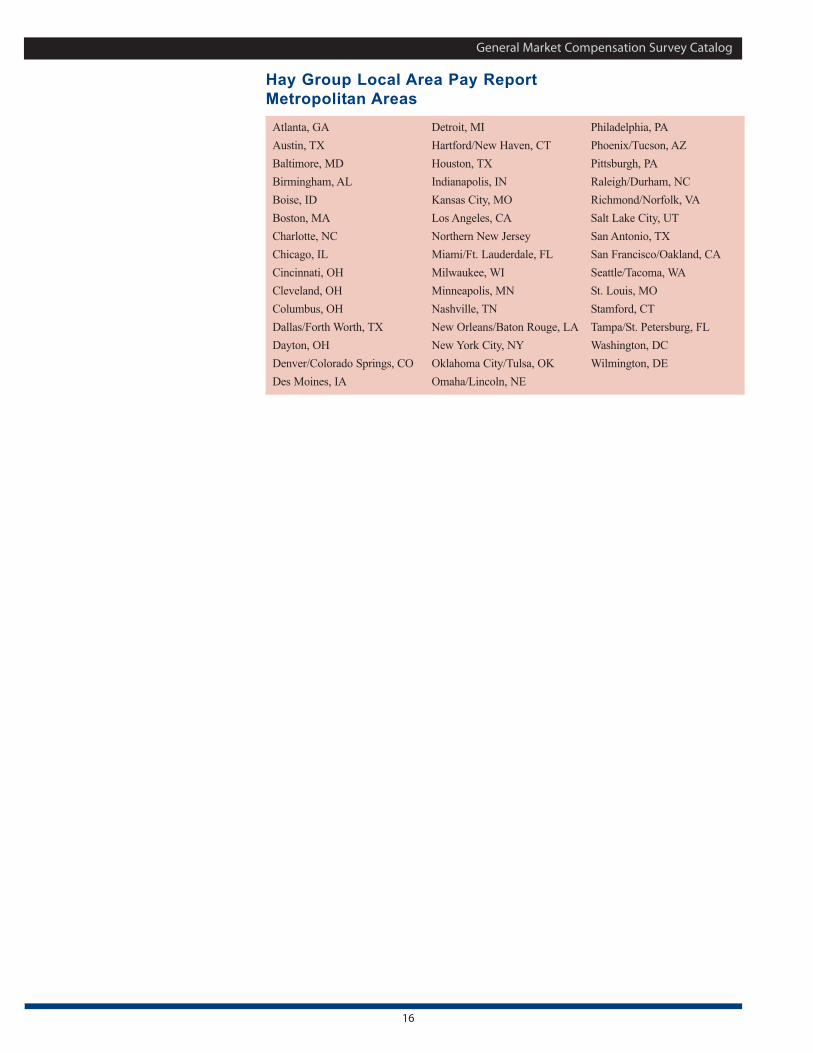
Hay Group Local Area Pay Report
Pay information for more than 150 administrative support and operations
support positions
The Hay Group Local Area Pay Report provides high quality market data for those
positions that are typically hired only within the local area. This includes hourly,
administrative and plant support positions.
� Results and Delivery – Base Salary and Total Cash data is provided for 150 positions
in more than 40 US metropolitan areas. The report includes an Adobe Acrobat PDF
file containing the national averages, as well as a Microsoft Excel file containing
detailed pay information for each position in each local market.
� Schedule
— Data Collection February to April
— Data Analysis and Quality Control May to June
— Preparation of Results July to August
— Delivery of Results Early September
� Pricing
— $1,000 (for survey participants)
— Discounts available for multi-report orders

General Market Compensation Survey Catalog
15
For more information on Hay
Group’s consult ing services
for the general market,
please contact the
general market team at
(800) 716-4HAY.
Hay Group Local Area Pay Report—PLUS
The Hay Group Local Area Pay Report—PLUS includes all of the information in the
Hay Group Local Area Pay Report, with these additional tools and information to best
price jobs in your area:
� Hay Group Geographic Differentials
— Information on typical pay differences between each local market and the
national average
� Local Pay Calculator
— The Local Pay Calculator helps you calculate the appropriate pay in more than 40
metropolitan areas. By applying a geographic differential to the national averages,
the calculator helps you build your own print-ready local area reports with the
push of a button.
� Pricing
— $1,500 (for survey participants)
— Discounts available for multi-report orders
General Market Compensation Survey Catalog
16
Atlanta, GA
Austin, TX
Baltimore, MD
Birmingham, AL
Boise, ID
Boston, MA
Charlotte, NC
Chicago, IL
Cincinnati, OH
Cleveland, OH
Columbus, OH
Dallas/Forth Worth, TX
Dayton, OH
Denver/Colorado Springs, CO
Des Moines, IA
Detroit, MI
Hartford/New Haven, CT
Houston, TX
Indianapolis, IN
Kansas City, MO
Los Angeles, CA
Northern New Jersey
Miami/Ft. Lauderdale, FL
Milwaukee, WI
Minneapolis, MN
Nashville, TN
New Orleans/Baton Rouge, LA
New York City, NY
Oklahoma City/Tulsa, OK
Omaha/Lincoln, NE
Philadelphia, PA
Phoenix/Tucson, AZ
Pittsburgh, PA
Raleigh/Durham, NC
Richmond/Norfolk, VA
Salt Lake City, UT
San Antonio, TX
San Francisco/Oakland, CA
Seattle/Tacoma, WA
St. Louis, MO
Stamford, CT
Tampa/St. Petersburg, FL
Washington, DC
Wilmington, DE
Hay Group Local Area Pay ReportMetropolitan Areas

General Market Compensation Survey Catalog
17
Finance andAccountingAccountant IAccountant Supervisor IAccounting Clerk IAccounting Clerk IIAccounting Clerk IIIAccounting Clerk IVAuditor IBookkeeperCredit Analyst/RepresentativePayroll Clerk IPayroll Clerk IIPayroll CoordinatorPayroll ManagerTax Analyst I
IT &TelecommunicationsAssociate ProgrammerAssociate Software
ProgrammerComputer Operator I Computer Operator IIComputer Operator IIIComputer Shift CoordinatorData Control ClerkData Entry Operator IData Entry Operator II Data Entry Operator III Data LibrarianInformation Center SpecialistPC Maintenance TechnicianProduction Control AnalystProgrammerSupport AssistantTelecommunications
Technician
Human ResourcesHRIS Specialist Human Resources AssistantHuman Resources Generalist IRecruiterTraining and Development
Specialist I
LegalLegal Secretary ILegal Secretary IILegal Secretary IIIParalegal IParalegal II
SalesOrder ClerkSales Representative ITelesales Representative
Customer ServiceCustomer Service
Representative ICustomer Service
Representative IICustomer Service
Representative IIITechnical Customer Service
Representative I
Research andDevelopmentScientist/Researcher—
Technician
EngineeringEngineer IEngineering AideEngineering Technician
Logistics/SupplyChainBuyer IDelivery Driver—LocalDelivery Driver—Medium
TruckFork Lift OperatorImport/Export ClerkMaterials Handler IMaterials Handler II Order FillerPacker ShippingProduction SchedulerWarehouse Supervisor
ProductionAssembler IAssembler IIAssembler IIICarpenterCrib Attendant or Stock ClerkDie CasterDrafter IDrafter IIDrafter IIIDrafter IVElectronics Technician IElectronics Technician IIElectronics Technician IIIElectronics Technician IVGroundskeeperHelper, Maintenance TradesHVAC TechnicianInspector IInspector IIInspector IIILaborerMachine Operator IMachine Operator IIMachine Operator IIIMachine Operator IVMaintenance Electrician IMaintenance Electrician IIMaintenance Electrician IIIMaintenance MachinistMaintenance MechanicMaintenance Mechanic,
Multi-SkilledMaintenance Unit Supervisor IMechanical Technician IMechanical Technician IIMechanical Technician IIIPainterPipefitterProcess Operator IProcess Operator IIStationary EngineerUnit Supervisor IWelder
Quality AssuranceQuality Control Technician IQuality Control Technician IIQuality Control Technician IIIQuality Control Technician IVQuality Control/Quality Assurance Supervisor I
Administration/Support/ServiceAdministrative Assistant IAdministrative Assistant IIAdministrative Assistant IIIArmed GuardDesktop Publisher IDesktop Publisher IIElectronic Imaging and
System SpecialistElectronic Output SpecialistElectronic Publishing
Specialist IIFile Clerk IFile Clerk IIFile Clerk IIIGeneral Clerk IGeneral Clerk IIGeneral Clerk IIIGeneral Clerk IVGraphics Artist IIGraphics Artist IIIGraphics CoordinatorMail ClerkOffice Manager IOffice Manager IIOffset/Multilith OperatorPhotocopy Machine OperatorReceptionist/Switchboard
OperatorSecretary ISecretary IISecretary IIISecretary IVSecretary VSecretary VIShipping/Receiving ClerkSupervisor Graphics
CommunicationsSupply ClerkTelephone Operator ITelephone Operator IITypist Clerk ITypist Clerk IIWatchman/GuardWord Processing Operator IIWord Processing Operator III
Corporate AffairsTechnical Writer
Health andEnvironmentEnvironmental Professional IIndustrial NurseSafety Professional I
Hay Group Local Area Pay ReportSurveyed Jobs
General Market Compensation Survey Catalog
18
For more information on Hay
Group’s consult ing services
for the general market,
please contact the
general market team at
(800) 716-4HAY.
Market Data Management
A partnership approach with Reward Information Services
Hay Group’s Market Data Management Service delivers parts or all of a client’s
compensation and benefits market data processes, including:
� Survey Audit
� Survey Data Submission
� Market Data Collection
� Market Data Analysis
� Market Data Delivery
Hay Group is available to do the submission work for you. Call your
industry team today at (800) 716-4HAY for more information.

General Market Compensation Survey Catalog
19
For more information on Hay
Group’s consult ing services
for the general market,
please contact the
general market team at
(800) 716-4HAY.
Special Analysis
Reward Information Services extracts specialized cuts from our extensive
US database and more than 60 countries worldwide to help clients address specific
compensation information issues. For those that require a particular selection of data, or
customized output to support your reward decision-making process, we can help.
Clients that need an ad hoc analysis, tailored annual compensation report, specific job
pricing or multiple country market report, our experienced team can assist you in selecting:
� Industry groups, sub-groups, or specific peer groups
� Relevant compensation elements
� Appropriate geographic scope
� Most effective presentation of results
Our most common requests include:
� Jobs-based analysis
� Grades-based analysis
� Market regression analysis
� Executive compensation analysis
� International job pricing
� Multiple country analyses
These are only a sample of the wide range of services we can provide.
Please contact us to discuss your particular issue so we can develop the
most effective solution.

General Market Compensation Survey Catalog
20
For more information on Hay
Group’s consult ing services
for the general market,
please contact the
general market team at
(800) 716-4HAY.
Hay Group Industry Reports
Hay Group publishes additional annual reports for a number of key
industry groups.
We offer robust market data and considerable consulting expertise in each of these
industries, allowing us to fully support all of your human resource
information and consulting needs.
Please contact us for information on offerings within any of the following
industries:
� Banking
� Chain restaurant
� Chemical
� Distribution center
� Fast-moving consumer goods
� General market
� Healthcare
� Health insurance
� Industrial
� Insurance
� Pharmaceutical
� Retail
� Trucking
� Utilities

General Market Compensation Survey Catalog
21
For more information on Hay
Group’s consult ing services
for the general market,
please contact the
general market team at
(800) 716-4HAY.
Benefits Prevalence Report
Since 1969, the Benefits Prevalence Report has provided the most comprehensive
information on benefits practices and policies nationwide. More than 800 mid-to large-size
organizations contributed to make this year’s edition an indispensable planning tool.
This report features a high-level overview of important items, such as:
� Benefit costs, including healthcare premiums,
� Benefit costs as a percentage of payroll,
� Changes in lifestyle benefits, such as:
— adoption
— child care
— commuting assistance
— domestic partner, etc.
� Executive Perquisites, such as:
— company car
— retirement plans
Total Remuneration: Hay Group Solutions
Total Remuneration comprises base pay, short- and long-term incentives, benefits and
perquisites. Communicating this total package is a key aspect in employee retention.
Organizations face numerous challenges in controlling and communicating total people
costs. Hay Group Total Remuneration products give you an edge in today’s volatile market.
Hay Group has helped a number of not-for-profit organizations, particularly in the
healthcare sector, establish reward structures that meet IRS standards, reflect the
organization’s philosophy, and are fair to executives and stakeholders alike.
Our Total R Reports include:
� Executive Total Remuneration Report
� Total Remuneration Benchmark Analysis
� Total Remuneration Executive Peer Group
� Professional/Managerial Total Remuneration Peer Group
Please visit www.haygroup.com for further information and to receive a free copy of a
Hay Group total remuneration working paper.

General Market Compensation Survey Catalog
22
For more information on Hay
Group’s consult ing services
for the general market,
please contact the
general market team at
(800) 716-4HAY.
Hay Group PayNet®
Hay Group PayNet® is an innovative, internet-based service that helps you build an
effective compensation and benefits strategy. Using PayNet you can access our databases
right from your desktop. You can research reward markets based on geography, company
size, or a company's peer group, across various jobs, families, and compensation elements.
Our data
Hay Group PayNet is your gateway to reward information covering more than 7 million
employees from more than 13,000 organizations in 63 countries, measured according to
Hay Group's leading, global methodologies. Unlike others, we don’t compare roles by job
title. Instead we use our own Job Mapping methodology, which gives a more objective
like-for-like comparison.
Our tools
PayNet's market leading salary analysis tools enable you to make the most of PayNet's
quality and comprehensive data. With PayNet you can easily measure your organization's
position against your chosen market, model changes to your salary practices and determine
the impacts of those changes on each individual, and on your company as a whole.
Our easy-to-use visualization and simulation tools are robust, intuitive, easy to maintain,
require no customization and are fully supported by Hay Group experts. These tools take
care of the calculations for you, allowing you to model complex salary adjustments with
confidence.
Our people
Although we’re proud of the invaluable tools and information we offer, our real talent is
turning that information into insights that will transform your reward decision making.
While you’re free to research your own information, we have local experts in 47 countries
who are always on hand to help you interpret the data in a meaningful way.
Salary Analysis Module
PayNet can now make your decisions even easier. Beginning January 2007, PayNet will
not only allow you to access high quality data on your chosen market, but you’ll be able
to easily measure your own organization’s position against that market, model the impact
of changes to your position, and determine the guideline salaries that will take you to that
new position.
To learn more about the full capabilities of Hay Group PayNet, visit
www.haygrouppaynet.com or contact your account manager to schedule a demonstration.

General Market Compensation Survey Catalog
23
For more information on Hay
Group’s consult ing services
for the general market,
please contact the
general market team at
(800) 716-4HAY.
Hay Group Consulting Capabilities
We help clients make insightful decisions about their people and
organizations.
Hay Group is the General Market’s leading human resources consulting firm.
We work with:
� 380 business units representing more than 250 companies
� Many of the Fortune 500 and Global 500 largest manufacturers
� Companies representing all major sub-industries, including manufacturers of heavy
equipment, automotive components, chemicals, consumer products, metals and
other organizations
How companies manage people has changed significantly over the last decade. Companies
are more nimble, changing structures and roles quickly to respond to business needs. As a
consequence, how companies manage compensation has also changed. Hay Group has
responded to meet these business challenges.
Today, market competitiveness, performance, capability, and the value of work drive pay.
Hay Group’s processes are designed to help you understand and apply these drivers in
making effective reward decisions. Hay Group has developed innovative solutions to
provide better information to our clients about how to manage their compensation budgets.
Hay Group has focused on developing our tools and approaches to provide balanced
information on the value of work to the company and to the market based on individual
contribution. We are the only consulting organization that has databases not only of how
companies pay, but also how they value work.
In the reward area, we work with both large and small companies on projects
ranging from consulting with boards of directors to helping set executive
compensation, to designing pay plans for plant-based jobs. In addition, we design
compensation and incentive programs for all organizational levels.
Hay Group helps organizations work, by organizing, developing and motivating people.
We also help clients develop the capability and capacity to respond to changes
demanded by customers, competitors, and technology. While our focus is on people, we
are experts at aligning the structure of work and management of people with the
demands of business strategy.
About Hay Group
Hay Group is a global consulting firm that works with leaders to transform strategy into reality. We develop talent,
organize people to be more effective, and motivate them to perform at their best. With 79 offices in 44 countries, we work
with more than 7000 clients around the world. Our clients are from private, public, and not-for-profit sectors, across every
major industry and represent diverse business challenges. For more than 60 years, we have been renowned for the quality
of our research and the intellectual rigor of our work. We transform research into actionable insights. We give our clients
breakthrough perspectives on their organization and we do it in the most efficient way to achieve the desired results. Our
focus is on making change happen and helping people and organizations realize their potential.
Hay Group has offices in the following North American cities:
Worldwide Headquarters Canadian Headquarters
Philadelphia Toronto
The Wanamaker Building Standard Life Centre
100 Penn Square East 121 King Street West
Philadelphia, PA Suite 700
19107-3388 Toronto, Ontario M5H 3X7
(215) 861-2000 (416) 868-1371
Hay Group has offices in the following cities outside North America:
Athens
Auckland
Bangkok
Barcelona
Beijing
Berlin
Birmingham
Bratislava
Bogota
Brisbane
Bristol
Brussels
Bucharest
Budapest
Buenos Aires
Canberra
Caracas
Delhi
Dubai
Dublin
Frankfurt
Glasgow
Helsinki
Hong Kong
Istanbul
Jakarta
Johannesburg
Kiev
Kuala Lumpur
Lille
Lima
Lisbon
London
Lyon
Madrid
Manchester
Melbourne
Milan
Moscow
Munich
New Delhi
Oslo
Paris
Prague
Rome
Sandown
Santiago
San Jose
Sao Paulo
Seoul
Shanghai
Singapore
Stockholm
Strasbourg
Sydney
Tel Aviv
Tokyo
Vienna
Vilnius
Warsaw
Wellington
Windsor
Zeist
Zurich
VViissiitt HHaayy GGrroouupp oonn tthhee WWeebb aatt wwwwww..hhaayyggrroouupp..ccoomm..
Arlington
(703) 841-3100
Atlanta
(404) 575-8700
Boston
(617) 425-4500
Calgary
(403) 215-6730
Charlotte
(704) 333-1591
Chicago
(312) 228-1800
Dallas
(469) 232-3800
Edmonton
(780) 415-8021
Halifax
(902) 491-4289
Kansas City
(816) 329-4900
Los Angeles
(949) 251-5454
Mexico City
+52 55 5523 2121
Montreal
(514) 866-7831
New York Metro
(201) 557-8400
Norwalk
(203) 750-6200
Ottawa
(613) 238-4785
Regina
(306) 359-0181
San Francisco Metro
(925) 279-3700
Vancouver
(604) 682-4269


