Page 1
Holt-Winters Forecasting 1
Running Heading: Holt-Winters Forecasting in Healthcare
Holt-Winters Forecasting: A Study of Practical Applications for Healthcare
Managers
Captain Joan H. Newberne
Army-Baylor University Graduate Program in Healthcare Administration
UISTRIBUTION STATEMENT AApproved for Public Release
Distribution Unlimited
20071101290
Page 2
Form Approved
REFIRT DOCUMENTATION PAGE I OMB No. 0704-0188
The public reporting burden for this collection of information is estimated to average 1 hour per response, including the time for reviewing instructions, searching existing data sources,gathering and maintaining the data needed, and completing and reviewing the collection of information. Send comments regarding this burden estimate or any other aspect of this collection of
information, including suggestions for reducing the burden, to Department of Defense, Washington Headquarters Services, Directorate for Information Operations and Reports (0704-0188),1215 Jefferson Davis Highway, Suite 1204, Arlington, VA 22202-4302. Respondents should be aware that notwithstanding any other provision of law, no person shall be subject to any
penalty for failing to comply with a collection of information if it does not display a currently valid OMB control number.
PLEASE DO NOT RETURN YOUR FORM TO THE ABOVE ADDRESS.
1. REPORT DATE (DD-MM-YYYY) 2. REPORT TYPE 3. DATES COVERED (From - To)
25-05-2006 Graduate Management Project June 2005 to June 2006
4. TITLE AND SUBTITLE 5a. CONTRACT NUMBER
Holt-Winters Forecasting: A Study of Practical Applications for Healthcare
Managers 5b. GRANT NUMBER
5c. PROGRAM ELEMENT NUMBER
6. AUTHOR(S) 5d. PROJECT NUMBER
Newbeme, Joan H., Captain, USAF, MSC
5e. TASK NUMBER
5f. WORK UNIT NUMBER
7. PERFORMING ORGANIZATION NAME(S) AND ADDRESS(ES) 8. PERFORMING ORGANIZATIONREPORT NUMBER
Mike O'Callaghan Federal Hospital
4700 Las Vegas Blvd N.Las Vegas, NV 89191
9. SPONSORING/MONITORING AGENCY NAME(S) AND ADDRESSIES) 10. SPONSOR/MONITOR'S ACRONYM(S)
US Army Medical Department Center and School
BLDG 2841 MCCS-HFB (Army-Baylor Program in Healthcare Administration)
3151 Scott Road, Suite 1411 11. SPONSOR/MONITOR'S REPORTNUMBER(S)
Fort Sam Houston, TX 78234-6135 33-06
12. DISTRIBUTION/AVAILABILITY STATEMENT
Approved for public release; distribution is unlimited
13. SUPPLEMENTARY NOTES
14. ABSTRACT
Healthcare managers often encounter the need for accurate and reliable forecasts. Decisions about staffing, purchasing, and
healthcare delivery depend on the ability to analyze data and predict future observations. Qualitative methods can help with strategic
planning in a changing environment; however, quantitative techniques may prove more appropriate in some cases. A basic
understanding of forecast modeling can save valuable time and resources. This study demonstrates the use of the Holt-Winters
model on common healthcare data series.
15. SUBJECT TERMS
forecasting, econometric modeling, exponential smoothing
16. SECURITY CLASSIFICATION OF: 17. LIMITATION OF 18. NUMBER 19a. NAME OF RESPONSIBLE PERSON
a. REPORT b. ABSTRACT c. THIS PAGE ABSTRACT OF Education TechnicianPAGES
UU 3 19b. TELEPHONE NUMBER (Include area code)UUUU36 210-221-6443
Standard Form 298 (Rev. 8/98)Prescribed by ANSI Std, Z39. 18
Page 3
Holt-Winters Forecasting 2
Acknowledgments
Many people contributed to my successful completion of the Army-Baylor
didactic year and an extremely educational residency. They include my family,
friends, classmates, colleagues, and preceptor Lt Col Troy McGilvra. They were
all sources of unwavering support and inspiration.
Lt Col McGilvra's superb guidance was only surpassed by his example of
an intelligent executive and a passionate leader. His encouragement allowed me
to explore topics and tackle projects that provided years worth of experience in
12 short months. It is no wonder that his troops admire him and I could not have
asked for a better mentor.
I would also like to thank LTC Christopher Pate who gave me the idea for
this paper by introducing my class to the endlessly interesting study of health
economics. He edited, answered questions, and provided resources. I cannot
express how much I appreciate his patience and expertise.
Additionally, I would like to thank Dr. Thomas Carroll, Professor,
Department of Economics, University of Nevada Las Vegas. Dr. Carroll's passion
for the application of econometrics and outstanding ability to turn numbers into
stories made for a very enjoyable educational experience. I can only dream of
knowing what he knows.
Page 4
Holt-Winters Forecasting 3
Abstract
Healthcare managers often encounter the need for accurate and reliable
forecasts. Decisions about staffing, purchasing, and healthcare delivery depend
on the ability to analyze data and predict future observations. Qualitative
methods can help with strategic planning in a changing environment; however,
quantitative techniques may prove more appropriate in some cases. A basic
understanding of forecast modeling can save valuable time and resources. This
study demonstrates the use of the Holt-Winters model on common healthcare
data series.
Page 5
Holt-Winters Forecasting 4
Table of Contents
Introduction.............................................................................. 7
Conditions that Prompted Study....................................................... 7
Problem Statement ..................................................................... 9
Literature Review ....................................................................... 9
Method and Procedures............................................................... 15
Setting................................................................................ 15
Data Source ........................................................................... 19
Validity and Reliability................................................................. 19
Results and Discussion ........................................................ 21
Conclusions and Recommendations............................................ 29
References............................................................................. 34
Page 6
Holt-Winters Forecasting 5
List of Tables
Table 1. Holt-Winters smoothing parameters and Mean Absolute Percentage
Errors: Pseudoephedrine prescriptions
Table 2. Holt-Winters Forecast of Psuedoephedrine prescriptions with smoothing
parameters = 0.25 and 95% confidence intervals
Table 3. Holt-Winters smoothing parameters and Mean Absolute Percentage
Errors: URI visits
Table 4. Holt-Winters Forecast of URI visits with smoothing parameters = 0.15
and 95% confidence intervals
Page 7
Holt-Winters Forecasting 6
List of Figures
Figure 1. Line Plot of Pseudoephedrine Prescriptions forecast using smoothing
parameters = 0.2 and 36 observations
Figure 2. Line Plot of Psuedoephedrine Prescriptions forecast using smoothing
parameters = 0.25 and 36 observations
Figure 3. Line Plot of Psuedoephedrine Prescriptions forecast using smoothing
parameters = 0.25 and 39 observations
Figure 4. Line Plot of URI visits forecast using smoothing parameters = 0.2 and
36 observations
Figure 5. Line Plot of Upper Respiratory Infection visits forecast using smoothing
parameters = 0.15 and 36 observations
Figure 6. Line Plot of Upper Respiratory Infection visits forecast using smoothing
parameters = 0.15 and 39 observations
Page 8
Holt-Winters Forecasting 7
Introduction
Healthcare managers often encounter the need for accurate and reliable
forecasts. Decisions about staffing, purchasing, and healthcare delivery depend
on the ability to analyze data and predict future observations. Many times
managers rely on qualitative methods based on judgment, experience, and
intuition. Although organizations may reap immeasurable benefit from these
methods, the use of quantitative methods may be more useful to managers who
are seeking to improve accuracy of predictions while keeping the costs
associated with development and use of forecasting models fixed or minimized.
The purpose of this study is to examine a quantitative business
forecasting model using the process of exponential smoothing called the Holt-
Winters method. Once explained, this study will demonstrate the Holt-Winters
method and compare measures of accuracy using two distinct data series.
Conditions that Prompted Study
Healthcare managers have been observed using everything from
guesswork and informal polling to advanced quantitative modeling in order to
perform forecasting activities. Although the usage frequency of quantitative
methods among healthcare managers is unknown, it may be assumed that
qualitative approaches are common and are not without benefits. Most tools have
quantitative aspects, but contain significant qualitative utility. Environmental
analysis tools include Delphi which uses the solicitation of expert opinion.
Brainstorming, focus groups, and nominal group technique are also more
qualitative in nature. They involve discussions by interactive groups and can be
Page 9
Holt-Winters Forecasting 8
used to forecast. Scenario analysis is another process for analyzing potential
outcomes and contains both quantitative and qualitative elements. It allows
managers to investigate the range of potential outcomes. Although quantitative
measures are used in scenario analysis, its true value is in exploring qualitative
considerations. Ginter, Swayne, and Duncan (2002) explain that tools such as
scenario analysis are useful in changing environments and provide a context for
strategic thinking. "Scenarios avoid the need for single-point forecasts by
allowing users to explore several alternative futures" (Ginter et al, 2002, p.83).
However, using qualitative methods to derive predictions when a quantitative
approach is more appropriate can lead to serious inaccuracies. The lack of
accuracy is a major problem with qualitative methods and many quantitative
Cmethods provide more accurate predictions without substantial costs (Pate,
2005).
Quantitative methods include simple and multiple regression techniques,
moving averages, and exponential (smoothing) methods. Because some of these
techniques require statistical software and expertise beyond the capabilities of
many organizations, managers may find that the benefits of investing in these
capabilities through outsourcing and additional training are well worth the costs.
In other cases, managers have the necessary resources, yet lack an appreciation
of quantitative forecasting methods. This study aims to inform healthcare
managers of the Holt-Winters method, which is an accessible and powerful
forecasting technique. The technique can be developed and used on widely
available software applications such as Microsoft Excel® and provides a cost-
Page 10
Holt-Winters Forecasting 9
effective way to conduct healthcare forecasts without tremendous expense and
expertise. An additional purpose of this study is to bring an awareness of the
application of forecasting in healthcare management and encourage healthcare
educators to include economic forecasting in graduate programs.
Problem Statement
The Holt-Winters method has been widely implemented in computer
forecasting software and is available to many healthcare managers and leaders.
It will be described in detail later, but it is important to recognize its potential
usefulness in solving common healthcare management dilemmas. An objective
of this paper is to increase awareness of quantitative forecasting techniques in
general and the Holt-Winters method in particular. This paper is intended for the
professional healthcare manager with little exposure to econometric modeling.
The research question here is how can the Holt-Winters method be applied to
common forecasting requirements in healthcare organizations?
Literature Review
Forecasting is a dynamic and exciting area of economic study and it has
extensive potential applications in healthcare. The goal of health economics is
"...to promote a better understanding of the economic aspects of healthcare
problems so that corrective health policies can be designed and proposed"
(Santerre & Neun, 2004, p. 4). Health economics involves the application of
various micro and macroeconomic tools and theories. These theories describe
economic activity or behavior, and are often general in nature. For example,
Page 11
Holt-Winters Forecasting 10
( economic models are almost never used to determine the actual market price
using the most elementary supply and demand model. Hyman (1994) states,
'These models are not applied models. They are meant to merely represent a
type of consistent economic behavior either visually or mathematically. They
provide a 'picture' of that behavior" (p. 11). Econometric forecasts are similar in
that they supply predictions that cannot be 100% accurate. "All models contain
variables that the model cannot predict because they are determined by forces
'outside' the model" (Hymans, 2005, T. 5). Some attempts at forecasting reveal
statistical evidence that a data series is almost completely stochastic or follows a
random walk. This too is important information for a healthcare professional
responsible for managing scarce resources. Although forecasting produces
predictions, it is important to remember that those predictions are based on
previous observations and are not guaranteed to be perfect. "Forecasting is
actually looking into the past; like driving while looking in the rear-view mirror"
(T. Carroll, personal communication, February 23, 2006). However, quantitative
forecasting models provide healthcare managers with practical tools they can
use to develop relatively accurate predictions.
Forecasting is vital to decision-making and strategic planning. Countless
industries have used forecasting models to determine such things as expected
sales or inventory levels. Pate (2005) suggests that healthcare leaders can gain
critical business information through the development of econometric models to
evaluate the complex relationships between productive outputs and predictors.
Most industries have multiple product lines and have many requirements for
Page 12
Holt-Winters Forecasting 11
forecasting. Healthcare is no different. Managers can utilize forecasting methods
to estimate future health plan enrollment, outpatient visits, laboratory tests,
radiological images, and pharmaceutical stocks. Such data are becoming
increasingly available and healthcare managers can use statistical analysis to
turn the data into information. Skrepneck (2005) discusses the opportunity for the
application of statistics in healthcare.
The increased availability of administrative databases containing medical
and pharmacy claims data may provide those in managed care settings
with a greater ability to evaluate treatments and practice patterns. Given
that administrative data are observational rather than experimental, it is
critical that analysts and decision makers be versed in appropriate
Qstatistical methods to design investigations or evaluate empiric findings (p.
250).
Skrepnek's article is among few pieces of professional literature that
specifically applies econometric models to healthcare management. Literature
describing quantitative forecasting in healthcare is even rarer; however, many
examples of forecasting in healthcare exist. One such example is a study
conducted by hospitals in Ontario that used population forecasts to determine the
future incidence of mechanical ventilation. The study, completed in 2005,
projected the incidence through 2026 in order to "understand the impact of aging
baby boomers on critical care resources" (Needham et al., 2005, p. 574). The
researchers applied existing incidence data derived from billing and insurance
plan databases to Census-based Ontario population data. Although the annually
Page 13
Holt-Winters Forecasting 12
compounded growth rate is expected to be consistent with previous years, the
researchers estimated an 80% increase in the number of ventilated patients by
2026. Such information is important to entities like Intensive Care Units (ICU).
"Given the specialized human and capital resources required, ICUs have much
less flexibility than other hospital units to adjust to growth" (Needham et al., 2005,
p. 577). Forecasts are necessary because advanced planning is essential to
adequate staffing and financing.
Another example of quantitative forecasting in healthcare comes from the
Military Healthcare System (MHS). Within the MHS, leaders and researchers
have access to the Managed Care Forecasting and Analysis System (MCFAS),
which is the official tool for predicting MHS-eligible beneficiary populations.
CMCFAS methodology involves creating cohorts of beneficiary groups such as
active duty, family members, and retirees. Demographic information is collected
on the cohorts in order to generate forecasts of the physical locations of
beneficiaries by zip code. The model then computes the eligible beneficiary
population by using weighted quarterly averages. Once averages are calculated,
beneficiaries are assigned to the market area of a Military Treatment Facility
(MTF). The resulting forecasts allow MTFs to manage the care provided to
eligible patients in their market areas. MCFAS data are useful when developing
marketing and business plans, providing input for population health initiatives,
and planning for medical facility construction among other things. The transient
nature of military beneficiaries poses a unique challenge to the accuracy of
MCFAS. As mentioned earlier, forecasting models rarely achieve absolute
Page 14
Holt-Winters Forecasting 13
precision. However, accuracy is important because errors can be expensive in
terms of cost and time.
"Forecast accuracy is important because a high forecast leads to
excessive inventories, and a low forecast leads to stockouts" (Holt, 2004).
Although accuracy of the model is important, healthcare managers must also
remember that no forecasting method has zero error. "Studies have shown that
forecasts that combine the model and the forecaster's judgment are generally
more accurate than 'purely objective' forecasts that are produced with the
econometric model alone" (Hymans, 2005, T. 15).
Although healthcare managers have a number of forecasting methods to
choose from, they must carefully select the best method given the context of the
problem and the data available to support analysis. When selecting a model, one
should consider the level, trend, and seasonality of the data. Additionally, some
models are more or less appropriate for short or long term forecasting.
Healthcare managers often evaluate time-series data. "A time series is a
sequence of observations which are ordered in time or space" (Statistics
Glossary, 2005, . 1). Time series data often display some degree of
randomness. Forecasting methods commonly used with time-series data are
considered deterministic because "no reference is made to the sources or nature
of the underlying randomness in the series. Essentially, the models involve
extrapolation techniques that have been standard tools of the trade in economic
and business forecasting for years" (Pindyck & Rubinfeld, 1998, p. 467). Methods
include moving averages, regression analysis, and smoothing techniques.
Page 15
Holt-Winters Forecasting 14
The Holt-Winters method uses a technique called exponential smoothing,
which is "used to reduce irregularities in time series data, thus providing a clearer
view of the true underlying behavior of the series. It also provides an effective
means of predicting future values of the time series" (Statistics Glossary, 2005,1 .
7). "At times it is desirable to smooth a time series and thus eliminate some of
the more volatile short-term fluctuations" (Pindyck & Rubinfeld, 1998, p. 467). An
important characteristic of exponential smoothing is that weights are applied to
past values. Weights can be set so that the most recent and therefore most
relevant observations are given more weight than those observed further in the
past. Models involving exponential smoothing are particularly helpful because
"the predicted value is updated each time new information becomes available at
the end of a series" (National Statistics United Kingdom [NSUK], 2005). These
methods provide healthcare managers with the ability to make predictions using
the most current and relevant data. Healthcare is an ever-changing industry,
which makes real-time forecasting even more important.
Recognizing a need for a practical technique to forecast sales, Holt
extended the concept of exponentially weighted moving averages to forecast
multiple components of a variable. Holt (2004) explains that he found that
components such as trend and seasonality could be forecasted and he created a
system that had several exciting characteristics. Holt noted that the method
"...was easy to program, fast to compute, required minimal data storage, put
declining weight on old data, used simple initial conditions, had robust
parameters, was automatically adaptive, model formulations were easy, and the
Page 16
Holt-Winters Forecasting 15
math was tractable" (p. 124). To determine the accuracy of Holt's method, a
graduate student by the name of Winters tested the new model by programming
"...the formulas in FORTRAN for an IBM 650 [10] and found that the formula
forecasts were surprisingly accurate" (Holt, 2004, p.124). Winters went on to
publish his results and the formulas became known as the Holt-Winters method.
Method and Procedures
Setting
The study originates at the Mike O'Callaghan Federal Hospital (MOFH)
located near Nellis Air Force Base, Nevada. The MOFH is a joint venture
between the Department of Defense (DoD) and the Veterans Health
OAdministration (VHA). It serves a population of over 300,000 eligible beneficiaries
both military and veteran. Situated in the Las Vegas valley, one of the fastest
growing regions in the United States, the MOFH is facing demand for healthcare
beyond current capacity. The military population is expected to grow with DoD
Base Realignment and Closure Commission decisions to increase troop levels at
Nellis. The veteran population is likewise expected to increase and many will
require VHA care as the incidence of service related injuries and illnesses rises.
A 2006 Air Force Times article reported that in fiscal year 2005, more than
23,000 service members with physical injuries or other conditions went through
the military disability evaluation system; a 55% increase from 2001. MOFH
functions such as business planning, financial management, and manpower can
all benefit from quantitative forecasting techniques. Forecasting models that
review past behavior can be combined with future expectations to create a
Page 17
Holt-Winters Forecasting 16
reliable basis for planning. The analysis examined two data series and evaluated
accuracy using both series. The first represents monthly prescriptions of
pseudoephedrine. Pseudoephedrine is a drug commonly prescribed to relieve
nasal congestion and other cold and flu symptoms. It belongs to a group of
drugs called sympathomimetic agents and is usually found in such over-the-
counter medications as Sudafed. However, military providers prescribe the
medication and it is dispensed in military pharmacies. The second series consists
of monthly outpatient visits resulting in a diagnosis of Upper Respiratory Infection
(URI). URIs are often treated with pseudoephedrine among other medications.
URIs include pharyngitis, sinusitis, epiglottitis, laryngotracheitis, common cold,
viral upper respiratory tract infection, bacterial respiratory infection, and group A
streptococci among others. The monitoring of visits associated with URI is
important because of the highly contagious nature of many conditions. The data
series were selected because of the close association between URI and
psudoephedrine use and their commonness in primary care settings worldwide.
This study evaluated 42 months of data covering fiscal years 2004 through
2005 and the first half of fiscal year 2006. Once the model was identified, there
was a fitting period of 39 months and an evaluation period of three months. The
evaluation period was January 2006 to March 2006. The Holt-Winters method
was used because both data series contain trend and seasonal variation. "Holt-
Winters has an additive and a multiplicative form. The additive method was used
in this study because "...the seasonal effect does not depend on the current
mean level of the time series" (Koehler, Snyder, & Ord, 2001, p. 269). "In other
Page 18
Holt-Winters Forecasting 17
words, the magnitude of the seasonal pattern does not change as the series
goes up or down" (Minitab Statistical Software v. 14).
The exponential smoothing technique used in the Holt-Winters method
requires a smoothing constant set in the range 0 < a < 1. This constant is used to
apply weights to the observations as described earlier. The optimal value of the
smoothing constant varies based on the time-series data in question. It is
"commonly set between 0.05 and 0.3, although it is possible to estimate a by
minimizing the sum of squared prediction errors" (NSUK, 2005). Some statistical
software programs calculate the optimal values of the smoothing constants by
minimizing Ze2. More basic smoothing techniques such as single and double
exponential smoothing use optimal values after an Autoregressive Integrated
6> Moving Average (ARIMA) analysis estimates the length and value of the
smoothing parameters. Minitab® does not provide optimal smoothing parameter
values for the Holt-Winters method because "...an equivalent ARIMA model only
exists for a very restricted form of the Holt-Winters model" (Minitab Statistical
Software v. 14). The value of the weight for each component can be changed
according the characteristics of the time series data. "A high value of a will lead
to the majority of the weight being placed on the most recent observations
whereas a low value of a will mean that observations further in the past will gain
more importance" (National Statistics United Kingdom, 2005, 1. 6) The additive
Holt-Winters model involves smoothing each component of level, trend, and
seasonality. Mathematically, it is written as:
Page 19
Holt-Winters Forecasting 18
Mt = a(Y - S,_,) + (1 - a)(M,_1 + R,-,)S, = 18(, - M, I)+ (1- fl)SI_,
R, = y(M, - M,-,) + (1 - )R-1
F,+l = M1 + hr + S , h
The smoothing constants are represented by a, 13, and y. M estimates the
deseasonalized level, S calculates the smoothed seasonal index, and R
represents the smoothed trend factor. The last equation is used to forecast the
next period. Minitab® statistical software version 14 was used to conduct all
analyses. Because it is unknown which statistical software may be available to a
particular healthcare manager, it is important to note that forecasting work can be
done in multiple software applications including the more sophisticated Eviews®
and the more common Microsoft Excel®.
Each data series was assigned two different sets of smoothing
parameters. The same model was used for both sets of data, but the model was
calibrated by changing the weights or smoothing parameters to determine the
version with the lowest error. First, the default parameters from Minitab® were
used. Defaults were set at 0.2 for the level, trend, and seasonal components.
Then, the weights that created the lowest Mean Absolute Percentage Error
(MAPE) were found by iteratively testing values between 0 and 3. The data used
in this study were compiled by fiscal month starting in October 2002 and the
seasonal period used in both calibrations of the model was 12.
Each set of parameters was applied to the 36 observations of both
pseudoephedrine prescriptions and URI encounters. Minitab® then calculated a
forecast and confidence intervals for periods 37, 38, and 39. The errors for both
Page 20
Holt-Winters Forecasting 19
calibrations were examined and the one with the lowest MAPE was applied to 39
observations in order to forecast periods 40, 41, and 42 basically creating a new
fitting period. When evaluating time series models "...our objective is to develop
models that explain the movement of a time series by relating it to its own past
values..." (Carroll, 2006). The final forecast was compared to the actual
observations for the same periods and results are discussed in this study.
Data Source
Data for this study were gathered from the Military Healthcare System's
M2 database. The M2 is a data warehouse that contains data related to
demographics, patient encounters, and cost; among other things from every
Department of Defense medical treatment facility. Patient specific data were notcollected to avoid any ethical dilemmas associated with the ability to identify
individuals.
Validity and Reliability
Before examining the method, it is important to discuss the validity and
reliability of the data used. Both M2 and MCFAS, the population forecasting tool
mentioned earlier, are supported by the Executive Information and Decision
Support (EIDS) office of the Military Healthcare System (MHS). "EIDS collects,
processes, and manages nearly 100 terabytes of enterprise data through a
powerful suite of decision-support tools that enable effective management of
MHS health care operations" (EIDS, 2006, p. 1, T 1). M2 is one of several
programs produced by EIDS, and it is widely used for its many applications in
healthcare management. EIDS (2005) explains M2's usefulness this way:
Page 21
Holt-Winters Forecasting 20
M2 is a powerful ad-hoc query tool used to obtain summary and detailed
views of population, clinical, and financial data from all MHS regions. M2
includes MTF and purchased care data with eligibility and enrollment data.
This integrated data enhances support to decision-makers at all levels of
the MHS. With M2, source sawy analysts can perform trend analyses,
conduct patient and provider profiling studies, and realize opportunities for
transferring health care from the private sector to the Military Treatment
Facility (MTF). (1] 2)
EIDS ensures data quality and consistency by following business rules that have
been approved by the medical departments of the Army, Navy, and Air Force.
The collection of data is standardized and data are gathered directly from the
operating systems of each MTF. Additionally, many other MHS applications use
data from M2 in order to assist healthcare managers in decision making. The M2
data warehouse is relied upon by government agencies and individuals alike for
the most recent record of administrative and clinical data. That said, the data
reflect inputs by individuals and are subject to human error. Regular audits are
performed to guard against gross errors and to ensure the best possible data
quality.
Evaluating reliability and validity of the Holt-Winters method involves
deciding "...whether the forecasting process was reasonable for the situation"
(Armstrong, 2001, p. 1). "Validity refers to the extent to which a test measures
what we actually wish to measure" (Cooper & Schindler, 2003, p. 231). This
study examines construct validity because "construct validity asks whether a
Page 22
Holt-Winters Forecasting 21
measure does, in fact, measure what it purports to measure" (Armstrong &
Collopy, 1992, p. 74). To what extent does the model produce accurate
forecasts? This is done by comparing the MAPE of each calibration of the model.
Another test of construct validity involves determining whether other error
measures were similar to the MAPE. Armstrong and Collopy (1992) considered
agreement among accuracy measures when testing construct validity. When they
evaluated the MAPE with other error measures; they found that depending on the
size of the series, the measures each provide reasonable measures of accuracy.
In this study Minitab® computes a Mean Absolute Deviation (MAD) and a Mean
Squared Deviation (MSD) which both measure the accuracy of fitted time series
values. The calibrations with the lower MAPE also produced the lower MAD and
MSD.
Reliability is a measure of consistency. It "...addresses the question of
whether repeated application of a procedure will produce similar results"
(Armstrong & Collopy, 1992, p. 73). This study calculated a three month ahead
forecast from 36 observations and then a different sample was created when the
actual values for the three months were added to the original sample. Again, the
calibration with the lower error was applied to the new sample of 39 observations
in order to derive a forecast for periods 40, 41, and 42. Reliability was assessed
by examining the extent to which the MAPE of the first sample was similar to the
MAPE of the second sample when the same calibration of the model was applied
to both samples. This approach was demonstrated by Armstrong and Collopy
(1992) when they used MAPE in the determination of reliability. MAPE and other
Page 23
Holt-Winters Forecasting 22
error measures were ranked by accuracy and then tested to determine whether
they produced the same accuracy rankings when applied to different samples
from a set of time series.
Results and Discussion
The following section contains results from the various calibrations of the
model and forecasts of both pseudoephedrine prescriptions and URI visits. First,
a model to forecast pseudoephedrine is determined and the predicted values are
compared with actual ones. The same is done for URI visits.
Table 1
Holt-Winters smoothing parameters and Mean Absolute Percentage Errors:
Pseudoephedrine prescriptions
Smoothing Parameters MAPE
Level 0.20, Trend 0.20, Seasonal 0.20 14.597
Level 0.25, Trend 0.25, Seasonal 0.25 13.255
/
Page 24
Holt-Winters Forecasting 23
Winters' Method Plot for Psuedoephedrine PrescriptionsAdditive Method
300- Variable-- Actual
.2- Forecastsw250- a,, p & 95.00%0PI
U9 *, Smoothing ConstantsU) '4 Alpha (level) 0.2
&200- 4 Gamma (trend) 0.24k P.[Delta (seasonal)_0.2
Accuracy MeasuresI r- MAPE 14.597
06 MAD 19.315i LMSD 563.086
Ir/
50 al4 8 12 16 20 24 28 32 36 4'0
Index
Figure 1. Line Plot of Pseudoephedrine Prescriptions forecast using smoothing
parameters = 0.2 and 36 observations
Page 25
Holt-Winters Forecasting 24
Winters' Method Plot for Pseudoephedrine PrescriptionsAdditive Method
S I -Variable
250- -0- Actual0 U Fits
A Forecasts
b 200- I Smoothing Constants
' ,I Alpha (level) 0.25
& Gamma (trend) 0.25\ I' Delta (seamonal) 0.25
C 150 --V Accuracy Measures
MAPE 13.255
W' MAD 17.7410I MSD 459.010" 100- ,
50-14 8 1'2_6 2'0 24__ 236
Index
C Figure 2. Line Plot of Psuedoephedrine Prescriptions forecast using smoothing
parameters = 0.25 and 36 observations
The Holt-Winters calibration which assigned smoothing parameters of
0.25 produced the lower MAPE when evaluated with 36 months of data. The
actual values for periods 37, 38, and 39 were then added to the sample and the
0.25 calibration was applied to a series of 39 observations. The resulting forecast
predicted pseudoephedrine prescriptions for periods 40, 41, and 42.
Page 26
Holt-Winters Forecasting 25
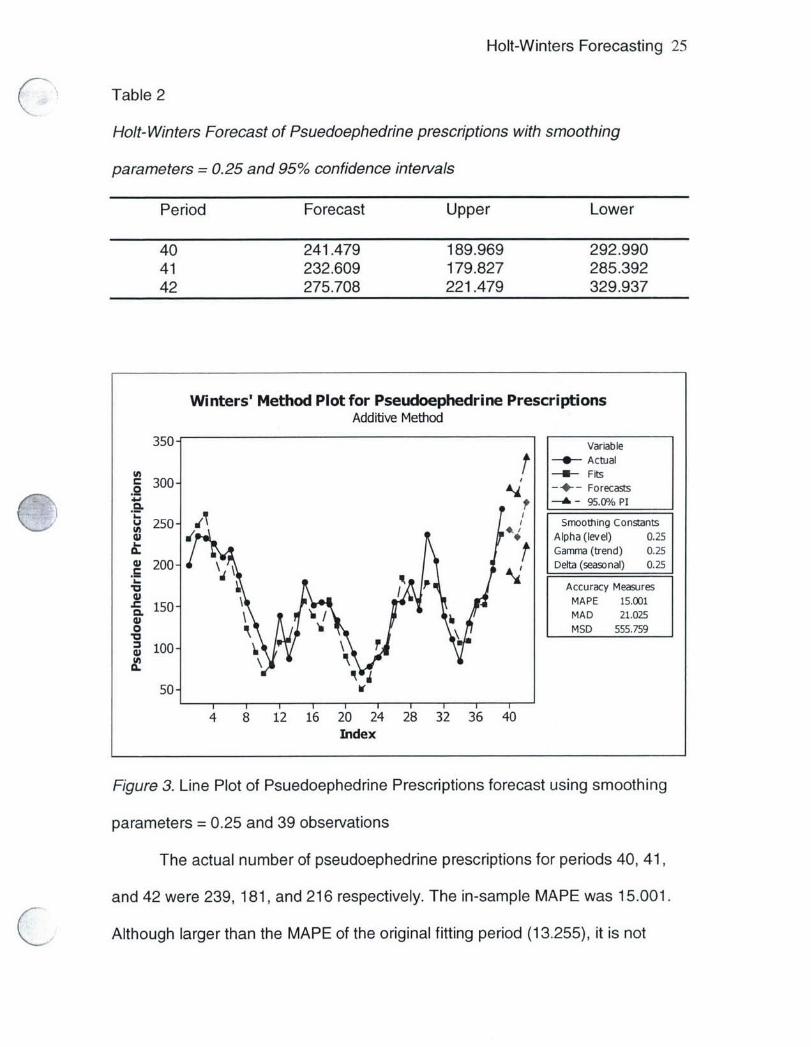
Table 2
Holt- Winters Forecast of Psuedoephedrine prescriptions with smoothing
parameters = 0.25 and 95% confidence intervals
Period Forecast Upper Lower
40 241.479 189.969 292.99041 232.609 179.827 285.39242 275.708 221.479 329.937
Winters' Method Plot for Pseudoephedrine PrescriptionsAdditive Method
350- VariableActual
(a--! - Fits
- 300"-'- Forecasts
250- Smooting Constants*t Alpha (level) 0.25
Gamma (trend) 0.25
200- Delta (seasonal) 0.25
Accuracy Measures15 MAPE 15.001
C 1 MAD 21.025l0 MSD 555.759
S100- 7
50 V
4 8 12 16 20 24 28 32 36 40Index
Figure 3. Line Plot of Psuedoephedrine Prescriptions forecast using smoothing
parameters = 0.25 and 39 observations
The actual number of pseudoephedrine prescriptions for periods 40, 41,
and 42 were 239, 181, and 216 respectively. The in-sample MAPE was 15.001.
Although larger than the MAPE of the original fitting period (13.255), it is not
Page 27
Holt-Winters Forecasting 26
significantly different and indicates a reliable model. Also, the actual values are
relatively close to the predicted values. However, the stochastic nature of the
data is apparent in the wide confidence intervals.
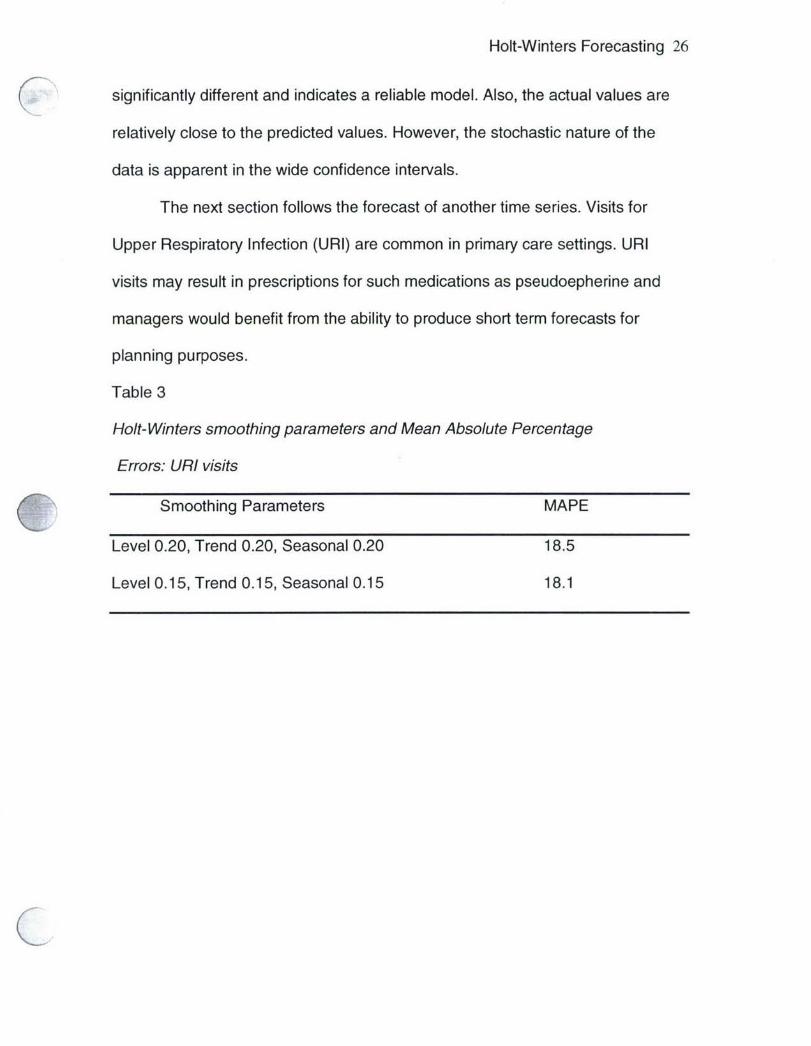
The next section follows the forecast of another time series. Visits for
Upper Respiratory Infection (URI) are common in primary care settings. URI
visits may result in prescriptions for such medications as pseudoepherine and
managers would benefit from the ability to produce short term forecasts for
planning purposes.
Table 3
Holt-Winters smoothing parameters and Mean Absolute Percentage
Errors: URI visits
Smoothing Parameters MAPE
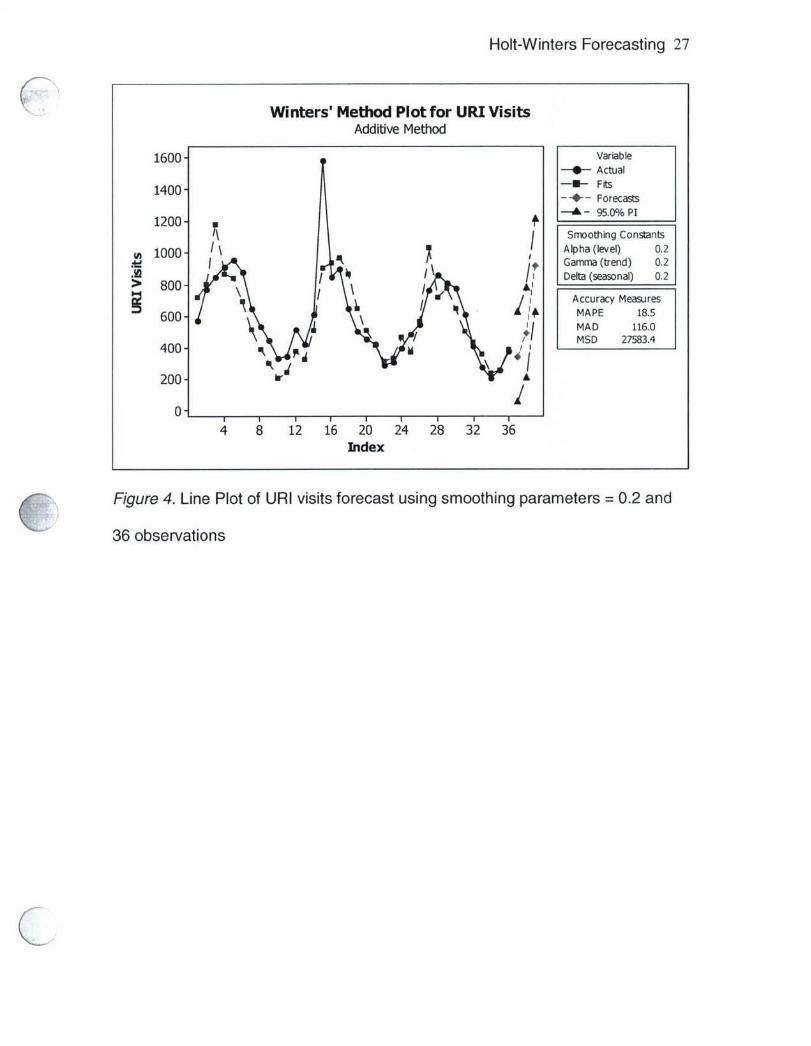
Level 0.20, Trend 0.20, Seasonal 0.20 18.5
Level 0.15, Trend 0.15, Seasonal 0.15 18.1
Page 28
Holt-Winters Forecasting 27
Winters' Method Plot for URI VisitsAdditive Method
1600- VariablepActual
1400 -111- F its-4-- Forecasts
1200 f -A -95.0% /P1
n c 00 Alpha (e l) 0.2Iw Gamma (trend) 0.2
AnI Debt (seasonal) 0.2> 800-
Accuracy Measures60I MAPE 18.5
I MAD 116.0I MSD 27583.44 0 0 -4
200-hA
4 8 12 16 20 24 28 32 36Index
C Figure 4. Line Plot of URI visits forecast using smoothing parameters =0.2 and36 observations
Page 29
Holt-Winters Forecasting 28
Winters' Method Plot for URI VisitsAdditive Method
1600- Variable-4-- Actual
1400- Fits-*-- Forecasts
1200- A - 95.00/0 PI1000 [ Smoothing Constants
i1000 I Alpha (ee) 01Ad Gamma (trend) 0.15
0I Delta (seasonal) 0.15
S00 Accuracy Measures
600- MAPE 18.1MAD 111.3
400" MSD 29099.4
200-
0-1
4 8 12 16 20 24 28 32 36Index
Figure 5. Line Plot of Upper Respiratory Infection visits forecast using smoothing
parameters = 0.15 and 36 observations
The calibration which assigned smoothing parameters of 0.15 produced
the lower MAPE when evaluated with 36 months of data. The actual values for
periods 37, 38, and 39 were then added to the sample and the 0.15 calibration
was applied to a series of 39 observations. The resulting forecast predicted URI
visits for periods 40, 41, and 42.
Page 30
Holt-Winters Forecasting 29
Table 4
Holt-Winters Forecast of URI visits with smoothing parameters =0. 15 and 95%
confidence intervals
Period Forecast Upper Lower
40 790.498 524.943 1056.0541 812.102 544.229 1079.9742 701.322 430.922 971.72
Winters' Method Plot for URI EncountersAdditive Method
1600 - Variable-0-- Actual
1400-~ FitsForecasts
1200- 95.0 /o PI1200 Smoothing Constants
(D 100 A lp ha (lev el) 0.1510 Gamma (trend) 0.15/0Delta (seasonal) 0.15(l Accuracy Measures
600- MAPE 17.6A \ MAD 108.4
400- MSD 27196.5
200
01
8 12 16 20 24 28 32 36 4bIndex
Figure 6. Line Plot of Upper Respiratory Infection visits forecast using smoothing
parameters = 0.15 and 39 observations
The actual number of URI visits for periods 40, 41, and 42 were 677, 584,
and 532 respectively. The in-sample MAPE was 17.6. Although smaller than the
MAPE of the original fitting period (18.1), it is not significantly different and
Page 31
Holt-Winters Forecasting 30
indicates a reliable model. In this case, however, the actual values seem quite
different from the predicted values although they fall within the confidence
intervals. Several explanations may exist for the discrepancies. For example,
there may be some assignable variance in recent months that the model cannot
account for, or the randomness of the time series was underestimated. Still,
familiarization with quantitative forecasting methods can arm the healthcare
manager with the ability to make simple forecasts and avoid more costly
analyses.
Conclusions and Recommendations
The objective of this study was to shed light on the possible applications of
quantitative forecasting in healthcare by demonstrating the Holt-Winters method
on two series of healthcare data. With an introduction to forecasting techniques,
healthcare professionals can create simple models to address common problems
or conduct short term planning.
The utility of this and other forecasting methods is extensive as shown by
current examples in healthcare. The military's MCFAS for example was created
in response to the need for predictions about future populations. Forecasting
techniques can be used by healthcare professionals at all levels who are
involved with policy analysis, strategic planning, or basic decision-making.
Models can be used to predict time-series data related to resource management,
clinical care, logistics, and ancillary services.
This study examined a model to forecast Pseudoephedrine prescriptions
and URI visits. However, forecasting not only aids in pharmacy and clinical
Page 32
Holt-Winters Forecasting 31
management, it can help identify spikes in usage and make managers aware of
trends. Unfortunately, it may be important for healthcare professionals to study
psuedoephedrine use because of potentially serious side effects and its illegal
use in methamphetamine production. Even when the recommended dosage is
taken, pseudoephedrine can cause adverse cardiovascular effects such as
"...hypertension, arrhythmias, prolongation of the QT interval, and angina
pectoris" (Manini, Kabrhel, & Thomsen, 2005, p. 213). Pseudoephedrine is a
main ingredient in the illegal drug methamphetamine also known as meth. Meth
is manufactured in makeshift laboratories throughout the US and there are
approximately 1.4 million meth users in America. That number is rising and a
2005 study found "... 58 percent of law enforcement officials in 500 counties
Q surveyed by the National Association of Counties cite methamphetamine as their
biggest drug problem" (PBS, 2006). Internationally, meth is considered the most
abused hard drug. "The world's 26 million meth addicts equals the combined
number for cocaine and heroine abusers" (PBS, 2006). Meth triggers dopamine
which results in a prolonged euphoria. It is extremely addictive and over time can
lead to many serious medical conditions such as stroke, heart attack, seizure,
and death.
Over 35 state legislatures have restricted the sales of products containing
pseudoephedrine. In Oregon, pseudoephedrine must be prescribed. The
Minnesota House of Representatives overwhelmingly approved a ban on over-
the-counter sales of tablets containing pseudoephedrine in 2005 making it one of
the strongest meth bills in the country. Critics are concerned that the bill goes too
Page 33
Holt-Winters Forecasting 32
far and that legitimate uses for the drug are overlooked, making it harder for
patients to obtain inexpensive cold therapies. In Minnesota, the ban only applies
to the pill form that is easily cooked and transformed into meth. Liquid and gel
caps will still be available on the market. The effects of meth are devastating and
the byproducts are extremely toxic. The epidemic concerns law enforcement,
environmentalists, politicians, healthcare professionals, and practically the whole
of society.
Many opportunities exist for future study. Additional research could include
the demonstration of other forecasting models such as moving averages or
autoregressive models. These models also relate a series to its own past values
and are useful in forecasting time series data.
Another opportunity for further study is the use of quantitative forecasting
in health law. Some states allow economists to project hedonic damages in
wrongful death and medical malpractice cases. Forensic economics involves
using financial and statistical models to determine the value of such things as the
loss of enjoyment of life. Forecasts are conducted to estimate lost earnings, the
cost of future healthcare, even the loss of companionship for survivors.
Increasingly, states are allowing testimony from economists on the value of many
variables related to damages. Many elements of damage are already allowed
under the law, however, "...until recently, jurors were left to their own
unpredictable estimations of additional values" (Smith, 1990, p. 48). Although
such economic analysis may be beyond the scope of your average healthcare
Page 34
Holt-Winters Forecasting 33
manager, an understanding of health law and related topics is important for a
successful healthcare professional.
Quantitative forecasting techniques such as the Holt-Winters method are
not simply numbers from thin air. They "consist of intuitive judgments throughout
the modeling process" (Pindyck & Rubinfeld, 1998, p. 13). It involves statistical
analysis, which is as much an art as a science. Healthcare managers are not as
familiar as they could be with very basic tools that can save a lot of time and
resources. Graduate healthcare administration programs should incorporate
additional and expanded health economics courses in their curricula. Students
and graduates will not predict the future with absolute certainty, but they will be
able to build and use models that allow them to come close.
Page 35
Holt-Winters Forecasting 34
References
Armstrong, J. S. (2001). Standards and practices for forecasting. Principles of
Forecasting: A Handbook for Researchers and Practitioners, 1-46.
Armstrong, J. S. & Collopy, F. (1992). Error measures for generalizing about
forecasting methods: empirical comparisons. International Journal of
Forecasting, 8, 69-80.
Cooper, D.R. & Schindler, P.S. (2003). Business Research Methods. New York,
NY: The McGraw Hill Companies, Inc.
Disability cases grow. (2006, April 24). Air Force Times, p. 6.
Executive Information and Decision Support for the MHS. (2004). MCFAS 4.02
Beneficiary Population Forecasting Model User Manual (Publication No.
10574.004 WP 04-4). Falls Church, VA: Author
Executive Information and Decision Support for the MHS. (2005). MCFAS
Methodology Overview. Falls Church, VA: Author
Ginter, P.M., Swayne, L.E. & Duncan, W.J. (2002). Strategic Management of
Health Care Organizations. Oxford: Blackwell Publishing Ltd.
Holt, C. C. (2004). Forecasting seasonals and trends by exponentially weighted
moving averages. Journal of Economic and Social Measurement, 29,
123-125.
Hyman, D. (1994). Macroeconomics (3rd ed.). Burr Ridge, IL: Irwin.
Hymans, S. H. (2005). Forecasting and Econometric Models. Retrieved
October 9, 2005, from http://www.econlib.orq/library/Enc
Kalekar, P. S. (2004). Time Series Forecasting using Holt-Winters Exponential
Page 36
Holt-Winters Forecasting 35
KSmoothing. Unpublished doctoral dissertation, Kanwal Rekhi School of
Information Technology.
Koehler, A.B., Snyder, R.D., & Ord, J.K. (2001). Forecasting models and
prediction intervals for the multiplicative Holt-Winters method.
International Journal of Forecasting, 17, 269-286.
Manini, A.F., Kabrhel, C., Thomsen, T.W. (2005). Acute myocardial infarction
after over-the-counter use of pseudoephedrine. Annals of Emergency
Medicine, 45, 213-216.
Military Healthcare System M2 Database: 2006
- Number of URI visits and Pseudoephedrine prescriptions in fiscal years
2004-2005 [Data file]. Falls Church, VA: TRICARE Management Activity
Minitab Statistical Software (2005). State College, PA.
National Statistics United Kingdom. (2005). Methodology of the Experimental
Monthly Index of Services. Retrieved September 21, 2005, from
http://www.statistics.gov. uk/iosmethodoloqy/defauIt.asp
Needham, D.M., Bronskill, S.E., Calinawan, J.R., Sibbald, W.J., Pronovost, P.J.,
& Laupacis, A. (2005). Projected incidence of mechanical ventilation in
Ontario to 2026: Preparing for the aging baby boomers. Critical Care
Medicine, 33(3), 574-579.
Pate, C.L. (2005, September). Exponential Smoothing Methods and Healthcare
Workload: A Case Study of Primary Care Visits. Paper presented at
The 27th Australian Conference of Health Economists
Pindyck, R.S. & Rubinfeld, D.L. (1998). Econometric Models and Economic
Page 37
Holt-Winters Forecasting 36
K Forecasts. Singapore: Irwin McGraw-Hill
Public Broadcasting System. (2006). Frontline: The Meth Epidemic. Retrieved
March 24, 2006, from http://www.pbs.orcq/wqbh/paqes/frontline/meth/fags/
Santerre, R.E. & Neun, S.P., (2004). Health Economics: Theories, Insights, and
Industry Studies. Mason, OH: Thomson South-Westem.
Skrepnek, G.H. (2005). Regression methods in the empiric analysis of health
care data. Journal of Managed Care Pharmacy, 11, 240-251.
Smith, S.V. (1990). Hedonic damages in the courtroom setting - a bridge over
troubled waters. Journal of Forensic Economics, 3(3), 41-49.
Statistics Glossary. (2005). Time Series Data. Retrieved September 30, 2005
from http://www.stats.qla.ac.uk/steps/.qlossary/time series.html