164
REGIONAL ANALYTICAL REPORT VOLTA REGION Ghana Statistical Service June, 2013

REGIONAL ANALYTICAL
REPORT
VOLTA REGION
Ghana Statistical ServiceJune, 2013

ii
Copyright © 2013 Ghana Statistical Service
Prepared by:
Martin K. Yeboah
Augusta Okantey
Emmanuel Nii Okang Tawiah
Edited by: N.N.N. Nsowah-Nuamah
Chief Editor: Nii Bentsi-Enchill
iii
PREFACE AND ACKNOWLEDGEMENT
There cannot be any meaningful developmental activity without taking into account the
characteristics of the population for whom the activity is targeted. The size of the population
and its spatial distribution, growth and change over time, and socio-economic characteristics
are all important in development planning. The Kilimanjaro Programme of Action on
Population adopted by African countries in 1984 stressed the need for population to be
considered as a key factor in the formulation of development strategies and plans.
A population census is the most important source of data on the population in a country. It
provides information on the size, composition, growth and distribution of the population at
the national and sub-national levels. Data from the 2010 Population and Housing Census
(PHC) will serve as reference for equitable distribution of resources, government services and
the allocation of government funds among various regions and districts for education, health
and other social services.
The Ghana Statistical Service (GSS) is delighted to provide data users with an analytical
report on the 2010 PHC at the regional level to facilitate planning and decision-making. This
follows the publication of the National Analytical Report in May, 2013 which contained
information on the 2010 PHC at the national level with regional comparisons. Conclusions
and recommendations from these reports are expected to serve as a basis for improving the
quality of life of Ghanaians through evidence-based policy formulation, planning, monitoring
and evaluation of developmental goals and intervention programs.
The Regional Analytical Report for the Volta Region is one of ten regional reports aimed at
making data available to planners and decision makers at the regional and district levels. In
addition to presenting district profiles, the report also discusses the social and economic
dimensions of demographic variables.
For ease of accessibility of the census data, the regional reports and other census reports
produced by the GSS will be disseminated widely in both print and electronic formats,
including posting on the GSS website: www.statsghana.gov.gh.
The GSS wishes to express its profound gratitude to the Government of Ghana for providing
the required resources for the conduct of the 2010 PHC. We also appreciate the contribution
of our Development Partners (DPs) towards the successful implementation of the Census.
Special mention must be made of the European Union (EU) and the Department for
International Development (DFID) for providing resources for the preparation of the report,
the World Bank for managing the resources and the United Nations Population Fund
(UNFPA) for the lead role it played in mobilizing resources from the UN System and from
other DPs for the 2010 PHC.
Finally, we wish to thank all households and individuals in Ghana who contributed to the
success of the 2010 Population and Housing Census.
Dr. Philomena Nyarko
Acting Government Statistician

iv
TABLE OF CONTENTS
PREFACE AND ACKNOWLEDGEMENT ..................................................................... iii
LIST OF TABLES ............................................................................................................ vii LIST OF FIGURES ........................................................................................................... ix
ACRONYMS ....................................................................................................................... x CHAPTER ONE: INTRODUCTION ............................................................................... 1
1.1 Introduction ......................................................................................................... 1 1.2 Historical Background ......................................................................................... 1
1.3 Physical features .................................................................................................. 2 1.4 Social Structure ................................................................................................... 3
1.5 Economic Activity ............................................................................................... 4 1.6 Social Infrastructure/Amenities ........................................................................... 4
1.7 Health and Nutrition ............................................................................................ 5 1.8 Tourism ............................................................................................................... 6
1.9 Organization of the report .................................................................................... 6
CHAPTER TWO: CENSUS METHODOLOGY ............................................................. 7 2.1 Introduction ......................................................................................................... 7 2.2 Pre-enumeration activities ................................................................................... 7
2.3 Census Enumeration .......................................................................................... 13 2.4 Post Enumeration Survey................................................................................... 14
2.5 Lessons learnt and Challenges ........................................................................... 15 2.6 Summary and recommendations ........................................................................ 16
2.7 Concepts and Definitions ................................................................................... 17
CHAPTER THREE: POPULATION SIZE, COMPOSITION AND AGE-SEX
STRUCTURE ............................................................................... 24 3.1 Introduction ....................................................................................................... 24
3.2 Population Size and Growth .............................................................................. 24 3.2 Population Density ............................................................................................ 25
3.3 Population Distribution (Urban/Rural) ............................................................... 26 3.4 Age-Sex Structure ............................................................................................. 27
3.5 Dependency Ratios ............................................................................................ 32 3.6 Sex Structure ..................................................................................................... 33
3.7 Sex Ratios ......................................................................................................... 35 3.8 Nationality......................................................................................................... 36
3.9 Birthplace .......................................................................................................... 37 3.10 Ethnicity ............................................................................................................ 39
3.11 Religious Affiliation .......................................................................................... 39
CHAPTER FOUR: HOUSEHOLD SIZE, STRUCTURE AND COMPOSITION ....... 41 4.1 Introduction ....................................................................................................... 41 4.2 Definition of Concept ........................................................................................ 41
4.3 Household Size .................................................................................................. 41 4.4 Household Headship .......................................................................................... 42
4.5 Household Composition .................................................................................... 44 4.6 Household Structure .......................................................................................... 47
CHAPTER FIVE: MARITAL CHARACTERISTICS .................................................. 49 5.1 Introduction ....................................................................................................... 49
5.2 Marital Status by Age ........................................................................................ 49 5.3 Marital Status by Sex ......................................................................................... 51
v
5.4 Marital Status by Locality of Residence ............................................................. 51
CHAPTER SIX: INFORMATION AND COMMUNICATIONS TECHNOLOGY ..... 55 6.1 Introduction ....................................................................................................... 55 6.2 Number and Characteristics of Mobile Phone Owners ....................................... 55
6.2 Number and Characteristics of Internet Facility Users ....................................... 61 6.3 Household Ownership of Desktop/Laptop Computer ......................................... 67
CHAPTER SEVEN: EDUCATION AND LITERACY .................................................. 70 7.1 Introduction ....................................................................................................... 70
7.2 Literacy ............................................................................................................. 70 7.3 Past School Attendance ..................................................................................... 72
7.4 Current School Attendance ................................................................................ 73 7.5 Educational Attainment by Selected Economic Characteristics .......................... 75
CHAPTER EIGHT: FERTILITY, MORTALITY AND MIGRATION ....................... 79 8.1 Introduction ....................................................................................................... 79
8.2 Fertility ............................................................................................................. 79 8.3 Mortality ........................................................................................................... 82
8.4 Migration and Urbanization ............................................................................... 84 8.5 Urbanization ...................................................................................................... 89
CHAPTER NINE: ECONOMIC CHARACTERISTICS............................................... 92 9.1 Introduction ....................................................................................................... 92
9.2 The Activity Status of the Population ................................................................ 92 9.3 The Employed Population ................................................................................. 95
9.4 The Unemployed ............................................................................................. 102
CHAPTER TEN: DISABILITY .................................................................................... 104 10.1 Introduction ..................................................................................................... 104 10.2 Disability by age.............................................................................................. 104
10.3 Type of Disabilty ............................................................................................. 105 10.4 Disability by Sex ............................................................................................. 105
10.5 Disability and Marital Status............................................................................ 106 10.5 Disability and Locality of Residence ............................................................... 108
10.6 Disability and Educational Attainment............................................................. 108 10.7 Disability and Economic Activity Status .......................................................... 109
CHAPTER ELEVEN: AGRICULTURAL ACTIVITY ............................................... 111 11.1 Introduction ..................................................................................................... 111
11.2 Households in Agriculture ............................................................................... 111 11.3 Type of Farming Activities .............................................................................. 115
CHAPTER TWELVE: HOUSING CONDITIONS ...................................................... 124 12.1 Introduction ..................................................................................................... 124
12.2 Housing Stock ................................................................................................. 124 12.3 Type of Dwelling............................................................................................. 125
12.4 Rooms in Occupied Units ................................................................................ 129 12.5 Households and Tenancy by District ................................................................ 131
12.6 Household Facilities ........................................................................................ 133 12.7 Bathing Facilities ............................................................................................. 139
12.8 Summary and Policy Implications ................................................................... 140 12.9 Demographic Characteristics ........................................................................... 141
12.4 Fertility, Mortality, Migration .......................................................................... 142 12.5 Social characteristics ....................................................................................... 143
12.6 Literacy and Education .................................................................................... 143 12.7 Disability ......................................................................................................... 144
vi
12.8 Economic Characteristics ................................................................................ 144 12.9 Information and Communications Technology ................................................ 146
12.10 Housing Conditions ......................................................................................... 147
CHAPTER THIRTEEN: SUMMARY FINDINGS AND POLICY
RECOMMENDATIONS ..................................................... 150 13.1 Policy Recommendation .................................................................................. 150
REFERENCE .................................................................................................................. 153

vii
LIST OF TABLES
Table 1.1: Districts in the Volta Region and their capitals.................................................... 3
Table 1.2: Number of schools, 2008/09 to 2010/11 .............................................................. 5
Table 1.3: Top 10 morbidity indicators ................................................................................ 5
Table 3.1: Trends in Volta Region Population Size and Growth Rate, 1960-2010 .............. 24
Table 3.2: Population Size, by District, 2010 ..................................................................... 25
Table 3.3: Regional population density trends, 1960-2010 ................................................. 25
Table 3.4: Population density by district ............................................................................ 26
Table 3.5: Population by district and locality ..................................................................... 27
Table 3.6: Population, by age and sex, 2000 and 2010 ....................................................... 28
Table 3.7: Population by age, locality and sex ................................................................... 30
Table 3.8a: Regional age structure, 1960-2010 .................................................................... 31
Table 3.8b: Age distribution of population, by district ......................................................... 31
Table 3.9: Population by broad age group, dependency ratios and district .......................... 32
Table 3.10: Regional distribution of population, by sex, 1960-2010 .................................... 34
Table 3.11: Distribution of the population, by district and sex ............................................. 35
Table 3.12: Population, by sex ratio and district .................................................................. 36
Table 3.13: Population by nationality and district ................................................................ 37
Table 3.14: Birthplace by district......................................................................................... 38
Table 3.15: Ethnic group, by district .................................................................................... 39
Table 3.16: Population, by religion and district ................................................................... 40
Table 4.1: Household size by district ................................................................................. 42
Table 4.2: Household headship, by district, locality and sex of head .................................. 43
Table 4.3: Household headship, by sex, age and locality.................................................... 43
Table 4.5: Household Composition, by Age ...................................................................... 44
Table 4.6: Household composition, by sex and district ...................................................... 45
Table 4.7: Household composition, by locality .................................................................. 47
Table 4.8: Household structure, by locality ........................................................................ 48
Table 5.1: Distribution of population 12 years and older, by marital status and age ........... 50
Table 5.2: Distribution of persons 12 years and older, by marital status ............................. 51
Table 5.3: Distribution of persons 12 years and older, by marital status and locality
of residence....................................................................................................... 51
Table 5.4: Distribution of persons 12 years and older, by marital status and level
of education ...................................................................................................... 52
Table 5.5: Distribution of persons 12 years and older, by marital status and religion ......... 53
Table 5.6: Marital status of persons 12 years and older, by economic activity status .......... 54
Table 6.1: Distribution of population 12 years and older with mobile phones, by............... 55
district and sex .................................................................................................. 55
Table 6.2: Population 12 years and older with mobile phones, by district and sex .............. 56
Table 6.3: Population 12 years and older with mobile phones, by age and sex ................... 57
Table 6.4: Population 12 years and older with mobile phones, by age group and sex ........ 58
Table 6.5: Distribution of the population 12 years and older with mobile phones,
by district and locality of residence ................................................................... 59
Table 6.6: Distribution of population 12 years and older with mobile phones, by
district and locality............................................................................................ 60
Table 6.7: Percentage of population 12 years and older with mobile phones, by level of
education and sex .............................................................................................. 61

viii
Table 6.8: Percentage of population 12 years and older with mobile phones, by economic
activity and sex ................................................................................................ 61
Table 6.9: Distribution of population 12 years and older using internet facilities,
by district and sex ............................................................................................ 62
Table 6.10: Population 12 years and older using internet, by district and sex ..................... 63
Table 6.11: Population 12 years and older using internet by district and locality of
residence .......................................................................................................... 64
Table 6.12: Percentage share of population 12 years and older using internet facility,
by age and sex ................................................................................................. 65
Table 6.13: Percentage of population 12 years and older using internet, by age and sex ...... 66
Table 6.14: Population 12 years and older using internet, by economic activity status
and sex ............................................................................................................. 67
Table 6.15: Households owning desktop/laptop, by district and sex of household head ....... 68
Table 6.16: Percentage of households with desktop/laptop, by district ................................ 69
Table 7.1: Literacy levels for persons 15 years and older, by district ................................ 71
Table 7.2: Age-specific literacy rates among literate heads of households, by sex ............. 72
Table 7.3: Past school attendance ( 6 years and older), by highest level attained
and district ....................................................................................................... 73
Table 7.4: Current school attendance (6 years and older), by highest level attained,
sex and district ................................................................................................. 74
Table 7.5: Educational attainment, by employment status of economically active
population (15 years and older), by sex ............................................................ 76
Table 7.6: Economically active population 15 years and older, by level of education,
sex and occupation ........................................................................................... 77
Table 8.1: Trends in total fertility rates, 1988-2010 ........................................................... 80
Table 8.2: Total fertility rate, by district ............................................................................ 80
Table 8.3: Total fertility rates and age-specific fertility rates, by district ............................ 81
Table 8.4: Children ever born and mean children ever born, by locality ............................. 82
Table 8.5: Infant and under-five mortality (per 1,000 live births ........................................ 83
Table 8.6: Infant and under-five mortality rates*, by district and reference period ............. 84
Table 8.7: Internal migration by place of birth and sex ...................................................... 85
Table 8.9: Non-Ghanaian population, by district and sex ................................................... 87
Table 8.10: Economically active foreign nationals 15 years and older, by sex, age group
and employment status ...................................................................................... 88
Table 8.11: Economically active foreign nationals 15 years and older, by sex, age group
and sector of employment ................................................................................. 89
Table 8.12: Urbanization, in Ghana and Volta Region, 1970-2010 ...................................... 90
Table 8.13: Urban population, by sex and district ................................................................ 91
Table 9.1: Population 15 years and older, by age group, economic activity status and sex . 93
Table 9.2: Economic Activity Status of Children 5-17 Years, by Sex ................................ 93
Table 9.3.: Population 15 years and older, by district, economic activity status and locality 94
Table 9.4: Employed population 15 years and older, by age group and sex ........................ 95
Table 9.5: Population 15 years and older, by economic activity status, district and locality
........................................................................................................................................... 96
Table 9.6: Employed population 15 years and older, by employment status, district
and locality ....................................................................................................... 97
Table 9.7: Employed persons 15 years and older, by occupation and sex ........................... 99
Table 9.8: Employed persons 15 years and older, by district and occupation ................... 100
Table 9.9: Sector of employed persons 15 years and older, by sex ................................... 101
Table 9.10: Economically active population 15 years and older, by industry and sex ......... 102

ix
Table 9.11: Population 15 years and older, by age group and economic activity status ..... 103
Table 9.12: Unemployed population 15 years and older, by district and sex ..................... 103
Table 10.1: Persons with disability, by age and district ..................................................... 104
Table 10.3: Persons with disability, by sex and district ..................................................... 106
Table 10.4: Persons with disability, by marital status, sex and district .............................. 107
Table 10.5: Persons with disability, by locality of residence ............................................. 108
Table 10.6: Persons 3 years and older with disability, by level of education and district ... 109
Table 10.7: Persons 15 years and older with disability by economic activity status ........... 110
Table 11.1: Number of household members engaged in agriculture, by district, locality
of residence and sex ....................................................................................... 111
Table 11.2: Households engaged in agriculture, by district, locality and sex of head ......... 112
Table 11.3: Households engaged in agriculture, by household size and district ................. 113
Table 11.4: Households in agriculture, by district, locality and age of head ...................... 114
Table 11.5: Households in agriculture, by district, locality, agricultural activity and
sex of head .................................................................................................... 116
Table 11.6: Type of crop, by number of farms and type of cropping ................................ 119
Table 11.7: Distribution of households, by locality and crop cultivated ........................... 121
Table 11.8: Distribution of livestock, by locality and number of holdings/livestock ......... 123
Table 12.1: Stock of houses and households, by district................................................... 125
Table 12.2: Type of dwelling, by district ......................................................................... 126
Table 12.3: Main construction material for outer wall, by district .................................... 127
Table 12.4: Materials used for floor construction, by district ........................................... 128
Table 12.6: Sleeping rooms per household, by district ..................................................... 130
Table 12.7: Number of rooms occupied by households, by district .................................. 131
Table 12.8: Ownership of dwelling, by district ................................................................ 132
Table 12.10: Main source of drinking water for households, by district ............................. 134
Table 12.11: Main source of lighting, by district ............................................................... 135
Table 12.11: Main source of cooking fuel for household, by district .................................. 136
Table 12.12: Toilet facility, by district ............................................................................... 137
Table 12.13: Solid waste disposal, by district ................................................................... 138
Table 12.14: Liquid waste disposal, by district ................................................................. 139
Table 12.15: Bathing facility used, by household and district ........................................... 140
LIST OF FIGURES
Figure 1.1: Relief Map …………………………………………………………………1
x
ACRONYMS
AGI: Association of Ghanaian Industries
AIDS: Acquired Immune Deficiency Syndrome
ASCII: American Standard Code for Information Interchange
CEB: Children Ever Born
CIDA: Canadian International Development Agency
CS: Children Surviving
CEDAW: Convention on Elimination of All forms of Discrimination
CERSGIS: Centre for Remote Sensing and Geographic Information Survey
CHIPS: Community Health Planning Services
CWIQ: Core Welfare Indicator Questionnaire
DANIDA: Danish International Development Agency
DFID: Department for International Development
ECOWAS: Economic Community of West African States
EMIS: Education Management Information System
EA: Enumeration Area
EU: European Union
fCUBE: Free Compulsory Universal Basic Education
GETFund: Ghana Education Trust Fund
GREDA: Ghana Real Estate Developers Association
GDP: Gross Domestic product
GSS: Ghana Statistical Service
GSDP: Ghana Statistics Development Plan
GPS: Global Positioning System
GPRTU: Ghana Private Road Transport Union
GES: Ghana Education Service
GDHS: Ghana Demography Health Survey
HIV: Human Immune Virus
ISCO: International Standard Classification of Occupation
ISIC: International Standard Classification of Industry
ICU: International Communication Union
ICT: Information Communication Technology
ISSER: Institute of Statistical Social and Economic Research
JSS: Junior Secondary School
JHS: Junior High School
SSS: Senior Secondary School
SHS: Senior High School
LEAP: Livelihood Empowerment Against Poverty Programme
LESDEP: Local Enterprise and Skills Development
LISGIS: Liberia Institute of Statistics and Geo-Information Services

xi
MMDAs: Metropolitan, Municipal and District Assemblies
MDGs: Millennium Development Goals
MER: Migration Effectiveness Ratio
MOE: Ministry of Education
MICS: Multiple Indicator Cluster Survey
MOFA: Ministry of Food and Agriculture
MOTI: Ministry of Trade and Industry
NCA: National Communication Authority
NCPEC: The National Census Publicity and Evaluation Committee
NCTAC: National Census Technical Advisory Committee
NIPORT: National Institute of Population Research and Training
NHIS: National Health Insurance Scheme
ICT4AD: National ICT for Accelerated Development Policy
NDPC: National Development Planning Commission
NGOs: Non-governmental Organisations
OIC: Opportunities Industrialisation Centre
PHC: Population and Housing Census
PPP: Public-Private Partnerships
PNDC: Provisional National Defence Council
PAS: Population Analysis Spreadsheet
PES: Post Enumeration Survey
PWDs: Persons with disabilities
PASEX: Population Analysis System
PES: Post Enumeration Survey
SADA: Savanna Accelerated Development Authority
SAP: Structural Adjustment Programme
SMAM: Singulate Mean Age at Marriage
UNICEF: United Nations International Children‟s Education Fund
UN: United Nations
UNDP: United Nations Development Programme
UNFPA: United Nations Population Fund
WHO: World Health Organization
W.C: Water Closet
ZIMSTAT: Zimbabwe National Statistics Agency
1
CHAPTER ONE
INTRODUCTION
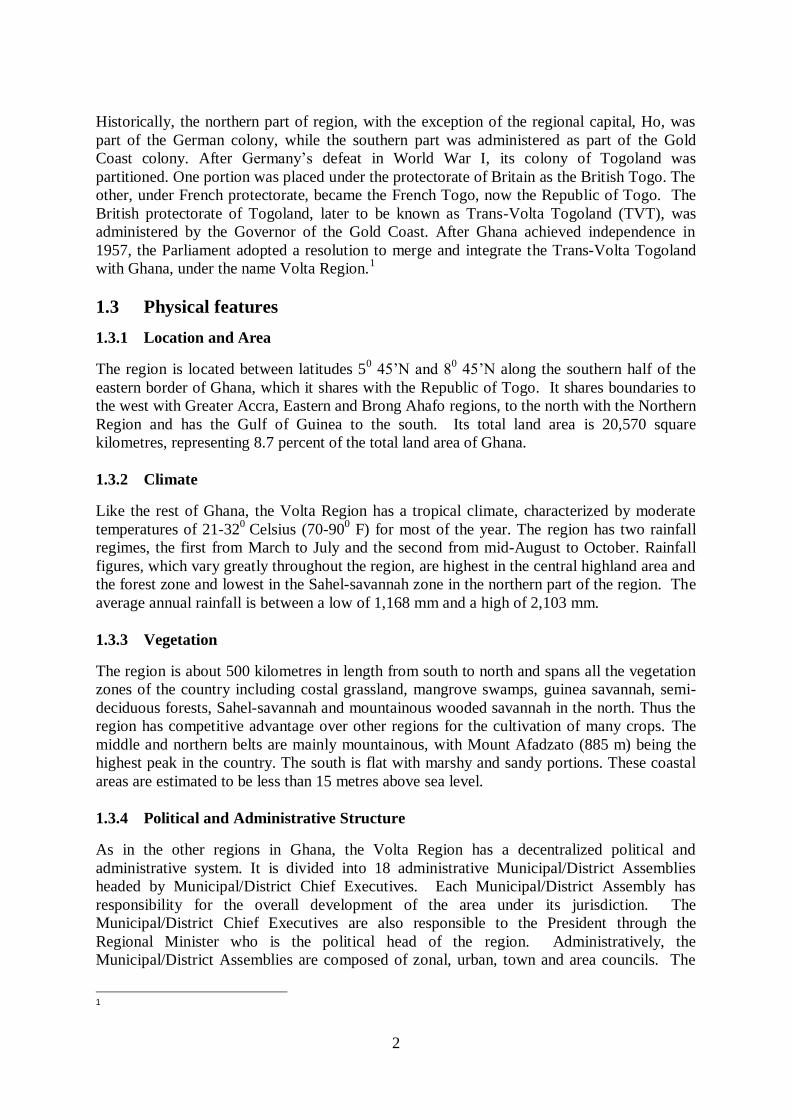
1.1 Introduction
This chapter provides information on the Volta Region and demographic analysis in the
context of the 2010 Population and Housing Census (PHC). The topics discussed include
historical background, physical features, political administration, social structure, economy,
and demographics. The section also includes the organization of the report.
Figure 1.1: Relief Map
1.2 Historical Background
Volta Region is one of the ten regions in Ghana. It lies on the eastern side of the country.
The region derived its name from the Volta River, which virtually separates it from the rest of
the country. The region is unique in the sense that it is the longest of the regions and has all
the ecological zones and ethnic groups found in Ghana living in it as indigenes. For this
uniqueness, the region is described as a microcosm of the country.
2
Historically, the northern part of region, with the exception of the regional capital, Ho, was
part of the German colony, while the southern part was administered as part of the Gold
Coast colony. After Germany‟s defeat in World War I, its colony of Togoland was
partitioned. One portion was placed under the protectorate of Britain as the British Togo. The
other, under French protectorate, became the French Togo, now the Republic of Togo. The
British protectorate of Togoland, later to be known as Trans-Volta Togoland (TVT), was
administered by the Governor of the Gold Coast. After Ghana achieved independence in
1957, the Parliament adopted a resolution to merge and integrate the Trans-Volta Togoland
with Ghana, under the name Volta Region.1
1.3 Physical features
1.3.1 Location and Area
The region is located between latitudes 50 45‟N and 8
0 45‟N along the southern half of the
eastern border of Ghana, which it shares with the Republic of Togo. It shares boundaries to
the west with Greater Accra, Eastern and Brong Ahafo regions, to the north with the Northern
Region and has the Gulf of Guinea to the south. Its total land area is 20,570 square
kilometres, representing 8.7 percent of the total land area of Ghana.
1.3.2 Climate
Like the rest of Ghana, the Volta Region has a tropical climate, characterized by moderate
temperatures of 21-320
Celsius (70-900 F) for most of the year. The region has two rainfall
regimes, the first from March to July and the second from mid-August to October. Rainfall
figures, which vary greatly throughout the region, are highest in the central highland area and
the forest zone and lowest in the Sahel-savannah zone in the northern part of the region. The
average annual rainfall is between a low of 1,168 mm and a high of 2,103 mm.
1.3.3 Vegetation
The region is about 500 kilometres in length from south to north and spans all the vegetation
zones of the country including costal grassland, mangrove swamps, guinea savannah, semi-
deciduous forests, Sahel-savannah and mountainous wooded savannah in the north. Thus the
region has competitive advantage over other regions for the cultivation of many crops. The
middle and northern belts are mainly mountainous, with Mount Afadzato (885 m) being the
highest peak in the country. The south is flat with marshy and sandy portions. These coastal
areas are estimated to be less than 15 metres above sea level.
1.3.4 Political and Administrative Structure
As in the other regions in Ghana, the Volta Region has a decentralized political and
administrative system. It is divided into 18 administrative Municipal/District Assemblies
headed by Municipal/District Chief Executives. Each Municipal/District Assembly has
responsibility for the overall development of the area under its jurisdiction. The
Municipal/District Chief Executives are also responsible to the President through the
Regional Minister who is the political head of the region. Administratively, the
Municipal/District Assemblies are composed of zonal, urban, town and area councils. The
1

3
lowest level sub-structures are the unit committees. The apex of the decentralized
administrative system is the Regional Coordinating Council (RCC) and the District
Assembly. The RCC comprises the Regional Minister, his Deputy, representatives of the
Regional House of Chiefs, the District Chief Executives of the region, Presiding Members,
and representatives of the various decentralized ministries, departments and agencies
(MDAs). Table 1.1 provides a list of the districts in the region and their capitals.
Table 1.1: Districts in the Volta Region and their capitals
District Capital
South Tongu Sogakope
Keta Municipal Keta
Ketu South Denu
Ketu North Dzodze
Akatsi Akatsi
North Tongu Adidome Adaklu Anyigbe Kpetoe
Ho Municipal Ho
South Dayi Kpeve North Dayi Kpando
Hohoe Municipal Hohoe
Biakoye Nkoya Ahenkro
Jasikan Jasikan
Kadjebi Kadjebi
Krachi East Damai
Krachi West Kete Krachi
Nkwanta South Nkwanta
Nkwanta North Kpassa Source: Ministry of Education, 2010/11 Annual Report
1.4 Social Structure
1.4.1 Ethnicity/Language Groups
There are eight major ethnic groups in the region speaking different languages. There are also
an estimated 62 sub-groups speaking 56 dialects. The major ethnic group is the Ewe,
followed by the Guan, the Akan and Gurma. The Guan comprises over 18 sub-groups and the
Akan over 19 sub-groups. The less prominent ethnic groups include the Ga-Dangme, Mole-
Dagbon, Grusi, and the Mande-Busanga.
1.4.2 Traditional Structure
The people of the Volta Region are organized under chiefs at the lineage and settlement
levels. A lineage comprises extended families that trace their genealogy to the same ancestor.
The extended families also have heads who are most often the oldest male. With the
exception of Kadjebi District and a few areas in Jasikan District, ownership of property is
passed on by patrilineal inheritance in all the other districts.
The Volta Regional House of Chiefs, like similar institutions in the other regions, was
established by statute in 1958. The Legislative Instrument 991 of 1974 defined the

4
composition of the Volta Regional House of Chiefs to consist of 15 paramount chiefs (in
charge of 15 Traditional Councils) and 17 rotating members (from 17 groupings) bringing the
total membership to 32.
The Traditional Council is composed of several area councils. The traditional authorities
administer stool lands, holding them in trust for the people, and arrange the celebration of
traditional festivals. They are also the custodians of traditional beliefs and customs, passed on
from one generation to another. The traditional authorities also have courts which adjudicate
on matters relating to stool lands, lineage and family lands, chieftaincy disputes, violations of
traditions and disputes between localities, lineages, families and individuals. In the Volta
Region, no paramountcy owes allegiance to another paramountcy.
1.5 Economic Activity
The majority of the people in the region are engaged in agriculture. The region has substantial
agricultural resources, which include large expanses of land of which an estimated 1,028,500
hectares are suitable for the cultivation of crops and rearing of animals. Currently only 29.0
percent of the total arable land of the region is under cultivation. The major agricultural
products include cocoa and staples such as maize, rice, sorghum, cassava, yam, cocoyam and
plantain.
The region used to be one of the country‟s major cocoa growing areas, mainly in the northern
districts of Hohoe, Jasikan, Kadjebi and Nkwanta. It was the cocoa industry that made Hohoe
a very important commercial town and the capital of the Trans-Volta Togoland before Ho
became the capital. It was also responsible for the considerable in-migration of various ethnic
groups from northern Ghana to the northern districts of the region. The cocoa industry has
however declined over the years as a result of agronomic and political problems. With the
Volta River and the Volta Lake running almost the whole length of the region, there is a good
potential for inland fishing as well as irrigation. The Volta River and Volta Lake are the
largest sources of Ghana‟s fresh water fish but irrigated agriculture is yet to be exploited.
Shallots, which are exported to many parts of West Africa, are cultivated on a large scale by
irrigation, using ground water and boreholes. Animal rearing ranks next to food crop
production in the region, with a large number of cattle, sheep and goats. The cultivation for
export of non-traditional crops such as black pepper, cashew nuts, ginger, pineapple, pawpaw
and mangoes is on the increase.
1.5.1 Major Activities
Agriculture, fishing, hunting and forestry and related work are the dominant economic
activities in the region and the major sources of employment for the economically active
population. The exception is in the Keta and Krachi districts where fishing is the main and
the second major economic activity respectively. Apart from these agriculture-related
activities, there is manufacturing, mining and quarrying, construction, wholesale and retail
trade, and tourism.
1.6 Social Infrastructure/Amenities
1.6.1 Telecommunications Infrastructure
Communication development in the region is progressing steadily, with improved public
telephone links between Ho (the regional capital) and other district/municipal capitals. A new

5
post office building has also been built and provides expedited courier services to every part
of the region. With the introduction of mobile phone services on the Ghanaian market; all
districts and municipalities and most sub-districts in the region can now be contacted on
telephone. Of 495,603 households in the Volta Region, 1.24% have fixed telephone lines,
which is below the national average of 2.3%. The proportion of households with a desktop or
a laptop computer is 3.04%. Of the 1,449,077 persons aged 12 years and older, 37.31% own
mobile phones, also below the national average of 47.70%. Only 3.49% are using an internet
facility (national average 7.80%).
1.6.2 Educational Infrastructure
The region has institutions providing education from kindergarten to tertiary level. Table 2.1
below shows the number of public and private basic schools in the Region from 2008/09 to
2010/11 academic years. The trend shows that the number of schools has increased
consistently over the years. The region also has one polytechnic, one university, and various
tertiary institutions such as teacher training colleges and nursing training schools.
Table 1.2: Number of schools, 2008/09 to 2010/11
2008/09 2009/10 2010/2011
Change
over (%)
All levels Total Public Private
Total Public Private
Total Public Private
2009/10
Kindergarten 1,691 1,358 333
1,708 1,394 314
311 1,740 311
1.9
Primary 1,744 1,490 254
1,767 1,471 296
1775 1,483 292
0.5
JHS 979 860 119
1,004 847 157
1030 866 164
2.6
SHS 83 72 11
90 72 18
92 72 20
2.2
Technical/
Vocational 42 23 19 36 16 20 31 18 13 13.9
Source: Ministry of Education, 2010/11 Annual Report
1.7 Health and Nutrition
1.7.1 Morbidity
Table 1.3 shows the top 10 morbidity indicators in 2010 in the Volta Region. Malaria
accounts for the largest share of morbidity in the region (40.96%), followed by acute
respiratory infections (ARI) with 9 percent share of morbidity.
Table 1.3: Top 10 morbidity indicators
No Disease No. of cases % of Total
1 Malaria 617,191 40.96
2 Acute Respiratory Infections 136,558 9.06
3 Hypertension 74,898 4.97 4 Rheumatism and joint pains 63,550 4.22
5 Skin diseases and ulcers 60,065 3.99
6 Diarrhea diseases 55,286 3.67 7 Intestinal worms 54,348 3.61
8 Anemia 44,113 2.93
9 Gynecological conditions 15,529 1.03
10 Acute eye infection 14,830 0.98 Source: Ghana Heath Service, 2010 Annual Report
6
1.7.2 Health Institutions
The region has a total of 326 health institutions out of which 242 are administered by the
Ghana Health Service (GHS), 18 are mission owned, one is quasi-government and 65 are
privately owned. It is worth noting that many of the GHS-run health centres were community
initiated. With the exception of Krachi East, Nkwanta North and Adaklu Anyigbe, every
district now has a hospital, either government- or mission-owned. As in other parts of the
country, the region has inadequate numbers of health professionals, especially doctors and
nurses, in relation to the population size. For example, in 2009 the total number of doctors in
the region was 53, which represented a ratio of one doctor to 35,871 people. With nurses, the
ratio was one nurse per 1,327 people.
1.7.3 Water and Sanitation
According to the 2011 Community Water and Sanitation Agency (CWSA) report, 2, 318 (or
71.3%) out of the total number of 3,252 communities in the Volta Region obtain their
drinking water from boreholes. This means that only a very small proportion of communities
has access to piped water. With regard to sanitation, the two main facilities available to
households in the region are public toilets (30.0%) and pit latrine in the house (18.7%). Some
households have no toilet facility and therefore resort to the use of the bush and the beach,
especially in the coastal districts (Keta and Ketu South).
1.8 Tourism
The Volta Region has untapped tourism potential capable of transforming the region's
economy and its overall contribution to national income when fully developed. The beautiful
landscape, clean environment of the towns, numerous eco-tourism sites and the rich cultural
heritage epitomized by kente weaving, make it one of the most important tourism areas in the
country. Some of the tourist sites in the region include Amedzofe Mountain, Tagbo Falls
near Hohoe, Tafi Atome Monkey Sanctuary and Xavi Bird Watching Sanctuary. Other areas
marked for tourism development include the Wli Waterfalls in the Hohoe District, the Kpetoe
Kente Village, Adaklu Mountain eco-tourism sites both in the Adaklu-Anyigbe District, Shari
Hilltop Unique Village in the Nkwanta District and Bowiri Lacham Village in the Jasikan
District.
1.9 Organization of the report
Chapter One presents background information on Volta Region as context for the socio-
economic and demographic analysis of the 2010 Population and Housing Census data in the
region. The topics discussed include historical background, physical features, political
administration, social structure, economy, and demographics. The rest of the chapters are
devoted to the analysis of the demographic, social and economic characteristics, as well as
housing and community facilities of the 18 districts in the region.

7
CHAPTER TWO
CENSUS METHODOLOGY
2.1 Introduction
The primary objective of the 2010 PHC was to provide information on the number,
distribution and social, economic and demographic characteristics of the population of Ghana
necessary to facilitate the socio-economic development of the country. In conducting the
2010 PHC, the Ghana Statistical Service (GSS) was guided by the principle of international
comparability and the need to obtain accurate information on population and housing Census
in the country. Therefore, the 2010 PHC was conducted using all the essential features of a
modern census as contained in the United Nations Principles and Recommendations for
countries taking part in the 2010 Round of Population and Housing Censuses. The exercise
was also informed by experience from previous post-independence censuses of Ghana (1960,
1970, 1984 and 2000). From the previous experiences, it was recognized that a large scale
statistical operation as the 2010 Population and Housing Census required meticulous
planning for its successful implementation. This chapter presents information on the pre-
census planning, enumeration and post enumeration activities. It is organized into five
sections namely, pre-enumeration activities, the census enumeration itself, post enumeration
activities, challenges and lessons learnt, summary and recommendations.
2.2 Pre-enumeration activities
The pre-enumeration period consisted of a number of discreet and related activities. This
section outlines the major pre-enumeration activities which were undertaken.
2.2.1 Development of census project document and work plans
The first stage of the exercise involved the setting up of a working group at the head office of
Ghana Statistical Service which was charged with the responsibility of preparing the census
project document with the assistance of consultants. The document contained the rationale
and objectives of the census, census organisation, a work plan and a budget. The project
document was launched in November 2008 as part of the Ghana Statistics Development Plan
(GSDP). In November 2009, the document was reviewed and updated to take into account the
changes which had occurred over the period. Secondly, a management and supervisory
framework which outlined the responsibilities of the various stakeholders essential for the
effective implementation of a population and housing census was also produced as part of the
initial preparation.
2.2.2 Census secretariat and committees
To implement the activities outlined in the 2010 PHC project document, a National Census
Secretariat was set up at GSS head office in January 2008. The Secretariat comprised
professional and technical staff of GSS as well as staff of other Ministries, Departments and
Agencies (MDAs), some of whom were seconded to GSS. The Secretariat, primarily
responsible for the day-to-day planning and implementation of the census activities, consisted
of seven units namely, census administration, cartography, recruitment and training, publicity
8
and education, field operations and logistics management, data processing, and data analysis
and dissemination.
The Census Secretariat was initially headed by an acting Census Coordinator engaged by the
United Nations Population Fund (UNFPA) in 2008 to support GSS in planning the Census. In
2009, the Census Secretariat was re-organised with the Government Statistician as the
National Chief Census Officer and overall Coordinator of the census. As part of the re-
organization, a Census Management Team and a Census Coordinating Team were established
to assist the National Chief Census Officer/Coordinator. The Census Management Team had
oversight responsibility for the implementation of the Census took critical decisions on the
census in consultation with other national committees. The Census Coordinating Team, on
the other hand, was responsible for the day-to-day implementation of the Census programme.
Census committees were set up at both national and sub-national levels to provide technical
advice and assist with resource mobilization. At the national level, the committees were the
National Census Steering Committee (NCSC), the National Census Technical Advisory
Committee (NCTAC) and the National Census Publicity and Education Committee
(NCPEC). At the regional and district levels, the committees were the Regional Census
Implementation Committee (RCIC) and the District Census Implementation Committee
(DCIC) respectively.
At the apex of the structure of the 2010 PHC management was the National Census Steering
Committee as the main policy making body. The Committee was responsible for policy
setting and direction on all aspects of the 2010 PHC. The composition of the NCSC was
inter-sectoral with representation at the highest level, from both public and private
institutions, such as, the Ministry of Finance and Economic Planning, Ministry of Education,
National Population Council, United Nations Population Fund (UNFPA), Electoral
Commission and National House of Chiefs.
The next tier was the National Census Technical Advisory Committee (NCTAC) which was
multi-disciplinary in its membership, comprising subject-matter specialists from a broad
spectrum of Ministries, Departments and Agencies (MDAs), universities, other research
institutions and private consultants. This Committee served as a think-tank and an advisory
body to the Census Management Team and supported the Census Coordinating Team at
specific stages of the census programme. For instance, the Committee assisted in developing
the questionnaires and ancillary documents used for the census.
A National Census Publicity and Education Committee comprising senior level
representatives in communication, civic education and advocacy from relevant public and
private institutions was set up to advice on education and publicity. The Committee provided
technical advice to the Census Secretariat in the development of publicity and educational
materials and implementation of the publicity programmes for the census.
Inter-sectoral Regional and District Census Implementation Committees were formed in all
the regions and districts in the country. With membership drawn mainly from decentralized
departments, Regional and District Coordinating Directors chaired the Committees
respectively. The Volta Regional Census Implementation Committee worked closely with the
Regional/District Census officials to plan the regional, district and locality level activities in
areas such as recruitment, training, publicity and field operations. The Committee also
assisted in mobilising logistical support for the census.

9
2.2.3 Census Mapping
A timely and well implemented census mapping was considered pivotal for the success of the
2010 PHC as it is the process for delineating the country into enumeration areas to facilitate
smooth enumeration of the population. For the 2010 PHC, the process involved updating the
2000 Census Enumeration Area (EA) maps, which started in the last quarter of 2007, the
acquisition of topographic and digital sheets of all indices from the Geographical Information
System Unit of the Survey and Mapping Division of the Lands Commission.
Updating of the 2000 PHC enumeration areas in the region was faced with a number of
challenges including the problem of demarcating fast growing areas. One other major
challenge for the mapping teams was the reconciliation of administrative boundaries
following the creation of new districts. Field cartographic work in the region was completed
in August, 2009.
2.2.4 Development of questionnaire and manuals
For effective data collection, there is the need to design appropriate documents to solicit the
required information from respondents. In developing questionnaires and other materials, the
GSS consulted widely with main data users and other stakeholders such as MDAs, research
institutions, civil society organisations and development partners. The aim was to give these
institutions and bodies, the opportunity to indicate the type of questions they felt should be
included in the census questionnaire.
The documents developed for the census consisted of questionnaires, manuals and field
operation documents. Three types of questionnaires were developed to cover different
population groups: (1) PHC1A to enumerate the household population; (2) PHC1B for non-
household (Group Quarters) population; and (3) PHC1C to enumerate out-door
sleepers/floating population.
The field operation documents were the Enumerator‟s Visitation Record Book, Supervisor‟s
Record Book, and operational control forms. Enumerators and supervisors used the record
books as operational and quality control tools to control and monitor field activities
respectively. The supervisor‟s record book consisted of checklists and was used to monitor
enumerators under his/her supervision, to record all errors identified in the work of an
enumerator and the measures which were taken to rectify the situation. Two summary sheets
were developed for recording summaries of information collected at the enumeration and
locality level: The PHC3 and the PHC4 forms. The PHC3 form was used to record total
number of persons in each enumeration area by sex and the data from that form were collated
and used to publish the provisional results. The PHC4 form was used to record information at
the locality level on total number of persons enumerated and the availability of social
facilities such as health and educational institutions, public toilets, and the distance to the
nearest facility if that facility was not available in the locality. This form is used to prepare
the Gazetteer, which is the alphabetical listing of all localities in the country by region and by
district with their population and the identified facilities.
The topics which were eventually selected for the 2010 Population and Housing Census were
based on recommendations from the United Nations Principles and Recommendations for
2010 Round of Population and Housing Censuses, the African Addendum to that document
and the needs of data users. 2010 PHC adopted all the core topics recommended at the global
10
level, i.e., geographical and internal migration characteristics, international migration,
household characteristics, demographic and social characteristics such as age, date of birth,
sex, and marital status, fertility and mortality, educational and economic characteristics,
issues relating to disability and housing conditions and amenities were adopted and included
in the census.
Some topics which were not considered „core‟ by the United Nations‟ recommendations but
were found to be of great interest and importance to Ghana and were, therefore, included in
the 2010 PHC questionnaire. These topics were religion, ethnicity, employment sector and
place of work, agricultural activity, Information and Communication Technology (ICT), and
issues on housing, such as type of dwelling, materials used for outer walls, floor and roof,
tenure/holding arrangement, number of sleeping rooms, cooking fuel and cooking space.
The specific items of information collected from the population encountered on census night
were name, sex, age, date of birth, nationality, ethnicity, birthplace, religion, internal
migration, marital status, literacy, full time education, fertility, mortality, economic activity,
occupation, industry, employment status, employment sector, disability, use of ICT, and
agricultural activity. All questions were pre-coded except those on ethnic group, agricultural
activity, occupation and industry, which were coded in the field.
Two manuals were developed: enumerator and supervisor‟s manuals. The first, the
enumerator‟s manual, contained procedures, definitions and concepts used in the census,
instructions on how to enumerate all persons and households in localities and a historical
calendar of national and regional events which was used to estimate the ages of persons who
did not know their date of birth or age. The second, the supervisor‟s manual, contained
information on the duties of a supervisors and how to conduct checks on the work of
enumerators.
For the coding of occupations and industrial activities in the country, a codebook based on
the International Standard Classification of Industry (ISIC) and International Standard
Classification of Occupation (ISCO) was developed. The codes, which were a four-digit
alphabetical ordering, were prepared taking into consideration the ISCO and ISIC structure as
well as occupations and industrial activities specific to Ghana.
2.2.5 Pre-tests and trial census
The census questionnaire was pre-tested twice in the course of its development in line with
the internationally accepted practices for conducting censuses. The first pre-test was carried
out in March 2009 and was used to assess the suitability of questions and instructions,
adequacy and completeness of questions and respondents‟ understanding of the questions.
The second pre-test was conducted in 10 selected enumeration areas in August 2009. The
objective of the second pre-test was to examine the sequencing of questions, testing of new
questions which were introduced in the 2010 PHC such as date of birth and migration and
assess how the introduction of „date of birth‟ could help to reduce „age heaping‟. For the
questions on fertility, the pre-tests sought to find out the difference, if any, between proxy
responses and responses by respondents themselves. Both pre-tests were carried out in the
Greater Accra region. Experiences from the pre-tests informed the development of the final
census questionnaires.

11
In May 2010, GSS with the support of the United Nations Population Fund conducted a
special test-census in the Awutu Senya District of the Central Region. The aim of the exercise
was to test the hypothesis that questions on children ever born and children surviving could
be asked in a census and secondly, if answered by respondents themselves or through proxy
would generate useful and good quality data. The results from this test showed that it was
possible to obtain lifetime fertility data in a census and that there were no significant
differences between the responses given by proxy and the eligible women themselves. Based
on this finding, lifetime fertility questions were re-introduced in the questionnaire.
A trial census was held in October/November 2009 as a dress rehearsal for all the activities
and procedures which had been planned for the main census. These were recruitment and
training, distribution of census materials, administration of questionnaires and other census
forms, enumeration of the various categories of the population (household, institutional and
floating population), and data processing. This trial census was held in six selected districts
across the country in six regions excluding the Volta region. The selection of districts for the
trial census districts was informed by factors such as administrative boundary issues,
ecological zones, accessibility, and availability of outdoor-sleepers/floating and institutional
populations, fast-growing areas and enumeration areas with scattered settlements.
The trial census provided an opportunity to assess plans, procedures and the state of
preparedness for the conduct of the 2010 PHC. Results from the trial census were used to
estimate the number of persons per questionnaire and the average number of persons in the
household roster, to assess the question on migration, the placement of the mortality question,
serial numbering of houses/housing structures and method of collection of information on
community facilities. Some of the common errors encountered during the editing of the
completed questionnaires resulted in modifications to the questionnaire and the enumerator‟s
manual. Lessons learnt from the trial census also guided the planning of the recruitment
process, the procedures for training of field staff, publicity and education on the census.
2.2.6 Distribution of census materials
Experience from trial census guided in the distribution of census materials in the region. The
Regional Census office liaised with institutions that had the capacity to transport large
volumes of materials to the districts. The District Assemblies, Ghana Education Service
(GES), the Electoral Commission, Information Services Department were the institutions that
assisted in transporting the census materials from Accra to the district capitals for distribution
to field personnel.
2.2.7 Publicity and Education
Publicity and public education on the census were considered essential for the success of the
2010 PHC. The objectives of the census education campaign were to sensitize the public on
the importance of the census, to create awareness on the census topics/questions, to solicit for
support from the public on the exercise and to assure the population of the confidentiality of
the information provided. The publicity programme was implemented in two phases. Phase
one was the publicity for the trial census and was restricted to the six trial census districts.
For this phase, the publicity was mostly through direct community such as interpersonal
communication through the Information Service Department vans and traditional forms such
as drums and drama as some of the trial districts were rural and some of the people did not
have access to radio or television. Phase two was the publicity for the main census and this

12
involved sensitization of civil society groups, religious leaders and community leaders;
seminars; workshops; television and radio programmes; and use of public address systems.
Materials used for the publicity of main census publicity included jingles, posters, banners,
car stickers, brochures, handbills, flyers and t-shirts. These materials were distributed freely
through Regional and District Offices of GSS, and Regional and District Census
Implementation Committees.
The Census Night, Sunday, 26th
September 2010, was observed in all Districts in the region
with various activities to make the day memorable. The rationale for celebrating the Census
Night was to create public awareness on the commencement of the census and also for people
to remember that night since information on the census was collected with reference to that
night.
Activities organised in communities included:
Sounding of sirens using Information Service Department, Police vehicles and Fire
Service tenders
Television and radio discussions explaining the importance of the census on Census
Night.
Tooting of horns by Ghana Private Road Transport Union (GPRTU) vehicles
Tolling of church bells
Brass band floats and street processions
Bonfires (especially in Greater Accra)
Traditional drumming, gong-gong beating and firing of muskets (especially in the
rural and semi-urban areas)
Cultural shows and music by spinning groups
Film shows.
2.2.8 Recruitment and Training of census personnel
Recognising the importance of using high calibre personnel, training and motivation in
conducting a successful census, the GSS developed elaborate plans for the recruitment and
training of field personnel. The Census Secretariat developed a criterion for field personnel.
Using the developed criteria, an online recruitment process was adopted and interested
person‟s selection which was used in all regions. Applicants were requested to complete an
online application form after which qualified candidates were shortlisted and interviewed in
the district of their choice. The names of successful applicants were forwarded to the Census
Secretariat after which the names were posted to the districts for interviews and selection of
successful applicants.
Given the large number of personnel that had to be trained for the census enumeration a four-
tier training programme was implemented at the national level. In the first tier, GSS trained
about 50 national level trainers. These together with senior officials of GSS formed the core
of trainers who trained about 250 regional level trainers. The regional level trainers then
trained about 2000 district level trainers who in turn trained about 50,000 enumerators,
supervisors and senior supervisors. These district level trainers were mainly from Ghana
Education Service (GES) and officials of MDAs. In August 2010, a one-week training
programme was conducted at the national level for all district level trainers. This was to
ensure standardized training. After the training of the district level trainers, they in-turn
organized training for field personnel in their respective districts.
13
The training of the field personnel for the main census took place concurrently in all the 20
districts in the region. The training focused on the objectives of the census, interview
techniques, map reading skills, listing of households, administration of the census
questionnaires and how to complete the operational control forms. The field personnel who
were trained included senior field supervisors, field supervisors and enumerators.
Based on results from an assessment of the trainers, some of them were select as supervisors.
Those selected were given additional training which focused mainly on supervision of
enumerators, field checks, and the completion of census operational control forms and
summary sheets.
Enumerators and supervisors were trained to undertake the census due to the fact that Ghana
is largely an illiterate society. Thus, the canvasser method, which involves trained field
personnel visiting houses and households to enumerate, was adopted for the 2010 PHC.
Specific arrangements were made for the coverage of special population groups, such as the
homeless and the floating population.
2.3 Census Enumeration
2.3.1 Enumeration
In the 2010 PHC, people were enumerated at where they were on census night (de facto) as in
all the four post- independence censuses (1960, 1970, 1984, and 2000) conducted in the
country and not at where they usually resided (de jure). The de facto count was adopted
because it is based on physical presence on a defined date and therefore it is simple,
straightforward, and easy to interpret as well as minimizes the risks of under-enumeration and
over enumeration. The reference period, the census night, was fixed for 20th September 2010.
The field personnel used the week preceding the Census Night to identify EA boundaries, list
houses and other structures in their enumeration areas and enumerated institutional
populations (health facilities, boarding schools and prisons). Prior to the census enumeration,
officials of the Regional Census office identify possible locations of out-door sleepers in the
region. This was to assist the officials to plan on how to enumerate the floating. Field officers
were deployed to enumerate the floating population on Census Night using the census
questionnaire (PHC1C).
Following the census night on 26th September 2010, enumeration of household populations
started on Monday, 27th
September 2010 with visits to houses, compounds and structures in
enumeration areas. The enumeration was carried out in the order in which houses/structures
were listed. Where the members of a household were absent, the enumerator left a call-back-
card indicating when he/she would return to enumerate the household. The enumeration
process took off smoothly and on schedule. However, after a few days‟ work, some
enumerators ran short of questionnaires, delaying the process for about three days.
Enumeration resumed in all districts when the shortage of questionnaires was resolved and by
17th
October, 2010, enumeration was completed in most districts. Enumerators who
completed their work early were mobilized to assist in the enumeration of localities that had
large EAs especially in the district capitals.

14
2.3.2 Supervision and monitoring of field work
To achieve effective supervision, one supervisor was assigned to five enumerators. The
supervisors ensured that enumerators followed all the instructions and procedures in carrying
out their assigned responsibilities. In addition, District and Regional Census Officials and
census committee members also went round to ensure that the enumeration exercise was
successful.
2.3.3 Retrieval of Census materials
One of the post enumeration activities in the region involved the collection and transportation
of census forms to Accra for data processing. At the end of field work on 17th
October, 2010,
enumerators submitted their completed questionnaires, summary forms (PHC3 & PHC4) and
other census materials to their supervisors who in turn forwarded them to the District Census
Office. Materials received at the District Office were documented and the receipts which
accompanied the census materials were used to reconcile the items given to an enumerator
and those returned. The PHC3 forms were quickly dispatched to the Census Secretariat from
which the provisional results were compiled. . Vehicles were sent from Accra to collect the
completed questionnaires and other documents from the districts to the Census Secretariat.
2.4 Post Enumeration Survey
In line with United Nations‟ recommendations, GSS conducted a Post Enumeration Survey
(PES) in April, 2011. The objective was to use the results to check for content and coverage
errors and to provide feedback on aspects such as concepts and procedures on census
operations. Findings from PES can also guide users in their interpretation of the 2010 PHC
results. Five items of information were collected in the PES: name, sex, age, relationship to
head of household and marital status. Similar PESs were undertaken in previous post-
independence censuses. The results of the 1960 and the 1970 PESs were published but not
those of 1984 and 2000.
For the PES a sample of 250 (0.67%) out of 37,642 enumeration areas, was selected across
the country. To ensure reliability of the survey estimates of the PES, the 2010 PHC frame
was used. First stratified into the 10 administrative regions, enumeration areas were allocated
to each stratum (region) according to the proportion of EAs in each region. Systematic
sampling with probability proportional to size (number of households) was applied in
selecting the enumeration areas in each region. A matching exercise was conducted to check
both coverage and content errors.
Some of the personnel who took part in the 2010 PHC field enumeration exercise were
recruited and trained for six days on the instruments prepared for the PES. The field work
was carried out for 21 days in April 2011 and was closely monitored and supervised to ensure
quality output. The main findings of the PES were that:
97.0 percent of all household residents who were in the country on Census Night (26th
September, 2010) were enumerated in the 2010 PHC representing an omission rate of
3.0 percent.

15
1.3 percent of the population was erroneously included in the census.
The PES count recorded a population of 24.0 million for Ghana on Census Night
against 24.1 from the main 2010.
The true population which is the population estimated from the PES multiplied by the
population from the census after correcting for erroneous inclusions and divided by
matched population between the census and the PES is 24.5 million.
Regional differentials are observed. Upper East region recorded the highest coverage
rate of 98.2 percent while the Volta region had the lowest coverage rate of 95.7
percent.
Males (3.3%) were more likely than females (2.8%) to be omitted in the census. The
coverage rate for males was 96.7 percent and the coverage rate for females was 97.2
percent. Also, the coverage rates (94.1%) for those within the 20-29 and 30-39 age
groups are relatively lower compared to the coverage rates of the other age groups.
There was a high rate of agreement between the 2010 PHC data and the PES data for
sex (98.8%), marital status (94.6%), relationship to head of household (90.5%) and
age (83.0%).
2.5 Lessons learnt and Challenges
This section highlights some of the challenges and lessons learnt before, during and after the
planning and implementation of the 2010 PHC in the Greater Accra region. The lessons
learnt cover aspects such as recruitment and training of field personnel, publicity and
education, demarcation of enumeration areas, and field challenges.
2.5.1 Boundary Disputes
Disputes relating to district boundaries arose during the demarcation of enumeration areas
and also during the actual enumeration of the population. During the delineation of EAs,
some community leaders and District Assembly officials confronted the cartographic field
personnel for placing their communities in districts other than those they claimed they
belonged to. Similar confrontations occurred during the enumeration where some
communities initially refused to be enumerated due to district boundary disputes. They
claimed that enumerators assigned to their area were from different districts and therefore
could not be allowed to enumerate them. In some cases, senior census officials, District Chief
Executives and officials of the Volta Regional Coordinating Council had to intervene before
the aggrieved communities accepted to be enumerated. The assurance given was that their
population will be allocated to the district they claimed to belong to. Such disputes affected
the timely completion of both exercises.
2.5.2 Large Enumeration Areas
The usual practice is to assign one enumerator to one enumeration area. As such enumeration
areas are usually created in such a way that the enumerator is able to complete enumeration
within the stipulated time. Unfortunately some enumeration areas in the region were larger
and therefore the enumerators of those enumeration areas were unable to complete
enumeration within the given time. When this became known, additional enumerators were

16
deployed to assist them to enumerate the remaining areas. This situation led to late
completion of work in such enumeration areas, which contributed to the overall delay in the
fieldwork in the region.
2.5.3 Shortage of Census Questionnaires
The initial shortage of questionnaires was one of the major setbacks in the 2010 PHC. As a
result, some enumerators resorted to the use of exercise books to record information of
households. Enumerators who did this were asked to transfer such information to the
questionnaire when the situation improved. This was done with the guidance of supervisors.
2.5.4 Supervision
Although conscious effort was made to select knowledgeable, experienced and committed
people as supervisors, some of them could not perform as expected in the field. Such people
did not have the necessary skills to supervise and monitor the work of others. In some cases,
there were problems with supervision because some teachers were selected as supervisors
over their superiors at work. This affected working relationships. In future, the selection of
supervisors should be done with more care than was the case in some of the areas.
2.5.5 Logistics
During the mapping exercise, an inadequate number and frequent breakdown of vehicles was
a challenge. Another challenge GSS faced by the Regional Census office was the late
delivery of bags/satchels that were to be used for packaging of the census questionnaires. Due
to the late delivery of the bags/satchels, cartons were used to package and transport the
census materials from the districts to the Census Secretariat in Accra.
2.6 Summary and recommendations
2.6.1 Summary
Methodologies adopted for the 2010 census were derived from the recommendations from the
United Nations Principles and Recommendations for the countries taking part in the 2010
round of population and housing census as well as experience from previous censuses in
Ghana.
Topics covered in the census were: demographic and social characteristics, such as, age, sex,
marital status, ethnicity, religion, literacy, education, economic characteristics, ICT,
disability, fertility, mortality, agricultural activity and housing.
In the area of census mapping, both manual and digital mapping techniques were used. In
previous censuses, only manual mapping techniques were used to produce census
enumeration area maps.
The 2010 Population and Housing Census was widely publicized in every community in the
region. The involvement of many stakeholders such as Ministry of Information, Information
Service Department, and the National Commission for Civic Education, MMDAs and the
private media contributed to the success of the census publicity campaign in the region.
Training of field personnel was done at the district level.
17
Some of the major challenges were encountered in the areas of census mapping, field data
collection and supervision. However, staff of GSS in the Volta region, and members of the
Regional and District Census Implementation Committees were able to find solutions to these
challenges.
2.6.2 Recommendations
The institutions responsible for the creation of districts, constituencies and electoral areas and
enumeration areas should build consensus in the creation of these units to avoid conflicts in
the conduct of national exercises such as elections and censuses.
In the future, every effort should be made to maintain the ten-year periodicity as well as
conduct the census in March as has been the practice. This calls for timely release of funds
for the conduct of the census exercise.
The field operations group should collaborate with the cartography section in the creation of
enumeration areas (EAs). This would help in minimizing cases where some EAs are
exceptionally large. Field officers should also be requested to report cases of large EAs at the
end of house listing to avoid the situation where some portions of EAs are left un-attended to.
The Census Coordinator should ensure that all the census materials, especially the census
questionnaires, are procured in good time and in sufficient quantities and sent to the regions
ahead of training of field personnel. This will avoid delays in census activities and shortages
of census materials.
Management should recognize the importance of supervision and monitoring and budget
adequately for them in future censuses.
2.7 Concepts and Definitions
Introduction
The 2010 Population and Housing Census of Ghana followed the essential concepts and
definitions of a modern Population and Housing Census as recommended by the United
Nations (UN). It is important that the concepts, definitions and recommendations are adhered
to since they form the basis upon which Ghana could compare her data with those of other
countries.
The concepts and definitions in this report cover all sections of the 2010 Population and
Housing Census questionnaires (PHC1A and PHC1B). The sections were: geographical
location of the population, Household and Non-household population, Literacy and
Education, Emigration, Demographic and Economic Characteristics, Disability, Information
and Communication Technology (ICT), Fertility, Mortality, Agricultural Activity and
Housing Conditions.
The concepts and definitions are provided to facilitate understanding and use of the data
presented in this report. Users are therefore advised to use the results of the census within the
context of these concepts and definitions.

18
Region
There were ten (10) administrative regions in Ghana during the 2010 Population and Housing
Census as they were in 1984 and 2000.
District
In 1988, Ghana changed from the local authority system of administration to the district
assembly system. In that year, the then existing 140 local authorities were demarcated into
110 districts. In 2004, 28 new districts were created; this increased the number of districts in
the country to 138. In 2008, 32 additional districts were created bringing the total number of
districts to 170. The 2010 Population and Housing Census was conducted in these 170
administrative districts (these are made-up of 164 districts/municipals and 6 metropolitan
areas). The six metropolitan areas in all have 33 sub-metros which the Statistical Service
considered as districts for the purpose of the exercise. Thus, the total number of statistical
districts was 197.
Locality
A locality was defined as a distinct population cluster (also designated as inhabited place,
populated centre, settlement) which has a NAME or LOCALLY RECOGNISED STATUS. It
included fishing hamlets, mining camps, ranches, farms, market towns, villages, towns, cities
and many other types of population clusters, which meet the above criteria. There were two
main types of localities, rural and urban. As in previous censuses, the classification of
localities into „urban‟ and „rural‟ was based on population size. Localities with 5,000 or more
persons were classified as urban while localities with less than 5,000 persons were classified
as rural.
Population
The 2010 Census was a “de facto” count and each person present in Ghana, irrespective of
nationality, was enumerated at the place where he/she spent the midnight of 26th
September,
2010.
Household
A household was defined as a person or a group of persons, who lived together in the same
house or compound and shared the same house-keeping arrangements. In general, a
household consisted of a man, his wife, children and some other relatives or a house help who
may be living with them. However, it is important to remember that members of a household
are not necessarily related (by blood or marriage) because non-relatives (e.g. house helps)
may form part of a household.
Head of Household
The household head was defined as a male or female member of the household recognised as
such by the other household members. The head of household is generally the person who has
economic and social responsibility for the household. All relationships are defined with
reference to the head.

19
Household and Non-household population
Household population comprised of all persons who spent the census night in a household
setting. All persons who did not spend the census night in a household setting (except
otherwise stated) were classified as non-household population. Persons who spent census
night in any of the under listed institutions and locations were classified as non-household
population:
(a) Educational Institutions
(b) Children's and Old People‟s Homes
(c) Hospitals and Healing Centres
(d) Hotels
(e) Prisons
(f) Service Barracks
(g) Soldiers on field exercise
(h) Floating Population: The following are examples of persons in this category:
i. All persons who slept in lorry parks, markets, in front of stores and offices,
public bathrooms, petrol filling stations, railway stations, verandas,
pavements, and all such places which are not houses or compounds.
ii. Hunting and fishing camps.
iii. Beggars and vagrants (mentally sick or otherwise).
Age
The age of every person was recorded in completed years disregarding fractions of days and
months. For those persons who did not know their birthdays, the enumerator estimated their
ages using a list of district, regional and national historical events.
Nationality
Nationality is defined as the country to which a person belongs. A distinction is made
between Ghanaians and other nationals. Ghanaian nationals are grouped into Ghanaian by
birth, Ghanaian with dual nationality and Ghanaian by naturalization. Other nationals are
grouped into ECOWAS nationals, Africans other than ECOWAS nationals, and non-
Africans.
Ethnicity
Ethnicity refers to the ethnic group that a person belonged to. This information is collected
only from Ghanaians by birth and Ghanaians with dual nationality. The classification of
ethnic groups in Ghana is that officially provided by the Bureau of Ghana Languages and
which has been in use since the 1960 census.
Birthplace
The birthplace of a person refers to the locality of usual residence of the mother at the time of
birth. If after delivery a mother stayed outside her locality of usual residence for six months
or more or had the intention of staying in the new place for six or more months, then the
actual town/village of physical birth becomes the birthplace of the child.

20
Duration of Residence
Duration of residence refers to the number of years a person has lived in a particular place.
This question is only asked of persons not born in the place where enumeration took place.
Breaks in duration of residence lasting less than 12 months are disregarded. The duration of
residence of persons who made multiple movements of one (1) year or more is assumed to be
the number of years lived in the locality (town or village) since the last movement.
Religion
Religion refers to the individual‟s religious affiliation as reported by the respondent,
irrespective of the religion of the household head or the head‟s spouse or the name of the
person. No attempt was made to find out if respondents actually practiced the faith they
professed.
Marital Status
Marital status refers to the respondent‟s marital status as at Census Night. The question on
marital status was asked only of persons 12 years and older. The selection of the age limit of
12 years was based on the average age at menarche and also on the practice in some parts of
the country where girls as young as 12 years old could be given in marriage.
Literacy
The question on literacy referred to the respondent's ability to read and write in any language.
A person was considered literate if he/she could read and write a simple statement with
understanding. The question on literacy was asked only of persons 11 years and older.
Education
School Attendance
Data was collected on school attendance for all persons three (3) years and older. School
attendance refers to whether a person has ever attended, was currently attending or has never
attended school. In the census, school meant an educational institution where a person
received at least four hours of formal education.
Although the lower age limit of formal education is six years for primary one, eligibility for
the school attendance question was lowered to three years because pre-school education has
become an important phenomenon in the country.
Level of Education
Level of education refers to the highest level of formal school that a person ever attended or
was attending. This information was obtained for persons 3 years and older.
21
Activity Status
Activity status refers to economic or non-economic activity of respondents during the 7 days
preceding census night. Information on type of activity was collected on persons 5 years and
older. A person was regarded as economically active if they:
a. Worked for pay or profit or family gain for at least 1 hour within the 7 days preceding
Census Night. This included persons who were in paid employment or self-
employment or contributing family workers.
b. Did not work, but had jobs to return to.
c. Were unemployed.
The economically not active were persons who did not work and were not seeking for work.
They were classified by reasons for not being economically active. Economically not active
persons included homemakers, students, retired persons, the disabled and persons who were
unable to work due to their age or ill-health.
Occupation
This referred to the type of work the person was engaged in at the establishment where he/she
worked. This was asked only of persons 5 years and older who worked 7 days before the
census night, and those who did not work but had a job to return to as well as those
unemployed who had worked before. All persons who worked during the 7 days before the
census night were classified by the kind of work they were engaged in. The emphasis was on
the work the person did during the reference period and not what he/she was trained to do.
For those who did not work but had a job to return to, their occupation was the job they
would go back to after the period of absence. Also, for persons who had worked before and
were seeking for work and available for work, their occupation was on the last work they did
before becoming unemployed. If a person was engaged in more than one occupation, only the
main one was considered.
Industry
Industry referred to the type of product produced or service rendered at the respondent‟s work
place. Information was collected only on the main product produced or service rendered in
the establishment during the reference period.
Employment Status
Employment status refers to the status of a person in the establishment where he/she currently
works or previously worked. Eight employment status categories were provided: employee,
self-employed without employees, self-employed with employees, casual worker,
contributing family worker, apprentice, domestic employee (house help). Persons who could
not be classified under any of the above categories were classified as “other”.
Employment Sector
This refers to the sector in which a person worked. The employment sectors covered in the
census were public, private formal, private informal, semi-public/parastatal, NGOs and
international organizations.

22
Disability
Persons with disability were defined as those who were unable to or were restricted in the
performance of specific tasks/activities due to loss of function of some part of the body as a
result of impairment or malformation. Information was collected on persons with visual/sight
impairment, hearing impairment, mental retardation, emotional or behavioural disorders and
other physical challenges.
Information and Communication Technology (ICT)
ICT questions were asked for both individuals and households. Persons having mobile
phones refer to respondents 12 years and older who owned mobile phones (irrespective of the
number of mobile phones owned by each person). Persons using internet facility refers to
those who had access to internet facility at home, internet cafe, on mobile phone or other
mobile device. Internet access is assumed to be not only via computer, but also by mobile
phones, PDA, game machine and digital television.
Households having Personal Computers/Laptops refer to households who own
desktops/laptop computers. The fixed telephone line refers to a telephone line connecting a
customer‟s terminal equipment (e.g. telephone set, facsimile machine) to the public switch
telephone network.
Fertility
Two types of fertility data were collected: lifetime fertility and current fertility. Lifetime
fertility refers to the total number of live births that females 12 years and older had ever had
during their life time. Current fertility refers to the number of live births that females 12-54
years old had in the 12 months preceding the Census Night.
Mortality
Mortality refers to all deaths that occurred in the household during the 12 months preceding
the Census Night. The report presents information on deaths due to accidents, violence,
homicide and suicide. In addition, data were collected on pregnancy-related deaths of females
12-54 years.
Agriculture
The census sought information on household members who are engaged in agricultural
activities, including the cultivation of crops or tree planting, rearing of livestock or breeding
of fish for sale or family consumption. Information was also collected on their farms, types of
crops and number and type of livestock.
Housing Conditions and Facilities
The UN recommended definition of a house as “a structurally separate and independent place
of abode such that a person or group of persons can isolate themselves from the hazards of
climate such as storms and the sun‟‟ was adopted. The definition, therefore, covered any type
of shelter used as living quarters, such as separate houses, semi-detached houses,
flats/apartments, compound houses, huts, tents, kiosks and containers.

23
Living quarters or dwelling units refer to a specific area or space occupied by a particular
household and therefore need not necessarily be the same as the house of which the dwelling
unit may be a part.
Information collected on housing conditions included the type of dwelling unit, main
construction materials for walls, floor and roof, holding/tenure arrangement, ownership type,
type of lighting, source of water supply and toilet facilities. Data was also collected on
method of disposal of solid and liquid waste.

24
CHAPTER THREE
POPULATION SIZE, COMPOSITION AND AGE-SEX
STRUCTURE
3.1 Introduction
Population size, composition and age-sex structure are important characteristics that have
many social and economic implications. Population size and composition influence the
region‟s potential human resource requirement and level of provision of social services such
as schools, hospitals/clinics and housing. The population composition by age and sex
influences mortality, nuptiality, fertility, migration and other demographic processes that
underlie population growth and ultimately socio-economic development.
3.2 Population Size and Growth
The trends in regional population size and growth in table 3.1 shows that Volta Region‟s
population has increased rapidly between 1960 and 2010. The population size has increased
from 777,288 in 1960 to 2,118,252 by 2010, more than double in just over fifty years.
Between the 2000 and 2010 censuses, the population increased by 29.5 percent, which
translates into an intercensal annual growth rate of 2.5 percent.
Table 3.1: Trends in population size and growth rate, 1960-2010
Census Year Population Population
increase
Percentage
increase
Annual
growth rate
1960 777,288 - - -
1970 947,268 169,980 21.9 2.0 1984 1,211,907 237,639 25.1 1.8
2000 1,635,421 423,514 34.9 1.9
2010 2,118,252 482,831 29.5 2.5
Source: Generated from census data, 1960,1970,1984,2000 and 2010.
Table 3.2 presents the distribution of the population by district. The data show that Ho and
Hohoe Municipalities, together account for just over a quarter (of the total regional
population). The least populated district is South Dayi with only 2 percent of the regional
total population. Other districts with populations of less than four percent of the regional
population are Biakoye (3.1%), Adaklu Anyigbe (3.0%), Nkwanta North (3.0%), Jasikan
(2.8%), and Kadjebi (2.8%).
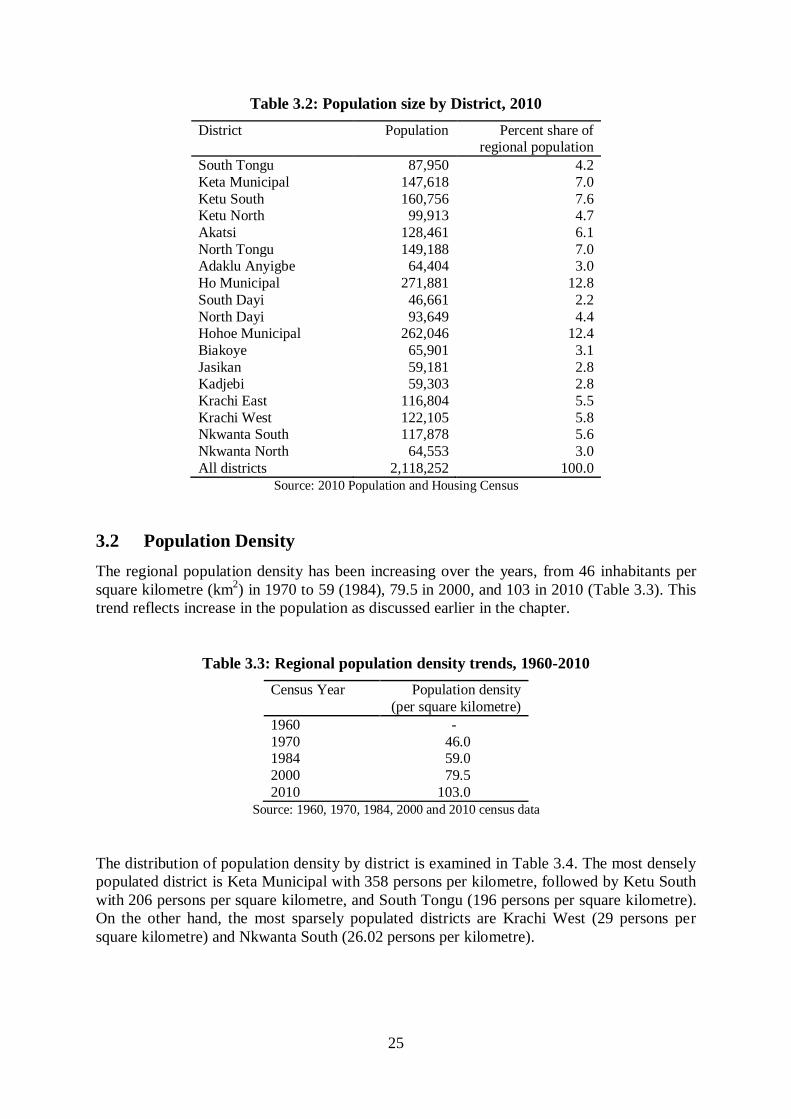
25
Table 3.2: Population size by District, 2010
District Population Percent share of regional population
South Tongu 87,950 4.2
Keta Municipal 147,618 7.0
Ketu South 160,756 7.6 Ketu North 99,913 4.7
Akatsi 128,461 6.1
North Tongu 149,188 7.0 Adaklu Anyigbe 64,404 3.0
Ho Municipal 271,881 12.8
South Dayi 46,661 2.2
North Dayi 93,649 4.4 Hohoe Municipal 262,046 12.4
Biakoye 65,901 3.1
Jasikan 59,181 2.8 Kadjebi 59,303 2.8
Krachi East 116,804 5.5
Krachi West 122,105 5.8 Nkwanta South 117,878 5.6
Nkwanta North 64,553 3.0
All districts 2,118,252 100.0
Source: 2010 Population and Housing Census
3.2 Population Density
The regional population density has been increasing over the years, from 46 inhabitants per
square kilometre (km2) in 1970 to 59 (1984), 79.5 in 2000, and 103 in 2010 (Table 3.3). This
trend reflects increase in the population as discussed earlier in the chapter.
Table 3.3: Regional population density trends, 1960-2010
Census Year Population density
(per square kilometre)
1960 -
1970 46.0 1984 59.0
2000 79.5
2010 103.0
Source: 1960, 1970, 1984, 2000 and 2010 census data
The distribution of population density by district is examined in Table 3.4. The most densely
populated district is Keta Municipal with 358 persons per kilometre, followed by Ketu South
with 206 persons per square kilometre, and South Tongu (196 persons per square kilometre).
On the other hand, the most sparsely populated districts are Krachi West (29 persons per
square kilometre) and Nkwanta South (26.02 persons per kilometre).

26
Table 3.4: Population density by district
Districts Population Land area (km2) Density
All districts 2,118,252 20,572 102.98 South Tongu 87,950 448 196.32
Keta Municipal 147,618 412 358.30
Ketu South 160,756 779 206.36
Ketu North 99,913 754 132.51
Akatsi 128,461 1,077 119.28
North Tongu 149,188 1,460 102.18
Adaklu Anyigbe 64,404 1,060 60.76
Ho Municipal 271,881 2,361 115.16
South Dayi 46,661 1,000 46.66
North Dayi 93,649 632 148.18
Hohoe Municipal 262,046 1,403 186.78
Biakoye 65,901 1,000 65.90
Jasikan 59,181 1,355 43.68
Kadjebi 59,303 1,092 54.31
Krachi East 116,804 2,528 46.20
Krachi West 122,105 4,169 29.29
Nkwanta South 117,878 4,530 26.02
Nkwanta North 64,553 1,151 56.08 Source: 2010 Population and Housing Census
3.3 Population Distribution (Urban/Rural)
Table 3.5 shows the distribution of the population by locality. The table indicates that
majority of the people in the region live in the rural areas (66.3%). However, about three out
of ten persons live in urban areas. The most urbanized district is Keta Municipal, with more
than half (53.3%) of the district‟s population living in urban areas, followed by Ketu South
(46.6%), and Ho Municipal (44.3%). The districts with very low levels of urbanization
include Adaklu Anyigbe (10.6%), South Tongu (12.9%), and Krachi West (19.6%).

27
Table 3.5: Population by District and locality
Districts Total
Population Percentage Urban Rural
All districts 2,118,252 100.0 33.7 66.3
South Tongu 87,950 100 .0 12.9 87.1
Keta Municipal 147,618 100 .0 53.3 46.7
Ketu South 160,756 100 .0 46.6 53.4
Ketu North 99,913 100 .0 34.2 65.8
Akatsi 128,461 100 .0 24.8 75.2
North Tongu 149,188 100 .0 29.1 70.9
Adaklu Anyigbe 64,404 100 .0 10.6 89.4
Ho Municipal 271,881 100 .0 44.3 55.7
South Dayi 46,661 100 .0 38.8 61.2
North Dayi 93,649 100 .0 31.6 68.4
Hohoe Municipal 262,046 100 .0 40.3 59.7
Biakoye 65,901 100 .0 33.9 66.1
Jasikan 59,181 100 .0 27.6 72.4
Kadjebi 59,303 100 .0 26.4 73.6
Krachi East 116,804 100 .0 27.7 72.3
Krachi West 122,105 100 .0 19.6 80.4
Nkwanta South 117,878 100 .0 25.6 74.4
Nkwanta North 64,553 100 .0 28.1 71.9
Source: 2010 Population and Housing Census.
3.4 Age-Sex Structure
The overall age structure of Ghana‟s population consists of a broad base made up of a large
number of children and a small number of elderly persons at the top. Table 3.6 examines the
age-sex distribution of the population in Volta Region in the 2000 and 2010 Population and
Housing censuses. Overall, the regional age-sex structure has remained largely unchanged
over the ten year intercensal period. Similar proportional shares of male and female
populations are observed across the age groups from 0-4 years to 95 and over years in the two
censuses.

28
Table 3.6: Population by age and sex, 2000 and 2010
2000
2010
Both sexes Male Female Both sexes Male Female
Total
population 1,635,421 790,886 844,535
2,118,252 1,019,398 1,098,854
All ages 100 100 100
100 100 100
0 - 4 13.9 14.2 13.6
14.0 14.7 13.4
5-9 14.9 15.4 14.5
12.6 13.3 11.9
10 – 14 12.3 13.1 11.5
11.8 12.6 11.0
15 - 19 10.3 11.2 9.5
10.5 11.3 9.7
20 - 24 7.7 7.6 7.8
8.5 8.4 8.5
25 - 29 7.0 6.6 7.4
7.2 6.8 7.6
30 - 34 6.0 5.6 6.4
6.1 5.7 6.4
35 - 39 5.3 5.0 5.6
5.3 5.1 5.5
40 - 44 4.5 4.4 4.6
4.8 4.5 5.0
45 - 49 3.9 3.8 3.9
4.1 3.9 4.3
50 - 54 3.3 3.2 3.4
3.8 3.6 4.0
55 - 59 2.1 2.1 2.2
2.5 2.4 2.6
60 - 64 2.3 2.1 2.5
2.4 2.2 2.5
65 - 69 1.7 1.6 1.9
1.5 1.4 1.6
70 - 74 1.6 1.4 1.8
1.9 1.6 2.3
75 - 79 1.1 1.0 1.2
1.2 1.0 1.4
80 - 84 0.9 0.8 1.0
0.9 0.7 1.1
85 - 89 0.6 0.5 0.6
0.5 0.4 0.6
90 - 94 0.3 0.3 0.4
0.3 0.2 0.4
95+ 0.3 0.3 0.4 0.1 0.1 0.2
Source: 2010 Population and Housing Census
Figure 1 depicts the age-sex structure of the population of Volta Region. This age structure is
the results of past fertility, mortality and migration in the region. It is in the form of a
pyramid, with broad base of the younger population and a narrow apex of the older
population. With increasing age, the age-sex structure looks slightly thinner for the males
than for the females, indicating that at older ages, the proportion of males is lower than that
of females. For the age groups 10-14 years and 15-19 years there are more males than
females. The high proportion of the populations aged 0-4 and 5-9 years indicates that the
population in the region has the potential to grow for a considerable number of years. This
has implications for the economic development of the region. This type of age structure is
typical of most developing countries.
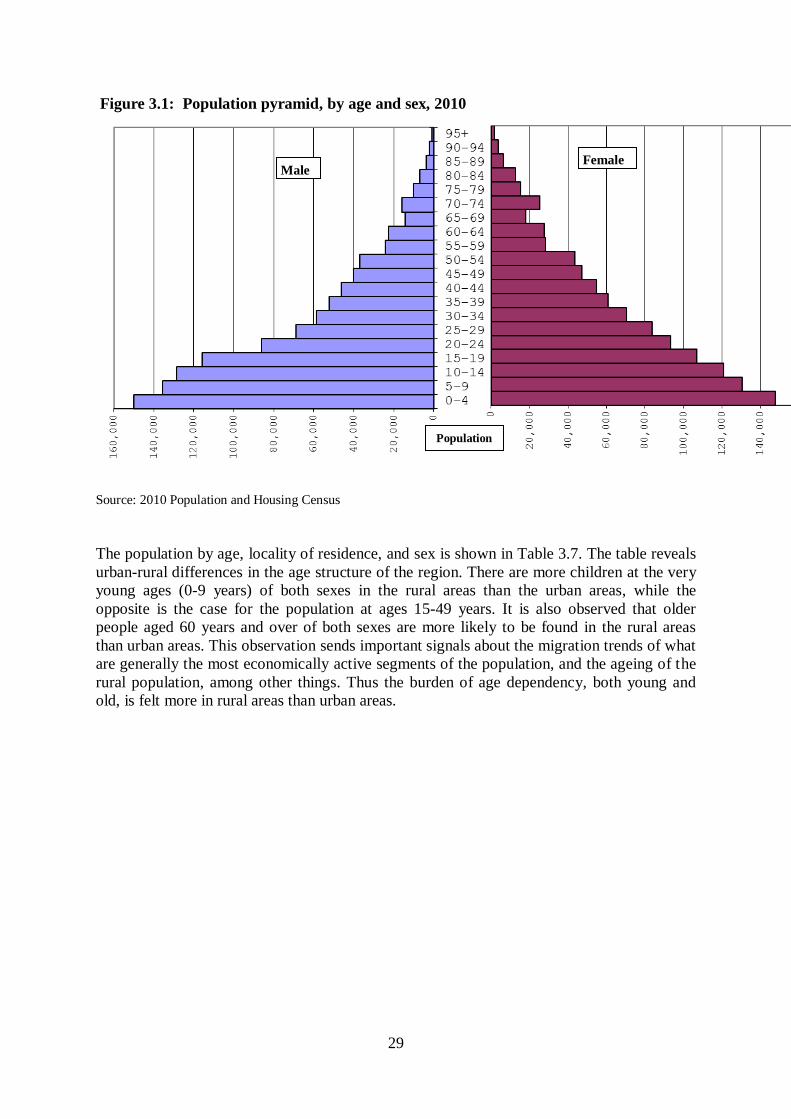
29
Figure 3.1: Population pyramid, by age and sex, 2010
Source: 2010 Population and Housing Census
The population by age, locality of residence, and sex is shown in Table 3.7. The table reveals
urban-rural differences in the age structure of the region. There are more children at the very
young ages (0-9 years) of both sexes in the rural areas than the urban areas, while the
opposite is the case for the population at ages 15-49 years. It is also observed that older
people aged 60 years and over of both sexes are more likely to be found in the rural areas
than urban areas. This observation sends important signals about the migration trends of what
are generally the most economically active segments of the population, and the ageing of the
rural population, among other things. Thus the burden of age dependency, both young and
old, is felt more in rural areas than urban areas.
Male Female
Population

30
Table 3.7: Population by age, locality and sex
Age
group
All localities
Urban Rural
Total Male Female Total Male Female Total Male Female
Population 2,118,252 1,019,398 1,098,854
713,735 336,560 377,175
1,404,517 682,838 721,679
All ages 100 100 100
100 100 100
100 100 100
0 – 4 14.0 14.7 13.4
12.8 13.7 12.1
14.7 15.2 14.1
5 – 9 12.6 13.3 11.9
11.4 12.1 10.7
13.2 13.9 12.5
10 – 14 11.8 12.6 11.0
11.6 11.9 11.3
11.9 13.0 10.8
15 – 19 10.5 11.3 9.7
11.3 11.9 10.8
10.1 11.1 9.2
20 – 24 8.5 8.4 8.5
9.7 9.7 9.6
7.9 7.8 7.9
25 – 29 7.2 6.8 7.6
8.2 7.8 8.6
6.7 6.2 7.1
30 – 34 6.1 5.7 6.4
6.7 6.5 6.8
5.8 5.4 6.2
35 – 39 5.3 5.1 5.5
5.7 5.6 5.8
5.2 4.9 5.4
40 – 44 4.8 4.5 5.0
4.8 4.6 5.0
4.8 4.5 5.0
45 – 49 4.1 3.9 4.3
4.1 3.9 4.3
4.1 4.0 4.3
50 – 54 3.8 3.6 4.0
3.7 3.6 3.8
3.8 3.6 4.0
55 – 59 2.5 2.4 2.6
2.5 2.4 2.6
2.5 2.3 2.5
60 – 64 2.4 2.2 2.5
2.1 2.0 2.3
2.5 2.3 2.7
65 – 69 1.5 1.4 1.6
1.4 1.3 1.5
1.6 1.5 1.7
70 – 74 1.9 1.6 2.3
1.6 1.3 1.9
2.1 1.7 2.5
75 – 79 1.2 1.0 1.4
1.0 0.8 1.2
1.3 1.1 1.5
80 – 84 0.9 0.7 1.1
0.7 0.5 0.9
1.0 0.8 1.3
85 – 89 0.5 0.4 0.6
0.4 0.3 0.5
0.5 0.4 0.6
90 – 94 0.3 0.2 0.4
0.2 0.2 0.3
0.3 0.2 0.4
95+ 0.1 0.1 0.2 0.1 0.1 0.1 0.1 0.1 0.2
Source: 2010 Population and Housing Census
Table 3.8a presents the trends in the regional age structure by broad age groups over the past
four decades. Overall, the age structure of the region mirrors that of the country over the four
decades. For both country and region, the proportion of the population aged less than 15
years has been declining since 1970. The proportion of the population less than 15 years in
the region decreased from 41.1 percent in 2000 to 38.4 percent in 2010, representing a 2.7
percentage point decrease.
The variations in the proportion of population aged 15-59 years in the region can largely be
attributed to in-migration. The table shows that the proportion of these persons has increased
overall over the four decades, particularly since 2000, indicating that the region is becoming
more and more a receiving region.
The data further show that the aging of the Ghanaian population may be slowing down, as
indicated by the decrease in the proportion of the population aged 60 years and over from 7.2
percent in 2000 to 6.7 percent in 2010. A similar population aging pattern is observed for the
Volta Region, barring age misreporting.

31
Table 3.8a: Regional age structure, 1960-2010
Year Age groups
0-14 yrs 15-59 yrs 60+ yrs
Ghana 1960 44.5 51.0 4.5
1970 46.9 47.7 5.4
1984 45.0 49.1 5.9
2000 41.3 51.5 7.2
2010 38.3 55.0 6.7
Volta Region 1960 45.6 48.8 6.0
1970 47.6 45.7 6.7
1984 44.2 47.9 7.9
2000 41.1 50.0 8.9
2010 38.4 55.1 6.5
Source: 1960, 1970, 1984, 2000, and 2010 census data
Table 3.8b presents the distribution of the population by age and district. In the analysis, age
is categorized into 0-14 years representing the young dependent population, 15-64 years
representing the non-dependent population, and 65 and older representing the old age
dependent population. For the region as a whole, the population aged 0-14 is 38.4 percent,
those in the non-dependent category are 55.1 percent, and the population aged 65 years and
over is 6.5 percent. Generally, the districts with the most dependent young population are
found in the northern districts (Krachi West, Krachi East, Nkwanta South, Nkwanta North),
while those with the most dependent old age population are in the southern districts (Keta,
Ketu North, Akatsi). Nkwanta North has the highest proportion of dependent children (0-14
years) of 46 percent, followed by Nkwanta South (45.0%) , Krachi East (44.7%) and Krachi
West (44.3%). Keta Municipal has the largest proportion of old age dependents (9.1%).
Other districts with relatively larger proportions of persons aged 65 and over are Akatsi
(8.2%) and Ketu North (8.0%).
Table 3.8b: Age distribution of population by District
District
Age group
Population 0-14 15-64 65+
All districts 2,118,252 38.4 55.1 6.5
South Tongu 87,950 39.9 52.4 7.8
Keta Municipal 147,618 34.6 56.3 9.1
Ketu South 160,756 37.8 56.2 6.0
Ketu North 99,913 37.2 54.9 8.0
Akatsi 128,461 37.7 54.1 8.2
North Tongu 149,188 38.3 55.0 6.7
Adaklu Anyigbe 64,404 36.9 57.1 6.0
Ho Municipal 271,881 32.9 60.2 7.0
South Dayi 46,661 39.0 53.6 7.4
North Dayi 93,649 36.2 55.9 7.9
Hohoe Municipal 262,046 36.8 56.4 6.8
Biakoye 65,901 40.2 54.2 5.6
Jasikan 59,181 37.8 55.5 6.7
Kadjebi 59,303 39.1 54.9 6.0
Krachi East 116,804 44.7 51.7 3.6
Krachi West 122,105 44.3 51.4 4.3
Nkwanta South 117,878 45.0 51.1 3.9
Nkwanta North 64,553 46.7 49.7 3.6
Source: 2010 Population and Housing Census

32
3.5 Dependency Ratios
The dependency ratio is one of the key indicators of socio-economic development. Generally,
the ratio is higher in developing regions of the world than in developed regions. Table 3.9
presents the dependency ratios for each of the 18 districts in the Volta Region. The regional
dependency ratio is quite high at about 81 dependents (child and old age) for every 100
people working. It is also evident in the table that the ratio is high across all the districts,
ranging from 66.2 per 100 working population for Ho Municipality to a high of 101.2 for 100
working population for Nkwanta North District. A large part of the total dependency ratios in
the districts are child dependency ratios as indicated by the age distribution of the district
populations in the table.
Table 3.9: Population by broad age group, dependency ratios and district
District
Age
group Total Male Female
Total
dependency
ratio
All districts <15 38.4 40.6 36.3 81.3
15-64 55.1 54.8 56.6
65+ 6.5 4.6 7.1
South Tongu <15 40.5 43.0 37.0 90.9
15-64 52.0 5.0 53.0
65+ 8.0 5.0 10.0
Keta Municipal <15 35.0 38.0 32.0 77.6
15-64 55.0 56.0 57.0
65+ 9.0 6.0 11.0
Ketu South <15 38.0 41.0 35.0 77.8
15-64 56.0 55.0 58.0
65+ 6.0 5.0 7.0
Ketu North <15 37.0 41.0 34.0 82.3
15-64 55.0 53.0 56.0
65+ 8.0 6.0 10.0
Akatsi <15 38.0 42.0 34.0 84.8
15-64 54.0 52.0 56.0
65+ 8.0 6.0 10.0
North Tongu <15 38.0 41.0 36.0 81.7
15-64 55.0 54.0 56.0
65+ 7.0 5.0 8.0 Adaklu Anyigbe <15 37.0 38.0 36.0 75.2
15-64 57.0 56.0 58.0
65+ 6.0 5.0 7.0 Ho Municipal <15 33.0 35.0 31.0 66.2
15-64 60.0 59.0 61.0
65+ 7.0 6.0 8.0
South Dayi <15 39.0 41.0 37.0 86.5
15-64 54.0 53.0 54.0
65+ 7.0 6.0 9.0
North Dayi <15 36.0 39.0 34.0 78.8
15-64 56.0 55.0 57.0
65+ 8.0 6.0 9.0
Source: 2010 Population and Housing Census

33
Table 3.9: Population, by broad age group and dependency ratios and district (Cont.)
District
Age
group Total Male Female
Total
dependency
ratio
Hohoe Municipal <15 37.0 39.0 35.0 77.3
15-64 56.0 55.0 57.0
65+ 7.0 6.0 8.0
Biakoye <15 40.0 42.0 39.0 84.5
15-64 54.0 54.0 55.0
65+ 6.0 5.0 6.0
Jasikan <15 38.0 39.0 36.0 80.2
15-64 55.0 55.0 56.0
65+ 7.0 6.0 8.0
Kadjebi <15 39.0 40.0 39.0 82.2
15-64 55.0 54.0 55.0
65+ 6.0 6.0 6.0
Krachi East <15 45.0 45.0 44.0 93.4
15-64 52.0 51.0 52.0
65+ 4.0 4.0 3.0
Krachi West <15 44.0 46.0 43.0 94.6
15-64 51.0 51.0 52.0
65+ 4.0 4.0 5.0
Nkwanta South <15 45.0 46.0 44.0 95.9
15-64 51.0 50.0 52.0
65+ 4.0 4.0 4.0
Nkwanta North <15 47.0 48.0 45.0 101.2
15-64 50.0 48.0 51.0
65+ 4.0 4.0 4.0
Source: 2010 Population and Housing Census
3.6 Sex Structure
The sex composition of a population is influenced largely by the sex ratio at birth (ratio of
male births to female births) as well as sex differences in death rates and migration. In most
populations, there is slight excess of males over females at birth but females become the
majority at older ages because of the higher death rates for males at all ages. Table 3.10
presents the regional distribution of the population by sex in the past five decades. The
proportion of females in the region‟s population has consistently remained just over 50
percent from 1960-2010. This pattern generally reflects the sex structure of Ghana as a
whole. However, compared to the other censuses, there were proportionally slightly more
males in the population in the 1960 census than in the 2010 census.

34
Table 3.10: Regional distribution of population, by sex, 1960-2010
All
Regions Percent
Volta
Region
Percent
1960
Total 6,726,815 100.0 777,285 100.0
Male 3,400,270 50.5 379,093 48.8
Female 3,326,545 49.5 398,192 51.2
1970
Total 8,559,313 100.0 947,268 100.0
Male 4,247,809 49.6 455,095 48.0
Female 4,311,504 50.4 492,173 52.0
1984
Total 12,296,081 100.0 1,211,907 100.0
Male 6,063,848 49.3 586,940 48.4
Female 6,232,233 50.7 624,967 51.6
2000
Total 18,912,079 100.0 1,635,421 100.0
Male 9,357,382 49.5 790,886 48.4
Female 9,554,697 50.5 844,535 51.6
2010
Total 24,658,823 100.0 2,118,252 100.0
Male 12,024,845 48.8 1,019,398 48.1
Female 12,633,978 51.2 1,098,854 51.9
Source: 2010 Population and Housing Census
Table 3.11 shows the shares of the population by sex and district. Ho has the largest total
population (12.8%), followed closely by Hohoe Municipality (12.4%). Nkwanta North has
the lowest share of the population of both sexes (3.0%). In addition, the table shows wide
variations in percent shares of males and females across the district. Generally, there are more
males than females in the northern districts such as Krachi East, Krachi West and Nkwanta
North, while the opposite is the case for the southern districts such as Ho, South Tongu, and
Keta Municipal. Three districts with the same proportion of males and females are South
Dayi District, and Hohoe Municipal.

35
Table 3.11: Distribution of the population by District and sex
District
Population
Percent share
Total Male Female
Total Male Female
All districts 2,118,252 1,019,398 1,098,854
100 100 100
South Tongu 87,950 40,019 47,931
4.2 3.9 4.4
Keta Municipal 147,618 68,556 79,062
7.0 6.7 7.2
Ketu South 160,756 75,648 85,108
7.6 7.4 7.7
Ketu North 99,913 46,551 53,362
4.7 4.6 4.9
Akatsi 128,461 59,165 69,296
6.1 5.8 6.3
North Tongu 149,188 70,282 78,906
7.0 6.9 7.2
Adaklu Anyigbe 64,404 31,298 33,106
3.0 3.1 3.0
Ho Municipal 271,881 129,180 142,701
12.8 12.7 13
South Dayi 46,661 22,132 24,529
2.2 2.2 2.2
North Dayi 93,649 44,553 49,096
4.4 4.4 4.5
Hohoe Municipal 262,046 126,239 135,807
12.4 12.4 12.4
Biakoye 65,901 33,057 32,844
3.1 3.2 3.0
Jasikan 59,181 29,142 30,039
2.8 2.9 2.7
Kadjebi 59,303 29,951 29,352
2.8 2.9 2.7
Krachi East 116,804 60,730 56,074
5.5 6.0 5.1
Krachi West 122,105 62,019 60,086
5.8 6.1 5.5
Nkwanta South 117,878 58,482 59,396
5.6 5.7 5.4
Nkwanta North 64,553 32,394 32,159 3.0 3.2 2.9
Source: 2010 Population and Housing Census
3.7 Sex Ratios
The sex ratio measures the number of males to females in the population, the balance of the
sexes being 100. In most populations the sex ratio favours males at birth. The average sex
ratio at birth in most populations is about 105 to 106. The sex ratio at birth in African
populations is reported to be 103. The sex ratio decreases with age as a result of differences
in death rates at all ages which favour females. The sex ratio is also influenced by migration
patterns.
Sex ratios for Volta Region districts are presented in Table 3.12. The observed sex ratio of
92.8 indicates an excess of females over males in the region – quite simply, about 92 males to
100 females. In the districts, the sex ratio ranges from 83.5 in South Tongu to a high of 108.3
for Krachi East. The data further suggest three patterns of sex ratio for the districts. The first
pattern – districts with low sex ratios – is observed for South Tongu, Keta, Ketu, Akatsi, and
North Tongu, where the ratios are as low as 83 to 89 males per 100 females. The second
pattern – districts with moderate sex ratios – involves Ho, Hohoe, North Dayi, South Dayi,
where there are 90 to 94 males per 100 females. The third pattern – high sex ratios of 97 to
108 males to 100 females – is observed for Jasikan, Kadjebi, Nkwanta North, Nkwanta
South, Krachi West, Krachi East and Biakoye. The differences in sex ratios across the region
may be a reflection of age-sex pattern of mortality as well as migration in and out of the
districts.
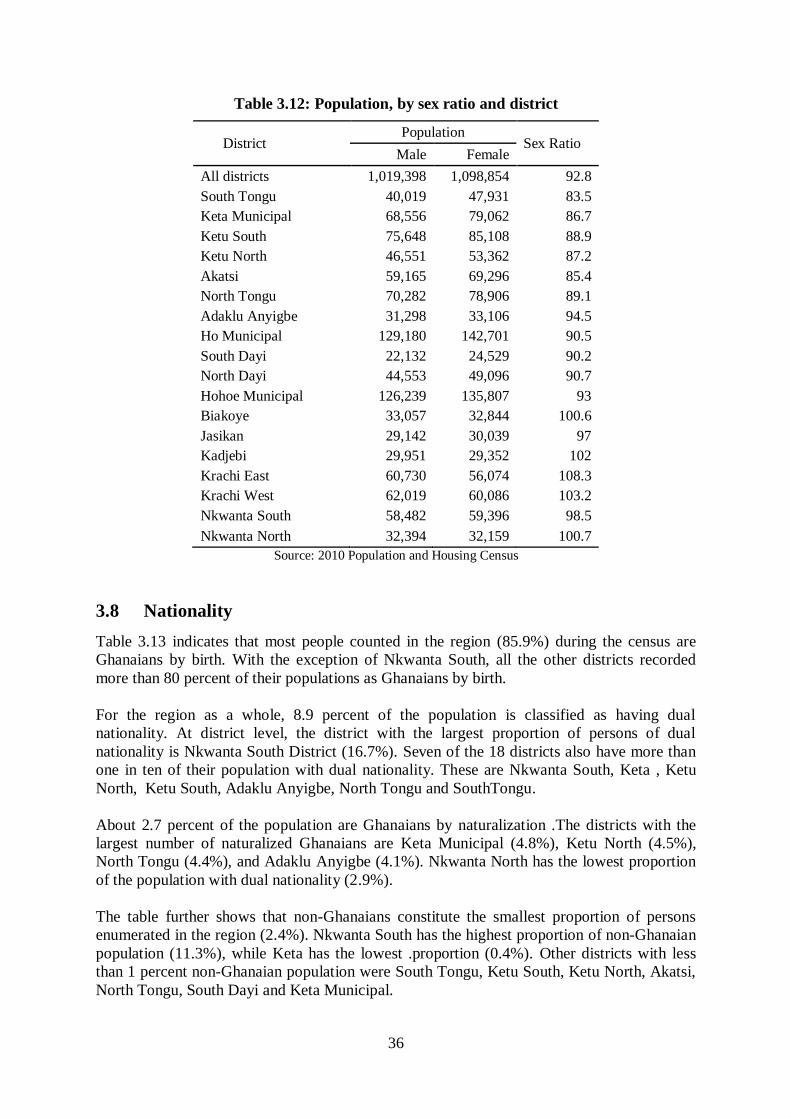
36
Table 3.12: Population, by sex ratio and district
District Population
Sex Ratio Male Female
All districts 1,019,398 1,098,854 92.8
South Tongu 40,019 47,931 83.5
Keta Municipal 68,556 79,062 86.7
Ketu South 75,648 85,108 88.9
Ketu North 46,551 53,362 87.2
Akatsi 59,165 69,296 85.4
North Tongu 70,282 78,906 89.1
Adaklu Anyigbe 31,298 33,106 94.5
Ho Municipal 129,180 142,701 90.5
South Dayi 22,132 24,529 90.2
North Dayi 44,553 49,096 90.7
Hohoe Municipal 126,239 135,807 93
Biakoye 33,057 32,844 100.6
Jasikan 29,142 30,039 97
Kadjebi 29,951 29,352 102
Krachi East 60,730 56,074 108.3
Krachi West 62,019 60,086 103.2
Nkwanta South 58,482 59,396 98.5
Nkwanta North 32,394 32,159 100.7
Source: 2010 Population and Housing Census
3.8 Nationality
Table 3.13 indicates that most people counted in the region (85.9%) during the census are
Ghanaians by birth. With the exception of Nkwanta South, all the other districts recorded
more than 80 percent of their populations as Ghanaians by birth.
For the region as a whole, 8.9 percent of the population is classified as having dual
nationality. At district level, the district with the largest proportion of persons of dual
nationality is Nkwanta South District (16.7%). Seven of the 18 districts also have more than
one in ten of their population with dual nationality. These are Nkwanta South, Keta , Ketu
North, Ketu South, Adaklu Anyigbe, North Tongu and SouthTongu.
About 2.7 percent of the population are Ghanaians by naturalization .The districts with the
largest number of naturalized Ghanaians are Keta Municipal (4.8%), Ketu North (4.5%),
North Tongu (4.4%), and Adaklu Anyigbe (4.1%). Nkwanta North has the lowest proportion
of the population with dual nationality (2.9%).
The table further shows that non-Ghanaians constitute the smallest proportion of persons
enumerated in the region (2.4%). Nkwanta South has the highest proportion of non-Ghanaian
population (11.3%), while Keta has the lowest .proportion (0.4%). Other districts with less
than 1 percent non-Ghanaian population were South Tongu, Ketu South, Ketu North, Akatsi,
North Tongu, South Dayi and Keta Municipal.

37
Table 3.13: Population by nationality and district
District Population
Ghanaian
by birth
Dual nationality
(Ghanaian
and other)
Ghanaian by
naturalisation
Non-
Ghanaian
All districts 2,118,252 85.9 8.9 2.7 2.4
South Tongu 87,950 84.8 11.1 3.6 0.5
Keta Municipal 147,618 80.2 14.6 4.8 0.4
Ketu South 160,756 83.0 10.7 3.4 3.0
Ketu North 99,913 81.4 13.6 4.5 0.6
Akatsi 128,461 89.4 7.4 2.4 0.8
North Tongu 149,188 81.9 13.1 4.4 0.6
Adaklu Anyigbe 64,404 81.4 12.7 4.1 1.8
Ho Municipal 271,881 88.7 7.6 2.4 1.3
South Dayi 46,661 89.9 7.2 2.3 0.7
North Dayi 93,649 90.8 6.1 2.0 1.1
Hohoe Municipal 262,046 89.2 6.6 2.1 2.1
Biakoye 65,901 92.7 3.5 1.0 2.7
Jasikan 59,181 91.1 3.2 1.0 4.8
Kadjebi 59,303 88.2 6.0 1.5 4.3
Krachi East 116,804 87.6 6.7 2.1 3.7
Krachi West 122,105 90.2 4.1 1.5 4.2
Nkwanta South 117,878 69.5 16.7 2.6 11.3
Nkwanta North 64,553 93.1 2.9 0.9 3.1 Source: 2010 Population and Housing Census
3.9 Birthplace
Regional and district birthplace statistics provide an indication of the extent of internal
migration. Internal migration may be defined as the movement of people within national
borders, and more specifically, inter- or intra-regional migration. Intra-regional migration
refers to population movement between localities within a region, while inter-regional
migration is the movement of people between regions. In terms of birthplace by district, 73.1
percent were born in the locality of enumeration (Table 3.14). In addition, 17.8 percent were
born in another locality in the region, indicating intra-regional movement of people. The table
also shows that there is migration of people from other regions in Ghana to the Volta Region.
Most of the Ghanaian migrants to the region are from the Greater Accra Region (1.9%),
followed by the Northern Region (1.6%), and Eastern Region (1.5%). Another origin of
migrants to the region is the Economic Community of West African States (ECOWAS).
Because of the Region shares a border with Togo and because of common cultural heritage,
most of the migrants from ECOWAS states are Togolese.

38
Table 3.14: Birthplace by District
Birth place Total South
Tongu Keta
Municipal Ketu
South Ketu
North Akatsi North
Tongu Adaklu
Anyigbe
Ho Muni-
cipal South Dayi
Total 100.0 100.0 100.0 100.0 100.0 100.0 100.0 100.0 100.0 100.0 Same locality 73.1 67.6 81.8 79.8 86.6 73.9 76.8 80.9 64.4 68.0
Different locality in this region 17.8 19.5 9.9 11.6 8.8 18.8 15.1 13.3 26.0 22.1 Western 0.3 1.1 0.6 0.3 0.2 0.4 0.3 0.3 0.4 0.5 Central 0.4 0.9 0.5 0.3 0.2 0.4 0.4 0.2 0.4 0.4 Greater Accra 1.9 3.0 2.4 1.4 1.0 1.7 1.6 0.8 2.7 2.7 Eastern 1.5 3.5 1.0 0.9 0.9 1.8 2.9 0.8 1.8 3.4 Ashanti 0.7 1.7 0.5 0.8 0.6 1.0 0.4 0.5 0.8 0.7 Brong Ahafo 0.4 1.1 0.2 0.2 0.1 0.3 0.7 0.2 0.3 0.4 Northern 1.6 0.6 0.2 0.2 0.1 0.2 1.0 0.2 0.6 0.6 Upper East 0.1 0.1 0.0 0.0 0.1 0.0 0.1 0.0 0.1 0.0
Upper West 0.1 0.0 0.0 0.0 0.0 0.0 0.1 0.0 0.1 0.1 Nigeria 0.2 0.2 0.6 0.5 0.1 0.2 0.1 0.4 0.3 0.1 Liberia 0.0 0.0 0.0 0.0 0.0 0.0 0.0 0.0 0.0 0.0 Sierra Leone 0.0 0.0 0.0 0.0 0.0 0.0 0.0 0.0 0.0 0.0 Gambia 0.0 0.0 0.0 0.0 0.0 0.0 0.0 0.0 0.0 0.0 Togo 1.5 0.4 0.6 3.0 0.9 0.9 0.3 1.8 1.7 0.7 Burkina Faso 0.1 0.0 0.0 0.0 0.0 0.0 0.1 0.3 0.0 0.0 Côte d'Ivoire 0.2 0.1 1.4 0.4 0.1 0.1 0.1 0.0 0.1 0.1
Other ECOWAS states 0.2 0.2 0.2 0.5 0.0 0.3 0.1 0.1 0.2 0.1 African other than ECOWAS 0.1 0.2 0.1 0.1 0.0 0.0 0.0 0.0 0.0 0.1 Europe 0.0 0.0 0.0 0.0 0.0 0.0 0.0 0.0 0.0 0.0 Americas (North South/Caribbean) 0.0 0.0 0.0 0.0 0.0 0.0 0.0 0.0 0.0 0.0 Asia 0.0 0.0 0.0 0.0 0.0 0.0 0.0 0.0 0.0 0.0 Oceania 0.0 0.0 0.0 0.0 0.0 0.0 0.0 0.0 0.0 0.0
Source: 2010 Population and Housing Census
North Dayi
Hohoe Municipal Biakoye Jasikan Kadjebi
Krachi East
Krachi West
Nkwanta South
Nkwanta North
Total 100.0 100.0 100.0 100.0 100.0 100.0 100.0 100.0 100.0 Same locality 70.7 68.0 68.6 76.1 74.0 62.4 79.6 71.9 80.5 Different locality in this region 20.3 24.3 21.8 16.3 19.2 22.9 10.1 16.1 7.4 Western 0.3 0.3 0.3 0.2 0.2 0.1 0.1 0.1 0.0 Central 0.6 0.3 0.8 0.3 0.3 0.7 0.9 0.2 0.1
Greater Accra 2.0 1.5 2.7 1.0 0.9 3.4 2.4 0.5 0.3 Eastern 2.4 1.1 1.4 0.9 1.1 1.0 0.7 0.6 0.4 Ashanti 0.7 0.6 0.4 0.5 0.5 0.7 0.5 0.6 0.3 Brong Ahafo 0.2 0.2 0.3 0.2 0.2 0.7 0.9 0.3 0.3 Northern 0.9 1.1 1.6 0.8 0.7 5.5 3.1 7.2 8.6 Upper East 0.1 0.1 0.1 0.1 0.1 0.2 0.2 0.1 0.1 Upper West 0.1 0.0 0.0 0.0 0.0 0.2 0.1 0.0 0.0 Nigeria 0.1 0.2 0.2 0.1 0.1 0.2 0.1 0.1 0.0
Liberia 0.0 0.0 0.0 0.0 0.0 0.0 0.0 0.0 0.0 Sierra Leone 0.0 0.0 0.0 0.0 0.0 0.0 0.0 0.0 0.0 Gambia 0.0 0.0 0.0 0.0 0.0 0.0 0.0 0.0 0.0 Togo 1.1 2.1 0.8 3.1 2.4 1.4 0.9 2.0 1.6 Burkina Faso 0.0 0.0 0.1 0.0 0.0 0.2 0.1 0.0 0.1 Côte d'Ivoire 0.1 0.0 0.0 0.0 0.0 0.0 0.0 0.0 0.0 Other ECOWAS states 0.1 0.1 0.6 0.2 0.2 0.3 0.2 0.2 0.1 African other than ECOWAS 0.1 0.0 0.1 0.1 0.1 0.1 0.0 0.0 0.0 Europe 0.0 0.0 0.0 0.0 0.0 0.0 0.0 0.0 0.0
Americas (North South/Caribbean) 0.0 0.0 0.0 0.0 0.0 0.0 0.0 0.0 0.0 Asia 0.0 0.0 0.0 0.0 0.0 0.0 0.0 0.0 0.0 Oceania 0.0 0.0 0.0 0.0 0.0 0.0 0.0 0.0 0.0
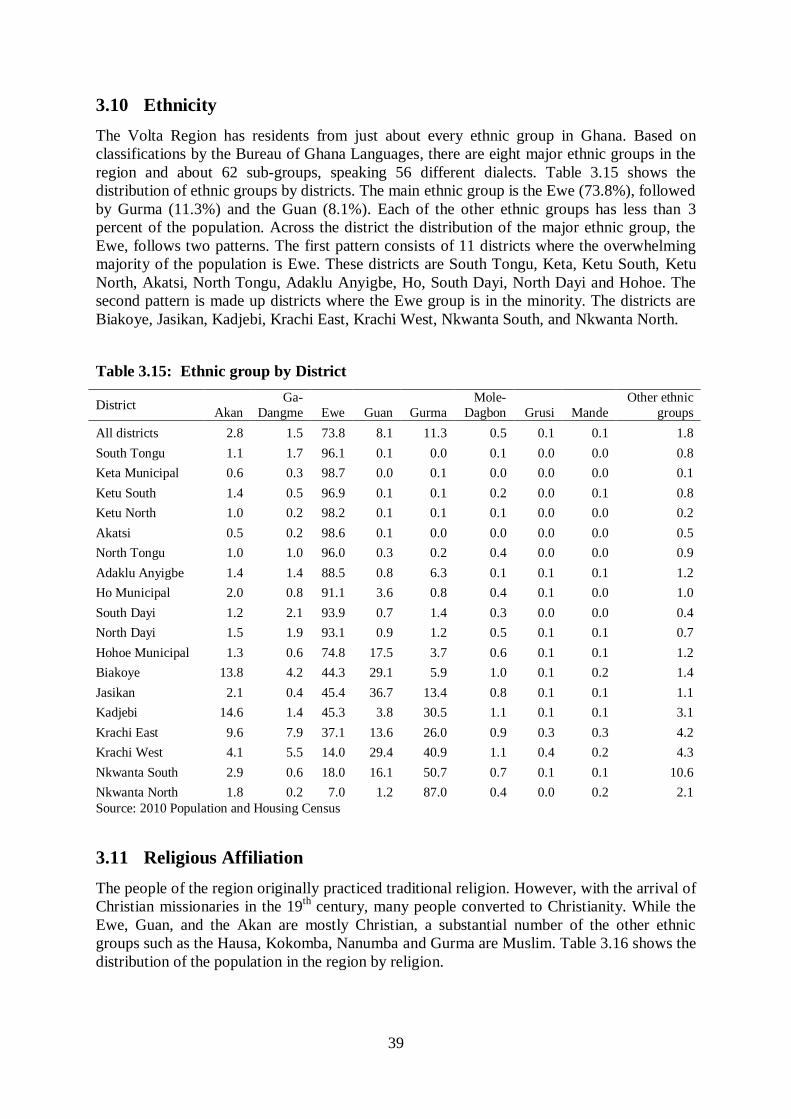
39
3.10 Ethnicity
The Volta Region has residents from just about every ethnic group in Ghana. Based on
classifications by the Bureau of Ghana Languages, there are eight major ethnic groups in the
region and about 62 sub-groups, speaking 56 different dialects. Table 3.15 shows the
distribution of ethnic groups by districts. The main ethnic group is the Ewe (73.8%), followed
by Gurma (11.3%) and the Guan (8.1%). Each of the other ethnic groups has less than 3
percent of the population. Across the district the distribution of the major ethnic group, the
Ewe, follows two patterns. The first pattern consists of 11 districts where the overwhelming
majority of the population is Ewe. These districts are South Tongu, Keta, Ketu South, Ketu
North, Akatsi, North Tongu, Adaklu Anyigbe, Ho, South Dayi, North Dayi and Hohoe. The
second pattern is made up districts where the Ewe group is in the minority. The districts are
Biakoye, Jasikan, Kadjebi, Krachi East, Krachi West, Nkwanta South, and Nkwanta North.
Table 3.15: Ethnic group by District
Source: 2010 Population and Housing Census
3.11 Religious Affiliation
The people of the region originally practiced traditional religion. However, with the arrival of
Christian missionaries in the 19th
century, many people converted to Christianity. While the
Ewe, Guan, and the Akan are mostly Christian, a substantial number of the other ethnic
groups such as the Hausa, Kokomba, Nanumba and Gurma are Muslim. Table 3.16 shows the
distribution of the population in the region by religion.
District Akan
Ga-
Dangme Ewe Guan Gurma
Mole-
Dagbon Grusi Mande
Other ethnic
groups
All districts 2.8 1.5 73.8 8.1 11.3 0.5 0.1 0.1 1.8
South Tongu 1.1 1.7 96.1 0.1 0.0 0.1 0.0 0.0 0.8
Keta Municipal 0.6 0.3 98.7 0.0 0.1 0.0 0.0 0.0 0.1
Ketu South 1.4 0.5 96.9 0.1 0.1 0.2 0.0 0.1 0.8
Ketu North 1.0 0.2 98.2 0.1 0.1 0.1 0.0 0.0 0.2
Akatsi 0.5 0.2 98.6 0.1 0.0 0.0 0.0 0.0 0.5
North Tongu 1.0 1.0 96.0 0.3 0.2 0.4 0.0 0.0 0.9
Adaklu Anyigbe 1.4 1.4 88.5 0.8 6.3 0.1 0.1 0.1 1.2
Ho Municipal 2.0 0.8 91.1 3.6 0.8 0.4 0.1 0.0 1.0
South Dayi 1.2 2.1 93.9 0.7 1.4 0.3 0.0 0.0 0.4
North Dayi 1.5 1.9 93.1 0.9 1.2 0.5 0.1 0.1 0.7
Hohoe Municipal 1.3 0.6 74.8 17.5 3.7 0.6 0.1 0.1 1.2
Biakoye 13.8 4.2 44.3 29.1 5.9 1.0 0.1 0.2 1.4
Jasikan 2.1 0.4 45.4 36.7 13.4 0.8 0.1 0.1 1.1
Kadjebi 14.6 1.4 45.3 3.8 30.5 1.1 0.1 0.1 3.1
Krachi East 9.6 7.9 37.1 13.6 26.0 0.9 0.3 0.3 4.2
Krachi West 4.1 5.5 14.0 29.4 40.9 1.1 0.4 0.2 4.3
Nkwanta South 2.9 0.6 18.0 16.1 50.7 0.7 0.1 0.1 10.6
Nkwanta North 1.8 0.2 7.0 1.2 87.0 0.4 0.0 0.2 2.1

40
Table 3.16: Population by religion and district
District
No
religion Catholic Protestants
Pentecostal /
Charismatic
Other
Christian Islam Traditionalist Other
All Districts 6.6 17.6 21.5 26.6 7.1 5.7 14.1 0.8
South Tongu 9.4 11.5 24.0 27.8 12.4 2.0 12.0 0.9
Keta Municipal 12.9 15.2 21.1 19.6 4.0 1.0 25.4 0.8
Ketu South 9.1 15.3 12.7 27.0 4.0 3.5 27.9 0.5
Ketu North 8.9 12.3 11.7 21.9 9.7 0.9 33.5 1.1
Akatsi 8.5 17.3 11.8 25.2 6.3 2.1 27.9 1.0
North Tongu 7.4 11.5 27.0 31.3 10.7 3.2 8.3 0.7
Adaklu Anyigbe 3.0 14.3 28.3 26.6 10.5 1.3 7.9 0.9
Ho Municipal 2.5 15.8 35.6 30.9 9.2 2.8 2.7 0.5
South Dayi 4.0 7.1 37.0 34.2 9.9 3.3 3.8 0.6
North Dayi 1.7 31.4 27.1 27.3 6.3 3.4 2.1 0.7
Hohoe Municipal 1.3 28.7 30.1 25.5 6.2 5.7 1.5 1.0
Biakoye 4.5 19.3 23.4 31.2 7.4 8.5 4.2 1.5
Jasikan 4.3 27.8 19.6 22.7 5.7 12.7 6.6 0.5
Kadjebi 2.1 22.7 18.5 19.7 5.4 29.6 1.4 0.7
Krachi East 10.4 13.3 12.7 32.5 6.9 8.2 15.0 1.0
Krachi West 10.2 17.5 8.0 27.1 6.7 10.2 19.5 0.6
Nkwanta South 10.0 18.7 10.8 21.5 5.6 10.2 22.2 0.9
Nkwanta North 12.6 3.2 6 21.9 2.1 10.3 43.3 0.6
Source: 2010 Population and Housing Census
The table reveals that majority of the population are Christians, 14.1 practice traditional
religion and 5.7 percent are Muslims. Among the Christians just a little over one in five are
either Protestants or Pentecostal/Charismatic Most of the people practicing the Islamic
religion are found in Kadjebi, Krachi West, Nkwanta South and Nkwanta North, while four
districts have substantial proportions of their population practicing traditional religion:
Nkwanta North (43.3%), Ketu North (33.5%), Ketu South (27.9%) and Akatsi (27.9%).

41
CHAPTER FOUR
HOUSEHOLD SIZE, STRUCTURE
AND COMPOSITION
4.1 Introduction
Ghanaian households are reflections of the social structure, in that living arrangements are
largely influenced by such socio-cultural factors as marriage, and the types of family and
kinship systems existing in a particular society. The structure, composition, and size differ
among the various ethnic groups in Ghana based on the prevailing kinship and the two broad
descent and inheritance systems, namely, the patrilineal and matrilineal systems. In the
patrilineal system, inheritance and descent are traced from the father‟s line and household
heads are mostly men. In the matrilineal systems, which trace descent from the mother‟s line,
a relatively large proportion of household heads are women. This chapter focuses on analysis
of data on household structure, size and composition in the Volta Region from the 2010
Population and Housing Census.
4.2 Definition of Concept
The 2010 PHC defined a household as “a person or group of persons who lived together in
the same house or compound and shared the same housekeeping arrangements. In general, a
household consists of a man, wife, children and other relatives or a house help who may be
living with them”.
4.3 Household Size
Household size provides important information to policy makers and planners with regard to
allocating resources for social services such as shelter, health and education. The 2010 census
found that there are 495,603 households in the Volta Region. Table 4.1 shows the distribution
of household size among districts in the region. It indicates that single-person households are
predominantly in the three municipalities with high populations, namely Ho (22.8%), Keta
(20.3%) and Hohoe (20.2%). Nkwanta North has a substantially lower proportion of single-
person households (5.1%). The proportion of households consisting of two people is also
higher in Keta (16.1%) and Ho (16.6%) districts. Larger households of 10 or more persons
are found in districts like Nkwanta North (18.5%), Krachi West (11.9%), Adaklu Anyigbe
(10.4%) and Krachi East (10.2%) in the northern part of the region. The factors that could
have influenced the average size of households in a particular district are the levels of
fertility, and the socio-economic situation of each household in terms of livelihood and
sufficiency of internal distribution.
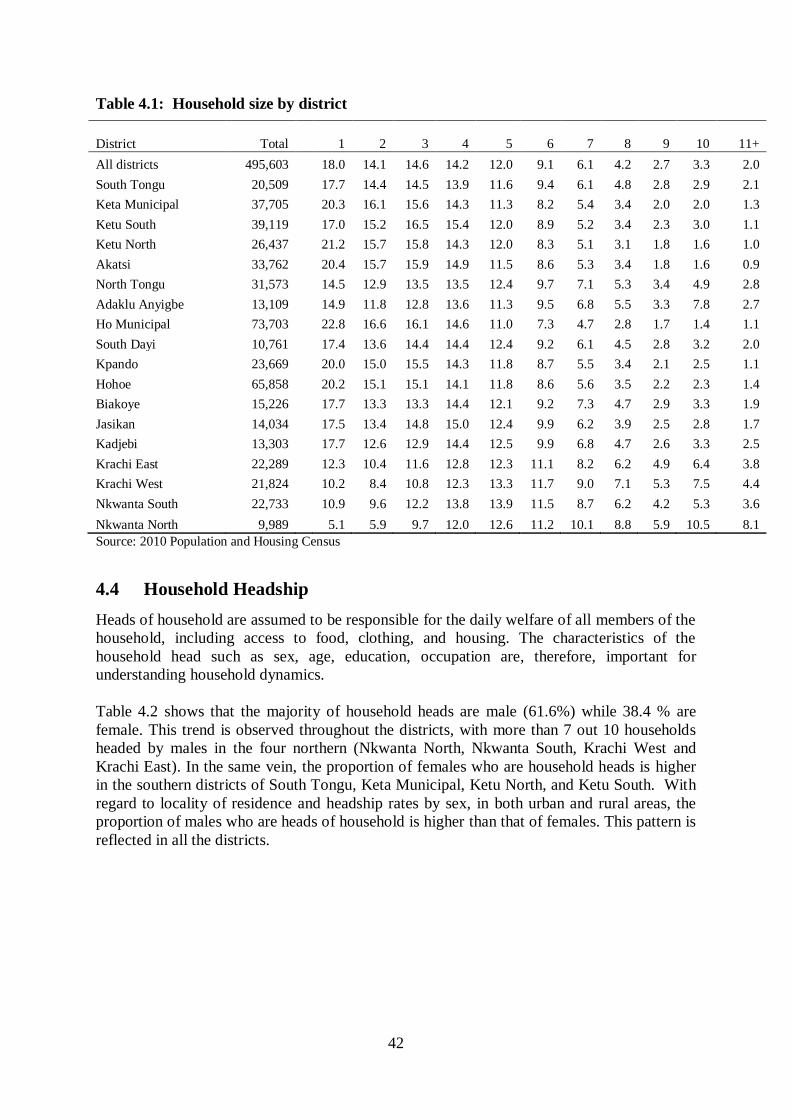
42
Table 4.1: Household size by district
District Total 1 2 3 4 5 6 7 8 9 10
11+
All districts 495,603
18.0 14.1 14.6 14.2 12.0 9.1 6.1 4.2 2.7 3.3 2.0
South Tongu 20,509
17.7 14.4 14.5 13.9 11.6 9.4 6.1 4.8 2.8 2.9 2.1
Keta Municipal 37,705
20.3 16.1 15.6 14.3 11.3 8.2 5.4 3.4 2.0 2.0 1.3
Ketu South 39,119
17.0 15.2 16.5 15.4 12.0 8.9 5.2 3.4 2.3 3.0 1.1
Ketu North 26,437
21.2 15.7 15.8 14.3 12.0 8.3 5.1 3.1 1.8 1.6 1.0
Akatsi 33,762
20.4 15.7 15.9 14.9 11.5 8.6 5.3 3.4 1.8 1.6 0.9
North Tongu 31,573
14.5 12.9 13.5 13.5 12.4 9.7 7.1 5.3 3.4 4.9 2.8
Adaklu Anyigbe 13,109
14.9 11.8 12.8 13.6 11.3 9.5 6.8 5.5 3.3 7.8 2.7
Ho Municipal 73,703
22.8 16.6 16.1 14.6 11.0 7.3 4.7 2.8 1.7 1.4 1.1
South Dayi 10,761
17.4 13.6 14.4 14.4 12.4 9.2 6.1 4.5 2.8 3.2 2.0
Kpando 23,669
20.0 15.0 15.5 14.3 11.8 8.7 5.5 3.4 2.1 2.5 1.1
Hohoe 65,858
20.2 15.1 15.1 14.1 11.8 8.6 5.6 3.5 2.2 2.3 1.4
Biakoye 15,226
17.7 13.3 13.3 14.4 12.1 9.2 7.3 4.7 2.9 3.3 1.9
Jasikan 14,034
17.5 13.4 14.8 15.0 12.4 9.9 6.2 3.9 2.5 2.8 1.7
Kadjebi 13,303
17.7 12.6 12.9 14.4 12.5 9.9 6.8 4.7 2.6 3.3 2.5
Krachi East 22,289
12.3 10.4 11.6 12.8 12.3 11.1 8.2 6.2 4.9 6.4 3.8
Krachi West 21,824
10.2 8.4 10.8 12.3 13.3 11.7 9.0 7.1 5.3 7.5 4.4
Nkwanta South 22,733
10.9 9.6 12.2 13.8 13.9 11.5 8.7 6.2 4.2 5.3 3.6
Nkwanta North 9,989 5.1 5.9 9.7 12.0 12.6 11.2 10.1 8.8 5.9 10.5 8.1
Source: 2010 Population and Housing Census
4.4 Household Headship
Heads of household are assumed to be responsible for the daily welfare of all members of the
household, including access to food, clothing, and housing. The characteristics of the
household head such as sex, age, education, occupation are, therefore, important for
understanding household dynamics.
Table 4.2 shows that the majority of household heads are male (61.6%) while 38.4 % are
female. This trend is observed throughout the districts, with more than 7 out 10 households
headed by males in the four northern (Nkwanta North, Nkwanta South, Krachi West and
Krachi East). In the same vein, the proportion of females who are household heads is higher
in the southern districts of South Tongu, Keta Municipal, Ketu North, and Ketu South. With
regard to locality of residence and headship rates by sex, in both urban and rural areas, the
proportion of males who are heads of household is higher than that of females. This pattern is
reflected in all the districts.

43
Table 4.2: Household headship, by district, locality and sex of head
District
Total Urban Rural
Total
Male
head
Female
head
Total
Male
head
Female
head
Total
Male
head
Female
head
All districts 495,603 61.6 38.4
178,817 58.9 41.1
316,786 63.1 36.9 South Tongu 20,509 51.4 48.6 3004 55.7 44.3 17,505 50.7 49.3
Keta Municipal 37,705 51.3 48.7
20,472 50.7 49.3
17,233 52.1 47.9 Ketu South 39,119 58.4 41.6 17,965 59.4 40.6 21,154 57.5 42.5
Ketu North 26,437 54.8 45.2
9,666 53.2 46.8
16,771 55.8 44.2
Akatsi 33,762 53.7 46.3 8,628 55.2 44.8 25,134 53.2 46.8
North Tongu 31,573 57.7 42.3 9,536 53.5 46.5 22,037 59.5 40.5 Adaklu Anyigbe 13,109 66.2 33.8 1,782 60.2 39.8 11,327 67.1 32.9
Ho Municipal 73,703 59.1 40.9 33,956 58.7 41.3 39,747 59.5 40.5 South Dayi 10,761 56.0 44.0 4,170 54.2 45.8 6,591 57.1 42.9
North Dayi 23,669 56.2 43.8 7,411 58.8 41.2 16,258 55.1 44.9 Hohoe Municipal 65,858 62.0 38.0 27,343 60.2 39.8 38,515 63.4 36.6
Biakoye 15,226 66.8 33.2 5,146 64.0 36.0 10,080 68.3 31.7 Jasikan 14,034 67.1 32.9 3,930 63.7 36.3 10,104 68.4 31.6
Kadjebi 13,303 73.8 26.2
3,869 65.0 35.0
9,434 77.4 22.6
Krachi East 22,289 76.8 23.2
7,196 68.0 32.0
15,093 81.1 18.9
Krachi West 21,824 77.3 22.7
4,743 70.4 29.6
17,081 79.2 20.8
Nkwanta South 22,733 76.2 23.8
6,886 66.7 33.3
15,847 80.3 19.7
Nkwanta North 9,989 84.7 15.3
3,114 75.2 24.8
6,875 89.0 11.0
Source: 2010 Population and Housing Census
Table 4.3 presents information on headship rate by sex, age and locality of residence. The
proportion of males who are heads of household increases with age up to age 65-69 years,
and then declines thereafter. On the other hand, female headship rates are higher at the older
ages (70 years and over). The same pattern is observed in both rural and urban areas.
Table 4.3: Household headship, by sex, age and locality
Age
group
Total Urban Rural
Total Male Female Total Male Female Total Male Female
All ages 495,603 61.6 38.4 178,817 58.9 41.1 316,786 63.1 36.9
15 - 19 7,387 61.9 38.1 3,373 58.4 41.6 4,014 64.9 35.1
20 - 24 26,133 63.1 36.9 12,159 57.9 42.1 13,974 67.6 32.4
25 - 29 46,119 67.8 32.2 20,128 62.3 37.7 25,991 72.0 28.0
30 - 34 53,024 70.2 29.8 21,621 66.1 33.9 31,403 73.0 27.0
35 - 39 54,363 69.5 30.5 20,904 65.8 34.2 33,459 71.9 28.1
40 - 44 53,888 65.5 34.5 19,260 61.7 38.3 34,628 67.7 32.3
45 - 49 50,548 63.2 36.8 17,597 59.1 40.9 32,951 65.3 34.7
50 - 54 49,679 59.8 40.2 16,873 57.0 43.0 32,806 61.2 38.8
55 - 59 34,292 58.7 41.3 12,175 56.6 43.4 22,117 59.9 40.1
60 - 64 32,963 55.6 44.4 10,211 53.1 46.9 22,752 56.7 43.3
65 - 69 21,490 53.9 46.1 6,608 51.5 48.5 14,882 54.9 45.1
70 - 74 27,415 47.2 52.8 7,493 46.1 53.9 19,922 47.6 52.4
75 - 79 16,584 49.0 51.0 4,724 45.8 54.2 11,860 50.3 49.7
80 - 84 11,654 44.1 55.9 3,027 41.1 58.9 8,627 45.1 54.9
85 - 89 5,507 45.7 54.3 1,538 42.6 57.4 3,969 46.9 53.1
90 - 94 3,238 48.0 52.0 776 46.6 53.4 2,462 48.5 51.5
95+ 1,319 47.5 52.5 350 42.0 58.0 969 49.5 50.5
Source: 2010 Population and Housing Census
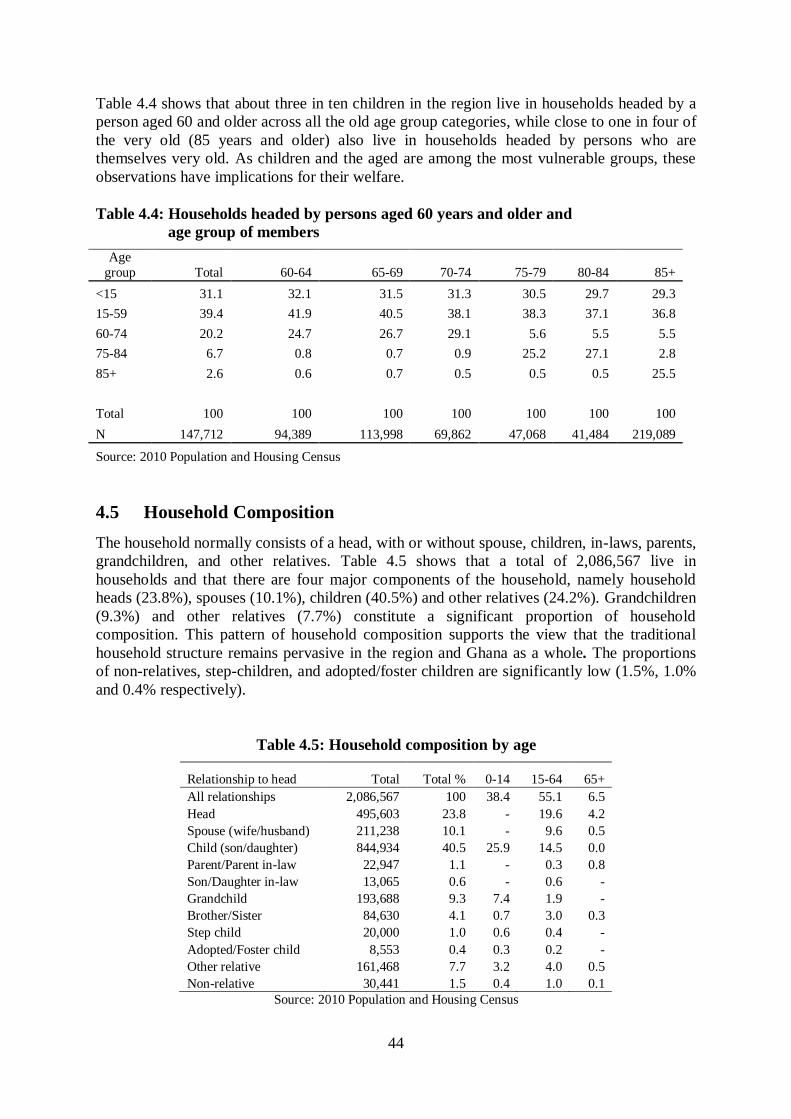
44
Table 4.4 shows that about three in ten children in the region live in households headed by a
person aged 60 and older across all the old age group categories, while close to one in four of
the very old (85 years and older) also live in households headed by persons who are
themselves very old. As children and the aged are among the most vulnerable groups, these
observations have implications for their welfare.
Table 4.4: Households headed by persons aged 60 years and older and
age group of members
Age
group Total 60-64 65-69 70-74 75-79 80-84 85+
<15 31.1 32.1 31.5 31.3 30.5 29.7 29.3
15-59 39.4 41.9 40.5 38.1 38.3 37.1 36.8
60-74 20.2 24.7 26.7 29.1 5.6 5.5 5.5
75-84 6.7 0.8 0.7 0.9 25.2 27.1 2.8
85+ 2.6 0.6 0.7 0.5 0.5 0.5 25.5
Total 100 100 100 100 100 100 100
N 147,712 94,389 113,998 69,862 47,068 41,484 219,089
Source: 2010 Population and Housing Census
4.5 Household Composition
The household normally consists of a head, with or without spouse, children, in-laws, parents,
grandchildren, and other relatives. Table 4.5 shows that a total of 2,086,567 live in
households and that there are four major components of the household, namely household
heads (23.8%), spouses (10.1%), children (40.5%) and other relatives (24.2%). Grandchildren
(9.3%) and other relatives (7.7%) constitute a significant proportion of household
composition. This pattern of household composition supports the view that the traditional
household structure remains pervasive in the region and Ghana as a whole. The proportions
of non-relatives, step-children, and adopted/foster children are significantly low (1.5%, 1.0%
and 0.4% respectively).
Table 4.5: Household composition by age
Relationship to head Total Total % 0-14 15-64 65+
All relationships 2,086,567 100 38.4 55.1 6.5
Head 495,603 23.8 - 19.6 4.2
Spouse (wife/husband) 211,238 10.1 - 9.6 0.5
Child (son/daughter) 844,934 40.5 25.9 14.5 0.0
Parent/Parent in-law 22,947 1.1 - 0.3 0.8
Son/Daughter in-law 13,065 0.6 - 0.6 -
Grandchild 193,688 9.3 7.4 1.9 -
Brother/Sister 84,630 4.1 0.7 3.0 0.3
Step child 20,000 1.0 0.6 0.4 -
Adopted/Foster child 8,553 0.4 0.3 0.2 -
Other relative 161,468 7.7 3.2 4.0 0.5
Non-relative 30,441 1.5 0.4 1.0 0.1
Source: 2010 Population and Housing Census

45
Table 4.6 shows that the district pattern does not deviate much from the regional pattern. The
proportion of male heads of households is higher than the proportion of female heads in all
the districts. In fact, the headship rate for males is twice that of females in Jasikan, Kadjebi,
Krachi East, Krachi West, Nkwanta North, Nkwanta South districts. It is also observed that
children constitute the largest proportion of household members, followed by heads of
household across all the districts. The head, the spouse, the children and other relatives
constitute about 80 percent of all household members in the districts.
Table 4.6: Household composition by sex and district
Head
Spouse (wife/
husband)
Child (son/
daughter)
Parent / Parent in-law
Son/ Dau-ghter
in-law Grand-
child Brother/
Sister Step child
Adopted/ Foster child
Other relative
Non-relative
All districts 23.6 10.0 39.9 1.1 0.6 9.1 4.0 0.9 0.4 7.6 1.4
Male 29.9 1.3 42.7 0.3 0.3 9.5 4.4 1.0 0.4 7.0 1.6
Female 17.3 18.0 37.3 1.8 0.9 8.8 3.6 0.9 0.4 8.2 1.3
South Tongu
Total 23.3 7.6 35.9 1.1 0.6 13.9 4.1 1.0 0.3 9.0 1.5
Male 26.4 1.4 38.9 0.4 0.3 14.6 4.3 1.2 0.3 8.9 1.8
Female 20.8 12.8 33.4 1.7 0.8 13.3 3.9 0.9 0.3 9.1 1.3
Keta
Municipal Total 25.5 7.9 32.6 1.3 0.8 14.0 3.9 0.9 0.3 9.7 1.1
Male 28.2 1.7 35.7 0.4 0.5 15.2 4.3 1.0 0.3 9.6 1.3
Female 23.2 13.3 30.0 2.0 1.1 12.9 3.6 0.8 0.3 9.8 0.9
Ketu South
Total 24.3 10.1 39.3 1.0 0.7 9.0 3.6 0.9 0.4 7.6 1.0
Male 30.2 1.9 42.2 0.3 0.3 9.5 3.9 0.9 0.4 7.1 1.1
Female 19.1 17.4 36.6 1.5 1.0 8.7 3.3 0.8 0.4 8.1 0.9
Ketu North
Total 26.5 9.8 39.6 1.1 0.7 10.4 2.7 0.9 0.3 5.8 0.9
Male 31.1 1.2 43.5 0.4 0.3 11.2 3.0 1.0 0.3 5.5 1.1
Female 22.4 17.2 36.2 1.7 1.0 9.7 2.5 0.8 0.3 6.1 0.7
Akatsi
Total 26.3 9.4 39.3 1.2 0.6 10.1 3.4 0.8 0.3 6.6 1.0
Male 30.7 1.7 42.7 0.3 0.3 10.7 3.7 0.8 0.3 6.4 1.2
Female 22.5 16.0 36.3 2.0 0.9 9.6 3.1 0.7 0.3 6.7 0.8
North Tongu
Total 21.2 8.3 39.3 1.0 0.5 11.9 5.2 0.8 0.3 9.4 1.1
Male 25.9 1.3 41.8 0.3 0.3 12.4 5.5 0.8 0.4 9.0 1.3
Female 16.9 14.6 37.1 1.5 0.7 11.5 5.0 0.7 0.3 9.8 1.0
Adaklu
Anyigbe Total 20.4 9.3 42.6 0.9 0.6 8.8 6.1 1.0 0.6 7.6 1.1
Male 27.7 0.9 44.1 0.2 0.4 8.9 6.5 1.1 0.5 7.2 1.3
Female 13.4 17.3 41.2 1.6 0.8 8.7 5.6 0.9 0.6 8.0 0.8
Ho Municipal
Total 27.1 27.1 27.1 27.1 27.1 27.1 27.1 27.1 0.4 8.2 1.9
Male 33.7 33.7 33.7 33.7 33.7 33.7 33.7 33.7 0.4 7.8 1.9
Female 21.1 21.1 21.1 21.1 21.1 21.1 21.1 21.1 0.4 8.6 1.8
South Dayi
Total 23.1 8.8 38.4 1.1 0.8 10.8 4.4 0.8 0.4 8.1 1.5
Male 27.2 2.2 41.3 0.4 0.3 11.4 4.6 0.9 0.4 7.9 1.6
Female 19.3 14.8 35.9 1.8 1.2 10.3 4.1 0.8 0.4 8.3 1.3
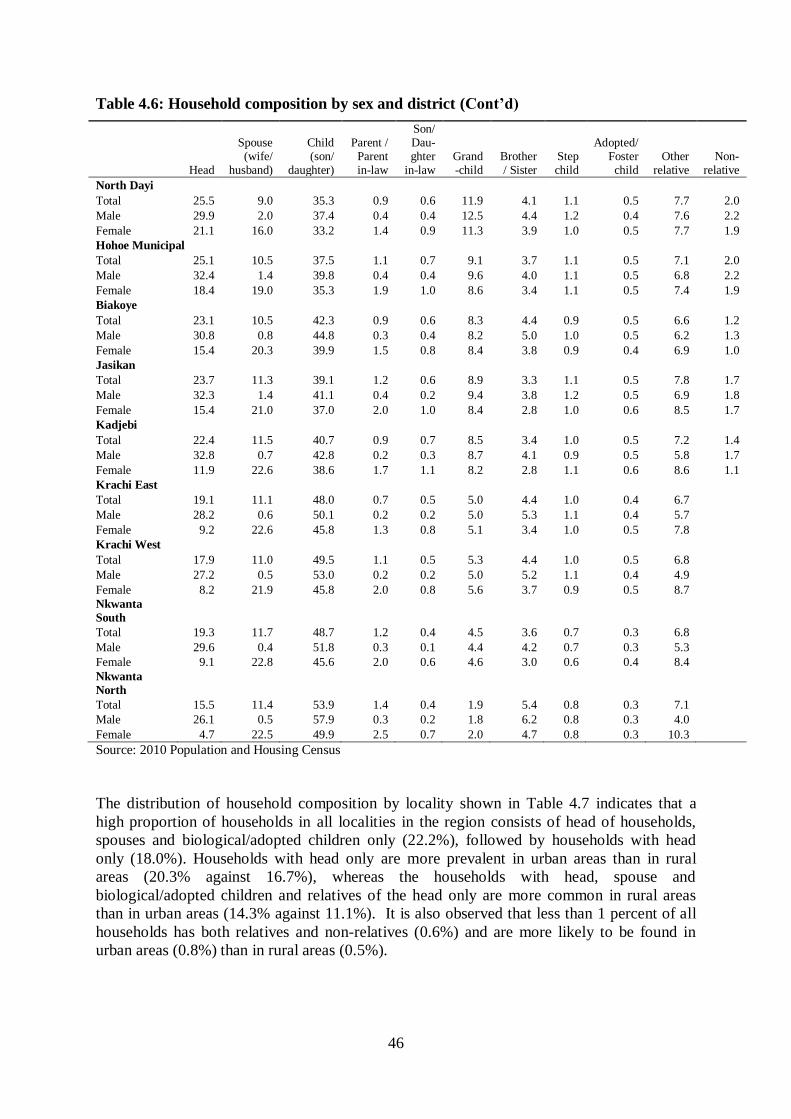
46
Table 4.6: Household composition by sex and district (Cont’d)
Head
Spouse (wife/
husband)
Child (son/
daughter)
Parent / Parent in-law
Son/ Dau-ghter
in-law Grand-child
Brother/ Sister
Step child
Adopted/Foster child
Other relative
Non-relative
North Dayi
Total 25.5 9.0 35.3 0.9 0.6 11.9 4.1 1.1 0.5 7.7 2.0
Male 29.9 2.0 37.4 0.4 0.4 12.5 4.4 1.2 0.4 7.6 2.2
Female 21.1 16.0 33.2 1.4 0.9 11.3 3.9 1.0 0.5 7.7 1.9
Hohoe Municipal
Total 25.1 10.5 37.5 1.1 0.7 9.1 3.7 1.1 0.5 7.1 2.0
Male 32.4 1.4 39.8 0.4 0.4 9.6 4.0 1.1 0.5 6.8 2.2
Female 18.4 19.0 35.3 1.9 1.0 8.6 3.4 1.1 0.5 7.4 1.9
Biakoye
Total 23.1 10.5 42.3 0.9 0.6 8.3 4.4 0.9 0.5 6.6 1.2
Male 30.8 0.8 44.8 0.3 0.4 8.2 5.0 1.0 0.5 6.2 1.3
Female 15.4 20.3 39.9 1.5 0.8 8.4 3.8 0.9 0.4 6.9 1.0
Jasikan
Total 23.7 11.3 39.1 1.2 0.6 8.9 3.3 1.1 0.5 7.8 1.7
Male 32.3 1.4 41.1 0.4 0.2 9.4 3.8 1.2 0.5 6.9 1.8
Female 15.4 21.0 37.0 2.0 1.0 8.4 2.8 1.0 0.6 8.5 1.7
Kadjebi
Total 22.4 11.5 40.7 0.9 0.7 8.5 3.4 1.0 0.5 7.2 1.4
Male 32.8 0.7 42.8 0.2 0.3 8.7 4.1 0.9 0.5 5.8 1.7
Female 11.9 22.6 38.6 1.7 1.1 8.2 2.8 1.1 0.6 8.6 1.1
Krachi East
Total 19.1 11.1 48.0 0.7 0.5 5.0 4.4 1.0 0.4 6.7 Male 28.2 0.6 50.1 0.2 0.2 5.0 5.3 1.1 0.4 5.7 Female 9.2 22.6 45.8 1.3 0.8 5.1 3.4 1.0 0.5 7.8 Krachi West
Total 17.9 11.0 49.5 1.1 0.5 5.3 4.4 1.0 0.5 6.8 Male 27.2 0.5 53.0 0.2 0.2 5.0 5.2 1.1 0.4 4.9 Female 8.2 21.9 45.8 2.0 0.8 5.6 3.7 0.9 0.5 8.7 Nkwanta
South Total 19.3 11.7 48.7 1.2 0.4 4.5 3.6 0.7 0.3 6.8
Male 29.6 0.4 51.8 0.3 0.1 4.4 4.2 0.7 0.3 5.3 Female 9.1 22.8 45.6 2.0 0.6 4.6 3.0 0.6 0.4 8.4
Nkwanta
North Total 15.5 11.4 53.9 1.4 0.4 1.9 5.4 0.8 0.3 7.1
Male 26.1 0.5 57.9 0.3 0.2 1.8 6.2 0.8 0.3 4.0
Female 4.7 22.5 49.9 2.5 0.7 2.0 4.7 0.8 0.3 10.3
Source: 2010 Population and Housing Census
The distribution of household composition by locality shown in Table 4.7 indicates that a
high proportion of households in all localities in the region consists of head of households,
spouses and biological/adopted children only (22.2%), followed by households with head
only (18.0%). Households with head only are more prevalent in urban areas than in rural
areas (20.3% against 16.7%), whereas the households with head, spouse and
biological/adopted children and relatives of the head only are more common in rural areas
than in urban areas (14.3% against 11.1%). It is also observed that less than 1 percent of all
households has both relatives and non-relatives (0.6%) and are more likely to be found in
urban areas (0.8%) than in rural areas (0.5%).

47
Table 4.7: Household composition by locality
Source: 2010 Population and Housing Census
4.6 Household Structure
The distribution of household structure by locality is shown in Table 4.8. Head with spouse(s)
and biological/adopted children constitutes the highest proportion of households (22.2%),
while head with biological/adopted children, relatives of the head and non-relatives constitute
the lowest proportion of households (0.6%). In urban areas, single-person household has the
largest share of all households (20.3%), followed by households consisting of the head,
spouse and children (19.7%). The opposite is the case in rural areas, where the highest
proportion of households is those with head, spouse and children only, followed by single-
person households. Household structure consisting of the head, spouse(s), biological/adopted
children, and relatives of the head only is more common in rural areas (14.3%) than urban
areas (11.1%), indicating a more traditional composition of rural households than of urban
households. It is also observed that head with other household members but without spouse is
more prevalent in urban areas (13.6%) than in rural areas (11.8%).
Household composition Total Percent Urban Percent Rural Percent
Total 495,603 100 178,817 100 316,786 100
Head and spouse only 16,549 3.3 6,368 3.6 10,181 3.2
Head with spouse
109,865 22.2 35,272 19.7 74,593 23.5 and biological/adopted children only
Head with spouse(s)
65,114 13.1 19,766 11.1 45,348 14.3
and biological/adopted children and relatives of the
head only
Head with spouse(s)
3,846 0.8 1,692 0.9 2,154 0.7
and biological/adopted children relatives/
nonrelatives of the head
Head with spouse(s)
15,864 3.2 5,940 3.3 9,924 3.1 and other composition
Head only 89,163 18.0 36,367 20.3 52,796 16.7
Head with biological/adopted children only 68,003 13.7 25,467 14.2 42,536 13.4
Head with biological/adopted children and relatives
of the head only 62,343 12.6 22,117 12.4 40,226 12.7
Head with biological/adopted children, relatives
and nonrelatives of the head 3,211 0.6 1,471 0.8 1,740 0.5
Head and other composition but no spouse 61,645 12.4 24,357 13.6 37,288 11.8

48
Table 4.8: Household structure by locality
Household structure Total Urban Rural Total % Urban % Rural %
Total 495,603 178,817 316,786 100.0 100.0 100.0
Head only 89,163 36,367 52,796 18.0 20.3 16.7
Head and a spouse only 16,549 6,368 10,181 3.3 3.6 3.2
Head with spouse(s) and
biological/adopted children only 109,865 35,272 74,593 22.2 19.7 23.5
Head, spouse(s) biological/adopted
children, relatives of the head only 65,114 19,766 45,348 13.1 11.1 14.3
Head, spouse(s) biological/adopted
children relatives and non-relatives of the
head 3,846 1,692 2,154 0.8 0.9 0.7
Head spouse(s) and other composition 15,864 5,940 9,924 3.2 3.3 3.1
Head and biological/adopted children
only 68,003 25,467 42,536 13.7 14.2 13.4
Head biological/adopted children and
relatives of the head only 62,343 22,117 40,226 12.6 12.4 12.7
Head biological/adopted children relatives
and non-relatives of the head 3,211 1,471 1,740 0.6 0.8 0.5
Head and other household members but
no spouse 61,645 24,357 37,288 12.4 13.6 11.8
Source: 2010 Population and Housing Census

49
CHAPTER FIVE
MARITAL CHARACTERISTICS
5.1 Introduction
Marriage in Ghana includes both formal and informal unions. Formal unions are those
sanctioned by law under the ordinance, by tradition/customary law, and by religion. Informal
unions are cohabiting unions recognized in Ghana but not sanctioned by law, tradition or
religion. Available data have documented that marriage is universal and early in many parts
of the country (GDHS, 1998; Gaisie, 1976; Aryee, 1975). There is also a close relationship
between proportion married and fertility. This chapter presents marital characteristics in the
region in terms of age, sex, locality of residence, level of education and religion.
5.2 Marital Status by Age
Early marriage is prevalent in populations where marriage is universal. Early marriage and
early child birth are known to be implicated in poor pregnancy outcomes for the mother and
child and are also likely to result in dissolution due to the inexperience of the couple. Table
5.1 shows the distribution of marital status by age. The data reveal that across all ages, 49.2
percent of the population 12 years and older is in some form of union, consisting of 46.6
percent who are married and 4.6 percent who are in consensual union. In addition, 13 percent
have once been married but are now divorced, separated, or widowed. As expected, higher
proportions of the widowed are in the older age groups, 60-64, 65-69 and 70 and over
(21.1%, 27.1% and 45.8% respectively). The rate of divorce also increases with increasing
age: persons over 50 years, but excluding those 70 years and over, are more likely to divorce
than persons in the younger age groups.
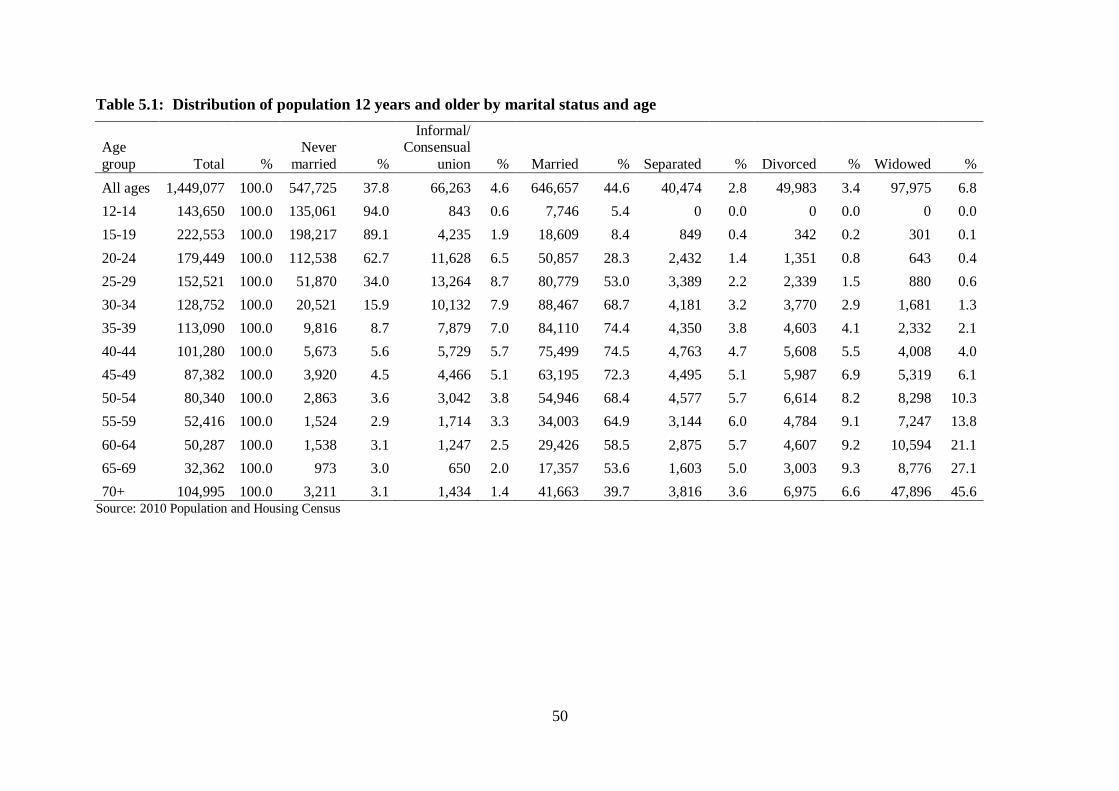
50
Table 5.1: Distribution of population 12 years and older by marital status and age
Age
group Total %
Never
married %
Informal/ Consensual
union % Married % Separated % Divorced % Widowed %
All ages 1,449,077 100.0 547,725 37.8 66,263 4.6 646,657 44.6 40,474 2.8 49,983 3.4 97,975 6.8
12-14 143,650 100.0 135,061 94.0 843 0.6 7,746 5.4 0 0.0 0 0.0 0 0.0
15-19 222,553 100.0 198,217 89.1 4,235 1.9 18,609 8.4 849 0.4 342 0.2 301 0.1
20-24 179,449 100.0 112,538 62.7 11,628 6.5 50,857 28.3 2,432 1.4 1,351 0.8 643 0.4
25-29 152,521 100.0 51,870 34.0 13,264 8.7 80,779 53.0 3,389 2.2 2,339 1.5 880 0.6
30-34 128,752 100.0 20,521 15.9 10,132 7.9 88,467 68.7 4,181 3.2 3,770 2.9 1,681 1.3
35-39 113,090 100.0 9,816 8.7 7,879 7.0 84,110 74.4 4,350 3.8 4,603 4.1 2,332 2.1
40-44 101,280 100.0 5,673 5.6 5,729 5.7 75,499 74.5 4,763 4.7 5,608 5.5 4,008 4.0
45-49 87,382 100.0 3,920 4.5 4,466 5.1 63,195 72.3 4,495 5.1 5,987 6.9 5,319 6.1
50-54 80,340 100.0 2,863 3.6 3,042 3.8 54,946 68.4 4,577 5.7 6,614 8.2 8,298 10.3
55-59 52,416 100.0 1,524 2.9 1,714 3.3 34,003 64.9 3,144 6.0 4,784 9.1 7,247 13.8
60-64 50,287 100.0 1,538 3.1 1,247 2.5 29,426 58.5 2,875 5.7 4,607 9.2 10,594 21.1
65-69 32,362 100.0 973 3.0 650 2.0 17,357 53.6 1,603 5.0 3,003 9.3 8,776 27.1
70+ 104,995 100.0 3,211 3.1 1,434 1.4 41,663 39.7 3,816 3.6 6,975 6.6 47,896 45.6 Source: 2010 Population and Housing Census
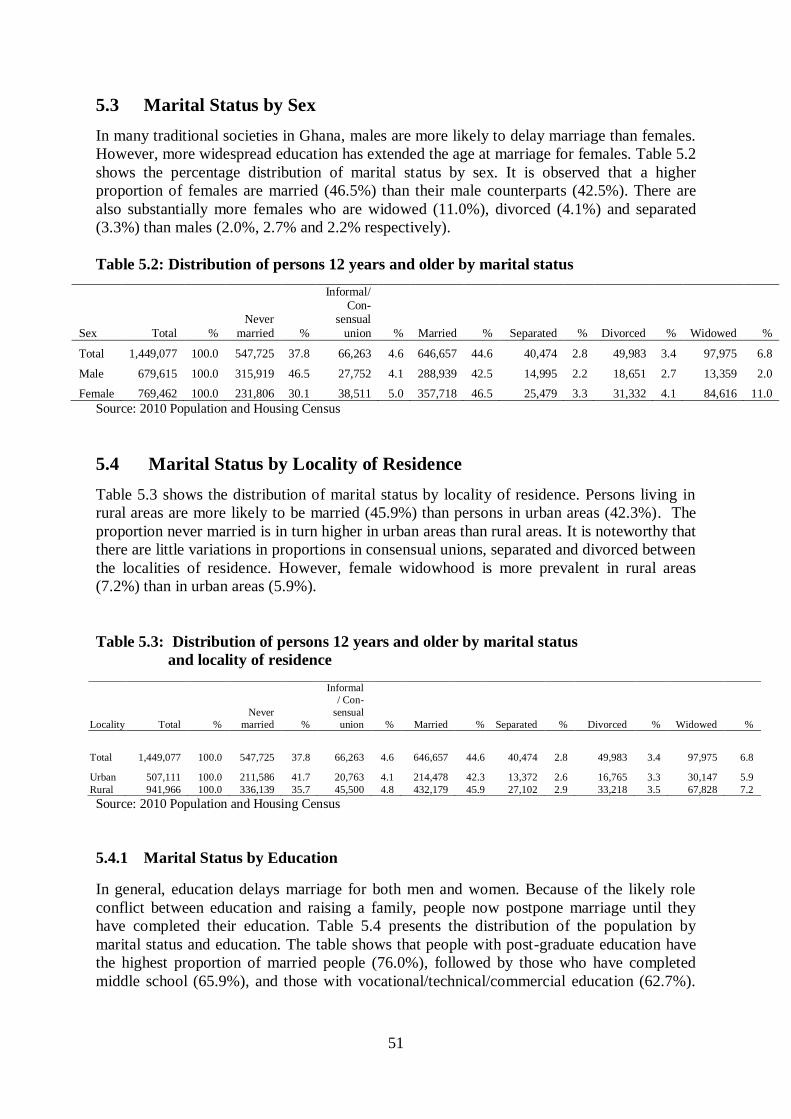
51
5.3 Marital Status by Sex
In many traditional societies in Ghana, males are more likely to delay marriage than females.
However, more widespread education has extended the age at marriage for females. Table 5.2
shows the percentage distribution of marital status by sex. It is observed that a higher
proportion of females are married (46.5%) than their male counterparts (42.5%). There are
also substantially more females who are widowed (11.0%), divorced (4.1%) and separated
(3.3%) than males (2.0%, 2.7% and 2.2% respectively).
Table 5.2: Distribution of persons 12 years and older by marital status
Source: 2010 Population and Housing Census
5.4 Marital Status by Locality of Residence
Table 5.3 shows the distribution of marital status by locality of residence. Persons living in
rural areas are more likely to be married (45.9%) than persons in urban areas (42.3%). The
proportion never married is in turn higher in urban areas than rural areas. It is noteworthy that
there are little variations in proportions in consensual unions, separated and divorced between
the localities of residence. However, female widowhood is more prevalent in rural areas
(7.2%) than in urban areas (5.9%).
Table 5.3: Distribution of persons 12 years and older by marital status
and locality of residence
Source: 2010 Population and Housing Census
5.4.1 Marital Status by Education
In general, education delays marriage for both men and women. Because of the likely role
conflict between education and raising a family, people now postpone marriage until they
have completed their education. Table 5.4 presents the distribution of the population by
marital status and education. The table shows that people with post-graduate education have
the highest proportion of married people (76.0%), followed by those who have completed
middle school (65.9%), and those with vocational/technical/commercial education (62.7%).
Sex Total %
Never
married %
Informal/ Con-
sensual
union % Married % Separated
% Divorced
% Widowed %
Total 1,449,077 100.0 547,725 37.8 66,263 4.6 646,657 44.6 40,474 2.8 49,983 3.4 97,975 6.8
Male 679,615 100.0 315,919 46.5 27,752 4.1 288,939 42.5 14,995 2.2 18,651 2.7 13,359 2.0
Female 769,462 100.0 231,806 30.1 38,511 5.0 357,718 46.5 25,479 3.3 31,332 4.1 84,616 11.0
Locality Total %
Never
married %
Informal
/ Con-
sensual
union % Married % Separated % Divorced % Widowed %
Total 1,449,077 100.0 547,725 37.8 66,263 4.6 646,657 44.6 40,474 2.8 49,983 3.4 97,975 6.8
Urban 507,111 100.0 211,586 41.7 20,763 4.1 214,478 42.3 13,372 2.6 16,765 3.3 30,147 5.9
Rural 941,966 100.0 336,139 35.7 45,500 4.8 432,179 45.9 27,102 2.9 33,218 3.5 67,828 7.2
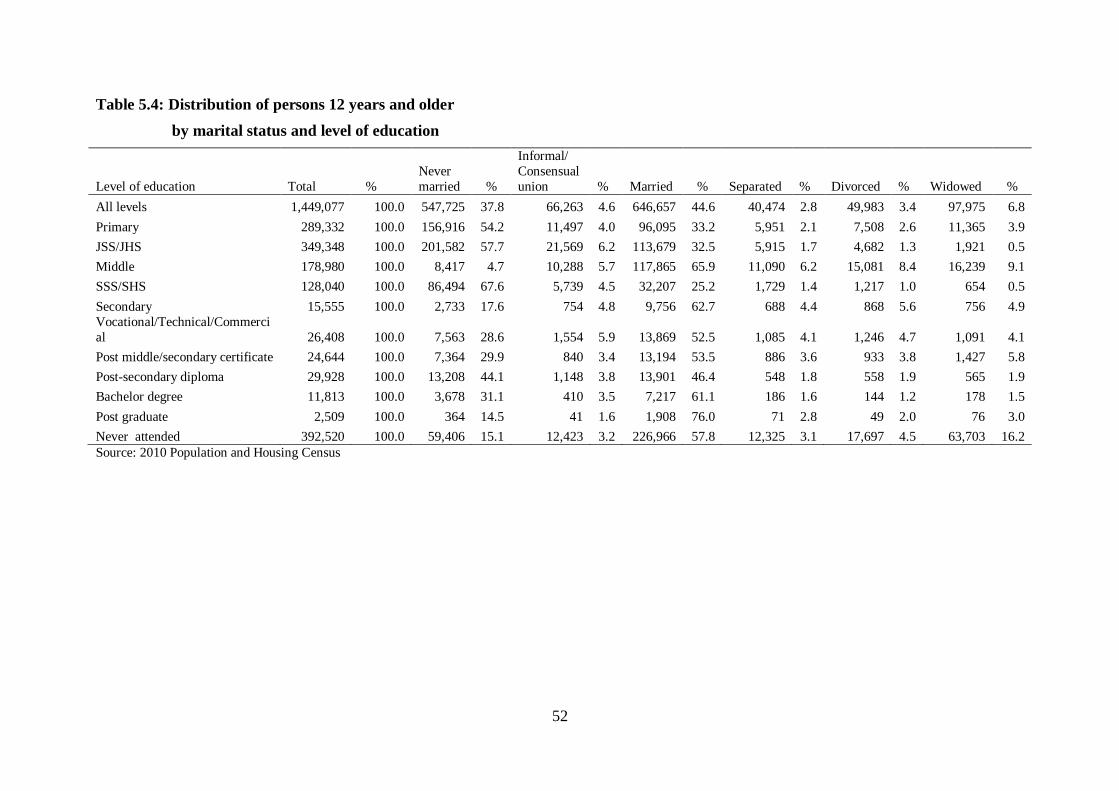
52
Table 5.4: Distribution of persons 12 years and older
by marital status and level of education
Level of education Total %
Never
married %
Informal/
Consensual
union
% Married % Separated
% Divorced
% Widowed %
All levels 1,449,077 100.0 547,725 37.8 66,263 4.6 646,657 44.6 40,474 2.8 49,983 3.4 97,975 6.8
Primary 289,332 100.0 156,916 54.2 11,497 4.0 96,095 33.2 5,951 2.1 7,508 2.6 11,365 3.9
JSS/JHS 349,348 100.0 201,582 57.7 21,569 6.2 113,679 32.5 5,915 1.7 4,682 1.3 1,921 0.5
Middle 178,980 100.0 8,417 4.7 10,288 5.7 117,865 65.9 11,090 6.2 15,081 8.4 16,239 9.1
SSS/SHS 128,040 100.0 86,494 67.6 5,739 4.5 32,207 25.2 1,729 1.4 1,217 1.0 654 0.5
Secondary 15,555 100.0 2,733 17.6 754 4.8 9,756 62.7 688 4.4 868 5.6 756 4.9
Vocational/Technical/Commerci
al 26,408 100.0 7,563 28.6 1,554 5.9 13,869 52.5 1,085 4.1 1,246 4.7 1,091 4.1
Post middle/secondary certificate 24,644 100.0 7,364 29.9 840 3.4 13,194 53.5 886 3.6 933 3.8 1,427 5.8
Post-secondary diploma 29,928 100.0 13,208 44.1 1,148 3.8 13,901 46.4 548 1.8 558 1.9 565 1.9
Bachelor degree 11,813 100.0 3,678 31.1 410 3.5 7,217 61.1 186 1.6 144 1.2 178 1.5
Post graduate 2,509 100.0 364 14.5 41 1.6 1,908 76.0 71 2.8 49 2.0 76 3.0
Never attended 392,520 100.0 59,406 15.1 12,423 3.2 226,966 57.8 12,325 3.1 17,697 4.5 63,703 16.2
Source: 2010 Population and Housing Census

53
It is also noted that about three out of ten of people who have attained only primary or junior
high school education are married and over one half of those who have never been to school
are also married. The proportion of individuals who have never married ranges from a low of
15.1 percent of those who have never been to school to a high of 67.6 percent of those who
have secondary school education.
Separation and divorce are more common among people with middle school education than
those in the other educational attainment categories, while widowhood is common among
those with no education.
5.4.2 Marital Status by Religion
Most religions lay strong emphasis on procreation within marriage. There is, therefore, the
need to examine people‟s marital status by their religious affiliation. Table 5.5 presents data
on the distribution of the population by religion and marital status. The table indicates that the
proportion married is above 40 percent across all the religious groups. Substantial proportions
of the never married are also found in all the religious categories. Interestingly, divorce and
separation, which are not approved in most religions, is lowest among Muslims compared to
the other religious groups. People who profess traditional religion have the highest proportion
of the widowed (11.5%), followed by those with no religion (8.0%) and those who adhere to
the Protestant religion (7.1%).
Table 5.5: Distribution of persons 12 years and older by marital status and religion
Total % Never
married %
Informal/
Con-sensual
union
% Married % Separated
% Divorced
% Widowed %
All regions 1,449,077 100 547,725 37.8 66,263 4.6 646,657 44.6 40,474 2.8 49,983 3.4 97,975 6.8
No religion 94,060 100 30,077 32 3,681 3.9 46,376 49.3 2,788 3 3,593 3.8 7,545 8
Catholic 262,246 100 105,060 40.1 14,421 5.5 107,244 40.9 8,271 3.2 10,280 3.9 16,970 6.5
Protestant 321,825 100 126,034 39.2 16,868 5.2 132,998 41.3 10,653 3.3 12,393 3.9 22,879 7.1 Pentecostal/ Charismatic 369,225 100 157,727 42.7 18,633 5 155,838 42.2 9,391 2.5 10,893 3 16,743 4.5 Other Christian 100,236 100 41,044 40.9 5,700 5.7 42,421 42.3 2,736 2.7 3,178 3.2 5,157 5.1
Muslim 79,395 100 30,803 38.8 1,518 1.9 40,631 51.2 1,188 1.5 1,449 1.8 3,806 4.8
Traditionalist 210,560 100 52,652 25 4,925 2.3 115,789 55 5,221 2.5 7,748 3.7 24,225 12
Other 11,530 100 4,328 37.5 517 4.5 5,360 46.5 226 2 449 3.9 650 5.6
Source: 2010 Population and Housing Census
5.4.3 Marital Status and Economic Activity
Table 5.6 looks at the distribution of marital status by type of economic activity. As expected,
about six out of ten people married are employed compared to three out of ten for the
unemployed and one out of five for the not economically active, which includes students and
retirees. Similarly, 67.1 percent of the not economically active have never been married
against 20.6 percent for the employed. The table further shows that the proportion of persons
in informal/consensual unions is higher in the unemployed category (7.6%) than the
employed category (5.8%). The proportion widowed is largest for the not economically
active (8.6%), followed by the employed (5.9%), while the unemployed has the lowest
proportion of the widowed (2.8%).
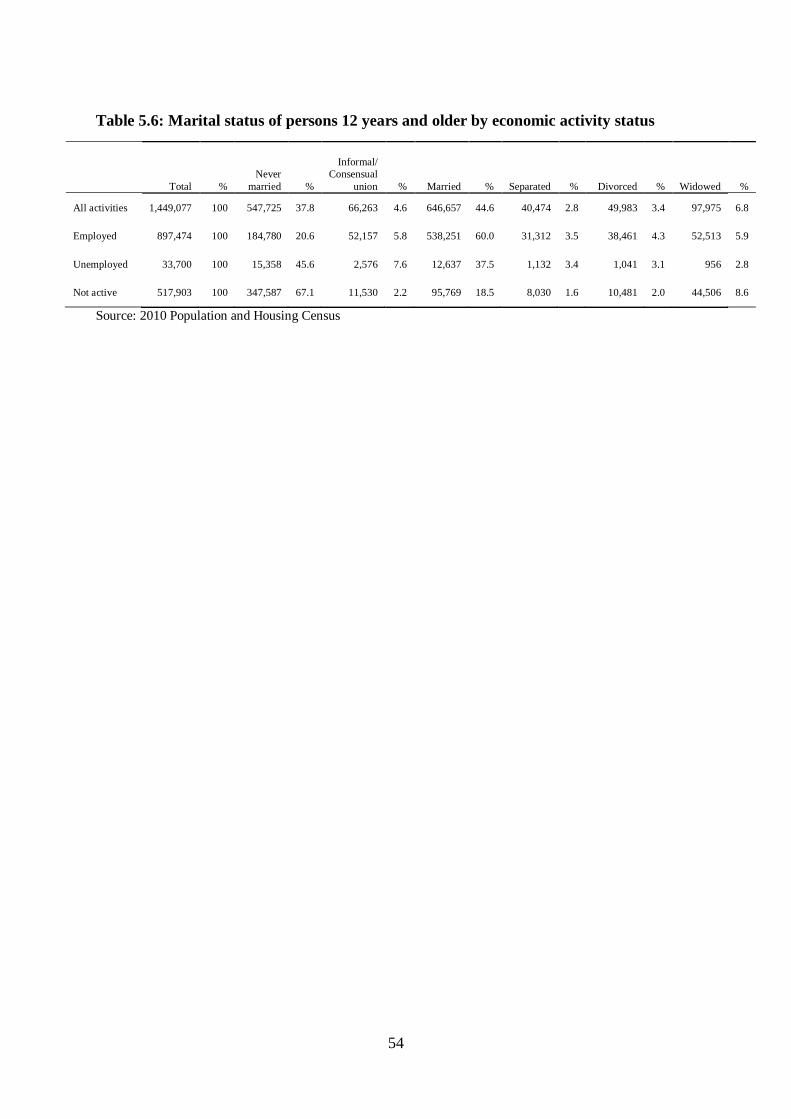
54
Table 5.6: Marital status of persons 12 years and older by economic activity status
Source: 2010 Population and Housing Census
Total %
Never
married %
Informal/
Consensual
union % Married % Separated
% Divorced
% Widowed
%
All activities 1,449,077 100 547,725 37.8 66,263 4.6 646,657 44.6 40,474 2.8 49,983 3.4 97,975 6.8
Employed 897,474 100 184,780 20.6 52,157 5.8 538,251 60.0 31,312 3.5 38,461 4.3 52,513 5.9
Unemployed 33,700 100 15,358 45.6 2,576 7.6 12,637 37.5 1,132 3.4 1,041 3.1 956 2.8
Not active 517,903 100 347,587 67.1 11,530 2.2 95,769 18.5 8,030 1.6 10,481 2.0 44,506 8.6

55
CHAPTER SIX
INFORMATION AND COMMUNICATIONS TECHNOLOGY
6.1 Introduction
Information and communications technology (ICT) is recognized as an important component
of socioeconomic development. The government has been implementing policies and
programmes to expand access of the population to ICT infrastructure and technology. This
chapter presents information on access of individuals and households to ICT in the Volta
Region.
6.2 Number and Characteristics of Mobile Phone Owners
The use of mobile phones has been an important mode of communication for social and
business activities for the majority of Ghanaians since as far back as 2003 (Ayensu, 2003).
Table 6.1 provides information on mobile phone ownership by district and sex. For the
region as a whole, there are 540,623 persons 12 years and older with mobile phones,
representing 37.3 percent of the population. Ho Municipal has the largest share of mobile
phone owners (18.9%) in the region, followed by Hohoe Municipal (14.7%). Seven out of
the 18 districts reported very low proportions of mobile phone ownership – Nkwanta South
(2.9%), Adaklu Anyigbe (2.7%), Jasikan (2.7%), Biakoye (2.6%), South Dayi (2.4%),
Kadjebi (2.0%) and Nkwanta North (1.1%). A similar pattern of mobile phone ownership can
be observed for the sexes.
Table 6.1: Distribution of population 12 years and older with mobile phones
by district and sex
District
All localities
Male
Female
Number Percent Number Percent Number Percent
All districts 540,623 100.0
291,006 100.0
249,617 100.0
South Tongu 23,263 4.3
12,194 4.2
11,069 4.4
Keta Municipal 44,334 8.2
21,881 7.5
22,453 9.0
Ketu South 50,341 9.3
25,799 8.9
24,542 9.8
Ketu North 25,564 4.7
13,690 4.7
11,874 4.8
Akatsi 30,808 5.7
16,714 5.7
14,094 5.6
North Tongu 37,519 6.9
20,474 7.0
17,045 6.8
Adaklu Anyigbe 14,786 2.7
8,457 2.9
6,329 2.5
Ho Municipal 102,114 18.9
52,305 18.0
49,809 20.0
South Dayi 13,135 2.4
6,752 2.3
6,383 2.6
North Dayi 26,037 4.8
13,433 4.6
12,604 5.0
Hohoe Municipal 79,252 14.7
41,647 14.3
37,605 15.1
Biakoye 13,930 2.6
7,896 2.7
6,034 2.4 Jasikan 14,779 2.7
8,266 2.8
6,513 2.6
Kadjebi 10,720 2.0
6,485 2.2
4,235 1.7
Krachi East 16,009 3.0
10,441 3.6
5,568 2.2
Krachi West 16,711 3.1
10,809 3.7
5,902 2.4
Nkwanta South 15,544 2.9
9,789 3.4
5,755 2.3
Nkwanta North 5,777 1.1 3,974 1.4 1,803 0.7
Source: 2010 Population and Housing Census

56
Table 6.2 presents analysis of intra-district ownership of mobile phones. The highest
proportion of population 12 years and older with mobile phones is in Ho Municipal (51.2%),
followed by Ketu South (45.8%), and Hohoe Municipal (43.2%). Krachi East, Krachi West,
and Nkwanta South all have relatively low proportions of their population with mobile
phones (22.0%, 21.7%, and 21.3% respectively). At the regional level, the proportion of
males with mobile phones was 42.8 percent as against 32.4 percent for females. This pattern
of males outnumbering females in mobile phone ownership is reflected in all the districts.
Table 6.2: Population 12 years and older with mobile phones by district and sex
District
Both sexes
Male
Female
Total
popu-
lation 12
years and
older
Popu-lation
12 years
and older
with mobile
phones
Per-centage
12 years
and older
with mobile
phones
Popu-
lation 12
years
and older
Popu-
lation 12
years and
older with
mobile
phones
Per-centage
12 years
and older
with mobile
phones
Popu-
lation 12
years
and older
Popu-
lation 12
years and
older with
mobile
phones
Per-centage
12 years
and older
with mobile
phones
All districts
1,449,07
7 540,623 37.3
679,615 291,006 42.8
769,462 249,617 32.4
South Tongu 59,055 23,263 39.4
25,695 12,194 47.5
33,360 11,069 33.2 Keta Municipal 105,884 44,334 41.9
47,403 21,881 46.2
58,481 22,453 38.4
Ketu South 110,005 50,341 45.8
49,932 25,799 51.7
60,073 24,542 40.9
Ketu North 69,370 25,564 36.9
30,979 13,690 44.2
38,391 11,874 30.9
Akatsi 89,046 30,808 34.6
39,239 16,714 42.6
49,807 14,094 28.3
North Tongu 102,798 37,519 36.5
47,141 20,474 43.4
55,657 17,045 30.6 Adaklu
Anyigbe 45,124 14,786 32.8
21,680 8,457 39.0
23,444 6,329 27.0
Ho Municipal 199,619 102,114 51.2
92,680 52,305 56.4
106,939 49,809 46.6
South Dayi 31,779 13,135 41.3
14,642 6,752 46.1
17,137 6,383 37.2
North Dayi 66,193 26,037 39.3
30,538 13,433 44.0
35,655 12,604 35.3 Hohoe Municipal 183,261 79,252 43.2
86,366 41,647 48.2
96,895 37,605 38.8
Biakoye 44,212 13,930 31.5
21,862 7,896 36.1
22,350 6,034 27.0
Jasikan 40,641 14,779 36.4
19,662 8,266 42.0
20,979 6,513 31.0
Kadjebi 40,311 10,720 26.6
20,279 6,485 32.0
20,032 4,235 21.1
Krachi East 72,858 16,009 22.0
37,839 10,441 27.6
35,019 5,568 15.9
Krachi West 76,999 16,711 21.7
38,602 10,809 28.0
38,397 5,902 15.4 Nkwanta South 73,140 15,544 21.3 35,840 9,789 27.3 37,300 5,755 15.4
Source: 2010 Population and Housing Census
Table 6.3 presents the distribution of the population 12 years and older with mobile phones,
by age and sex. It shows that ownership of mobile phone by age tends to increase from the
very young ages, peaks at ages 20-24 and then declines with increasing age. A similar age
pattern of ownership is reflected by the sexes.

57
Table 6.3: Population 12 years and older with mobile phones by age and sex
Age
Group
Total Region
Males
Females
Number Percent Number Percent Number Percent
All ages 540,623 100
291,006 100
249,617 100
12-14 4,183 0.8
2,268 0.8
1,915 0.8
15-19 40,496 7.5
23,766 8.2
16,730 6.7
20-24 82,879 15.3
45,085 15.5
37,794 15.1
25-29 82,365 15.2
43,405 14.9
38,960 15.6
30-34 68,802 12.7
36,839 12.7
31,963 12.8
35-39 59,978 11.1
32,528 11.2
27,450 11
40-44 49,934 9.2
26,596 9.1
23,338 9.3
45-49 42,427 7.8
22,038 7.6
20,389 8.2
50-54 36,134 6.7
18,794 6.5
17,340 6.9
55-59 23,973 4.4
12,554 4.3
11,419 4.6
60-64 18,319 3.4
9,944 3.4
8,375 3.4
65-69 10,617 2
5,849 2
4,768 1.9
70+ 20,516 3.8 11,340 3.9 9,176 3.7
Source: 2010 Population and Housing Census
Table 6.4 shows the distribution of mobile phone ownership by age group. It shows that over
half the population of three age groups (25-29, 30-34, 35-39) have mobile phones (54.0%,
53.4% and 53.0% respectively). Persons least likely to have mobile phones are in the very
youngest age group (12-14 years). For the sexes, mobile phone ownership is more prevalent
among the male population across all the age groups. For example, about six out of ten males
have mobile phones in the 25-29 and 30-34 age groups compared to about four out of ten for
females in the same age groups.

58
Table 6.4: Population 12 years and older with mobile phones by age group and sex
Source: 2010 Population and Housing Census
Age
group
Population
12+ by age
group
Population
12+ with
mobile
phones
Percentage
12+ with
mobile
phones
Male
population
12+
Male
population
12+ with
mobile
phones
Males 12+
percentage
with mobile
phones
Female
population
12+
Female
population
12+ with
mobile
phones
Female 12+
percentage
with mobile
phones
All ages 1,449,077 540,623 37.3 679,615 291,006 42.8 769,462 249,617 32.4
12-14 143,650 4,183 2.9 74,176 2,268 3.1 69,474 1,915 2.8
15-19 222,553 40,496 18.2 115,697 23,766 20.5 106,856 16,730 15.7
20-24 179,449 82,879 46.2 86,049 45,085 52.4 93,400 37,794 40.5
25-29 152,521 82,365 54.0 68,834 43,405 63.1 83,687 38,960 46.6
30-34 128,752 68,802 53.4 58,483 36,839 63.0 70,269 31,963 45.5
35-39 113,090 59,978 53.0 52,204 32,528 62.3 60,886 27,450 45.1
40-44 101,280 49,934 49.3 46,289 26,596 57.5 54,991 23,338 42.4
45-49 87,382 42,427 48.6 40,158 22,038 54.9 47,224 20,389 43.2
50-54 80,340 36,134 45.0 36,811 18,794 51.1 43,529 17,340 39.8
55-59 52,416 23,973 45.7 24,254 12,554 51.8 28,162 11,419 40.5
60-64 50,287 18,319 36.4 22,584 9,944 44.0 27,703 8,375 30.2
65-69 32,362 10,617 32.8 14,273 5,849 41.0 18,089 4,768 26.4
70+ 104,995 20,516 19.5 39,803 11,340 28.5 65,192 9,176 14.1
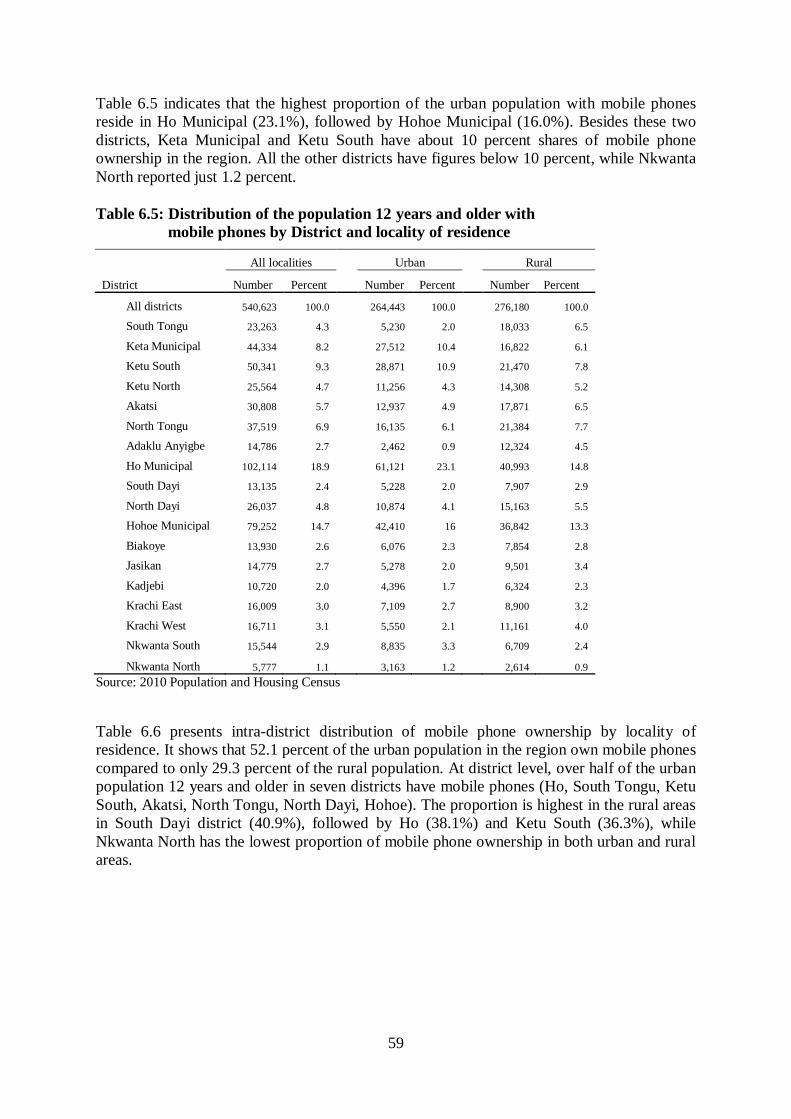
59
Table 6.5 indicates that the highest proportion of the urban population with mobile phones
reside in Ho Municipal (23.1%), followed by Hohoe Municipal (16.0%). Besides these two
districts, Keta Municipal and Ketu South have about 10 percent shares of mobile phone
ownership in the region. All the other districts have figures below 10 percent, while Nkwanta
North reported just 1.2 percent.
Table 6.5: Distribution of the population 12 years and older with
mobile phones by District and locality of residence
District
All localities
Urban
Rural
Number Percent Number Percent Number Percent
All districts 540,623 100.0
264,443 100.0
276,180 100.0
South Tongu 23,263 4.3
5,230 2.0
18,033 6.5
Keta Municipal 44,334 8.2
27,512 10.4
16,822 6.1
Ketu South 50,341 9.3
28,871 10.9
21,470 7.8
Ketu North 25,564 4.7
11,256 4.3
14,308 5.2
Akatsi 30,808 5.7
12,937 4.9
17,871 6.5
North Tongu 37,519 6.9
16,135 6.1
21,384 7.7
Adaklu Anyigbe 14,786 2.7
2,462 0.9
12,324 4.5
Ho Municipal 102,114 18.9
61,121 23.1
40,993 14.8
South Dayi 13,135 2.4
5,228 2.0
7,907 2.9
North Dayi 26,037 4.8
10,874 4.1
15,163 5.5
Hohoe Municipal 79,252 14.7
42,410 16
36,842 13.3
Biakoye 13,930 2.6
6,076 2.3
7,854 2.8
Jasikan 14,779 2.7
5,278 2.0
9,501 3.4
Kadjebi 10,720 2.0
4,396 1.7
6,324 2.3
Krachi East 16,009 3.0
7,109 2.7
8,900 3.2
Krachi West 16,711 3.1
5,550 2.1
11,161 4.0
Nkwanta South 15,544 2.9
8,835 3.3
6,709 2.4
Nkwanta North 5,777 1.1 3,163 1.2 2,614 0.9
Source: 2010 Population and Housing Census
Table 6.6 presents intra-district distribution of mobile phone ownership by locality of
residence. It shows that 52.1 percent of the urban population in the region own mobile phones
compared to only 29.3 percent of the rural population. At district level, over half of the urban
population 12 years and older in seven districts have mobile phones (Ho, South Tongu, Ketu
South, Akatsi, North Tongu, North Dayi, Hohoe). The proportion is highest in the rural areas
in South Dayi district (40.9%), followed by Ho (38.1%) and Ketu South (36.3%), while
Nkwanta North has the lowest proportion of mobile phone ownership in both urban and rural
areas.

60
Table 6.6: Distribution of population 12 years and older with
mobile phones by district and locality
District
Total urban
population
12+
Urban
population 12+ with
mobile
phones
Percentage
12+ urban
population with
mobile
phones
Total Rural
Population
12+
Rural
population 12+ with
mobile
phones
Percentage
12+ rural
population with
mobile
phones
All districts 507,111 264,443 52.1 941,966 276,180 29.3
South Tongu 8,113 5,230 64.5 50,942 18,033 35.4
Keta Municipal 57,182 27,512 48.1 48,702 16,822 34.5
Ketu South 50,842 28,871 56.8 59,163 21,470 36.3
Ketu North 24,633 11,256 45.7 44,737 14,308 32
Akatsi 22,771 12,937 56.8 66,275 17,871 27
North Tongu 31,036 16,135 52 71,762 21,384 29.8
Adaklu Anyigbe 4,969 2,462 49.5 40,155 12,324 30.7
Ho Municipal 91,907 61,121 66.5 107,712 40,993 38.1
South Dayi 12,431 5,228 42.1 19,348 7,907 40.9
North Dayi 21,241 10,874 51.2 44,952 15,163 33.7
Hohoe Municipal 75,258 42,410 56.4 108,003 36,842 34.1
Biakoye 15,118 6,076 40.2 29,094 7,854 27
Jasikan 11,470 5,278 46 29,171 9,501 32.6
Kadjebi 10,780 4,396 40.8 29,531 6,324 21.4
Krachi East 21,611 7,109 32.9 51,247 8,900 17.4
Krachi West 15,818 5,550 35.1 61,181 11,161 18.2
Nkwanta South 20,353 8,835 43.4 52,787 6,709 12.7
Nkwanta North 11,578 3,163 27.3 27,204 2,614 9.6 Source: 2010 Population and Housing Census
Table 6.7 examines mobile phone ownership by level of educational attainment and sex. It
indicates that the proportion of persons with mobile phones rises steadily with an increasing
level of education. The proportion of mobile phone ownership ranges from a low of 19.5
percent of individuals with no education to a high of 95.3 percent for those with tertiary
education. A similar pattern of ownership can be observed for the sexes. The table further
shows that females with vocational/technical/commercial, post-middle/secondary and post-
secondary diplomas are more likely to have mobile phones than their male counterparts with
the same levels of educational attainment.

61
Table 6.7: Percentage of population 12 years and older with mobile phones
by level of education and sex
Economic activity status
Population
12+
Population
12+ with
mobile
phone
Percentage
12+ with
mobile
phones
Male
population
12+
Male
population
12+ with
mobile
phones
Males 12+
percentage
with
mobile
phones
Female
population
12+
Female
population
12+ with
mobile
phones
Female
12+
percentage
with
mobile
phones
All levels of education 1,449,077 540,623 37.3 679,615 291,006 42.8 769,462 249,617 32.4
No education 392,520 76,488 19.5 130,356 30,652 23.5 262,164 45,836 17.5
Primary 289,332 61,531 21.3 134,389 28,843 21.5 154,943 32,688 21.1
JHS/Middle 528,328 232,268 44.0 270,007 125,804 46.6 258,321 106,464 41.2
Secondary/SSS/SHS 143,595 88,461 61.6 84,834 54,127 63.8 58,761 34,334 58.4
Vocational/Technical /Commercial
26,408 19,848 75.2 14,794 11,053 74.7 11,614 8,795 75.7
Post-middle/secondary
certificate 24,644 20,764 84.3 14,006 11,472 81.9 10,638 9,292 87.3
Post-secondary diploma 29,928 27,621 92.3 20,053 18,401 91.8 9,875 9,220 93.4
Tertiary 14,322 13,642 95.3 11,176 10,654 95.3 3,146 2,988 95.0
Source: 2010 Population and Housing Census
Mobile phone ownership by type of economic activity is shown in Table 6.8. There is not
much difference in the proportions of employed persons (45.3%) and unemployed persons
(47.9%) 12 years and older with mobile phones. The table also indicates that about one in
four of the economically not active population (which includes students) have mobile phones
Table 6.8: Percentage of population 12 years and older with mobile phones
by economic activity and sex
Source: 2010 Population and Housing Census
6.2 Number and Characteristics of Internet Facility Users
The internet has become a vital communication facility for people, businesses and
organizations. This section examines access to internet facilities in the region.
According to the 2010 Population and Housing Census, internet users amount to 50,644 or
3.5 percent of the region‟s total population of 1,449,077 persons 12 years and older. The
figure is far below the national average of 7.8 percent. Table 6.9 indicates a wide variation in
internet use by district. The share of internet facility users in the region ranges from a low of
0.9 percent for Krachi East and Kadjebi to a high of 39.4 percent in Ho Municipality. With
Economic Activity status
Population 12+
Population 12+ with
mobile phones
Percentage 12+ with
mobile phones
Male population
12+
Male population
12+ with mobile phones
Males 12+ percentage
with mobile phones
Female population
12+
Female population
12+ with mobile phone
Female 12+
percentage with
mobile phone
Total 1,449,077 540,623 37.3 679,615 291006 42.8 769,462 249,617 32.4
Employed 897,474 406,984 45.3 425,346 222931 52.4 472,128 184,053 39.0
Unemployed 33,700 16,151 47.9 14,974 7938 53.0 21,361 8,539 40.0
Not active 517,903 117,488 22.7 239,295 60137 25.1 275,973 57,025 20.7

62
the exception of Ho Municipality, all the other districts have higher proportions of males than
females using the internet. This observation may be a reflection of gender differences in
educational attainment and/or employment in the formal sector, both of which may be
associated with Internet use.
Table 6.9: Distribution of population 12 years and older using internet facilities
by District and sex
District
Both sexes Males Females
Number Percent Number Percent Number Percent
All districts 50,644 100 33,918 100 16,726 100
South Tongu 1,571 3.1 1,095 3.2 476 2.8
Keta Municipal 4,039 8.0 2,830 8.3 1,209 7.2 Ketu South 4,303 8.5 3,012 8.9 1,291 7.7
Ketu North 1,149 2.3 849 2.5 300 1.8
Akatsi 1,624 3.2 1,204 3.5 420 2.5
North Tongu 2,119 4.2 1,511 4.5 608 3.6
Adaklu Anyigbe 770 1.5 535 1.6 235 1.4
Ho Municipal 19,954 39.4 12,649 37.3 7,305 43.7
South Dayi 1,082 2.1 678 2.0 404 2.4
North Dayi 2,253 4.4 1,526 4.5 727 4.3
Hohoe Municipal 7,332 14.5 4,899 14.4 2,433 14.5
Biakoye 699 1.4 449 1.3 250 1.5
Jasikan 1,161 2.3 787 2.3 374 2.2 Kadjebi 438 0.9 321 0.9 117 0.7
Krachi East 471 0.9 361 1.1 110 0.7
Krachi West 626 1.2 452 1.3 174 1.0
Nkwanta South 861 1.7 619 1.8 242 1.4
Source: 2010 Population and Housing Census
Table 6.10 shows that the district with the largest proportion of internet facility users is Ho
(10.0%), followed by Hohoe (4.0%). Two other districts with figures higher than the regional
average of 3.5 percent of internet users are Keta Municipal and Ketu South (3.8% and 3.9%,
respectively). All the other districts have rates below 3 percent. Krachi East and Nkwanta
North have figures less than 1 percent (0.6% and 0.5%, respectively). With regard to the
sexes, the table shows that about twice as many males as females use internet facilities in the
region. Across all the districts, males are more likely than females to use internet facilities.
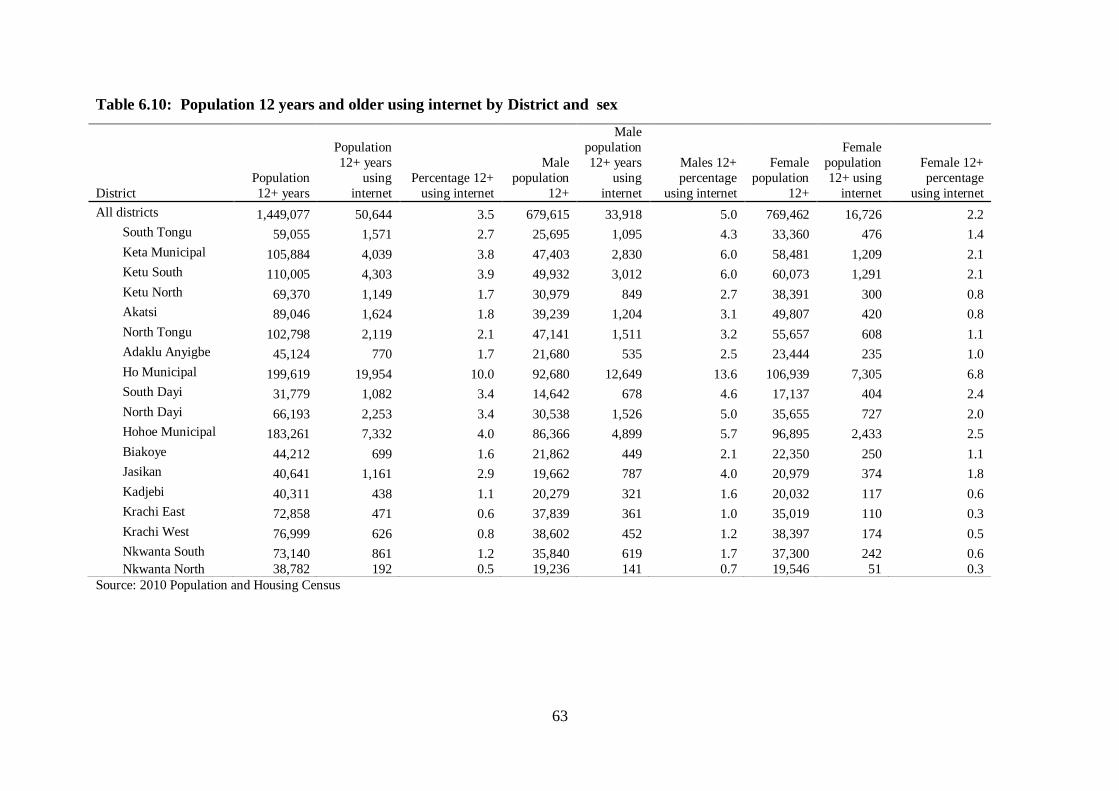
63
Table 6.10: Population 12 years and older using internet by District and sex
Source: 2010 Population and Housing Census
District
Population
12+ years
Population
12+ years
using
internet
Percentage 12+
using internet
Male
population
12+
Male
population
12+ years
using
internet
Males 12+
percentage
using internet
Female
population
12+
Female
population
12+ using
internet
Female 12+
percentage
using internet
All districts 1,449,077 50,644 3.5 679,615 33,918 5.0 769,462 16,726 2.2
South Tongu 59,055 1,571 2.7 25,695 1,095 4.3 33,360 476 1.4
Keta Municipal 105,884 4,039 3.8 47,403 2,830 6.0 58,481 1,209 2.1
Ketu South 110,005 4,303 3.9 49,932 3,012 6.0 60,073 1,291 2.1
Ketu North 69,370 1,149 1.7 30,979 849 2.7 38,391 300 0.8
Akatsi 89,046 1,624 1.8 39,239 1,204 3.1 49,807 420 0.8
North Tongu 102,798 2,119 2.1 47,141 1,511 3.2 55,657 608 1.1
Adaklu Anyigbe 45,124 770 1.7 21,680 535 2.5 23,444 235 1.0
Ho Municipal 199,619 19,954 10.0 92,680 12,649 13.6 106,939 7,305 6.8
South Dayi 31,779 1,082 3.4 14,642 678 4.6 17,137 404 2.4
North Dayi 66,193 2,253 3.4 30,538 1,526 5.0 35,655 727 2.0
Hohoe Municipal 183,261 7,332 4.0 86,366 4,899 5.7 96,895 2,433 2.5
Biakoye 44,212 699 1.6 21,862 449 2.1 22,350 250 1.1
Jasikan 40,641 1,161 2.9 19,662 787 4.0 20,979 374 1.8
Kadjebi 40,311 438 1.1 20,279 321 1.6 20,032 117 0.6
Krachi East 72,858 471 0.6 37,839 361 1.0 35,019 110 0.3
Krachi West 76,999 626 0.8 38,602 452 1.2 38,397 174 0.5
Nkwanta South 73,140 861 1.2 35,840 619 1.7 37,300 242 0.6
Nkwanta North 38,782 192 0.5 19,236 141 0.7 19,546 51 0.3
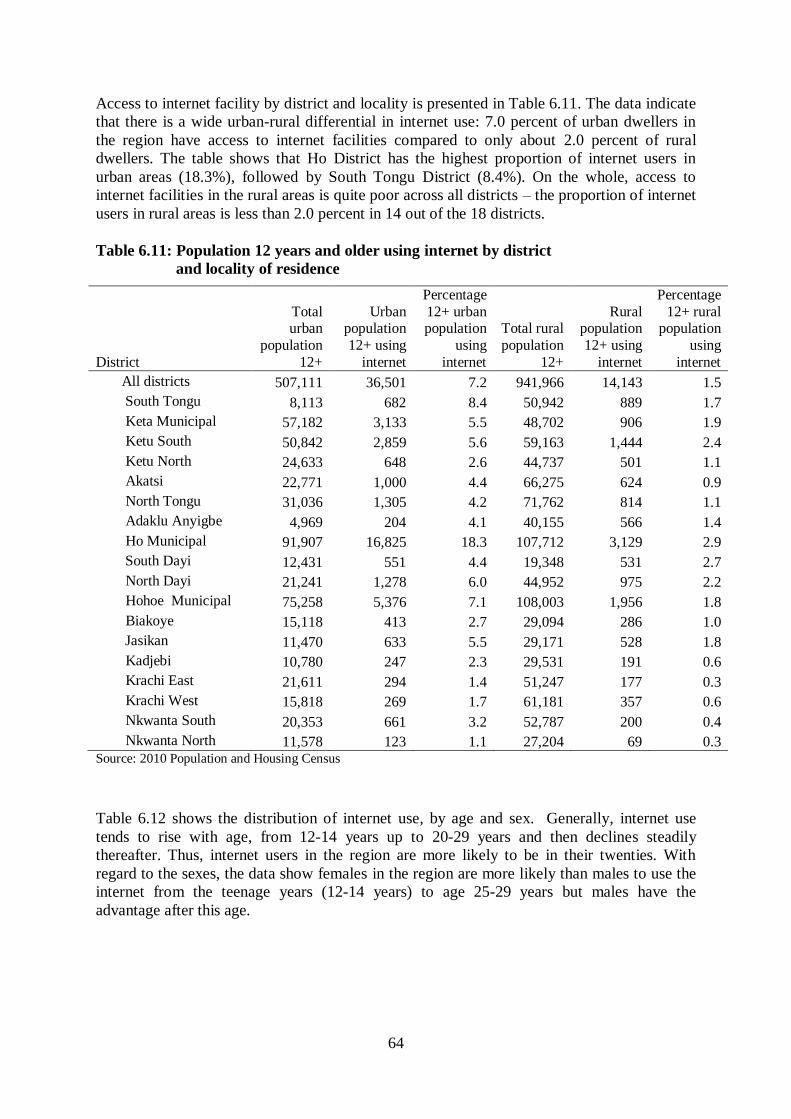
64
Access to internet facility by district and locality is presented in Table 6.11. The data indicate
that there is a wide urban-rural differential in internet use: 7.0 percent of urban dwellers in
the region have access to internet facilities compared to only about 2.0 percent of rural
dwellers. The table shows that Ho District has the highest proportion of internet users in
urban areas (18.3%), followed by South Tongu District (8.4%). On the whole, access to
internet facilities in the rural areas is quite poor across all districts – the proportion of internet
users in rural areas is less than 2.0 percent in 14 out of the 18 districts.
Table 6.11: Population 12 years and older using internet by district
and locality of residence
District
Total urban
population
12+
Urban population
12+ using
internet
Percentage
12+ urban population
using
internet
Total rural
population
12+
Rural population
12+ using
internet
Percentage
12+ rural population
using
internet
All districts 507,111 36,501 7.2 941,966 14,143 1.5
South Tongu 8,113 682 8.4 50,942 889 1.7
Keta Municipal 57,182 3,133 5.5 48,702 906 1.9
Ketu South 50,842 2,859 5.6 59,163 1,444 2.4
Ketu North 24,633 648 2.6 44,737 501 1.1
Akatsi 22,771 1,000 4.4 66,275 624 0.9
North Tongu 31,036 1,305 4.2 71,762 814 1.1
Adaklu Anyigbe 4,969 204 4.1 40,155 566 1.4
Ho Municipal 91,907 16,825 18.3 107,712 3,129 2.9
South Dayi 12,431 551 4.4 19,348 531 2.7
North Dayi 21,241 1,278 6.0 44,952 975 2.2
Hohoe Municipal 75,258 5,376 7.1 108,003 1,956 1.8
Biakoye 15,118 413 2.7 29,094 286 1.0
Jasikan 11,470 633 5.5 29,171 528 1.8
Kadjebi 10,780 247 2.3 29,531 191 0.6
Krachi East 21,611 294 1.4 51,247 177 0.3
Krachi West 15,818 269 1.7 61,181 357 0.6
Nkwanta South 20,353 661 3.2 52,787 200 0.4
Nkwanta North 11,578 123 1.1 27,204 69 0.3 Source: 2010 Population and Housing Census
Table 6.12 shows the distribution of internet use, by age and sex. Generally, internet use
tends to rise with age, from 12-14 years up to 20-29 years and then declines steadily
thereafter. Thus, internet users in the region are more likely to be in their twenties. With
regard to the sexes, the data show females in the region are more likely than males to use the
internet from the teenage years (12-14 years) to age 25-29 years but males have the
advantage after this age.
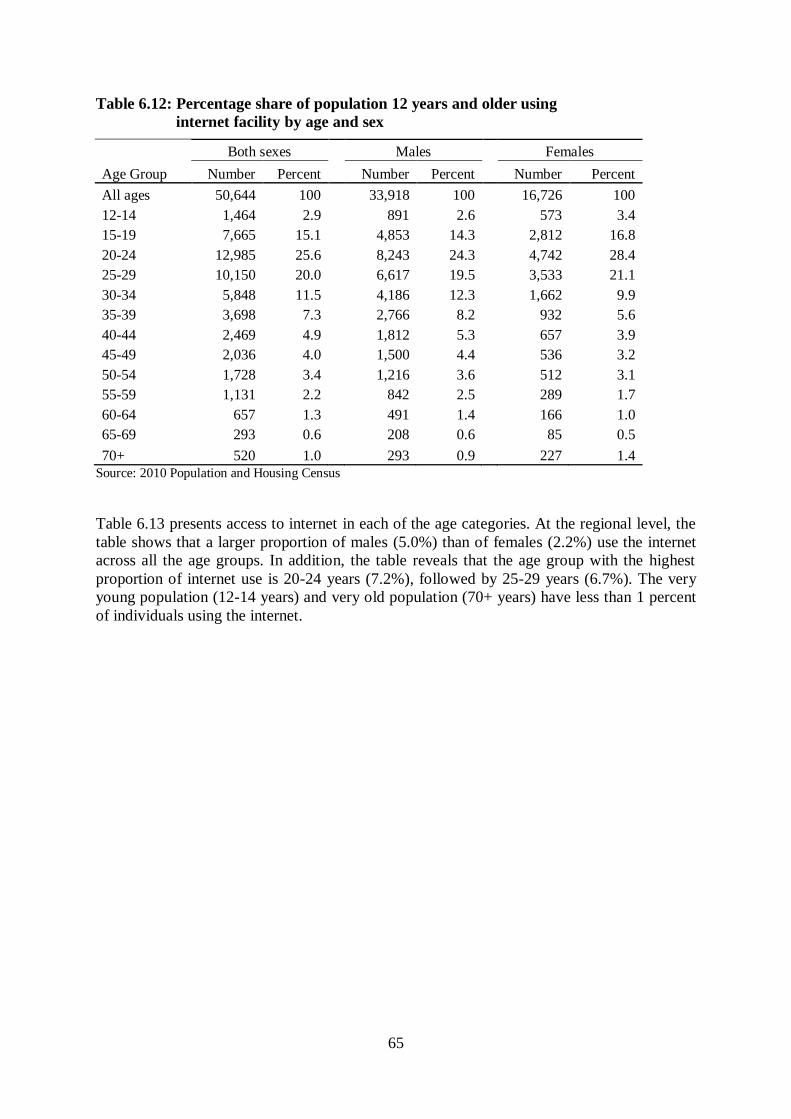
65
Table 6.12: Percentage share of population 12 years and older using
internet facility by age and sex
Age Group
Both sexes Males Females
Number Percent Number Percent Number Percent
All ages 50,644 100 33,918 100 16,726 100
12-14 1,464 2.9 891 2.6 573 3.4
15-19 7,665 15.1 4,853 14.3 2,812 16.8
20-24 12,985 25.6 8,243 24.3 4,742 28.4
25-29 10,150 20.0 6,617 19.5 3,533 21.1
30-34 5,848 11.5 4,186 12.3 1,662 9.9
35-39 3,698 7.3 2,766 8.2 932 5.6
40-44 2,469 4.9 1,812 5.3 657 3.9
45-49 2,036 4.0 1,500 4.4 536 3.2
50-54 1,728 3.4 1,216 3.6 512 3.1
55-59 1,131 2.2 842 2.5 289 1.7
60-64 657 1.3 491 1.4 166 1.0
65-69 293 0.6 208 0.6 85 0.5
70+ 520 1.0 293 0.9 227 1.4
Source: 2010 Population and Housing Census
Table 6.13 presents access to internet in each of the age categories. At the regional level, the
table shows that a larger proportion of males (5.0%) than of females (2.2%) use the internet
across all the age groups. In addition, the table reveals that the age group with the highest
proportion of internet use is 20-24 years (7.2%), followed by 25-29 years (6.7%). The very
young population (12-14 years) and very old population (70+ years) have less than 1 percent
of individuals using the internet.

66
Table 6.13: Percentage of population 12 years and older using internet by age and sex
Source: 2010 Population and Housing Census
Age
group
Population
12+ by
age group
Population
12+ using
internet
Percentage
12+ using
internet
Male
population
12 +
Male
population
12+ using
internet
Male 12+
percentage
using
internet
Female
population
12+
Female
population
12+ using
internet
Female 12+
percentage
using
internet
All ages 1,449,077 50,644 3.5 679,615 33,918 5.0 769,462 16,726 2.2
12-14 143,650 1,464 1.0 74,176 891 1.2 69,474 573 0.8
15-19 222,553 7,665 3.4 115,697 4,853 4.2 106,856 2,812 2.6
20-24 179,449 12,985 7.2 86,049 8,243 9.6 93,400 4,742 5.1
25-29 152,521 10,150 6.7 68,834 6,617 9.6 83,687 3,533 4.2
30-34 128,752 5,848 4.5 58,483 4,186 7.2 70,269 1,662 2.4
35-39 113,090 3,698 3.3 52,204 2,766 5.3 60,886 932 1.5
40-44 101,280 2,469 2.4 46,289 1,812 3.9 54,991 657 1.2
45-49 87,382 2,036 2.3 40,158 1,500 3.7 47,224 536 1.1
50-54 80,340 1,728 2.2 36,811 1,216 3.3 43,529 512 1.2
55-59 52,416 1,131 2.2 24,254 842 3.5 28,162 289 1.0
60-64 50,287 657 1.3 22,584 491 2.2 27,703 166 0.6
65-69 32,362 293 0.9 14,273 208 1.5 18,089 85 0.5
70+ 104,995 520 0.5 39,803 293 0.7 65,192 227 0.3

67
Table 6.14 presents information on internet use by economic activity status and sex. Contrary
to expectation, the employed have the lowest proportion of its population (3.1%) using the
internet compared to the unemployed (7.3%) and the not economically active (4.0%). A
possible explanation for this observation may be that the unemployed and economically not
active, which include educated individuals and students respectively, may be using the
internet for job searches and social networking more than the employed.
Table 6.14: Population 12 years and older using internet by economic
activity status and sex
Economic
Population 12+ by age
group
Population 12+
using internet
Popu-lation
12+ using
internet (%)
Male Popu-
lation 12+
Male population 12+ using
internet
Males 12+
using internet
(%)
Female population
12+
Female popu-lation
12+ using
internet
Female 12+
using internet
(%)
All activities 1,449,077 50,644 3.5 679,615 33,918 5.0 769,462 16,726 2.2
Employed 897,474 27,423 3.1 425,346 19,187 4.5 472,128 8,236 1.7
Unemployed 33,700 2,460 7.3 14,974 1,698 11.3 18,726 762 4.1
Not active 517,903 20,761 4.0 239,295 13,033 5.4 278,608 7,728 2.8
Source: 2010 Population and Housing Census
6.3 Household Ownership of Desktop/Laptop Computer
Ownership of desktop and laptop computers is essential for easy access to the internet,
electronic mail (e-mail), and other services. The 2010 census results show that only about 3
percent of all households own desktop/laptop computers in the Volta Region, compared to
7.2 percent of all households in Ghana.
Table 6.15 shows the distribution of households with desktop/laptop computers by district
and sex of household head. Ho Municipality stands out as the district with the highest share
of households with the facility in the region (36.1%), followed by Hohoe (15.9%). Nkwanta
North has the lowest share of households with desktop/laptop computers with less than 1
percent having the facility (0.5%). With regard to the sexes, ownership of desktop/laptop
computers is higher for female household heads compared to male household heads in South
Tongu, Keta Municipal, Ketu North, Ho, and South Dayi districts.

68
Table 6.15: Households owning desktop/laptop by district
and sex of household head
District
Both sexes Male Female
Number Percent Number Percent Number Percent
All districts 15,054 100.0 11,313 100.0 3,741 100.0
South Tongu 549 3.6 409 3.6 140 3.7
Keta Municipal 1,109 7.4 773 6.8 336 9.0
Ketu South 946 6.3 716 6.3 230 6.1
Ketu North 375 2.5 275 2.4 100 2.7
Akatsi 572 3.8 441 3.9 131 3.5
North Tongu 646 4.3 492 4.3 154 4.1
Adaklu Anyigbe 234 1.6 192 1.7 42 1.1
Ho Municipal 5,439 36.1 3,981 35.2 1,458 39.0
South Dayi 407 2.7 281 2.5 126 3.4
North Dayi 732 4.9 564 5.0 168 4.5
Hohoe Municipal 2,392 15.9 1,821 16.1 571 15.3
Biakoye 191 1.3 160 1.4 31 0.8
Jasikan 274 1.8 200 1.8 74 2.0
Kadjebi 240 1.6 198 1.8 42 1.1
Krachi East 296 2.0 270 2.4 26 0.7
Krachi West 243 1.6 195 1.7 48 1.3
Nkwanta South 336 2.2 287 2.5 49 1.3
Nkwanta North 73 0.5 58 0.5 15 0.4
Source: 2010 Population and Housing Census
Table 6.16 presents household ownership of desktop/laptop computers within the individual
districts. It indicates that Ho Municipality has the highest proportion of households with
desktop/laptop computers (7.4%). The other districts with proportions higher than the
regional average are South Dayi (3.8%), North Dayi (3.1%) and Hohoe Municipal (3.6%).
The lowest proportion is in the Nkwanta North District, which has less than 1 percent of its
households with access to the facility (0.7%).

69
Table 6.16: Percentage of households with desktop/laptop by district
District Total
Households Households with
desktop/laptop % with
desktop/laptop
All districts 495,603 15,054 3.0
South Tongu 20,509 549 2.7
Keta Municipal 37,705 1,109 2.9
Ketu South 39,119 946 2.4
Ketu North 26,437 375 1.4
Akatsi 33,762 572 1.7
North Tongu 31,573 646 2.0
Adaklu Anyigbe 13,109 234 1.8
Ho Municipal 73,703 5,439 7.4
South Dayi 10,761 407 3.8
North Dayi 23,669 732 3.1
Hohoe Municipal 65,858 2,392 3.6
Biakoye 15,226 191 1.3
Jasikan 14,034 274 2.0
Kadjebi 13,303 240 1.8
Krachi East 22,289 296 1.3
Krachi West 21,824 243 1.1
Nkwanta South 22,733 336 1.5
Nkwanta North 9,989 73 0.7 Source: 2010 Population and Housing Census

70
CHAPTER SEVEN
EDUCATION AND LITERACY
7.1 Introduction
The acquisition of knowledge and skills through education is essential for the development of
the requisite human resources needed for accelerated socio-economic development. The
government and development partners over the years have made significant efforts to
improve equitable access to quality education at all levels.
This chapter presents information on the current levels of educational attainment in the Volta
Region. The chapter is divided into three sections: literacy, school attendance (current and
past), and educational attainment by economic activity status, occupation, and employment
status.
7.2 Literacy
Literacy is defined as the ability to read and write in any language with understanding. It is an
indicator of the extent to which societal knowledge can be transmitted from generation to
generation in written form. Thus, literacy is important for the development of the individual
and society. The 2010 Population and Housing Census collected information from persons
aged 15 years and older on literacy in three languages; Ghanaian languages, English (the
official language), and French.
Table 7.1 presents the distribution of literacy levels for persons 15 years and older by sex and
district. For the region as a whole, 29.3 percent of the population are illiterate, 9.0 percent are
literate in English, and 11.7 percent are literate in a Ghanaian language, while 48.7 percent
are literate in both English and a Ghanaian language. It is also observed that less than 1
percent of the population are literate in English and French, as well as all the three languages
(English, French and a Ghanaian language). A higher proportion of females are illiterate
(19.7%) than males (9.6%) but only a slightly higher proportion of males (26.9%) than
females (26.8%) is literate in both English and a Ghanaian language.
At the district level, the table indicates that Ho Municipality has the lowest illiteracy rate
(12.4%), followed by Hohoe (13.6%) and South Dayi (19.0%). The highest illiteracy levels
are found in Nkwanta North (74.2%), Krachi West (58.8%), Nkwanta South (52.8%) and
Krachi East (50.9%). For the sexes, Ho, North Dayi, South Dayi, and Hohoe have relatively
low illiteracy levels for males (ranging from 3.2% to 4.7%) and females (from 9.1% to
13.5%), while the two Krachi districts and the two Nkwanta districts have very high male and
female illiteracy rates (ranging from 21.1% to 32.5% and from 28.1% to 41.7% respectively).

71
Table 7.1: Literacy levels for persons 15 years and older by district
Total
Not literate
English only
Ghanaian language only
Total Male Female Total Male Female Total Male Female Total Male Female
All districts 1,305,427 46.4 53.6
29.3 9.6 19.7
9.0 4.6 4.5
11.7 4.7 7.1
South Tongu 52,893 42.8 57.2
29.5 6.8 22.7
7.9 3.4 4.4
12.2 4.8 7.4
Keta Municipal 96,558 44.0 56.0
27.7 6.4 21.3
4.1 1.8 2.4
13.8 6.0 7.8
Ketu South 100,044 44.9 55.1
31.0 8.0 23.0
7.7 3.8 3.9
9.3 4.0 5.3
Ketu North 62,790 43.8 56.2
34.0 8.0 26.1
4.7 2.0 2.6
12.4 5.8 6.6
Akatsi 80,059 43.2 56.8
34.1 8.3 25.8
3.0 1.4 1.7
12.6 5.7 6.9
North Tongu 92,036 45.4 54.6
29.8 8.5 21.2
8.0 3.8 4.2
11.8 5.0 6.8
Adaklu Anyigbe 40,635 47.6 52.4
23.8 7.6 16.2
4.8 2.5 2.4
17.1 7.4 9.7
Ho Municipal 182,444 46.1 53.9
12.4 3.2 9.1
6.8 3.2 3.6
16.1 5.7 10.4
South Dayi 28,483 45.6 54.4
19.0 5.5 13.5
7.9 3.6 4.3
14.2 5.1 9.1
North Dayi 59,736 45.6 54.4
16.2 4.7 11.5
8.3 3.9 4.4
15.4 5.2 10.2
Hohoe Municipal 165,542 46.7 53.3
13.6 4.1 9.5
7.5 3.5 3.9
16.4 5.7 10.7
Biakoye 39,417 48.9 51.1
26.2 9.4 16.7
15.1 7.7 7.4
10.2 4.3 5.9
Jasikan 36,802 48.1 51.9
25.5 8.4 17.1
16.2 8.2 8.0
10.4 4.0 6.4
Kadjebi 36,125 50.0 50.0
29.4 10.2 19.2
14.2 7.9 6.3
8.3 3.6 4.7
Krachi East 64,589 51.6 48.4
50.9 22.8 28.1
18.6 10.1 8.4
4.8 2.5 2.3
Krachi West 68,038 49.6 50.4
58.8 25.3 33.5
17.1 9.5 7.6
2.7 1.4 1.3
Nkwanta South 64,832 48.7 51.3
52.8 21.1 31.7
14.7 8.0 6.6
3.5 1.6 1.9
Nkwanta North 34,404 48.9 51.1 74.2 32.5 41.7 15.9 9.9 6.0 1.5 0.8 0.7
English and Ghanaian
language
English and French
English French and Ghanaian Language
Other
Total Male Female Total Male Female Total Male Female Total Male Female
All districts 48.7 26.8 21.9
0.4 0.2 0.1
0.9 0.6 0.3
0.0 0.0 0.0
South Tongu 49.7 27.4 22.3
0.2 0.1 0.1
0.5 0.3 0.3
0.0 0.0 0.0
Keta Municipal 53.5 29.3 24.2
0.2 0.1 0.1
0.8 0.5 0.3
0.0 0.0 0.0
Ketu South 49.3 27.4 21.9
1.0 0.6 0.4
1.7 1.1 0.6
0.0 0.0 0.0
Ketu North 48.2 27.5 20.7
0.2 0.1 0.0
0.5 0.4 0.2
0.0 0.0 0.0
Akatsi 49.6 27.4 22.2
0.2 0.1 0.1
0.5 0.3 0.2
0.0 0.0 0.0
North Tongu 49.9 27.8 22.1
0.1 0.1 0.1
0.4 0.2 0.2
0.0 0.0 0.0
Adaklu Anyigbe 52.6 28.9 23.6
0.5 0.3 0.2
1.3 0.9 0.3
0.0 0.0 0.0
Ho Municipal 62.9 32.8 30.1
0.4 0.2 0.2
1.5 1.0 0.5
0.0 0.0 0.0
South Dayi 58.1 30.9 27.2
0.2 0.1 0.1
0.6 0.4 0.2
0.0 0.0 0.0
North Dayi 59.0 31.1 27.9
0.3 0.2 0.2
0.8 0.5 0.3
0.0 0.0 0.0 Hohoe Municipal 60.8 32.2 28.6
0.4 0.3 0.2
1.3 0.9 0.4
0.0 0.0 0.0
Biakoye 47.7 26.9 20.8
0.4 0.2 0.1
0.5 0.3 0.2
0.0 0.0 0.0
Jasikan 46.2 26.3 19.9
0.8 0.5 0.2
0.9 0.7 0.2
0.0 0.0 0.0
Kadjebi 46.1 27.0 19.2
0.9 0.6 0.3
1.1 0.8 0.3
0.0 0.0 0.0
Krachi East 25.1 15.6 9.5
0.4 0.3 0.1
0.3 0.3 0.1
0.0 0.0 0.0
Krachi West 21.1 13.2 7.9
0.1 0.1 0.0
0.1 0.1 0.0
0.0 0.0 0.0
Nkwanta South 28.3 17.4 10.9
0.3 0.2 0.1
0.4 0.3 0.1
0.0 0.0 0.0
Nkwanta North 7.9 5.4 2.5 0.2 0.2 0.0 0.3 0.2 0.1 0.0 0.0 0.0
Source: 2010 Population and Housing Census
Literacy allows people to gain access to information which enhances their understanding of
issues pertaining to their lives and society at large. A literate household head therefore has the
capacity to make informed decision concerning his or her family as well as contribute to
overall development of his/her community. Table 7.2 shows age-sex specific literacy rates
among heads of household in the region. Generally, the table shows a curvilinear relationship

72
between age of household head and literacy rate. Literacy rates increase from age 11-19 years
up to age 50-59 years and then decline. With regard to the sexes, the overall literacy rate for
male household heads (32.5%) is substantially higher than that of the female household heads
(13.4%). In fact, the literacy rates for female household heads are lower across all the age
groups.
Table 7.2: Age-specific literacy rates among literate heads of households, by sex
Age group
Population 11 years +
Literate heads Age-specific literacy
rates
Total Male Female
Total Male Female
Total
Male Female
All Ages 1,492,538 702,162 790,376 333,820 227,927 105,893 22.4 32.5 13.4
11-19 409,664 212,420 197,244 6,526 4,085 2,441 1.6 1.9 1.2
20 - 29 331,970 154,883 177,087 59,166 39,269 19,897 17.8 25.4 11.2
30 - 39 241,842 110,687 131,155 80,053 58,018 22,035 33.1 52.4 16.8
40 - 49 188,662 86,447 102,215 72,949 50,283 226,66 38.7 58.2 22.2
50 - 59 132,756 61,065 71,691 58,165 37,816 20,349 43.8 61.9 28.4
60 - 69 82,649 36,857 45,792 32,768 21,644 11,124 39.6 58.7 24.3
70 - 99 104,995 39,803 65,192 24,193 16,812 7,381 23 42.2 11.3
Source: 2010 Population and Housing Census
7.3 Past School Attendance
Information on past school attendance provides an indication of formal schooling in society.
In a society where few people have attended formal school in the past, there will be few
people with the requisite knowledge and skills needed for social and economic development.
Table 7.3 shows the distribution of past school attendance for persons aged 6 years and older
classified by highest level of schooling and district. For the region as a whole, the majority of
people who have attended school previously (55.2%) have attained at least the basic level that
is, middle/JSS/JHS. In fact, more than one-fifth of the population in all the districts attained
at least the primary level, except Hohoe, South Dayi, North Dayi and Ho. Three districts with
substantially high proportions of their population reaching primary level are Krachi East
(34.2%), Nkwanta North (45.4%) and Ketu North (30.4%). In Nkwanta South and Nkwanta
North the level reached by the highest proportion (26.5% and 45.4% respectively) is primary.
In three out of the 18 districts (Nkwanta North, Nkwanta South, and Ho Municipality) about
one out of 10 of their population 6 years and older attained secondary/high school as the
highest level. The proportion of the population attaining higher levels of education beyond
the basic is low for the region and all the districts. For example, only 1.3 percent and 0.3
percent of the population in the region have had undergraduate university education and post-
graduate education respectively.
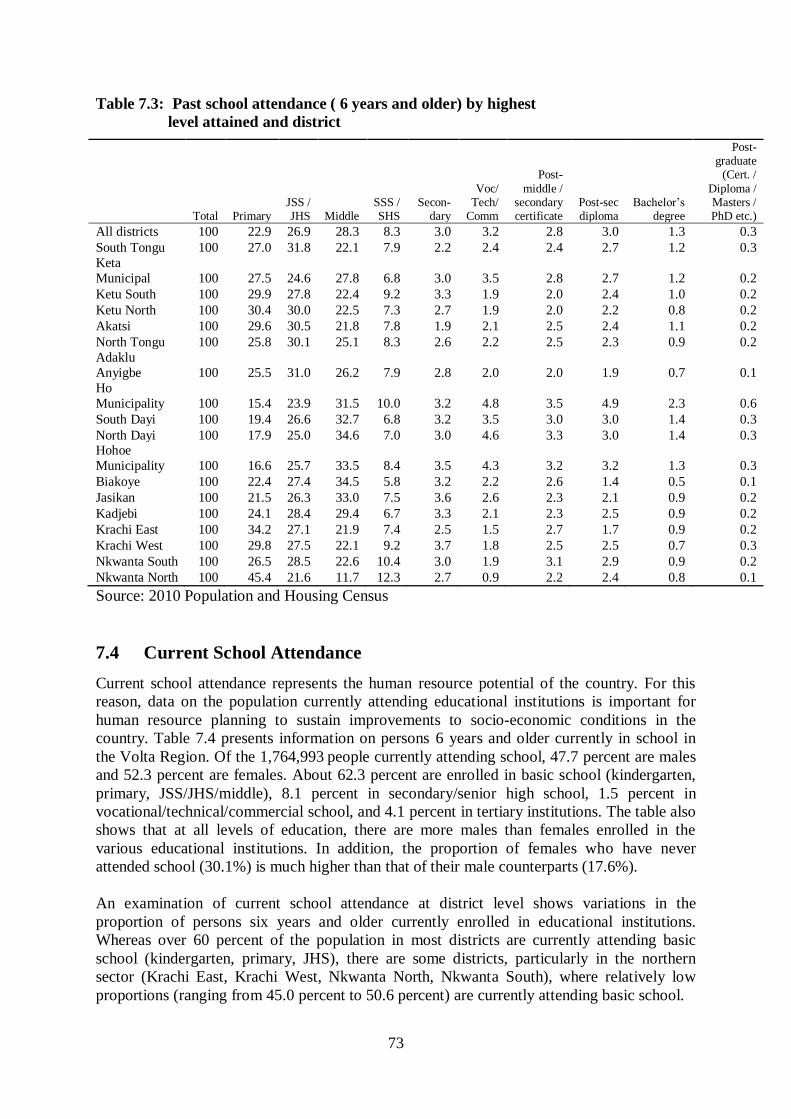
73
Table 7.3: Past school attendance ( 6 years and older) by highest
level attained and district
Total Primary JSS / JHS Middle
SSS / SHS
Secon-dary
Voc/ Tech/
Comm
Post-
middle / secondary certificate
Post-sec diploma
Bachelor‟s degree
Post-graduate
(Cert. /
Diploma / Masters / PhD etc.)
All districts 100 22.9 26.9 28.3 8.3 3.0 3.2 2.8 3.0 1.3 0.3
South Tongu 100 27.0 31.8 22.1 7.9 2.2 2.4 2.4 2.7 1.2 0.3
Keta
Municipal 100 27.5 24.6 27.8 6.8 3.0 3.5 2.8 2.7 1.2 0.2
Ketu South 100 29.9 27.8 22.4 9.2 3.3 1.9 2.0 2.4 1.0 0.2
Ketu North 100 30.4 30.0 22.5 7.3 2.7 1.9 2.0 2.2 0.8 0.2
Akatsi 100 29.6 30.5 21.8 7.8 1.9 2.1 2.5 2.4 1.1 0.2
North Tongu 100 25.8 30.1 25.1 8.3 2.6 2.2 2.5 2.3 0.9 0.2
Adaklu
Anyigbe 100 25.5 31.0 26.2 7.9 2.8 2.0 2.0 1.9 0.7 0.1
Ho
Municipality 100 15.4 23.9 31.5 10.0 3.2 4.8 3.5 4.9 2.3 0.6
South Dayi 100 19.4 26.6 32.7 6.8 3.2 3.5 3.0 3.0 1.4 0.3
North Dayi 100 17.9 25.0 34.6 7.0 3.0 4.6 3.3 3.0 1.4 0.3 Hohoe
Municipality 100 16.6 25.7 33.5 8.4 3.5 4.3 3.2 3.2 1.3 0.3
Biakoye 100 22.4 27.4 34.5 5.8 3.2 2.2 2.6 1.4 0.5 0.1
Jasikan 100 21.5 26.3 33.0 7.5 3.6 2.6 2.3 2.1 0.9 0.2
Kadjebi 100 24.1 28.4 29.4 6.7 3.3 2.1 2.3 2.5 0.9 0.2
Krachi East 100 34.2 27.1 21.9 7.4 2.5 1.5 2.7 1.7 0.9 0.2
Krachi West 100 29.8 27.5 22.1 9.2 3.7 1.8 2.5 2.5 0.7 0.3
Nkwanta South 100 26.5 28.5 22.6 10.4 3.0 1.9 3.1 2.9 0.9 0.2
Nkwanta North 100 45.4 21.6 11.7 12.3 2.7 0.9 2.2 2.4 0.8 0.1
Source: 2010 Population and Housing Census
7.4 Current School Attendance
Current school attendance represents the human resource potential of the country. For this
reason, data on the population currently attending educational institutions is important for
human resource planning to sustain improvements to socio-economic conditions in the
country. Table 7.4 presents information on persons 6 years and older currently in school in
the Volta Region. Of the 1,764,993 people currently attending school, 47.7 percent are males
and 52.3 percent are females. About 62.3 percent are enrolled in basic school (kindergarten,
primary, JSS/JHS/middle), 8.1 percent in secondary/senior high school, 1.5 percent in
vocational/technical/commercial school, and 4.1 percent in tertiary institutions. The table also
shows that at all levels of education, there are more males than females enrolled in the
various educational institutions. In addition, the proportion of females who have never
attended school (30.1%) is much higher than that of their male counterparts (17.6%).
An examination of current school attendance at district level shows variations in the
proportion of persons six years and older currently enrolled in educational institutions.
Whereas over 60 percent of the population in most districts are currently attending basic
school (kindergarten, primary, JHS), there are some districts, particularly in the northern
sector (Krachi East, Krachi West, Nkwanta North, Nkwanta South), where relatively low
proportions (ranging from 45.0 percent to 50.6 percent) are currently attending basic school.

74
Table 7.4: Current school attendance (6 years and older)
by highest level attained , sex and district
Total Never attended Basic Secondary Vocational/
Technical/ Commercial Tertiary
Total Male Female Total Male Female Total Male Female Total Male Female
Total Male Female
Total Male Female
All districts 1,764,993 841,205 923,788
24.1 17.6 30.1
62.3 65.2 59.7
8.1 10.1 6.4
1.5 1.8 1.3
4.1 5.4 2.6
South Tongu 72,434 32,359 40,075
23.2 13.2 31.3
65.7 71.1 61.3
6.7 9.1 4.8
1.2 1.7 0.9
3.4 4.9 1.8
Keta Municipal 125,648 57,551 68,097
22.4 12.0 31.1
64.4 70.4 59.2
7.9 10.2 6.0
1.9 2.4 1.4
4.1 5.0 2.2
Ketu South 132,647 61,498 71,149
25.4 15.1 34.3
62.5 68.8 57.0
8.5 11.0 6.4
0.8 1.0 0.7
2.7 4.1 1.7
Ketu North 83,620 38,317 45,303
27.5 15.2 37.8
62.5 70.4 55.8
6.7 9.3 4.5
0.8 1.1 0.5
2.6 4.0 1.4
Akatsi 108,124 48,994 59,130
26.8 15.4 36.2
63.0 70.5 56.7
6.5 8.5 4.8
1.0 1.3 0.7
3.0 4.4 1.5
North Tongu 125,756 58,548 67,208
24.0 16.2 30.8
64.4 68.3 61.1
7.9 10.1 6.0
0.9 1.2 0.7
2.9 4.3 1.5
Adaklu Anyigbe 54,559 26,411 28,148
19.5 13.8 25.0
67.2 69.6 64.9
9.1 11.1 7.2
2.4 1.4 1.0
3.2 4.1 1.9
Ho Municipal 234,131 110,047 124,084
10.2 6.0 14.0
65.6 65.5 65.8
12.0 13.7 10.5
6.0 3.1 2.9
8.5 11.7 6.8
South Dayi 38,885 18,213 20,672
15.2 10.1 19.7
70.4 71.7 69.3
8.0 9.6 6.7
3.8 2.3 1.5
4.8 6.3 2.8
North Dayi 79,639 37,477 42,162
13.1 8.7 17.0
70.5 70.5 70.4
8.8 10.4 7.3
5.7 3.6 2.1
6.0 6.8 3.1
Hohoe Municipal 220,415 105,313 115,102
11.0 7.3 14.3
70.5 70.1 70.8
10.7 12.7 8.8
5.1 3.0 2.2
5.9 7.0 3.8
Biakoye 54,529 27,284 27,245
21.0 15.9 26.1
69.0 70.8 67.3
6.5 8.4 4.6
2.2 1.4 0.8
2.8 3.4 1.3
Jasikan 49,217 24,194 25,023
20.7 14.6 26.6
66.3 68.2 64.5
8.6 11.2 6.1
2.6 1.5 1.1
3.5 4.4 1.7
Kadjebi 49,418 24,898 24,520
22.5 15.7 29.4
66.7 70.2 63.2
7.0 9.0 5.0
1.8 1.1 0.8
3.0 4.0 1.6
Krachi East 93,351 48,600 44,751
42.2 37.8 47.0
50.6 52.6 48.5
4.8 6.3 3.3
0.7 0.5 0.3
1.9 2.9 0.9
Krachi West 98,027 49,749 48,278
47.8 42.2 53.7
45.0 48.2 41.7
5.3 6.9 3.6
0.9 0.6 0.3
1.6 2.2 0.6
Nkwanta South 93,979 46,460 47,519
41.5 34.4 48.5
50.1 54.2 46.2
5.9 8.0 3.9
1.0 0.6 0.3
1.9 2.9 1.1
Nkwanta North 50,614 25,292 25,322
63.7 57.6 69.7 32.4 36.4 28.4 3.2 4.7 1.6 0.2 0.1 0.1 0.7 1.1 0.2
Source: 2010 Population and Housing Census

75
7.5 Educational Attainment by Selected Economic Characteristics
Information on educational attainment by background characteristics indicates, among other
things, the extent to which persons have been trained to work in the various employment
sectors and occupations. Table 7.5 presents information on the economically active
population 15 years and older by employment status and level of educational attainment. The
overwhelming majority (72.5%) work in the informal sector as self-employed without
employees, followed by employees (11.2%) mainly in the formal sector (private and public).
As expected, the majority of informal sector workers have never attended school (81.8%) or
attained basic education (74.8%), while the majority of employees have attained tertiary
education (post-middle/secondary and above).
The proportion of formal sector employees is higher among males (16.0%) than females
(6.8%), while the reverse is case in the informal sector (68.1% males against 76.4% females).
At higher levels of education, the proportion of females working in the formal sector is high
and low in the informal sector.
Home-based activities (unpaid family work, apprenticeship, domestic work) provide
employment for 12.1 percent of the total workforce, with a relatively higher proportion for
females than males. It is noteworthy that the proportion does not change much at the
secondary/SSS level, which may be an indication of unemployment among persons even with
this level of educational attainment. This suggests the need to improve vocational and
technical education and training for the youth in the region.
Table 7.6 presents data on educational attainment by occupation of the economically active
population 15 years and older, by sex. It shows that 50.1 percent of persons at all levels of
education are in agriculture and related work, followed by craft and related work (17.6%) and
services and sales work (16.6%). These three occupational categories account for 84.3
percent of workers in the region. This is a clear indication of the low levels of education and
technical skills of the working population in the region.
Agricultural workers constitute a major proportion of individuals with no education (67.7%)
or only basic education (46.4%), while professional/technical and managerial workers feature
more prominently among persons with post-secondary and tertiary education. With the
exception of post-secondary and tertiary education, services and sales workers as well as
crafts and related trades workers feature in all the other levels of education. With regard to
the sexes, more males are found in agriculture and related occupations (56.9%) than females
(44.1%). On the other hand, more females are in services and sales (26.2%) than males
(6.0%) across all levels of education. The data also show that while a higher proportion of
managerial workers are males (14.5% against 11.2% female), a higher proportion of
professional/technical workers are females (68.2% female against 62.6% males).
Interestingly, a higher proportion of males are in clerical support work (1.2%) compared to
female (0.7%).

76
Table 7.5: Educational attainment, by employment status of economically active
population (15 years and older) by sex
Employment Status
Total
population
All
levels
Never
attended
Basic
school
Secondary/
SHS
Vocational/
Technical/
Commercial
Post- middle/
secondary
certificate
Post-
secondary
diploma
Degree
or higher
Both sexes
All sectors 875,003 100.0 100.0 100.0 100.0 100.0 100.0 100.0 100.0
Employee 97,719 11.2 2.3 4.9 25.6 26.2 72.9 79.3 88.5
Self-employed without employee(s) 634,261 72.5 81.8 74.8 56.1 62.5 22.3 14.7 7.2
Self-employed with employee(s) 24,700 2.8 2.1 2.3 3.9 5.2 2.0 3.1 2.9
Casual worker 12,724 1.5 1.1 1.8 2.0 1.6 0.5 0.8 0.4
Contributing family worker 86,003 9.8 11.3 13.2 10.6 3.5 1.9 1.6 0.7
Apprentice 13,606 1.6 0.7 2.2 1.1 0.6 0.1 0.1 0.0
Domestic employee (House help) 4,890 0.6 0.6 0.6 0.5 0.3 0.3 0.2 0.2
Other 1,100 0.1 0.1 0.1 0.1 0.1 0.1 0.2 0.2
Male
All sectors 412,747 100.0 100.0 100.0 100.0 100.0 100.0 100.0 100.0
Employee 66,232 16.0 3.9 8.1 27.3 26.4 68.8 76.6 87.6
Self-employed without employee(s) 281,070 68.1 81.1 70.1 55.3 61.7 26.0 16.8 7.8
Self-employed with employee(s) 13,946 3.4 2.7 2.7 4.1 5.9 2.2 3.6 3.3 Casual worker 8,397 2.0 1.5 2.8 2.4 2.1 0.6 1.0 0.4
Contributing family worker 34,757 8.4 9.5 13.3 9.5 2.9 1.9 1.5 0.5
Apprentice 5,611 1.4 0.6 2.3 0.9 0.5 0.1 0.1 0.0
Domestic employee (House help) 2,138 0.5 0.5 0.6 0.4 0.3 0.3 0.3 0.2
Other 596 0.1 0.1 0.2 0.1 0.1 0.1 0.2 0.2
Female
All sectors 462,256 100.0 100.0 100.0 100.0 100.0 100.0 100.0 100.0
Employee 31,487 6.8 1.4 2.6 22.6 25.9 78.7 85.0 91.8
Self-employed without employee(s) 353,191 76.4 82.2 78.3 57.5 63.5 17.1 10.3 5.0
Self-employed with employee(s) 10,754 2.3 1.8 2.0 3.7 4.3 1.6 2.1 1.2
Casual worker 4,327 0.9 0.9 1.1 1.4 0.9 0.3 0.4 0.4 Contributing family worker 51,246 11.1 12.2 13.0 12.6 4.2 1.8 1.6 1.1
Apprentice 7,995 1.7 0.8 2.2 1.6 0.9 0.2 0.1 0.0
Domestic employee (House help) 2,752 0.6 0.6 0.7 0.5 0.3 0.2 0.2 0.1
Other 504 0.1 0.1 0.1 0.1 0.0 0.0 0.1 0.3
Source: 2010 Population and Housing Census
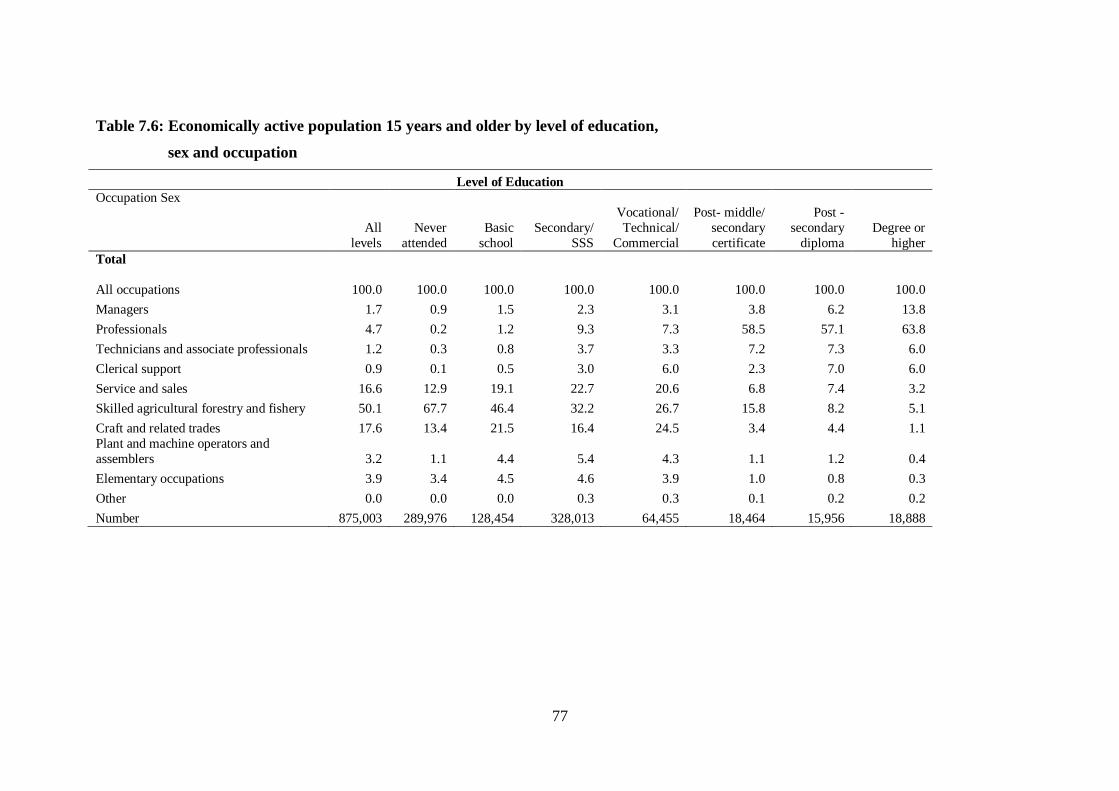
77
Table 7.6: Economically active population 15 years and older by level of education,
sex and occupation
Level of Education
Occupation Sex
All
levels
Never
attended
Basic
school
Secondary/
SSS
Vocational/
Technical/
Commercial
Post- middle/
secondary
certificate
Post -
secondary
diploma
Degree or
higher
Total
All occupations 100.0 100.0 100.0 100.0 100.0 100.0 100.0 100.0
Managers 1.7 0.9 1.5 2.3 3.1 3.8 6.2 13.8
Professionals 4.7 0.2 1.2 9.3 7.3 58.5 57.1 63.8
Technicians and associate professionals 1.2 0.3 0.8 3.7 3.3 7.2 7.3 6.0
Clerical support 0.9 0.1 0.5 3.0 6.0 2.3 7.0 6.0
Service and sales 16.6 12.9 19.1 22.7 20.6 6.8 7.4 3.2
Skilled agricultural forestry and fishery 50.1 67.7 46.4 32.2 26.7 15.8 8.2 5.1
Craft and related trades 17.6 13.4 21.5 16.4 24.5 3.4 4.4 1.1
Plant and machine operators and
assemblers 3.2 1.1 4.4 5.4 4.3 1.1 1.2 0.4
Elementary occupations 3.9 3.4 4.5 4.6 3.9 1.0 0.8 0.3
Other 0.0 0.0 0.0 0.3 0.3 0.1 0.2 0.2
Number 875,003 289,976 128,454 328,013 64,455 18,464 15,956 18,888

78
Table 7.6: Economically active population 15 years and older by level of education, sex and occupation Occupation Sex
All
levels
Never
attended
Basic
school
Secondary/
SSS
Vocational/
Technical/
Commercial
Post- middle/
secondary
certificate
Post-
secondary
diploma
Degree
or
higher
Male
All occupations 100.0 100.0 100.0 100.0 100.0 100.0 100.0 100.0
Managers 1.4 0.3 0.7 2.0 2.6 4.7 6.9 14.5
Professionals 6.1 0.2 1.3 9.3 7.4 54.8 54.0 62.6
Technicians and associate professionals 1.9 0.5 1.3 4.3 4.2 5.8 8.6 6.2
Clerical support 1.2 0.2 0.9 2.7 3.1 2.0 5.6 5.6
Service and sales 6.0 3.7 5.8 12.7 9.0 4.7 6.1 2.9 Skilled agricultural forestry and fishery 56.9 81.6 55.8 39.6 35.8 21.5 10.7 6.0
Craft and related trades 17.1 8.2 22.5 17.0 27.6 3.8 5.2 1.1
Plant and machine operators and assemblers 6.5 2.6 8.5 8.3 7.2 1.7 1.8 0.5
Elementary occupations 2.9 2.6 3.2 3.7 2.8 0.9 0.8 0.3
Other 0.1 0.0 0.0 0.4 0.4 0.1 0.2 0.2
Number 412,747 103,241 54,769 171,924 41,478 10,650 9,307 12,830
Source: 2010 Population and Housing Census
Female
All occupations 100.0 100.0 100.0 100.0 100.0 100.0 100.0 100.0
Managers 2.0 1.3 2.3 3.0 3.8 2.6 4.7 11.2
Professionals 3.4 0.3 1.2 9.4 7.2 63.7 63.7 68.2
Technicians and associate professionals 0.7 0.2 0.4 2.6 2.1 9.2 4.5 5.5
Clerical support 0.7 0.0 0.2 3.3 10.0 2.7 10.0 7.5
Service and sales 26.2 17.9 32.2 40.6 36.5 9.6 10.2 4.5
Skilled agricultural forestry and fishery 44.1 60.0 37.2 18.7 14.4 7.8 3.0 1.6
Craft and related trades 18.0 16.3 20.6 15.5 20.3 2.8 2.8 1.2
Plant and machine operators and
assemblers 0.2 0.2 0.3 0.4 0.3 0.2 0.1 0.0
Elementary occupations 4.8 3.9 5.7 6.2 5.3 1.3 0.8 0.3
Other 0.0 0.0 0.0 0.1 0.1 0.0 0.2 0.1
Number 462,256 186,735 73,685 156,089 22,977 7,814 6,649 6,058
79
CHAPTER EIGHT
FERTILITY, MORTALITY AND MIGRATION
8.1 Introduction
Fertility, mortality and migration are the three components of population change that
determine the size, age-sex composition and distribution of the population at a particular
point in time. Data on these three components are critical for planning the overall socio-
economic development of the region.
This chapter provides analysis of the fertility, mortality and migration patterns in the region
using data from the 2010 Population and Housing Census. However, since census data alone
cannot provide a complete picture of the demographic history of the region, other data
sources such as the Ghana Demographic and Health Survey (GDHS) are used in the analysis.
8.2 Fertility
Measures of fertility are important in determining the size and structure of the population.
Information on fertility in the region is, therefore, critical for the management of the
population for social and economic development. This section reports on fertility, levels,
patterns and trends.
8.2.1 Levels and patterns of fertility
Two types of fertility measures are used to examine levels and patterns of fertility. These are
current fertility measures and cumulative fertility measures. Current fertility measures such as
total fertility rate (TFR) are based on data covering a short period of time such as a year ( in
the case of population censuses) or five years (in surveys), while cumulative measures such
as mean children ever born are based on retrospective fertility data covering women‟s
reproductive performance over their lifetime.
8.2.2 Current fertility measures
The most commonly used measures of current fertility are the total fertility rate (TFR) and its
component age-specific fertility rates (ASFR). The TFR is defined as the number of children
a woman would have by the end of her childbearing years if she were to experience the
currently observed age-specific fertility rates.
Table 8.1 shows a total fertility rate for the Volta Region of 3.2 children per woman age 15-
49, which is slightly lower than the national average. This means that a woman living in the
region would have, on average, 3.2 children by the end of her reproductive period if the
current age-specific fertility rates continue to prevail.
Table 8.1 presents trends in TFR in the region derived from demographic surveys conducted
in Ghana over past decades, together with data from the 2010 census. The results indicate that
the region is experiencing a slow demographic transition, along with the rest of Ghana. This
is seen in the dramatic decline of the total fertility rate from 6.7 children per woman in the
1988 GDHS to 3.2 children in the 2010 census.

80
Table 8.1: Trends in total fertility rates, 1988-2010
Year Source TFR
Ghana 1988 GDHS 6.3
1993 GDHS 5.5
1998 GDHS 4.6 2000 Census 4.0
2003 GDHS 4.4
2008 GDHS 4.0 2010 Census 3.3
Volta Region
1988 GDHS 6.7 1993 GDHS 5.4
1998 GDHS 4.8
2000 Census 3.5 2003 GDHS 4.4
2008 GDHS 3.8
2010 Census 3.2
Sources: 1988,1993,1998,2000 and 2008 Ghana Demographic and Health Survey;
2000 and 2010 Population and Housing Census data
Table 8.2 shows marked variations in district fertility, ranging from a high of 3.93 children
per woman in Krachi East to a low of 2.65 children per woman in Ho Municipal. It is further
observed that four districts beside Ho Municipal have fertility rates below the regional
average. These districts are Keta Municipal (2.98), Ketu South (2.86), North Tongu (2.83),
and Adaklu Anyigbe (2.75).
Table 8.2: Total fertility rate, by district
District TFR
All districts 3.18
South Tongu 3.38
Keta Municipal 2.98
Ketu South 2.86
Ketu North 3.26
Akatsi 3.36
North Tongu 2.83
Adaklu Anyigbe 2.75
Ho Municipal 2.65
South Dayi 3.14
North Dayi 3.04
Hohoe Municipal 3.30
Biakoye 3.21
Jasikan 3.38
Kadjebi 3.41
Krachi East 3.93
Krachi West 3.43
Nkwanta South 3.73
Nkwanta North 3.21
Source: 2010 Population and Housing Census
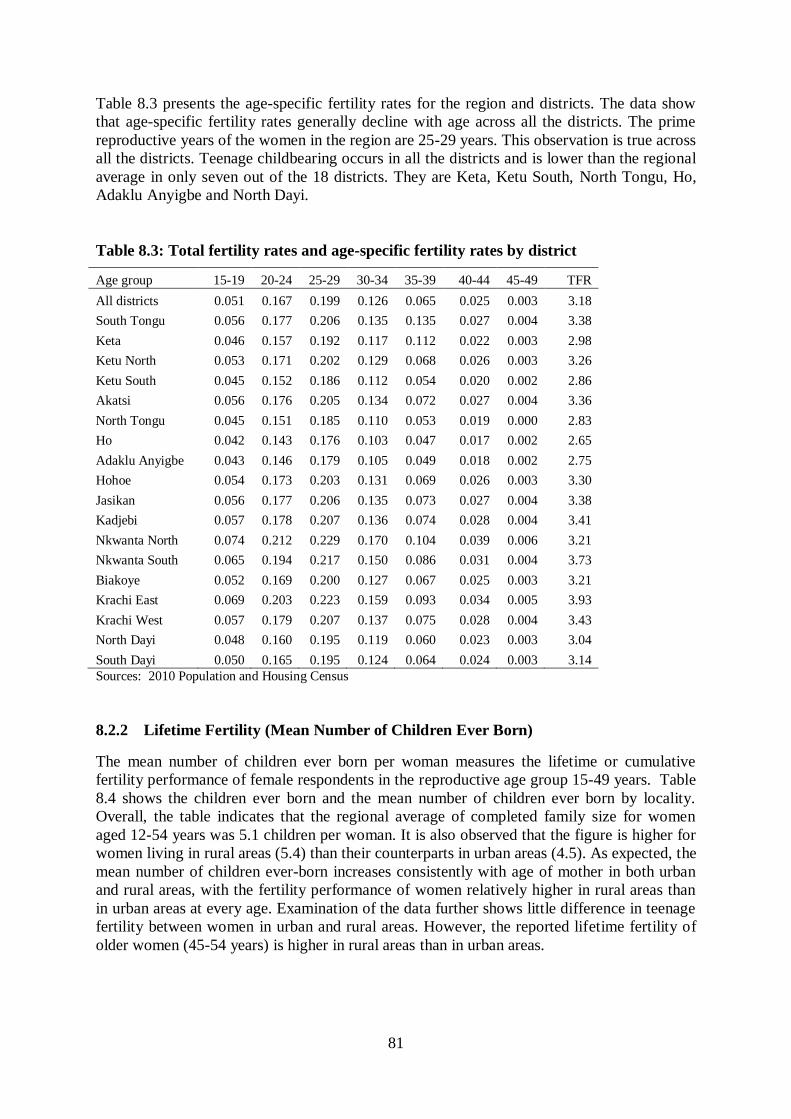
81
Table 8.3 presents the age-specific fertility rates for the region and districts. The data show
that age-specific fertility rates generally decline with age across all the districts. The prime
reproductive years of the women in the region are 25-29 years. This observation is true across
all the districts. Teenage childbearing occurs in all the districts and is lower than the regional
average in only seven out of the 18 districts. They are Keta, Ketu South, North Tongu, Ho,
Adaklu Anyigbe and North Dayi.
Table 8.3: Total fertility rates and age-specific fertility rates by district
Age group 15-19 20-24 25-29 30-34 35-39 40-44 45-49 TFR
All districts 0.051 0.167 0.199 0.126 0.065 0.025 0.003 3.18
South Tongu 0.056 0.177 0.206 0.135 0.135 0.027 0.004 3.38
Keta 0.046 0.157 0.192 0.117 0.112 0.022 0.003 2.98
Ketu North 0.053 0.171 0.202 0.129 0.068 0.026 0.003 3.26
Ketu South 0.045 0.152 0.186 0.112 0.054 0.020 0.002 2.86
Akatsi 0.056 0.176 0.205 0.134 0.072 0.027 0.004 3.36
North Tongu 0.045 0.151 0.185 0.110 0.053 0.019 0.000 2.83
Ho 0.042 0.143 0.176 0.103 0.047 0.017 0.002 2.65
Adaklu Anyigbe 0.043 0.146 0.179 0.105 0.049 0.018 0.002 2.75
Hohoe 0.054 0.173 0.203 0.131 0.069 0.026 0.003 3.30
Jasikan 0.056 0.177 0.206 0.135 0.073 0.027 0.004 3.38
Kadjebi 0.057 0.178 0.207 0.136 0.074 0.028 0.004 3.41
Nkwanta North 0.074 0.212 0.229 0.170 0.104 0.039 0.006 3.21
Nkwanta South 0.065 0.194 0.217 0.150 0.086 0.031 0.004 3.73
Biakoye 0.052 0.169 0.200 0.127 0.067 0.025 0.003 3.21
Krachi East 0.069 0.203 0.223 0.159 0.093 0.034 0.005 3.93
Krachi West 0.057 0.179 0.207 0.137 0.075 0.028 0.004 3.43
North Dayi 0.048 0.160 0.195 0.119 0.060 0.023 0.003 3.04
South Dayi 0.050 0.165 0.195 0.124 0.064 0.024 0.003 3.14
Sources: 2010 Population and Housing Census
8.2.2 Lifetime Fertility (Mean Number of Children Ever Born)
The mean number of children ever born per woman measures the lifetime or cumulative
fertility performance of female respondents in the reproductive age group 15-49 years. Table
8.4 shows the children ever born and the mean number of children ever born by locality.
Overall, the table indicates that the regional average of completed family size for women
aged 12-54 years was 5.1 children per woman. It is also observed that the figure is higher for
women living in rural areas (5.4) than their counterparts in urban areas (4.5). As expected, the
mean number of children ever-born increases consistently with age of mother in both urban
and rural areas, with the fertility performance of women relatively higher in rural areas than
in urban areas at every age. Examination of the data further shows little difference in teenage
fertility between women in urban and rural areas. However, the reported lifetime fertility of
older women (45-54 years) is higher in rural areas than in urban areas.

82
Table 8.4: Children ever born and mean children ever born by locality
Total Urban Rural
Age group
Children
ever born Mean
Children
ever born Mean
Children
ever born Mean
All ages 1,338,642 5.1 395,754 4.5 942,888 5.4
12 - 14 403 1.2 105 1.3 298 1.2
15 - 19 14,173 1.4 4,187 1.4 9,986 1.5
20 - 24 76,569 2.2 21,828 2.1 54,741 2.3
25 - 29 148,777 3.2 45,149 2.8 103,628 3.3
30 - 34 199,124 4.3 59,877 3.7 139,247 4.5
35 - 39 219,859 5.0 66,487 4.4 153,372 5.3
40 - 44 236,421 5.9 68,959 5.2 167,462 6.1
45 - 49 221,474 6.2 65,002 5.5 156,472 6.6
50 - 54 221,842 6.7 64,160 6.0 157,682 7.0
Source: 2010 Population and Housing Census
8.3 Mortality
Data on mortality provide an indication of the health status of the population as well as a
measure of the living conditions of the people. It also provides information on the potential
growth of the population in the future.
To reduce the prevailing high levels of mortality in Ghana, successive governments and
development agencies have made various interventions over the years, including enhancing
access to quality health care services, improving food security and improving environmental
conditions, among others. These initiatives have contributed to reducing mortality rates.
Nevertheless, factors that underlie high mortality levels in the country persist, such as the
prevalence of infectious and parasitic diseases, poor environmental sanitation and poor access
to good drinking water. There is, therefore, still room for further reductions of mortality. This
section examines levels and trends in infant and child mortality in the Volta Region.
8.3.1 Mortality Levels and Patterns: Infant and child mortality
The infant mortality rate is the probability of dying before the first birthday and under-five
mortality rate is the probability of dying before the fifth birthday. One of the Millennium
Development Goals (MDGs) is to reduce infant and under-five mortality. The specific
objective is to reduce under-five mortality by two-thirds between 1990 and 2015.
Consequently, the government and development agencies have been monitoring progress
towards the achievement of this goal.
Table 8.5 presents data on levels of infant and child mortality from the various rounds of the
Ghana Demographic and Health Survey (GDHS) and the 2006 Multiple Indicator Cluster
Survey (MICS). The data show high but declining infant and under-five mortality rates for
the country and Volta Region in the 2003 and 2008 GDHS. It is also observed that the
reported infant and under-five mortality rates for the region were sometimes better than the
national average.
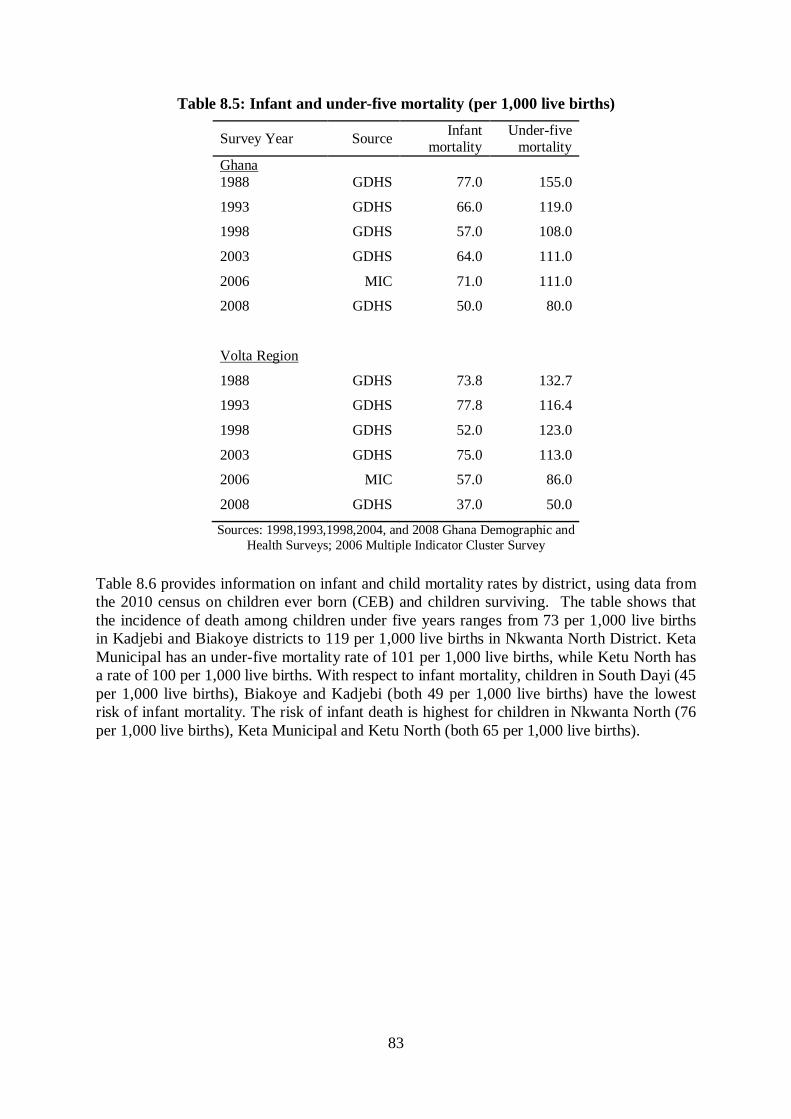
83
Table 8.5: Infant and under-five mortality (per 1,000 live births)
Survey Year Source Infant
mortality Under-five
mortality
Ghana
1988 GDHS 77.0 155.0
1993 GDHS 66.0 119.0
1998 GDHS 57.0 108.0
2003 GDHS 64.0 111.0
2006 MIC 71.0 111.0
2008 GDHS 50.0 80.0
Volta Region
1988 GDHS 73.8 132.7
1993 GDHS 77.8 116.4
1998 GDHS 52.0 123.0
2003 GDHS 75.0 113.0
2006 MIC 57.0 86.0
2008 GDHS 37.0 50.0
Sources: 1998,1993,1998,2004, and 2008 Ghana Demographic and
Health Surveys; 2006 Multiple Indicator Cluster Survey
Table 8.6 provides information on infant and child mortality rates by district, using data from
the 2010 census on children ever born (CEB) and children surviving. The table shows that
the incidence of death among children under five years ranges from 73 per 1,000 live births
in Kadjebi and Biakoye districts to 119 per 1,000 live births in Nkwanta North District. Keta
Municipal has an under-five mortality rate of 101 per 1,000 live births, while Ketu North has
a rate of 100 per 1,000 live births. With respect to infant mortality, children in South Dayi (45
per 1,000 live births), Biakoye and Kadjebi (both 49 per 1,000 live births) have the lowest
risk of infant mortality. The risk of infant death is highest for children in Nkwanta North (76
per 1,000 live births), Keta Municipal and Ketu North (both 65 per 1,000 live births).

84
Table 8.6: Infant and under-five mortality rates* by district and reference period
District
Infant
mortality
Under-five
mortality Reference period
All Districts 57 87 2002.2-2006.7
South Tongu 53 80 2002.1-2006.6
Keta Municipal 65 101 2002.6-2006.7
Ketu South 62 96 2002.3-2006.7
Ketu North 65 100 2002.4-2006.7
Akatsi 62 96 2002.2-2006.8
North Tongu 53 80 2002.1-2006.6
Adaklu Anyigbe 52 77 2002.6-2006.8
Ho Municipal 58 89 2002.6-2006.7
South Dayi 45 66 2002.4-2006.7
North Dayi 50 74 2001.8-2006.6
Hohoe 51 76 2002.1-2006.6
Biakoye 49 73 2002.2-2006.7
Jasikan 53 78 2001.9-2006.5
Kadjebi 49 73 2002.3-2006.7
Krachi East 53 79 2002.0-2006.6
Krachi West 55 83 2001.9-2006.7
Nkwanta South 62 95 2001.9-2006.7
Nkwanta North 76 119 2002.2-2006.6 *Per 1,000 live births
Source: 2010 Population and Housing Census
8.4 Migration and Urbanization
8.4.1 Concepts and measures
Migration refers to change in usual place of residence. A migrant is therefore defined as a
person whose usual place of residence is different from his/her place of birth or previous
residence. The importance of measuring migration lies in its impact on population size,
structure and distribution in the region. Migration out of the region decreases the size of the
population in the region, while migration into the region increases the population size. In
addition, the variations in the migration process in terms of age, sex, education and other
socio-demographic characteristics can have significant impact on the overall social and
economic development of the region.
Migration is difficult to measure due to its repetitiveness and difficulty in establishing
direction and permanency of the event. Nevertheless census information on usual place of
residence five years before the census and current residence is used to discuss migration
patterns in the region.
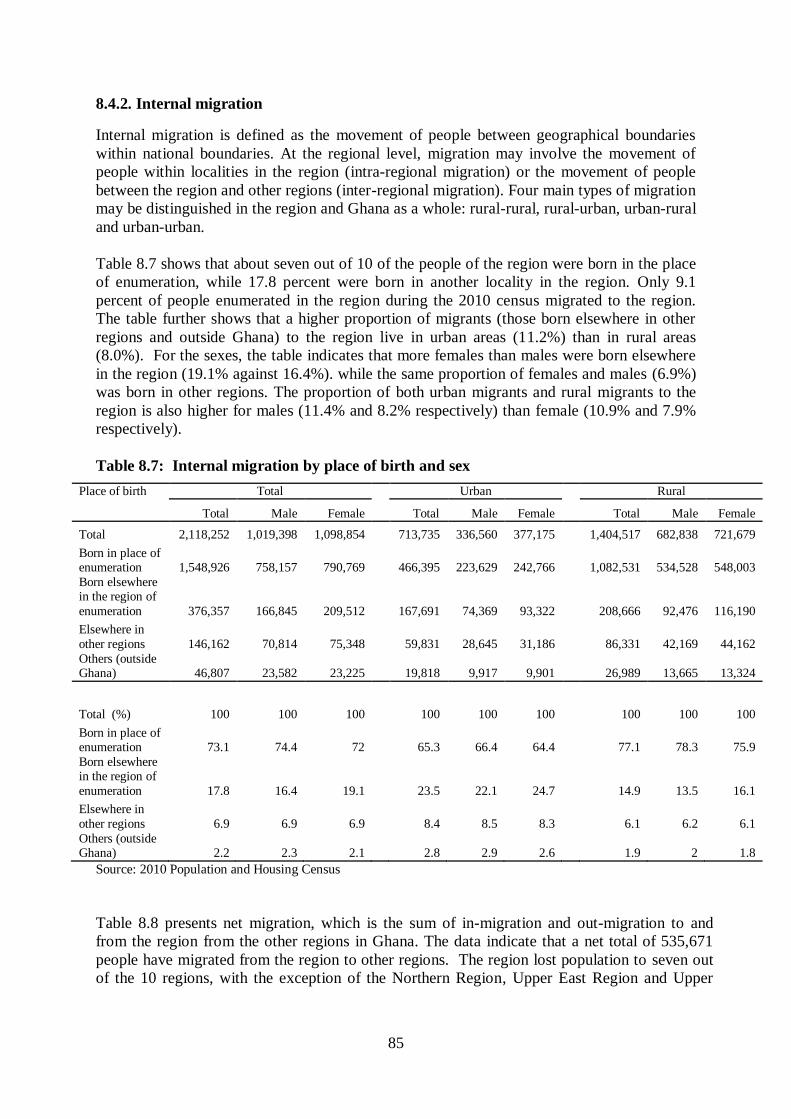
85
8.4.2. Internal migration
Internal migration is defined as the movement of people between geographical boundaries
within national boundaries. At the regional level, migration may involve the movement of
people within localities in the region (intra-regional migration) or the movement of people
between the region and other regions (inter-regional migration). Four main types of migration
may be distinguished in the region and Ghana as a whole: rural-rural, rural-urban, urban-rural
and urban-urban.
Table 8.7 shows that about seven out of 10 of the people of the region were born in the place
of enumeration, while 17.8 percent were born in another locality in the region. Only 9.1
percent of people enumerated in the region during the 2010 census migrated to the region.
The table further shows that a higher proportion of migrants (those born elsewhere in other
regions and outside Ghana) to the region live in urban areas (11.2%) than in rural areas
(8.0%). For the sexes, the table indicates that more females than males were born elsewhere
in the region (19.1% against 16.4%). while the same proportion of females and males (6.9%)
was born in other regions. The proportion of both urban migrants and rural migrants to the
region is also higher for males (11.4% and 8.2% respectively) than female (10.9% and 7.9%
respectively).
Table 8.7: Internal migration by place of birth and sex
Place of birth Total Urban Rural
Total Male Female Total Male Female Total Male Female
Total 2,118,252 1,019,398 1,098,854
713,735 336,560 377,175
1,404,517 682,838 721,679
Born in place of enumeration 1,548,926 758,157 790,769
466,395 223,629 242,766
1,082,531 534,528 548,003
Born elsewhere in the region of
enumeration 376,357 166,845 209,512
167,691 74,369 93,322
208,666 92,476 116,190
Elsewhere in
other regions 146,162 70,814 75,348
59,831 28,645 31,186
86,331 42,169 44,162
Others (outside Ghana) 46,807 23,582 23,225 19,818 9,917 9,901 26,989 13,665 13,324
Total (%) 100 100 100
100 100 100
100 100 100
Born in place of enumeration 73.1 74.4 72
65.3 66.4 64.4
77.1 78.3 75.9
Born elsewhere in the region of
enumeration 17.8 16.4 19.1
23.5 22.1 24.7
14.9 13.5 16.1
Elsewhere in
other regions 6.9 6.9 6.9
8.4 8.5 8.3
6.1 6.2 6.1
Others (outside Ghana) 2.2 2.3 2.1 2.8 2.9 2.6 1.9 2 1.8
Source: 2010 Population and Housing Census
Table 8.8 presents net migration, which is the sum of in-migration and out-migration to and
from the region from the other regions in Ghana. The data indicate that a net total of 535,671
people have migrated from the region to other regions. The region lost population to seven out
of the 10 regions, with the exception of the Northern Region, Upper East Region and Upper
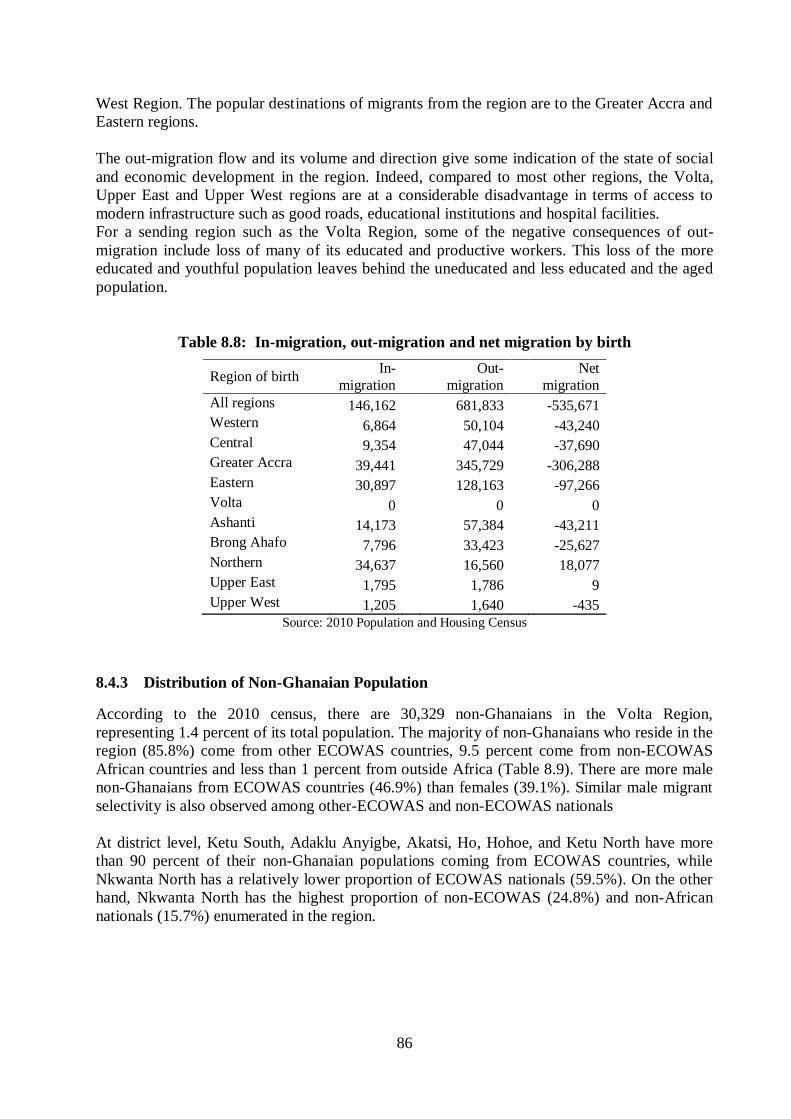
86
West Region. The popular destinations of migrants from the region are to the Greater Accra and
Eastern regions.
The out-migration flow and its volume and direction give some indication of the state of social
and economic development in the region. Indeed, compared to most other regions, the Volta,
Upper East and Upper West regions are at a considerable disadvantage in terms of access to
modern infrastructure such as good roads, educational institutions and hospital facilities.
For a sending region such as the Volta Region, some of the negative consequences of out-
migration include loss of many of its educated and productive workers. This loss of the more
educated and youthful population leaves behind the uneducated and less educated and the aged
population.
Table 8.8: In-migration, out-migration and net migration by birth
Region of birth In-
migration
Out-
migration
Net
migration
All regions 146,162
681,833
-535,671
Western 6,864
50,104
-43,240
Central 9,354
47,044
-37,690
Greater Accra 39,441
345,729
-306,288
Eastern 30,897
128,163
-97,266
Volta 0 0 0
Ashanti 14,173
57,384
-43,211
Brong Ahafo 7,796
33,423
-25,627
Northern 34,637
16,560
18,077
Upper East 1,795
1,786
9
Upper West 1,205
1,640
-435
Source: 2010 Population and Housing Census
8.4.3 Distribution of Non-Ghanaian Population
According to the 2010 census, there are 30,329 non-Ghanaians in the Volta Region,
representing 1.4 percent of its total population. The majority of non-Ghanaians who reside in the
region (85.8%) come from other ECOWAS countries, 9.5 percent come from non-ECOWAS
African countries and less than 1 percent from outside Africa (Table 8.9). There are more male
non-Ghanaians from ECOWAS countries (46.9%) than females (39.1%). Similar male migrant
selectivity is also observed among other-ECOWAS and non-ECOWAS nationals
At district level, Ketu South, Adaklu Anyigbe, Akatsi, Ho, Hohoe, and Ketu North have more
than 90 percent of their non-Ghanaian populations coming from ECOWAS countries, while
Nkwanta North has a relatively lower proportion of ECOWAS nationals (59.5%). On the other
hand, Nkwanta North has the highest proportion of non-ECOWAS (24.8%) and non-African
nationals (15.7%) enumerated in the region.
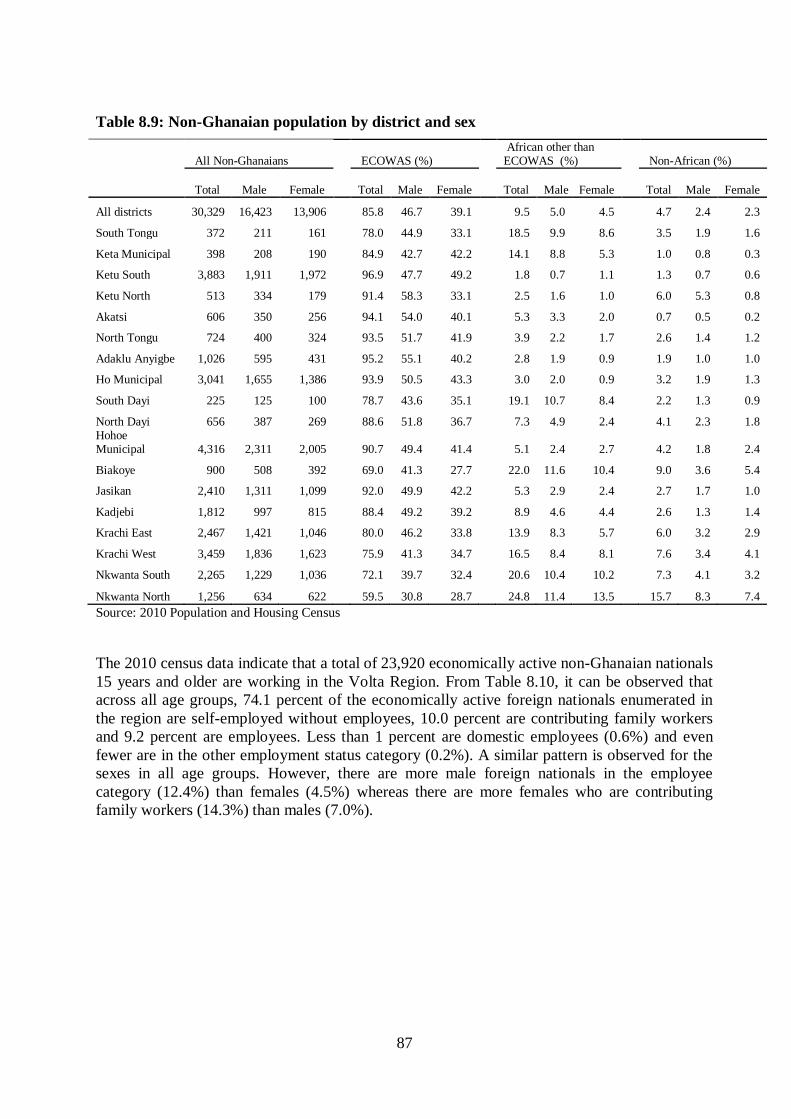
87
Table 8.9: Non-Ghanaian population by district and sex
All Non-Ghanaians ECOWAS (%) African other than ECOWAS (%) Non-African (%)
Total Male Female Total
Male
Female
Total
Male
Female
Total
Male
Female
All districts 30,329 16,423 13,906
85.8 46.7 39.1 9.5 5.0 4.5 4.7 2.4 2.3
South Tongu 372 211 161
78.0 44.9 33.1
18.5 9.9 8.6
3.5 1.9 1.6
Keta Municipal 398 208 190
84.9 42.7 42.2
14.1 8.8 5.3
1.0 0.8 0.3
Ketu South 3,883 1,911 1,972
96.9 47.7 49.2
1.8 0.7 1.1
1.3 0.7 0.6
Ketu North 513 334 179
91.4 58.3 33.1
2.5 1.6 1.0
6.0 5.3 0.8
Akatsi 606 350 256
94.1 54.0 40.1
5.3 3.3 2.0
0.7 0.5 0.2
North Tongu 724 400 324
93.5 51.7 41.9
3.9 2.2 1.7
2.6 1.4 1.2
Adaklu Anyigbe 1,026 595 431
95.2 55.1 40.2
2.8 1.9 0.9
1.9 1.0 1.0
Ho Municipal 3,041 1,655 1,386
93.9 50.5 43.3
3.0 2.0 0.9
3.2 1.9 1.3
South Dayi 225 125 100
78.7 43.6 35.1
19.1 10.7 8.4
2.2 1.3 0.9
North Dayi 656 387 269
88.6 51.8 36.7
7.3 4.9 2.4
4.1 2.3 1.8
Hohoe Municipal 4,316 2,311 2,005
90.7 49.4 41.4
5.1 2.4 2.7
4.2 1.8 2.4
Biakoye 900 508 392
69.0 41.3 27.7
22.0 11.6 10.4
9.0 3.6 5.4
Jasikan 2,410 1,311 1,099
92.0 49.9 42.2
5.3 2.9 2.4
2.7 1.7 1.0
Kadjebi 1,812 997 815
88.4 49.2 39.2
8.9 4.6 4.4
2.6 1.3 1.4
Krachi East 2,467 1,421 1,046
80.0 46.2 33.8
13.9 8.3 5.7
6.0 3.2 2.9
Krachi West 3,459 1,836 1,623
75.9 41.3 34.7
16.5 8.4 8.1
7.6 3.4 4.1
Nkwanta South 2,265 1,229 1,036
72.1 39.7 32.4
20.6 10.4 10.2
7.3 4.1 3.2
Nkwanta North 1,256 634 622 59.5 30.8 28.7 24.8 11.4 13.5 15.7 8.3 7.4
Source: 2010 Population and Housing Census
The 2010 census data indicate that a total of 23,920 economically active non-Ghanaian nationals
15 years and older are working in the Volta Region. From Table 8.10, it can be observed that
across all age groups, 74.1 percent of the economically active foreign nationals enumerated in
the region are self-employed without employees, 10.0 percent are contributing family workers
and 9.2 percent are employees. Less than 1 percent are domestic employees (0.6%) and even
fewer are in the other employment status category (0.2%). A similar pattern is observed for the
sexes in all age groups. However, there are more male foreign nationals in the employee
category (12.4%) than females (4.5%) whereas there are more females who are contributing
family workers (14.3%) than males (7.0%).

88
Table 8.10: Economically active foreign nationals 15 years and older by sex,
age group and employment status
Age
Group/Sex Total
Employee
Self-
employed
without
employee(s)
Self-
employed
with
employee(s)
Casual
worker
Contri-
buting
family
worker
Appren-
tice
Domestic
employee
(House
help)
Other
Both sexes .
All ages 23,920 9.2 74.1 2.7 1.6 10.0 1.7 0.6 0.2
15-29 8,547 8.7 62.9 2.2 2.3 18.5 4.6 0.6 0.2
30-49 10,682 9.7 79.7 3.1 1.2 5.3 0.2 0.7 0.1
50-64 3,258 10.2 80.6 2.7 0.8 5.1 0.0 0.4 0.2
65+ 1,433 5.4 84.4 2.4 1.5 5.4 0.2 0.6 0.1
Male
All ages 14,133 12.4 73.2 3.2 2.1 7.0 1.5 0.6 0.1
15-29 4,656 11.4 60.7 2.3 3.5 17.4 4.0 0.7 0.2
30-49 6,564 13.2 78.6 3.7 1.5 2.0 0.3 0.6 0.1
50-64 1,981 14.1 79.3 3.3 1.0 1.6 0.1 0.4 0.3
65+ 932 7.4 84.9 3.2 1.5 2.0 0.3 0.6 0.0
Female
All ages 9,787 4.5 75.4 2.0 0.8 14.3 2.2 0.7 0.2
15-29 3,891 5.4 65.5 2.1 1.0 19.9 5.3 0.5 0.3
30-49 4,118 4.2 81.5 2.0 0.6 10.5 0.1 0.9 0.1
50-64 1,277 4.2 82.6 1.7 0.6 10.4 0.0 0.4 0.1
65+ 501 1.6 83.6 1.0 1.4 11.6 0.0 0.6 0.2
Source: 2010 Population and Housing Census
Table 8.11 presents the distribution of the economically active foreign population by age group
and sector of employment. It indicates that an overwhelming majority (93.6%) of the non-
Ghanaian labour force across all age groups and for both sexes work in the informal private
sector. Very few foreign nationals are employed in the public sector (3.3%) and the private
formal sector (2.6%). Less than 1 percent of non-Ghanaian males and females of all ages work
in semi-public/parastatal organizations, non-governmental organizations (NGOs) and
international organizations.

89
Table 8.11: Economically active foreign nationals 15 years and older
by sex, age group and sector of employment
Age group
Total
Public
(Government)
Private
Formal
Private
Informal
Semi-
Public/
Parastatal
NGOs
(Local and
International)
Other
International
Organisations
Both sexes
All ages 23,920 3.3 2.6 93.6 0.1 0.4 0.1
15 - 29 8,547 2.6 2.7 94.2 0.0 0.3 0.1
30 - 49 10,682 3.4 2.8 93.0 0.1 0.5 0.2
50 - 64 3,258 5.6 1.9 91.9 0.2 0.4 0.0
65+ 1,433 1.2 1.1 97.4 - 0.3 -
Male
All ages 14,133 4.2 3.4 91.6 0.1 0.5 0.2
15 - 29 4,656 3.2 3.3 93.1 0.0 0.2 0.2
30 - 49 6,564 4.3 3.9 90.7 0.1 0.7 0.3
50 - 64 1,981 7.6 2.9 88.6 0.3 0.6 0.1
65+ 932 1.8 1.6 96.2 - 0.3 -
Female
All ages 9,787 1.9 1.3 96.4 0.1 0.3 -
15 - 29 3,891 1.9 2.0 95.6 - 0.5 0.1
30 - 49 4,118 1.9 1.2 96.6 0.1 0.1 -
50 - 64 1,277 2.5 0.2 97.0 - 0.2 -
65+ 501 0.0 0.2 99.6 - 0.2 -
Source: 2010 Population and Housing Census
8.5 Urbanization
Urbanization refers to the positive change in the proportion of the total population living in
urban areas. Urbanization occurs as a result of natural increase and net migration. In Ghana, as
in many other developing countries, rural-urban migration constitutes a significant force in the
growth of urban places. Economic and income disparities and the perception of availability of
jobs and better living conditions in the urban areas are the major factors driving rural-urban
migration.
While urbanization has its advantages, there are also serious disadvantages, especially if the
pace of urbanization outstrips the ability of city and town planners to meet the requirements for
infrastructure such as housing, and services such as water, electricity, roads and schools.
Negative effects of the movement of large numbers of people to cities in Ghana include the
growth of slums and rising crime and vice.
Table 8.12 shows the levels and trends in urbanization in the Volta Region and in Ghana for the
period 1970 to 2010. It shows substantial increases in urbanization in the region and the country
as a whole across the censuses. Specifically for the region, the urban proportion has increased
from 16 percent in 1970 to about 34 percent in 2010, even as the level of urbanization is lower
in the region compared to that in the country as a whole.
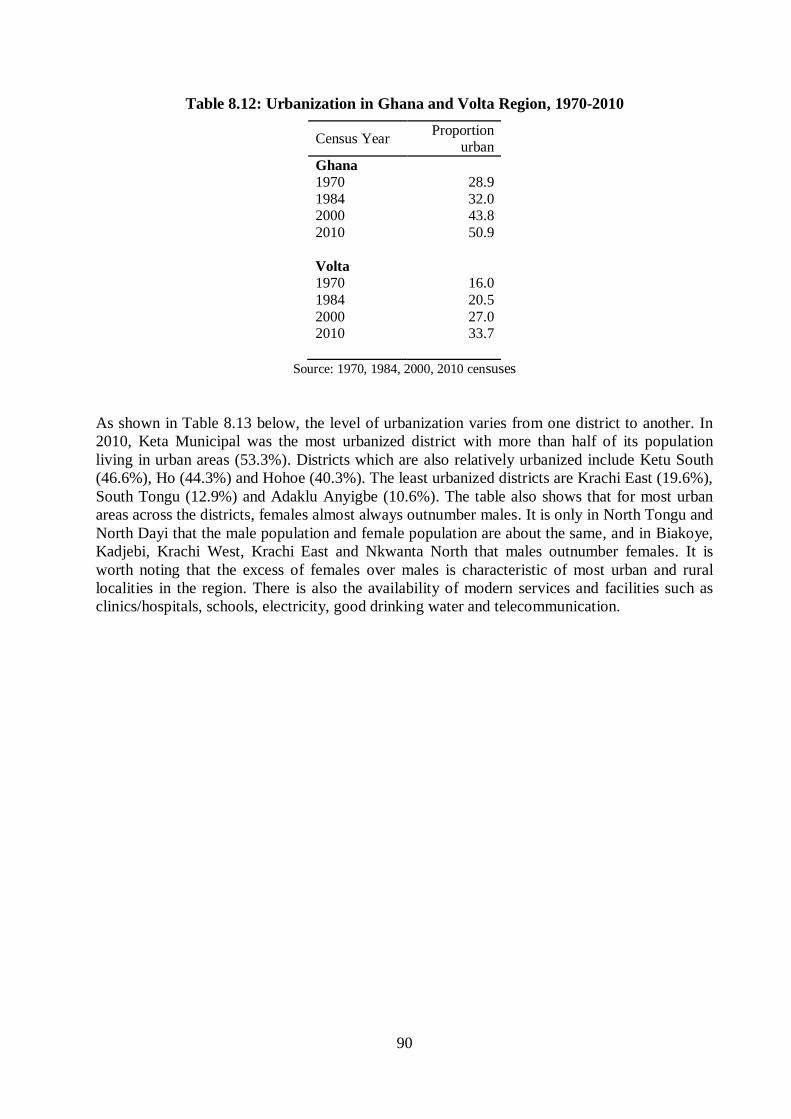
90
Table 8.12: Urbanization in Ghana and Volta Region, 1970-2010
Census Year Proportion
urban
Ghana
1970 28.9
1984 32.0 2000 43.8
2010 50.9
Volta
1970 16.0
1984 20.5
2000 27.0 2010 33.7
Source: 1970, 1984, 2000, 2010 censuses
As shown in Table 8.13 below, the level of urbanization varies from one district to another. In
2010, Keta Municipal was the most urbanized district with more than half of its population
living in urban areas (53.3%). Districts which are also relatively urbanized include Ketu South
(46.6%), Ho (44.3%) and Hohoe (40.3%). The least urbanized districts are Krachi East (19.6%),
South Tongu (12.9%) and Adaklu Anyigbe (10.6%). The table also shows that for most urban
areas across the districts, females almost always outnumber males. It is only in North Tongu and
North Dayi that the male population and female population are about the same, and in Biakoye,
Kadjebi, Krachi West, Krachi East and Nkwanta North that males outnumber females. It is
worth noting that the excess of females over males is characteristic of most urban and rural
localities in the region. There is also the availability of modern services and facilities such as
clinics/hospitals, schools, electricity, good drinking water and telecommunication.
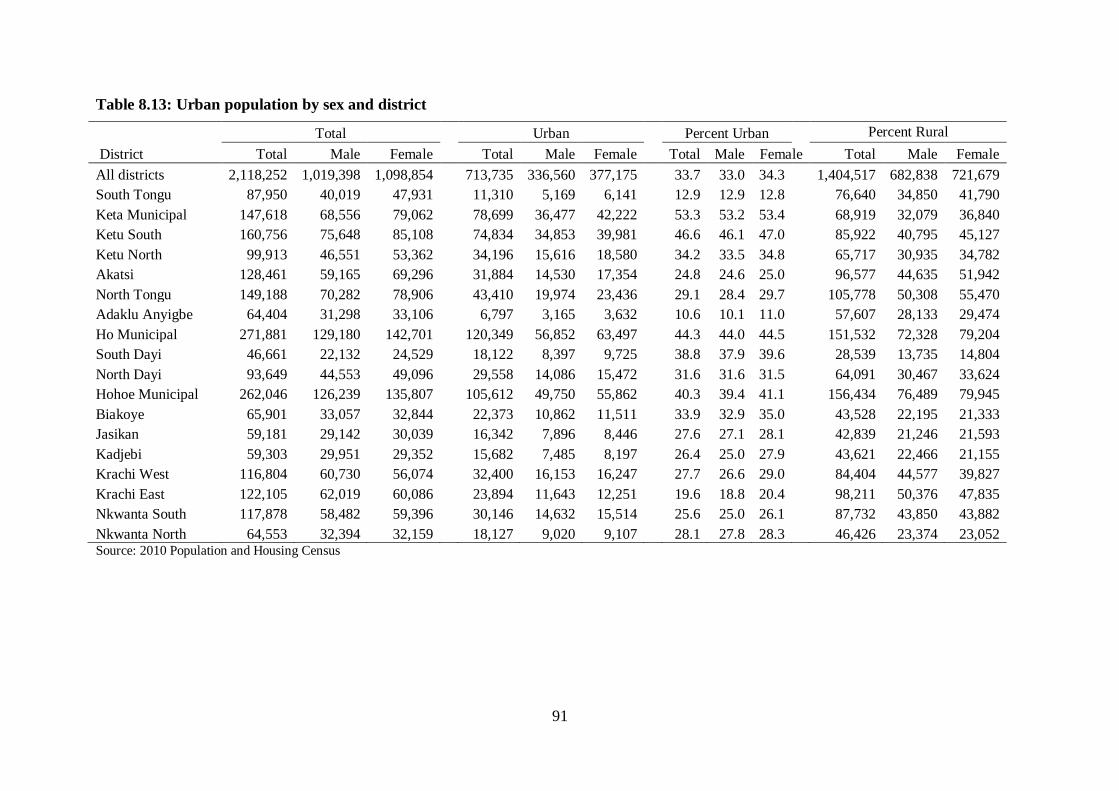
91
Table 8.13: Urban population by sex and district
Total
Urban
Percent Urban
Percent Rural
District Total Male Female Total Male Female Total Male Female Total Male Female
All districts 2,118,252 1,019,398 1,098,854
713,735 336,560 377,175
33.7 33.0 34.3
1,404,517 682,838 721,679
South Tongu 87,950 40,019 47,931
11,310 5,169 6,141
12.9 12.9 12.8
76,640 34,850 41,790
Keta Municipal 147,618 68,556 79,062
78,699 36,477 42,222
53.3 53.2 53.4
68,919 32,079 36,840
Ketu South 160,756 75,648 85,108
74,834 34,853 39,981
46.6 46.1 47.0
85,922 40,795 45,127
Ketu North 99,913 46,551 53,362
34,196 15,616 18,580
34.2 33.5 34.8
65,717 30,935 34,782
Akatsi 128,461 59,165 69,296
31,884 14,530 17,354
24.8 24.6 25.0
96,577 44,635 51,942
North Tongu 149,188 70,282 78,906
43,410 19,974 23,436
29.1 28.4 29.7
105,778 50,308 55,470
Adaklu Anyigbe 64,404 31,298 33,106
6,797 3,165 3,632
10.6 10.1 11.0
57,607 28,133 29,474
Ho Municipal 271,881 129,180 142,701
120,349 56,852 63,497
44.3 44.0 44.5
151,532 72,328 79,204
South Dayi 46,661 22,132 24,529
18,122 8,397 9,725
38.8 37.9 39.6
28,539 13,735 14,804
North Dayi 93,649 44,553 49,096
29,558 14,086 15,472
31.6 31.6 31.5
64,091 30,467 33,624
Hohoe Municipal 262,046 126,239 135,807
105,612 49,750 55,862
40.3 39.4 41.1
156,434 76,489 79,945
Biakoye 65,901 33,057 32,844
22,373 10,862 11,511
33.9 32.9 35.0
43,528 22,195 21,333
Jasikan 59,181 29,142 30,039
16,342 7,896 8,446
27.6 27.1 28.1
42,839 21,246 21,593
Kadjebi 59,303 29,951 29,352
15,682 7,485 8,197
26.4 25.0 27.9
43,621 22,466 21,155
Krachi West 116,804 60,730 56,074
32,400 16,153 16,247
27.7 26.6 29.0
84,404 44,577 39,827
Krachi East 122,105 62,019 60,086
23,894 11,643 12,251
19.6 18.8 20.4
98,211 50,376 47,835
Nkwanta South 117,878 58,482 59,396
30,146 14,632 15,514
25.6 25.0 26.1
87,732 43,850 43,882
Nkwanta North 64,553 32,394 32,159 18,127 9,020 9,107 28.1 27.8 28.3 46,426 23,374 23,052 Source: 2010 Population and Housing Census
92
CHAPTER NINE
ECONOMIC CHARACTERISTICS
9.1 Introduction
The economic and social development of any country is contingent upon the quality and
quantity of its productive resources, of which labour is vitally important. In fact, the other
productive resources, namely physical capital and land, are dependent upon labour.
Consequently, labour constitutes a critical agent of production. As a result of the very important
position of labour in the productive process, knowledge of the current size and characteristics of
the labour force and its variation over time is vital for possible policy interventions for
maximum development and utilization of these human resources. This chapter analyses data on
the economic activity status of the population, age and sex structure of the employed population,
employment status and sector, and age and sex composition of the unemployed population.
9.2 The Activity Status of the Population
The economically active population consists of those persons who either worked for pay or
profit or family gain for at least one hour within the seven days preceding Census Night. This
includes persons who were in paid employment or self-employed or contributing family
workers; persons who did not work but had jobs to return to; and persons who were
unemployed.
The not economically active were persons who did not work and were not seeking work within
the seven days preceding Census Night. This includes homemakers, students, retired persons,
the disabled and persons who were unable to work due to their age or ill-health.
9.2.1 Economic Activity Status by Age and Sex
The 2010 PHC reported a total population of 2,118,252 for the Volta Region out of which
1,305,427 are persons 15 years and older, representing 61.6 percent of the total population.
Table 9.1 presents the distribution of persons 15 years and older by age, sex and economic
activity status. For both sexes, the table indicates that 69.9 of persons 15 years and older are
economically active, while the economically inactive population constitutes 30.4%. It further
shows that the proportion of persons who are economically active is higher in total for females
(53.6%) than males (46.4%) and in all age groups.
The data also show that the proportion of the economically active population increases with age
from 15-24 years to 35-44 years and subsequently declines with advancing age. For females, the
peak of economically active population is the 25-34 years age group, while for males; the peak
is the 15-24 year age group. As expected, a higher proportion of persons who are economically
not active are in the younger age group (15-24 years) and older age group (65 years and older),
while the lowest proportion is in the age group 35-44 years. It is worth noting the 60.2 percent
proportion of females not economically active in the 25-34 segment, in general terms perhaps
the most dynamic age group.
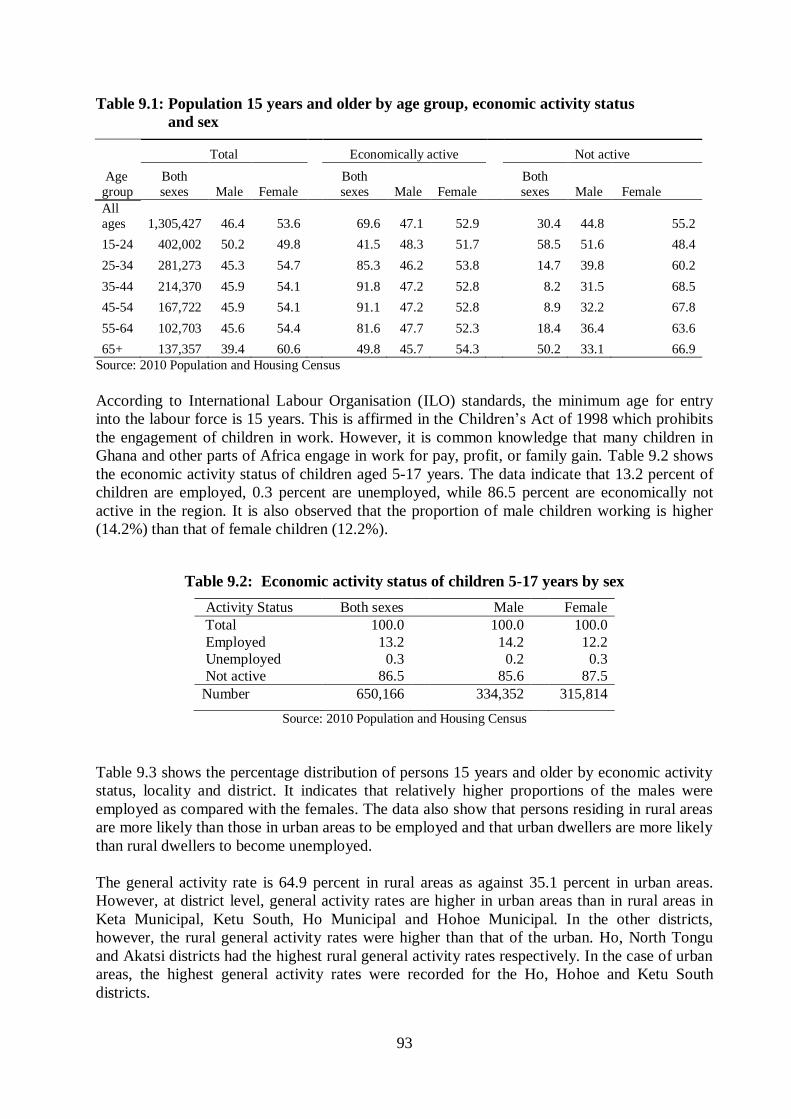
93
Table 9.1: Population 15 years and older by age group, economic activity status
and sex
Age
group
Total
Economically active
Not active
Both
sexes
Male
Female
Both
sexes
Male
Female
Both
sexes
Male Female
All
ages 1,305,427 46.4 53.6
69.6 47.1 52.9
30.4 44.8 55.2
15-24 402,002 50.2 49.8 41.5 48.3 51.7 58.5 51.6 48.4
25-34 281,273 45.3 54.7 85.3 46.2 53.8 14.7 39.8 60.2
35-44 214,370 45.9 54.1 91.8 47.2 52.8 8.2 31.5 68.5
45-54 167,722 45.9 54.1 91.1 47.2 52.8 8.9 32.2 67.8
55-64 102,703 45.6 54.4 81.6 47.7 52.3 18.4 36.4 63.6
65+ 137,357 39.4 60.6 49.8 45.7 54.3 50.2 33.1 66.9
Source: 2010 Population and Housing Census
According to International Labour Organisation (ILO) standards, the minimum age for entry
into the labour force is 15 years. This is affirmed in the Children‟s Act of 1998 which prohibits
the engagement of children in work. However, it is common knowledge that many children in
Ghana and other parts of Africa engage in work for pay, profit, or family gain. Table 9.2 shows
the economic activity status of children aged 5-17 years. The data indicate that 13.2 percent of
children are employed, 0.3 percent are unemployed, while 86.5 percent are economically not
active in the region. It is also observed that the proportion of male children working is higher
(14.2%) than that of female children (12.2%).
Table 9.2: Economic activity status of children 5-17 years by sex
Activity Status Both sexes Male Female
Total 100.0 100.0 100.0
Employed 13.2
14.2
12.2
Unemployed 0.3
0.2
0.3
Not active 86.5 85.6 87.5
Number 650,166
334,352
315,814
Source: 2010 Population and Housing Census
Table 9.3 shows the percentage distribution of persons 15 years and older by economic activity
status, locality and district. It indicates that relatively higher proportions of the males were
employed as compared with the females. The data also show that persons residing in rural areas
are more likely than those in urban areas to be employed and that urban dwellers are more likely
than rural dwellers to become unemployed.
The general activity rate is 64.9 percent in rural areas as against 35.1 percent in urban areas.
However, at district level, general activity rates are higher in urban areas than in rural areas in
Keta Municipal, Ketu South, Ho Municipal and Hohoe Municipal. In the other districts,
however, the rural general activity rates were higher than that of the urban. Ho, North Tongu
and Akatsi districts had the highest rural general activity rates respectively. In the case of urban
areas, the highest general activity rates were recorded for the Ho, Hohoe and Ketu South
districts.

94
Table 9.3.: Population 15 years and older by district, economic activity status and locality
Total Urban Rural
Economically Active Not Active
Economically Active Not Active
Economically Active Not Active District Total Employed Unemployed Total Employed Unemployed Total Employed Unemployed
All districts 1,305,427 67.0 2.6 30.4 35.1 61.0 3.4 35.6 64.9 70.3 2.1 27.6
South Tongu 4.1 2.8 0.1 1.2 0.6 0.4 0.0 0.2 3.5 2.4 0.1 1.0
Keta Municipal 7.4 4.4 0.3 2.7 4.0 2.3 0.2 1.5 3.4 2.1 0.1 1.1
Ketu South 7.7 5.2 0.2 2.2 3.5 2.3 0.1 1.1 4.1 2.8 0.1 1.2
Ketu North 4.8 3.3 0.1 1.4 1.7 1.1 0.1 0.6 3.1 2.2 0.0 0.8
Akatsi 6.1 4.4 0.1 1.6 1.6 1.0 0.0 0.5 4.6 3.4 0.1 1.1
North Tongu 7.1 4.7 0.2 2.2 2.1 1.2 0.1 0.9 4.9 3.6 0.1 1.3
Adaklu Anyigbe 3.1 2.1 0.1 1.0 0.3 0.2 0.0 0.1 2.8 1.9 0.1 0.8
Ho Municipal 14.0 8.7 0.5 4.7 6.5 3.7 0.3 2.5 7.5 5.0 0.2 2.3
South Dayi 2.2 1.4 0.1 0.7 0.8 0.5 0.0 0.3 1.3 0.9 0.0 0.4
North Dayi 4.6 2.8 0.2 1.6 1.5 0.9 0.1 0.5 3.1 2.0 0.1 1.0
Hohoe Municipal 12.7 8.0 0.3 4.4 5.2 3.1 0.2 1.9 7.5 4.8 0.2 2.5
Biakoye 3.0 2.3 0.1 0.7 1.0 0.7 0.0 0.3 2.0 1.5 0.0 0.4
Jasikan 2.8 2.0 0.1 0.8 0.8 0.5 0.0 0.3 2.0 1.5 0.0 0.5
Kadjebi 2.8 2.0 0.1 0.8 0.7 0.5 0.0 0.2 2.0 1.5 0.0 0.5
Krachi East 4.9 3.8 0.1 1.1 1.5 0.9 0.0 0.5 3.5 2.8 0.0 0.6
Krachi West 5.2 3.8 0.1 1.4 1.1 0.7 0.0 0.4 4.1 3.1 0.0 1.0
Nkwanta South 5.0 3.5 0.1 1.4 1.4 0.8 0.0 0.5 3.6 2.7 0.0 0.9
Nkwanta North 2.6 2.0 0.0 0.6 0.8 0.5 0.0 0.2 1.8 1.5 0.0 0.3
Source: 2010 Population and Housing Census
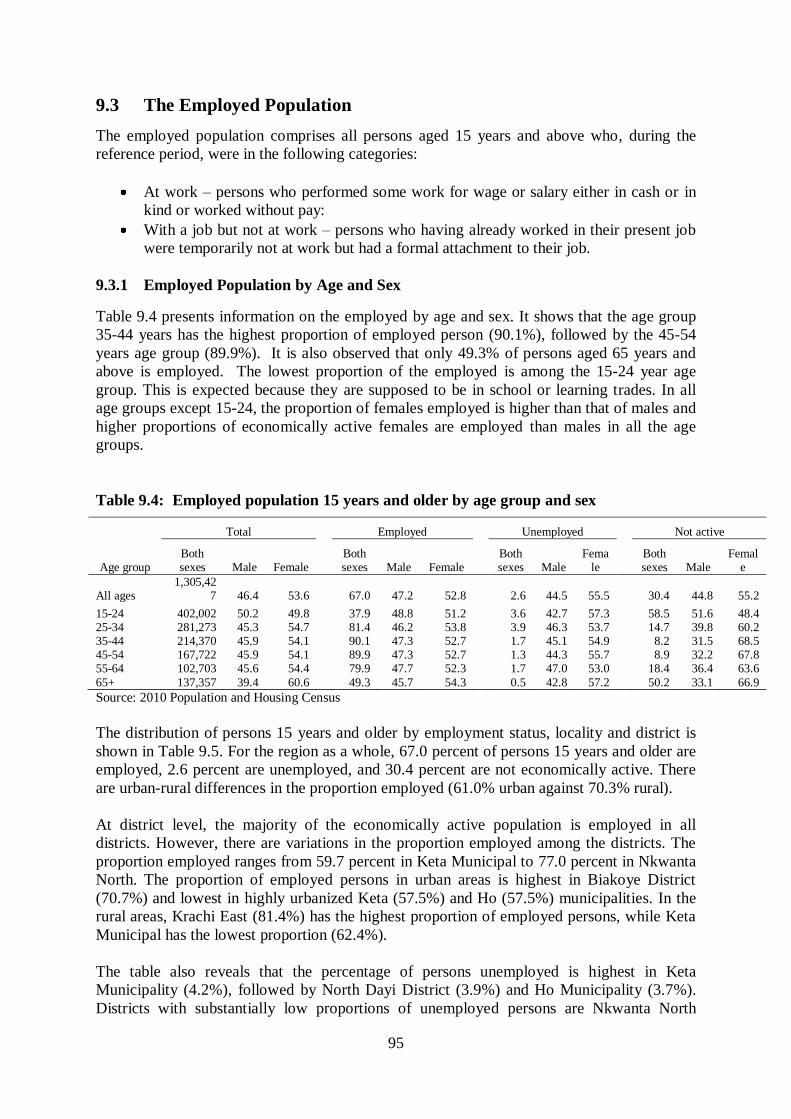
95
9.3 The Employed Population
The employed population comprises all persons aged 15 years and above who, during the
reference period, were in the following categories:
At work – persons who performed some work for wage or salary either in cash or in
kind or worked without pay:
With a job but not at work – persons who having already worked in their present job
were temporarily not at work but had a formal attachment to their job.
9.3.1 Employed Population by Age and Sex
Table 9.4 presents information on the employed by age and sex. It shows that the age group
35-44 years has the highest proportion of employed person (90.1%), followed by the 45-54
years age group (89.9%). It is also observed that only 49.3% of persons aged 65 years and
above is employed. The lowest proportion of the employed is among the 15-24 year age
group. This is expected because they are supposed to be in school or learning trades. In all
age groups except 15-24, the proportion of females employed is higher than that of males and
higher proportions of economically active females are employed than males in all the age
groups.
Table 9.4: Employed population 15 years and older by age group and sex
Age group
Total
Employed
Unemployed
Not active
Both sexes Male Female
Both sexes Male Female
Both sexes Male
Female
Both sexes Male
Female
All ages 1,305,42
7 46.4 53.6
67.0 47.2 52.8
2.6 44.5 55.5
30.4 44.8 55.2
15-24 402,002 50.2 49.8 37.9 48.8 51.2 3.6 42.7 57.3 58.5 51.6 48.4 25-34 281,273 45.3 54.7 81.4 46.2 53.8 3.9 46.3 53.7 14.7 39.8 60.2 35-44 214,370 45.9 54.1 90.1 47.3 52.7 1.7 45.1 54.9 8.2 31.5 68.5 45-54 167,722 45.9 54.1 89.9 47.3 52.7 1.3 44.3 55.7 8.9 32.2 67.8 55-64 102,703 45.6 54.4 79.9 47.7 52.3 1.7 47.0 53.0 18.4 36.4 63.6
65+ 137,357 39.4 60.6 49.3 45.7 54.3 0.5 42.8 57.2 50.2 33.1 66.9
Source: 2010 Population and Housing Census
The distribution of persons 15 years and older by employment status, locality and district is
shown in Table 9.5. For the region as a whole, 67.0 percent of persons 15 years and older are
employed, 2.6 percent are unemployed, and 30.4 percent are not economically active. There
are urban-rural differences in the proportion employed (61.0% urban against 70.3% rural).
At district level, the majority of the economically active population is employed in all
districts. However, there are variations in the proportion employed among the districts. The
proportion employed ranges from 59.7 percent in Keta Municipal to 77.0 percent in Nkwanta
North. The proportion of employed persons in urban areas is highest in Biakoye District
(70.7%) and lowest in highly urbanized Keta (57.5%) and Ho (57.5%) municipalities. In the
rural areas, Krachi East (81.4%) has the highest proportion of employed persons, while Keta
Municipal has the lowest proportion (62.4%).
The table also reveals that the percentage of persons unemployed is highest in Keta
Municipality (4.2%), followed by North Dayi District (3.9%) and Ho Municipality (3.7%).
Districts with substantially low proportions of unemployed persons are Nkwanta North

96
(0.7%), Krachi West (1.1%), Nkwanta South (1.2%), Krachi East (1.4%) and Akatsi (1.7%).
The data further indicate that relatively higher proportions of the economically not active
population reside in the urban compared with rural areas across all the districts.
Table 9.5: Population 15 years and older by economic activity status,
district and locality
Total Urban Rural
District
Total
Em-
ployed
Un-
employed
Not
active Total
Em-
ployed
Un-
employed
Not
active Total
Em-
ployed
Un-
employed
Not
active
All districts 1,305,427 67.0 2.6 30.4 458,504 61.0 3.4 35.6 846,923 70.3 2.1 27.6
South Tongu 52,893 68.0 2.9 29.1 7,287 64.5 3.1 32.4 45,606 68.6 2.9 28.6
Keta Municipal 96,558 59.7 4.2 36.1 52,314 57.5 4.3 38.2 44,244 62.4 4.0 33.6
Ketu South 100,044 67.7 3.2 29.1 46,317 66.1 3.8 30.1 53,727 69.1 2.7 28.1
Ketu North 62,790 68.1 2.1 29.8 22,562 62.0 3.0 35.0 40,228 71.5 1.6 27.0
Akatsi 80,059 71.8 1.7 26.5 20,654 65.3 2.5 32.1 59,405 74.1 1.4 24.5
North Tongu 92,036 66.8 2.4 30.8 27,739 54.6 3.8 41.6 64,297 72.1 1.7 26.2
Adaklu Anyigbe 40,635 66.9 2.5 30.6 4,492 64.7 2.1 33.2 36,143 67.2 2.5 30.3
Ho Municipal 182,444 62.4 3.7 33.9 84,424 57.5 4.5 38.0 98,020 66.6 3.0 30.4
South Dayi 28,483 62.8 2.9 34.2 11,083 58.9 3.0 38.1 17,400 65.3 2.9 31.8
North Dayi 59,736 61.6 3.9 34.5 19,095 59.2 4.5 36.3 40,641 62.7 3.6 33.7
Hohoe Municipal 165,542 63.0 2.6 34.5 67,760 60.6 3.3 36.1 97,782 64.6 2.1 33.3
Biakoye 39,417 75.3 1.8 22.9 13,383 70.7 1.6 27.8 26,034 77.6 2.0 20.4
Jasikan 36,802 70.6 1.9 27.5 10,303 64.2 2.5 33.3 26,499 73.1 1.7 25.2
Kadjebi 36,125 70.9 1.9 27.2 9,630 64.6 2.0 33.4 26,495 73.2 1.9 24.9
Krachi East 64,589 76.5 1.4 22.1 19,074 64.7 1.7 33.6 45,515 81.4 1.3 17.3
Krachi West 68,038 72.0 1.1 26.9 13,936 64.1 1.9 34.0 54,102 74.1 0.8 25.1
Nkwanta South 64,832 70.5 1.2 28.3 18,151 59.1 2.3 38.6 46,681 74.9 0.8 24.3
Nkwanta North 34,404 77.0 0.7 22.3 10,300 68.3 1.4 30.3 24,104 80.7 0.4 18.8
Source: 2010 Population and Housing Census
9.3.2 Employment Status of Employed Persons
Employment status refers to the status of a person in the establishment where he/she currently
works or previously worked. The 2010 census provided seven employment status categories:
employee, self-employed without employees, self-employed with employees, casual worker,
contributing family worker, apprentice, domestic employee (house help). Persons who could
not be classified under any of the above categories were classified as “Other”. It can be
observed in Table 9.6 that in all districts, over two-thirds of the employed population is self-
employed without employees. The proportion of the self-employed without employees ranges
from 65.2 percent in Ho a high of 78.5 percent in Adaklu Anyigbe to a low of. The
rural/urban distribution shows that the proportion of self-employed with employees is higher
in rural (76.1%) than in urban areas (64.8%). On the other hand, the proportion of the self-
employed with employees is less than 5.0 % generally. This is observed in all the districts.
Together, the two self-employed categories account for 75.3 percent of the working
population. In seven districts, the proportion recorded as employees (from 11.6% to 21.4%) is
higher than the regional figure (11.2%).

97
Table 9.6: Employed population 15 years and older by employment status,
district and locality
Urban
Districts/Type
of Locality
Total Employee
Self-
employed
without
employee(s)
Self-
employed
with
employee(s)
Casual
worker
Contri-
buting
family
worker
Appren-
tice
Domestic
employee
(House
help) Other
Total All districts 875,003 11.2 72.5 2.8 1.5 9.8 1.6 0.6 0.1
South Tongu 35,973 11.6 67.6 2.5 2.1 14.2 1.3 0.5 0.2
Keta Municipal 57,674 12.4 70.9 3.8 3.4 6.9 2.1 0.5 0.1
Ketu South 67,762 12.6 72.9 3.5 3.2 4.6 2.5 0.7 0.1
Ketu North 42,741 8.7 77.3 2.0 1.9 8.0 1.5 0.5 0.2
Akatsi 57,511 7.6 77.3 2.2 0.6 10.1 1.6 0.5 0.1
North Tongu 61,507 8.9 72.3 2.1 1.6 13.2 1.0 0.6 0.2
Adaklu Anyigbe 27,195 8.1 78.5 1.7 0.8 8.7 1.1 0.8 0.2
Ho Municipal 113,874 21.4 65.2 3.8 1.3 5.6 2.1 0.4 0.1
South Dayi 17,894 13.5 74.1 2.2 1.2 7.0 1.4 0.4 0.1
North Dayi 36,783 14.4 74.8 3.3 1.0 4.5 1.4 0.5 0.1
Hohoe
Municipal 104,235 13.9 73.4 2.8 1.5 5.8 1.8 0.7 0.1
Biakoye 29,663 6.7 77.4 2.2 0.5 11.3 1.1 0.6 0.1
Jasikan 25,980 10.4 74.3 1.9 0.9 10.3 1.5 0.5 0.2
Kadjebi 25,613 9.3 70.1 2.6 0.8 15.0 1.3 0.8 0.1
Krachi East 49,389 5.5 71.4 3.7 1.0 16.7 1.0 0.5 0.1
Krachi West 49,004 4.4 71.6 2.5 0.6 19.2 0.9 0.6 0.2
Nkwanta South 45,718 6.6 76.3 2.4 0.7 12.6 0.9 0.4 0.1
Nkwanta North 26,487 2.2 73.4 1.8 0.3 20.6 0.9 0.7 0.1
All districts 279,734 20.6 64.8 4.2 1.9 5.2 2.7 0.5 0.2
South Tongu 4,703 31.7 53.3 8.0 2.2 1.7 2.4 0.6 0.1
Keta Municipal 30,067 15.6 65.4 4.2 4.1 7.1 3.0 0.5 0.1
Ketu South 30,614 15.9 71.0 3.8 2.8 2.8 2.8 0.7 0.1
Ketu North 13,998 14.9 74.6 2.7 1.9 3.1 2.2 0.4 0.1
Akatsi 13,493 18.0 66.8 3.8 1.2 5.9 3.8 0.4 0.1
North Tongu 15,144 19.6 67.0 3.6 2.3 4.7 2.1 0.4 0.4
Adaklu
Anyigbe 2,905 18.6 70.8 2.5 1.5 3.7 1.8 0.5 0.6
Ho Municipal 48,570 35.3 51.0 5.8 1.6 2.8 3.0 0.4 0.1
South Dayi 6,531 15.3 73.1 2.4 1.4 5.6 1.7 0.4 0.0
North Dayi 11,303 24.7 65.1 4.6 1.1 1.8 2.3 0.3 0.1
Hohoe
Municipal 41,070 22.8 65.3 4.1 1.6 2.8 2.8 0.6 0.2
Biakoye 9,457 9.5 73.2 2.6 0.6 11.5 1.9 0.6 0.2
Jasikan 6,613 18.7 68.9 2.0 1.3 5.6 2.4 0.7 0.3
Kadjebi 6,221 17.8 66.5 4.0 1.5 6.3 3.1 0.5 0.2
Krachi East 12,343 11.8 63.4 5.6 1.5 13.9 3.1 0.5 0.2
Krachi West 8,935 12.0 67.7 3.4 1.0 13.1 2.1 0.5 0.2
Nkwanta South 10,735 20.2 69.7 3.1 1.5 2.9 2.2 0.3 0.1
Nkwanta North 7,032 4.7 72.4 2.4 0.4 17.7 1.8 0.6 0.1

98
Rural
District Total Employee
Self- employed
without employee(s)
Self- employed
with employee(s)
Casual worker
Contri-buting family worker
Appren-tice
Domestic employee (House -
help) Other
Rural
All districts
595,26
9 6.7 76.1 2.2 1.2 12.0 1.0 0.6 0.1
South Tongu 31,270 8.5 69.8 1.7 2.0 16.1 1.1 0.5 0.2
Keta Municipal 27,607 8.8 76.8 3.4 2.5 6.7 1.1 0.5 0.1
Ketu South 37,148 9.8 74.5 3.2 3.6 6.0 2.2 0.6 0.1
Ketu North 28,743 5.7 78.6 1.6 1.9 10.4 1.2 0.5 0.2
Akatsi 44,018 4.5 80.5 1.7 0.4 11.4 1.0 0.5 0.1
North Tongu 46,363 5.4 74.1 1.6 1.4 16.0 0.7 0.7 0.1
Adaklu Anyigbe 24,290 6.8 79.4 1.6 0.8 9.3 1.1 0.8 0.1
Ho Municipal 65,304 11.0 75.7 2.4 1.1 7.8 1.4 0.4 0.1
South Dayi 11,363 12.5 74.7 2.1 1.1 7.8 1.3 0.4 0.1
North Dayi 25,480 9.9 79.1 2.7 0.9 5.7 1.1 0.6 0.2
Hohoe Municipal 63,165 8.1 78.6 2.0 1.5 7.7 1.2 0.7 0.1
Biakoye 20,206 5.3 79.3 2.0 0.5 11.3 0.8 0.6 0.1
Jasikan 19,367 7.5 76.1 1.9 0.8 11.9 1.2 0.4 0.1
Kadjebi 19,392 6.6 71.3 2.1 0.6 17.7 0.7 0.9 0.1
Krachi East 37,046 3.4 74.1 3.1 0.8 17.6 0.4 0.5 0.1
Krachi West 40,069 2.7 72.4 2.3 0.6 20.5 0.6 0.7 0.2
Nkwanta South 34,983 2.5 78.3 2.1 0.5 15.6 0.5 0.5 0.1
Nkwanta North 19,455 1.3 73.8 1.5 0.2 21.6 0.6 0.8 0.1
Source: 2010 Population and Housing Census
9.3.3 Occupation of Employed Persons
Occupation refers to the type of work a person was engaged in during the seven days
preceding Census Night,, and those did not work but had a job to return to, as well as those
unemployed who had worked before. The emphasis was on the work the person did during
the reference period but not what he/she was trained to do.
Table 9.7 provides data on employed persons 15 years and older by occupation and sex. It
shows that workers in skilled agriculture, forestry, and fishing constitute the largest
occupational group (50.1%), followed by those in craft and related trades (17.6%), and in
services and sales (16.6%). On the other hand, only a small proportion of employed persons
are in the technical and associated professionals (1.2%) and managerial categories (1.7%).
For both sexes, skilled agricultural, forestry, and fishery work is the dominant occupation.
There are more males in managerial and professional occupations (7.5%) than females
(5.4%). On the other hand, the proportion of females engaged in services and sales as workers
(26.2%) is higher than that of men (6.0%).
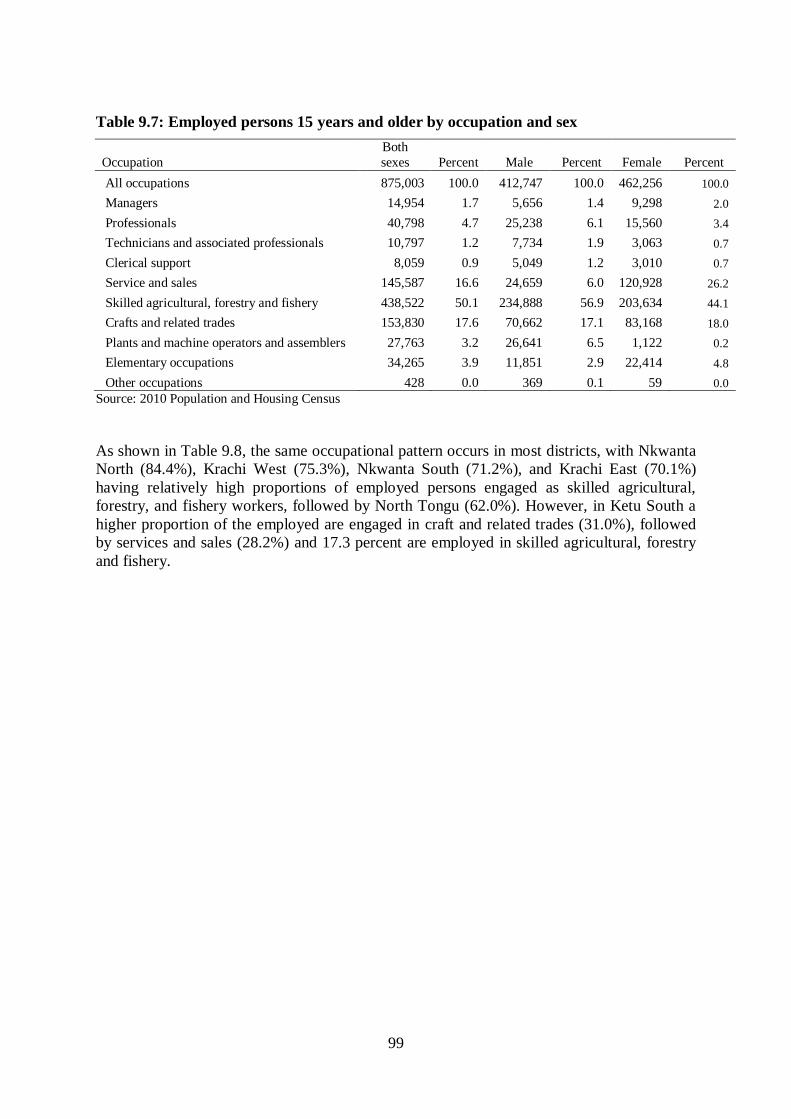
99
Table 9.7: Employed persons 15 years and older by occupation and sex
Occupation
Both
sexes
Percent Male Percent Female Percent
All occupations 875,003 100.0 412,747 100.0 462,256 100.0
Managers 14,954 1.7 5,656 1.4 9,298 2.0
Professionals 40,798 4.7 25,238 6.1 15,560 3.4
Technicians and associated professionals 10,797 1.2 7,734 1.9 3,063 0.7
Clerical support 8,059 0.9 5,049 1.2 3,010 0.7
Service and sales 145,587 16.6 24,659 6.0 120,928 26.2
Skilled agricultural, forestry and fishery 438,522 50.1 234,888 56.9 203,634 44.1
Crafts and related trades 153,830 17.6 70,662 17.1 83,168 18.0
Plants and machine operators and assemblers 27,763 3.2 26,641 6.5 1,122 0.2
Elementary occupations 34,265 3.9 11,851 2.9 22,414 4.8
Other occupations 428 0.0 369 0.1 59 0.0
Source: 2010 Population and Housing Census
As shown in Table 9.8, the same occupational pattern occurs in most districts, with Nkwanta
North (84.4%), Krachi West (75.3%), Nkwanta South (71.2%), and Krachi East (70.1%)
having relatively high proportions of employed persons engaged as skilled agricultural,
forestry, and fishery workers, followed by North Tongu (62.0%). However, in Ketu South a
higher proportion of the employed are engaged in craft and related trades (31.0%), followed
by services and sales (28.2%) and 17.3 percent are employed in skilled agricultural, forestry
and fishery.

100
Table 9.8: Employed persons 15 years and older by district and occupation
District Number Total Managers Pro-
fessionals
Technicians
and associate professionals
Clerical
support workers
Service
and sales workers
Skilled
agricultural forestry and
fishery workers
Craft and related
trades workers
Plant and
machine operators
and assemblers
Elementary occupations
Other occupations
All regions 875,003 100.0 1.7 4.7 1.2 0.9 16.6 50.1 17.6 3.2 3.9 0.0
South Tongu 35,973 100.0 1.7 4.6 1.1 0.7 15.9 46.4 20.5 3.3 5.6 0.0
Keta Municipal 57,674 100.0 2.3 4.6 1.2 1.0 21.8 34.8 25.4 3.1 5.9 0.0
Ketu South 67,762 100.0 2.0 4.1 2.2 1.6 28.2 17.3 31.0 5.2 8.3 0.1
Ketu North 42,741 100.0 1.8 3.6 1.1 0.6 16.7 47.1 19.8 4.6 4.7 0.0
Akatsi 57,511 100.0 1.1 3.7 0.7 0.7 13.5 60.7 13.7 3.2 2.7 0.0
North Tongu 61,507 100.0 1.1 3.9 0.9 0.5 12.7 62.0 12.8 2.8 3.3 0.0
Adaklu Anyigbe 27,195 100.0 1.1 3.7 1.0 0.5 13.6 58.0 17.3 2.4 2.4 0.0
Ho Municipal 113,874 100.0 2.7 8.1 2.1 2.1 21.9 34.4 20.3 4.2 4.1 0.2
South Dayi 17,894 100.0 1.8 6.3 1.5 1.0 19.8 43.5 18.6 3.1 4.4 0.0
North Dayi 36,783 100.0 3.2 6.3 1.5 1.0 21.5 38.1 19.4 3.8 5.1 0.0
Hohoe Municipal 104,235 100.0 2.0 6.6 1.5 1.1 19.3 43.5 18.0 3.8 4.2 0.0
Biakoye 29,663 100.0 1.2 3.8 1.0 0.4 13.5 60.4 14.9 2.2 2.6 0.0
Jasikan 25,980 100.0 1.3 4.5 1.1 0.7 14.3 57.3 14.1 3.3 3.3 0.0
Kadjebi 25,613 100.0 1.5 4.0 1.4 0.7 13.9 60.3 12.1 2.9 3.2 0.0
Krachi East 49,389 100.0 0.9 2.2 0.5 0.3 8.5 70.1 13.9 1.3 2.4 0.0
Krachi West 49,004 100.0 0.6 2.0 0.4 0.3 8.8 75.3 10.0 0.9 1.7 0.0
Nkwanta South 45,718 100.0 1.2 3.3 0.8 0.4 8.7 71.2 11.2 1.8 1.4 0.0
Nkwanta North 26,487 100.0 0.5 1.1 0.3 0.2 6.1 84.4 6.0 0.7 0.8 0.0
Source: 2010 Population and Housing Census

101
9.3.4 Employment Sector
This refers to the sector in which a person works. The employment sectors covered in the
2010 census were public, private formal, private informal, semi-public/parasatal, NGOs and
international organizations. Table 9.9 shows the distribution of persons 15 years and older by
sector of employment and sex. It indicates that the informal private sector is by far the largest
employer of economically active persons in the region (90.6%), followed by public
(government) sector (6.1%). Less than 1 percent of employees are in semi-public/parasatal
(0.1%), NGOs (0.4%) or other international organization (0.0). A similar pattern is observed
for the sexes, with more males than females employed across all the sectors. Table 9.9: Sector of employed persons 15 years and older, by sex
Sex of Employed Persons
Sector of employment Both sexes
Percent Male
Percent Female
Percent
All sectors 875,003 100.0 412,747 100.00 462,256 100.00
Public (government) 52,894 6.1 33,802 8.2 19,092 4.1
Private formal 24,982 2.9 17,016 4.1 7,966 1.7
Private informal 792,893 90.6 359,159 87.0 433,734 93.8
Semi-public/parastatal 766 0.1 520 0.1 246 0.1
NGOs (local and international) 3,317 0.4 2,119 0.5 1,198 0.2
Other international Organisations 151 0.0 131 0.0 20 0.0 Source: 2010 Population and Housing Census
9.3.5 Industry of Employed Persons
Table 9.10 shows the industrial activities of employed persons 15 years and older by sex. It
indicates that agriculture, forestry and fishing is the largest industrial sector, employing more
than 50 3 percent of the economically active population 15 years and older. The other two
major industries are manufacturing (14.1%), and wholesale and retail trade, repair of motor
vehicles and motorcycles (14.0%). For both sexes, these industries remain the major
employers. However, the proportion of males in skilled agricultural, forestry, and fishing
(57.3%) is higher than that of females (44.0%), while the opposite is the case for wholesale
and retail trade (20.8% of females and 6.4% of males) and manufacturing (17.2%) for
females and 10.6% of males).
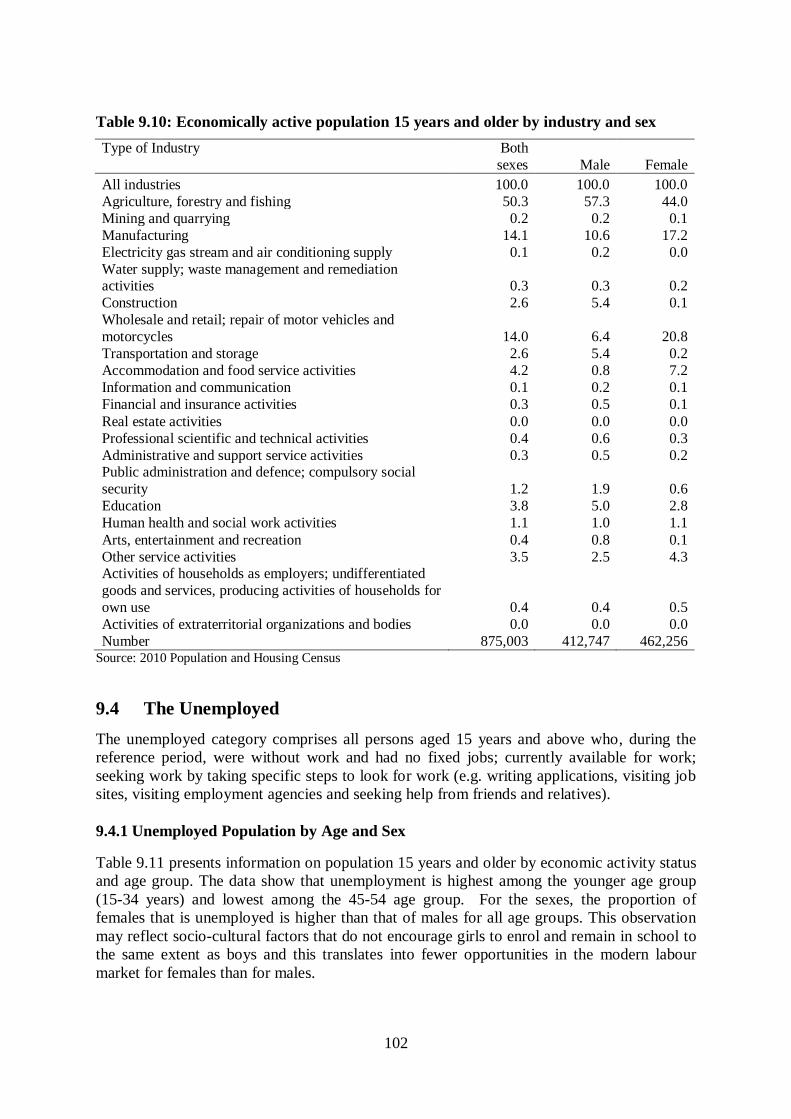
102
Table 9.10: Economically active population 15 years and older by industry and sex
Type of Industry Both
sexes Male Female
All industries 100.0 100.0 100.0
Agriculture, forestry and fishing 50.3 57.3 44.0
Mining and quarrying 0.2 0.2 0.1
Manufacturing 14.1 10.6 17.2
Electricity gas stream and air conditioning supply 0.1 0.2 0.0
Water supply; waste management and remediation activities 0.3 0.3 0.2
Construction 2.6 5.4 0.1
Wholesale and retail; repair of motor vehicles and
motorcycles 14.0 6.4 20.8
Transportation and storage 2.6 5.4 0.2
Accommodation and food service activities 4.2 0.8 7.2
Information and communication 0.1 0.2 0.1
Financial and insurance activities 0.3 0.5 0.1
Real estate activities 0.0 0.0 0.0
Professional scientific and technical activities 0.4 0.6 0.3
Administrative and support service activities 0.3 0.5 0.2 Public administration and defence; compulsory social
security 1.2 1.9 0.6
Education 3.8 5.0 2.8
Human health and social work activities 1.1 1.0 1.1
Arts, entertainment and recreation 0.4 0.8 0.1
Other service activities 3.5 2.5 4.3 Activities of households as employers; undifferentiated
goods and services, producing activities of households for
own use 0.4 0.4 0.5
Activities of extraterritorial organizations and bodies 0.0 0.0 0.0
Number 875,003 412,747 462,256 Source: 2010 Population and Housing Census
9.4 The Unemployed
The unemployed category comprises all persons aged 15 years and above who, during the
reference period, were without work and had no fixed jobs; currently available for work;
seeking work by taking specific steps to look for work (e.g. writing applications, visiting job
sites, visiting employment agencies and seeking help from friends and relatives).
9.4.1 Unemployed Population by Age and Sex
Table 9.11 presents information on population 15 years and older by economic activity status
and age group. The data show that unemployment is highest among the younger age group
(15-34 years) and lowest among the 45-54 age group. For the sexes, the proportion of
females that is unemployed is higher than that of males for all age groups. This observation
may reflect socio-cultural factors that do not encourage girls to enrol and remain in school to
the same extent as boys and this translates into fewer opportunities in the modern labour
market for females than for males.

103
Table 9.11: Population 15 years and older by age group and economic activity status
Age group
Total
Employed
Unemployed
Not active
Both sexes Male
Female
Both sexes
Male
Female
Both sexes
Male
Female
Both sexes
Male
Female
All ages 1,305,427 46.4 53.6
67.0 47.2 52.8
2.6 44.5 55.5
30.4 44.8 55.2
15-24 402,002 50.2 49.8
37.9 48.8 51.2
3.6 42.7 57.3
58.5 51.6 48.4
25-34 281,273 45.3 54.7
81.4 46.2 53.8
3.9 46.3 53.7
14.7 39.8 60.2
35-44 214,370 45.9 54.1
90.1 47.3 52.7
1.7 45.1 54.9
8.2 31.5 68.5
45-54 167,722 45.9 54.1
89.9 47.3 52.7
1.3 44.3 55.7
8.9 32.2 67.8
55-64 102,703 45.6 54.4
79.9 47.7 52.3
1.7 47.0 53.0
18.4 36.4 63.6
65+ 137,357 39.4 60.6
49.3 45.7 54.3
0.5 42.8 57.2
50.2 33.1 66.9
Source: 2010 Population and Housing Census
9.4.2 Unemployed Population by District and Sex
Table 9.12 presents the distribution of unemployed persons by district and sex. The table
indicates that more females (55.5%) than males (45.5%) are unemployed in the region.
Among the districts, the proportion of the economically active male population that is
unemployed is higher in Jasikan (51.4%), followed by Kadjebi (48.7%) and by Nkwanta
North (46.1%), while Keta Municipal recorded the lowest proportion (37.8%). For females,
the proportion of the economically active population unemployed is above 50 percent in all
districts, with the exception of Jasikan (48.6%). Keta Municipal has a relatively high
proportion of unemployed females (62.2%) compared to the other districts.
Table 9.12: Unemployed population 15 years and older by district and sex
District Number Both sexes Male Female
All Districts 33,557 100.0 44.5 55.5
South Tongu 1,528 100.0 42.4 57.6
Keta Municipal 4,008 100.0 37.8 62.2
Ketu South 3,204 100.0 44.2 55.8
Ketu North 1,313 100.0 42.0 58.0
Akatsi 1,370 100.0 45.4 54.6
North Tongu 2,167 100.0 47.3 52.7
Adaklu Anyigbe 1,001 100.0 47.3 52.7
Ho Municipal 6,768 100.0 46.5 53.5
South Dayi 834 100.0 42.1 57.9
North Dayi 2,321 100.0 43.8 56.2
Hohoe Municipal 4,259 100.0 46.1 53.9
Biakoye 723 100.0 44.7 55.3
Jasikan 703 100.0 51.4 48.6
Kadjebi 696 100.0 48.7 51.3
Krachi East 919 100.0 45.5 54.5
Krachi West 717 100.0 42.8 57.2
Nkwanta South 772 100.0 42.5 57.5
Nkwanta North 254 100.0 46.1 53.9 Source: 2010 Population and Housing Census

104
CHAPTER TEN
DISABILITY
10.1 Introduction
The prevention of disability and ensuring care for people with disability (PWDs) and helping
them to become productive citizens is an important aspect of national development. The
government has enacted the Disability Act to address issues of high poverty among PWDs
due to low levels of education and lack of employable skills; inaccessible public transport;
and unfriendly environmental facilities such as the widespread absence of ramps for PWDs
and uncovered drains and gutters. This chapter aims at updating knowledge on prevalence
and selected characteristics of persons with disability in the region.
10.2 Disability by age
The 2010 Population and Housing Census recorded a total of 91,767 persons with disability
in the Volta Region, representing 4.3 percent of the total regional population (Table 10.1).
The table shows that the proportion of persons with disability ranges from a low of 2.0
percent in Nkwanta North District to a high 11.3 percent in South Tongu District. The latter
and seven other districts have rates of disability higher than the regional average – Keta
(7.2%), Jasikan (7.2%), Biakoye (5.5%), South Dayi (5.4%), North Tongu (5.2%), Ho
Municipal (4.9%) and North Dayi (4.7%). In addition, Table 10.1 presents the age pattern of
disability. Across all the districts, the highest proportion of persons with disability are aged
65 years and over (26.1%), followed by children under 15 years (14.8%). It is worth noting
that more than 10% of persons in all the other age groups are disabled. With the exception of
Krachi West and Nkwanta North, all other districts have more than one in five people aged
65 years and older with some form disability. Nkwanta North recorded the largest proportion
of children with disability (22.9%), while Keta has the lowest proportion (11.2%).
Table 10.1: Persons with disability by age and district
Population
N. Prop. of pop.
All ages 0-14 15-24 25-34 35-44 45-54 55-64 65+
All districts 2,118,252 91,767 4.3 100.0 14.8 12.0 11.2 11.8 13.1 10.9 26.1
South Tongu 87,950 9,980 11.3 100.0 15.5 12.7 11.5 11.5 12.7 10.3 25.8
Keta Municipal 147,618 10,632 7.2 100.0 11.2 11.3 9.6 11.6 14.3 12.0 29.9
Ketu South 160,756 5,820 3.6 100.0 19.2 13.1 13.6 11.2 11.7 9.4 21.8
Ketu North 99,913 3,956 4.0 100.0 12.2 11.5 10.3 11.9 12.4 10.7 31.1
Akatsi 128,461 5,090 4.0 100.0 15.0 12.6 11.0 12.0 11.1 9.8 28.5
North Tongu 149,188 7,767 5.2 100.0 17.6 13.5 11.7 11.6 11.6 9.4 24.8
Adaklu Anyigbe 64,404 2,200 3.4 100.0 14.7 12.5 11.8 9.9 12.9 10.4 27.8
Ho Municipal 271,881 13,320 4.9 100.0 11.9 11.4 12.1 11.9 14.0 12.2 26.6
South Dayi 46,661 2,528 5.4 100.0 12.3 10.7 9.7 11.1 13.8 11.7 30.9
North Dayi 93,649 4,390 4.7 100.0 12.9 10.6 9.5 11.9 13.9 11.9 29.3
Hohoe Municipal 262,046 6,335 2.4 100.0 14.3 12.3 10.4 12.2 13.2 11.6 25.9
Biakoye 65,901 3,616 5.5 100.0 13.3 10.0 10.0 12.1 16.3 12.6 25.8
Jasikan 59,181 4,236 7.2 100.0 13.4 9.9 9.4 12.4 15.2 13.4 26.4
Kadjebi 59,303 1,335 2.3 100.0 14.7 9.8 11.0 11.8 12.4 11.5 28.8
Krachi East 116,804 2,769 2.4 100.0 21.3 14.2 13.3 13.0 12.4 9.1 16.6
Krachi West 122,105 4,083 3.3 100.0 20.5 13.8 12.7 13.0 12.3 7.7 20.0
Nkwanta South 117,878 2,428 2.1 100.0 19.4 13.5 12.6 11.2 12.8 8.7 21.8
Nkwanta North 64,553 1,282 2.0 100.0 22.9 12.3 14.3 12.4 10.3 9.2 18.6
Source: 2010 Population and Housing Census

105
10.3 Type of Disabilty
Table10.2 shows the distribution of PWDs by type of disability at the district level. The data
indicates that sight is the highest form of disability in the region (44.3%) followed by
physical (26.6%) and emotional disability (21.1%). The other type of disability recorded the
lowest (7.6%) in the region. Sight continues to be the most common type of disability in all
the districts with Biakoye district recording the highest (60.9%) and Hohoe Municipal
(26.0%) being the lowest. Hearing disability is highest in North Tongu and Ketu South
(23.2%), followed by Nkwanta North (22.8%) with South Tongu recording the lowest
(10.5%). Speech disability is highest in North Tongu and Ketu South (20.9%) followed by
Hohoe Municipal (17.3%) with South Tongu recording the lowest (7.6%). Physical disability
is highest in Kadjebi (35.1%) followed by Hohoe Municipal (34.6%) and Nkwanta North
(32.7%).The district with the lowest rate of physical disability is South Tongu. Intellectual
and Emotional disabilities are high in Ketu South. The other form of disability is the lowest
among the types of disability in all the districts.
Table 10.2: Persons with of disability by type and district
District Population
Persons with Disability
Number Sight Hearing Speech Physical Intellectual Emotional Other
All District 2,118,252 91,767 44.3 15.6 13.5 26.6 16.8 21.1 7.6
South Tongu 87,950 9,980 47.0 10.5 7.6 15.3 18.2 28.1 4.7
Keta Municapal 147,618 10,632 43.1 13.7 9.2 23.1 15.6 26.7 7.6
Ketu South 160,756 5,820 48.0 23.2 20.9 31.9 27.2 25.9 12.3
Ketu North 99,913 3,956 49.7 14.3 11.1 30.8 11.5 12.5 5.8
Akatsi 128,461 5,090 36.9 15.3 16.2 27.6 15.8 16.7 8.1
North Tongu 149,188 7,767 57.0 23.2 20.9 30.6 21.4 27.8 8.3
Adaklu
Anyigbe 64,404 2,200 44.0 15.9 14.5 32.3 14.7 12.1 13.7
Ho Municipal 271,881 13,320 42.1 15.2 14.7 29.5 16.0 25.6 7.0
South Dayi 46,661 2,528 50.0 14.1 9.6 24.4 12.9 15.7 7.0
North Dayi 93,649 4,390 37.9 11.4 11.5 29.6 13.8 20.7 5.3
Hohoe
Municipal 262,046 6,335 26.0 14.7 17.3 34.6 23.7 17.2 10.5
Biakoye 65,901 3,616 60.9 12.1 11.1 20.4 11.2 7.6 7.5
Jasikan 59,181 4,236 54.4 14.1 9.8 19.4 11.1 20.5 5.5
Kadjebi 59,303 1,335 32.7 13.7 14.1 35.1 19.2 18.7 9.8
Krachi East 116,804 2,769 40.1 17.2 14.5 26.9 9.4 13.9 8.6
Krachi West 122,105 4,083 45.6 18.2 11.2 22.0 17.4 10.5 6.9
Nkwanta South 117,878 2,428 34.4 18.1 15.1 29.9 10.7 10.5 8.0
Nkwanta North 64,553 1,282 33.4 22.8 14.5 32.7 11.3 13.0 6.6
Source: 2010 Population and Housing Census
10.4 Disability by Sex
Table 10.2 provides the distribution of persons with disability, by sex and district. Generally,
the proportion of persons with disability is higher among females (2.4%) than among males

106
(1.9%) across all the districts. South Tongu has the highest proportion of both males and
females with disability (4.5% and 6.9% respectively). Krachi West and Hohoe Municipality
reported equal proportions of persons with disability, while the proportions of both sexes with
disability are substantially low in Nkwanta North and Nkwanta South.
Table 10.3: Persons with disability by sex and district
No disability (%) With a disability (%)
Population Total Total
Male Female Total Total Male Female
All districts 2,118,252 2,026,485 95.7 46.2 49.5 91,767 4.3 1.9 2.4
South Tongu 87,950 77,970 88.7 41.0 47.6 9,980 11.3 4.5 6.9
Keta Municipal 147,618 136,986 92.8 43.5 49.3 10,632 7.2 2.9 4.3
Ketu South 160,756 154,936 96.4 45.4 51.0 5,820 3.6 1.6 2.0
Ketu North 99,913 95,957 96.0 44.9 51.1 3,956 4.0 1.7 2.3
Akatsi 128,461 123,371 96.0 44.3 51.7 5,090 4.0 1.7 2.2
North Tongu 149,188 141,421 94.8 44.8 50.0 7,767 5.2 2.3 2.9
Adaklu Anyigbe 64,404 62,204 96.6 47.0 49.6 2,200 3.4 1.6 1.9
Ho Municipal 271,881 258,561 95.1 45.3 49.8 13,320 4.9 2.2 2.7
South Dayi 46,661 44,133 94.6 45.2 49.4 2,528 5.4 2.3 3.2
North Dayi 93,649 89,259 95.3 45.4 49.9 4,390 4.7 2.1 2.5
Hohoe Municipal 262,046 255,711 97.6 47.0 50.6 6,335 2.4 1.2 1.2
Biakoye 65,901 62,285 94.5 47.5 47.1 3,616 5.5 2.7 2.8
Jasikan 59,181 54,945 92.8 46.0 46.9 4,236 7.2 3.3 3.9
Kadjebi 59,303 57,968 97.7 49.3 48.4 1,335 2.3 1.2 1.0
Krachi East 116,804 114,035 97.6 50.7 46.9 2,769 2.4 1.3 1.1
Krachi West 122,105 118,022 96.7 49.1 47.6 4,083 3.3 1.7 1.7
Nkwanta South 117,878 115,450 97.9 48.5 49.4 2,428 2.1 1.1 1.0
Nkwanta North 64,553 63,271 98.0 49.1 48.9 1,282 2.0 1.1 0.9
Source: 2010 Population and Housing Census
10.5 Disability and Marital Status
Although marriage is not the only avenue for social support, it is important for creating and
maintaining expanded social networks for many people in many cultures. In Ghana, as
elsewhere, marriage creates new ties with other kin groups, expanding the range of people
from whom potential resources can be accessed by the disabled person in times of need.
Table 10.3 shows the distribution of persons with disability by marital status, sex and district.
For the region as a whole, about one in five persons with disability have never married, 4.5
percent are in some form of union, 20 percent have once been married but are now separated
(4.7%), divorced (7.4%) or widowed (20.4%).

107
Table 10.4: Persons with disability by marital status, sex and district
Never married (%)
Informal / Consensual union / Living together
(%)
Married (%)
Separated (%)
Divorced (%)
Widowed (%)
District Total Total Male Female Total Male Female Total Male Female Total Male Female Total Male Female Total Male Female
All districts 81,068 22.9 13.9 9.0 4.5 1.9 2.6 40.1 20.1 20.0 4.7 1.9 2.8 7.4 3.2 4.2 20.4 3.0 17.4
South Tongu 8,769 20.2 11.5 8.7 4.6 1.7 3.0 40.1 17.9 22.2 4.7 1.8 3.0 7.8 2.7 5.2 22.5 2.2 20.3
Keta Municipal 9,705 19.0 11.2 7.8 1.4 0.4 1.0 43.3 19.6 23.7 4.4 1.8 2.6 6.4 3.2 3.2 25.4 3.2 22.2
Ketu South 4,915 23.3 12.8 10.5 3.9 1.7 2.1 44.0 21.6 22.5 3.1 1.2 1.9 6.2 3.2 3.1 19.5 3.3 16.2
Ketu North 3,566 20.5 12.9 7.5 3.4 1.3 2.1 39.7 18.7 20.9 4.2 1.7 2.4 6.5 3.0 3.5 25.8 3.7 22.1
Akatsi 4,523 24.3 15.2 9.2 2.1 0.7 1.4 40.7 18.6 22.0 3.3 1.1 2.2 7.3 4.2 3.2 22.4 3.1 19.3
North Tongu 6,685 24.2 13.8 10.4 3.6 1.4 2.2 42.3 20.9 21.4 4.3 1.4 2.9 6.1 2.1 4.0 19.5 2.8 16.7
Adaklu Anyigbe
1,960 23.9 14.2 9.7
4.9 2.2 2.7
37.6 20.8 16.8
6.3 2.4 3.8
7.1 2.9 4.2
20.2 2.9 17.3
Ho Municipal 12,089 24.5 14.6 9.9 8.8 4.0 4.8 35.0 17.8 17.2 6.9 2.8 4.1 6.6 2.5 4.1 18.3 2.8 15.5
South Dayi 2,299 21.1 12.9 8.1 3.5 1.6 1.9 38.2 18.5 19.7 5.1 1.7 3.4 9.3 3.3 6.0 22.9 2.9 20.0
North Dayi 3,946 23.2 14.0 9.1 9.5 3.9 5.5 29.4 15.7 13.7 6.5 3.1 3.4 11.5 4.6 6.8 20.0 3.2 16.8
Hohoe Municipal
5,641 29.7 19.3 10.4
4.0 1.6 2.4
32.3 17.8 14.4
5.8 2.5 3.3
9.1 3.7 5.4
19.1 3.7 15.5
Biakoye 3,226 18.4 12.0 6.4 4.5 2.0 2.5 45.3 24.1 21.2 3.3 1.9 1.3 11.3 5.3 6.0 17.3 2.9 14.4
Jasikan 3,790 19.9 12.2 7.7 5.8 2.7 3.1 42.7 21.6 21.1 3.5 1.3 2.2 8.4 4.2 4.2 19.6 2.6 17.0
Kadjebi 1,170 25.6 16.4 9.1 2.0 1.1 0.9 41.2 24.3 16.9 6.8 3.4 3.4 6.7 4.4 2.3 17.8 4.1 13.7
Krachi East 2,300 28.4 18.1 10.3 6.5 2.8 3.7 43.0 25.3 17.7 2.4 1.1 1.3 7.3 3.7 3.6 12.3 2.7 9.7
Krachi West 3,404 24.5 16.0 8.5 1.5 1.0 0.6 48.8 27.5 21.3 2.4 1.2 1.2 6.0 2.4 3.6 16.8 2.1 14.7
Nkwanta South 2,046 25.2 16.5 8.7 1.9 1.1 0.8 45.6 26.3 19.3 3.9 1.3 2.6 5.4 2.6 2.8 18.0 3.8 14.2
Nkwanta North 1,034 23.0 16.2 6.9 1.2 0.4 0.8 56.0 32.4 23.6 2.6 1.4 1.3 3.8 1.9 1.8 13.4 1.9 11.5
Source: 2010 Population and Housing Census
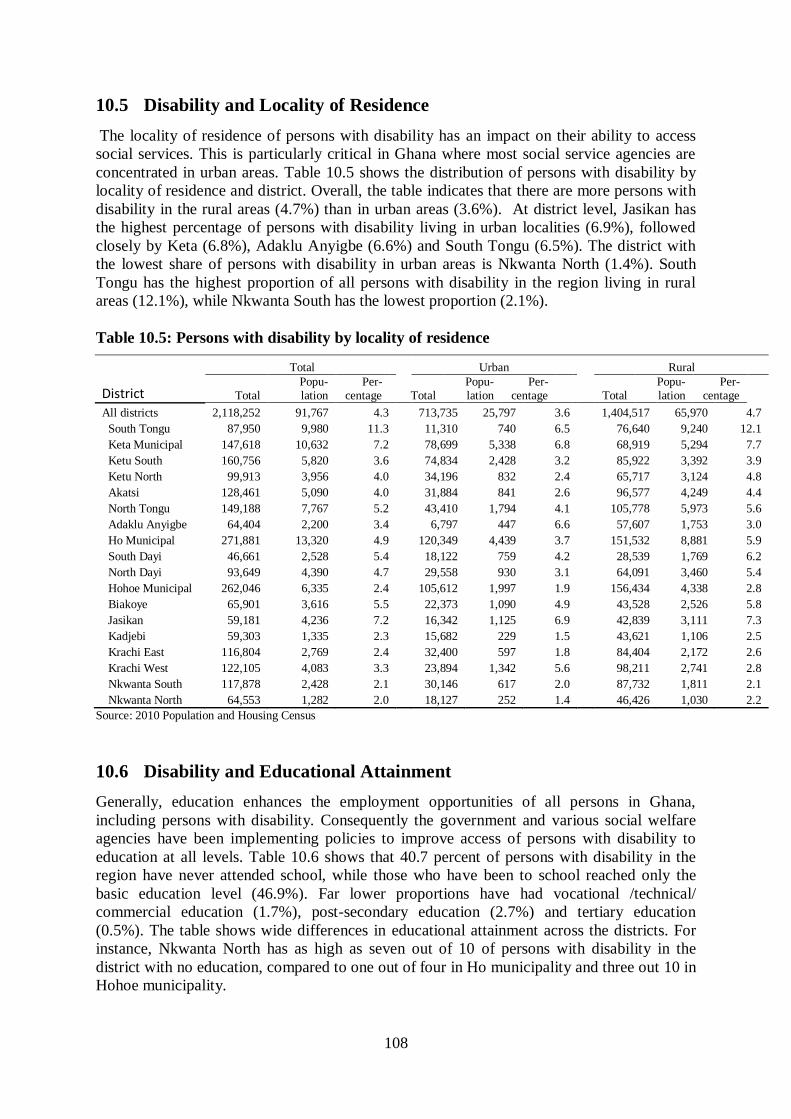
108
10.5 Disability and Locality of Residence
The locality of residence of persons with disability has an impact on their ability to access
social services. This is particularly critical in Ghana where most social service agencies are
concentrated in urban areas. Table 10.5 shows the distribution of persons with disability by
locality of residence and district. Overall, the table indicates that there are more persons with
disability in the rural areas (4.7%) than in urban areas (3.6%). At district level, Jasikan has
the highest percentage of persons with disability living in urban localities (6.9%), followed
closely by Keta (6.8%), Adaklu Anyigbe (6.6%) and South Tongu (6.5%). The district with
the lowest share of persons with disability in urban areas is Nkwanta North (1.4%). South
Tongu has the highest proportion of all persons with disability in the region living in rural
areas (12.1%), while Nkwanta South has the lowest proportion (2.1%).
Table 10.5: Persons with disability by locality of residence
Total
Urban
Rural
District Total Popu-lation
Per-centage Total
Popu-lation
Per-centage Total
Popu-lation
Per-centage
All districts 2,118,252 91,767 4.3
713,735 25,797 3.6
1,404,517 65,970 4.7
South Tongu 87,950 9,980 11.3
11,310 740 6.5
76,640 9,240 12.1
Keta Municipal 147,618 10,632 7.2
78,699 5,338 6.8
68,919 5,294 7.7
Ketu South 160,756 5,820 3.6
74,834 2,428 3.2
85,922 3,392 3.9
Ketu North 99,913 3,956 4.0
34,196 832 2.4
65,717 3,124 4.8
Akatsi 128,461 5,090 4.0
31,884 841 2.6
96,577 4,249 4.4
North Tongu 149,188 7,767 5.2
43,410 1,794 4.1
105,778 5,973 5.6
Adaklu Anyigbe 64,404 2,200 3.4
6,797 447 6.6
57,607 1,753 3.0
Ho Municipal 271,881 13,320 4.9
120,349 4,439 3.7
151,532 8,881 5.9
South Dayi 46,661 2,528 5.4
18,122 759 4.2
28,539 1,769 6.2
North Dayi 93,649 4,390 4.7
29,558 930 3.1
64,091 3,460 5.4
Hohoe Municipal 262,046 6,335 2.4
105,612 1,997 1.9
156,434 4,338 2.8
Biakoye 65,901 3,616 5.5
22,373 1,090 4.9
43,528 2,526 5.8
Jasikan 59,181 4,236 7.2
16,342 1,125 6.9
42,839 3,111 7.3
Kadjebi 59,303 1,335 2.3
15,682 229 1.5
43,621 1,106 2.5
Krachi East 116,804 2,769 2.4
32,400 597 1.8
84,404 2,172 2.6
Krachi West 122,105 4,083 3.3
23,894 1,342 5.6
98,211 2,741 2.8
Nkwanta South 117,878 2,428 2.1
30,146 617 2.0
87,732 1,811 2.1
Nkwanta North 64,553 1,282 2.0 18,127 252 1.4 46,426 1,030 2.2
Source: 2010 Population and Housing Census
10.6 Disability and Educational Attainment
Generally, education enhances the employment opportunities of all persons in Ghana,
including persons with disability. Consequently the government and various social welfare
agencies have been implementing policies to improve access of persons with disability to
education at all levels. Table 10.6 shows that 40.7 percent of persons with disability in the
region have never attended school, while those who have been to school reached only the
basic education level (46.9%). Far lower proportions have had vocational /technical/
commercial education (1.7%), post-secondary education (2.7%) and tertiary education
(0.5%). The table shows wide differences in educational attainment across the districts. For
instance, Nkwanta North has as high as seven out of 10 of persons with disability in the
district with no education, compared to one out of four in Ho municipality and three out 10 in
Hohoe municipality.
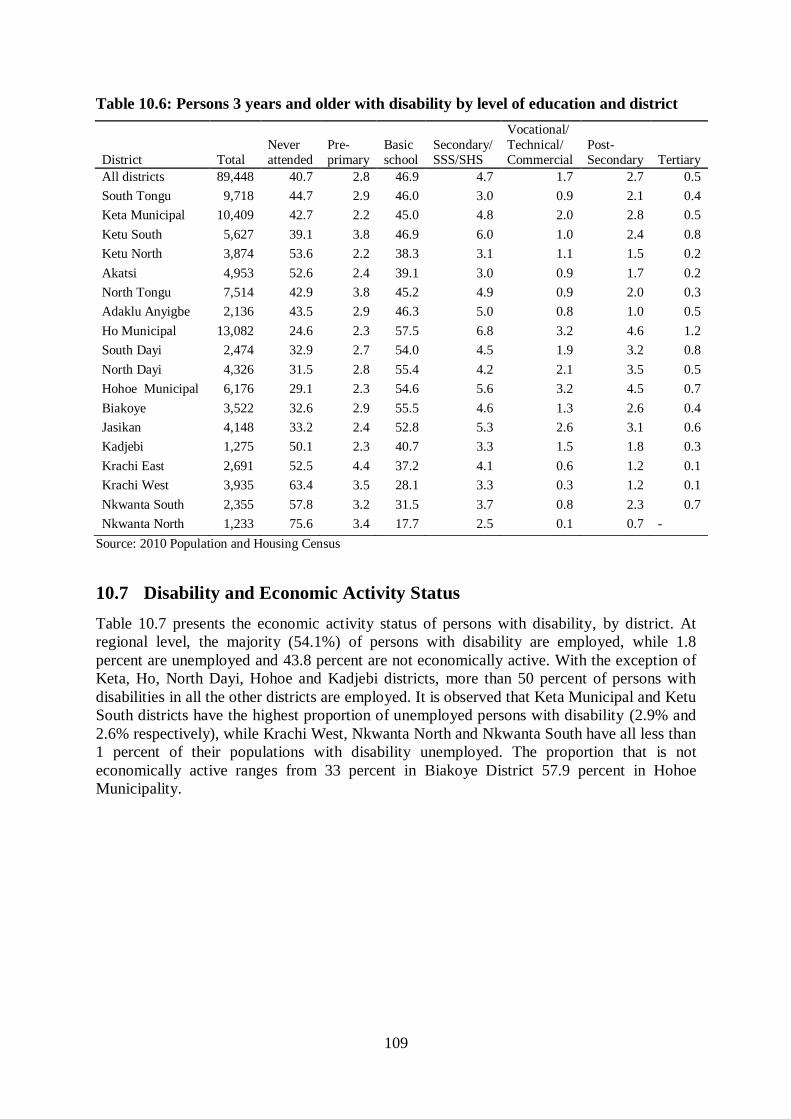
109
Table 10.6: Persons 3 years and older with disability by level of education and district
District Total Never attended
Pre-primary
Basic school
Secondary/ SSS/SHS
Vocational/
Technical/ Commercial
Post-Secondary Tertiary
All districts 89,448 40.7 2.8 46.9 4.7 1.7 2.7 0.5
South Tongu 9,718 44.7 2.9 46.0 3.0 0.9 2.1 0.4
Keta Municipal 10,409 42.7 2.2 45.0 4.8 2.0 2.8 0.5
Ketu South 5,627 39.1 3.8 46.9 6.0 1.0 2.4 0.8
Ketu North 3,874 53.6 2.2 38.3 3.1 1.1 1.5 0.2
Akatsi 4,953 52.6 2.4 39.1 3.0 0.9 1.7 0.2
North Tongu 7,514 42.9 3.8 45.2 4.9 0.9 2.0 0.3
Adaklu Anyigbe 2,136 43.5 2.9 46.3 5.0 0.8 1.0 0.5
Ho Municipal 13,082 24.6 2.3 57.5 6.8 3.2 4.6 1.2
South Dayi 2,474 32.9 2.7 54.0 4.5 1.9 3.2 0.8
North Dayi 4,326 31.5 2.8 55.4 4.2 2.1 3.5 0.5
Hohoe Municipal 6,176 29.1 2.3 54.6 5.6 3.2 4.5 0.7
Biakoye 3,522 32.6 2.9 55.5 4.6 1.3 2.6 0.4
Jasikan 4,148 33.2 2.4 52.8 5.3 2.6 3.1 0.6
Kadjebi 1,275 50.1 2.3 40.7 3.3 1.5 1.8 0.3
Krachi East 2,691 52.5 4.4 37.2 4.1 0.6 1.2 0.1
Krachi West 3,935 63.4 3.5 28.1 3.3 0.3 1.2 0.1
Nkwanta South 2,355 57.8 3.2 31.5 3.7 0.8 2.3 0.7
Nkwanta North 1,233 75.6 3.4 17.7 2.5 0.1 0.7 -
Source: 2010 Population and Housing Census
10.7 Disability and Economic Activity Status
Table 10.7 presents the economic activity status of persons with disability, by district. At
regional level, the majority (54.1%) of persons with disability are employed, while 1.8
percent are unemployed and 43.8 percent are not economically active. With the exception of
Keta, Ho, North Dayi, Hohoe and Kadjebi districts, more than 50 percent of persons with
disabilities in all the other districts are employed. It is observed that Keta Municipal and Ketu
South districts have the highest proportion of unemployed persons with disability (2.9% and
2.6% respectively), while Krachi West, Nkwanta North and Nkwanta South have all less than
1 percent of their populations with disability unemployed. The proportion that is not
economically active ranges from 33 percent in Biakoye District 57.9 percent in Hohoe
Municipality.
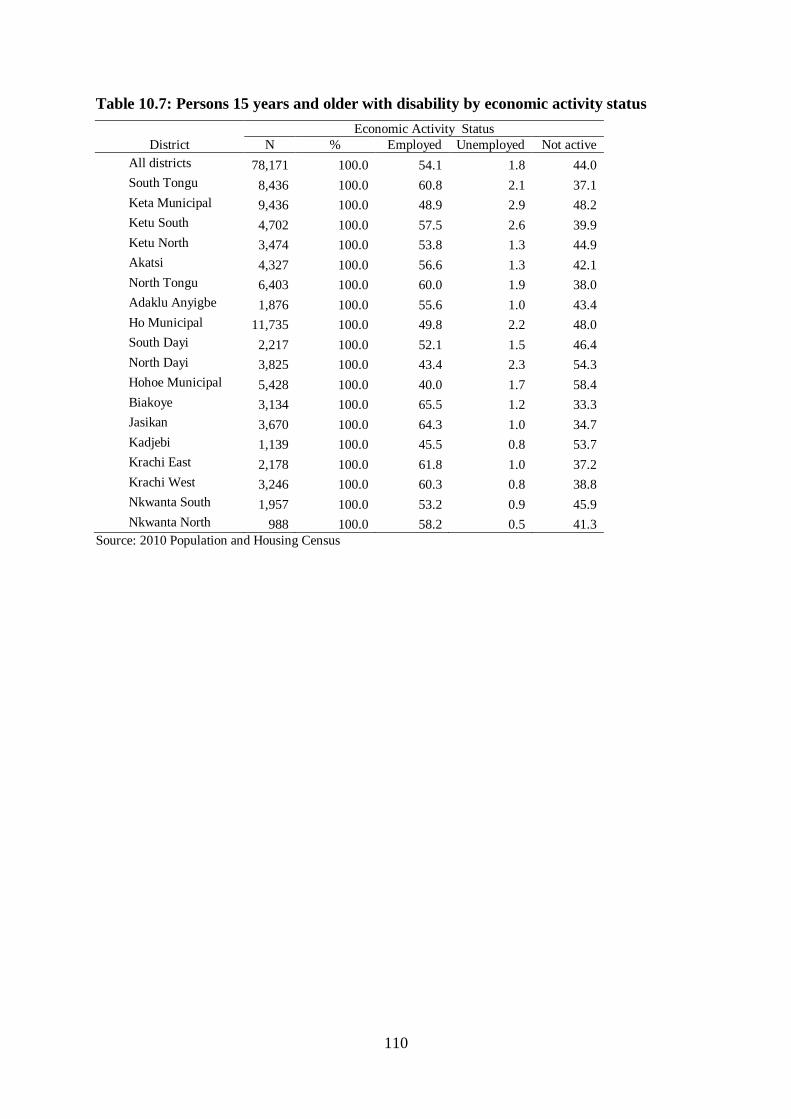
110
Table 10.7: Persons 15 years and older with disability by economic activity status
Economic Activity Status
District N % Employed Unemployed Not active
All districts 78,171 100.0 54.1 1.8 44.0
South Tongu 8,436 100.0 60.8 2.1 37.1
Keta Municipal 9,436 100.0 48.9 2.9 48.2
Ketu South 4,702 100.0 57.5 2.6 39.9
Ketu North 3,474 100.0 53.8 1.3 44.9
Akatsi 4,327 100.0 56.6 1.3 42.1
North Tongu 6,403 100.0 60.0 1.9 38.0
Adaklu Anyigbe 1,876 100.0 55.6 1.0 43.4
Ho Municipal 11,735 100.0 49.8 2.2 48.0
South Dayi 2,217 100.0 52.1 1.5 46.4
North Dayi 3,825 100.0 43.4 2.3 54.3
Hohoe Municipal 5,428 100.0 40.0 1.7 58.4
Biakoye 3,134 100.0 65.5 1.2 33.3
Jasikan 3,670 100.0 64.3 1.0 34.7
Kadjebi 1,139 100.0 45.5 0.8 53.7
Krachi East 2,178 100.0 61.8 1.0 37.2
Krachi West 3,246 100.0 60.3 0.8 38.8
Nkwanta South 1,957 100.0 53.2 0.9 45.9
Nkwanta North 988 100.0 58.2 0.5 41.3
Source: 2010 Population and Housing Census

111
CHAPTER ELEVEN
AGRICULTURAL ACTIVITY
11.1 Introduction
Agriculture plays a vital role in the socio-economic development of the Volta Region. The
region‟s economy is mainly rural and dominated by the agriculture sector, which employs
about 74 percent of the economically active population. The key agricultural sub-sectors
include crops, livestock, fisheries, agroforestry and non-traditional commodities. The average
agricultural land holding is about 0.46 hectares. The farming practices in the region include
mono-cropping, mixed cropping and mixed farming. This chapter presents analysis of data on
the agricultural activities in the region, with a main focus on households in agriculture and
types of farming.
11.2 Households in Agriculture
11.2.1 Number of household members engaged in agriculture
The 2010 Population and Housing Census reported a total of 599,276 household members in
agriculture in the Volta Region, out of which 116,507 are in the urban areas and 482,789 in
the rural areas. At regional level, the majority of the population in agriculture is male
(50.8%), while 49.2 percent are females (Table 11.1). The table further shows that there are
more males in agriculture in urban localities (53.9%) than females (46.1%). On the other
hand, there are equal proportions of males and females in agriculture in the rural areas
(50.0% respectively). At district level, more males than females are in agriculture in urban
areas across all districts, with the exception of Akatsi (49.2%) and North Tongu (48.4%).
However, in the rural areas, females predominate in agriculture in 9 out of the 18 districts.
Table 11.1: Number of household members engaged in agriculture by district,
locality of residence and sex Total Urban Rural
District Total % Male Female Total % Male Female Total % Male Female
All districts 599,276 100.0 50.8 49.2
116,507 100.0 53.9 46.1
482,769 100.0 50.0 50.0
South Tongu 24,900 100.0 46.3 53.7
992 100.0 50.7 49.3
23,908 100.0 46.1 53.9
Keta Municipal 25,033 100.0 49.0 51.0
11,048 100.0 52.4 47.6
13,985 100.0 46.3 53.7
Ketu South 18,240 100.0 52.7 47.3
3,476 100.0 55.6 44.4
14,764 100.0 52.0 48.0
Ketu North 27,781 100.0 49.5 50.5
5,726 100.0 53.7 46.3
22,055 100.0 48.5 51.5
Akatsi 43,235 100.0 43.5 56.5
4,569 100.0 49.2 50.8
38,666 100.0 42.9 57.1
North Tongu 54,980 100.0 46.9 53.1
8,896 100.0 48.4 51.6
46,084 100.0 46.6 53.4
Adaklu Anyigbe 21,857 100.0 49.9 50.1
1,285 100.0 54.2 45.8
20,572 100.0 49.6 50.4
Ho Municipal 62,200 100.0 50.5 49.5
12,531 100.0 54.5 45.5
49,669 100.0 49.5 50.5
South Dayi 13,104 100.0 49.9 50.1
3,257 100.0 51.2 48.8
9,847 100.0 49.5 50.5
North Dayi 24,476 100.0 50.3 49.7
4,321 100.0 54.7 45.3
20,155 100.0 49.3 50.7
Hohoe Municipal 80,547 100.0 52.0 48.0
21,430 100.0 54.4 45.6
59,117 100.0 51.1 48.9
Biakoye 23,519 100.0 52.6 47.4
6,028 100.0 54.2 45.8
17,491 100.0 52.1 47.9
Jasikan 19,488 100.0 53.0 47.0
3,619 100.0 54.7 45.3
15,869 100.0 52.6 47.4
Kadjebi 23,558 100.0 56.0 44.0
4,741 100.0 55.2 44.8
18,817 100.0 56.2 43.8
Krachi East 36,548 100.0 54.9 45.1
8,328 100.0 56.7 43.3
28,220 100.0 54.3 45.7
Krachi West 37,176 100.0 55.1 44.9
5,332 100.0 58.8 41.2
31,844 100.0 54.5 45.5
Nkwanta South 40,398 100.0 52.3 47.7
6,175 100.0 54.9 45.1
34,223 100.0 51.9 48.1
Nkwanta North 22,236 100.0 53.1 46.9 4,753 100.0 56.2 43.8 17,483 100.0 52.2 47.8
Source: 2010 Population and Housing Census
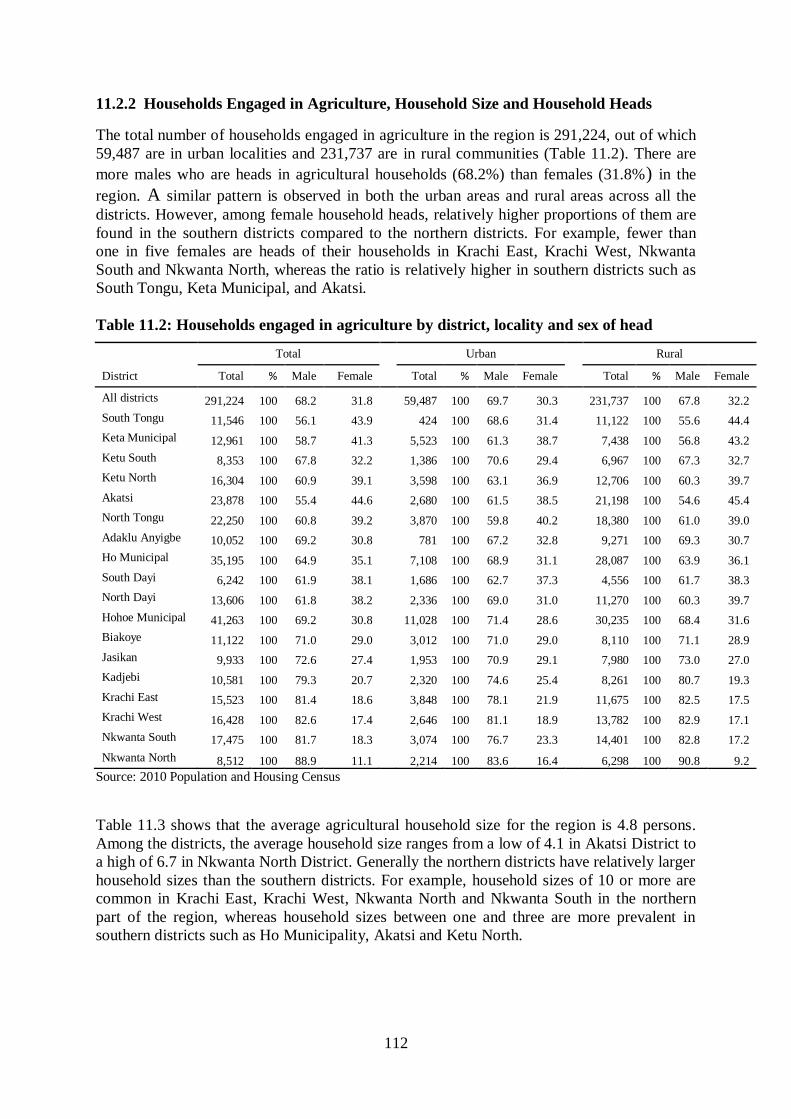
112
11.2.2 Households Engaged in Agriculture, Household Size and Household Heads
The total number of households engaged in agriculture in the region is 291,224, out of which
59,487 are in urban localities and 231,737 are in rural communities (Table 11.2). There are
more males who are heads in agricultural households (68.2%) than females (31.8%) in the
region. A similar pattern is observed in both the urban areas and rural areas across all the
districts. However, among female household heads, relatively higher proportions of them are
found in the southern districts compared to the northern districts. For example, fewer than
one in five females are heads of their households in Krachi East, Krachi West, Nkwanta
South and Nkwanta North, whereas the ratio is relatively higher in southern districts such as
South Tongu, Keta Municipal, and Akatsi.
Table 11.2: Households engaged in agriculture by district, locality and sex of head
Total Urban Rural
District Total % Male Female Total % Male Female Total % Male Female
All districts 291,224 100 68.2 31.8
59,487 100 69.7 30.3
231,737 100 67.8 32.2
South Tongu 11,546 100 56.1 43.9
424 100 68.6 31.4
11,122 100 55.6 44.4
Keta Municipal 12,961 100 58.7 41.3
5,523 100 61.3 38.7
7,438 100 56.8 43.2
Ketu South 8,353 100 67.8 32.2
1,386 100 70.6 29.4
6,967 100 67.3 32.7
Ketu North 16,304 100 60.9 39.1
3,598 100 63.1 36.9
12,706 100 60.3 39.7
Akatsi 23,878 100 55.4 44.6
2,680 100 61.5 38.5
21,198 100 54.6 45.4
North Tongu 22,250 100 60.8 39.2
3,870 100 59.8 40.2
18,380 100 61.0 39.0
Adaklu Anyigbe 10,052 100 69.2 30.8
781 100 67.2 32.8
9,271 100 69.3 30.7
Ho Municipal 35,195 100 64.9 35.1
7,108 100 68.9 31.1
28,087 100 63.9 36.1
South Dayi 6,242 100 61.9 38.1
1,686 100 62.7 37.3
4,556 100 61.7 38.3
North Dayi 13,606 100 61.8 38.2
2,336 100 69.0 31.0
11,270 100 60.3 39.7
Hohoe Municipal 41,263 100 69.2 30.8
11,028 100 71.4 28.6
30,235 100 68.4 31.6
Biakoye 11,122 100 71.0 29.0
3,012 100 71.0 29.0
8,110 100 71.1 28.9
Jasikan 9,933 100 72.6 27.4
1,953 100 70.9 29.1
7,980 100 73.0 27.0
Kadjebi 10,581 100 79.3 20.7
2,320 100 74.6 25.4
8,261 100 80.7 19.3
Krachi East 15,523 100 81.4 18.6
3,848 100 78.1 21.9
11,675 100 82.5 17.5
Krachi West 16,428 100 82.6 17.4
2,646 100 81.1 18.9
13,782 100 82.9 17.1
Nkwanta South 17,475 100 81.7 18.3
3,074 100 76.7 23.3
14,401 100 82.8 17.2
Nkwanta North 8,512 100 88.9 11.1 2,214 100 83.6 16.4 6,298 100 90.8 9.2
Source: 2010 Population and Housing Census
Table 11.3 shows that the average agricultural household size for the region is 4.8 persons.
Among the districts, the average household size ranges from a low of 4.1 in Akatsi District to
a high of 6.7 in Nkwanta North District. Generally the northern districts have relatively larger
household sizes than the southern districts. For example, household sizes of 10 or more are
common in Krachi East, Krachi West, Nkwanta North and Nkwanta South in the northern
part of the region, whereas household sizes between one and three are more prevalent in
southern districts such as Ho Municipality, Akatsi and Ketu North.

113
Table 11.3: Households engaged in agriculture by household size and district
District
Number of persons in household
Total % 1 2 3 4 5 6 7 8 9 10+ Average
All districts 291,224 100.0 12.4 11.4 13.6 14.7 13.5 10.9 7.7 5.4 3.5 7.0 4.8
South Tongu 11,546 100.0 11.6 11.7 13.3 14.7 13.2 11.0 7.6 6.3 3.7 6.8 4.8
Keta Municipal 12,961 100.0 11.4 11.7 14.6 15.3 14.0 11.2 8.1 5.1 3.1 5.4 4.7
Ketu South 8,353 100.0 12.0 12.7 13.8 15.1 14.2 11.8 7.3 4.7 3.1 5.3 4.6
Ketu North 16,304 100.0 15.5 13.8 15.2 15.5 13.9 10.1 6.4 4.1 2.2 3.3 4.2
Akatsi 23,878 100.0 15.9 14.4 16.1 15.6 12.7 9.7 6.2 4.2 2.1 3.0 4.1
North Tongu 22,250 100.0 10.8 10.9 13.0 13.9 13.3 11.0 8.2 6.1 3.9 8.9 5.0
Adaklu Anyigbe 10,052 100.0 11.1 10.3 12.2 14.1 12.2 10.4 7.8 6.2 3.8 11.9 5.2
Ho Municipal 35,195 100.0 15.5 13.6 15.4 15.8 13.4 9.8 6.3 4.2 2.4 3.6 4.2
South Dayi 6,242 100.0 12.1 11.4 13.3 14.6 14.0 11.2 7.8 5.6 3.7 6.1 4.7
North Dayi 13,606 100.0 14.7 12.4 15.0 14.9 13.6 10.6 6.9 4.4 2.7 4.9 4.4
Hohoe Municipal 41,263 100.0 14.4 12.8 14.3 15.2 13.5 10.5 7.0 4.5 2.9 4.9 4.4
Biakoye 11,122 100.0 14.4 11.8 13.3 14.9 13.2 10.1 8.2 5.2 3.2 5.7 4.6
Jasikan 9,933 100.0 13.3 11.9 14.3 15.5 13.9 11.3 7.3 4.6 2.9 4.9 4.5
Kadjebi 10,581 100.0 13.6 11.0 12.4 15.0 13.7 11.2 7.9 5.5 3.0 6.8 4.7
Krachi East 15,523 100.0 7.9 8.0 11.0 13.1 13.4 12.3 9.3 7.1 5.7 12.0 5.7
Krachi West 16,428 100.0 6.9 6.4 10.0 12.2 13.9 12.6 10.1 7.9 6.1 13.9 6.0
Nkwanta South 17,475 100.0 7.2 7.4 11.1 13.9 14.9 12.9 9.9 7.3 5.0 10.6 5.6
Nkwanta North 8,512 100.0 3.1 4.3 8.9 11.9 12.7 11.7 10.9 9.6 6.5 20.3 6.7
Source: 2010 Population and Housing Census
Table 11.4 indicates that Volta Region has an aged population of agricultural household
heads. The largest proportion of agricultural household heads are aged 70 years and older
(13.2%), followed by those aged between 40 and 44 years (11.8%). Household heads in the
southern districts tend to be older than those in the northern districts. For example, while less
than 10 percent of agricultural household heads who are 70 years and older are found in
Krachi East (9.2%), Nkwanta South (8.0%), and Nkwanta North (8.7%), the figure is higher
in southern districts such as Keta (16.3%), South Tongu (17.3%) and Akatsi (17.8%).
As expected, very few agricultural household heads are young. Indeed, less than 1 percent
(0.8%) of agricultural household heads are found in the youngest age group (15- 19 years). A
similar picture of the age distribution of agricultural household heads is observed in the
districts and in both rural and urban areas.
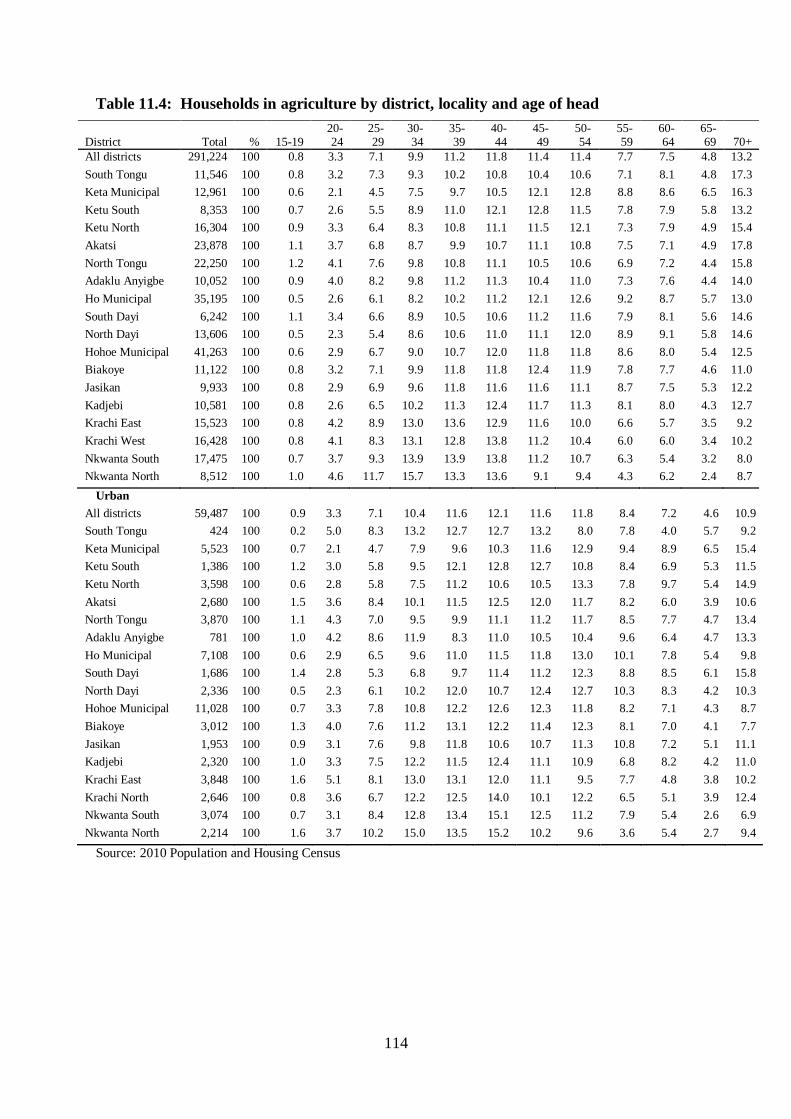
114
Table 11.4: Households in agriculture by district, locality and age of head
District Total % 15-19 20-24
25-29
30-34
35-39
40-44
45-49
50-54
55-59
60-64
65-69 70+
All districts 291,224 100 0.8 3.3 7.1 9.9 11.2 11.8 11.4 11.4 7.7 7.5 4.8 13.2
South Tongu 11,546 100 0.8 3.2 7.3 9.3 10.2 10.8 10.4 10.6 7.1 8.1 4.8 17.3
Keta Municipal 12,961 100 0.6 2.1 4.5 7.5 9.7 10.5 12.1 12.8 8.8 8.6 6.5 16.3
Ketu South 8,353 100 0.7 2.6 5.5 8.9 11.0 12.1 12.8 11.5 7.8 7.9 5.8 13.2
Ketu North 16,304 100 0.9 3.3 6.4 8.3 10.8 11.1 11.5 12.1 7.3 7.9 4.9 15.4
Akatsi 23,878 100 1.1 3.7 6.8 8.7 9.9 10.7 11.1 10.8 7.5 7.1 4.9 17.8
North Tongu 22,250 100 1.2 4.1 7.6 9.8 10.8 11.1 10.5 10.6 6.9 7.2 4.4 15.8
Adaklu Anyigbe 10,052 100 0.9 4.0 8.2 9.8 11.2 11.3 10.4 11.0 7.3 7.6 4.4 14.0
Ho Municipal 35,195 100 0.5 2.6 6.1 8.2 10.2 11.2 12.1 12.6 9.2 8.7 5.7 13.0
South Dayi 6,242 100 1.1 3.4 6.6 8.9 10.5 10.6 11.2 11.6 7.9 8.1 5.6 14.6
North Dayi 13,606 100 0.5 2.3 5.4 8.6 10.6 11.0 11.1 12.0 8.9 9.1 5.8 14.6
Hohoe Municipal 41,263 100 0.6 2.9 6.7 9.0 10.7 12.0 11.8 11.8 8.6 8.0 5.4 12.5
Biakoye 11,122 100 0.8 3.2 7.1 9.9 11.8 11.8 12.4 11.9 7.8 7.7 4.6 11.0
Jasikan 9,933 100 0.8 2.9 6.9 9.6 11.8 11.6 11.6 11.1 8.7 7.5 5.3 12.2
Kadjebi 10,581 100 0.8 2.6 6.5 10.2 11.3 12.4 11.7 11.3 8.1 8.0 4.3 12.7
Krachi East 15,523 100 0.8 4.2 8.9 13.0 13.6 12.9 11.6 10.0 6.6 5.7 3.5 9.2
Krachi West 16,428 100 0.8 4.1 8.3 13.1 12.8 13.8 11.2 10.4 6.0 6.0 3.4 10.2
Nkwanta South 17,475 100 0.7 3.7 9.3 13.9 13.9 13.8 11.2 10.7 6.3 5.4 3.2 8.0
Nkwanta North 8,512 100 1.0 4.6 11.7 15.7 13.3 13.6 9.1 9.4 4.3 6.2 2.4 8.7
Urban
All districts 59,487 100 0.9 3.3 7.1 10.4 11.6 12.1 11.6 11.8 8.4 7.2 4.6 10.9
South Tongu 424 100 0.2 5.0 8.3 13.2 12.7 12.7 13.2 8.0 7.8 4.0 5.7 9.2
Keta Municipal 5,523 100 0.7 2.1 4.7 7.9 9.6 10.3 11.6 12.9 9.4 8.9 6.5 15.4
Ketu South 1,386 100 1.2 3.0 5.8 9.5 12.1 12.8 12.7 10.8 8.4 6.9 5.3 11.5
Ketu North 3,598 100 0.6 2.8 5.8 7.5 11.2 10.6 10.5 13.3 7.8 9.7 5.4 14.9
Akatsi 2,680 100 1.5 3.6 8.4 10.1 11.5 12.5 12.0 11.7 8.2 6.0 3.9 10.6
North Tongu 3,870 100 1.1 4.3 7.0 9.5 9.9 11.1 11.2 11.7 8.5 7.7 4.7 13.4
Adaklu Anyigbe 781 100 1.0 4.2 8.6 11.9 8.3 11.0 10.5 10.4 9.6 6.4 4.7 13.3
Ho Municipal 7,108 100 0.6 2.9 6.5 9.6 11.0 11.5 11.8 13.0 10.1 7.8 5.4 9.8
South Dayi 1,686 100 1.4 2.8 5.3 6.8 9.7 11.4 11.2 12.3 8.8 8.5 6.1 15.8
North Dayi 2,336 100 0.5 2.3 6.1 10.2 12.0 10.7 12.4 12.7 10.3 8.3 4.2 10.3
Hohoe Municipal 11,028 100 0.7 3.3 7.8 10.8 12.2 12.6 12.3 11.8 8.2 7.1 4.3 8.7
Biakoye 3,012 100 1.3 4.0 7.6 11.2 13.1 12.2 11.4 12.3 8.1 7.0 4.1 7.7
Jasikan 1,953 100 0.9 3.1 7.6 9.8 11.8 10.6 10.7 11.3 10.8 7.2 5.1 11.1
Kadjebi 2,320 100 1.0 3.3 7.5 12.2 11.5 12.4 11.1 10.9 6.8 8.2 4.2 11.0
Krachi East 3,848 100 1.6 5.1 8.1 13.0 13.1 12.0 11.1 9.5 7.7 4.8 3.8 10.2
Krachi North 2,646 100 0.8 3.6 6.7 12.2 12.5 14.0 10.1 12.2 6.5 5.1 3.9 12.4
Nkwanta South 3,074 100 0.7 3.1 8.4 12.8 13.4 15.1 12.5 11.2 7.9 5.4 2.6 6.9
Nkwanta North 2,214 100 1.6 3.7 10.2 15.0 13.5 15.2 10.2 9.6 3.6 5.4 2.7 9.4
Source: 2010 Population and Housing Census

115
Table 11.4: Households in agriculture by district, locality and age of head Rural
District Rural
Pop % 15-19 20-24 25-29 30-34
35-39 40-44 45-49 50-54
55-59
60-64 65-69 70+
All districts 231,737 100 0.7 3.2 7.1 9.8 11.1 11.7 11.4 11.2 7.5 7.6 4.8 13.8
South Tongu 11,122 100 0.8 3.1 7.2 9.2 10.1 10.7 10.3 10.7 7.1 8.3 4.8 17.6
Keta Municipal 7,438 100 0.6 2.1 4.4 7.1 9.9 10.6 12.4 12.8 8.4 8.3 6.4 17.0
Ketu South 6,967 100 0.6 2.5 5.5 8.8 10.8 12.0 12.8 11.7 7.7 8.1 5.9 13.5
Ketu North 12,706 100 1.0 3.5 6.6 8.6 10.7 11.2 11.8 11.8 7.1 7.4 4.8 15.6
Akatsi 21,198 100 1.0 3.7 6.6 8.6 9.7 10.5 11.0 10.7 7.4 7.2 5.0 18.7
North Tongu 18,380 100 1.2 4.1 7.8 9.9 11.0 11.1 10.3 10.4 6.5 7.1 4.3 16.3
Adaklu Anyigbe 9,271 100 0.9 4.0 8.2 9.6 11.4 11.3 10.4 11.1 7.1 7.6 4.4 14.0
Ho Municipal 28,087 100 0.4 2.6 6.0 7.9 10.0 11.1 12.2 12.4 9.0 8.9 5.8 13.7
South Dayi 4,556 100 1.0 3.7 7.1 9.7 10.8 10.3 11.2 11.4 7.5 7.9 5.4 14.2
North Dayi 11,270 100 0.5 2.4 5.2 8.3 10.3 11.1 10.9 11.8 8.6 9.3 6.1 15.5
Hohoe Municipal 30,235 100 0.6 2.7 6.3 8.4 10.2 11.7 11.6 11.8 8.7 8.3 5.8 13.9
Biakoye 8,110 100 0.7 2.9 6.9 9.3 11.2 11.7 12.8 11.8 7.7 8.0 4.7 12.3
Jasikan 7,980 100 0.8 2.9 6.7 9.5 11.8 11.9 11.8 11.1 8.2 7.6 5.3 12.4
Kadjebi 8,261 100 0.8 2.4 6.2 9.7 11.3 12.4 11.9 11.4 8.5 8.0 4.3 13.2
Krachi East 11,675 100 0.6 3.9 9.2 12.9 13.8 13.2 11.8 10.1 6.2 6.0 3.3 8.9
Krachi North 13,782 100 0.9 4.2 8.6 13.3 12.9 13.7 11.4 10.0 6.0 6.2 3.3 9.7
Nkwanta South 14,401 100 0.6 3.8 9.5 14.1 14.0 13.5 10.9 10.7 5.9 5.4 3.3 8.2
Nkwanta North 6,298 100 0.8 4.9 12.2 16.0 13.2 13.1 8.7 9.4 4.6 6.5 2.3 8.4
Source: 2010 Population and Housing Census
11.3 Type of Farming Activities
Like other regions in Ghana, the majority of people in the Volta Region are engaged in
agriculture. The region has substantial agricultural resources, which include large expanses of
land suitable for general agriculture (i.e. cultivation of crops and animal rearing). With the
Volta River and Volta Lake running the whole length of the region, there is also potential for
fish farming. This section of the report examines types of crops cultivated, tree growing,
livestock farming, and fish farming.
Table 11.5 presents data on the distribution of agricultural households by district and types of
agricultural activities undertaken. The data show that out of the 291,224 agricultural
households, 271,071 are engaged in crop farming, 1,850 are engaged in tree growing, 11,270
are engaged in livestock rearing, and 557 are engaged in fish farming. Thus the major
agricultural activity in the region by far is crop farming, followed by livestock rearing. More
male household heads are engaged in all the agricultural activities than females across all the
districts. For both urban and rural areas, crop production ranks first in farming activities,
followed by animal rearing in all the districts. The least widespread farming activity in the
region is fish farming.

116
Table 11.5: Households in agriculture, by district, locality, agricultural activity
and sex of head
All households in agriculture
Crop farming
Tree growing
Livestock rearing
Fish farming
District Total % Male Female
Total % Male Female
Total % Male Female
Total % Male Female
Total % Male Female
All districts 291,224 100 68.2 31.8 271017 100 69.4 30.6 1,850 100 77.2 22.8 114270 100 69.4 30.6 557 100 84.2 15.8
South Tongu 11,546 100 56.1 43.9 10,419 100 57.2 42.8 70 100 65.7 34.3 4,387 100 57.5 42.5 80 100 87.5 12.5 Keta
Municipal 12,961 100 58.7 41.3
8,776 100 66.8 33.2
71 100 77.5 22.5
6,621 100 49.9 50.1
45 100 77.8 22.2
Ketu South 8,353 100 67.8 32.2 7,405 100 69.9 30.1 31 100 74.2 25.8 2,218 100 61.3 38.7 9 100 100.0 0.0
Ketu North 16,304 100 60.9 39.1 15,987 100 61.4 38.6 45 100 64.4 35.6 3,482 100 59.8 40.2 6 100 83.3 16.7
Akatsi 23,878 100 55.4 44.6 23,304 100 55.6 44.4 225 100 70.2 29.8 7,256 100 59.2 40.8 14 100 85.7 14.3
North Tongu 22,250 100 60.8 39.2 21,247 100 60.7 39.3 172 100 70.9 29.1 7,617 100 66.6 33.4 80 100 77.5 22.5 Adaklu Anyigbe 10,052 100 69.2 30.8
9,694 100 69.7 30.3
151 100 71.5 28.5
4,088 100 72.9 27.1
8 100 100.0 0.0
Ho Municipal 35,195 100 64.9 35.1 32,641 100 66.0 34.0 225 100 78.7 21.3 12,769 100 65.3 34.7 51 100 78.4 21.6
South Dayi 6,242 100 61.9 38.1 5,820 100 62.8 37.2 56 100 73.2 26.8 2,799 100 62.8 37.2 13 100 92.3 7.7
North Dayi 13,606 100 61.8 38.2 12,352 100 63.2 36.8 64 100 79.7 20.3 6,149 100 61.8 38.2 7 100 85.7 14.3 Hohoe Municipal 41,263 100 69.2 30.8
38,209 100 70.6 29.4
182 100 78.6 21.4
19,527 100 68.0 32.0
24 100 91.7 8.3
Biakoye 11,122 100 71.0 29.0 10,513 100 71.8 28.2 49 100 79.6 20.4 4,826 100 72.0 28.0 33 100 69.7 30.3
Jasikan 9,933 100 72.6 27.4 9,595 100 73.5 26.5 93 100 76.3 23.7 4,514 100 74.8 25.2 11 100 90.9 9.1
Kadjebi 10,581 100 79.3 20.7 10,057 100 81.0 19.0 43 100 81.4 18.6 6,492 100 79.8 20.2 11 100 100.0 0.0
Krachi East 15,523 100 81.4 18.6 14,399 100 82.0 18.0 145 100 87.6 12.4 6,473 100 82.9 17.1 85 100 90.6 9.4
Krachi West 16,428 100 82.6 17.4 15,178 100 83.2 16.8 98 100 90.8 9.2 7,667 100 85.4 14.6 19 100 78.9 21.1 Nkwanta South 17,475 100 81.7 18.3
17,120 100 82.1 17.9
85 100 96.5 3.5
4,019 100 85.8 14.2
54 100 83.3 16.7
Nkwanta
North 8,512 100 88.9 11.1
8,301 100 89.3 10.7
45 100 73.3 26.7
3,366 100 92.3 7.7
7 100 100.0 0.0
Source: 2010 Population and Housing Census
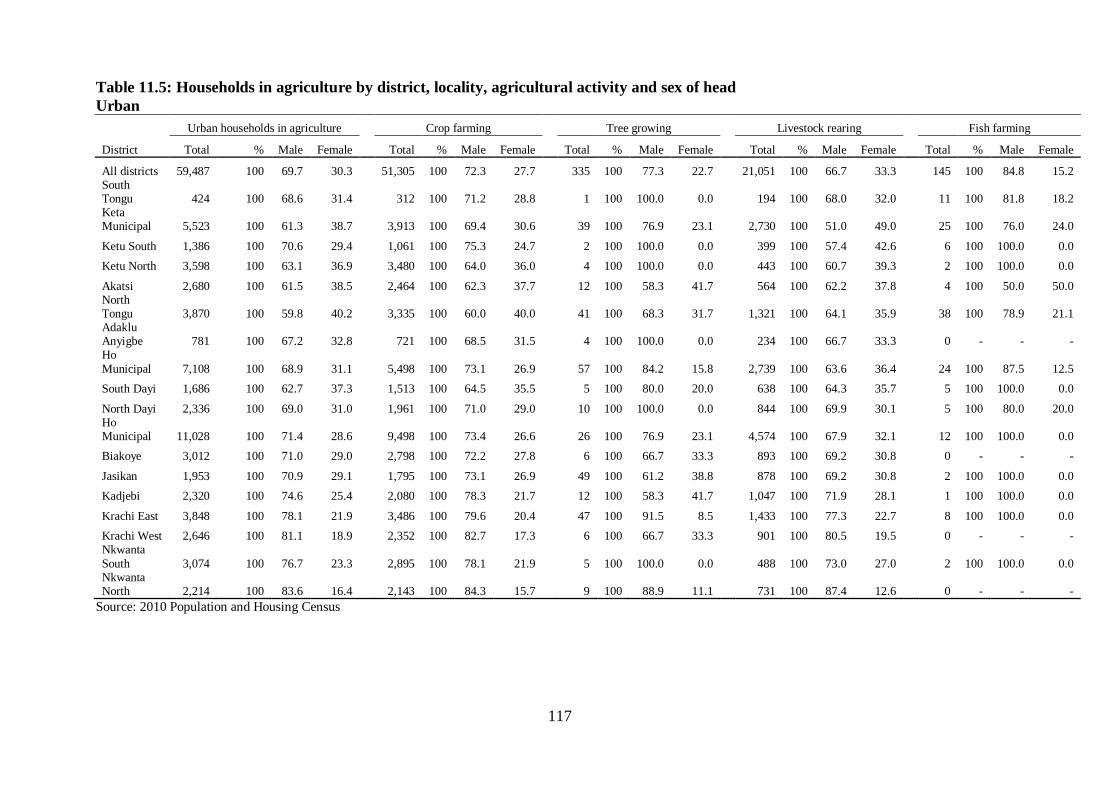
117
Table 11.5: Households in agriculture by district, locality, agricultural activity and sex of head
Urban
Urban households in agriculture
Crop farming
Tree growing
Livestock rearing
Fish farming
District Total % Male Female
Total % Male Female
Total % Male Female
Total % Male Female
Total % Male Female
All districts 59,487 100 69.7 30.3
51,305 100 72.3 27.7
335 100 77.3 22.7
21,051 100 66.7 33.3
145 100 84.8 15.2 South Tongu 424 100 68.6 31.4
312 100 71.2 28.8
1 100 100.0 0.0
194 100 68.0 32.0
11 100 81.8 18.2
Keta Municipal 5,523 100 61.3 38.7
3,913 100 69.4 30.6
39 100 76.9 23.1
2,730 100 51.0 49.0
25 100 76.0 24.0
Ketu South 1,386 100 70.6 29.4
1,061 100 75.3 24.7
2 100 100.0 0.0
399 100 57.4 42.6
6 100 100.0 0.0
Ketu North 3,598 100 63.1 36.9
3,480 100 64.0 36.0
4 100 100.0 0.0
443 100 60.7 39.3
2 100 100.0 0.0
Akatsi 2,680 100 61.5 38.5
2,464 100 62.3 37.7
12 100 58.3 41.7
564 100 62.2 37.8
4 100 50.0 50.0 North Tongu 3,870 100 59.8 40.2
3,335 100 60.0 40.0
41 100 68.3 31.7
1,321 100 64.1 35.9
38 100 78.9 21.1
Adaklu Anyigbe 781 100 67.2 32.8
721 100 68.5 31.5
4 100 100.0 0.0
234 100 66.7 33.3
0 - - -
Ho
Municipal 7,108 100 68.9 31.1
5,498 100 73.1 26.9
57 100 84.2 15.8
2,739 100 63.6 36.4
24 100 87.5 12.5
South Dayi 1,686 100 62.7 37.3
1,513 100 64.5 35.5
5 100 80.0 20.0
638 100 64.3 35.7
5 100 100.0 0.0
North Dayi 2,336 100 69.0 31.0
1,961 100 71.0 29.0
10 100 100.0 0.0
844 100 69.9 30.1
5 100 80.0 20.0 Ho Municipal 11,028 100 71.4 28.6
9,498 100 73.4 26.6
26 100 76.9 23.1
4,574 100 67.9 32.1
12 100 100.0 0.0
Biakoye 3,012 100 71.0 29.0
2,798 100 72.2 27.8
6 100 66.7 33.3
893 100 69.2 30.8
0 - - -
Jasikan 1,953 100 70.9 29.1
1,795 100 73.1 26.9
49 100 61.2 38.8
878 100 69.2 30.8
2 100 100.0 0.0
Kadjebi 2,320 100 74.6 25.4
2,080 100 78.3 21.7
12 100 58.3 41.7
1,047 100 71.9 28.1
1 100 100.0 0.0
Krachi East 3,848 100 78.1 21.9
3,486 100 79.6 20.4
47 100 91.5 8.5
1,433 100 77.3 22.7
8 100 100.0 0.0
Krachi West 2,646 100 81.1 18.9
2,352 100 82.7 17.3
6 100 66.7 33.3
901 100 80.5 19.5
0 - - - Nkwanta
South 3,074 100 76.7 23.3
2,895 100 78.1 21.9
5 100 100.0 0.0
488 100 73.0 27.0
2 100 100.0 0.0 Nkwanta North 2,214 100 83.6 16.4
2,143 100 84.3 15.7
9 100 88.9 11.1
731 100 87.4 12.6
0 - - -
Source: 2010 Population and Housing Census
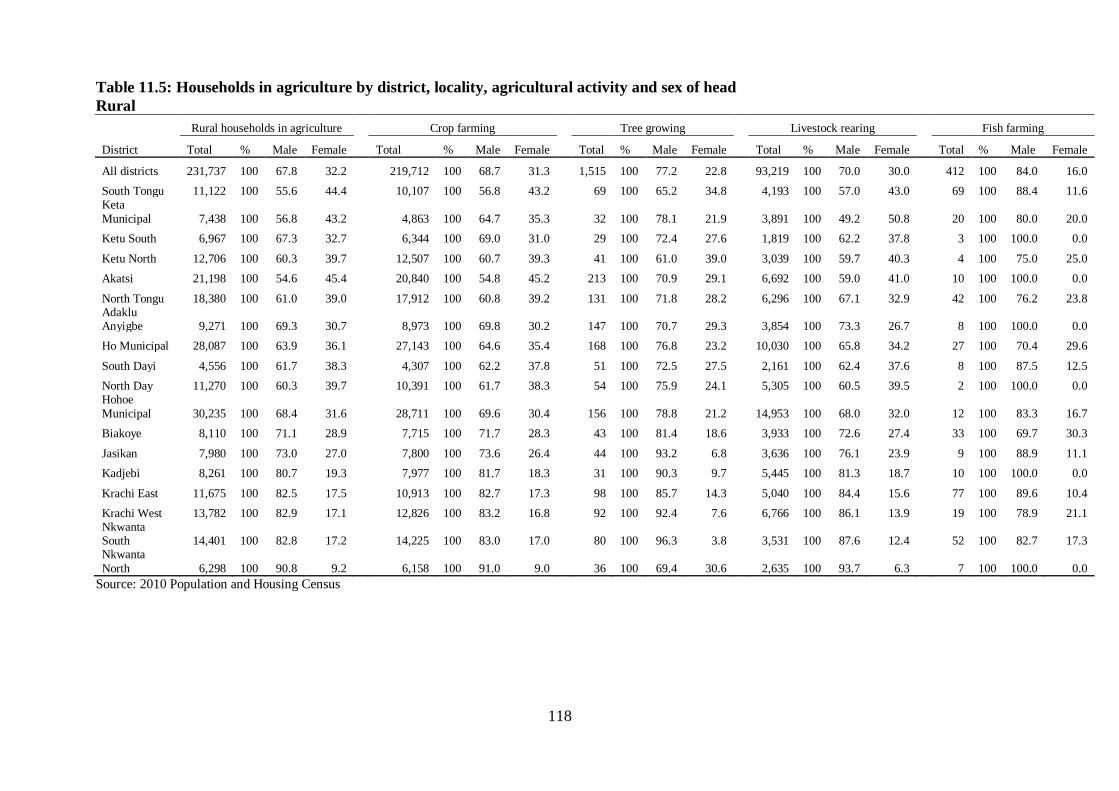
118
Table 11.5: Households in agriculture by district, locality, agricultural activity and sex of head
Rural
Rural households in agriculture
Crop farming
Tree growing
Livestock rearing
Fish farming
District Total % Male Female
Total % Male Female
Total % Male Female
Total % Male Female
Total % Male Female
All districts 231,737 100 67.8 32.2
219,712 100 68.7 31.3
1,515 100 77.2 22.8
93,219 100 70.0 30.0
412 100 84.0 16.0
South Tongu 11,122 100 55.6 44.4
10,107 100 56.8 43.2
69 100 65.2 34.8
4,193 100 57.0 43.0
69 100 88.4 11.6 Keta
Municipal 7,438 100 56.8 43.2
4,863 100 64.7 35.3
32 100 78.1 21.9
3,891 100 49.2 50.8
20 100 80.0 20.0
Ketu South 6,967 100 67.3 32.7
6,344 100 69.0 31.0
29 100 72.4 27.6
1,819 100 62.2 37.8
3 100 100.0 0.0
Ketu North 12,706 100 60.3 39.7
12,507 100 60.7 39.3
41 100 61.0 39.0
3,039 100 59.7 40.3
4 100 75.0 25.0
Akatsi 21,198 100 54.6 45.4
20,840 100 54.8 45.2
213 100 70.9 29.1
6,692 100 59.0 41.0
10 100 100.0 0.0
North Tongu 18,380 100 61.0 39.0
17,912 100 60.8 39.2
131 100 71.8 28.2
6,296 100 67.1 32.9
42 100 76.2 23.8 Adaklu Anyigbe 9,271 100 69.3 30.7
8,973 100 69.8 30.2
147 100 70.7 29.3
3,854 100 73.3 26.7
8 100 100.0 0.0
Ho Municipal 28,087 100 63.9 36.1
27,143 100 64.6 35.4
168 100 76.8 23.2
10,030 100 65.8 34.2
27 100 70.4 29.6
South Dayi 4,556 100 61.7 38.3
4,307 100 62.2 37.8
51 100 72.5 27.5
2,161 100 62.4 37.6
8 100 87.5 12.5
North Day 11,270 100 60.3 39.7
10,391 100 61.7 38.3
54 100 75.9 24.1
5,305 100 60.5 39.5
2 100 100.0 0.0 Hohoe
Municipal 30,235 100 68.4 31.6
28,711 100 69.6 30.4
156 100 78.8 21.2
14,953 100 68.0 32.0
12 100 83.3 16.7
Biakoye 8,110 100 71.1 28.9
7,715 100 71.7 28.3
43 100 81.4 18.6
3,933 100 72.6 27.4
33 100 69.7 30.3
Jasikan 7,980 100 73.0 27.0
7,800 100 73.6 26.4
44 100 93.2 6.8
3,636 100 76.1 23.9
9 100 88.9 11.1
Kadjebi 8,261 100 80.7 19.3
7,977 100 81.7 18.3
31 100 90.3 9.7
5,445 100 81.3 18.7
10 100 100.0 0.0
Krachi East 11,675 100 82.5 17.5
10,913 100 82.7 17.3
98 100 85.7 14.3
5,040 100 84.4 15.6
77 100 89.6 10.4
Krachi West 13,782 100 82.9 17.1
12,826 100 83.2 16.8
92 100 92.4 7.6
6,766 100 86.1 13.9
19 100 78.9 21.1 Nkwanta South 14,401 100 82.8 17.2
14,225 100 83.0 17.0
80 100 96.3 3.8
3,531 100 87.6 12.4
52 100 82.7 17.3
Nkwanta
North 6,298 100 90.8 9.2
6,158 100 91.0 9.0
36 100 69.4 30.6
2,635 100 93.7 6.3
7 100 100.0 0.0
Source: 2010 Population and Housing Census

119
11.3.1 Crop Farming
As indicated earlier, crop production is the dominant type of farming activity in the region.
Crop farming practices include mixed cropping, inter-cropping, and mono-cropping. Table
11.6 shows that the most common farming practice is inter-cropping (39.5%), while mixed
cropping is relatively less popular (24.8%). However, as can be seen from the table, the type
of farming practice adopted depends on the type of crop. For example, cocoyam farming
tends to utilize mixed farming, while the farming practice adopted for ginger, tree planting
and coffee production tends to be mono-cropping.
The table further indicates that a wide variety of crops are produced in the region, including
staples such as yam, cocoyam, millet, sorghum, cassava, garden eggs, and plantain. Non-
traditional crops meant for export include cocoa, apples, black pepper, cashew, nuts, ginger,
pineapple, pawpaw, and mangoes. The highest proportion of farms produce maize (30.9%),
followed by cassava (30.6%), and yam (8.7%).
Table 11.6: Type of crop by number of farms and type of cropping
Type of Crop
Total
farms
Mixed
cropping
Inter-
cropping
Mono-
cropping
Mixed
cropping
%
Inter-
cropping
%
Mono-
cropping
%
All farms 697,859 172,875 275,450 249,534 24.8 39.5 35.8
Agro-forestry (tree planting) 2,186 234 365 1,587 10.7 16.7 72.6
Alligator pepper 636 268 150 218 42.1 23.6 34.3
Apples 375 102 123 150 27.2 32.8 40.0
Asian vegetables (e.g. tinda,
cauliflower) 483 186 155 142 38.5 32.1 29.4
Avocado 227 91 53 83 40.1 23.3 36.6 Banana 3,746 1,673 1,185 888 44.7 31.6 23.7
Beans 10,796 4,814 2,567 3,415 44.6 23.8 31.6
Black pepper 496 105 125 266 21.2 25.2 53.6
Blackberries 67 42 20 5 62.7 29.9 7.5
Cabbage 198 67 63 68 33.8 31.8 34.3
Carrot 809 222 225 362 27.4 27.8 44.7
Cashew 940 208 345 387 22.1 36.7 41.2
Cassava 213,207 42,471 105,027 65,709 19.9 49.3 30.8
Citronella 375 86 177 112 22.9 47.2 29.9
Citrus 644 150 212 282 23.3 32.9 43.8
Cocoa 19,759 4,458 4,663 10,638 22.6 23.6 53.8 Coconut 1,142 240 420 482 21.0 36.8 42.2
Cocoyam / Taro (kooko) 477 214 139 124 44.9 29.1 26.0
Coffee 751 159 136 456 21.2 18.1 60.7
Cola 395 200 106 89 50.6 26.8 22.5
Cotton 127 35 68 24 27.6 53.5 18.9
Cucumber 1,124 239 471 414 21.3 41.9 36.8
Eggplant 197 59 70 68 29.9 35.5 34.5
Garlic 47 15 17 15 31.9 36.2 31.9
Garden eggs 3,052 1,070 850 1,132 35.1 27.9 37.1
Ginger 1,184 155 135 894 13.1 11.4 75.5
Groundnut 22,644 6,223 7,188 9,233 27.5 31.7 40.8
Guava 289 74 86 129 25.6 29.8 44.6 Kenaf 146 29 60 57 19.9 41.1 39.0
Lemon grass 92 26 30 36 28.3 32.6 39.1
Lettuce 113 30 46 37 26.5 40.7 32.7
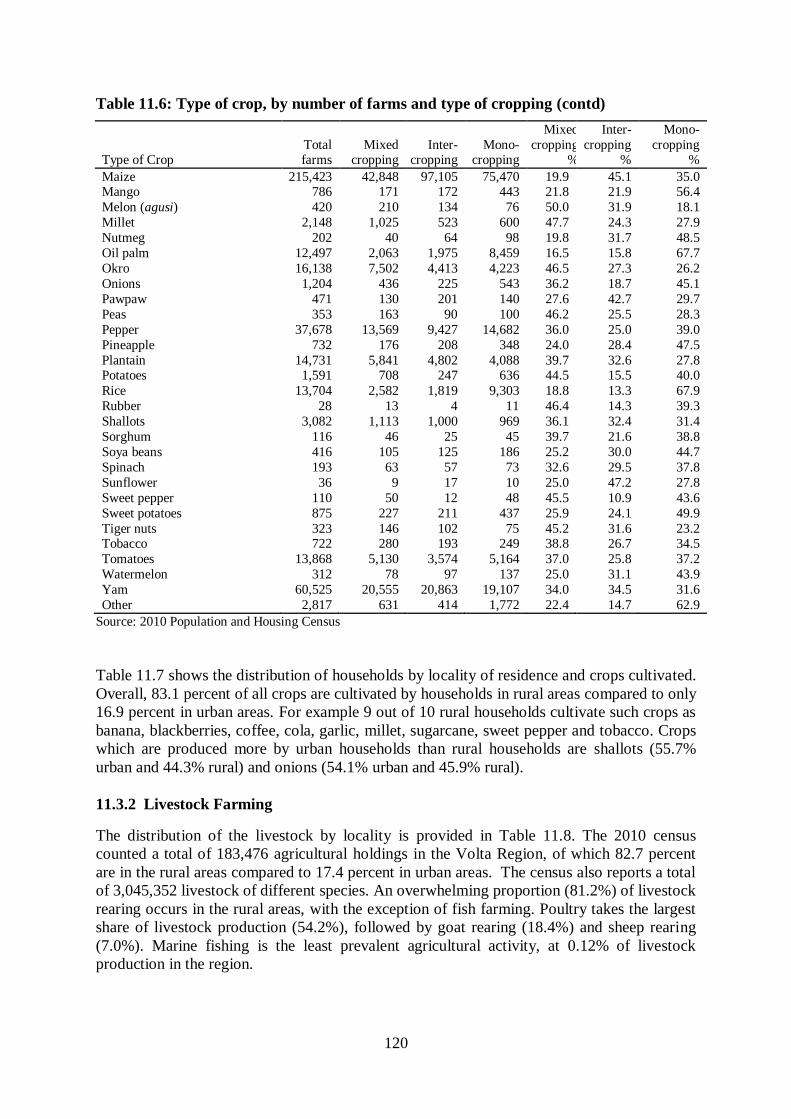
120
Table 11.6: Type of crop, by number of farms and type of cropping (contd)
Type of Crop Total farms
Mixed cropping
Inter- cropping
Mono- cropping
Mixed
cropping %
Inter-
cropping %
Mono-
cropping %
Maize 215,423 42,848 97,105 75,470 19.9 45.1 35.0 Mango 786 171 172 443 21.8 21.9 56.4
Melon (agusi) 420 210 134 76 50.0 31.9 18.1
Millet 2,148 1,025 523 600 47.7 24.3 27.9
Nutmeg 202 40 64 98 19.8 31.7 48.5
Oil palm 12,497 2,063 1,975 8,459 16.5 15.8 67.7
Okro 16,138 7,502 4,413 4,223 46.5 27.3 26.2
Onions 1,204 436 225 543 36.2 18.7 45.1
Pawpaw 471 130 201 140 27.6 42.7 29.7
Peas 353 163 90 100 46.2 25.5 28.3
Pepper 37,678 13,569 9,427 14,682 36.0 25.0 39.0
Pineapple 732 176 208 348 24.0 28.4 47.5
Plantain 14,731 5,841 4,802 4,088 39.7 32.6 27.8 Potatoes 1,591 708 247 636 44.5 15.5 40.0
Rice 13,704 2,582 1,819 9,303 18.8 13.3 67.9
Rubber 28 13 4 11 46.4 14.3 39.3
Shallots 3,082 1,113 1,000 969 36.1 32.4 31.4
Sorghum 116 46 25 45 39.7 21.6 38.8
Soya beans 416 105 125 186 25.2 30.0 44.7
Spinach 193 63 57 73 32.6 29.5 37.8
Sunflower 36 9 17 10 25.0 47.2 27.8
Sweet pepper 110 50 12 48 45.5 10.9 43.6
Sweet potatoes 875 227 211 437 25.9 24.1 49.9
Tiger nuts 323 146 102 75 45.2 31.6 23.2 Tobacco 722 280 193 249 38.8 26.7 34.5
Tomatoes 13,868 5,130 3,574 5,164 37.0 25.8 37.2
Watermelon 312 78 97 137 25.0 31.1 43.9
Yam 60,525 20,555 20,863 19,107 34.0 34.5 31.6
Other 2,817 631 414 1,772 22.4 14.7 62.9
Source: 2010 Population and Housing Census
Table 11.7 shows the distribution of households by locality of residence and crops cultivated.
Overall, 83.1 percent of all crops are cultivated by households in rural areas compared to only
16.9 percent in urban areas. For example 9 out of 10 rural households cultivate such crops as
banana, blackberries, coffee, cola, garlic, millet, sugarcane, sweet pepper and tobacco. Crops
which are produced more by urban households than rural households are shallots (55.7%
urban and 44.3% rural) and onions (54.1% urban and 45.9% rural).
11.3.2 Livestock Farming
The distribution of the livestock by locality is provided in Table 11.8. The 2010 census
counted a total of 183,476 agricultural holdings in the Volta Region, of which 82.7 percent
are in the rural areas compared to 17.4 percent in urban areas. The census also reports a total
of 3,045,352 livestock of different species. An overwhelming proportion (81.2%) of livestock
rearing occurs in the rural areas, with the exception of fish farming. Poultry takes the largest
share of livestock production (54.2%), followed by goat rearing (18.4%) and sheep rearing
(7.0%). Marine fishing is the least prevalent agricultural activity, at 0.12% of livestock
production in the region.
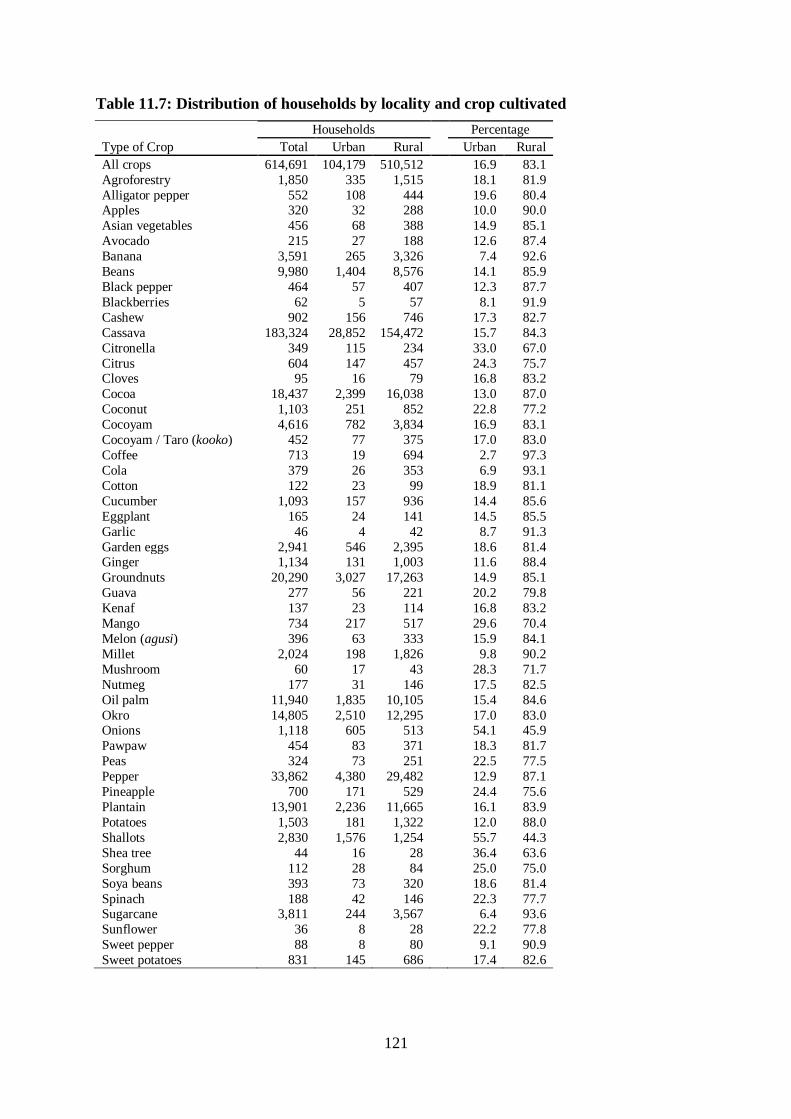
121
Table 11.7: Distribution of households by locality and crop cultivated
Households Percentage
Type of Crop Total Urban Rural Urban Rural
All crops 614,691 104,179 510,512 16.9 83.1
Agroforestry 1,850 335 1,515
18.1 81.9
Alligator pepper 552 108 444
19.6 80.4
Apples 320 32 288
10.0 90.0
Asian vegetables 456 68 388
14.9 85.1
Avocado 215 27 188
12.6 87.4
Banana 3,591 265 3,326
7.4 92.6
Beans 9,980 1,404 8,576
14.1 85.9
Black pepper 464 57 407
12.3 87.7
Blackberries 62 5 57
8.1 91.9
Cashew 902 156 746
17.3 82.7
Cassava 183,324 28,852 154,472
15.7 84.3
Citronella 349 115 234
33.0 67.0
Citrus 604 147 457
24.3 75.7
Cloves 95 16 79
16.8 83.2
Cocoa 18,437 2,399 16,038
13.0 87.0
Coconut 1,103 251 852
22.8 77.2
Cocoyam 4,616 782 3,834
16.9 83.1
Cocoyam / Taro (kooko) 452 77 375
17.0 83.0
Coffee 713 19 694
2.7 97.3
Cola 379 26 353
6.9 93.1
Cotton 122 23 99
18.9 81.1
Cucumber 1,093 157 936
14.4 85.6
Eggplant 165 24 141
14.5 85.5
Garlic 46 4 42
8.7 91.3
Garden eggs 2,941 546 2,395
18.6 81.4
Ginger 1,134 131 1,003
11.6 88.4
Groundnuts 20,290 3,027 17,263
14.9 85.1
Guava 277 56 221
20.2 79.8
Kenaf 137 23 114
16.8 83.2
Mango 734 217 517
29.6 70.4
Melon (agusi) 396 63 333
15.9 84.1
Millet 2,024 198 1,826
9.8 90.2
Mushroom 60 17 43
28.3 71.7
Nutmeg 177 31 146
17.5 82.5
Oil palm 11,940 1,835 10,105
15.4 84.6
Okro 14,805 2,510 12,295
17.0 83.0
Onions 1,118 605 513
54.1 45.9
Pawpaw 454 83 371
18.3 81.7
Peas 324 73 251
22.5 77.5
Pepper 33,862 4,380 29,482
12.9 87.1
Pineapple 700 171 529
24.4 75.6
Plantain 13,901 2,236 11,665
16.1 83.9
Potatoes 1,503 181 1,322
12.0 88.0
Shallots 2,830 1,576 1,254
55.7 44.3
Shea tree 44 16 28
36.4 63.6
Sorghum 112 28 84
25.0 75.0
Soya beans 393 73 320
18.6 81.4
Spinach 188 42 146
22.3 77.7
Sugarcane 3,811 244 3,567
6.4 93.6
Sunflower 36 8 28
22.2 77.8
Sweet pepper 88 8 80
9.1 90.9
Sweet potatoes 831 145 686
17.4 82.6

122
Table 11.7: Distribution of households, by locality and crop cultivated (contd)
Households Percentage
Type of Crop Total Urban Rural Urban Rural
Tiger nuts 303 18 285
5.9 94.1
Tobacco 652 61 591
9.4 90.6
Tomatoes 12,865 3,401 9,464
26.4 73.6
Watermelon 296 81 215
27.4 72.6
Yam 54,523 10,533 43,990
19.3 80.7
Other crops 2,615 540 2,075 20.7 79.3
Source: 2010 Population and Housing Census

123
Table 11.8: Distribution of livestock by locality and number of holdings/livestock
Number. of holdings
Total livestock
Total Urban Rural % Urban % Rural Total Urban Rural % Urban % Rural
Total 183,476 31,862 151,614
17.4 82.6
3,045,352 571,689 2,473,663
18.8 81.2
Beehives 296 28 268
9.5 90.5
10,664 375 10,289
3.5 96.5
Cattle 6,197 873 5,324
14.1 85.9
257,583 37,539 220,044
14.6 85.4
Chickens 80,818 14,175 66,643
17.5 82.5
1,650,123 294,309 1,355,814
17.8 82.2
Dove 587 148 439
25.2 74.8
15,451 3,894 11,557
25.2 74.8
Duck 6,841 2,223 4,618
32.5 67.5
75,571 25,691 49,880
34.0 66.0
Goat 56,644 9,573 47,071
16.9 83.1
561,397 105,024 456,373
18.7 81.3
Grasscutter 486 160 326
32.9 67.1
9,263 1,884 7,379
20.3 79.7
Guinea fowl 3,297 459 2,838
13.9 86.1
62,234 8,433 53,801
13.6 86.4
Ostrich 302 57 245
18.9 81.1
4,340 693 3,647
16.0 84.0
Pig 4,211 791 3,420
18.8 81.2
62,971 13,706 49,265
21.8 78.2
Rabbit 281 137 144
48.8 51.2
5,369 2,109 3,260
39.3 60.7
Sheep 20,266 2,470 17,796
12.2 87.8
212,518 32,519 179,999
15.3 84.7
Silkworm 279 53 226
19.0 81.0
4,714 749 3,965
15.9 84.1
Snail 125 19 106
15.2 84.8
8,247 2,809 5,438
34.1 65.9
Turkey 671 185 486
27.6 72.4
7,969 3,467 4,502
43.5 56.5
Other 1,559 349 1,210
22.4 77.6
13,703 3,019 10,684
22.0 78.0
Fish farming 326 106 220
32.5 67.5
58,146 31,839 26,307
54.8 45.2
Inland fishing 231 34 197
14.7 85.3
21,503 2,942 18,561
13.7 86.3
Marine fishing 59 22 37 37.3 62.7 3,586 688 2,898 19.2 80.8
Source: 2010 Population and Housing Census

124
CHAPTER TWELVE
HOUSING CONDITIONS
12.1 Introduction
The concept of household is used to identify and group persons in a unit of enumeration. The
adopted working definition used in the 2010 Population and Housing Census defines a
household as consisting of “a person or group of persons living together in the same house or
compound, sharing the same housekeeping arrangements and being catered for as one unit”.
It covers those persons joined together in an arrangement to provide food, shelter, and other
basic residential necessities. Each household has a head, recognised as such by members,
who may or may not be the chief breadwinner. People in households have varied living
arrangements, along and cultural and ethnic lines and according to housing conditions. This
chapter provides information on types of housing and housing facilities in the Volta Region.
12.2 Housing Stock
The distribution of housing stock and households in the region is presented in Table 12.1.
The table indicates that the total stock of houses in the region is 399,953, of which the highest
proportion is located in the rural areas (72.2%) compared with urban areas (27.8%). The
district distribution shows that Ho Municipality (13.5%) has the highest proportion of houses,
followed by Hohoe Municipality (11.5%) and Akatsi District (7.6%). Together these three
districts share about 32.6 percent of all houses in the region. Meanwhile, North Tongu
(6.8%), Ketu South (6.3%), Ketu North (5.9%) and Krachi West (5.5%) together have only
24.5 percent of houses and less than 20.0 percent of households in the region.
The data further show that the average population per house in the region of 5.3 is lower than
the national average of 7.3. There are wide variations in population per house by district,
ranging from a low of 3.8 in Akatsi District to a high of 8.4 in Nkwanta North District.
Overall, districts with the largest share of the region‟s housing stock also account for the
largest share of households. In essence, districts with a larger than average regional share of
houses also have a larger than average size of household. Also worth noting is that the
average household size in the region does not vary much among the districts. For the region
as a whole, the average household size is 4.2 with variation from 3.6 in Ho Municipality to
6.4 in Nkwanta North.
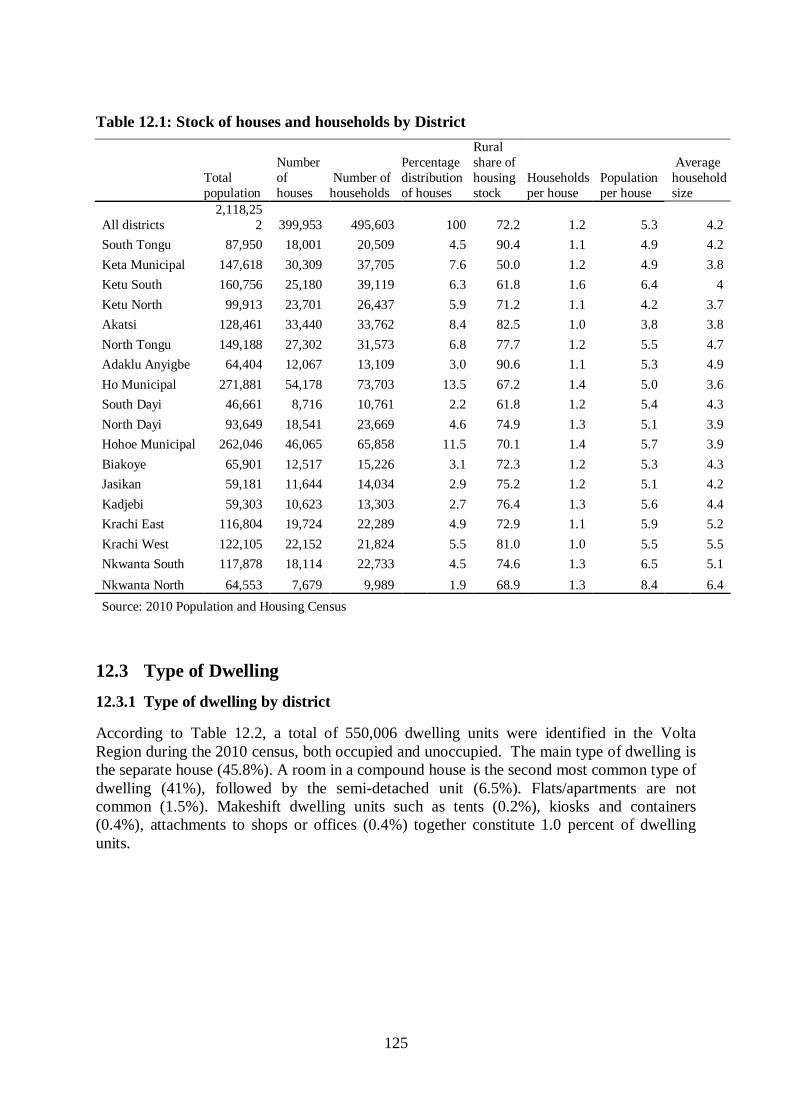
125
Table 12.1: Stock of houses and households by District
Total
population
Number
of
houses
Number of
households
Percentage
distribution
of houses
Rural
share of
housing
stock
Households
per house
Population
per house
Average
household
size
All districts
2,118,25
2 399,953 495,603 100 72.2 1.2 5.3 4.2
South Tongu 87,950 18,001 20,509 4.5 90.4 1.1 4.9 4.2
Keta Municipal 147,618 30,309 37,705 7.6 50.0 1.2 4.9 3.8
Ketu South 160,756 25,180 39,119 6.3 61.8 1.6 6.4 4
Ketu North 99,913 23,701 26,437 5.9 71.2 1.1 4.2 3.7
Akatsi 128,461 33,440 33,762 8.4 82.5 1.0 3.8 3.8
North Tongu 149,188 27,302 31,573 6.8 77.7 1.2 5.5 4.7
Adaklu Anyigbe 64,404 12,067 13,109 3.0 90.6 1.1 5.3 4.9
Ho Municipal 271,881 54,178 73,703 13.5 67.2 1.4 5.0 3.6
South Dayi 46,661 8,716 10,761 2.2 61.8 1.2 5.4 4.3
North Dayi 93,649 18,541 23,669 4.6 74.9 1.3 5.1 3.9
Hohoe Municipal 262,046 46,065 65,858 11.5 70.1 1.4 5.7 3.9
Biakoye 65,901 12,517 15,226 3.1 72.3 1.2 5.3 4.3
Jasikan 59,181 11,644 14,034 2.9 75.2 1.2 5.1 4.2
Kadjebi 59,303 10,623 13,303 2.7 76.4 1.3 5.6 4.4
Krachi East 116,804 19,724 22,289 4.9 72.9 1.1 5.9 5.2
Krachi West 122,105 22,152 21,824 5.5 81.0 1.0 5.5 5.5
Nkwanta South 117,878 18,114 22,733 4.5 74.6 1.3 6.5 5.1
Nkwanta North 64,553 7,679 9,989 1.9 68.9 1.3 8.4 6.4
Source: 2010 Population and Housing Census
12.3 Type of Dwelling
12.3.1 Type of dwelling by district
According to Table 12.2, a total of 550,006 dwelling units were identified in the Volta
Region during the 2010 census, both occupied and unoccupied. The main type of dwelling is
the separate house (45.8%). A room in a compound house is the second most common type of
dwelling (41%), followed by the semi-detached unit (6.5%). Flats/apartments are not
common (1.5%). Makeshift dwelling units such as tents (0.2%), kiosks and containers
(0.4%), attachments to shops or offices (0.4%) together constitute 1.0 percent of dwelling
units.

126
Table 12.2: Type of dwelling by district
District
Total
dwelling
units
Separate
house
Semi-
detache
d house
Flat/
apart-
ment
Com-
pound
house
(rooms)
Huts/
buildings
(same
com-
pound)
Huts/
buildings
(different
com-
pound) Tent
Improvise
d home
(kiosk/
container)
Uncompleted
building
Other
All districts 550,006 45.8 6.5 1.5 41.0 3.1 0.6 0.2 0.4 0.6 0.1
South Tongu 23,525 44.0 4.0 0.7 47.4 2.0 0.3 0.3 0.4 0.5 0.1
Keta Municipal 41,090 41.8 6.8 2.0 44.6 2.8 0.6 0.3 0.2 0.6 0.1
Ketu South 41,527 29.3 6.1 1.4 58.4 2.5 0.8 0.6 0.2 0.4 0.1
Ketu North 30,398 42.8 5.6 1.0 42.2 6.5 0.9 0.1 0.1 0.3 0.1
Akatsi 40,175 59.4 2.6 0.6 33.7 1.7 0.9 0.2 0.2 0.6 0.1
North Tongu 35,719 55.6 7.1 1.4 29.0 4.2 0.8 0.2 0.3 0.7 0.7
Adaklu Anyigbe 14,765 58.3 3.4 1.2 28.1 6.2 1.4 0.2 0.2 0.7 0.1
Ho Municipal 80,868 42.0 5.8 2.7 44.3 2.6 0.6 0.1 0.6 0.8 0.2
South Dayi 11,888 52.6 4.5 2.0 36.8 2.2 0.1 0.1 0.9 0.5 0.1
North Dayi 25,429 43.6 6.6 1.2 43.1 3.3 0.5 0.1 0.4 0.8 0.0
Hohoe Municipal 72,064 39.6 8.1 1.3 47.1 1.9 0.3 0.2 0.4 0.8 0.1
Biakoye 16,495 55.8 8.5 1.0 30.3 3.2 0.2 0.2 0.3 0.4 0.0
Jasikan 16,848 48.0 5.5 1.6 41.0 1.7 0.4 0.1 1.1 0.3 0.1
Kadjebi 14,468 44.9 7.7 1.5 42.2 2.4 0.4 0.2 0.2 0.4 0.0
Krachi East 24,198 52.7 6.9 2.5 28.4 7.2 1.2 0.2 0.4 0.2 0.1
Krachi West 25,474 56.5 1.6 1.1 21.0 4.0 0.3 0.2 0.4 0.3 0.1
Nkwanta South 24,382 49.9 4.8 0.8 40.0 2.5 0.8 0.1 0.1 0.6 0.1
Nkwanta North 10,693 34.3 7.3 2.1 52.3 1.6 1.5 0.3 0.2 0.4 0.0
Source: 2010 Population and Housing Census
12.3.2 Material of Outer Walls
Table 12.3 shows that in the Volta Region, walls of dwelling units are made of two main
construction materials: mud brick/earth (48.1%) and cement block/concrete (45.6%). Walls
made of thatch/palm leaf, (2.1%), sandcrete/landcrete (1.4%) and wood (0.9%) are not
common. The use of mud brick/earth for walls accounts for over 50 percent of dwelling units
in two thirds of the 18 districts in the region, but only 14.7 percent in Ketu South and 10.1
percent in Keta Municipality. At district level, the use of mud brick/earth for walls ranges
from 41.6 percent of dwelling units in South Tongu to 87.9 percent in Nkwanta North.
Cement/block/concrete, the second most widely used material in the region (45.6%), accounts
for 74.7 percent of walls of dwelling units in Ketu South and 72.4 percent in Keta
Municipality and falls to 14.1 percent in Kadjebi and to 9.2 percent in Nkwanta North. Palm
leaf/thatch walls are not common in the region (2.1%) but are found in small but
significant/proportions in the coastal districts of Keta (12.9%) and Ketu South (7.6%). Wood
is also rarely used for walls – the highest use is in South Dayi District (1.4 %).

127
Table 12.3: Main construction material for outer wall by district
District
Total
dwellin
g units
Mud
brick/
earth Wood
Metal
sheet
/slate/
asbestos
Stone
Burnt
bricks
Cement
blocks/
concrete
Land
crete Bamboo
Palm leaf/
Thatch
(grass)/
Raffia Other
All districts 550,006 48.1 0.9 0.6 0.2 0.6 45.6 1.4 0.1 2.1 0.4
South Tongu 23,525 41.6 0.6 0.6 0.4 0.3 55.4 0.2 0.1 0.4 0.4
Keta Municipal 41,090 10.1 0.9 0.8 0.7 0.3 72.4 0.3 0.3 12.9 1.4
Ketu South 41,527 14.7 0.6 0.5 0.3 0.1 74.7 0.1 0.2 7.6 1.1
Ketu North 30,398 44.1 0.4 0.4 0.1 1.3 52.3 0.2 0.1 0.4 0.7
Akatsi 40,175 52.3 0.5 0.4 0.1 0.2 45.2 0.8 0.1 0.2 0.3
North Tongu 35,719 53.4 1.0 0.6 0.1 0.5 41.9 1.9 0.1 0.2 0.3
Adaklu
Anyigbe 14,765 53.6 0.9 0.5 0.1 0.9 42.0 0.7 0.2 0.8 0.3
Ho Municipal 80,868 30.3 1.2 0.8 0.1 1.4 62.6 2.0 0.2 1.1 0.3
South Dayi 11,888 55.1 1.4 0.4 0.3 0.7 41.1 0.5 0.1 0.1 0.2
North Dayi 25,429 43.7 0.9 0.6 0.2 0.7 51.2 1.2 0.3 1.1 0.2
Hohoe
Municipal 72,064 57.7 0.9 0.7 0.2 0.7 38.2 1.1 0.2 0.2 0.2
Biakoye 16,495 61.5 1.1 0.3 0.1 0.3 29.8 4.1 0.2 2.3 0.3
Jasikan 16,848 58.9 1.0 0.2 0.1 0.3 28.1 8.1 0.1 2.8 0.3
Kadjebi 14,468 83.1 1.1 0.4 0.1 0.1 14.1 0.6 0.2 0.0 0.2
Krachi East 24,198 74.4 1.2 0.5 0.1 0.2 20.3 2.7 0.0 0.4 0.3
Krachi West 25,474 71.4 1.0 0.8 0.2 0.4 22.7 2.4 0.1 0.7 0.3
Nkwanta South 24,382 88.2 0.8 0.3 0.1 0.1 9.6 0.6 0.0 0.1 0.2
Nkwanta North 10,693 87.9 1.3 0.3 0.3 0.1 9.2 0.4 0.0 0.3 0.3
Source: 2010 Population and Housing Census
12.3.3 Floor Material
Materials for floors of dwelling units are mainly cement/concrete and earth/mud bricks.
According to Table 12.4, four out of every five (80.2%) households use cement/concrete
while about one fifth (18%) of households use earth/mud for the floor. 0.4 percent of
households in the districts use other materials such as stone, wood, terrazzo, burnt brick,
vinyl/tiles and ceramic/marble tiles. With the exception of Krachi East (64.5%), over 70
percent of households in all other districts in the region use cement/concrete for the floor.
There are 10 districts in which floors are made with earth or mud bricks in proportions higher
than the regional average (18%) while Ho Municipality has the lowest proportion (9.7%).
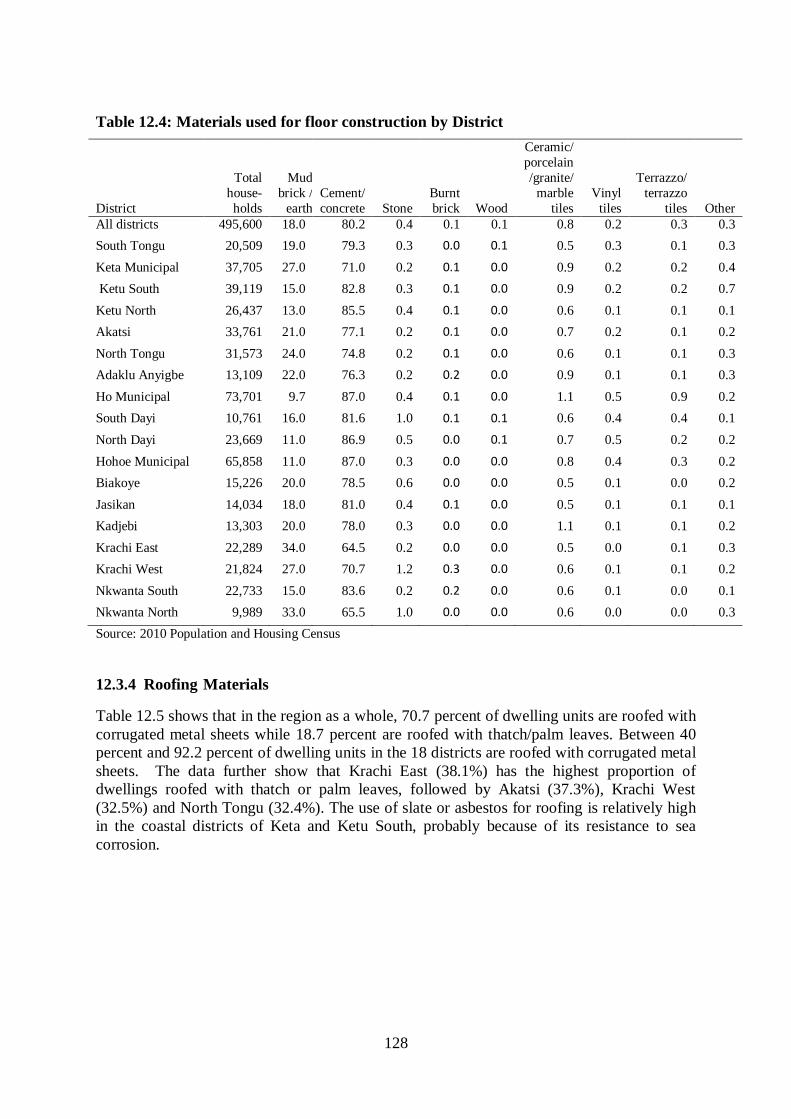
128
Table 12.4: Materials used for floor construction by District
District
Total
house-
holds
Mud
brick /
earth
Cement/
concrete
Stone
Burnt
brick
Wood
Ceramic/
porcelain
/granite/
marble
tiles
Vinyl
tiles
Terrazzo/
terrazzo
tiles
Other
All districts 495,600 18.0 80.2 0.4 0.1 0.1 0.8 0.2 0.3 0.3
South Tongu 20,509 19.0 79.3 0.3 0.0 0.1 0.5 0.3 0.1 0.3
Keta Municipal 37,705 27.0 71.0 0.2 0.1 0.0 0.9 0.2 0.2 0.4
Ketu South 39,119 15.0 82.8 0.3 0.1 0.0 0.9 0.2 0.2 0.7
Ketu North 26,437 13.0 85.5 0.4 0.1 0.0 0.6 0.1 0.1 0.1
Akatsi 33,761 21.0 77.1 0.2 0.1 0.0 0.7 0.2 0.1 0.2
North Tongu 31,573 24.0 74.8 0.2 0.1 0.0 0.6 0.1 0.1 0.3
Adaklu Anyigbe 13,109 22.0 76.3 0.2 0.2 0.0 0.9 0.1 0.1 0.3
Ho Municipal 73,701 9.7 87.0 0.4 0.1 0.0 1.1 0.5 0.9 0.2
South Dayi 10,761 16.0 81.6 1.0 0.1 0.1 0.6 0.4 0.4 0.1
North Dayi 23,669 11.0 86.9 0.5 0.0 0.1 0.7 0.5 0.2 0.2
Hohoe Municipal 65,858 11.0 87.0 0.3 0.0 0.0 0.8 0.4 0.3 0.2
Biakoye 15,226 20.0 78.5 0.6 0.0 0.0 0.5 0.1 0.0 0.2
Jasikan 14,034 18.0 81.0 0.4 0.1 0.0 0.5 0.1 0.1 0.1
Kadjebi 13,303 20.0 78.0 0.3 0.0 0.0 1.1 0.1 0.1 0.2
Krachi East 22,289 34.0 64.5 0.2 0.0 0.0 0.5 0.0 0.1 0.3
Krachi West 21,824 27.0 70.7 1.2 0.3 0.0 0.6 0.1 0.1 0.2
Nkwanta South 22,733 15.0 83.6 0.2 0.2 0.0 0.6 0.1 0.0 0.1
Nkwanta North 9,989 33.0 65.5 1.0 0.0 0.0 0.6 0.0 0.0 0.3
Source: 2010 Population and Housing Census
12.3.4 Roofing Materials
Table 12.5 shows that in the region as a whole, 70.7 percent of dwelling units are roofed with
corrugated metal sheets while 18.7 percent are roofed with thatch/palm leaves. Between 40
percent and 92.2 percent of dwelling units in the 18 districts are roofed with corrugated metal
sheets. The data further show that Krachi East (38.1%) has the highest proportion of
dwellings roofed with thatch or palm leaves, followed by Akatsi (37.3%), Krachi West
(32.5%) and North Tongu (32.4%). The use of slate or asbestos for roofing is relatively high
in the coastal districts of Keta and Ketu South, probably because of its resistance to sea
corrosion.
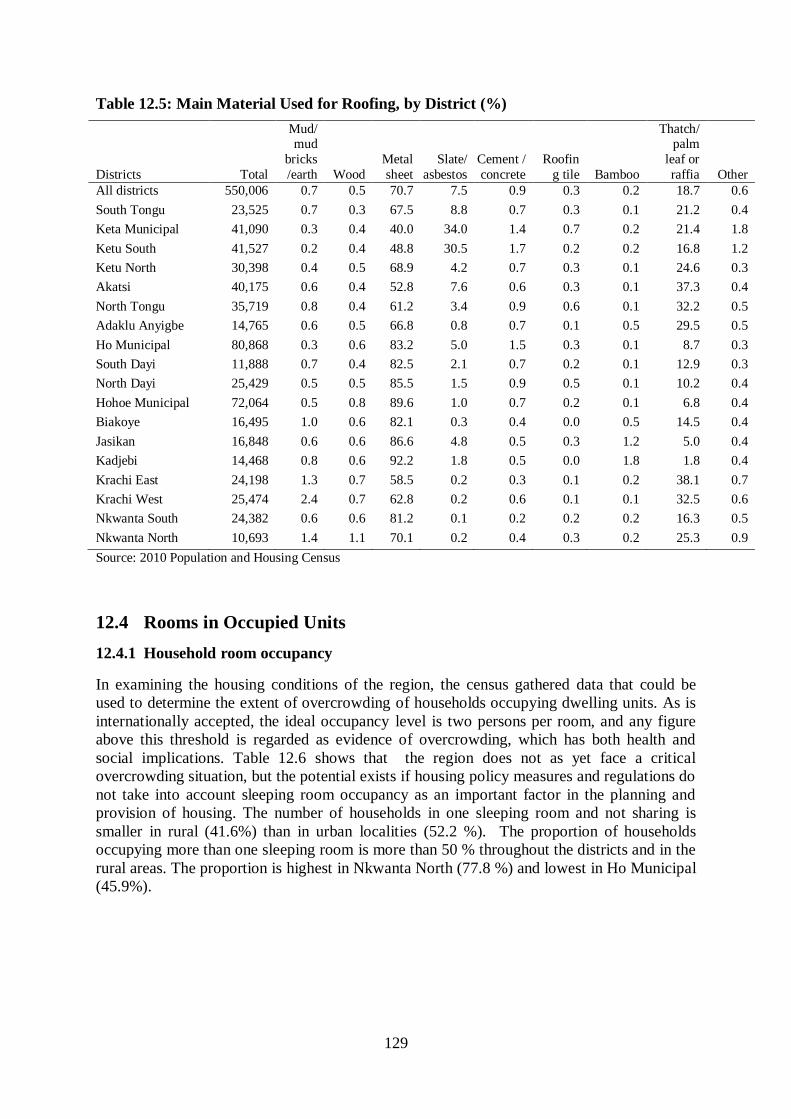
129
Table 12.5: Main Material Used for Roofing, by District (%)
Districts Total
Mud/ mud
bricks
/earth
Wood
Metal
sheet
Slate/
asbestos
Cement /
concrete
Roofin
g tile
Bamboo
Thatch/ palm
leaf or
raffia
Other
All districts 550,006 0.7 0.5 70.7 7.5 0.9 0.3 0.2 18.7 0.6
South Tongu 23,525 0.7 0.3 67.5 8.8 0.7 0.3 0.1 21.2 0.4
Keta Municipal 41,090 0.3 0.4 40.0 34.0 1.4 0.7 0.2 21.4 1.8
Ketu South 41,527 0.2 0.4 48.8 30.5 1.7 0.2 0.2 16.8 1.2
Ketu North 30,398 0.4 0.5 68.9 4.2 0.7 0.3 0.1 24.6 0.3
Akatsi 40,175 0.6 0.4 52.8 7.6 0.6 0.3 0.1 37.3 0.4
North Tongu 35,719 0.8 0.4 61.2 3.4 0.9 0.6 0.1 32.2 0.5
Adaklu Anyigbe 14,765 0.6 0.5 66.8 0.8 0.7 0.1 0.5 29.5 0.5
Ho Municipal 80,868 0.3 0.6 83.2 5.0 1.5 0.3 0.1 8.7 0.3
South Dayi 11,888 0.7 0.4 82.5 2.1 0.7 0.2 0.1 12.9 0.3
North Dayi 25,429 0.5 0.5 85.5 1.5 0.9 0.5 0.1 10.2 0.4
Hohoe Municipal 72,064 0.5 0.8 89.6 1.0 0.7 0.2 0.1 6.8 0.4
Biakoye 16,495 1.0 0.6 82.1 0.3 0.4 0.0 0.5 14.5 0.4
Jasikan 16,848 0.6 0.6 86.6 4.8 0.5 0.3 1.2 5.0 0.4
Kadjebi 14,468 0.8 0.6 92.2 1.8 0.5 0.0 1.8 1.8 0.4
Krachi East 24,198 1.3 0.7 58.5 0.2 0.3 0.1 0.2 38.1 0.7
Krachi West 25,474 2.4 0.7 62.8 0.2 0.6 0.1 0.1 32.5 0.6
Nkwanta South 24,382 0.6 0.6 81.2 0.1 0.2 0.2 0.2 16.3 0.5
Nkwanta North 10,693 1.4 1.1 70.1 0.2 0.4 0.3 0.2 25.3 0.9
Source: 2010 Population and Housing Census
12.4 Rooms in Occupied Units
12.4.1 Household room occupancy
In examining the housing conditions of the region, the census gathered data that could be
used to determine the extent of overcrowding of households occupying dwelling units. As is
internationally accepted, the ideal occupancy level is two persons per room, and any figure
above this threshold is regarded as evidence of overcrowding, which has both health and
social implications. Table 12.6 shows that the region does not as yet face a critical
overcrowding situation, but the potential exists if housing policy measures and regulations do
not take into account sleeping room occupancy as an important factor in the planning and
provision of housing. The number of households in one sleeping room and not sharing is
smaller in rural (41.6%) than in urban localities (52.2 %). The proportion of households
occupying more than one sleeping room is more than 50 % throughout the districts and in the
rural areas. The proportion is highest in Nkwanta North (77.8 %) and lowest in Ho Municipal
(45.9%).
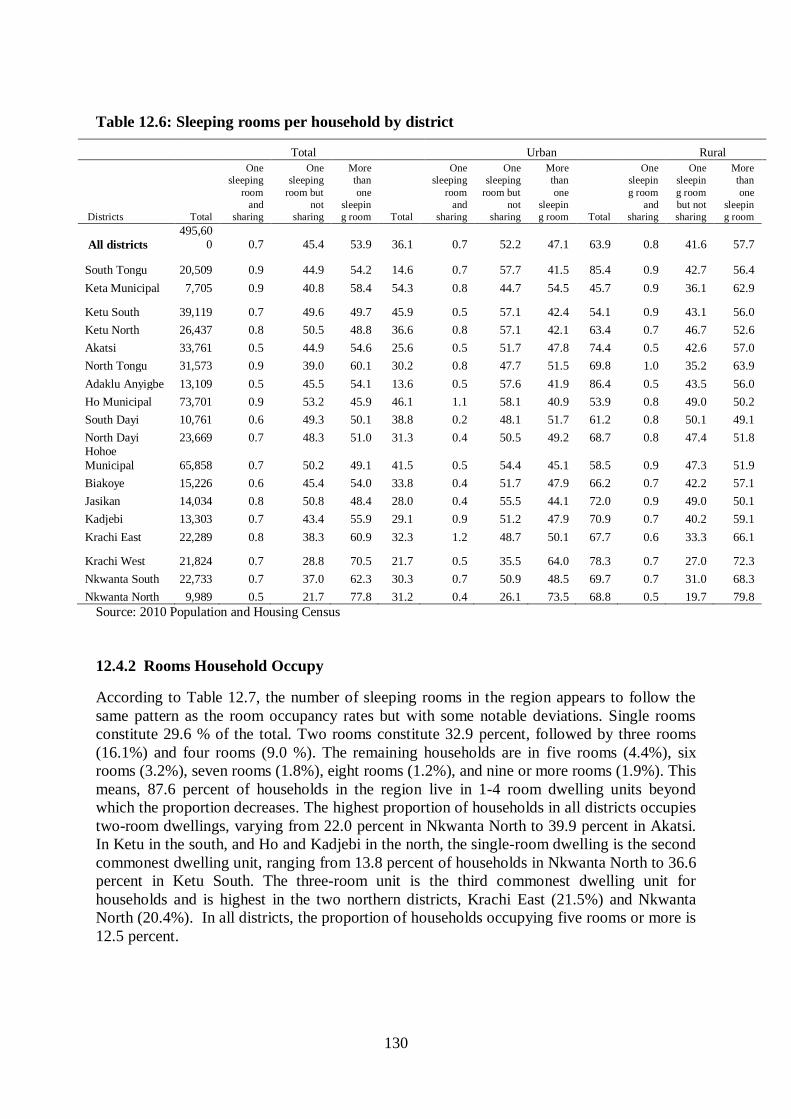
130
Table 12.6: Sleeping rooms per household by district
Total Urban Rural
Districts Total
One
sleeping
room
and
sharing
One
sleeping
room but
not
sharing
More
than
one
sleepin
g room Total
One
sleeping
room
and
sharing
One
sleeping
room but
not
sharing
More
than
one
sleepin
g room Total
One
sleepin
g room
and
sharing
One
sleepin
g room
but not
sharing
More
than
one
sleepin
g room
All districts
495,600 0.7 45.4 53.9 36.1 0.7 52.2 47.1 63.9 0.8 41.6 57.7
South Tongu 20,509 0.9 44.9 54.2 14.6 0.7 57.7 41.5 85.4 0.9 42.7 56.4
Keta Municipal 7,705 0.9 40.8 58.4 54.3 0.8 44.7 54.5 45.7 0.9 36.1 62.9
Ketu South 39,119 0.7 49.6 49.7 45.9 0.5 57.1 42.4 54.1 0.9 43.1 56.0
Ketu North 26,437 0.8 50.5 48.8 36.6 0.8 57.1 42.1 63.4 0.7 46.7 52.6
Akatsi 33,761 0.5 44.9 54.6 25.6 0.5 51.7 47.8 74.4 0.5 42.6 57.0
North Tongu 31,573 0.9 39.0 60.1 30.2 0.8 47.7 51.5 69.8 1.0 35.2 63.9
Adaklu Anyigbe 13,109 0.5 45.5 54.1 13.6 0.5 57.6 41.9 86.4 0.5 43.5 56.0
Ho Municipal 73,701 0.9 53.2 45.9 46.1 1.1 58.1 40.9 53.9 0.8 49.0 50.2
South Dayi 10,761 0.6 49.3 50.1 38.8 0.2 48.1 51.7 61.2 0.8 50.1 49.1
North Dayi 23,669 0.7 48.3 51.0 31.3 0.4 50.5 49.2 68.7 0.8 47.4 51.8 Hohoe
Municipal 65,858 0.7 50.2 49.1 41.5 0.5 54.4 45.1 58.5 0.9 47.3 51.9
Biakoye 15,226 0.6 45.4 54.0 33.8 0.4 51.7 47.9 66.2 0.7 42.2 57.1
Jasikan 14,034 0.8 50.8 48.4 28.0 0.4 55.5 44.1 72.0 0.9 49.0 50.1
Kadjebi 13,303 0.7 43.4 55.9 29.1 0.9 51.2 47.9 70.9 0.7 40.2 59.1
Krachi East 22,289 0.8 38.3 60.9 32.3 1.2 48.7 50.1 67.7 0.6 33.3 66.1
Krachi West 21,824 0.7 28.8 70.5 21.7 0.5 35.5 64.0 78.3 0.7 27.0 72.3
Nkwanta South 22,733 0.7 37.0 62.3 30.3 0.7 50.9 48.5 69.7 0.7 31.0 68.3
Nkwanta North 9,989 0.5 21.7 77.8 31.2 0.4 26.1 73.5 68.8 0.5 19.7 79.8
Source: 2010 Population and Housing Census
12.4.2 Rooms Household Occupy
According to Table 12.7, the number of sleeping rooms in the region appears to follow the
same pattern as the room occupancy rates but with some notable deviations. Single rooms
constitute 29.6 % of the total. Two rooms constitute 32.9 percent, followed by three rooms
(16.1%) and four rooms (9.0 %). The remaining households are in five rooms (4.4%), six
rooms (3.2%), seven rooms (1.8%), eight rooms (1.2%), and nine or more rooms (1.9%). This
means, 87.6 percent of households in the region live in 1-4 room dwelling units beyond
which the proportion decreases. The highest proportion of households in all districts occupies
two-room dwellings, varying from 22.0 percent in Nkwanta North to 39.9 percent in Akatsi.
In Ketu in the south, and Ho and Kadjebi in the north, the single-room dwelling is the second
commonest dwelling unit, ranging from 13.8 percent of households in Nkwanta North to 36.6
percent in Ketu South. The three-room unit is the third commonest dwelling unit for
households and is highest in the two northern districts, Krachi East (21.5%) and Nkwanta
North (20.4%). In all districts, the proportion of households occupying five rooms or more is
12.5 percent.
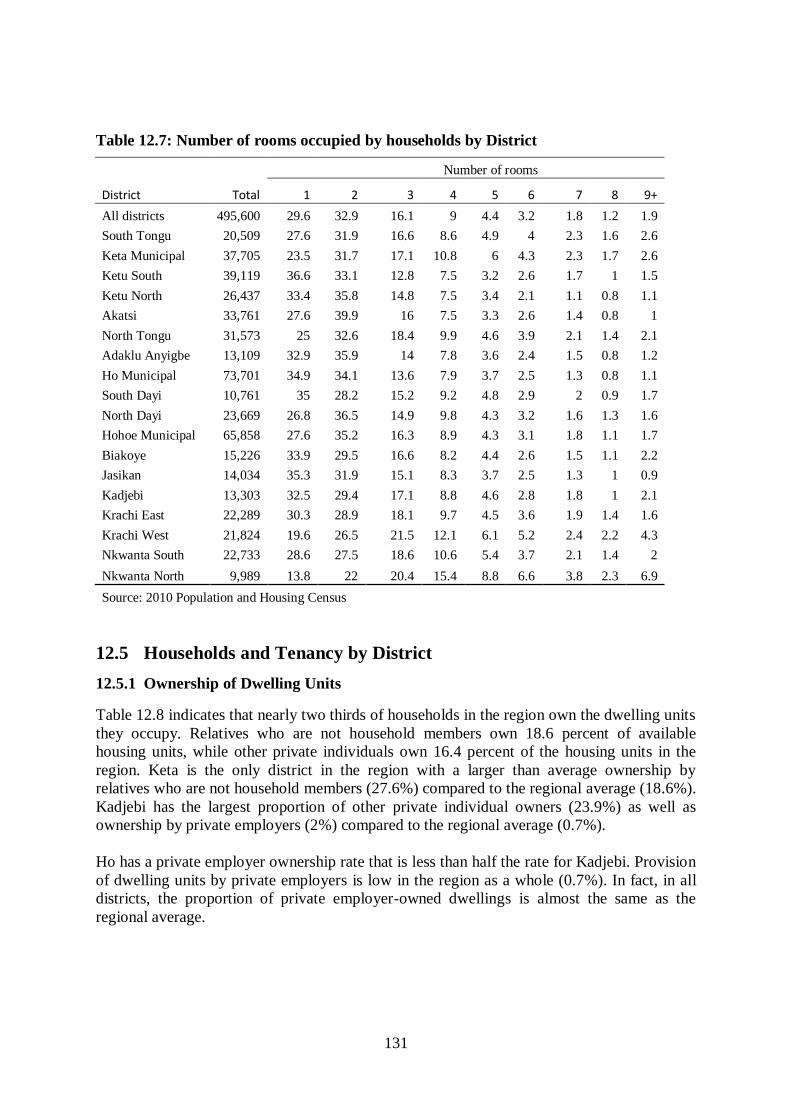
131
Table 12.7: Number of rooms occupied by households by District
District
Number of rooms
Total 1 2 3 4 5 6 7 8 9+
All districts 495,600 29.6 32.9 16.1 9 4.4 3.2 1.8 1.2 1.9
South Tongu 20,509 27.6 31.9 16.6 8.6 4.9 4 2.3 1.6 2.6
Keta Municipal 37,705 23.5 31.7 17.1 10.8 6 4.3 2.3 1.7 2.6
Ketu South 39,119 36.6 33.1 12.8 7.5 3.2 2.6 1.7 1 1.5
Ketu North 26,437 33.4 35.8 14.8 7.5 3.4 2.1 1.1 0.8 1.1
Akatsi 33,761 27.6 39.9 16 7.5 3.3 2.6 1.4 0.8 1
North Tongu 31,573 25 32.6 18.4 9.9 4.6 3.9 2.1 1.4 2.1
Adaklu Anyigbe 13,109 32.9 35.9 14 7.8 3.6 2.4 1.5 0.8 1.2
Ho Municipal 73,701 34.9 34.1 13.6 7.9 3.7 2.5 1.3 0.8 1.1
South Dayi 10,761 35 28.2 15.2 9.2 4.8 2.9 2 0.9 1.7
North Dayi 23,669 26.8 36.5 14.9 9.8 4.3 3.2 1.6 1.3 1.6
Hohoe Municipal 65,858 27.6 35.2 16.3 8.9 4.3 3.1 1.8 1.1 1.7
Biakoye 15,226 33.9 29.5 16.6 8.2 4.4 2.6 1.5 1.1 2.2
Jasikan 14,034 35.3 31.9 15.1 8.3 3.7 2.5 1.3 1 0.9
Kadjebi 13,303 32.5 29.4 17.1 8.8 4.6 2.8 1.8 1 2.1
Krachi East 22,289 30.3 28.9 18.1 9.7 4.5 3.6 1.9 1.4 1.6
Krachi West 21,824 19.6 26.5 21.5 12.1 6.1 5.2 2.4 2.2 4.3
Nkwanta South 22,733 28.6 27.5 18.6 10.6 5.4 3.7 2.1 1.4 2
Nkwanta North 9,989 13.8 22 20.4 15.4 8.8 6.6 3.8 2.3 6.9
Source: 2010 Population and Housing Census
12.5 Households and Tenancy by District
12.5.1 Ownership of Dwelling Units
Table 12.8 indicates that nearly two thirds of households in the region own the dwelling units
they occupy. Relatives who are not household members own 18.6 percent of available
housing units, while other private individuals own 16.4 percent of the housing units in the
region. Keta is the only district in the region with a larger than average ownership by
relatives who are not household members (27.6%) compared to the regional average (18.6%).
Kadjebi has the largest proportion of other private individual owners (23.9%) as well as
ownership by private employers (2%) compared to the regional average (0.7%).
Ho has a private employer ownership rate that is less than half the rate for Kadjebi. Provision
of dwelling units by private employers is low in the region as a whole (0.7%). In fact, in all
districts, the proportion of private employer-owned dwellings is almost the same as the
regional average.

132
Table 12.8: Ownership of dwelling by district
Total
number
Total
(%)
Owned by
household
member
Being purchased
(e.g.
mortgage)
Relative not a
household
member
Other private
individual
Private
employer
Other private
agency
Public/ govern-
ment owner-
ship Other
All districts 495,600 100.0 61.4 0.6 18.6 16.4 0.7 0.3 1.6 0.4
South Tongu 20,509 100.0 60.0 0.5 22.6 13.1 0.8 0.5 1.7 0.8
Keta Municipal 37,705 100.0 60.3 0.4 27.6 9.2 0.7 0.1 1.1 0.5
Ketu South 39,119 100.0 58.6 0.5 20.9 17.9 0.6 0.2 0.9 0.3
Ketu North 26,437 100.0 61.4 1.0 25.1 10.9 0.4 0.1 0.8 0.3
Akatsi 33,761 100.0 63.3 0.2 20.8 14.3 0.5 0.0 0.7 0.2
North Tongu 31,573 100.0 69.2 0.6 17.4 10.7 0.6 0.1 0.8 0.5
Adaklu Anyigbe 13,109 100.0 67.4 0.4 18.3 11.8 0.5 0.2 1.1 0.4
Ho Municipal 73,701 100.0 50.8 0.7 19.7 23.5 0.9 0.3 3.9 0.4
South Dayi 10,761 100.0 60.5 0.8 17.5 17.2 0.5 0.4 3.0 0.3
North Dayi 23,669 100.0 54.1 1.0 22.6 19.3 0.6 0.4 1.6 0.4
Hohoe Municipal 65,858 100.0 58.6 0.4 16.2 21.3 0.9 0.6 1.3 0.7
Biakoye 15,226 100.0 64.8 1.1 15.3 16.5 0.9 0.2 1.1 0.1
Jasikan 14,034 100.0 58.8 0.4 17.8 20.3 0.7 0.3 1.5 0.2
Kadjebi 13,303 100.0 51.4 1.0 18.4 23.9 2.0 0.2 2.7 0.5
Krachi East 22,289 100.0 74.5 1.0 6.7 15.6 0.6 0.4 1.0 0.3
Krachi West 21,824 100.0 80.9 1.3 8.3 7.4 0.4 0.2 1.3 0.3
Nkwanta South 22,733 100.0 66.3 0.3 15.5 15.1 0.6 0.2 1.6 0.3
Nkwanta North 9,989 100.0 86.2 0.4 6.9 5.8 0.3 0.1 0.3 0.0
Source: 2010 Population and Housing Census
12.5.2 Tenure/holding arrangements
Table 12.9 presents the distribution of present holdings/tenancy arrangement by district.
Around 59.0 percent of housing units in the region are owner occupied. The rates in the
districts appear to conform to the regional pattern except for Nkwanta North (83.7%), Krachi
West (77.0%), and Krachi East (70.6%), where the rates are far in excess of the regional
average and in Kadjebi, where the proportion is as low as 47.3 percent. The other types of
tenure in the region include rent free (19.4%) and living in rental units (20.8%). The rent-free
tenure system is less common in Nkwanta North (5.9%) and Krachi East (9.0%) than in any
other district in the region. Districts with higher-than-average rent-free tenures are South
Tongu (22.6%), Kadjebi (24.3%), Ketu North (25.7%), Keta (24.1%) and North Dayi
(23.4%). Ho Municipality has the highest rental unit tenure in the region (29.0%) compared
to the regional average (20.8%). Three other districts with higher than average renting are
Kadjebi (27.7%), Hohoe Municipality (27.6%) and Jasikan (24.1%).

133
Table 12.9: Present holding/tenancy arrangement by district
District Total
Owner
occupied
Renting
Rent-
Free
Perching
Squatting Other
All districts 495,600 59.0 20.8 19.4 0.5 0.1 0.2
South Tongu 20,509 59.6 16.2 22.6 1.1 0.1 0.4
Keta Municipal 37,705 63.5 11.0 24.1 0.9 0.1 0.4
Ketu South 39,119 56.6 24.0 18.6 0.6 0.1 0.1
Ketu North 26,437 58.9 14.8 25.7 0.5 0.1 0.1
Akatsi 33,761 62.1 16.4 21 0.3 0.0 0.2
North Tongu 31,573 64.8 15.5 18.8 0.7 0.1 0.2
Adaklu Anyigbe 13,109 66.1 15.4 17.4 0.8 0.1 0.2
Ho Municipal 73,701 49.0 29.0 21.2 0.5 0.1 0.1
South Dayi 10,761 59.6 21.3 18.7 0.4 0.0 0.1
North Dayi 23,669 52.1 23.8 23.4 0.4 0.1 0.2
Hohoe Municipal 65,858 53.4 27.6 18.3 0.4 0.1 0.2
Biakoye 15,226 60.1 22.7 16.5 0.5 0.0 0.2
Jasikan 14,034 56.2 24.1 18.6 0.3 0.0 0.7
Kadjebi 13,303 47.3 27.7 24.3 0.5 0.1 0.1
Krachi East 22,289 70.6 19.7 9.0 0.6 0.0 0.1
Krachi West 21,824 77.0 11.5 11.0 0.5 0.0 0.1
Nkwanta South 22,733 61.5 18.1 19.7 0.5 0.0 0.2
Nkwanta North 9,989 83.7 9.6 5.9 0.8 0.1 0.1
Source: 2010 Population and Housing Census
12.6 Household Facilities
12.6.1 Main source of drinking water
Households in the region derive their drinking water from diverse sources but the five main
sources are river/stream, well, standpipes, dugout and borehole, which together constitute the
main sources for 91.2 percent of households. Rainwater is more the common source of
drinking water for households in Ketu North and Adaklu Anyigbe than in any other district.
Meanwhile, dugouts are common in households in Akatsi, North Tongu and Krachi East.
Boreholes are similarly common in households in North Dayi, Biakoye and Nkwanta South
(47%), suggesting a distribution pattern that follows the rainfall pattern in the region. Water
piped into homes constitutes just 7.4 percent of all the water sources in households in the
region and is shared largely by households in Ho (19.1%), South Dayi (11.1%), Hohoe
(10.9%) and Keta (9.0 %). Households in Krachi East (0.6 %) and Nkwanta North (0.9%)
have the two lowest proportions in the region in terms of water piped into homes.

134
Table 12.10: Main source of drinking water for households by district
Source: 2010 Population and Housing Census
Districts
Total
households
Pipe-
borne
inside
dwelling
Pipe-
borne
outside
dwelling
Public
tap/stan
dpipe
Bore-
hole/pump
/tube well
Protect
ed well
Rain
water
Protected
spring
Bottled
water
Sachet
water
Tanker
supply/
vendor
provided
Un-
protected
well
Unprotected
spring
River/
stream
Dugout/
pond/
lake/dam/
canal
All districts 495,600 7.4 18.8 19.2 16.4 4.6 3.2 0.3 0.2 3.3 0.4 4.8 0.6 20.4 5.5
South Tongu 20,509 6.9 13.4 46.4 0.4 0.4 1.3 0.1 0.3 0.7 1.3 0.7 1.7 25.3 6.7
Keta Municipal 37,705 9.0 40.5 22.4 1.6 7.7 2.3 0.2 0.2 4.1 2.6 5.3 0.3 4.7 0.8
Ketu South 39,119 3.7 7.6 5.1 11.9 17.8 1.9 0.2 0.1 16.8 0.1 34.0 0.6 1.0 0.3
Ketu North 26,437 1.2 14.1 18.0 12.6 8.7 25.4 0.1 0.2 2.9 0.6 5.9 0.1 7.5 8.0
Akatsi 33,761 1.7 11.5 10.3 23.2 9.0 8.6 0.2 0.1 5.4 0.3 5.2 0.4 14.8 15.9
North Tongu 31,573 7.9 14.0 24.8 5.6 3.3 1.0 0.2 0.1 1.4 0.1 2.7 1.6 28.2 13.8
Adaklu Anyigbe 13,109 1.7 8.0 20.9 22.7 0.7 4.6 0.1 0.2 1.5 0.1 5.2 1.0 20.2 18.4
Ho Municipal 73,701 19.1 27.6 19.6 13.7 2.5 1.0 0.4 0.2 1.9 0.3 1.7 0.6 13.3 0.8
South Dayi 10,761 11.1 19.6 25.4 4.3 0.9 2.5 0.2 0.0 1.4 0.9 0.5 0.3 28.8 8.0
North Dayi 23,669 9.8 24.9 16.7 24.0 1.5 2.9 0.2 0.1 3.1 0.1 0.6 0.6 21.2 3.8
Hohoe Municipal 65,858 10.9 25.6 20.4 10.8 2.0 0.8 1.0 0.1 1.8 0.3 0.6 0.9 27.7 1.1
Biakoye 15,226 3.1 20.9 23.2 28.2 0.5 1.0 0.3 0.2 0.6 0.1 0.3 0.1 22.4 7.7
Jasikan 14,034 1.2 6.1 29.6 19.9 7.5 1.6 0.2 0.1 3.5 0.0 6.1 0.3 29.0 0.1
Kadjebi 13,303 2.3 18.2 20.0 33.3 0.4 0.8 0.2 0.1 0.9 0.0 0.9 0.4 25.9 0.3
Krachi East 22,289 0.6 5.5 11.4 29.5 0.2 0.9 0.3 0.3 1.5 0.0 0.4 0.0 42.8 18.6
Krachi West 21,824 1.8 10.1 24.5 28.1 1.2 0.3 0.2 0.2 0.3 0.0 1.4 0.2 25.1 9.7
Nkwanta South 22,733 1.1 12.7 14.6 47.1 0.4 0.5 0.2 0.1 0.5 0.0 0.4 0.3 31.0 1.6
Nkwanta North 9,989 0.9 9.6 2.9 17.6 9.1 1.4 0.2 0.0 0.3 0.0 3.4 0.1 58.8 1.7
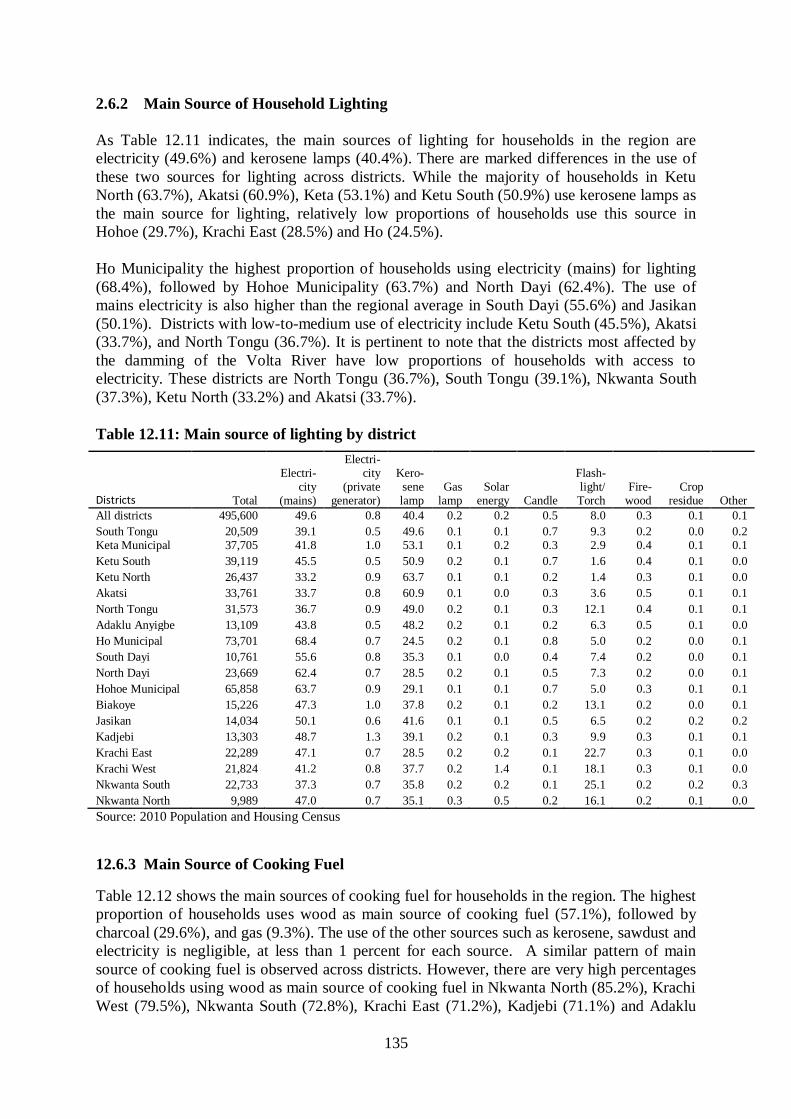
135
2.6.2 Main Source of Household Lighting
As Table 12.11 indicates, the main sources of lighting for households in the region are
electricity (49.6%) and kerosene lamps (40.4%). There are marked differences in the use of
these two sources for lighting across districts. While the majority of households in Ketu
North (63.7%), Akatsi (60.9%), Keta (53.1%) and Ketu South (50.9%) use kerosene lamps as
the main source for lighting, relatively low proportions of households use this source in
Hohoe (29.7%), Krachi East (28.5%) and Ho (24.5%).
Ho Municipality the highest proportion of households using electricity (mains) for lighting
(68.4%), followed by Hohoe Municipality (63.7%) and North Dayi (62.4%). The use of
mains electricity is also higher than the regional average in South Dayi (55.6%) and Jasikan
(50.1%). Districts with low-to-medium use of electricity include Ketu South (45.5%), Akatsi
(33.7%), and North Tongu (36.7%). It is pertinent to note that the districts most affected by
the damming of the Volta River have low proportions of households with access to
electricity. These districts are North Tongu (36.7%), South Tongu (39.1%), Nkwanta South
(37.3%), Ketu North (33.2%) and Akatsi (33.7%).
Table 12.11: Main source of lighting by district
Districts Total
Electri-city
(mains)
Electri-city
(private generator)
Kero-
sene lamp
Gas lamp
Solar energy
Candle
Flash-light/ Torch
Fire-wood
Crop residue
Other
All districts 495,600 49.6 0.8 40.4 0.2 0.2 0.5 8.0 0.3 0.1 0.1
South Tongu 20,509 39.1 0.5 49.6 0.1 0.1 0.7 9.3 0.2 0.0 0.2 Keta Municipal 37,705 41.8 1.0 53.1 0.1 0.2 0.3 2.9 0.4 0.1 0.1
Ketu South 39,119 45.5 0.5 50.9 0.2 0.1 0.7 1.6 0.4 0.1 0.0
Ketu North 26,437 33.2 0.9 63.7 0.1 0.1 0.2 1.4 0.3 0.1 0.0
Akatsi 33,761 33.7 0.8 60.9 0.1 0.0 0.3 3.6 0.5 0.1 0.1
North Tongu 31,573 36.7 0.9 49.0 0.2 0.1 0.3 12.1 0.4 0.1 0.1
Adaklu Anyigbe 13,109 43.8 0.5 48.2 0.2 0.1 0.2 6.3 0.5 0.1 0.0
Ho Municipal 73,701 68.4 0.7 24.5 0.2 0.1 0.8 5.0 0.2 0.0 0.1
South Dayi 10,761 55.6 0.8 35.3 0.1 0.0 0.4 7.4 0.2 0.0 0.1
North Dayi 23,669 62.4 0.7 28.5 0.2 0.1 0.5 7.3 0.2 0.0 0.1
Hohoe Municipal 65,858 63.7 0.9 29.1 0.1 0.1 0.7 5.0 0.3 0.1 0.1
Biakoye 15,226 47.3 1.0 37.8 0.2 0.1 0.2 13.1 0.2 0.0 0.1
Jasikan 14,034 50.1 0.6 41.6 0.1 0.1 0.5 6.5 0.2 0.2 0.2
Kadjebi 13,303 48.7 1.3 39.1 0.2 0.1 0.3 9.9 0.3 0.1 0.1
Krachi East 22,289 47.1 0.7 28.5 0.2 0.2 0.1 22.7 0.3 0.1 0.0
Krachi West 21,824 41.2 0.8 37.7 0.2 1.4 0.1 18.1 0.3 0.1 0.0
Nkwanta South 22,733 37.3 0.7 35.8 0.2 0.2 0.1 25.1 0.2 0.2 0.3
Nkwanta North 9,989 47.0 0.7 35.1 0.3 0.5 0.2 16.1 0.2 0.1 0.0
Source: 2010 Population and Housing Census
12.6.3 Main Source of Cooking Fuel
Table 12.12 shows the main sources of cooking fuel for households in the region. The highest
proportion of households uses wood as main source of cooking fuel (57.1%), followed by
charcoal (29.6%), and gas (9.3%). The use of the other sources such as kerosene, sawdust and
electricity is negligible, at less than 1 percent for each source. A similar pattern of main
source of cooking fuel is observed across districts. However, there are very high percentages
of households using wood as main source of cooking fuel in Nkwanta North (85.2%), Krachi
West (79.5%), Nkwanta South (72.8%), Krachi East (71.2%), Kadjebi (71.1%) and Adaklu

136
Anyigbe (70.8%). Charcoal use is also substantial in the region, averaging 29.6% of
households and reaching 48.1 percent in Ketu South and 40.9 percent in Keta Municipal. The
table further shows that the proportion of households using gas for cooking is relatively high
in the more urbanized districts such as Ho Municipality (22.9%), Ketu South (12.5%), Keta
Municipality (12.0%) and Hohoe Municipality (10.4%). On the other hand, Nkwanta North
has the lowest proportion (0.9%) of households using gas.
Table 12.11: Main source of cooking fuel for household by district
Total
No
cooking
Wood
Gas
Electri-
city
Kero-
sene
Charcoal
Crop
residue
Saw-
dust
Other
All districts 495,600 2.6 57.1 9.3 0.2 0.5 29.6 0.5 0.1 0.1
South Tongu 20,509 2.6 59.9 7.8 0.1 0.3 28.5 0.5 0.0 0.2
Keta Municipal 37,705 2.5 42.2 12.0 0.1 1.2 40.9 0.7 0.1 0.3
Ketu South 39,119 1.2 35.8 12.5 0.3 0.9 48.1 0.9 0.1 0.1
Ketu North 26,437 1.6 63.0 5.7 0.2 0.4 28.7 0.3 0.0 0.0
Akatsi 33,761 2.7 64.6 6.1 0.2 0.3 25.4 0.5 0.0 0.2
North Tongu 31,573 2.6 63.8 3.9 0.2 0.4 28.4 0.6 0.0 0.1
Adaklu Anyigbe 13,109 2.2 70.8 4.8 0.1 0.5 20.9 0.7 0.1 0.1
Ho Municipal 73,701 3.0 43.1 22.9 0.3 0.6 29.7 0.2 0.1 0.0
South Dayi 10,761 2.4 55.0 7.6 0.1 0.3 34.2 0.3 0.0 0.1
North Dayi 23,669 3.0 53.6 7.7 0.2 0.5 34.4 0.5 0.0 0.1
Hohoe Municipal 65,858 3.0 53.9 10.4 0.2 0.4 31.5 0.4 0.1 0.1
Biakoye 15,226 3.1 66.6 2.8 0.3 0.4 26.5 0.3 0.0 0.0
Jasikan 14,034 3.7 65.6 5.5 0.2 0.4 23.8 0.4 0.0 0.4
Kadjebi 13,303 4.6 71.1 4.5 0.1 0.4 18.3 0.8 0.1 0.0
Krachi East 22,289 3.0 71.2 1.8 0.2 0.4 22.9 0.3 0.0 0.0
Krachi West 21,824 2.2 79.5 1.4 0.3 0.5 15.6 0.5 0.1 0.0
Nkwanta South 22,733 2.4 72.8 2.9 0.2 0.1 21.1 0.5 0.0 0.0
Nkwanta North 9,989 0.9 85.2 0.9 0.1 0.2 11.6 1.0 0.0 0.0
Source: 2010 Population and Housing Census
12.6.5 Toilet Facilities
Table 12.12 shows that the three main toilet facilities available to households in the districts
are public toilets (30.0%), pit latrine in the house (22.6%) and KVIP (12.8%). In addition,
about a quarter (27.7%) of households have no facilities and therefore resort to the use of the
bush and the beach. Very low proportions (4.9%) of households in Keta use the pit latrine
while 43.4% of its households use the bush or the beach. That fact that households in Keta,
one of the most urbanized districts in the region, should use the beach and bushes as a toilet
facility is a serious health challenge to the people. This situation is more serious in Nkwanta
North where a small proportion of households (5.6%) use pit latrines in comparison to 78.8
percent of households using the bush. Most other districts in which high proportions of
households use pit latrines also have relatively low proportions of households using the bush.
There are also wide differences in the use of water closet (WC) among the districts. As
shown in the Table, the use of the facility ranges from a high of 18.9 percent in Ho
Municipality to a low of 0.3 percent in Nkwanta North.

137
Table 12.12: Toilet facility by district
Total
households
No facilities (bush/beach/
field) WC
Pit
latrine KVIP
Bucket/
Pan
Public toilet (WC/KVIP/
pit/pan, etc.) Other
All districts 495,600 27.7 6.0 22.6 12.8 0.5 30.0 0.3
South Tongu 20,509 30.9 3.7 29.4 10.6 0.6 24.3 0.5
Keta Municipal 37,705 43.4 6.3 4.9 14.1 1.9 29.1 0.3
Ketu South 39,119 36.2 6.5 17.0 12.8 0.3 27.0 0.2
Ketu North 26,437 22.8 1.9 39.2 11.5 0.1 24.2 0.3
Akatsi 33,761 19.5 1.8 33.5 14.6 0.1 30.2 0.3
North Tongu 31,573 30.5 3.1 30.8 12.2 0.2 22.7 0.5
Adaklu Anyigbe 13,109 26.0 2.1 32.6 9.9 0.9 28.3 0.2
Ho Municipal 73,701 17.5 18.9 16.8 11.9 0.4 34.0 0.5
South Dayi 10,761 16.8 5.6 28.4 15.1 0.3 33.5 0.3
North Dayi 23,669 16.1 5.4 14.7 17.7 0.2 45.4 0.6
Hohoe Municipal 65,858 11.7 6.6 23.7 18.4 0.6 38.6 0.4
Biakoye 15,226 19.8 1.3 31.4 11.5 0.3 35.3 0.4
Jasikan 14,034 17.3 2.3 28.3 14.4 0.5 37.0 0.3
Kadjebi 13,303 15.2 1.7 36.0 15.4 1.0 30.4 0.3
Krachi East 22,289 45.8 0.8 19.5 6.2 0.1 27.5 0.2
Krachi West 21,824 57.2 1.2 16.7 7.1 0.5 17.1 0.2
Nkwanta South 22,733 47.7 1.6 23.7 7.7 0.1 19.0 0.2
Nkwanta North 9,989 78.8 0.3 5.6 4.0 0.1 11.2 0.1
Source: 2010 Population and Housing Census
12.6.6 Solid Waste Disposal
According to Table 12.13, about 41.3 percent of households in the region dispose of solid
waste at public dumps (open space), 16.6 percent at public dumps (container), 15.9 percent of
households burn their solid waste, while 13.7 percent dump their solid waste
indiscriminately. A similar pattern of solid waste disposal is observed in all the districts. On
the other hand, just 6.1 percent of households have their solid waste collected. The proportion
of households with access to solid waste collection is relatively high in Akatsi (10.8%), North
Tongu (10.2%) and Krachi West (10.0%). In view of poor maintenance of public dump sites,
this pattern of solid waste disposal poses health hazards. The burning of solid waste by
households is highest in South Tongu (39.9%) and lowest in Nkwanta South (4.3 %). The
other districts where relatively high proportions of households burn their solid waste are
North Tongu (27.3%), Akatsi (25.5%) and South Dayi (23.8%).
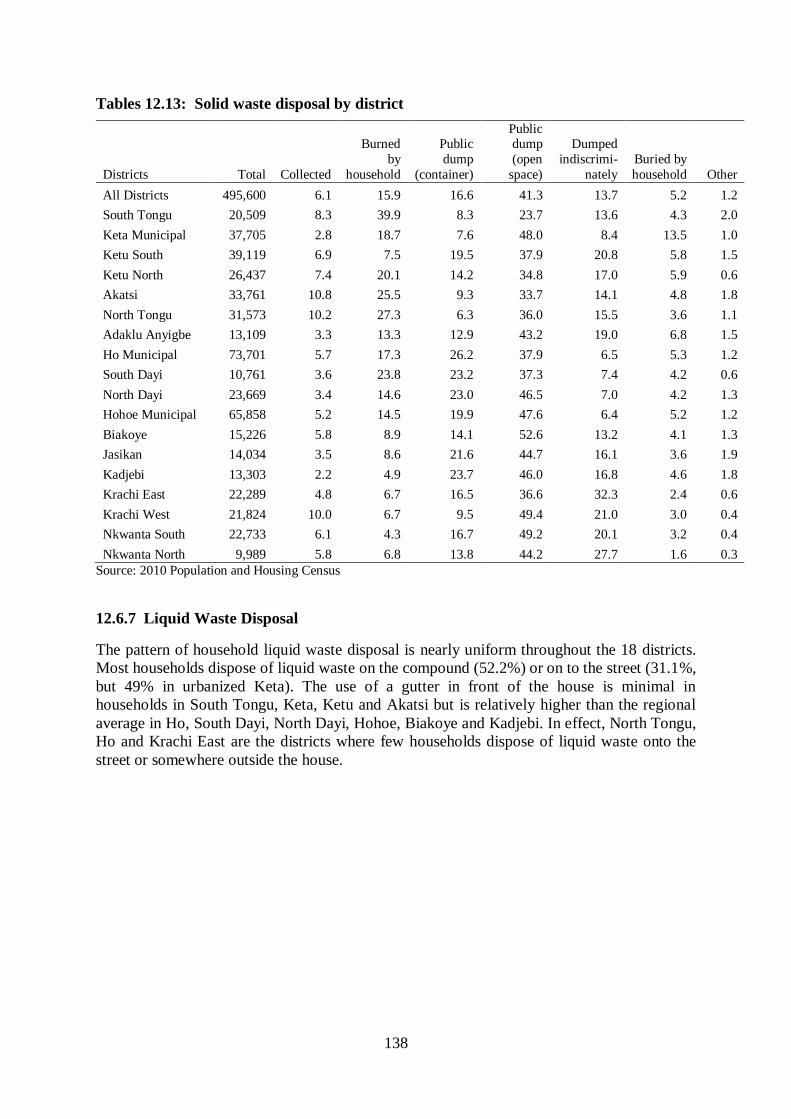
138
Tables 12.13: Solid waste disposal by district
Districts Total Collected
Burned
by
household
Public
dump
(container)
Public dump
(open
space)
Dumped
indiscrimi-
nately
Buried by
household Other
All Districts 495,600 6.1 15.9 16.6 41.3 13.7 5.2 1.2
South Tongu 20,509 8.3 39.9 8.3 23.7 13.6 4.3 2.0
Keta Municipal 37,705 2.8 18.7 7.6 48.0 8.4 13.5 1.0
Ketu South 39,119 6.9 7.5 19.5 37.9 20.8 5.8 1.5
Ketu North 26,437 7.4 20.1 14.2 34.8 17.0 5.9 0.6
Akatsi 33,761 10.8 25.5 9.3 33.7 14.1 4.8 1.8
North Tongu 31,573 10.2 27.3 6.3 36.0 15.5 3.6 1.1
Adaklu Anyigbe 13,109 3.3 13.3 12.9 43.2 19.0 6.8 1.5
Ho Municipal 73,701 5.7 17.3 26.2 37.9 6.5 5.3 1.2
South Dayi 10,761 3.6 23.8 23.2 37.3 7.4 4.2 0.6
North Dayi 23,669 3.4 14.6 23.0 46.5 7.0 4.2 1.3
Hohoe Municipal 65,858 5.2 14.5 19.9 47.6 6.4 5.2 1.2
Biakoye 15,226 5.8 8.9 14.1 52.6 13.2 4.1 1.3
Jasikan 14,034 3.5 8.6 21.6 44.7 16.1 3.6 1.9
Kadjebi 13,303 2.2 4.9 23.7 46.0 16.8 4.6 1.8
Krachi East 22,289 4.8 6.7 16.5 36.6 32.3 2.4 0.6
Krachi West 21,824 10.0 6.7 9.5 49.4 21.0 3.0 0.4
Nkwanta South 22,733 6.1 4.3 16.7 49.2 20.1 3.2 0.4
Nkwanta North 9,989 5.8 6.8 13.8 44.2 27.7 1.6 0.3
Source: 2010 Population and Housing Census
12.6.7 Liquid Waste Disposal
The pattern of household liquid waste disposal is nearly uniform throughout the 18 districts.
Most households dispose of liquid waste on the compound (52.2%) or on to the street (31.1%,
but 49% in urbanized Keta). The use of a gutter in front of the house is minimal in
households in South Tongu, Keta, Ketu and Akatsi but is relatively higher than the regional
average in Ho, South Dayi, North Dayi, Hohoe, Biakoye and Kadjebi. In effect, North Tongu,
Ho and Krachi East are the districts where few households dispose of liquid waste onto the
street or somewhere outside the house.
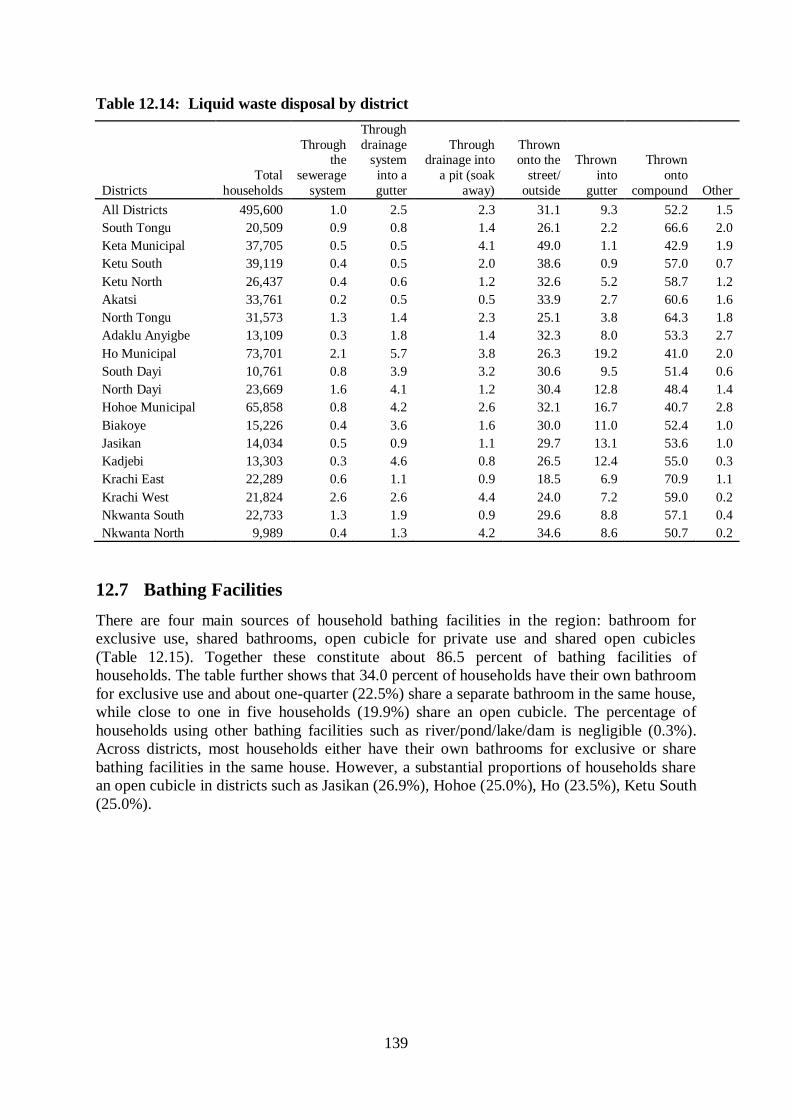
139
Table 12.14: Liquid waste disposal by district
Districts
Total
households
Through the
sewerage
system
Through
drainage system
into a
gutter
Through drainage into
a pit (soak
away)
Thrown onto the
street/
outside
Thrown
into
gutter
Thrown
onto
compound Other
All Districts 495,600 1.0 2.5 2.3 31.1 9.3 52.2 1.5
South Tongu 20,509 0.9 0.8 1.4 26.1 2.2 66.6 2.0
Keta Municipal 37,705 0.5 0.5 4.1 49.0 1.1 42.9 1.9
Ketu South 39,119 0.4 0.5 2.0 38.6 0.9 57.0 0.7
Ketu North 26,437 0.4 0.6 1.2 32.6 5.2 58.7 1.2
Akatsi 33,761 0.2 0.5 0.5 33.9 2.7 60.6 1.6
North Tongu 31,573 1.3 1.4 2.3 25.1 3.8 64.3 1.8
Adaklu Anyigbe 13,109 0.3 1.8 1.4 32.3 8.0 53.3 2.7
Ho Municipal 73,701 2.1 5.7 3.8 26.3 19.2 41.0 2.0
South Dayi 10,761 0.8 3.9 3.2 30.6 9.5 51.4 0.6
North Dayi 23,669 1.6 4.1 1.2 30.4 12.8 48.4 1.4
Hohoe Municipal 65,858 0.8 4.2 2.6 32.1 16.7 40.7 2.8
Biakoye 15,226 0.4 3.6 1.6 30.0 11.0 52.4 1.0
Jasikan 14,034 0.5 0.9 1.1 29.7 13.1 53.6 1.0
Kadjebi 13,303 0.3 4.6 0.8 26.5 12.4 55.0 0.3
Krachi East 22,289 0.6 1.1 0.9 18.5 6.9 70.9 1.1
Krachi West 21,824 2.6 2.6 4.4 24.0 7.2 59.0 0.2
Nkwanta South 22,733 1.3 1.9 0.9 29.6 8.8 57.1 0.4
Nkwanta North 9,989 0.4 1.3 4.2 34.6 8.6 50.7 0.2
12.7 Bathing Facilities
There are four main sources of household bathing facilities in the region: bathroom for
exclusive use, shared bathrooms, open cubicle for private use and shared open cubicles
(Table 12.15). Together these constitute about 86.5 percent of bathing facilities of
households. The table further shows that 34.0 percent of households have their own bathroom
for exclusive use and about one-quarter (22.5%) share a separate bathroom in the same house,
while close to one in five households (19.9%) share an open cubicle. The percentage of
households using other bathing facilities such as river/pond/lake/dam is negligible (0.3%).
Across districts, most households either have their own bathrooms for exclusive or share
bathing facilities in the same house. However, a substantial proportions of households share
an open cubicle in districts such as Jasikan (26.9%), Hohoe (25.0%), Ho (23.5%), Ketu South
(25.0%).

140
Table 12.15: Bathing facility used by household and district
District Total
Own
bath-
room for
exclusive
use
Shared
separate
bath-
room in
the same
house
Private
open
cubicle
Shared
open
cubicle
Publi
c bath
house
Bath-
room in
another
house
Open
space
around
house
River
/pond/
lake/
dam Other
All districts 495,600 34.0 22.5 10.1 19.9 0.7 4.0 8.0 0.3 0.5
South Tongu 20,509 31.8 23.0 10.3 19.8 1.0 4.2 8.5 0.4 1.0
Keta Municipal 37,705 43.3 16.1 13.8 15.7 0.6 1.2 8.8 0.2 0.3
Ketu South 39,119 32.2 23.1 10.0 25.0 0.6 0.5 7.5 0.2 0.9
Ketu North 26,437 32.8 20.2 16.4 20.7 0.8 2.2 6.5 0.2 0.2
Akatsi 33,761 35.1 14.2 16.7 19.7 0.7 4.8 7.6 0.1 1.0
North Tongu 31,573 33.7 20.6 8.7 18.9 0.5 5.5 10.9 0.5 0.7
Adaklu Anyigbe 13,109 29.1 19.9 9.2 19.7 0.3 5.6 13.7 0.1 2.5
Ho Municipal 73,701 30.2 27.2 9.9 23.5 0.7 2.8 5.2 0.1 0.4
South Dayi 10,761 35.3 26.0 9.5 15.8 0.3 4.1 8.5 0.3 0.2
North Dayi 23,669 32.6 27.0 7.6 21.7 1.1 3.7 5.7 0.2 0.7
Hohoe Municipal 65,858 27.8 25.9 9.6 25.0 0.4 4.3 6.5 0.1 0.5
Biakoye 15,226 35.6 26.4 8.5 13.7 1.0 6.7 7.3 0.4 0.5
Jasikan 14,034 24.7 24.4 11.2 26.9 0.3 3.7 8.4 0.1 0.3
Kadjebi 13,303 32.6 27.7 7.6 19.8 1.2 3.1 7.7 0 0.2
Krachi East 22,289 42.0 15.0 5.5 12.6 0.8 9.2 13.6 1.0 0.3
Krachi West 21,824 48.0 17.9 5.3 6.9 1.0 7.8 11.8 1.1 0.3
Nkwanta South 22,733 31.9 24.5 7.5 19.1 0.9 6.8 9.1 0.1 0.2
Nkwanta North 9,989 59.4 21.2 3.3 6.2 0.7 2.8 6.2 0.2 0.1
Source; 2010 Population and Housing Census
12.8 Summary and Policy Implications
The population census is the primary source of information about the population and its
characteristics. The 2010 Population and Housing Census collected data on the demographic,
social and economic characteristics, and housing conditions of the entire population of
Ghana. Geographically, the census covered regional, district, and sub-district levels such as
localities, villages and settlements, residential areas and municipal areas.
This report on Volta Region provides detailed analysis of the 2010 census data at the regional
and district levels. Data from previous censuses and demographic surveys are used to show
trends when appropriate. The aim is to provide useful data and analysis for planners and
policy makers in designing and implementing evidence-based strategies for development in
the districts of the region.
141
12.9 Demographic Characteristics
12.9.1 Population size and structure
The Volta Region‟s population has increased rapidly since 1960. The population size, which
was only 777,288 in 1960 increased to 2,118,252 in 2010; thus the population has more than
doubled in just over 50 years. Ho and Hohoe municipalities, together account for just over a
quarter of the total regional population. The least populated district is South Dayi with only 2
percent of the regional total. Other districts with populations of less than 4 percent of the
regional total are Biakoye (3.1%), Adaklu Anyigbe (3.0%), Nkwanta North (3.0%), Jasikan
(2.8%), and Kadjebi (2.8%). The sex ratio for the region is 92.8, or nearly 93 males to 100
females).
The age structure of the population shows that all the districts have a relatively young
population, typical of developing countries. However, the proportion of the population less
than 15 years in the region as a whole has been declining since 1970. The proportion
decreased from 41.1 percent in 2000 to 38.4 percent in 2010. In the same vein, the proportion
of the population aged 60 years and over decreased from 8.9 percent in 2000 to 6.5 percent in
2010 after decades of increase.
12.9.2 Population density
In consonance with an increase in the population, the region‟s population density increased
from 75.9 inhabitants per square kilometre in 2000 to 103 per square kilometre in 2010. The
most densely populated district is Keta Municipal with 358 persons per square kilometre,
followed by Ketu South with 206 persons per square kilometre, and South Tongu (196
persons per square kilometre). The most sparsely populated districts are Krachi West (29
persons per square kilometre) and Nkwanta South (26.02 persons per square kilometre).
12.9.3 Urbanization
Data from the various rounds of censuses indicate that urbanization has been increasing in the
region as in the country. The proportion of the population living in urban areas has increased
from 16 percent in 1970 to about 34 percent in 2010. Among the districts, the most urbanized
district is Keta Municipal with more than half (53.3%) its population living in urban areas,
followed by Ketu South (46.6%) and Ho Municipal (44.3%). The districts with very low
levels of urbanization include Adaklu Anyigbe (10.6%), South Tongu (12.9%) and Krachi
West (19.6%).
12.3.4 Nationality
About 89.9 percent of the residents in the region are Ghanaians, including 2.7 percent
naturalized Ghanaians. The non-Ghanaian population constitutes 2.4 percent of the region‟s
population. Nkwanta South has the highest proportion of non-Ghanaian population (11.3%),
while Keta has the lowest proportion (0.4%). Other districts with less than 1 percent of non-
Ghanaian populations include South Tongu, Ketu South, Ketu North, Akatsi, North Tongu,
South Dayi and Keta Municipal.
142
12.4 Fertility, Mortality, Migration
12.4.1 Fertility
The trend in total fertility rate (TFR) in the region derived from previous demographic
surveys and censuses indicates that the region is experiencing a slow demographic transition
like the rest of the country. This is seen in the dramatic decline of the TFR from 6.7 children
per woman in the 1988 GDHS to a low of 3.2 children in the 2010 census, slightly lower than
the national average of 3.3. At district level, the TFR ranges from a high of 3.93 children per
woman in Krachi East to a low of 2.65 children per woman in Ho Municipality. Other
districts with relatively low fertility below the regional average include Keta Municipal
(2.98), Ketu South (2.86), North Tongu (2.83), and Adaklu Anyigbe (2.75).
12.4.2 Mortality
One of the Millennium Development Goals (MDGs) is to reduce infant and under-five
mortality. The specific objective is to reduce under-five mortality by two-thirds by 2015.
Data from the 2010 census show that both infant and child mortality rates are high in the
region at 57 per 1,000 live births and 87 per 1,000 live births respectively. There are also
marked district variations. The incidence of deaths among children under five years ranges
from 73 per 1,000 live births in Kadjebi and Biakoye districts to 119 per 1,000 live births in
Nkwanta North District. With respect to infant mortality, children in South Dayi (45 per
1,000 live births), Biakoye and Kadjebi (49 per 1,000 live births) have the lowest risk of
infant mortality. On the other hand, the risk of infant death is highest for children in Nkwanta
North (76 per 1,000 live births), Keta Municipal (65 per 1,000 live births) and Ketu North (65
per 1,000 live births).
12.4.3 Migration
The importance of measuring migration lies in its impact on the population size, structure and
distribution in the region. Migration out of the region reduces the size of the population,
while migration into the region increases it. In addition, the selectivity of the migration
process in terms of age, sex, education and other socio-demographic characteristics can have
a significant impact on the overall social and economic development of the region. Analysis
of regional and birthplace statistics show that an overwhelming majority of the population in
the region (90.9%) Most Ghanaian migrants to the region are from the Greater Accra Region
(1.9%), followed by the Northern Region (1.6%) and Eastern Region (1.5%). A number of
migrants to the region come from ECOWAS states. Because of the region‟s proximity to
Togo and because of common cultural heritage, most of the migrants from ECOWAS states
are Togolese
Figures for net migration, which is the net effect of in-migration and out-migration to the
region from the other regions in Ghana, indicate that a total of 535,671 people have migrated
from the region to other regions. The region lost population to seven out of the 10 regions,
the exceptions being the Northern, Upper East and Upper West regions. The popular
destinations of migrants from the region are to the Greater Accra and Eastern regions. The
volume and direction of migration from the region provides some indication of social and
economic conditions. Compared to the other regions, Volta Region, like the Upper East and
Upper West, is at considerable disadvantage in terms of modern infrastructure such as good
roads, educational institutions and hospital facilities. For a sending region like the Volta
Region, some of the negative consequences of migration include loss of many of its youthful,
143
educated and productive workers, leaving behind the uneducated and less educated and the
aged population.
12.5 Social characteristics
12.5.1 Household Size, Structure and Composition
There are 495,603 households in the region. A higher proportion of households are headed by
males (61.6%) than females (38.4%). A similar pattern is observed in urban and rural areas.
Single-person households are predominantly in the three municipalities with high
populations, namely Ho (22.8%), Keta (20.3%) and Hohoe (20.2%). Large households of 10
or more persons are found in districts like Nkwanta North (18.5%), Krachi West (11.9%),
Adaklu Anyigbe (10.4%) and Krachi East (10.2%) in the Northern Volta.
Of the 2,086,567 people living in households, 23.8 percent are household heads, 10.1 percent
are spouses, 40.5 percent are children and 24.2 percent are other relatives. Grandchildren
(9.3%) and other relatives (7.7%) constitute a significant proportion of household
composition.
12.5.2 Marital status
Data on marital status indicate that 44.6 percent of the population 12 years and older are
currently married, 4.6 percent are in consensual union, 13.0 percent were once married, 2.8%
are separated, 3.4% are divorced , 6.8% are widowed and 37.8 percent have never married.
12.5.3 Ethnicity
The predominant ethnic group in the region is Ewe (73.8%), followed by Gurma (11.3%) and
Guan (8.1%). The Ewe are the overwhelming majority of the population in 11 of the region‟s
18 districts.
12.5.4 Religion
The majority (71.4%) of the population is Christian, while 14.1 percent practice traditional
religion and 5.7 percent are Muslim. Most Muslims are found in Kadjebi (29.6%), Jasikan
(12.7%), Krachi West (10.2%), Nkwanta South (10.2%) and Nkwanta North (10.3%). The
four districts with substantial proportions of their population practicing traditional religion
are Nkwanta North (43.3%), Ketu North (33.5%), Ketu South (27.9%) and Akatsi (27.9%).
12.6 Literacy and Education
For the region as a whole, 29.3 percent of the population are illiterate, 9.0 percent are literate
in English, 11.7 percent are literate in a Ghanaian language, while 48.7 percent are literate in
both English and a Ghanaian language. Less than 1 percent of the population is literate in
both English and French, or in English, French and a Ghanaian language. A higher
proportion of females are illiterate (19.7%) than males (9.6%).
The distribution of past school attendance for persons aged 6 years and over indicates that the
majority of people who have attended school previously (55.2%) have attained at least the
basic level, that is middle/JSS/JHS. More than one in five of the population in all districts
144
have attained at least primary level, except in Hohoe, South Dayi, North Dayi and Ho. Three
districts with substantially high proportions of their populations reaching the primary level
are Krachi East (34.2%), Nkwanta North (45.4%) and Ketu North (30.4). In three out of the
18 districts (Nkwanta North, Nkwanta South, and Ho Municipality) about one out of 10 of
their population 6 years and older attained secondary/senior high school as the highest level.
The proportion of the population attaining higher levels of education is low for the region and
all the districts. For example, only 3 percent and less than 1 percent of the population in the
region have had undergraduate university education and post-graduate education respectively.
Of the 1,764,993 population 6 years and older currently attending school, 47.7 percent are
males and 52.3 percent are females. About 62.3 percent are enrolled in basic school
(kindergarten, primary, JSS/JHS/middle), 8.1 percent in secondary/senior high school, 1.5
percent in vocational/ technical/commercial school, and 4.1 percent in tertiary institutions.
There are more males than females enrolled at all levels of education. In addition, the
proportion of females who have never attended school (30.1%) is much higher than that of
their male counterparts (17.6%). Whereas over 60 percent of the population in most of the
districts in the region are currently attending basic school (Kindergarten, primary, JHS), there
are some districts, particularly in the northern sector (Krachi East, Krachi West, Nkwanta
North, Nkwanta South), where relatively low proportions (between 45.0 percent and 50.6
percent) are currently attending basic school.
12.7 Disability
The prevention of disability and enabling people with disability (PWDs) to be productive
citizens is an important aspect of national development. There is a total of 91,767 persons
with disability in the region, representing 4.3 percent of its total population. The proportion
of persons with disability ranges from a low of 2.0 percent in Nkwanta North District to a
high of 11.3 percent in South Tongu District and is higher among females (2.4%) than males
(1.9%) in all districts. In addition, the highest proportion of persons with disability is aged 65
years and over (26.1%), followed by children under 15 years (14.8%). The disability statistics
also show that about one in five persons with disability have never married, 44.6 percent are
in some form of union, and 20 percent have once been married but are now separated (4.7%),
divorced (7.4%) or widowed (20.4%).
12.8 Economic Characteristics
12.8.1 Economic activity
Information on the activity status of the population indicates that 69.9 percent of the
population 15 years and older are economically active. The proportion of persons who are
economically active is higher for females (52.9%) than males (47.1%). The general activity
rate of 64.9% in the rural areas is much higher that of urban areas (35.1%). However, across
districts, general activity rates in urban areas are higher than those in rural areas in Keta, Ketu
South, Ho and Hohoe municipalities.
Of the economically active population, 67.0 percent are employed, 2.9 percent are
unemployed, and 30.1 percent are not economically active. There are urban-rural differences
in the proportion employed (61.0% urban against 73.1% rural). Of the 37,222 unemployed

145
persons recorded in the region, 54.9 percent are females and 45.1 percent are males. Among
the districts, the unemployment rate is highest in Jasikan (50.9%), followed by Kadjebi
(48.7%) and by Nkwanta North (48.4%), while Keta Municipality recorded the lowest
proportion (38.2%).
Most of the economically active population in the region are self-employed without
employee(s) (72.5%), followed by those who are employees (11.2%), contributing family
workers (9.8%) and self-employed with employee(s) (2.8%). People in apprenticeship,
domestic work and others together constitute 2.3 percent of workers. The informal private
sector is the largest employer in the region (90.6%), followed by public (government) sector
(6.1%).
12.8.2 Occupation
Workers in skilled agriculture and related occupations are in the majority in all the districts
except Keta Municipal (34.8%), Ketu South (17.3%), Ketu North (47.1%), Ho Municipality
(34.4%), South Dayi (43.5%), North Dayi (38.1%), and Hohoe Municipality (43.5%). Males
predominate in managerial and professional occupations (7.5% against 5.4%), while females
predominate in services and sales (26.6% against 6.0%).
12.8.3 Industry
Agriculture/forestry/fishing is the largest industrial sector, employing more than 50 percent of
the economically active population. The other two major industries are wholesale and retail
trade (14.0%) and manufacturing (14.1%). The proportion of males in skilled agricultural,
forestry, and fishing (57.3%) is higher than that of females (44.0%), whereas the opposite is
the case for wholesale and retail trade (20.8% female and 14.0% males) and manufacturing
(17.2% females and 10.6% males).
12.8.4 Agriculture activity
The 2010 Population and Housing Census reported a total of 599,276 household members in
agriculture in the Volta Region, of which 116,507 are in the urban areas and 482,789 are in
the rural areas. The majority of the population in agriculture is male (50.8%). There are also
more males who are heads in agricultural households than females in all districts and
localities. The average agricultural household size for the region is 4.8 persons. Among the
districts, the average household size ranges from a low of 4.1 in Akatsi District to a high of
6.7 in Nkwanta North District. The major agricultural activity in the region is crop farming,
followed by livestock rearing.
Crop farming practices in the region include mixed cropping, inter-cropping, and mono-
cropping. The most common farming practice is inter-cropping (39.5%), while mixed
cropping is relatively less popular (24.8%). A wide variety of crops are produced in the
region, including staples such as yam, cocoyam, millet, sorghum, cassava, garden eggs, and
plantain. Non-traditional crops meant for export are also produced and include cocoa, apples,
black pepper, cashew nuts, ginger, pineapple, pawpaw, and mangoes. The highest proportion
of farms produce maize (30.9%), followed by cassava (30.6%), and yam (8.7%). Overall,
83.1 percent of all crops are cultivated by households that live in rural areas compared to 16.9
percent in urban areas. Crops which are produced more by urban households compared to
rural households are shallots (55.7% urban and 44.3% rural) and onions (54.1% urban and
45.9% rural).
146
An overwhelming proportion (81.2%) of livestock rearing occurs in the rural areas. Poultry
constitutes the largest share of livestock production (54.2%), followed by goat rearing
(18.4%) and sheep rearing (7.0%). Marine fishing is the least prevalent agricultural activity
with just a 0.12% share of livestock production in the region. Livestock production is largely
a rural activity.
12.9 Information and Communications Technology
Information and communications technology (ICT) is recognized as an important component
of socio-economic development. In order to ensure rapid deployment of ICT infrastructure,
the government has been implementing policies and programmes to expand access for the
population.
12.9.1 Mobile phone ownership
The region has 540,623 persons 12 years and older with mobile phones, representing 37.3
percent of the population. Among the districts, Ho Municipality reported the highest
proportion of its population 12 years and older with mobile phones (51.2%), followed by
Ketu South (45.8%), and Hohoe Municipal (43.2%). Krachi East, Krachi West, and Nkwanta
South all have relatively low proportions of their population with mobile phones (22.0%,
21.7%, and 21.3%, respectively).
With respect to the distribution of mobile phones by locality, 52.1 percent of the urban
population in the region own mobile phones compared to only 29.3 percent of the rural
population. Seven districts have over half of their urban populations 12 years and older with
mobile phones (Ho Municipality, South Tongu, Ketu South, Akatsi, North Tongu, North
Dayi, Hohoe). The proportion is highest in the rural areas in South Dayi (40.9%), followed by
Ho (38.1%) and Ketu South (36.3%), while Nkwanta North has the lowest proportion of
mobile phone ownership in both urban and rural areas. There are more males owning mobile
phones (42.8%) than females (32.4%) in the region.
The proportion of persons with mobile phones increases steadily with increasing level of
education. The percentage of mobile phone ownership ranges from a low of 19.5 percent of
individuals with no education to a high of 95.3 percent for those with tertiary education.
12.9.2 Access to internet facility
Data on access to internet facility indicate that there are 50,644 or 3.5 percent of internet
users in the region out of a total population of 1,449,077 persons 12 years and older. The
figure is far below the national average of 7.8 percent. The largest proportion of internet
facility users in the region live in Ho (10.0%), followed by Hohoe (4.0%). Two other
districts with figures higher than the regional average of 3.5 percent are Keta Municipal and
Ketu South (3.8% and 3.9%, respectively). All other districts have rates below 3 percent. Use
of internet is negligible in Krachi East and Nkwanta North (0.6% and 0.5% respectively).
Males are more likely than females to use internet facilities in all the districts.
There is a wide urban-rural differential in internet use: 7.0 percent of urban dwellers in the
region have access to internet facilities compared to only about 2.0 percent of rural dwellers.
Ho District has the highest proportion of internet users in urban areas (18.3%), followed by
147
South Tongu District (8.4%). On the whole, access to internet facilities in the rural areas is
quite poor across all districts. The proportion of internet users in rural areas is less than 2.0
percent in 14 out of the 18 districts.
12.9.3 Household ownership of desktop/laptop computer
The 2010 census results show that only about 3 percent of all households in the region own
desktop/laptop computers, compared to 7.2 percent of all households in Ghana. Ho
Municipality has the highest proportion of its households with desktop/laptop computers
(7.4%). The other districts with proportions higher than the regional average are South Dayi
(3.8%), North Dayi (3.1%) and Hohoe Municipal (3.6%). The most disadvantaged district is
Nkwanta North, which has less than 1 percent of its households with access to the facility
(0.7%). Ownership of desktop/laptop computers is higher for female household heads than
male household heads in South Tongu, Keta Municipal, Ketu North, Ho and South Dayi
districts.
12.10 Housing Conditions
12.10.1Housing stock
The total stock of houses in the region is 399,953. Of this total, 72.2 percent are located in
rural areas and 27.8 percent in urban areas. Ho Municipality has the highest proportion of
houses (13.5%), followed by Hohoe Municipality (11.5%) and Akatsi District (7.6%).
Together these three districts share about 32.6 percent of all houses in the region. In contrast,
North Tongu (6.8%), Ketu South (6.3%), Ketu North (5.9%) and Krachi West (5.5%)
together have only 24.5 percent of houses. The population per house in the region is 5.3,
which is lower than the national average of 7.3. Among the districts, the population per house
ranges from a high of 8.4 in Nkwanta North to a low of 3.8 in Akatsi.
12.10.2 Dwelling units
A total of 550,006 dwelling units were identified in the region, both occupied and
unoccupied. The main type of dwelling most people use is the separate house (45.8%),
followed by a room in a compound (41%), and semi-detached unit (6.5%). Flats/apartments
are not common (1.5%). Makeshift dwelling units such as tents (0.2%), kiosks containers
(0.4%), attachments to shops or offices (0.4%) together constitute about only 1.0 percent of
all dwelling units.
12.10.3 Construction materials
Mud brick/earth are the main materials used to in constructing walls of dwelling units
(48.1%), followed by cement block/concrete (45.6%), leaf/thatch (2.1%), sandcrete/landcrete
(1.4%) and wood (0.9%). Materials for floors of dwelling units are made mainly of
cement/concrete (80.2%) and earth/mud (18.0%).
Most (70.7 %) households live in dwelling units roofed with corrugated metal sheets while
18.7% of households live in units roofed with thatch/palm leaves. The proportion of
dwellings roofed with corrugated metal sheets is high in Hohoe Municipality (89.6%), North
Dayi (85.5%), Biakoye (82.1%), Ho Municipality (83.2%), Jasikan (86.6%) and Kadjebi
(92.2%), while Krachi East (38.1%) has the highest proportion of dwellings roofed with
148
thatch or palm leaves, followed by Krachi East (38.1%), Akatsi (37.3%), Krachi West
(32.5%) and North Tongu (32.4%). The use of slates or asbestos as roofing material is
relatively high in the coastal districts of Keta Municipality and Ketu South, probably because
of its resistance to sea corrosion
12.10.4 Tenure and holding arrangements
The 2010 census data indicated that 61.4 percent of dwelling units are occupied by their
owners, 18.6 percent by relatives who are not household members, and 16.4 percent by other
private individuals. Only 1.6 percent of dwellings are owned by the government or public
agency. The other types of tenure in the region include rent free (19.4%) and living in rental
units (20.8%). The same pattern of tenure and holding arrangement pertains in all the
districts.
12.10.5 Household facilities and amenities
Data on room occupancy indicate that 45.5 percent of households occupy only one room and
53.9 percent more than one room Less than 1 percent of households occupy a single room
shared with other households (0.7%). About three out of 10 household members sleep in
single rooms, 32.9 percent in two sleeping rooms, 16.1 percent in three sleeping rooms and
9.0 percent in four sleeping rooms. The proportion of households occupying single rooms
varies from a high of 36.6 percent in Ketu South district to a low of 13.8 percent in Nkwanta
North district. These results show that the region does not as yet face a critical overcrowding
situation, but the potential exists, and can occur, if housing policy measures and regulations
do not take into account sleeping room occupancy as an important factor in the planning and
provision of housing.
The main sources of drinking water for 26.6 percent of households is pipe-borne water, while
21.0 percent use boreholes or protected wells, and 19.2 percent use public tap/standpipe. In
addition, 3.5 percent use sachet or bottled water. However, it is worrying that about three out
of 10 households depend on surface water such as river/stream, canal and ponds. Three
districts with relatively higher proportions of households that depend on rivers and streams as
the main source of drinking water are Nkwanta North (58.8%), Krachi East (42.8%) and
Nkwanta South (31.0%).
The three main toilet facilities available to households in the region are public toilets
(30.0%), pit latrine in the house (22.6%) and KVIP (12.8%). In addition, 27.7 percent of
households are without a toilet facility and use the bush and the beach. This situation is most
prevalent in Nkwanta North (78.8%), Krachi West (57.2%), Nkwanta South (47.7%), Krachi
East (45.8%) and Keta Municipal (43.4%).
Electricity (46.9%) and kerosene lamp (40.4%) are the main sources of lighting for
households in the region and in all the districts. There are marked differences in the use of
these two sources of light across districts. Ho Municipality the highest proportion of
households using electricity (mains) for lighting (68.4%), followed by Hohoe Municipality
(63.4%) and North Dayi (62.4%). While the majority of households in Ketu North (63.7%),
Akatsi (60.9%), Keta (53.1%) and Ketu South (50.9%) use kerosene lamps as the main
source of lighting, a relatively low proportion of households use this source in Hohoe
(29.7%), Krachi East (28.5%) and Ho (24.5%).
149
Most households (87.5%) in the region use wood or charcoal as the main source of cooking
fuel (57.1%), followed by charcoal (29.6%) and gas (9.3%). The use of the other sources such
as kerosene, sawdust and electricity is negligible (under 1 percent for each). The proportion
of households using gas for cooking is relatively high in the more urbanized districts like Ho
Municipality (22.9%), Ketu South (12.5%), Keta Municipality (12.0%) and Hohoe
Municipality (10.4%).
On waste disposal, 41.3 percent of households in the region dispose of solid waste at public
dumps (open space), 16.6 percent at public dumps (container), 15.9 percent of households
burn their solid waste, while 13.7 percent dump their solid waste indiscriminately. With
regard to liquid waste, most households (50.2%) throw their liquid waste onto the compounds
of their homes. Another 31.3 percent throw their liquid waste on the streets or outside their
homes, while 9.3 percent of households throw their liquid waste into gutters. A similar
pattern of solid waste disposal is observed in all the districts.
Concerning access to bathing facilities, 34.0 percent of households have their own bathroom
for exclusive use and about one-quarter (22.5%) share a separate bathroom in the same house,
while close to one in five households (19.9%) share an open cubicle. The percentage of
households using other bathing facilities like river/pond/lake is quite low. There is little
variation among districts in this pattern of household bathing facilities.

150
CHAPTER THIRTEEN
SUMMARY FINDINGS AND POLICY
RECOMMENDATIONS
13.1 Policy Recommendation
The formulation and implementation of development policies are often driven by data. The
regional specific demographic and socioeconomic information from the 2010 Population and
Housing Census could inform the goals and objectives of policies, targets to be achieved, and
strategies adopted for achieving such targets.
The following recommendations are made based on the findings of the report:
Population size, growth and structure
Analysis of the trends in regional population size and growth shows that Volta region‟s
population has increased rapidly since 1960. As a result, the age and structure of the
population shows a relatively young population, which has the potential for further growth.
The results have implications for the planning of social services, particularly education and
health. It is therefore recommended that the integration of population variables into regional
development planning should be considered a priority.
Urbanization
Urbanization in the region has been increased substantially from 16 per cent in 1970 to 34 per
cent in 2010. The phenomenon is relatively more pronounced in Keta Municipal with more
than half of its population living in urban areas. The rapid rate of urbanization in the region
presents both development opportunities and serious challenges for socioeconomic progress.
The opportunities offered by urbanization include sustained decrease in fertility and mortality
rates; cities serving as engines of growth; cost-effectiveness in the provision of infrastructure
and social services such as health and education; and more efficient environmental
management. The challenges on the other hand include development of slums and squatter
settlements, growth of urban poverty, deterioration of urban environment, inadequate
provision of social infrastructure and services, and urban governance. These observations
suggest the need for the adoption and implementation of a comprehensive regional urban
policy.
Fertility
The trend in the Total Fertility Rate (TFR) in the region indicates that the region is
experiencing a slow demographic transition like the rest of the country. To sustain the
transition, there is the need to continue with, and intensify, fertility education and family
planning prgrammes.

151
Mortality
The results of this report show that both infant and child mortality rates are high in the region
at 57 per 1000 live births and 87 per 1000 live births respectively with marked district
variations. The strengthening of initiatives aimed at improving family planning, girl child
education and maternal health services in the region could go a long way to reduce childhood
mortality.
Education
The report shows that illiteracy and lack of formal education (particularly at higher levels of
education) are still high in the region. These compromise the quality of labour force in the
region. The policy of free and compulsory should be vigorously enforced and opportunities
offered by educational initiatives such as the School Feeding Programme, Capitation Grant
and provision of free uniform should be utilized to enroll more children in school.
Gender parity in access to education remains a matter of concern in the region. Gender
specific educational initiative need to be put in place to ensure that both boys and girls enroll
and remain in school.
District Assemblies should establish educational fund to assist needy students, especially
girls, to pursue senior high school and tertiary education.
Occupation and Industry
Workers in skilled agriculture and related occupations are in the majority in all the districts
and Agriculture/Forestry/ Fishing is the largest industrial sector employing more than 50 per
cent of the economically active population. On the basis of these results, the following are
suggested:
Efforts to modernize agriculture using appropriate technologies to increase
productivity in the sector need to be intensified.
Farmers in agriculture need to be supported to acquire implements and small-to
medium scale irrigation equipment that will facilitate farming activities throughout
the year.
The linkage between agriculture related activities and local industries need to be
strengthened to create employment and ensure efficiency in both sectors.
Community facilities and amenities
The quality of life of the people in the communities in the region depends in large part on
access to good drinking, electricity, and adequate sanitary facilities among others. The report
shows, however, that access to these facilities tends to be poor and non-existent in some
homes. It is therefore recommended that:
District Assembles in collaboration with Non-governmental organizations operating
in the water sector need to target underserved communities to construct more of bore-
holes. This will ensure access to portable water for those communities.
Accessible and easily recoverable soft loans should be provided to households to
construct adequate toilet facilities in their dwellings.

152
District Assemblies should be supported to enforce by-laws regarding the disposal of
solid and liquid wastes.
An important concern is the use of wood as the main source of fuel for domestic
consumption with its attendant impact on deforestation in the region. District planners
need to devise strategies for households to cut down on use of wood for cooking and
encourage the use of gas as replacement.

153
REFERENCE
Ghana Statistical Service (GSS), ICF Macro. 2010. 2008 Ghana Demographic and Health
Survey. Calverton, Maryland, USA: ICF Macro.
Ghana Statistical Service (GSS), 2010 Population and Housing Census, Enumerators Manual.
Ghana Statistical Service (2012).2010 Population and Housing Census. Summary Report of
Final Results. GSS, Accra.
Ghana Statistical Service, (2009). 2010 Population and Housing Census, Enumerator‟s
Manual.
Ghana Statistical Service ; Ministry of Health; UNICEF, Ghana andMacro International GSS,
Multiple Indicator Cluster Survey 2006
Ministry of Education, Ghana, 2010/11 Annual Report United Nations, (2008). Principles and
Recommendations for Population and Housing Censuses. Revision 2.
International Labour Organisation (ILO), the Children‟s Act of 1998
World Health Organisation, (2011).Summary World Report on Disability.
WHO/NMH/VIP/11.01 WHO, Malta.
WHO and UNICEF (2000).The Global Water Supply and Sanitation Assessment 2000
Report. Geneva: WHO.


