48
A Profile of Student Learning and Performance in Manitoba 2010–2014
A Profile of Student Learning and Performance
in Manitoba
2010–2014

A P r o f i l e o f S t u d e n t l e A r n i n g A n d P e r f o r m A n c e i n m A n i t o b A
2010–2014
2015Manitoba Educat ion and Advanced Learning
Manitoba Education and Advanced Learning Cataloguing in Publication Data
A profile of student learning and performance in Manitoba, 2010–2014 [electronic resource]
Includes bibliographical references.
ISBN: 978-0-7711-5384-6
1. Academic achievement—Manitoba. 2. Educational tests and measurements—Manitoba. 3. Students—Manitoba. 4. Education—Manitoba. I. Manitoba. Manitoba Education and Advanced Learning. 370.97127
Copyright © 2015, the Government of Manitoba, represented by the Minister of Education and Advanced Learning.
Manitoba Education and Advanced Learning School Programs Division Winnipeg, Manitoba, Canada
Every effort has been made to acknowledge original sources and to comply with copyright law. If cases are identified where this has not been done, please notify Manitoba Education and Advanced Learning.
Any websites referenced in this document are subject to change.
This resource is also available on the Manitoba Education and Advanced Learning website at <www.edu.gov.mb.ca/k12/docs/reports/profile/>.
Disponible en français.
Available in alternate formats upon request.
C o n t e n t s iii
C o n t e n t s
Introduction 1
The Early Years 2
Early Childhood Development 2
Provincial Measurement of School Readiness 2
Provincial Classroom‑Based Results 3
The Middle Years 12
The Middle Years Assessment 12
The Senior Years 23
Grade 12 Provincial Tests 23
Manitoba’s High School Graduation Rate 30
National and International Assessment 33
The Pan‑Canadian Assessment Program 33
The Programme for International Student Assessment 35
Bibliography 39
Feedback Form 41

I n t r o d u c t i o n 1
I n t r o d u c t I o n
Manitoba Education and Advanced Learning’s official and fundamental responsibility is to provide direction and allocate resources in support of youth programming and Kindergarten to Grade 12 education in both public and funded independent schools. If this responsibility is met, all of Manitoba’s children and youth will have access to an array of educational opportunities that enable every learner to experience success. They will be offered a relevant, engaging, and high quality education that prepares them for lifelong learning and citizenship in a democratic, socially just, and sustainable society.
The results of Manitoba’s students’ performance on recent pan-Canadian and international assessments have brought to the forefront the importance of ensuring that Manitoba Education and Advanced Learning, together with parents, teachers and education leaders, maintain a strong focus on improving student achievement. “A Profile of Student Learning and Performance in Manitoba 2010-2014” represents the last in a series of compilations of provincial, national and international assessments. This document provides important baseline data as we move forward with implementing Closing the Achievement Gap: Success for Every Student, an action plan focussed on improving academic achievement for all Manitoba students.
This action plan will reflect a new approach to working with school divisions around their use and analysis of data for the purpose of ensuring there is continual progress to achieve academic excellence for all students, particularly in the areas of numeracy and literacy. In addition, there will be increased transparency in the sharing of data with the broader public, with the specifics still to be determined.
A P r o f i l e o f S t u d e n t L e a r n i n g a n d P e r f o r m a n c e i n M a n i t o b a , 2 0 1 0 – 2 0 1 42
T h e e a r l y y e a r s
Early Childhood Development
Manitobans understand the importance of early childhood development and its impact on children’s readiness for school. A considerable amount of children’s success in school from Kindergarten through Grade 12 is determined well before they begin their schooling at age 5. Children’s learning readiness at school entry is a good predictor of their school performance in later years, and of high school completion rates. Establishing a strong foundation for children before they start school is important for their successful lifelong learning and health. Investing in early childhood development is the most effective (and cost‑effective) way to improve the lives of Manitoba’s future population, and it continues to be a top priority for Manitoba.
Provincial Measurement of School Readiness
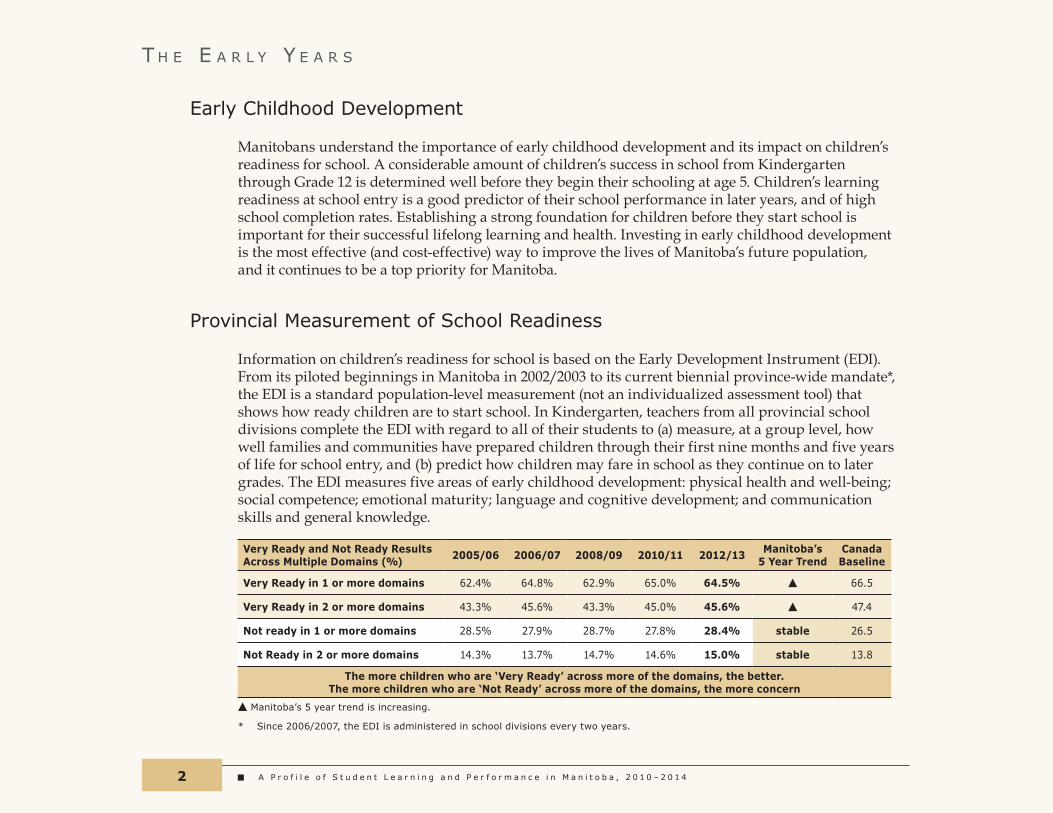
Information on children’s readiness for school is based on the Early Development Instrument (EDI). From its piloted beginnings in Manitoba in 2002/2003 to its current biennial province‑wide mandate*, the EDI is a standard population‑level measurement (not an individualized assessment tool) that shows how ready children are to start school. In Kindergarten, teachers from all provincial school divisions complete the EDI with regard to all of their students to (a) measure, at a group level, how well families and communities have prepared children through their first nine months and five years of life for school entry, and (b) predict how children may fare in school as they continue on to later grades. The EDI measures five areas of early childhood development: physical health and well‑being; social competence; emotional maturity; language and cognitive development; and communication skills and general knowledge.
Very Ready and Not Ready Results Across Multiple Domains (%) 2005/06 2006/07 2008/09 2010/11 2012/13 Manitoba’s
5 Year TrendCanada Baseline
Very Ready in 1 or more domains 62.4% 64.8% 62.9% 65.0% 64.5% s 66.5
Very Ready in 2 or more domains 43.3% 45.6% 43.3% 45.0% 45.6% s 47.4
Not ready in 1 or more domains 28.5% 27.9% 28.7% 27.8% 28.4% stable 26.5
Not Ready in 2 or more domains 14.3% 13.7% 14.7% 14.6% 15.0% stable 13.8
The more children who are ‘Very Ready’ across more of the domains, the better. The more children who are ‘Not Ready’ across more of the domains, the more concern
s Manitoba’s 5 year trend is increasing.
* Since 2006/2007, the EDI is administered in school divisions every two years.
T h e E a r l y Y e a r s 3
Since the first province-wide collection in 2005/2006, the EDI has grown in its capacity to influence provincial and community-level action. Aided with EDI data, the Healthy Child Committee of Cabinet and its departments, school divisions, parent-child coalitions, and the child care community have developed policies and programs that address the evidence-based needs of communities, as measured by the EDI (e.g., Healthy Child Manitoba’s Triple P—Positive Parenting Program; Manitoba Education and Advanced Learning’s Community Schools Partnership Initiative and Students At-Risk (SAR) school funding; and Manitoba Family Services and Consumer Affairs’ Family Choices Early Learning and Child Care Plan). Early childhood development continues to be a top provincial priority and has been highlighted in every Manitoba Throne Speech and Budget Address since April 2000.For more information on Manitoba’s EDI, or to view provincial and community EDI data reports, please visit the Healthy Child Manitoba website at <www.gov.mb.ca/healthychild/edi/index.html>.
Provincial Classroom-Based Results
Grade 3 Assessment in Reading, Lecture, and NumeracyGrade 4 Assessment in French Immersion Lecture
IntroductionEarly in the school year, Manitoba students in Grade 3 (all programs) and Grade 4 (French Immersion) undergo classroom-based provincial assessments in numeracy and reading competencies identified by Manitoba Education and Advanced Learning. Teachers base assessments of their students on their observations, conversations with students, and student classroom work. Evaluation criteria, including the competencies, scoring scales, and indicators of achievement, are provided by the department and are used by teachers when reporting achievement results for these assessments to parents and to the department.The data collected for this assessment are reported to the department through an online web application. This application permits the generation of student-level and school-level results by competency, and also generates individual reports for each student. In addition, schools are able to generate a raw data file that can be utilized to further analyze data at the student level. This can allow for the examination of current processes and practices to ensure that the best strategies are being employed to foster development and growth in students.
A P r o f i l e o f S t u d e n t L e a r n i n g a n d P e r f o r m a n c e i n M a n i t o b a , 2 0 1 0 – 2 0 1 44
Schools and school divisions are expected to include an analysis of their results in a report to the community. To facilitate this analysis, each school year the department provides summary reports of divisional and provincial results for all competencies by school program.
Further information is available on the department’s assessment website at <www.edu.gov.mb.ca/k12/assess/gr3/index.html>. The document Interpreting and Using Results from Provincial Tests and Assessments: A Support Document for Teachers, Administrators, and Consultants provides further interpretive support and is available on the department’s website at <www.edu.gov.mb.ca/k12/assess/support/results/index.html>.
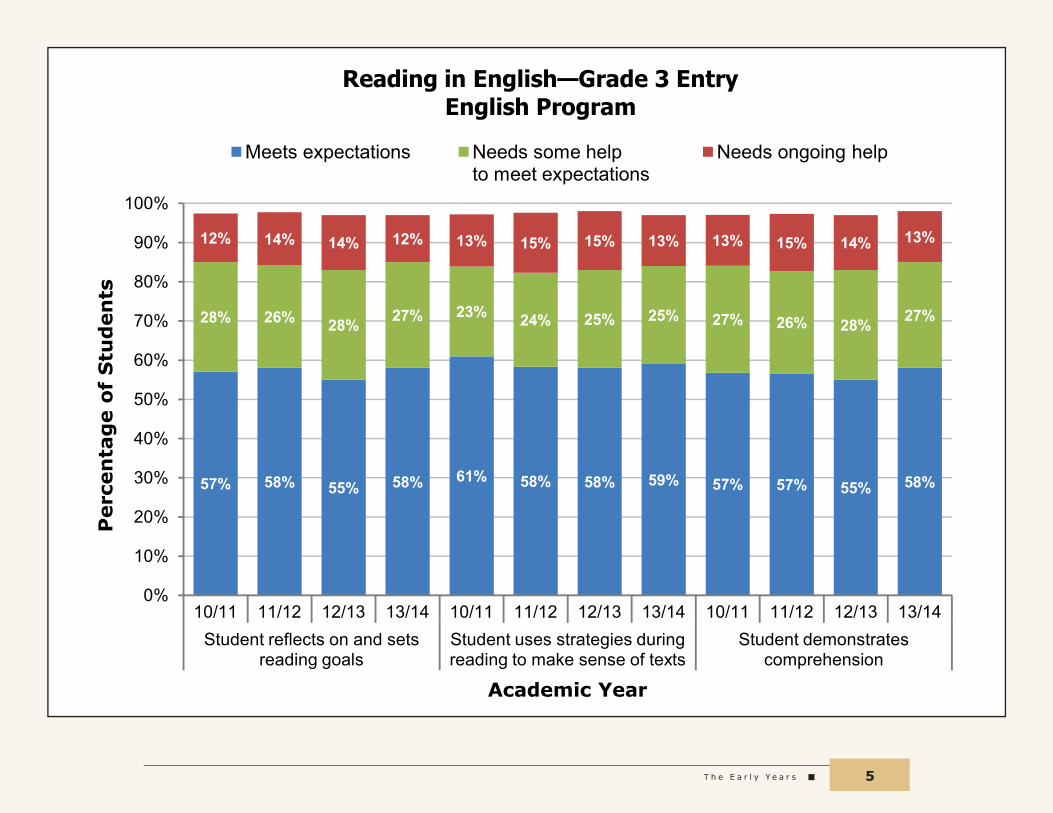
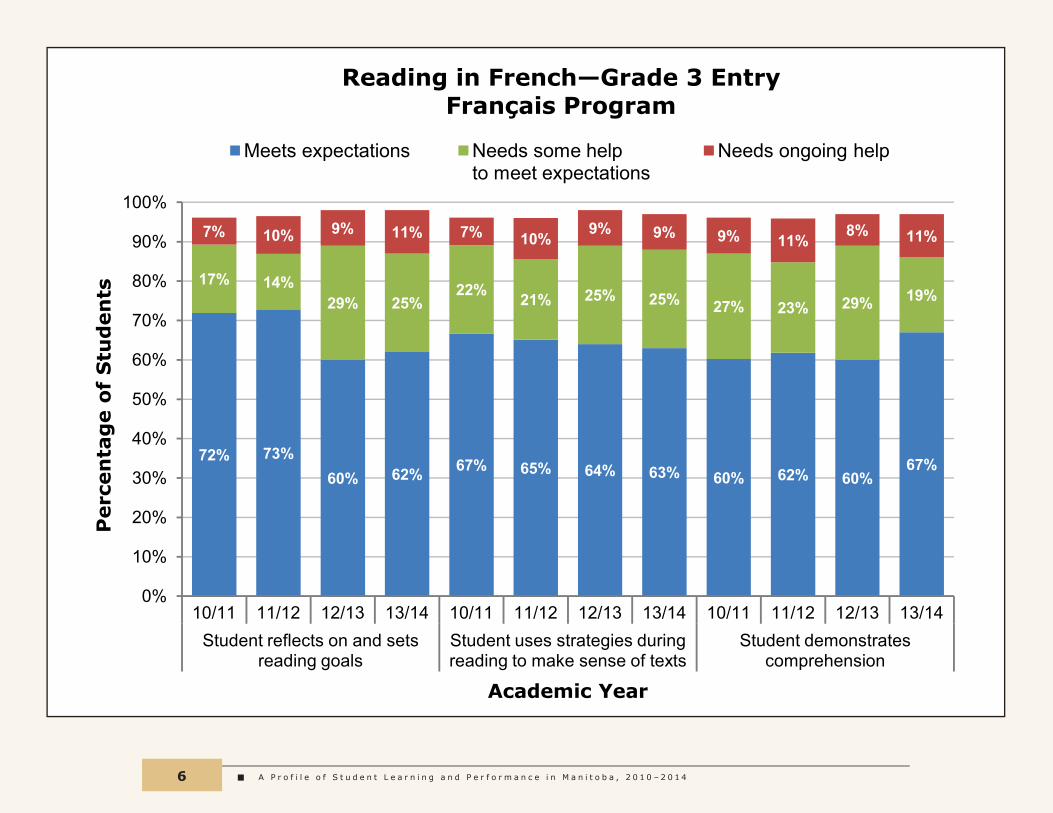
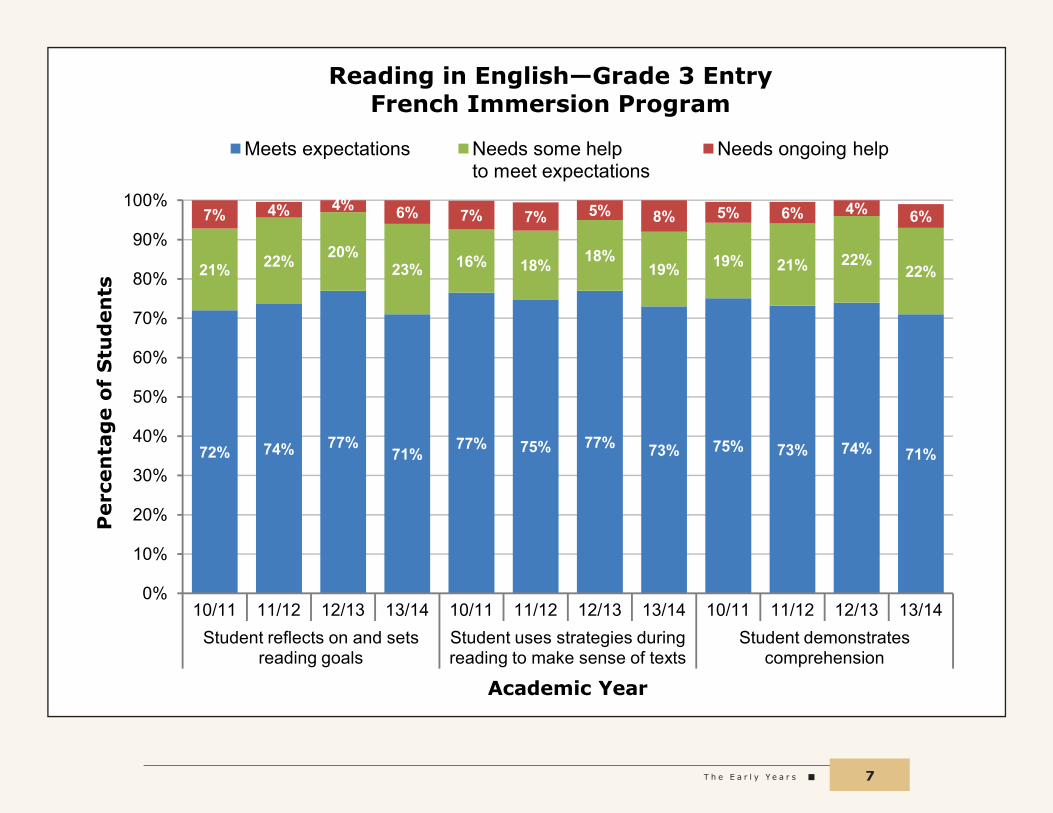
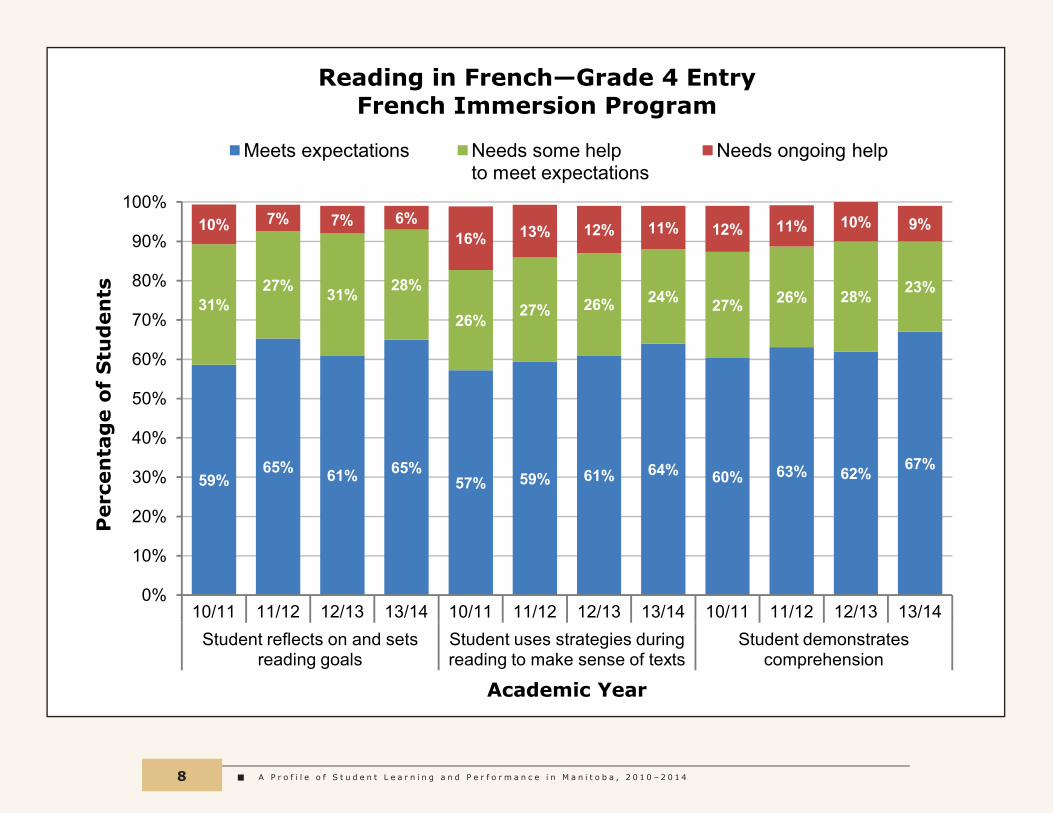
Grade 3/4 Assessment Results
The following information provides provincial summary results for the Grade 3/4 Assessment for the past four years. When interpreting these data, there are a number of points to keep in mind:
QQ An “out of range—below” category was added in 2009; therefore, the data presented do not add up to 100 percent. “Out of range—below” is used to describe those students who are working well below grade-level curriculum relative to the competencies assessed due to their learning disabilities or their need for new language learning.
QQ Although the reading competencies are the same in English and French, each language has unique features that are not readily equivalent and curriculum, instruction, and assessment differ accordingly. This means that results are not directly comparable between languages.
T h e E a r l y Y e a r s 5
57% 58% 55% 58% 61% 58% 58% 59% 57% 57% 55% 58%
28% 26% 28% 27% 23% 24% 25% 25% 27% 26% 28% 27%
12% 14% 14% 12% 13% 15% 15% 13% 13% 15% 14% 13%
0%
10%
20%
30%
40%
50%
60%
70%
80%
90%
100%
10/11 11/12 12/13 13/14 10/11 11/12 12/13 13/14 10/11 11/12 12/13 13/14 Student reflects on and sets
reading goals Student uses strategies during reading to make sense of texts
Student demonstrates comprehension
Perc
en
tag
e o
f S
tud
en
ts
Academic Year
Reading in English—Grade 3 Entry English Program
Meets expectations Needs some help to meet expectations
Needs ongoing help
A P r o f i l e o f S t u d e n t L e a r n i n g a n d P e r f o r m a n c e i n M a n i t o b a , 2 0 1 0 – 2 0 1 46
72% 73% 60 % 62% 67% 65% 64% 63% 60 % 62% 60 %
67%
17% 14% 29% 25%
22% 21% 25% 25% 27% 23% 29% 19%
7% 10 % 9% 11% 7% 10 % 9% 9% 9% 11% 8% 11%
0%
10%
20%
30%
40%
50%
60%
70%
80%
90%
100%
10/11 11/12 12/13 13/14 10/11 11/12 12/13 13/14 10/11 11/12 12/13 13/14 Student reflects on and sets
reading goals Student uses strategies during reading to make sense of texts
Student demonstrates comprehension
Perc
en
tag
e o
f S
tud
en
ts
Academic Year
Reading in French— G rade 3 Entry Franç ais Program
Meets expectations Needs some help to meet expectations
Needs ongoing help
T h e E a r l y Y e a r s 7
72% 74% 77% 71%
77% 75% 77% 73% 75% 73% 74% 71%
21% 22% 20 % 23% 16% 18% 18%
19% 19% 21% 22% 22%
7% 4% 4% 6% 7% 7% 5% 8% 5% 6% 4% 6%
0%
10%
20%
30%
40%
50%
60%
70%
80%
90%
100%
10/11 11/12 12/13 13/14 10/11 11/12 12/13 13/14 10/11 11/12 12/13 13/14 Student reflects on and sets
reading goals Student uses strategies during reading to make sense of texts
Student demonstrates comprehension
Perc
en
tag
e o
f S
tud
en
ts
Academic Year
Reading in English— G rade 3 Entry French Immersion Program
Meets expectations Needs some help to meet expectations
Needs ongoing help
A P r o f i l e o f S t u d e n t L e a r n i n g a n d P e r f o r m a n c e i n M a n i t o b a , 2 0 1 0 – 2 0 1 48
59% 65% 61% 65%
57% 59% 61% 64% 60 % 63% 62% 67%
31% 27% 31% 28%
26% 27% 26% 24% 27% 26% 28% 23%
10 % 7% 7% 6% 16% 13% 12% 11% 12% 11% 10 % 9%
0%
10%
20%
30%
40%
50%
60%
70%
80%
90%
100%
10/11 11/12 12/13 13/14 10/11 11/12 12/13 13/14 10/11 11/12 12/13 13/14 Student reflects on and sets
reading goals Student uses strategies during reading to make sense of texts
Student demonstrates comprehension
Perc
en
tag
e o
f S
tud
en
ts
Academic Year
Reading in French— G rade 4 Entry French Immersion Program
Meets expectations Needs some help to meet expectations
Needs ongoing help
T h e E a r l y Y e a r s 9
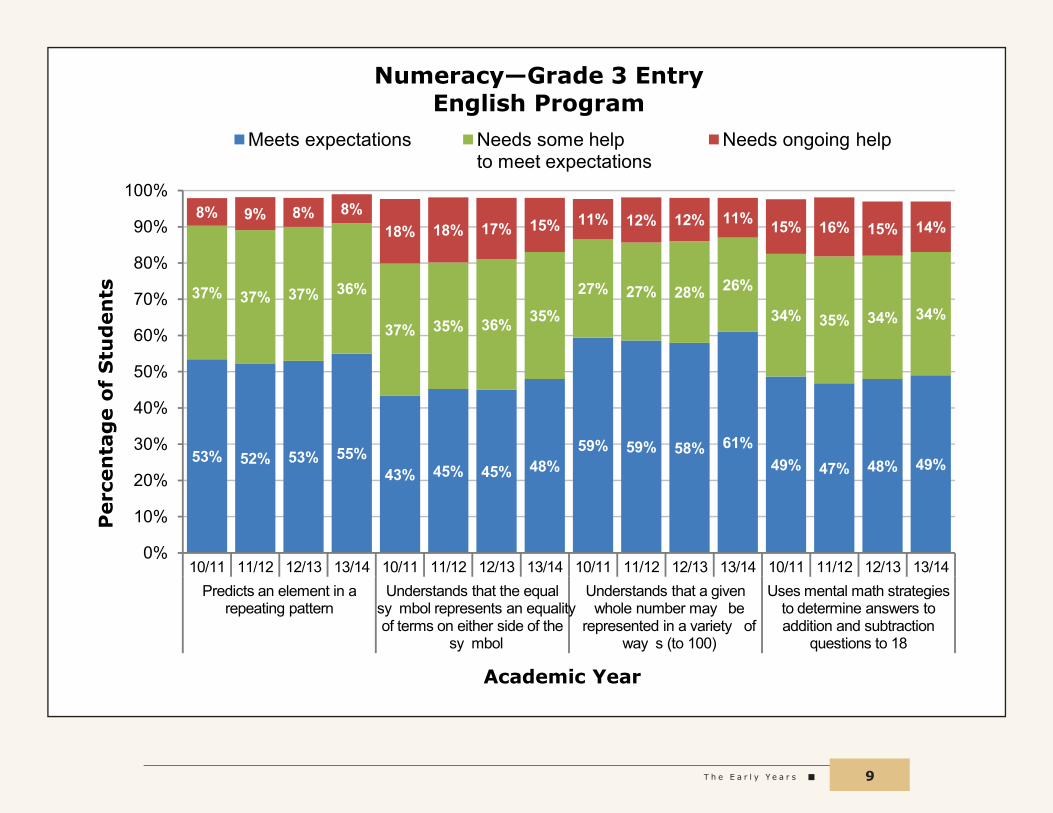
53% 52% 53% 55% 43% 45% 45% 48%
59% 59% 58% 61% 49% 47% 48% 49%
37% 37% 37% 36%
37% 35% 36% 35%
27% 27% 28% 26%
34% 35% 34% 34%
8% 9% 8% 8% 18% 18% 17% 15% 11% 12% 12% 11% 15% 16% 15% 14%
0%
10%
20%
30%
40%
50%
60%
70%
80%
90%
100%
10/11 11/12 12/13 13/14 10/11 11/12 12/13 13/14 10/11 11/12 12/13 13/14 10/11 11/12 12/13 13/14 P redicts an element in a
repeating pattern U nderstands that the eq ual
sy mb ol represents an eq uality of terms on either side of the
sy mb ol
U nderstands that a giv en w hole numb er may b e
represented in a v ariety of w ay s ( to 100)
U ses mental math strategies to determine answ ers to addition and sub traction
q uestions to 18
Perc
en
tag
e o
f S
tud
en
ts
Academic Year
Numeracy— G rade 3 Entry English Program
Meets expectations Needs some help to meet expectations
Needs ongoing help
A P r o f i l e o f S t u d e n t L e a r n i n g a n d P e r f o r m a n c e i n M a n i t o b a , 2 0 1 0 – 2 0 1 410
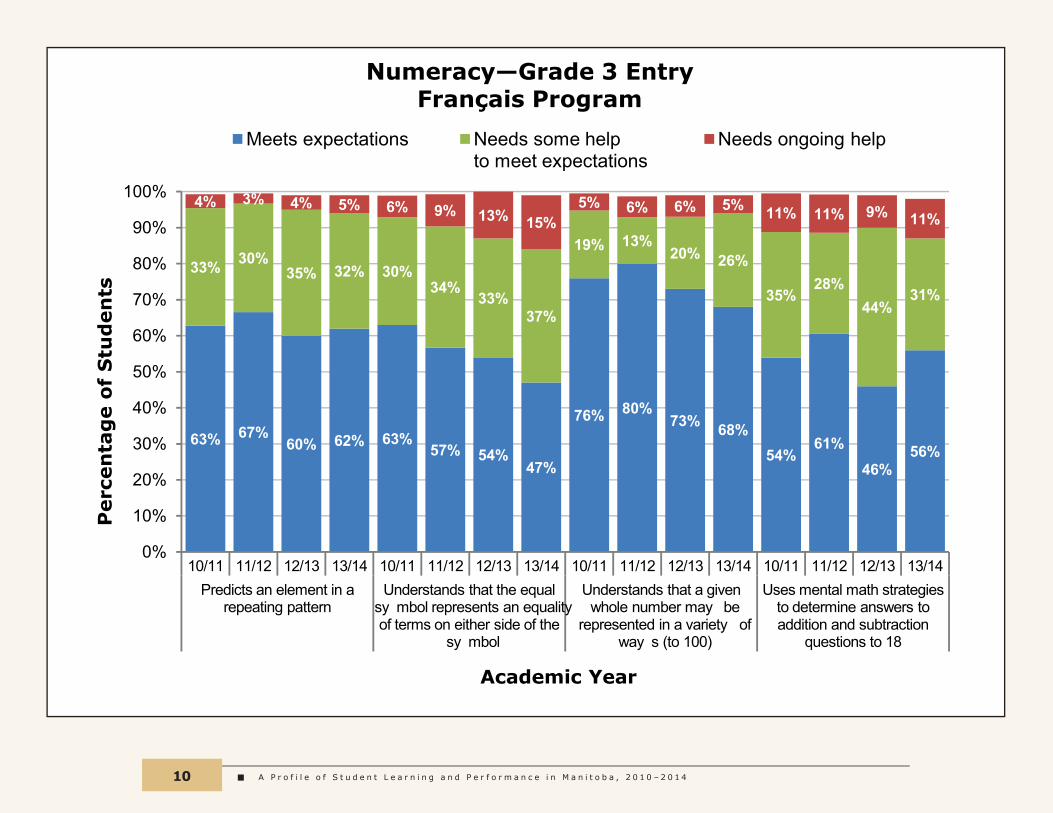
63% 67% 60 % 62% 63%
57% 54% 47%
76% 80 % 73% 68%
54% 61%
46% 56%
33% 30 % 35% 32% 30 %
34% 33%
37%
19% 13% 20 % 26%
35% 28%
44% 31%
4% 3% 4% 5% 6% 9% 13% 15% 5% 6% 6% 5% 11% 11% 9% 11%
0%
10%
20%
30%
40%
50%
60%
70%
80%
90%
100%
10/11 11/12 12/13 13/14 10/11 11/12 12/13 13/14 10/11 11/12 12/13 13/14 10/11 11/12 12/13 13/14 P redicts an element in a
repeating pattern U nderstands that the eq ual
sy mb ol represents an eq uality of terms on either side of the
sy mb ol
U nderstands that a giv en w hole numb er may b e
represented in a v ariety of w ay s ( to 100)
U ses mental math strategies to determine answ ers to addition and sub traction
q uestions to 18
Perc
en
tag
e o
f S
tud
en
ts
Academic Year
Numeracy— G rade 3 Entry Franç ais Program
Meets expectations Needs some help to meet expectations
Needs ongoing help

T h e E a r l y Y e a r s 11
64% 63% 66% 63% 52% 54%
60 % 61% 69% 65%
71% 71%
55% 53% 60 % 61%
32% 31% 30 % 32%
35% 36%
34% 31% 26% 30 %
25% 25%
35% 36% 31% 31%
3% 6% 4% 4% 14% 10 % 7% 7% 5% 6% 4% 4% 9% 11% 9% 8%
0%
10%
20%
30%
40%
50%
60%
70%
80%
90%
100%
10/11 11/12 12/13 13/14 10/11 11/12 12/13 13/14 10/11 11/12 12/13 13/14 10/11 11/12 12/13 13/14 P redicts an element in a
repeating pattern U nderstands that the eq ual
sy mb ol represents an eq uality of terms on either side of the
sy mb ol
U nderstands that a giv en w hole numb er may b e
represented in a v ariety of w ay s ( to 100)
U ses mental math strategies to determine answ ers to addition and sub traction
q uestions to 18
Perc
en
tag
e o
f S
tud
en
ts
Academic Year
Numeracy— G rade 3 Entry French Immersion Program
Meets expectations Needs some help to meet expectations
Needs ongoing help
A P r o f i l e o f S t u d e n t L e a r n i n g a n d P e r f o r m a n c e i n M a n i t o b a , 2 0 1 0 – 2 0 1 412
t h e m i d d l e y e A r S
The Middle Years Assessment
Introduction
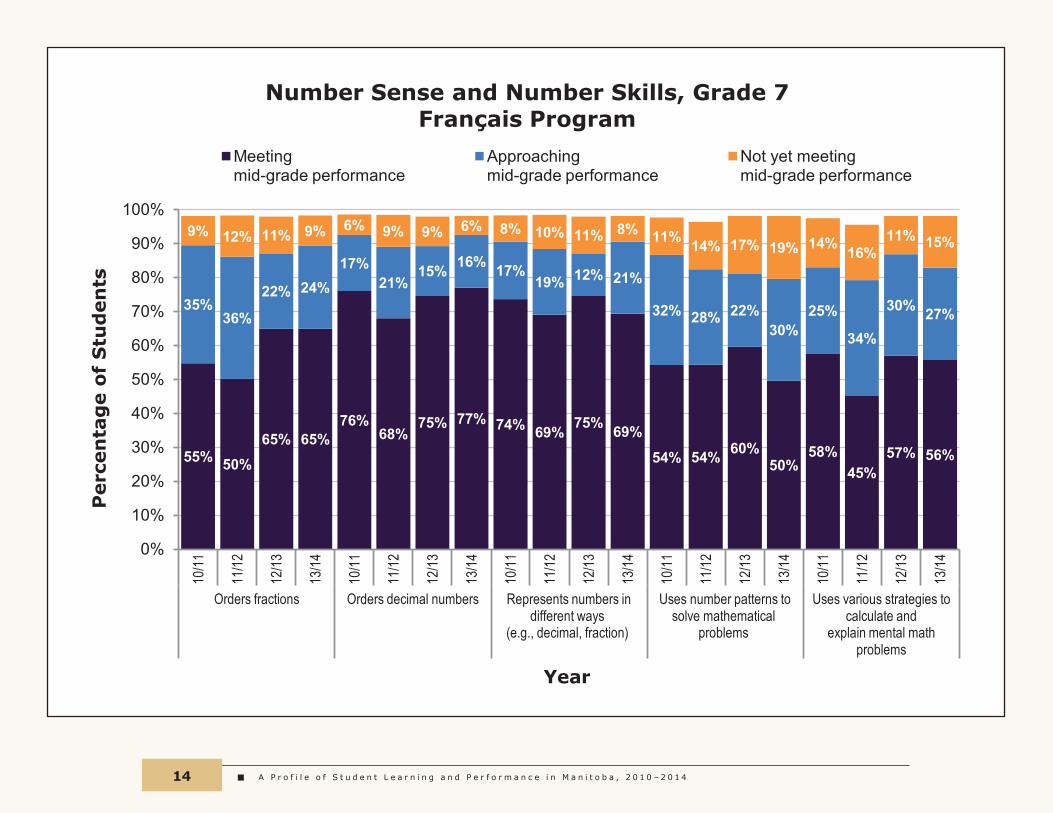
Manitoba students in Grades 7 and 8 undergo classroom-based provincial assessments in competencies in numeracy, engagement with school, reading, and writing. Teachers base assessments of their students on their observations, conversations with students, and their evaluations of students’ classroom-based work, and they report on student performance levels as of the last two weeks of January. Evaluation criteria, including the competencies, scoring scales, and indicators of achievement, are provided by the department and are used by teachers when reporting achievement results for these assessments to parents and to the department.
The data collected for this assessment are reported to the department through an online web application. This application permits the generation of student-level and school-level results by competency, and also generates individual reports for each student. In addition, schools are able to generate a raw data file that can be utilized to further analyze data at the student level. This can allow for the examination of current processes and practices to ensure that the best strategies are being employed to foster development and growth in students.
Schools and school divisions are expected to include an analysis of their results in a report to the community. To help facilitate this, each school year the department provides summary reports of divisional and provincial results for all competencies by school program.
The Middle Years Assessment was implemented fully for the first time in the 2007/2008 school year. Further information is available on the department’s website at <www.edu.gov.mb.ca/k12/assess/myreporting.html>.
The document Interpreting and Using Results from Provincial Tests and Assessments provides further interpretive support, and is available on the department’s website at <www.edu.gov.mb.ca/k12/assess/support/results/index.html>.
Middle Years Assessment Results
The following tables provide provincial summary results for the Middle Years Assessment. When interpreting Middle Years Assessment data, there are a number of points to keep in mind:
QQ A performance level called “out of range—below” is excluded from the following tables; therefore, the data presented do not add up to 100%.
T h e M i d d l e Y e a r s 13
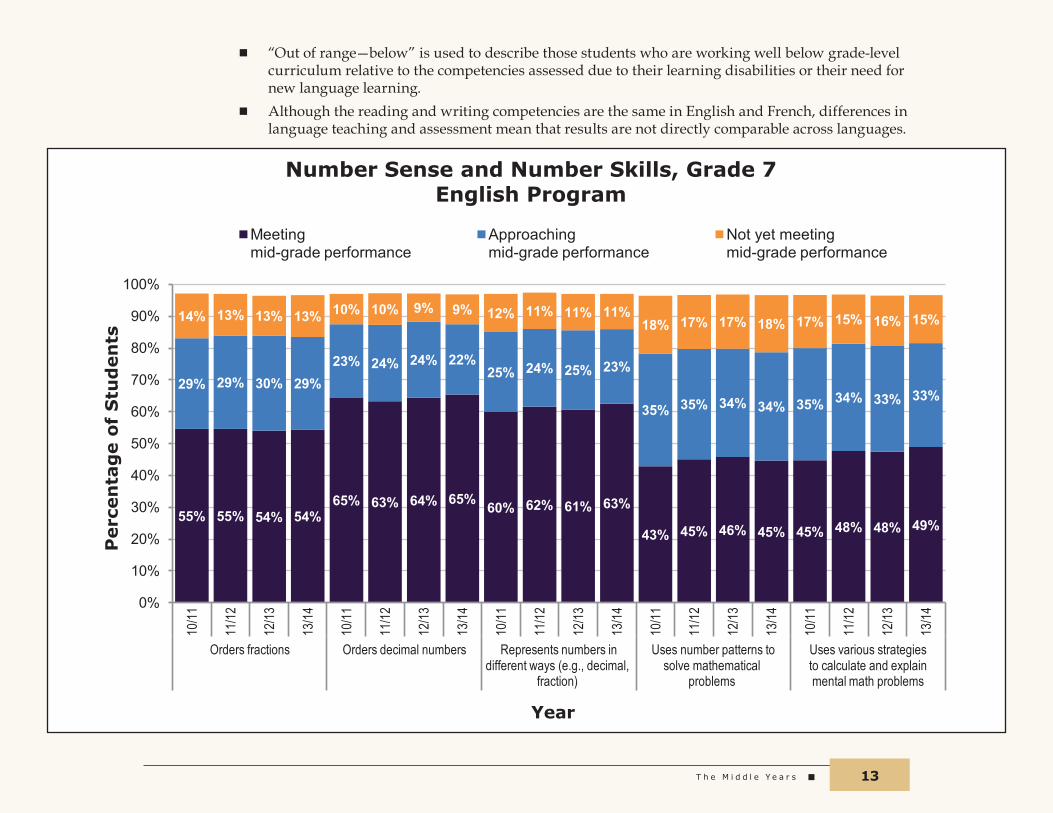
QQ “Out of range—below” is used to describe those students who are working well below grade‑level curriculum relative to the competencies assessed due to their learning disabilities or their need for new language learning.
QQ Although the reading and writing competencies are the same in English and French, differences in language teaching and assessment mean that results are not directly comparable across languages.
55% 55% 54% 54% 65% 63% 64% 65% 60% 62% 61% 63%
43% 45% 46% 45% 45% 48% 48% 49%
29% 29% 30% 29% 23% 24% 24% 22%
25% 24% 25% 23%
35% 35% 34% 34% 35% 34% 33% 33%
14% 13% 13% 13% 10% 10% 9% 9% 12% 11% 11% 11% 18% 17% 17% 18% 17% 15% 16% 15%
0%
10%
20%
30%
40%
50%
60%
70%
80%
90%
100%
10/11
11/12
12/13
13/14
10/11
11/12
12/13
13/14
10/11
11/12
12/13
13/14
10/11
11/12
12/13
13/14
10/11
11/12
12/13
13/14
Orders fractions Orders decimal numbers Represents numbers in different ways (e.g., decimal,
fraction)
Uses number patterns to solve mathematical
problems
Uses various strategies to calculate and explain mental math problems
Perc
en
tag
e o
f S
tud
en
ts
Year
Number Sense and Number Skills, Grade 7 English Program
Meeting mid-grade performance
Approaching mid-grade performance
Not yet meeting mid-grade performance
A P r o f i l e o f S t u d e n t L e a r n i n g a n d P e r f o r m a n c e i n M a n i t o b a , 2 0 1 0 – 2 0 1 414
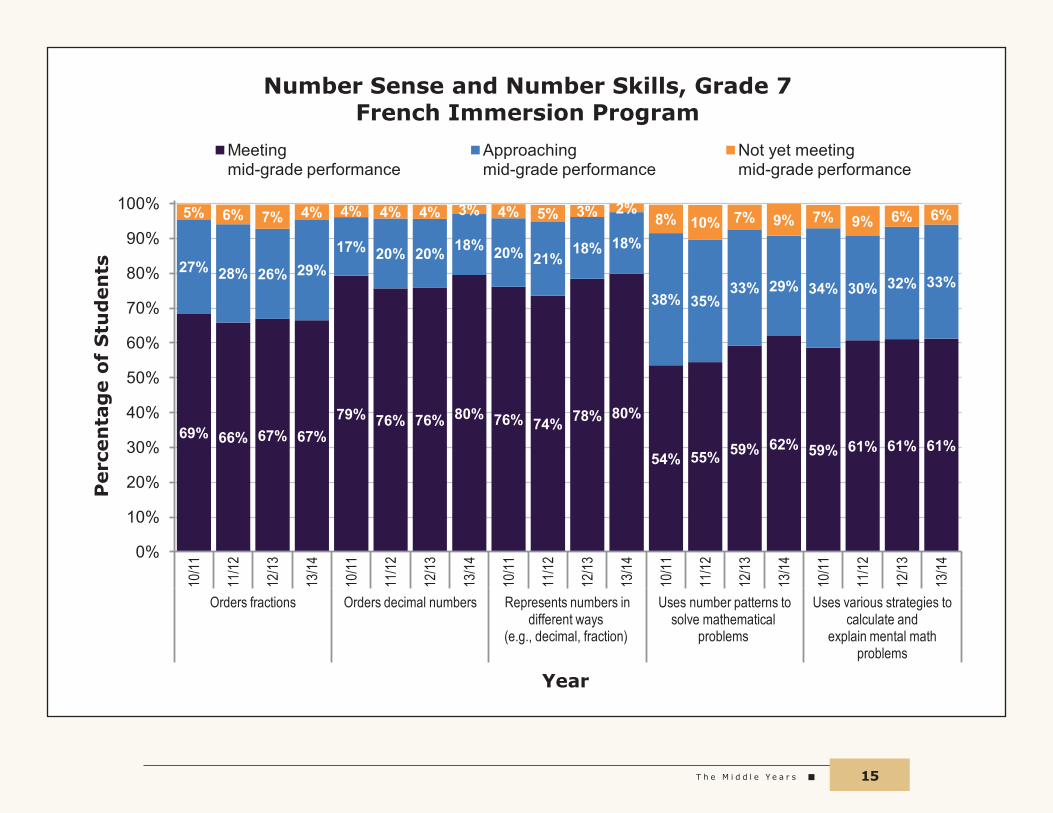
55% 50% 65% 65%
76% 68%
75% 77% 74% 69% 75% 69%
54% 54% 60% 50%
58% 45%
57% 56%
35% 36%
22% 24% 17%
21% 15% 16% 17%
19% 12% 21%
32% 28% 22% 30%
25%
34%
30% 27%
9% 12% 11% 9% 6% 9% 9% 6% 8% 10% 11% 8% 11% 14% 17% 19% 14% 16% 11% 15%
0%
10%
20%
30%
40%
50%
60%
70%
80%
90%
100% 10
/11
11/12
12/13
13/14
10/11
11/12
12/13
13/14
10/11
11/12
12/13
13/14
10/11
11/12
12/13
13/14
10/11
11/12
12/13
13/14
Orders fractions Orders decimal numbers Represents numbers in different ways
(e.g., decimal, fraction)
Uses number patterns to solve mathematical
problems
Uses various strategies to calculate and
explain mental math problems
Perc
en
tag
e o
f S
tud
en
ts
Year
Number Sense and Number Skills, Grade 7 Français Program
Meeting mid-grade performance
Approaching mid-grade performance
Not yet meeting mid-grade performance
T h e M i d d l e Y e a r s 15
69% 66% 67% 67% 79% 76% 76% 80% 76% 74% 78% 80%
54% 55% 59% 62% 59% 61% 61% 61%
27% 28% 26% 29% 17% 20% 20% 18% 20% 21%
18% 18%
38% 35% 33% 29% 34% 30% 32% 33%
5% 6% 7% 4% 4% 4% 4% 3% 4% 5% 3% 2% 8% 10% 7% 9% 7% 9% 6% 6%
0%
10%
20%
30%
40%
50%
60%
70%
80%
90%
100% 10
/11
11/12
12/13
13/14
10/11
11/12
12/13
13/14
10/11
11/12
12/13
13/14
10/11
11/12
12/13
13/14
10/11
11/12
12/13
13/14
Orders fractions Orders decimal numbers Represents numbers in different ways
(e.g., decimal, fraction)
Uses number patterns to solve mathematical
problems
Uses various strategies to calculate and
explain mental math problems
Perc
en
tag
e o
f S
tud
en
ts
Year
Number Sense and Number Skills, Grade 7 French Immersion Program
Meeting mid-grade performance
Approaching mid-grade performance
Not yet meeting mid-grade performance
A P r o f i l e o f S t u d e n t L e a r n i n g a n d P e r f o r m a n c e i n M a n i t o b a , 2 0 1 0 – 2 0 1 416
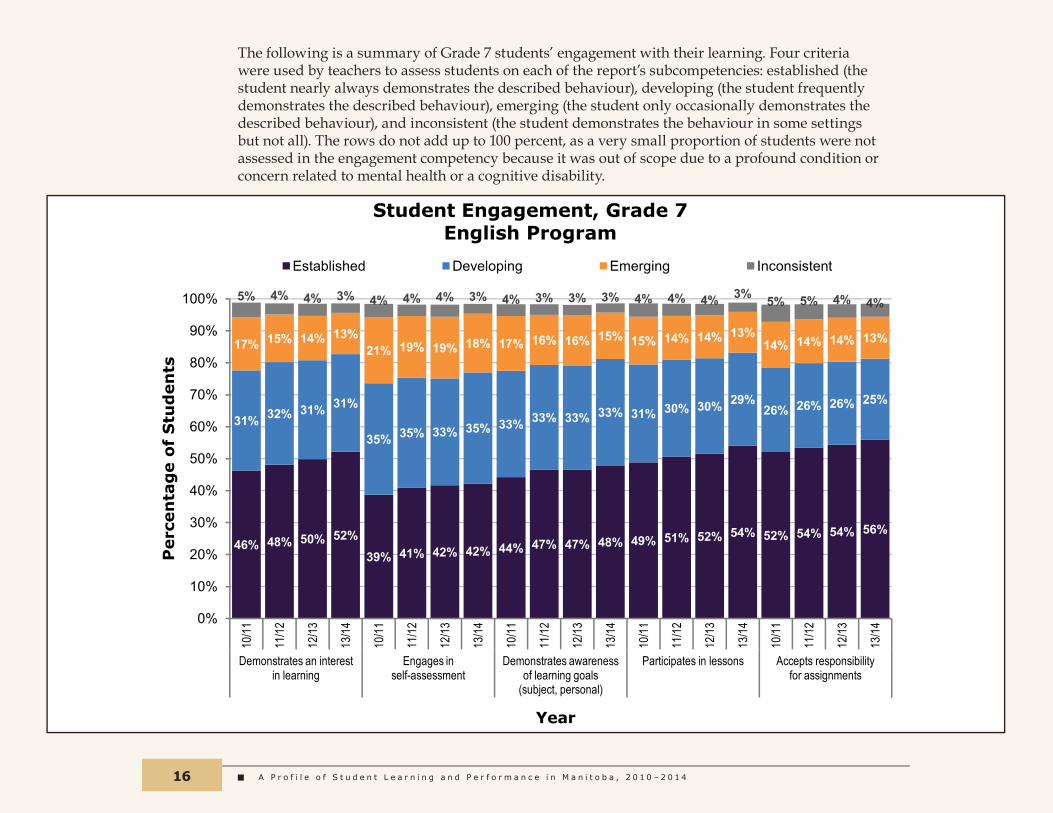
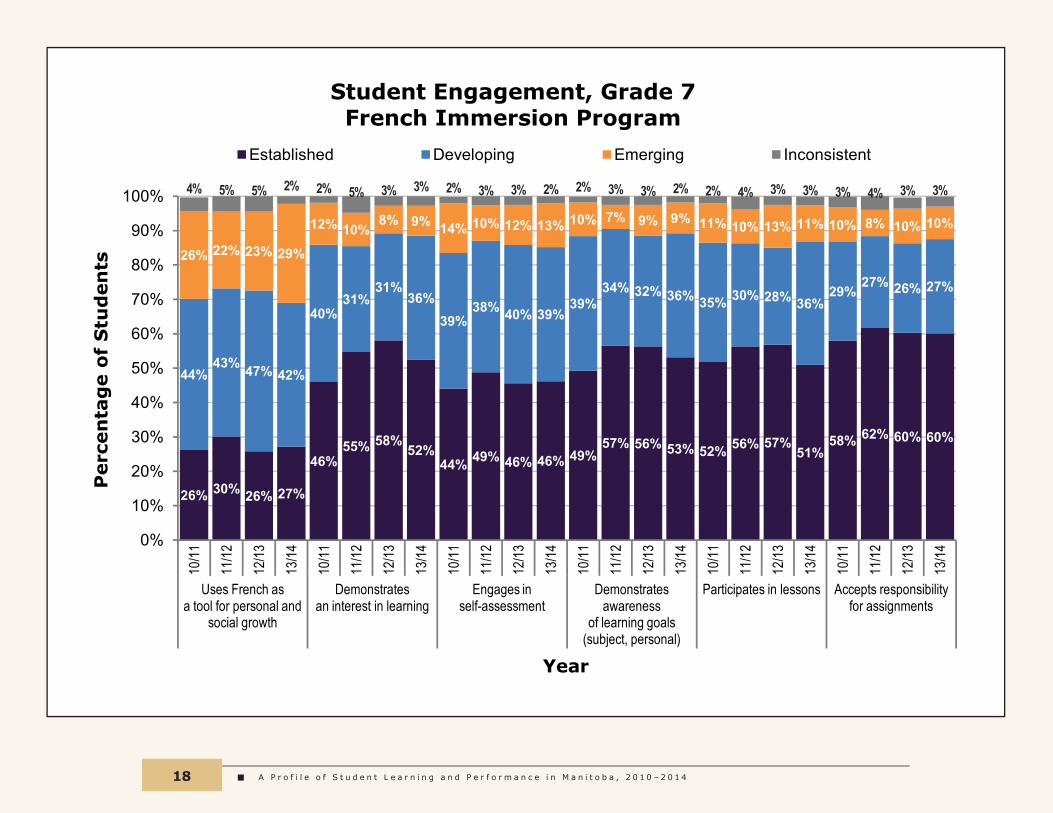
The following is a summary of Grade 7 students’ engagement with their learning. Four criteria were used by teachers to assess students on each of the report’s subcompetencies: established (the student nearly always demonstrates the described behaviour), developing (the student frequently demonstrates the described behaviour), emerging (the student only occasionally demonstrates the described behaviour), and inconsistent (the student demonstrates the behaviour in some settings but not all). The rows do not add up to 100 percent, as a very small proportion of students were not assessed in the engagement competency because it was out of scope due to a profound condition or concern related to mental health or a cognitive disability.
46% 48% 50 % 52% 39% 41% 42% 42% 44% 47% 47% 48% 49% 51% 52% 54% 52% 54% 54% 56%
31% 32% 31% 31%
35% 35% 33% 35% 33% 33% 33% 33% 31% 30 % 30 % 29% 26% 26% 26% 25%
17% 15% 14% 13% 21% 19% 19% 18% 17% 16% 16% 15% 15% 14% 14% 13%
14% 14% 14% 13%
5% 4% 4% 3% 4% 4% 4% 3% 4% 3% 3% 3% 4% 4% 4% 3% 5% 5% 4% 4%
0%
10%
20%
30%
40%
50%
60%
70%
80%
90%
100%
10/11
11/12
12/13
13/14
10/11
11/12
12/13
13/14
10/11
11/12
12/13
13/14
10/11
11/12
12/13
13/14
10/11
11/12
12/13
13/14
D emonstrates an interest in learning
E ngages in self- assessment
D emonstrates awareness of learning goals
(subj ect, personal)
P articipates in lessons A ccepts responsibility for assignments
Perc
en
tag
e o
f S
tud
en
ts
Year
Student Engagement, G rade 7 English Program
E stab lished D ev eloping E merging I nconsistent
T h e M i d d l e Y e a r s 17
29% 33% 29% 32% 32% 36% 33% 36% 45%
50% 42% 45%
36% 43% 39% 42% 40% 42% 47%
41% 51% 49% 45% 48%
60% 62% 59% 60%
31% 30% 33%
32% 29% 33% 36%
45% 28% 27%
37% 38%
31%
29% 34% 38%
28% 27% 30% 43%
28% 29% 26%
37% 23% 23%
20% 26%
36% 33% 31% 31% 34% 24% 23%
18% 24%
20% 18% 16%
29% 26% 24% 17%
28% 28% 20%
14% 18% 18%
25%
12% 15% 13% 18%
12%
3% 3% 5% 4% 4% 6% 6%
2% 4% 2% 3% 2% 3% 2% 2% 3% 3% 2% 3% 2% 3% 3% 3% 2% 2% 2% 2% 2%
0%
10%
20%
30%
40%
50%
60%
70%
80%
90%
100% 10
/11
11/12
12/13
13/14
10/11
11/12
12/13
13/14
10/11
11/12
12/13
13/14
10/11
11/12
12/13
13/14
10/11
11/12
12/13
13/14
10/11
11/12
12/13
13/14
10/11
11/12
12/13
13/14
Understands fit in francophone linguistic and
cultural realities
Expresses values and behaviours demonstrating French identity
Demonstrates an interest
in learning
Engages in self-assessment
Demonstrates awareness of learning goals
(subject, personal)
Participates in lessons
Accepts responsibility
for assignments
Perc
en
tag
e o
f S
tud
en
ts
Year
Student Engagement, Grade 7 Français Program
Established Developing Emerging Inconsistent
A P r o f i l e o f S t u d e n t L e a r n i n g a n d P e r f o r m a n c e i n M a n i t o b a , 2 0 1 0 – 2 0 1 418
26% 30 % 26% 27%
46% 55% 58%
52% 44% 49% 46% 46% 49%
57% 56% 53% 52% 56% 57% 51%
58% 62% 60 % 60 %
44% 43% 47% 42%
40 % 31%
31% 36%
39% 38% 40 % 39%
39% 34% 32% 36% 35% 30 % 28% 36%
29% 27% 26% 27%
26% 22% 23% 29%
12% 10 % 8% 9% 14% 10 % 12% 13% 10 % 7% 9% 9% 11% 10 % 13% 11% 10 % 8% 10 % 10 %
4% 5% 5% 2% 2% 5% 3% 3% 2% 3% 3% 2% 2% 3% 3% 2% 2% 4% 3% 3% 3% 4% 3% 3%
0%
10%
20%
30%
40%
50%
60%
70%
80%
90%
100% 10
/11
11/12
12/13
13/14
10/11
11/12
12/13
13/14
10/11
11/12
12/13
13/14
10/11
11/12
12/13
13/14
10/11
11/12
12/13
13/14
10/11
11/12
12/13
13/14
Uses F rench as a tool for personal and
social growth
D emonstrates an interest in learning
E ngages in self- assessment
D emonstrates awareness
of learning goals (subj ect, personal)
P articipates in lessons A ccepts responsibility for assignments
Perc
en
tag
e o
f S
tud
en
ts
Year
Student Engagement, G rade 7 French Immersion Program
E stab lished D ev eloping E merging I nconsistent
T h e M i d d l e Y e a r s 19
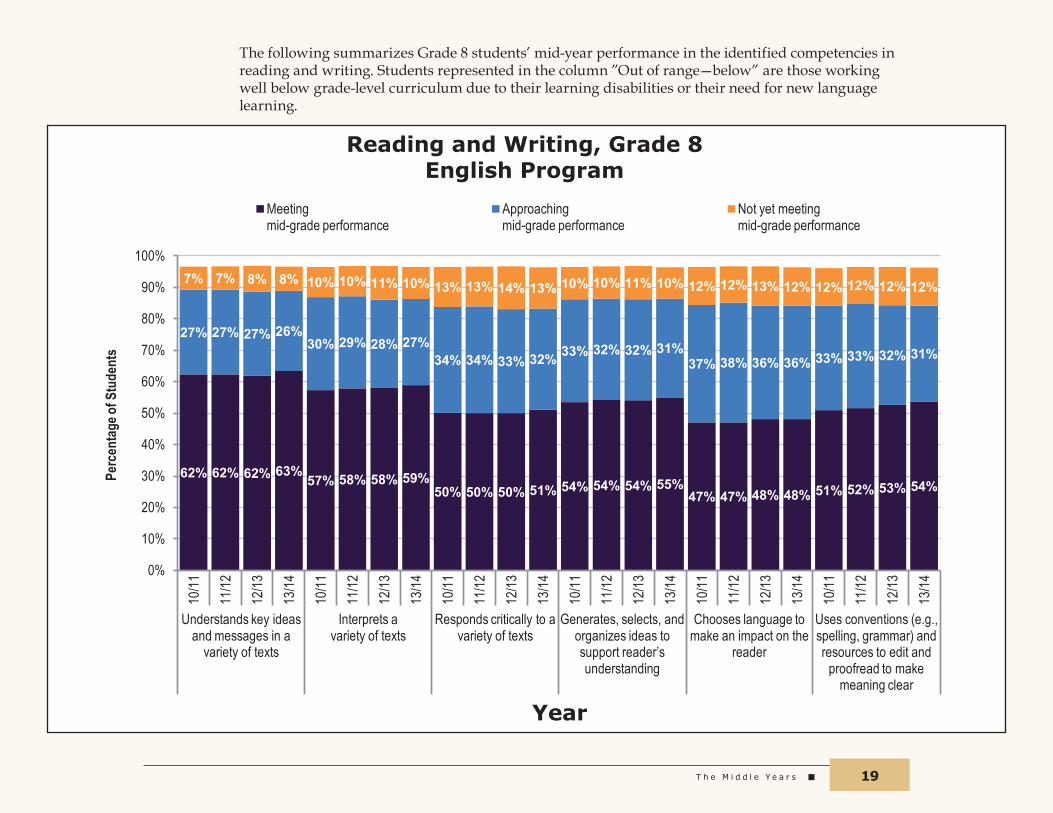
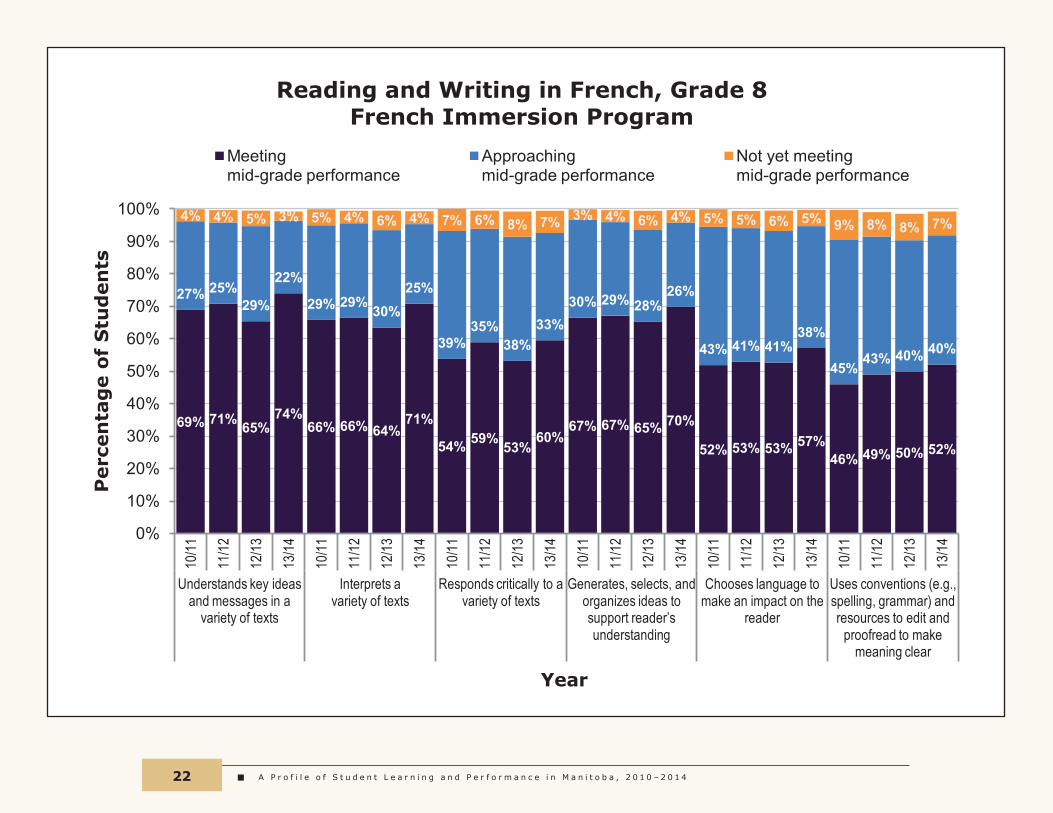
The following summarizes Grade 8 students’ mid‑year performance in the identified competencies in reading and writing. Students represented in the column ”Out of range—below” are those working well below grade‑level curriculum due to their learning disabilities or their need for new language learning.
62% 62% 62% 63% 57% 58% 58% 59%
50% 50% 50% 51% 54% 54% 54% 55% 47% 47% 48% 48% 51% 52% 53% 54%
27% 27% 27% 26% 30% 29% 28% 27%
34% 34% 33% 32% 33% 32% 32% 31% 37% 38% 36% 36% 33% 33% 32% 31%
7% 7% 8% 8% 10% 10% 11% 10% 13% 13% 14% 13% 10% 10% 11% 10% 12% 12% 13% 12% 12% 12% 12% 12%
0%
10%
20%
30%
40%
50%
60%
70%
80%
90%
100%
10/11
11/12
12/13
13/14
10/11
11/12
12/13
13/14
10/11
11/12
12/13
13/14
10/11
11/12
12/13
13/14
10/11
11/12
12/13
13/14
10/11
11/12
12/13
13/14
Understands key ideas and messages in a
variety of texts
Interprets a variety of texts
Responds critically to a variety of texts
Generates, selects, and organizes ideas to support reader’s understanding
Chooses language to make an impact on the
reader
Uses conventions (e.g., spelling, grammar) and resources to edit and
proofread to make meaning clear
Perc
enta
ge of
Stu
dent
s
Year
Reading and Writing, Grade 8 English Program
Meeting mid-grade performance
Approaching mid-grade performance
Not yet meeting mid-grade performance
A P r o f i l e o f S t u d e n t L e a r n i n g a n d P e r f o r m a n c e i n M a n i t o b a , 2 0 1 0 – 2 0 1 420
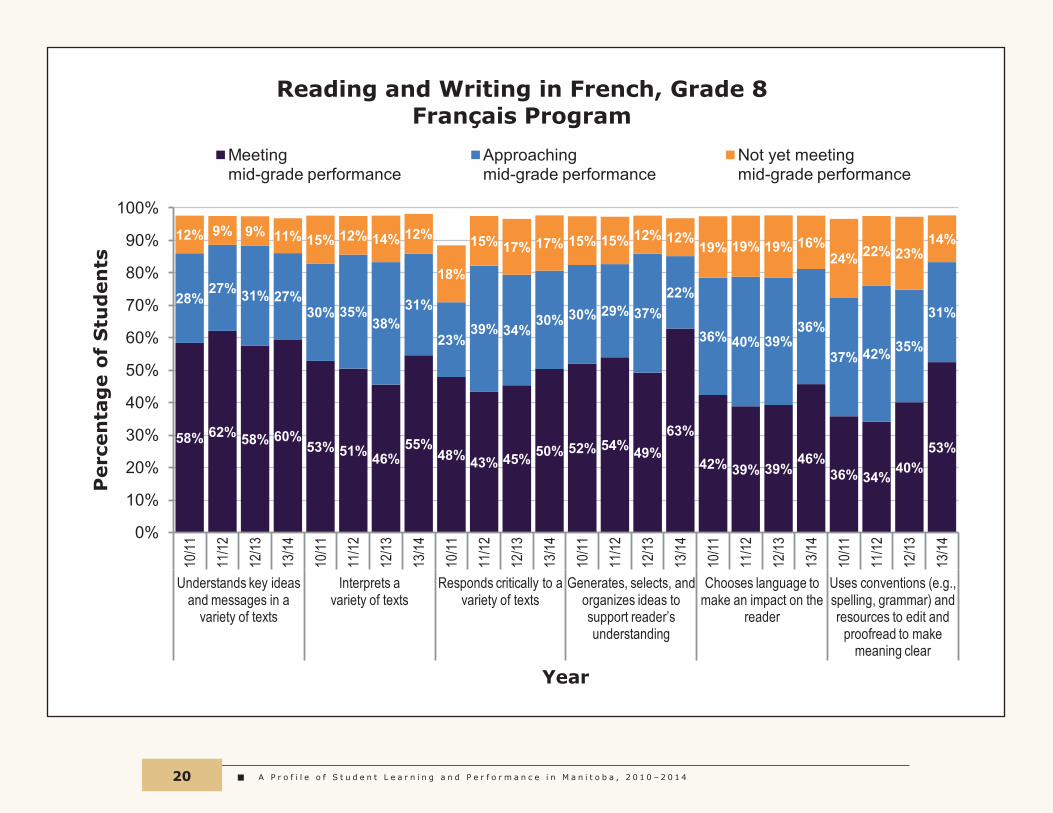
58% 62% 58% 60% 53% 51% 46%
55% 48% 43% 45% 50% 52% 54% 49%
63%
42% 39% 39% 46%
36% 34% 40% 53%
28% 27% 31% 27%
30% 35% 38%
31%
23% 39% 34%
30% 30% 29% 37% 22%
36% 40% 39% 36%
37% 42% 35%
31%
12% 9% 9% 11% 15% 12% 14% 12%
18%
15% 17% 17% 15% 15% 12% 12% 19% 19% 19% 16%
24% 22% 23% 14%
0%
10%
20%
30%
40%
50%
60%
70%
80%
90%
100% 10
/11
11/12
12/13
13/14
10/11
11/12
12/13
13/14
10/11
11/12
12/13
13/14
10/11
11/12
12/13
13/14
10/11
11/12
12/13
13/14
10/11
11/12
12/13
13/14
Understands key ideas and messages in a
variety of texts
Interprets a variety of texts
Responds critically to a variety of texts
Generates, selects, and organizes ideas to support reader’s understanding
Chooses language to make an impact on the
reader
Uses conventions (e.g., spelling, grammar) and resources to edit and
proofread to make meaning clear
Perc
en
tag
e o
f S
tud
en
ts
Year
Reading and Writing in French, Grade 8 Français Program
Meeting mid-grade performance
Approaching mid-grade performance
Not yet meeting mid-grade performance
T h e M i d d l e Y e a r s 21
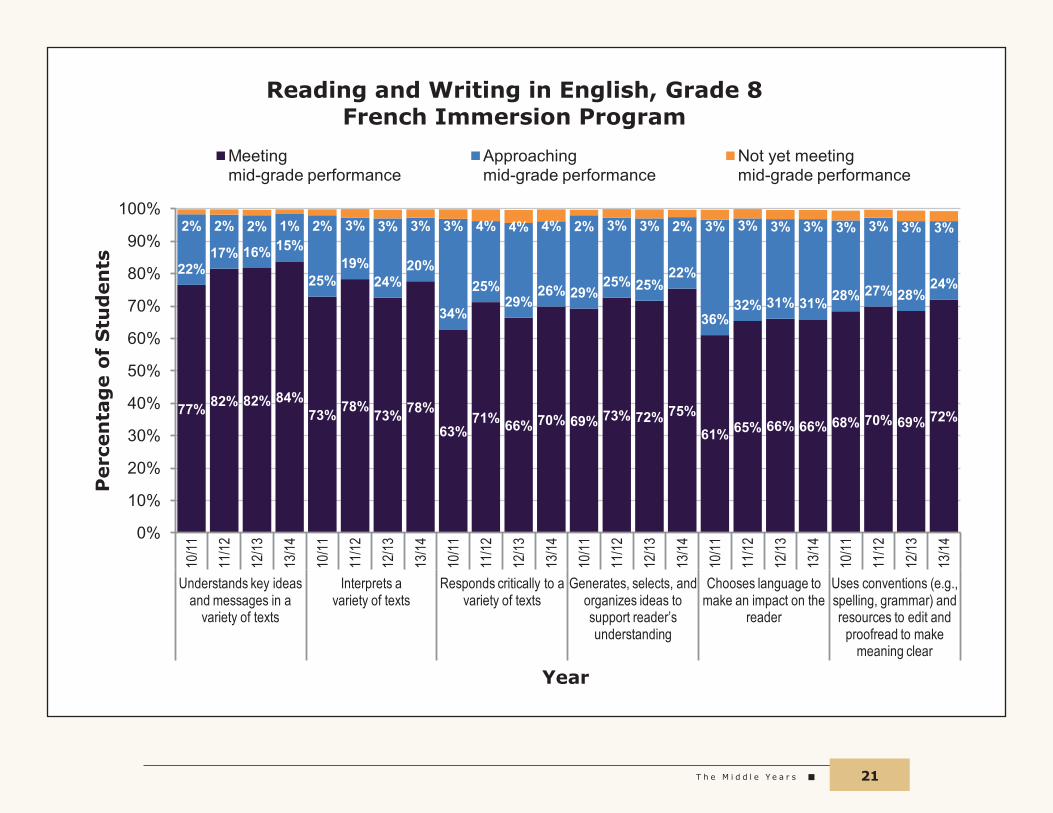
77% 82% 82% 84% 73% 78% 73% 78%
63% 71% 66% 70% 69% 73% 72% 75%
61% 65% 66% 66% 68% 70% 69% 72%
22% 17% 16% 15%
25% 19%
24% 20%
34%
25% 29%
26% 29% 25% 25%
22%
36% 32% 31% 31% 28% 27% 28%
24%
2% 2% 2% 1% 2% 3% 3% 3% 3% 4% 4% 4% 2% 3% 3% 2% 3% 3% 3% 3% 3% 3% 3% 3%
0%
10%
20%
30%
40%
50%
60%
70%
80%
90%
100% 10
/11
11/12
12/13
13/14
10/11
11/12
12/13
13/14
10/11
11/12
12/13
13/14
10/11
11/12
12/13
13/14
10/11
11/12
12/13
13/14
10/11
11/12
12/13
13/14
Understands key ideas and messages in a
variety of texts
Interprets a variety of texts
Responds critically to a variety of texts
Generates, selects, and organizes ideas to support reader’s understanding
Chooses language to make an impact on the
reader
Uses conventions (e.g., spelling, grammar) and resources to edit and
proofread to make meaning clear
Perc
en
tag
e o
f S
tud
en
ts
Year
Reading and Writing in English, Grade 8 French Immersion Program
Meeting mid-grade performance
Approaching mid-grade performance
Not yet meeting mid-grade performance
A P r o f i l e o f S t u d e n t L e a r n i n g a n d P e r f o r m a n c e i n M a n i t o b a , 2 0 1 0 – 2 0 1 422
69% 71% 65% 74%
66% 66% 64% 71%
54% 59% 53% 60%
67% 67% 65% 70%
52% 53% 53% 57% 46% 49% 50% 52%
27% 25% 29%
22%
29% 29% 30% 25%
39% 35%
38% 33%
30% 29% 28% 26%
43% 41% 41% 38%
45% 43% 40% 40%
4% 4% 5% 3% 5% 4% 6% 4% 7% 6% 8% 7% 3% 4% 6% 4% 5% 5% 6% 5% 9% 8% 8% 7%
0%
10%
20%
30%
40%
50%
60%
70%
80%
90%
100% 10
/11
11/12
12/13
13/14
10/11
11/12
12/13
13/14
10/11
11/12
12/13
13/14
10/11
11/12
12/13
13/14
10/11
11/12
12/13
13/14
10/11
11/12
12/13
13/14
Understands key ideas and messages in a
variety of texts
Interprets a variety of texts
Responds critically to a variety of texts
Generates, selects, and organizes ideas to support reader’s understanding
Chooses language to make an impact on the
reader
Uses conventions (e.g., spelling, grammar) and resources to edit and
proofread to make meaning clear
Perc
en
tag
e o
f S
tud
en
ts
Year
Reading and Writing in French, Grade 8 French Immersion Program
Meeting mid-grade performance
Approaching mid-grade performance
Not yet meeting mid-grade performance
T h e S e n i o r Y e a r s 23
t h e S e n i o r y e A r S
Grade 12 Provincial Tests
Introduction
Provincial tests are assessments in ‘S’ level (specialized) language arts and mathematics courses that students in the English Program, French Immersion Program, and Français Program are required to write. Students seeking to graduate from the Technology Education Program are not required to take these ‘S’ level courses, but they may opt to do so, in which case they would also be required to write the tests. These tests are administered at the end of each semester, and count for 30 percent of students’ final course grades (20 percent for Essential Mathematics). The tests also provide curriculum-referenced measures of student knowledge and skill in these courses that are useful for evaluating instructional programming. The tests are developed by teachers who serve on provincial committees under the leadership of Manitoba Education and Advanced Learning. The tests are marked by teachers in their schools or divisions using marking guides provided by the department, which also provides marking training.
Summary statistics are provided to schools and school divisions to assist them in using the data when evaluating their instructional programming. Feedback is also provided about the consistency of marking based on samples of test booklets that are re-marked at the department.
Further information about these tests, including policies regarding exemptions, adaptations, eligibility, and requirement to participate, is available on the department’s assessment website at <www.edu.gov.mb.ca/k12/assess/tests/index.html>. Guidelines for interpreting these results are found in Interpreting and Using Results from Provincial Tests and Assessments, available on the department’s website at <www.edu.gov.mb.ca/k12/assess/support/results/index.html>.
When interpreting Grade 12 provincial test data, there are a number of points to keep in mind:
Q Even though each test is designed according to strict test specifications and piloted prior to provincial administration, they are not exactly identical over time in terms of content coverage and difficulty. Therefore, small differences in provincial means and pass rates over time should be interpreted with caution.
Q Students choose from among the three math courses, according to personal interests and needs. The math courses are distinct in providing for these needs. Therefore, the different mathematics tests and the results are not comparable to each other.
A P r o f i l e o f S t u d e n t L e a r n i n g a n d P e r f o r m a n c e i n M a n i t o b a , 2 0 1 0 – 2 0 1 424
QQ The tests in language arts (English for the English Program, French for the French Immersion Program and for the Français Program) are based on their respective curricula, which are distinct. Therefore, these tests and the results are not comparable to each other.
QQ The Grade 12 Consumer Mathematics provincial test, administered up until 2011/2012, consisted of three components: project, portfolio, and written test. The Grade 12 Essential Mathematics provincial test consists of a written test only.
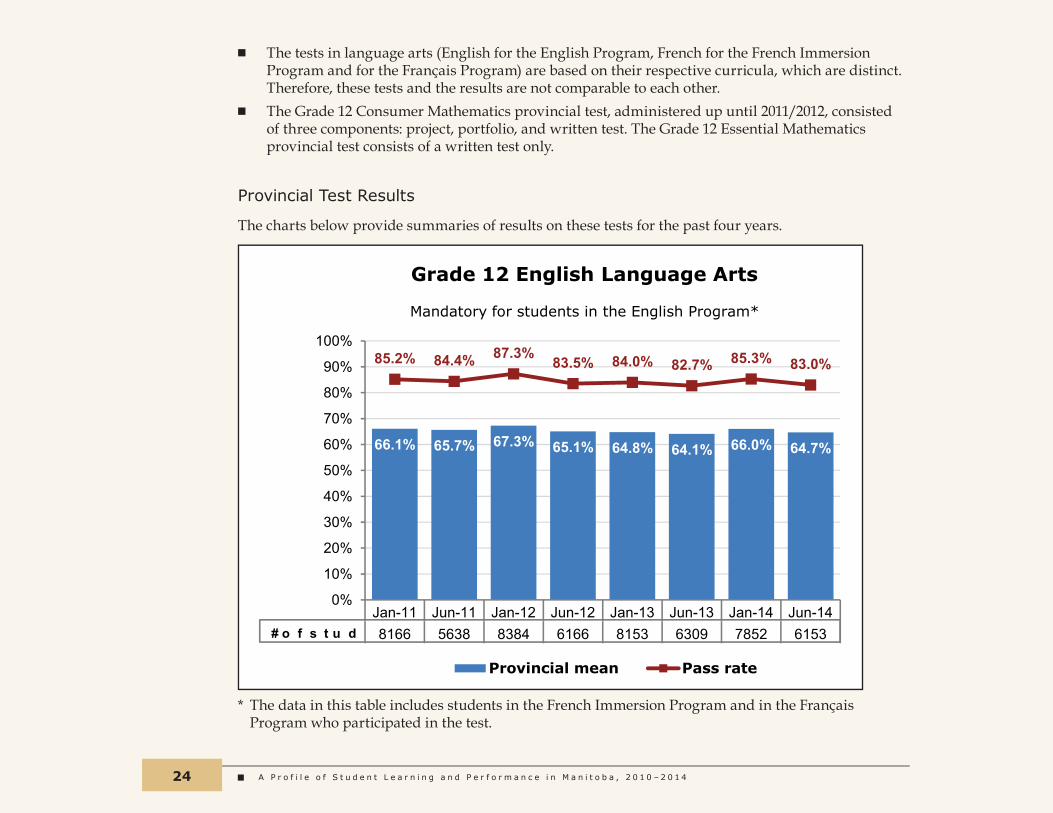
Provincial Test Results
The charts below provide summaries of results on these tests for the past four years.
66. 1% 65. 7% 67. 3% 65. 1% 64. 8% 64. 1% 66. 0 % 64. 7%
85. 2% 84. 4% 87. 3% 83. 5% 84. 0 % 82. 7% 85. 3% 83. 0 %
0%
10%
20%
30%
40%
50%
60%
70%
80%
90%
100%
J an- 11 J un- 11 J an- 12 J un- 12 J an- 13 J un- 13 J an- 14 J un- 14 8166 5638 8384 6166 8153 6309 7852 6153
G rade 12 English Language Arts
Provincial mean Pass rate
Mandatory for students in the English Program*
# o f s t u d e n t s
* The data in this table includes students in the French Immersion Program and in the Français Program who participated in the test.
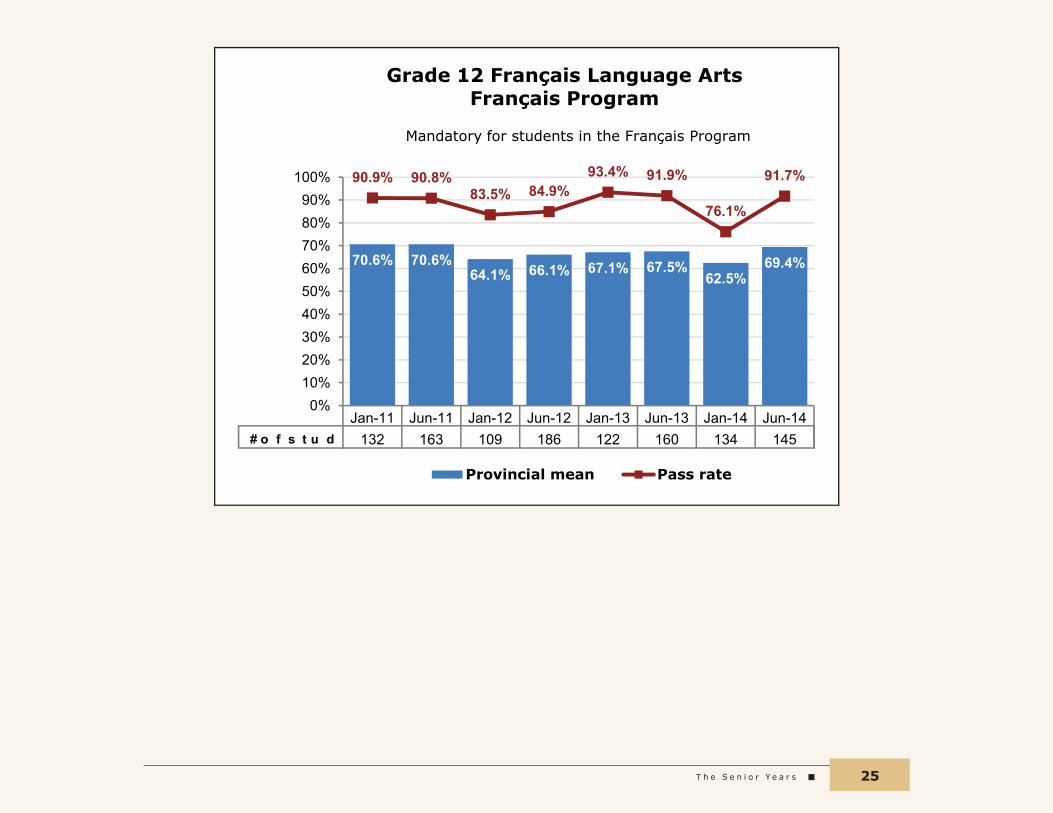
T h e S e n i o r Y e a r s 25
70 . 6% 70 . 6% 64. 1% 66. 1% 67. 1% 67. 5%
62. 5% 69. 4%
90 . 9% 90 . 8% 83. 5% 84. 9%
93. 4% 91. 9%
76. 1%
91. 7%
0% 10% 20% 30% 40% 50% 60% 70% 80% 90%
100%
J an- 11 J un- 11 J an- 12 J un- 12 J an- 13 J un- 13 J an- 14 J un- 14 132 163 109 186 122 160 134 145
G rade 12 Franç ais Language Arts Franç ais Program
Provincial mean Pass rate
Mandatory for students in the Franç ais Program
# o f s t u d e n t s
A P r o f i l e o f S t u d e n t L e a r n i n g a n d P e r f o r m a n c e i n M a n i t o b a , 2 0 1 0 – 2 0 1 426
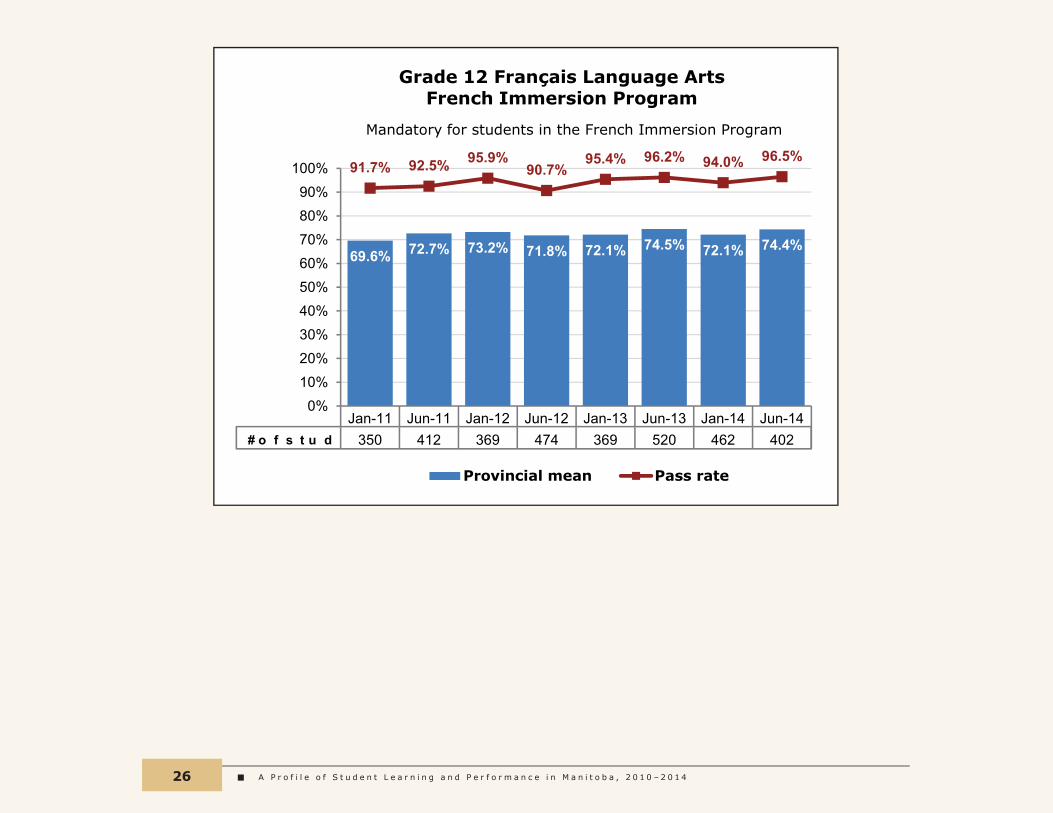
69. 6% 72. 7% 73. 2% 71. 8% 72. 1% 74. 5% 72. 1% 74. 4%
91. 7% 92. 5% 95. 9% 90 . 7%
95. 4% 96. 2% 94. 0 % 96. 5%
0% 10% 20% 30% 40% 50% 60% 70% 80% 90%
100%
J an- 11 J un- 11 J an- 12 J un- 12 J an- 13 J un- 13 J an- 14 J un- 14 350 412 369 474 369 520 462 402
G rade 12 Franç ais Language Arts French Immersion Program
Provincial mean Pass rate
Mandatory for students in the French Immersion Program
# o f s t u d e n t s
T h e S e n i o r Y e a r s 27
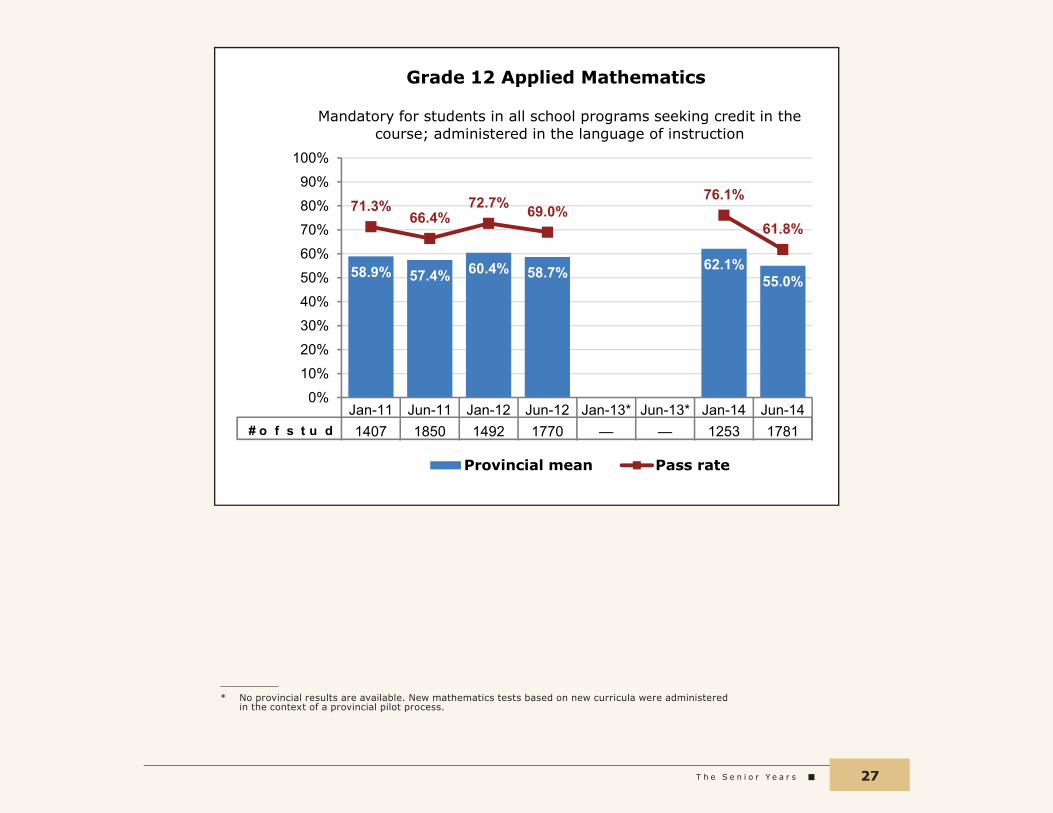
58. 9% 57. 4% 60 . 4% 58. 7% 62. 1% 55. 0 %
71. 3% 66. 4%
72. 7% 69. 0 % 76. 1%
61. 8%
0%
10%
20%
30%
40%
50%
60%
70%
80%
90%
100%
J an- 11 J un- 11 J an- 12 J un- 12 J an- 13* J un- 13* J an- 14 J un- 14 1407 1850 1492 1770 — — 1253 1781
Provincial mean Pass rate
G rade 12 Applied Mathematics
Mandatory for students in all school programs seeking credit in the course; administered in the language of instruction
# o f s t u d e n t s
__________
* No provincial results are available. New mathematics tests based on new curricula were administered in the context of a provincial pilot process.
A P r o f i l e o f S t u d e n t L e a r n i n g a n d P e r f o r m a n c e i n M a n i t o b a , 2 0 1 0 – 2 0 1 428
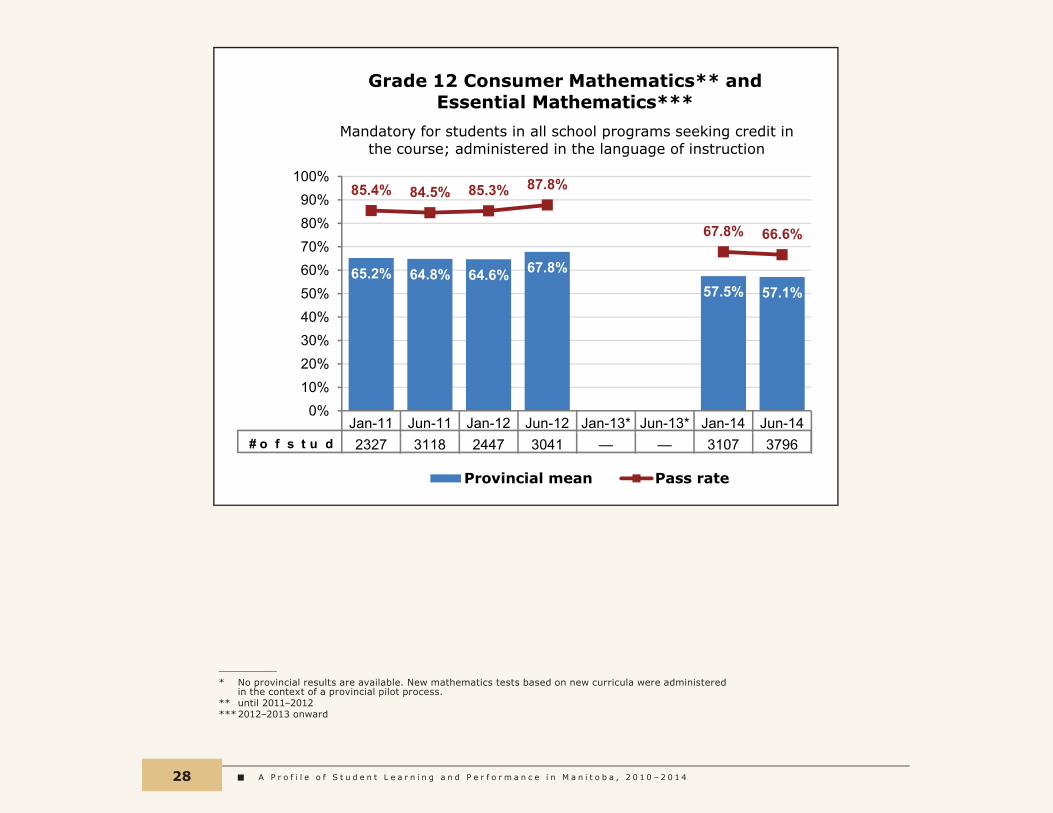
65. 2% 64. 8% 64. 6% 67. 8% 57. 5% 57. 1%
85. 4% 84. 5% 85. 3% 87. 8%
67. 8% 66. 6%
0% 10% 20% 30% 40% 50% 60% 70% 80% 90%
100%
J an- 11 J un- 11 J an- 12 J un- 12 J an- 13* J un- 13* J an- 14 J un- 14 2327 3118 2447 3041 — — 3107 3796
G rade 12 Consumer Mathematics* * and Essential Mathematics* * *
Provincial mean Pass rate
Mandatory for students in all school programs seeking credit in the course; administered in the language of instruction
# o f s t u d e n t s
__________
* No provincial results are available. New mathematics tests based on new curricula were administered in the context of a provincial pilot process.
** until 2011–2012*** 2012–2013 onward
T h e S e n i o r Y e a r s 29
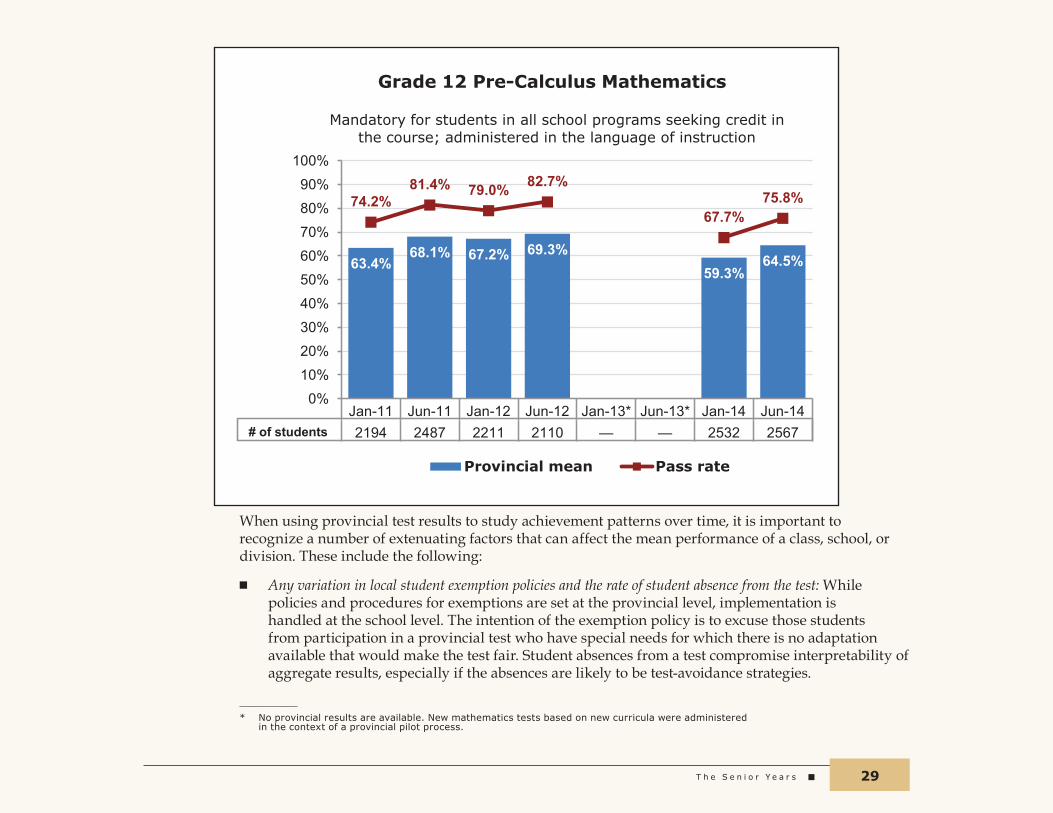
63.4% 68.1% 67.2% 69.3%
59.3% 64.5%
74.2% 81.4% 79.0% 82.7%
67.7% 75.8%
0% 10% 20% 30% 40% 50% 60% 70% 80% 90%
100%
Jan-11 Jun-11 Jan-12 Jun-12 Jan-13* Jun-13* Jan-14 Jun-14 2194 2487 2211 2110 — — 2532 2567
Provincial mean Pass rate
Grade 12 Pre-Calculus Mathematics
Mandatory for students in all school programs seeking credit in the course; administered in the language of instruction
# of students
When using provincial test results to study achievement patterns over time, it is important to recognize a number of extenuating factors that can affect the mean performance of a class, school, or division. These include the following:
QQ Any variation in local student exemption policies and the rate of student absence from the test: While policies and procedures for exemptions are set at the provincial level, implementation is handled at the school level. The intention of the exemption policy is to excuse those students from participation in a provincial test who have special needs for which there is no adaptation available that would make the test fair. Student absences from a test compromise interpretability of aggregate results, especially if the absences are likely to be test‑avoidance strategies.
__________
* No provincial results are available. New mathematics tests based on new curricula were administered in the context of a provincial pilot process.

A P r o f i l e o f S t u d e n t L e a r n i n g a n d P e r f o r m a n c e i n M a n i t o b a , 2 0 1 0 – 2 0 1 430
QQ Slight variability in test content and difficulty from one test to another: A change in a group average of up to about five percentage points should not be viewed as significant, as the various tests are not precisely equivalent in terms of content and difficulty. However, should a consistent increase (or decrease) over test administrations be noted (such as three increases in a row of 3% to 5%), or if a local change (e.g., school) in performance goes counter to larger trends (e.g., provincial), then this likely represents a meaningful change in group performance.
QQ Natural variability among groups of students taking the test at a particular time: Random, uncontrollable, “natural” variability in group performance should be considered when aggregating and interpreting results for groups of about 30 students or smaller. For example, the presence of even one student with an unusually high or low mark can significantly affect a small-group mean score in a way unrelated to changes (over time) or differences (between groups) in factors that might affect group performance.
QQ Systemic variability in groups of students taking the test at a particular time: Changes in course offerings or policies and practice regarding student enrolment in courses and programs can have a significant effect on test results. For example, if a particular mathematics course is offered in a school one year and not the next, then this would affect enrolment patterns and the types of interpretations that can be made when making year-to-year performance comparisons for mathematics. There are specialized statistical procedures to use when comparing mean scores for smaller groups, such as classrooms of students. For studies of this nature, the help of a statistical consultant should be sought if the expertise is not available in your organization.
Manitoba’s High School Graduation Rate
For the purposes of calculating Manitoba’s high school graduation rate, Manitoba Education and Advanced Learning uses a proxy measure that is comprised of the ratio of the total number of graduates reported by public and funded independent high schools at the end of every academic year to the total Grade 9 enrolment in these schools four years prior to the year of graduation. The graduates in a given year do not all necessarily come from the same Grade 9 cohort. It is important to note that this is not a calculation of a four-year sequential graduation rate, nor an individual student-tracked rate that follows students as they move from Grade 9 to graduation.
The difference between the annual graduation rate and 100% is not a measure of the drop-out rate in Manitoba. The difference includes students who are continuing in public and funded independent schools and require more than four years to gain the credits needed to graduate, students who have transferred out of public and funded independent schools to enroll in First Nations schools, non-funded independent schools and Adult Learning Centres, students who have left the province, and students who have withdrawn from school.
T h e S e n i o r Y e a r s 31
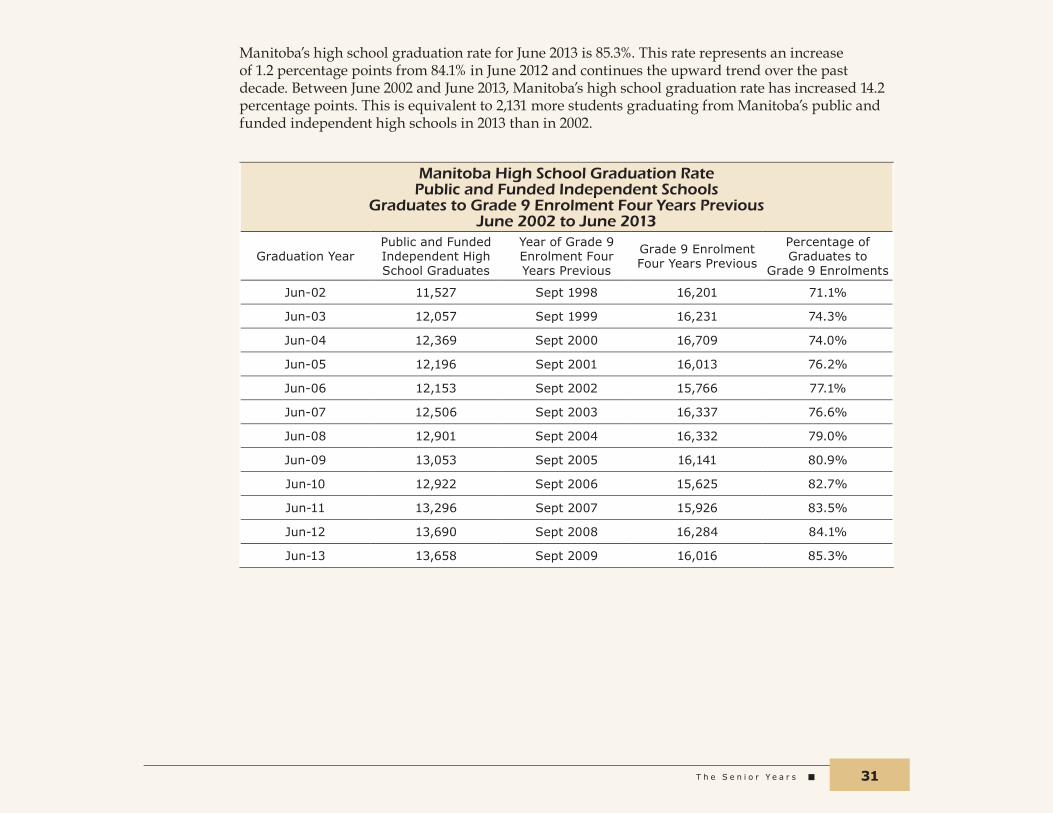
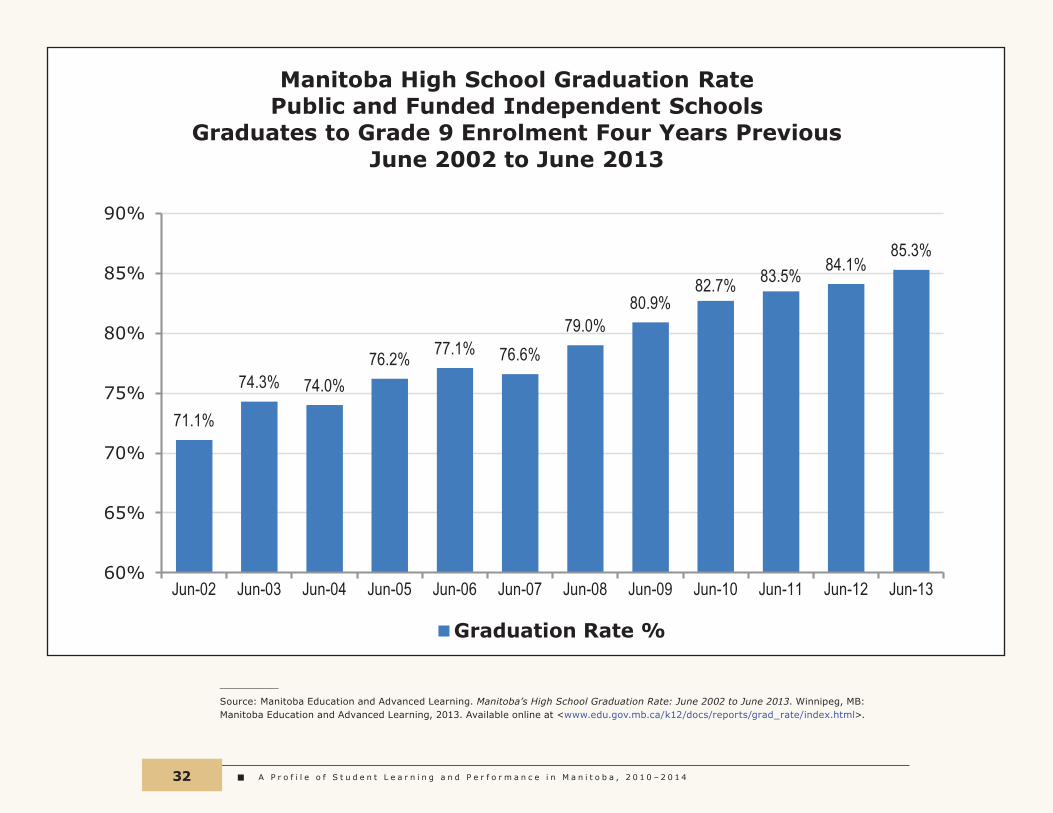
Manitoba’s high school graduation rate for June 2013 is 85.3%. This rate represents an increase of 1.2 percentage points from 84.1% in June 2012 and continues the upward trend over the past decade. Between June 2002 and June 2013, Manitoba’s high school graduation rate has increased 14.2 percentage points. This is equivalent to 2,131 more students graduating from Manitoba’s public and funded independent high schools in 2013 than in 2002.
Manitoba High School Graduation Rate Public and Funded Independent Schools
Graduates to Grade 9 Enrolment Four Years PreviousJune 2002 to June 2013
Graduation YearPublic and Funded Independent High School Graduates
Year of Grade 9 Enrolment Four Years Previous
Grade 9 Enrolment Four Years Previous
Percentage of Graduates to
Grade 9 Enrolments
Jun-02 11,527 Sept 1998 16,201 71.1%
Jun-03 12,057 Sept 1999 16,231 74.3%
Jun-04 12,369 Sept 2000 16,709 74.0%
Jun-05 12,196 Sept 2001 16,013 76.2%
Jun-06 12,153 Sept 2002 15,766 77.1%
Jun-07 12,506 Sept 2003 16,337 76.6%
Jun-08 12,901 Sept 2004 16,332 79.0%
Jun-09 13,053 Sept 2005 16,141 80.9%
Jun-10 12,922 Sept 2006 15,625 82.7%
Jun-11 13,296 Sept 2007 15,926 83.5%
Jun-12 13,690 Sept 2008 16,284 84.1%
Jun-13 13,658 Sept 2009 16,016 85.3%
A P r o f i l e o f S t u d e n t L e a r n i n g a n d P e r f o r m a n c e i n M a n i t o b a , 2 0 1 0 – 2 0 1 432
71.1%
74.3% 74.0% 76.2% 77.1% 76.6%
79.0% 80.9%
82.7% 83.5% 84.1% 85.3%
60%
65%
70%
75%
80%
85%
90%
Jun-02 Jun-03 Jun-04 Jun-05 Jun-06 Jun-07 Jun-08 Jun-09 Jun-10 Jun-11 Jun-12 Jun-13
Manitoba High School Graduation Rate Public and Funded Independent Schools
Graduates to Grade 9 Enrolment Four Years Previous June 2002 to June 2013
Graduation Rate %
___ _____Source: Manitoba Education and Advanced Learning. Manitoba’s High School Graduation Rate: June 2002 to June 2013. Winnipeg, MB: Manitoba Education and Advanced Learning, 2013. Available online at <www.edu.gov.mb.ca/k12/docs/reports/grad_rate/index.html>.
N a t i o n a l a n d I n t e r n a t i o n a l A s s e s s m e n t 33
N a t i o N a l a N d i N t e r N a t i o N a l a s s e s s m e N t
Manitoba participates in two large‑scale assessment programs that provide insight into the performance of Manitoba students and into the context in which education takes place. They are the Pan‑Canadian Assessment (PCAP) and the Programme for International Student Assessment (PISA). Each is described below and selected results are provided that have been extracted from public reports, to which links can be found on the Council of Ministers of Education, Canada (CMEC) website at <http://cmec.ca/131/Programs‑and‑Initiatives/Assessment/Overview/index.html>.
The Pan‑Canadian Assessment Program
At the national level, the Pan‑Canadian Assessment Program (PCAP), developed by the CMEC and administered in collaboration with provincial and territorial ministries of education and schools, focuses on achievement in reading, mathematics, and science. It was first administered in the spring of 2007 to samples of students who were 13 years old at the start of the school year (mostly Grade 8). It was most recently administered in the spring of 2013, with a target group of Grade 8 students. It is scheduled to be administered once every three years. At each administration, one of the domains is the ”major” domain (meaning it is more thoroughly assessed with a larger sample of students), while the other two are present as minor domains (meaning there is less coverage of the domain, fewer students are sampled, and there is less analysis).
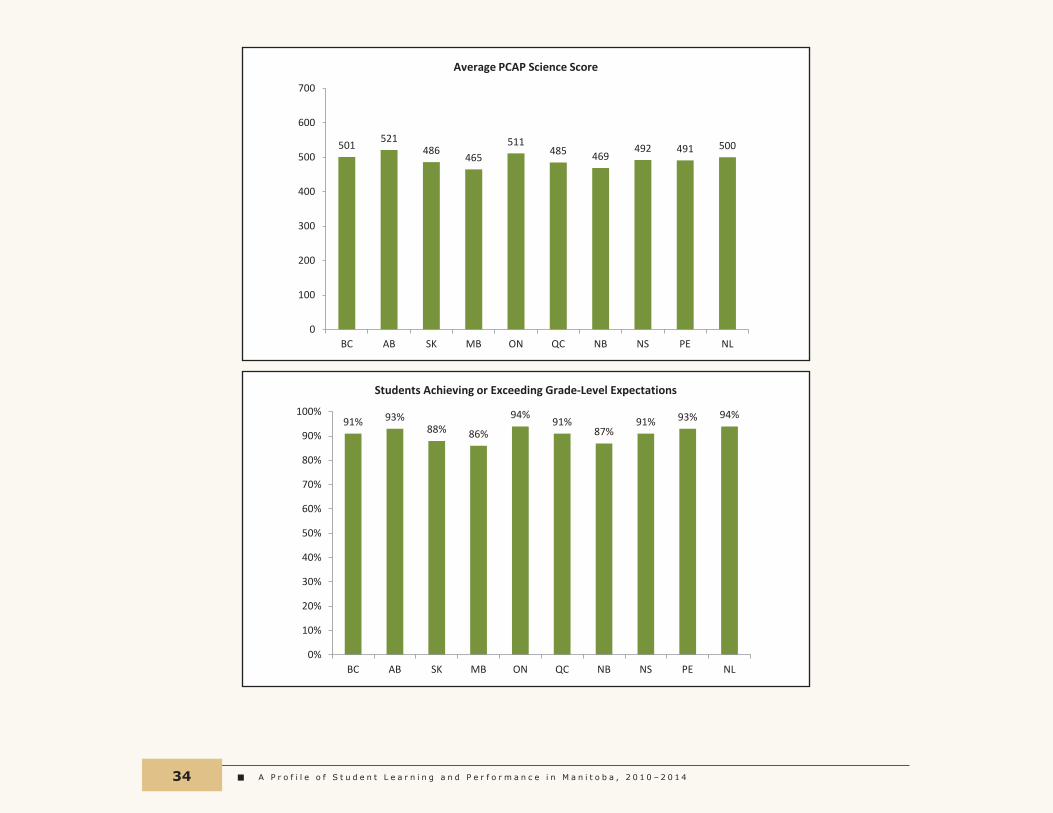
PCAP 2013* was administered to approximately 3,500 students in 168 schools in Manitoba and to 32,000 students across Canada. The main domain was Science. Manitoba students in the Français Program participated in French. Results for Manitoba are reported both for all students combined, as well as separately by language. This was also done for seven other provinces, namely Quebec, New Brunswick, Nova Scotia, Ontario, Alberta, Saskatchewan, and British Columbia.
Average scores and the percentage of students achieving or exceeding grade‑level expectations in the main domain of Science are provided on the following page.
__________
* The public report is available at <http://cmec.ca/Publications/Lists/Publications/Attachments/337/PCAP‑2013‑Public‑Report‑EN.pdf>.
A P r o f i l e o f S t u d e n t L e a r n i n g a n d P e r f o r m a n c e i n M a n i t o b a , 2 0 1 0 – 2 0 1 434
• • • • • • • • • • • • • • • • • • • • • • • • • • • • • • • • • • • • • • • • • • • • • • • • • • • • • • • • • • • • • •
91% 93% 88% 86%
94% 91%
87% 91% 93% 94%
0%
10%
20%
30%
40%
50%
60%
70%
80%
90%
100%
BC AB SK MB ON QC NB NS PE NL
Students Achieving or Exceeding Grade-Level Expectations
501 521
486 465
511 485 469
492 491 500
0
100
200
300
400
500
600
700
BC AB SK MB ON QC NB NS PE NL
Average PCAP Science Score
N a t i o n a l a n d I n t e r n a t i o n a l A s s e s s m e n t 35
The Programme for International Student Assessment
The Programme for International Student Assessment (PISA) is an initiative of the Organization for Economic Cooperation and Development (OECD)*, of which Canada is a member. PISA is managed collaboratively at the national level by the CMEC, Statistics Canada, and Employment and Social Development Canada. It follows the same administration cycle and focuses on the same domains as PCAP (see page 33), but assesses students who are 15 years old on December 31 of the school year (largely Grade 9 and Grade 10). PISA has been administered in 2000, 2003, 2006, 2009, and 2012.
PISA Results
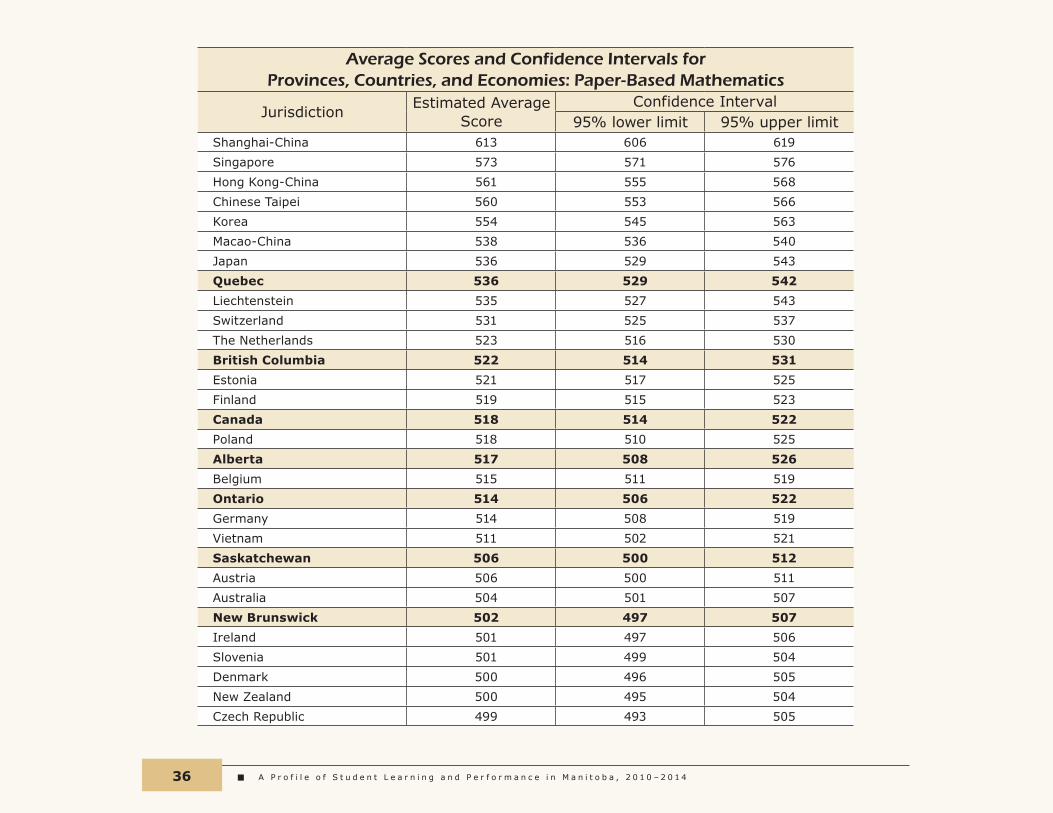
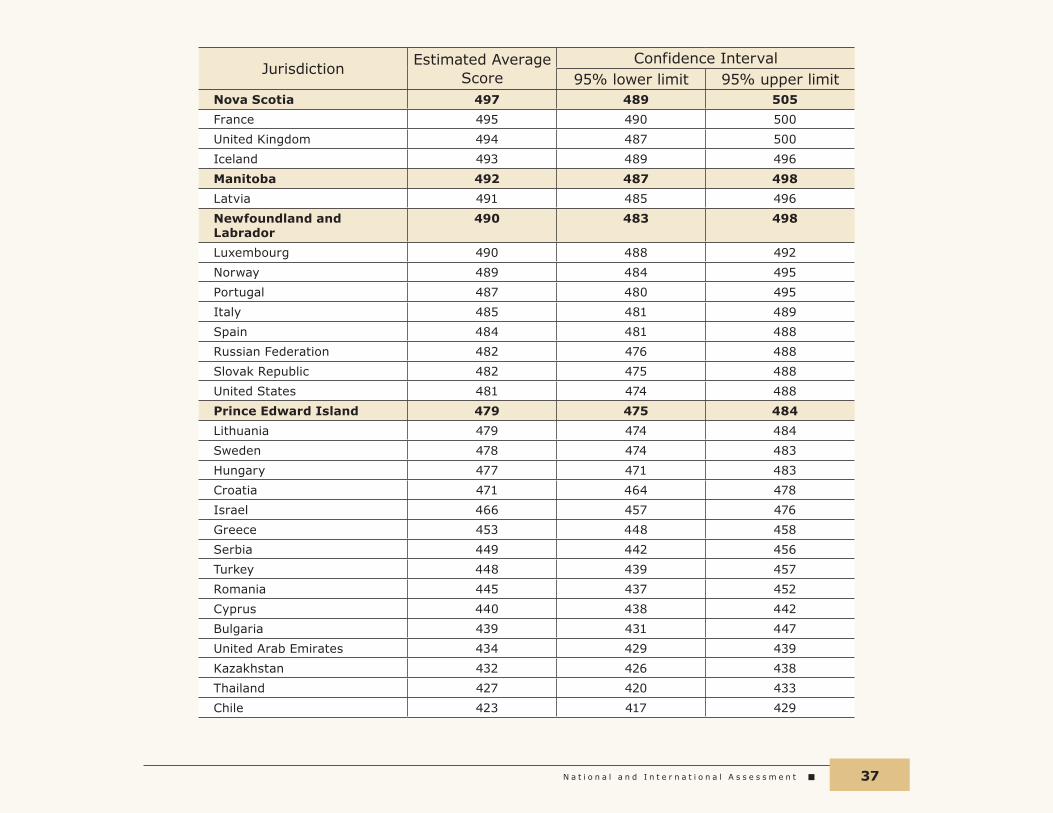
In the spring of 2012, PISA was administered to approximately 2100 15‑year‑old students in 86 schools in Manitoba. Sixty‑five countries/economies participated, including many outside of the OECD. The main domain was Mathematics. Results for Manitoba are reported both for all students combined, as well as separately by language. This was also done for six other provinces, namely Quebec, New Brunswick, Nova Scotia, Alberta, British Columbia, and Ontario, permitting comparisons to be made among students in the respective francophone education systems.
Average scores in the main domain of Mathematics are provided in the following table.
__________
* Summaries of OECD results may be found at: <www.oecd.org/pisa/keyfindings/pisa-2012-results-overview.pdf> <www.oecd.org/pisa/keyfindings/pisa-2012-results.htm>
A P r o f i l e o f S t u d e n t L e a r n i n g a n d P e r f o r m a n c e i n M a n i t o b a , 2 0 1 0 – 2 0 1 436
Average Scores and Confidence Intervals for Provinces, Countries, and Economies: Paper-Based Mathematics
JurisdictionEstimated Average
ScoreConfidence Interval
95% lower limit 95% upper limitShanghai-China 613 606 619
Singapore 573 571 576
Hong Kong-China 561 555 568
Chinese Taipei 560 553 566
Korea 554 545 563
Macao-China 538 536 540
Japan 536 529 543
Quebec 536 529 542
Liechtenstein 535 527 543
Switzerland 531 525 537
The Netherlands 523 516 530
British Columbia 522 514 531
Estonia 521 517 525
Finland 519 515 523
Canada 518 514 522
Poland 518 510 525
Alberta 517 508 526
Belgium 515 511 519
Ontario 514 506 522
Germany 514 508 519
Vietnam 511 502 521
Saskatchewan 506 500 512
Austria 506 500 511
Australia 504 501 507
New Brunswick 502 497 507
Ireland 501 497 506
Slovenia 501 499 504
Denmark 500 496 505
New Zealand 500 495 504
Czech Republic 499 493 505
N a t i o n a l a n d I n t e r n a t i o n a l A s s e s s m e n t 37
JurisdictionEstimated Average
ScoreConfidence Interval
95% lower limit 95% upper limitNova Scotia 497 489 505
France 495 490 500
United Kingdom 494 487 500
Iceland 493 489 496
Manitoba 492 487 498
Latvia 491 485 496
Newfoundland and Labrador
490 483 498
Luxembourg 490 488 492
Norway 489 484 495
Portugal 487 480 495
Italy 485 481 489
Spain 484 481 488
Russian Federation 482 476 488
Slovak Republic 482 475 488
United States 481 474 488
Prince Edward Island 479 475 484
Lithuania 479 474 484
Sweden 478 474 483
Hungary 477 471 483
Croatia 471 464 478
Israel 466 457 476
Greece 453 448 458
Serbia 449 442 456
Turkey 448 439 457
Romania 445 437 452
Cyprus 440 438 442
Bulgaria 439 431 447
United Arab Emirates 434 429 439
Kazakhstan 432 426 438
Thailand 427 420 433
Chile 423 417 429
A P r o f i l e o f S t u d e n t L e a r n i n g a n d P e r f o r m a n c e i n M a n i t o b a , 2 0 1 0 – 2 0 1 438
JurisdictionEstimated Average
ScoreConfidence Interval
95% lower limit 95% upper limitMalaysia 421 414 427
Mexico 413 411 416
Montenegro 410 408 412
Uruguay 409 404 415
Costa Rica 407 401 413
Albania 394 390 398
Brazil 391 387 395
Argentina 388 382 395
Tunisia 388 380 395
Jordan 386 379 392
Columbia 376 371 382
Qatar 376 375 378
Indonesia 375 367 383
Peru 368 361 375
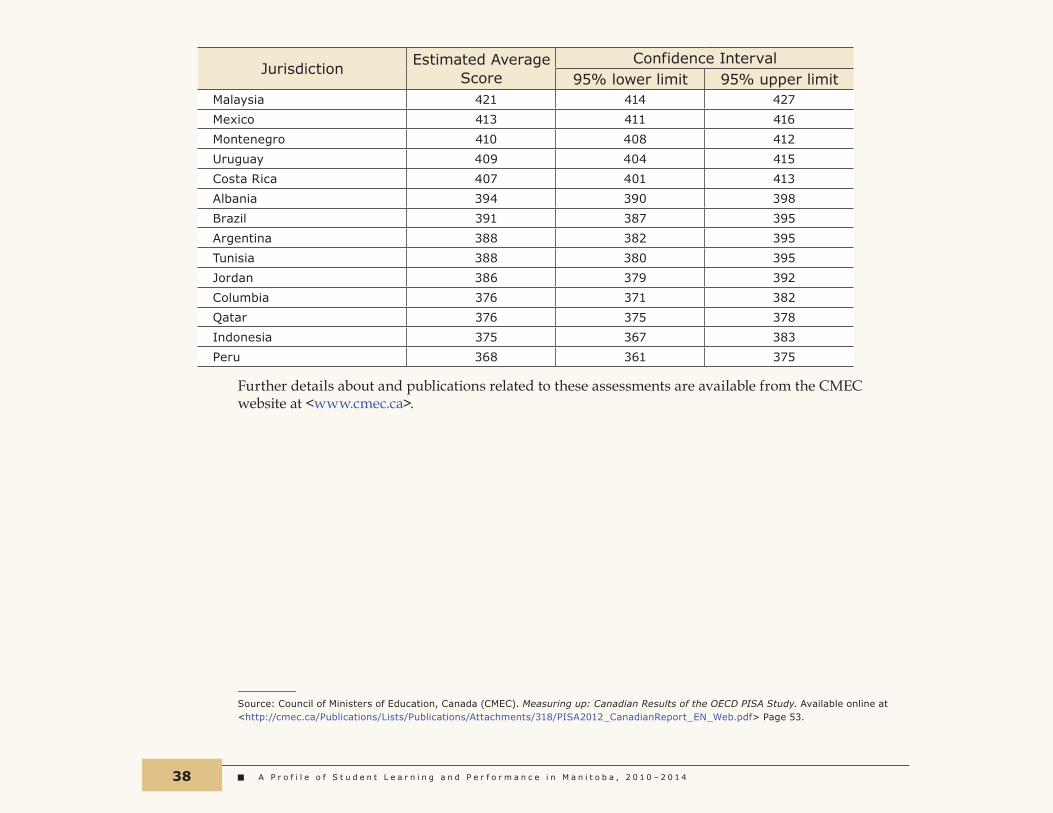
Further details about and publications related to these assessments are available from the CMEC website at <www.cmec.ca>.
__________
Source: Council of Ministers of Education, Canada (CMEC). Measuring up: Canadian Results of the OECD PISA Study. Available online at <http://cmec.ca/Publications/Lists/Publications/Attachments/318/PISA2012_CanadianReport_EN_Web.pdf> Page 53.

B i b l i o g r a p h y 39
B i B l i o g r a p h y
Catherine O’Grady, Koffi Houme. Council of Ministers of Education, Canada (CMEC). PCAP-2013: Report on the Pan-Canadian Assessment of Science, Reading, and Mathematics. Toronto, ON: CMEC, 2014. Available online at <http://cmec.ca/Publications/Lists/Publications/Attachments/337/PCAP-2013-Public-Report-EN.pdf>.
Pierre Brochu, Marie-Anne Deussing, Koffi Houme, Maria Chuy. Measuring Up: Canadian Results of the OECD PISA Study: The Performance of Canada’s Youth in Mathematics, Reading and Science: 2012 First Results for Canadians Aged 15. Ottawa, ON: Human Resources and Social Development Canada, Council of Ministers of Education, Canada, and Statistics Canada, 2013. Available online at <http://cmec.ca/Publications/Lists/Publications/Attachments/318/PISA2012_CanadianReport_EN_web.pdf>.
Manitoba Education. Interpreting and Using Results from Provincial Tests and Assessments: A Support Document for Teachers, Administrators, and Consultants. Winnipeg, MB: Manitoba Education, 2009. Available online at <www.edu.gov.mb.ca/k12/assess/support/results/>.
Manitoba Education and Advanced Learning. Manitoba’s High School Graduation Rate: June 2002 to June 2013. Winnipeg, MB: Manitoba Education and Advanced Learning, 2013. Available online at <www.edu.gov.mb.ca/k12/docs/reports/grad_rate/index.html>
Manitoba Education, Citizenship and Youth. Communicating Student Learning: Guidelines for Schools, 2008. Winnipeg, MB: Manitoba Education, Citizenship and Youth, 2008. Available online at <www.edu.gov.mb.ca/k12/assess/docs/csl/>.
. Rethinking Classroom Assessment with Purpose in Mind: Assessment for Learning, Assessment as Learning, Assessment of Learning. Winnipeg, MB: Manitoba Education, Citizenship and Youth, 2006. Available online at <www.edu.gov.mb.ca/k12/assess/wncp/index.html>.
A P r o f i l e o f S t u d e n t L e a r n i n g a n d P e r f o r m a n c e i n M a n i t o b a , 2 0 1 0 – 2 0 1 440
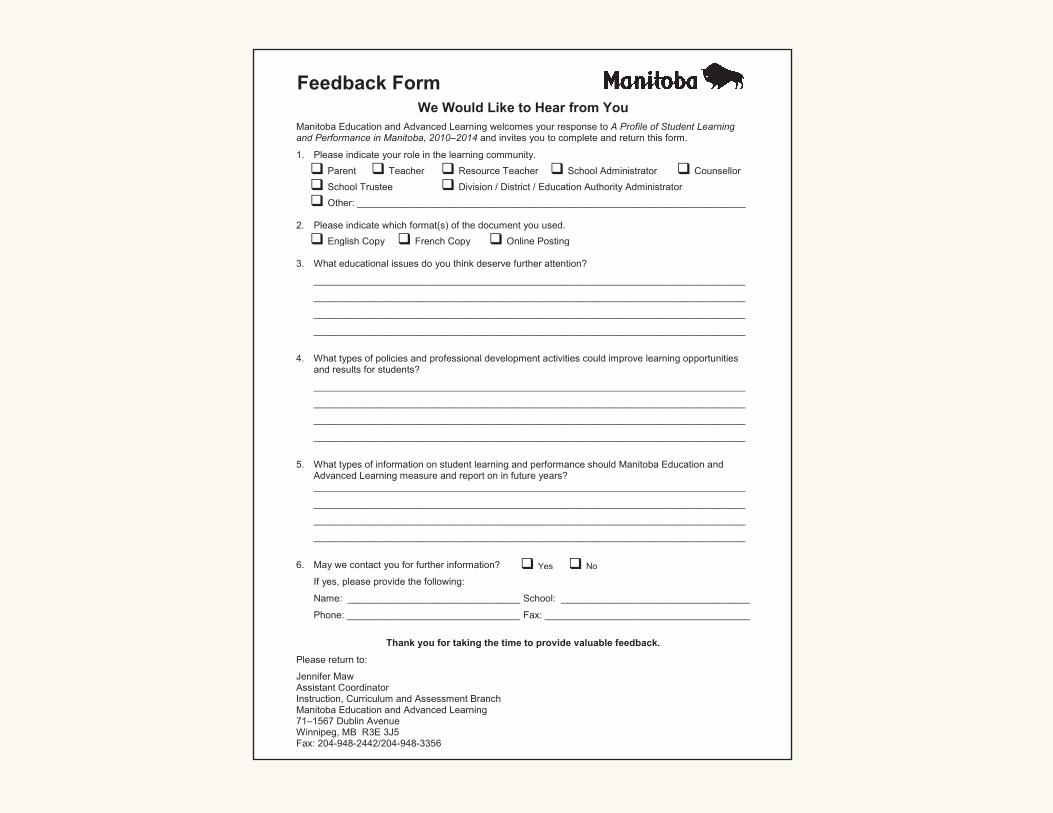
Feedback Form We Would Like to Hear from You
Manitoba Education and Advanced Learning welcomes your response to A Profile of Student Learning and Performance in Manitoba, 2010–2014 and invites you to complete and return this form.
1. Please indicate your role in the learning community. Parent Teacher Resource Teacher School Administrator Counsellor School Trustee Division / District / Education Authority Administrator
Other: ________________________________________________________________________ 2. Please indicate which format(s) of the document you used. English Copy French Copy Online Posting
3. What educational issues do you think deserve further attention?
________________________________________________________________________________
________________________________________________________________________________
________________________________________________________________________________
________________________________________________________________________________
4. What types of policies and professional development activities could improve learning opportunities
and results for students?
________________________________________________________________________________
________________________________________________________________________________
________________________________________________________________________________
________________________________________________________________________________
5. What types of information on student learning and performance should Manitoba Education and
Advanced Learning measure and report on in future years? ________________________________________________________________________________
________________________________________________________________________________
________________________________________________________________________________
________________________________________________________________________________
6. May we contact you for further information?
If yes, please provide the following:
Name: ________________________________ School: ___________________________________
Phone: ________________________________ Fax: ______________________________________
Thank you for taking the time to provide valuable feedback.
Please return to:
Jennifer Maw Assistant Coordinator Instruction, Curriculum and Assessment Branch Manitoba Education and Advanced Learning 71–1567 Dublin Avenue Winnipeg, MB R3E 3J5 Fax: 204-948-2442/204-948-3356
Yes No
Printed in CanadaImprimé au Canada


![Throne Room Throne Room [A, 64 bpm, 4/4] - jc … Room. A A... Throne Room... Throne Room. B... Throne Room... Throne Room..... ...](https://static.documents.pub/doc/80x56/5aa470f67f8b9a1d728bdf0c/throne-room-throne-room-a-64-bpm-44-jc-room-a-a-throne-room-throne.jpg)


