2011-12 Assessment of General Education Outcomes Quantitative Reasoning (Full Report) Office of Institutional Assessment and Evaluation July, 2012 “Working together to create a culture of evidence-based decision making…”
Transcript
2011-12 Assessment of General Education Outcomes
Quantitative Reasoning (Full Report)
Office of Institutional Assessment and Evaluation
July, 2012
“Working together to create a culture of evidence-based decision making…”
2010-11 Assessment of Quantitative Reasoning: Full Report
i
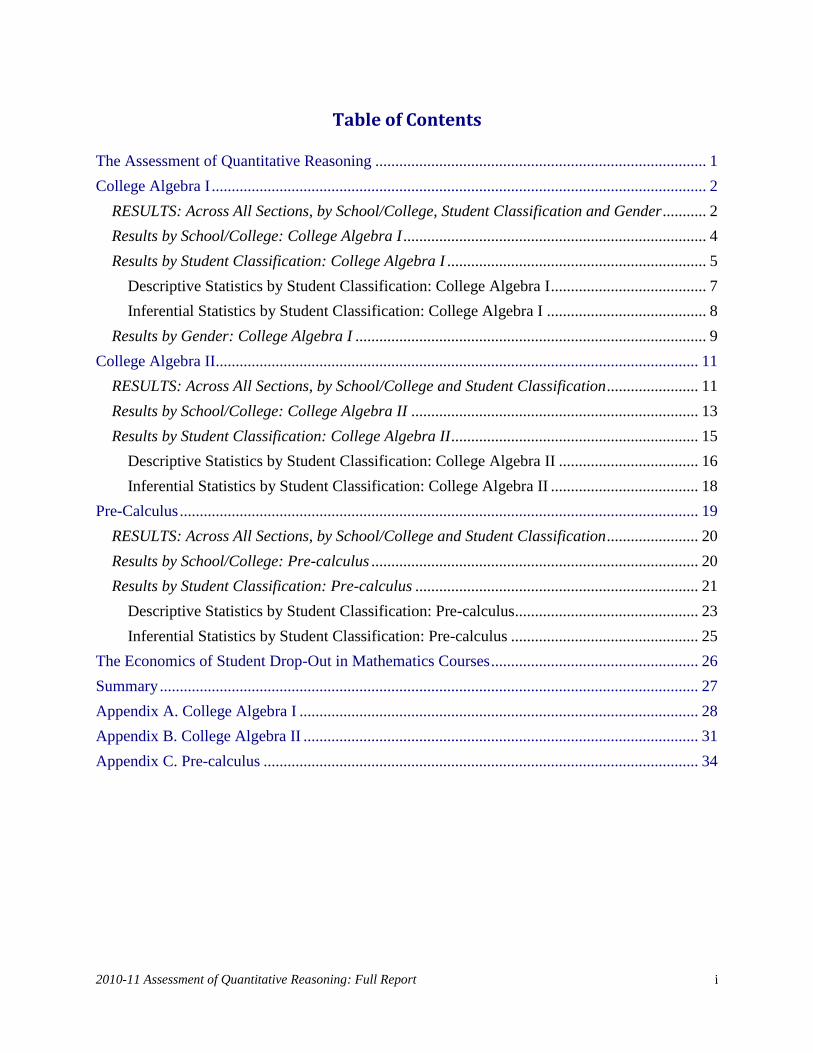
Table of Contents
The Assessment of Quantitative Reasoning ................................................................................... 1
College Algebra I ............................................................................................................................ 2
RESULTS: Across All Sections, by School/College, Student Classification and Gender ........... 2
Results by School/College: College Algebra I ............................................................................ 4
Results by Student Classification: College Algebra I ................................................................. 5
Descriptive Statistics by Student Classification: College Algebra I ....................................... 7
Inferential Statistics by Student Classification: College Algebra I ........................................ 8
Results by Gender: College Algebra I ........................................................................................ 9
College Algebra II......................................................................................................................... 11
RESULTS: Across All Sections, by School/College and Student Classification ....................... 11
Results by School/College: College Algebra II ........................................................................ 13
Results by Student Classification: College Algebra II .............................................................. 15
Descriptive Statistics by Student Classification: College Algebra II ................................... 16
Inferential Statistics by Student Classification: College Algebra II ..................................... 18
Appendix A. College Algebra I .................................................................................................... 28
Appendix B. College Algebra II ................................................................................................... 31
Appendix C. Pre-calculus ............................................................................................................. 34
2011-12 Assessment of Quantitative Reasoning: Full Report
1
Office of Institutional Assessment and Evaluation “Working together to create a culture of evidence-based decision making…”
2011-12 Assessment of General Education Outcomes
Quantitative Reasoning
The Assessment of Quantitative Reasoning
n Spring Semester 2012, the Office of Institutional Assessment and Evaluation (OIAE)
consulted with chairs of the departmental final examination committees for College Algebra I,
College Algebra II, and Pre-calculus for the purpose of deciding which questions on the final
examinations would be used to measure the general education learning outcome, quantitative
reasoning. To aid in the identification of questions that would be used to measure quantitative
reasoning, committee chairs were given the general education competencies for quantitative
reasoning as defined by the Mathematical Association of America (MAA). Chairs were asked to
identify at least two questions on their respective final examination which measured students’
ability to:
Interpret mathematical models such as formulas, graphs, tables, and schematics, and draw
inferences from them;
Represent mathematical information symbolically, visually, numerically, and verbally;
Use arithmetical, algebraic, geometric and statistical methods to solve problems; and
Estimate and check answers to mathematical problems in order to determine
reasonableness, identify alternatives, and select optimal results.
The assessment of quantitative reasoning occurs each spring semester; therefore, the OIAE
set three goals for this assessment activity for AY 2011-12: (1) to improve the measurement –
reliability and validity – of quantitative reasoning as defined by the four competencies, (2) to
glean information about student performance in mathematics based on student classification and
gender so that appropriate interventions can be designed and implemented, and (3) to increase
the response rate among professors who report their students’ performance data. In the past, only
one question was identified to measure each competency; however, to improve the measurement
of the competencies, OIAE decided to collect data on two questions for each competency. This
decision to collect more information has the effect of increasing the validity of inferences about
the level of students’ competency in quantitative reasoning. This decision also carried with it the
probability that professors would have to devote more time to reporting student performance on
eight questions instead of four – which could have a negative effect on the response rate.
Therefore, the OIAE divided professors into two groups. Each group of professors was
responsible for reporting student performance on only four questions on the final examination,
where each question measured a different competency.
Thus, OIAE was able to (1) improve the measurement of quantitative reasoning by collecting
more data on student performance without increasing the level of reporting effort required from
I
2011-12 Assessment of Quantitative Reasoning: Full Report
2
participating professors; and (2) disaggregate the student performance data by student
classification and gender so that the results could be used to improve student learning.
The question number and point value, the statement of the question, and the related
competency are presented in Tables 1, 9, and 15 for College Algebra I, College Algebra II and
Pre-calculus, respectively. “Competent” performance was defined as earning a question or final
examination score of at least 60%.
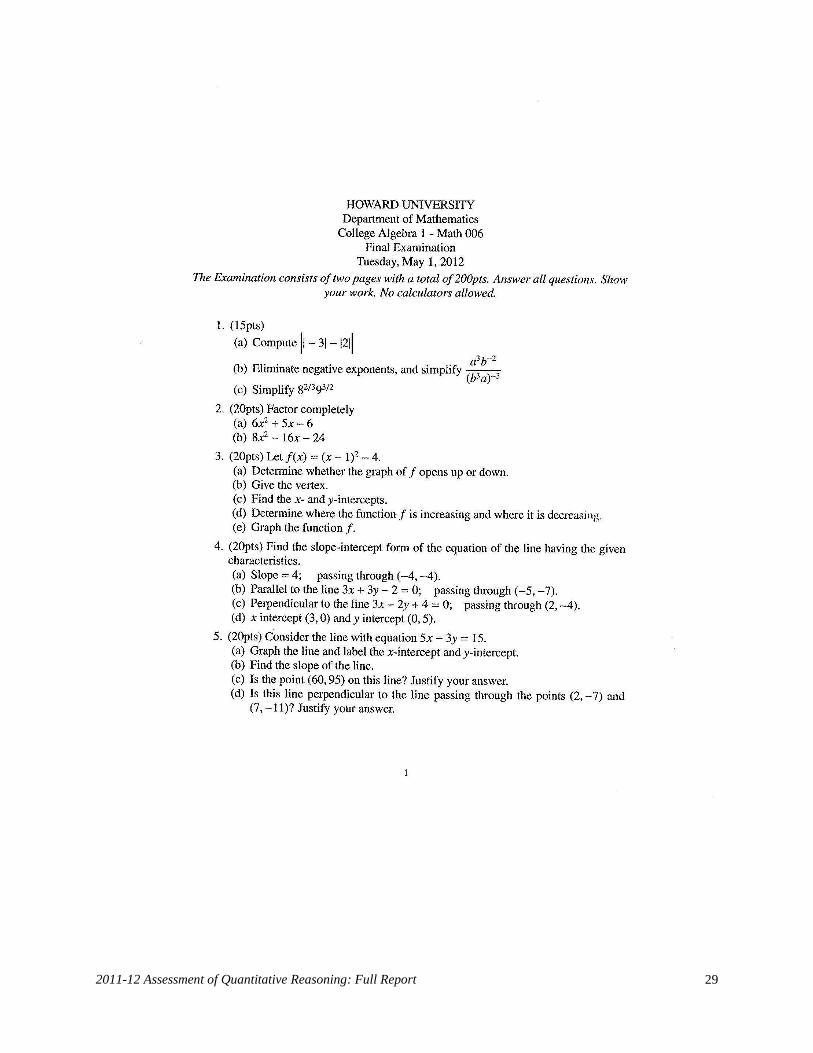
College Algebra I
he final examination for College Algebra I for Spring Semester 2012 consisted of 15
questions and a total score of 200 points. Table 1 presents the questions that were selected to
measure each of two competencies. A copy of the College Algebra I final examination is in
Appendix A.
RESULTS: Across All Sections, by School/College, Student Classification and Gender
Table 2 presents the results of student performance on the College Algebra I final
examination for all sections by school or college. The results indicate that 242 of 363 or 67% of
the enrollees had a final exam score and, therefore, were considered “valid cases” for these
analyses. Thus, 121 or 33% of the students who did not have a final exam score either withdrew
from the course, remained in the course but did not take the final exam, or took a different final
exam because they were prospective graduates (seniors). Still, the retention rate for College
Algebra I was low across all schools and colleges, ranging for 33% to 85%. Across all sections
of College Algebra I, the results of data analyses on student performance indicate that for:
• Questions 3, 5, 6, and 12, which measured students’ ability to (1) interpret mathematical
models such as formulas, graphs, tables, and schematics, and draw inferences from them,
79 of 130 valid cases or 60.8% of the students who took the final exam earned a question
score of 60% or higher, and 79 of 188 or 42% of the original enrollees earned a score of
60% or higher.
• Questions 7, 8, 10 and 14, which measured students’ ability to (3) use arithmetical,
algebraic, geometric and statistical methods to solve problems, 86 of 106 valid cases or
81.1% of the students who took the final exam earned an question score of 60% or
higher, and 86 of 177 or 48.6% of the original enrollees earned a score of 60% or higher.
T
2011-12 Assessment of Quantitative Reasoning: Full Report
3
Table 1. Questions and QR Competencies for College Algebra I Final Examination
Question #
(Points) Question Description
QR Competency
Measured
3.
(20pts)
Let f(x) = (𝑥 − 1)2 − 4. (a) Determine whether the graph of f opens up or down
(b) Give the vertex
(c) Find the x- and y- intercepts
(d) Determine whether the function f is increasing and where it is
decreasing.
(e) Graph the function f.
(1) Interpret
mathematical models
such as formulas,
graphs, tables, and
schematics, and draw
inferences from them.
5.
(20pts)
Consider the line with equation 5x-3y=15
(a) Graph the line and label the x- intercept and y- intercept.
(b) Find the slope of the line
(c) Is the point (60,95) on this line? Justify your answer.
(d) Is this line perpendicular to the line passing through the points (2,-7) and
(7,-11)? Justify your answer.
6.
(10pts)
(a) Find the equation to the circle with center (3,-2) and which passes
through (3, 0). Graph the circle.
(b) Find the center and radius of the circle 𝑥2 + 𝑦2+4x-6y+12=0. Graph
the circle.
12.
(10pts)
Find the domain of each function. Give your answer in interval notation.
(a) f (x) = √𝑥 + 3
(b) f (x) = 𝑥
𝑥2+𝑥−6
7.
(5pts)
Add the fractions and simplify. Leave your answer in factored form. 2𝑥
𝑥2−1 +
3𝑥
𝑥2−2𝑥+1
(3) Use arithmetical,
algebraic, geometric
and statistical
methods to solve
problems
8.
(10pts)
Find all real solutions, if any, to x+1 = √𝑥 + 3.
(a) 2𝑥3=54
(b) 6𝑥2- 5x-6= 0
10.
(10pts)
Solve each inequality, and give the solutions and interval notation. Also
graph the solution set.
(a) −3 < 2𝑥 + 1 ≤ 4
(b) |2𝑥 −3| ≤ 4
14.
(15pts)
When a certain medicinal drug is administered to a patient, the number of
milligrams remaining in the patient’s bloodstream after t hours is modeled
by
D(t) = 50𝑒−0.2𝑡
For all questions on the final exam, 171 of 242 valid cases or 70.7% of the students earned a
score of 60% or higher, and 171 of 366 or 46.7% of the original enrollees earned a score of 60%
or higher.
2011-12 Assessment of Quantitative Reasoning: Full Report
4
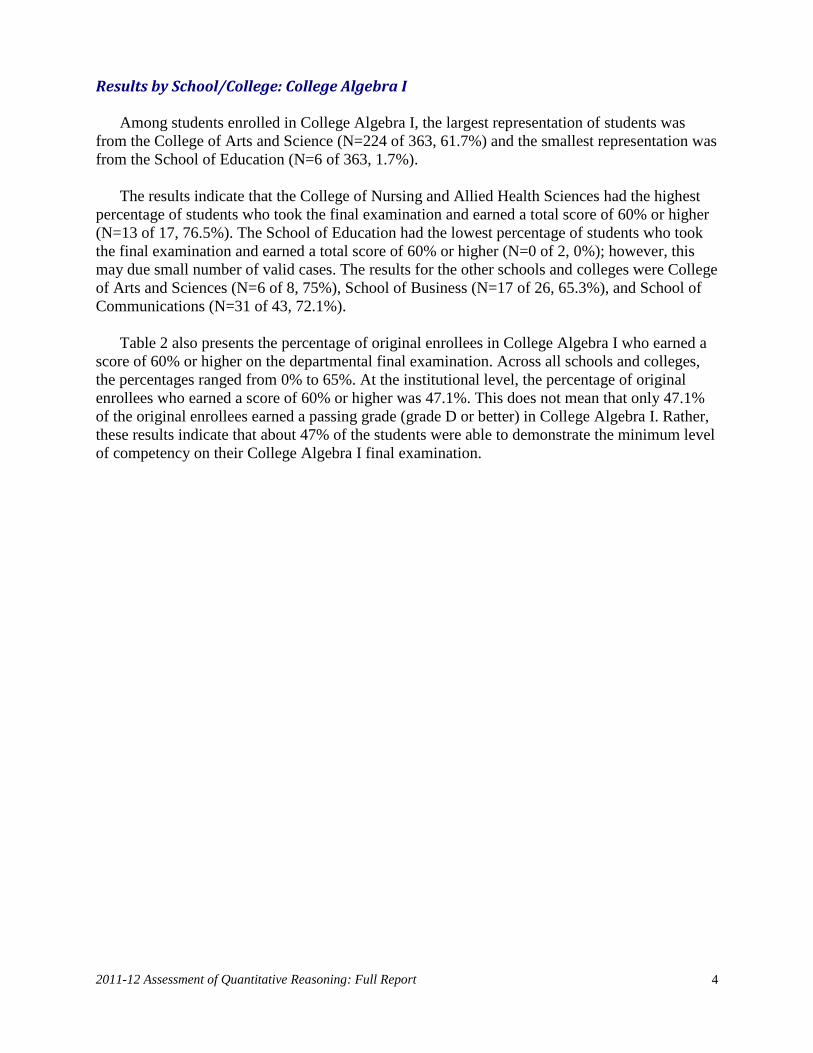
Results by School/College: College Algebra I
Among students enrolled in College Algebra I, the largest representation of students was
from the College of Arts and Science (N=224 of 363, 61.7%) and the smallest representation was
from the School of Education (N=6 of 363, 1.7%).
The results indicate that the College of Nursing and Allied Health Sciences had the highest
percentage of students who took the final examination and earned a total score of 60% or higher
(N=13 of 17, 76.5%). The School of Education had the lowest percentage of students who took
the final examination and earned a total score of 60% or higher (N=0 of 2, 0%); however, this
may due small number of valid cases. The results for the other schools and colleges were College
of Arts and Sciences (N=6 of 8, 75%), School of Business (N=17 of 26, 65.3%), and School of
Communications (N=31 of 43, 72.1%).
Table 2 also presents the percentage of original enrollees in College Algebra I who earned a
score of 60% or higher on the departmental final examination. Across all schools and colleges,
the percentages ranged from 0% to 65%. At the institutional level, the percentage of original
enrollees who earned a score of 60% or higher was 47.1%. This does not mean that only 47.1%
of the original enrollees earned a passing grade (grade D or better) in College Algebra I. Rather,
these results indicate that about 47% of the students were able to demonstrate the minimum level
of competency on their College Algebra I final examination.
2011-12 Assessment of Quantitative Reasoning: Full Report
5
Table 2. Quantitative Reasoning for Spring Semester 2012 by School and College
Algebra I Final Examination
Student
Classification
Number
of Cases
Withdrew
or No Score
Valid
Cases
Item #
&
(QR Comp)
No. of Valid
Cases Scoring
60% or
Higher
Percent of
Valid Cases
Scoring 60%
or Higher
Percent of
Original
Enrollees
Scoring 60%
or Higher
College of
Arts &
Sciences
116 38 78 3, 5, 6, & 12
(1) 47 60.2% 40.5%
108 44 64 7, 8, 10 & 14
(3) 53 82.8% 49.1%
224 78 146 Total Exam 104 71.2% 46.4%
College
Engineering,
Architecture
& Computer
Science
6 2 4 3, 5, 6, & 12 3 75.0% 50.0%
5 1 4 7, 8, 10 & 14 4 100.0% 80.0%
11 3 8 Total Exam 6 75.0% 54.5%
School of
Education
3 2 1 3, 5, 6, & 12 0 0% 0%
3 2 1 7, 8, 10 & 14 1 100.0% 33.3%
6 4 2 Total Exam 0 0% 0%
College of
Nursing and
Allied Health
Sciences
10 1 9 3, 5, 6, & 12 6 66.7% 60.0%
10 2 8 7, 8, 10 & 14 6 75.0% 60.0%
20 3 17 Total Exam 13 76.5% 65.0%
School of
Business
20 3 17 3, 5, 6, & 12 12 70.6% 60.0%
11 2 9 7, 8, 10 & 14 6 66.7% 54.5%
31 5 26 Total Exam 17 65.3% 54.8%
School of
Communicati
ons
33 12 21 3, 5, 6, & 12 11 52.3% 33.3%
38 18 20 7, 8, 10 & 14 16 80% 42.1%
71 28 43 Total Exam 31 72.1% 43.7%
Institutional
Results
188 58 130 3, 5, 6, & 12 79 60.8% 42.0%
175 69 106 7, 8, 10 & 14 86 81.1% 49.1%
363 121 242 Total Exam 171 70.7% 47.1%
Note: (1) Institutional Results include Arts & Sciences, Engineering, Architecture and Computer Sciences, Education, Allied
Health Sciences, School of Business, and School of Communications. (2) Number of Cases indicates the number of students on
the official class roster. (3) Withdrew or No Score includes situations in which students withdrew from the class, did not take
the final (including prospective graduating students), or did not answer the particular item. (4) Valid Cases indicate the number
of cases included in the analysis for which there is a question or exam score. (5) Two students (freshman) did not choose school
or college yet at the time when final exam was taken; their data are not included in this table.
Results by Student Classification: College Algebra I
Table 3 presents the results of student performance on the College Algebra I final
examination for all classifications of students. Of the 366 students enrolled in the course,
freshmen had the largest representation (N=222 of 366, 60.7%) and junior and seniors had the
smallest representation (N=34 of 366, 9.3%). The results also indicate that freshmen had the
2011-12 Assessment of Quantitative Reasoning: Full Report
6
highest percentage of students who took the final examination and earned a total score of 60% or
higher (N=123 of 165, 74.5%). Juniors had the lowest percentage of students who took the final
examination and earned a total score of 60% or higher (N=10 of 19, 52.6%).
Table 3. Quantitative Reasoning for Spring Semester 2012 by Student Classification
College Algebra I Final Examination
Student
Classification
Number
of Cases
Withdrew
or No Score
Valid
Cases Item #
No. of Valid
Cases Scoring
60% or
Higher
Percent of
Valid Cases
Scoring 60%
or Higher
Percent of
Original
Enrollees
Scoring 60%
or Higher
Freshman
117 27 90 3, ,5 ,6, & 12 60 66.7% 51.3%
105 34 71 7, 8, 10, & 14 59 83.0% 56.2%
222 57 165 Total Exam 123 74.5% 55.4%
Sophomore
34 11 23 3, ,5 ,6, & 12 11 47.8% 32.4%
41 19 22 7, 8, 10, & 14 16 72.7% 39.0%
75 29 46 Total Exam 31 67.4% 41.3%
Junior
20 9 11 3, ,5 ,6, & 12 6 54.5% 30.0%
14 6 8 7, 8, 10, & 14 6 75.0% 42.9%
34 15 19 Total Exam 10 52.6% 29.4%
Senior
17 11 6 3, ,5 ,6, & 12 2 33.3% 11.8%
17 12 5 7, 8, 10, & 14 5 100% 29.4%
34 22 12 Total Exam 7 58.3% 20.6%
Institutional
Results
188 58 130 3, ,5 ,6, & 12 79 60.8% 42.0%
177 71 106 7, 8, 10, & 14 86 81.1% 48.6%
365 123 242 Total Exam 171 70.7% 46.8%
Note: (1) Institutional Results include Arts & Sciences, Engineering, Architecture & Computer Sciences, and Nursing and Allied Health
Sciences. (2) Number of Cases indicates the number of “original enrollees” on the official class roster. (3) Withdrew or No Score includes
situations in which students withdrew from the class, did not take the final (including perspective graduating students), or did not answer the
particular item. (4) Valid Cases indicate the number of cases included in the analysis for which there is a question or exam score.
The results also indicate that retention rates for College Algebra I were low across all
classifications and decreased as classification level increased (See “valid cases”): freshmen
(N=123 of 165, 74.5%); sophomores (N=31 of 46, 67.4%); juniors (N=10 of 19, 52.6%); and
seniors (N=7 of 12, 58.3%). Essentially, nearly one-fourth of all freshmen and two-thirds of all
seniors who were enrolled in College Algebra did not have a departmental final examination
score reported for them. The retention rate for seniors, however, may be somewhat
underestimated since seniors who were prospective graduates took a final examination
approximately one week before the departmental final examination was administered.
2011-12 Assessment of Quantitative Reasoning: Full Report
7
Figure 1 presents the percentage of original enrollees in College Algebra I who earned a
score of 60% or higher on the departmental final examination by student classification -- the
percentages ranged from 4.2% for seniors to 19.1% for freshmen.
Figure 1
Descriptive Statistics by Student Classification: College Algebra I
Table 4 provides descriptive statistics for the 242 valid cases who took the department final
examination in College Algebra I in Spring Semester 2012. Valid cases are those students for
whom a question or final examination score is reported. Raw scores on the final examination
range from 0 to 200. Table 4 shows the percentage scores and range from 0% to 100%, for
example, if the raw score is 80 (out of 200), the percentage score is 40% in Table 4. The highest
mean score and lowest variability occurred among freshmen, M=69.6%, SD=20.2%, and the
lowest mean score and highest variability occurred among seniors, M=57.5%, SD=27.2%.
Observed scores ranged from 1.5% to 99%. Both of these extreme scores were earned by
freshmen.
55.4%
41.3%
29.4%
46.7%
0%
20%
40%
60%
Freshman Sophomore Junior Senior
Perc
en
t o
f E
nro
llees S
co
rin
g 6
0%
or
Hig
her
Percent of Original Enrollees Scoring 60% or Higher in College Algebra I by Student Classification, Spring 2012
Note: Data reflect students who withdrew or had no score. Some seniors who were propspective graduates had no score because they took an earlier examination.
2011-12 Assessment of Quantitative Reasoning: Full Report
8
Table 4. Descriptive Statistics for Algebra I by Student Classification (Percentages)
Spring Semester 2012
Classification Valid N Minimum Maximum Mean Std. Dev.
Freshman 165 1.5% 99.0% 69.6% 20.2%
Sophomore 46 8.5% 91.0% 64.8% 21.3%
Junior 19 12.5% 97.5% 57.5% 27.2%
Senior 12 35.5% 89.5% 65.3% 17.9%
Institutional Results 242 1.5% 99.0% 67.5% 21.1%
Figure 2 presents the mean scores on the College Algebra I final examination by student
classification for valid cases only. The graph shows that, overall, the mean scores for all student
classifications -- freshmen, sophomores, juniors and seniors – were around 60% or a C grade.
Figure 2
Inferential Statistics by Student Classification: College Algebra I
F-Test and Post Hoc Analyses: An Analysis of Variance (ANOVA) was performed on the
four mean percentage scores by student classification. The results of the F-test in Table 5 show
that there is no statistically significant difference in the mean scores at 5% significant level for
69.6%
64.8%
57.5%
67.5%
0%
20%
40%
60%
80%
Freshman Sophomore Junior Senior
Mean
Sco
re (
%)
on
Fin
al E
xam
Mean Scores of College Algebra I by Student Classification, Spring 2012
2011-12 Assessment of Quantitative Reasoning: Full Report
9
freshmen, sophomores, juniors and seniors on the departmental final examination for College
Algebra I, F(3,238)=2.31, p=.08.
Table 5. ANOVA for Final Exam (Percentage) Score
by Student Classification in College Algebra I
Sum of
Squares df
Mean
Square F Sig.
Between Groups 3026.265 3 1008.755 2.306 .077
Within Groups 104124.030 238 437.496
Total 107150.295 241
A Post Hoc analysis was also performed in order to examine pair-wise differences in mean
performances by student classification. Table 6 shows that there are no statistically significant
differences (p<.05) between the mean performances.
Table 6. Post Hoc Multiple Comparisons for Final Exam Percentage Scores
by Student Classification in College Algebra I, 2012
(I) Classification (J) Classification Mean
Difference
(I-J)
Std.
Error Sig.
95% Confidence
Interval
Lower
Bound Upper
Bound
Freshman
Sophomore 4.79 3.51 .69 -4.71 14.29
Junior 12.12 6.44 .37 -6.65 30.89
Senior 4.32 5.38 .97 -12.32 20.97
Sophomore
Freshman -4.79 3.51 .69 -14.29 4.71
Junior 7.33 6.99 .89 -12.49 27.14
Senior -.47 6.03 1.00 -18.06 17.13
Junior
Freshman -12.12 6.44 .37 -30.89 6.65
Sophomore -7.33 6.99 .89 -27.14 12.49
Senior -7.79 8.10 .92 -30.66 15.07
Senior
Freshman -4.32 5.38 .97 -20.97 12.32
Sophomore .47 6.03 1.00 -17.13 18.06
Junior 7.79 8.10 .92 -15.07 30.66
Note: "Tamhane”s T2" Post Hoc test is used, and equal variances are not assumed.
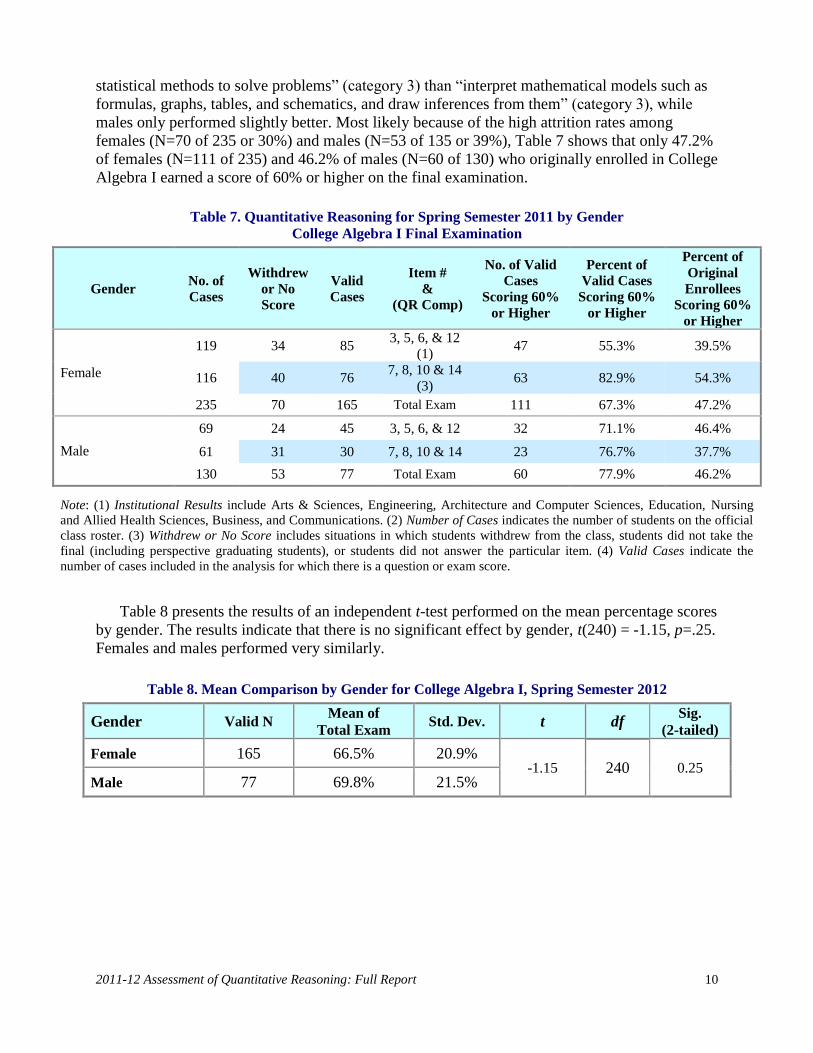
Results by Gender: College Algebra I
Of the 365 students enrolled in College Algebra I, 64.4% (N=235 of 365) were female and
35.6% (N=130 of 365) were male, thereby reflecting a ratio of females to males of almost 2:1.
Table 7 shows that females performed much better on “use arithmetical, algebraic, geometric and
2011-12 Assessment of Quantitative Reasoning: Full Report
10
statistical methods to solve problems” (category 3) than “interpret mathematical models such as
formulas, graphs, tables, and schematics, and draw inferences from them” (category 3), while
males only performed slightly better. Most likely because of the high attrition rates among
females (N=70 of 235 or 30%) and males (N=53 of 135 or 39%), Table 7 shows that only 47.2%
of females (N=111 of 235) and 46.2% of males (N=60 of 130) who originally enrolled in College
Algebra I earned a score of 60% or higher on the final examination.
Table 7. Quantitative Reasoning for Spring Semester 2011 by Gender
College Algebra I Final Examination
Gender No. of
Cases
Withdrew
or No
Score
Valid
Cases
Item #
&
(QR Comp)
No. of Valid
Cases
Scoring 60%
or Higher
Percent of
Valid Cases
Scoring 60%
or Higher
Percent of
Original
Enrollees
Scoring 60%
or Higher
Female
119 34 85 3, 5, 6, & 12
(1) 47 55.3% 39.5%
116 40 76 7, 8, 10 & 14
(3) 63 82.9% 54.3%
235 70 165 Total Exam 111 67.3% 47.2%
Male
69 24 45 3, 5, 6, & 12 32 71.1% 46.4%
61 31 30 7, 8, 10 & 14 23 76.7% 37.7%
130 53 77 Total Exam 60 77.9% 46.2%
Note: (1) Institutional Results include Arts & Sciences, Engineering, Architecture and Computer Sciences, Education, Nursing
and Allied Health Sciences, Business, and Communications. (2) Number of Cases indicates the number of students on the official
class roster. (3) Withdrew or No Score includes situations in which students withdrew from the class, students did not take the
final (including perspective graduating students), or students did not answer the particular item. (4) Valid Cases indicate the
number of cases included in the analysis for which there is a question or exam score.
Table 8 presents the results of an independent t-test performed on the mean percentage scores
by gender. The results indicate that there is no significant effect by gender, t(240) = -1.15, p=.25.
Females and males performed very similarly.
Table 8. Mean Comparison by Gender for College Algebra I, Spring Semester 2012
Gender Valid N Mean of
Total Exam Std. Dev. t df
Sig.
(2-tailed)
Female 165 66.5% 20.9% -1.15 240 0.25
Male 77 69.8% 21.5%
2011-12 Assessment of Quantitative Reasoning: Full Report
11
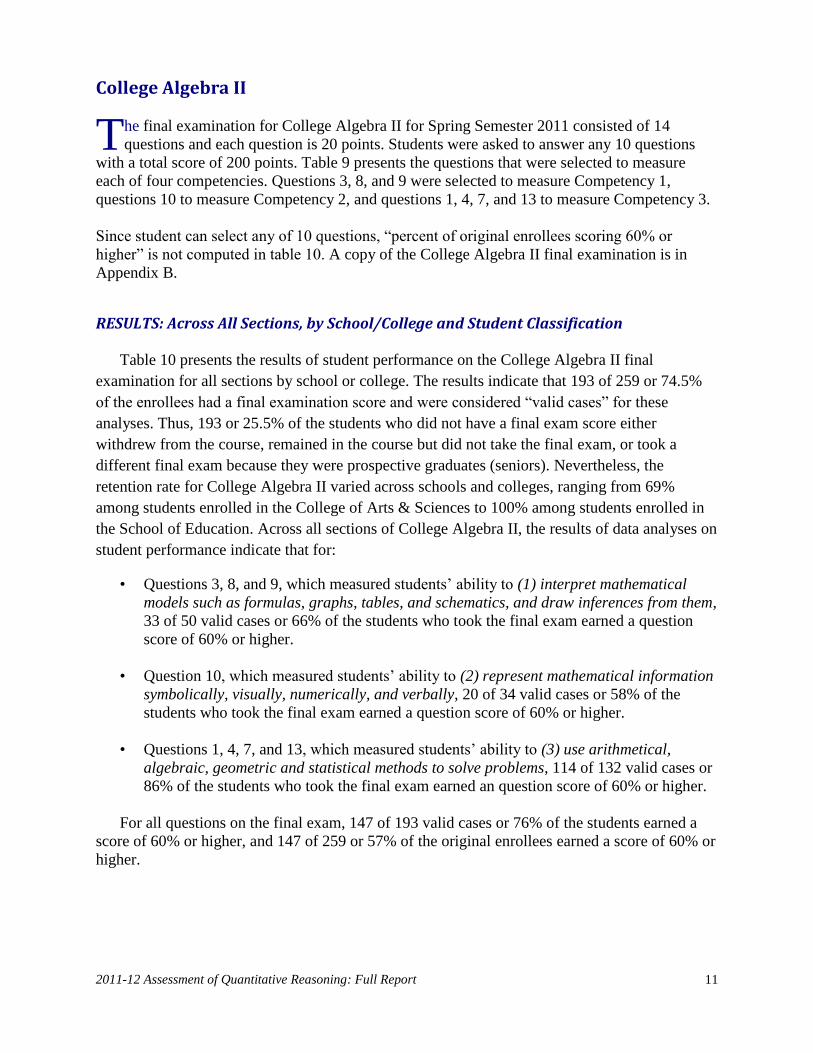
College Algebra II
he final examination for College Algebra II for Spring Semester 2011 consisted of 14
questions and each question is 20 points. Students were asked to answer any 10 questions
with a total score of 200 points. Table 9 presents the questions that were selected to measure
each of four competencies. Questions 3, 8, and 9 were selected to measure Competency 1,
questions 10 to measure Competency 2, and questions 1, 4, 7, and 13 to measure Competency 3.
Since student can select any of 10 questions, “percent of original enrollees scoring 60% or
higher” is not computed in table 10. A copy of the College Algebra II final examination is in
Appendix B.
RESULTS: Across All Sections, by School/College and Student Classification
Table 10 presents the results of student performance on the College Algebra II final
examination for all sections by school or college. The results indicate that 193 of 259 or 74.5%
of the enrollees had a final examination score and were considered “valid cases” for these
analyses. Thus, 193 or 25.5% of the students who did not have a final exam score either
withdrew from the course, remained in the course but did not take the final exam, or took a
different final exam because they were prospective graduates (seniors). Nevertheless, the
retention rate for College Algebra II varied across schools and colleges, ranging from 69%
among students enrolled in the College of Arts & Sciences to 100% among students enrolled in
the School of Education. Across all sections of College Algebra II, the results of data analyses on
student performance indicate that for:
• Questions 3, 8, and 9, which measured students’ ability to (1) interpret mathematical
models such as formulas, graphs, tables, and schematics, and draw inferences from them,
33 of 50 valid cases or 66% of the students who took the final exam earned a question
score of 60% or higher.
• Question 10, which measured students’ ability to (2) represent mathematical information
symbolically, visually, numerically, and verbally, 20 of 34 valid cases or 58% of the
students who took the final exam earned a question score of 60% or higher.
• Questions 1, 4, 7, and 13, which measured students’ ability to (3) use arithmetical,
algebraic, geometric and statistical methods to solve problems, 114 of 132 valid cases or
86% of the students who took the final exam earned an question score of 60% or higher.
For all questions on the final exam, 147 of 193 valid cases or 76% of the students earned a
score of 60% or higher, and 147 of 259 or 57% of the original enrollees earned a score of 60% or
higher.
T
2011-12 Assessment of Quantitative Reasoning: Full Report
12
Table 9. Questions and QR Competencies for College Algebra II Final Examination
Item #
(Points) Item Description Competency Measured
3.
(20 pts)
The time required to double the amount of an investment of the interest rate
r compounded continuously is given by t = ln 2
𝑟 where t is measured in
years.
(a) Write the exponential equation that gives A(t), the amount after t
years.
(b) Find the time required to double an investment at 6 percent
interest.
(1) Interpret mathematical
models such as formulas,
graphs, tables, and
schematics, and draw
inferences from them. 8.
(20 pts)
Find the equation for the hyperbola whose focus is at the point (0,1) and
whose directrix is the line y=5
9.
(20 pts)
Find the equation for the hyperbola that satisfies the given conditions:
Foci: (±5; 0), vertices (±3; 0)
10.
(20 pts)
Graph the region which satisfies the following inequalities. Be sure to
identify the coordinates of each vertex.
𝑥 ≥ 0
𝑦 ≥ 0
2𝑥 + 𝑦 ≤ 10
−2𝑥 + 𝑦 ≤ 2
4𝑥 + 7𝑦 ≤ 28
(2) Represent mathematical
information symbolically,
visually, numerically, and
verbally.
1.
(20 pts) Find all rational zeros of the polynomial P(x) = 𝑥3+9𝑥1-108.
(3) Use arithmetical,
algebraic, geometric and
statistical methods to solve
problems
4
(20 pts)
The perimeter of the triangle is 72 inches. The length is 3.5 times as large
as the width. Find the dimensions.
7.
(20 pts)
Use Cramer’s rule to solve the following system of equations:
4x-5y=3, 3x-2y=1.
13.
(20 pts)
Find the final amount in an annuity in which $200 is deposited monthly for
10 years, interest is compounded monthly and the annual interest rate is 12
percent.
2011-12 Assessment of Quantitative Reasoning: Full Report
13
Results by School/College: College Algebra II
Of the 259 students enrolled in College Algebra II, the largest representation of students was
from the College of Arts and Science (N=123 of 259 or 47.5%) and the smallest representation
was from the School of Education (N=4 of 259 or 1.5%).
The results indicate that the College of Nursing and Allied Health Sciences (CEACS) had the
highest percentage of students who took the final examination and earned a total score of 60% or
higher (N=19 of 21 or 90%). The School of Business had no students (68%) to earned a total
score of 60% or higher.
Table 10 also presents the percentage of original enrollees in College Algebra II who earned
a score of 60% or higher on the departmental final examination. Across all schools and colleges,
the percentages ranged from 53% to 75%. At the institutional level, the percentage of original
enrollees who earned a score of 60% or higher was 57%. This does not mean that only 57% of
the original enrollees earned a passing grade (grade D or better) in College Algebra II. Rather,
these results indicate that about one-third of the students were able to demonstrate the minimum
level of competency on their College Algebra II final examination.
2011-12 Assessment of Quantitative Reasoning: Full Report
14
Table 10. Quantitative Reasoning for Spring Semester 2012 by School and College
Student
Classification
Number
of Cases
Withdrew or
No Score
Valid
Cases
Item #
&
(QR Comp)
No. of Valid
Cases Scoring
60% or Higher
Percent of
Valid Cases
Scoring 60%
or Higher
Percent of
Original
Enrollees
Scoring 60%
or Higher
College of
Arts &
Sciences
28 7 21 3, 8, & 9 (1) 12 57% NA
28 11 17 10 (2) 8 47% NA
95 34 61 1, 4, 7, & 13
(3) 52 85% NA
123 38 85 Total Exam 67 79% 54%
College
Engineering,
Architecture
& Computer
Science
2 2 0 3, 8, & 9 0 NA NA
2 2 0 10 0 NA NA
3 0 3 1, 4, 7, & 13 2 66% NA
5 1 4 Total Exam 3 75% 60%
School of
Education
3 0 3 3, 8, & 9 1 33% NA
3 0 3 10 3 100% NA
1 0 1 1, 4, 7, & 13 1 100% NA
4 0 4 Total Exam 3 75% 75%
College of
Nursing and
Allied Health
Sciences
5 1 4 3, 8, & 9 4 100% NA
5 2 3 10 2 66% NA
22 6 16 1, 4, 7, & 13 16 100% NA
27 6 21 Total Exam 19 90% 70%
School of
Business
23 8 15 3, 8, & 9 11 73% NA
23 14 9 10 6 66% NA
47 12 35 1, 4, 7, & 13 28 80% NA
70 16 54 Total Exam 37 68% 53%
School of
Communicati
ons
9 2 7 3, 8, & 9 5 71% NA
9 7 2 10 1 50% NA
21 5 16 1, 4, 7, & 13 15 93% NA
30 5 25 Total Exam 18 72% 60%
Institutional
Results
70 20 50 3, 8, & 9 33 66% NA
70 36 34 10 20 58% NA
189 57 132 1, 4, 7, & 13 114 86% NA
259 66 193 Total Exam 147 76% 57%
Note: (1) Institutional Results include Arts & Sciences, Engineering & Architecture, Education, Allied Health Sciences, School
of Business, and School of Communications and exclude one student from Continuing Education. (2) Number of Cases indicates
the number of students on the official class roster. (3) Withdrew or No Score includes situations in which students withdrew from
the class, did not take the final (including perspective graduating students), or did not answer the particular item. (4) Valid Cases
indicate the number of cases included in the analysis for which there is a question or exam score (5) Item 13 was optional, which
could reduce the number of valid cases.
2011-12 Assessment of Quantitative Reasoning: Full Report
15
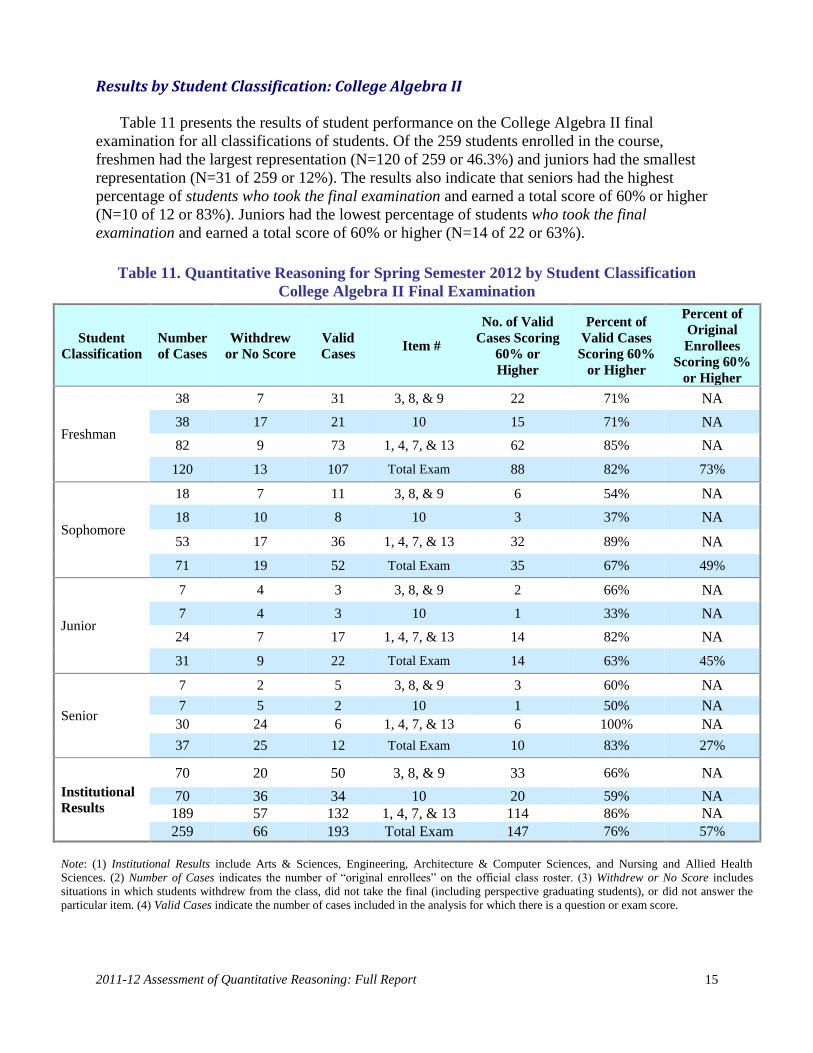
Results by Student Classification: College Algebra II
Table 11 presents the results of student performance on the College Algebra II final
examination for all classifications of students. Of the 259 students enrolled in the course,
freshmen had the largest representation (N=120 of 259 or 46.3%) and juniors had the smallest
representation (N=31 of 259 or 12%). The results also indicate that seniors had the highest
percentage of students who took the final examination and earned a total score of 60% or higher
(N=10 of 12 or 83%). Juniors had the lowest percentage of students who took the final
examination and earned a total score of 60% or higher (N=14 of 22 or 63%).
Table 11. Quantitative Reasoning for Spring Semester 2012 by Student Classification
College Algebra II Final Examination
Student
Classification
Number
of Cases
Withdrew
or No Score
Valid
Cases Item #
No. of Valid
Cases Scoring
60% or
Higher
Percent of
Valid Cases
Scoring 60%
or Higher
Percent of
Original
Enrollees
Scoring 60%
or Higher
Freshman
38 7 31 3, 8, & 9 22 71% NA
38 17 21 10 15 71% NA
82 9 73 1, 4, 7, & 13 62 85% NA
120 13 107 Total Exam 88 82% 73%
Sophomore
18 7 11 3, 8, & 9 6 54% NA
18 10 8 10 3 37% NA
53 17 36 1, 4, 7, & 13 32 89% NA
71 19 52 Total Exam 35 67% 49%
Junior
7 4 3 3, 8, & 9 2 66% NA
7 4 3 10 1 33% NA
24 7 17 1, 4, 7, & 13 14 82% NA
31 9 22 Total Exam 14 63% 45%
Senior
7 2 5 3, 8, & 9 3 60% NA
7 5 2 10 1 50% NA
30 24 6 1, 4, 7, & 13 6 100% NA
37 25 12 Total Exam 10 83% 27%
Institutional
Results
70 20 50 3, 8, & 9 33 66% NA
70 36 34 10 20 59% NA
189 57 132 1, 4, 7, & 13 114 86% NA
259 66 193 Total Exam 147 76% 57%
Note: (1) Institutional Results include Arts & Sciences, Engineering, Architecture & Computer Sciences, and Nursing and Allied Health
Sciences. (2) Number of Cases indicates the number of “original enrollees” on the official class roster. (3) Withdrew or No Score includes
situations in which students withdrew from the class, did not take the final (including perspective graduating students), or did not answer the
particular item. (4) Valid Cases indicate the number of cases included in the analysis for which there is a question or exam score.
2011-12 Assessment of Quantitative Reasoning: Full Report
16
The results also indicate that retention rates for College Algebra II decreased as classification
increased (See “valid cases”): freshmen (N=107 of 120 or 89.2%); sophomores (N=52 of 71 or
73.2%); juniors (N=22 of 31 or 71%); and seniors (N=12 of 37 or 32.4%).
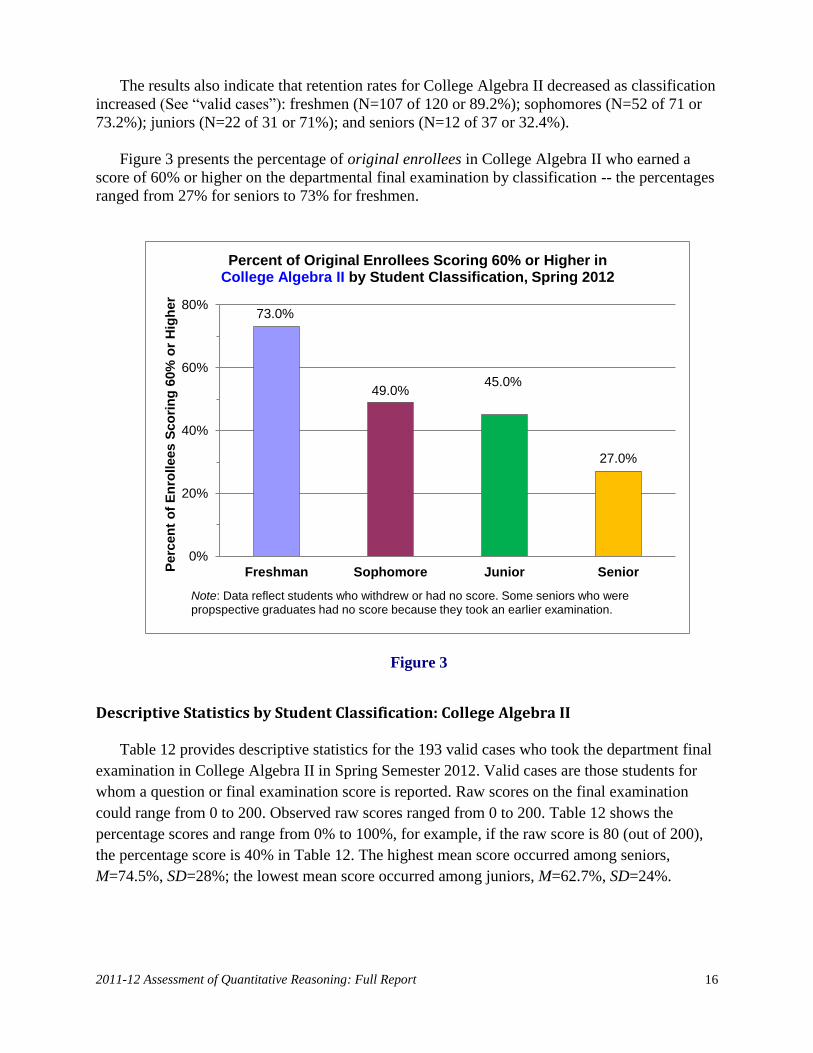
Figure 3 presents the percentage of original enrollees in College Algebra II who earned a
score of 60% or higher on the departmental final examination by classification -- the percentages
ranged from 27% for seniors to 73% for freshmen.
Figure 3
Descriptive Statistics by Student Classification: College Algebra II
Table 12 provides descriptive statistics for the 193 valid cases who took the department final
examination in College Algebra II in Spring Semester 2012. Valid cases are those students for
whom a question or final examination score is reported. Raw scores on the final examination
could range from 0 to 200. Observed raw scores ranged from 0 to 200. Table 12 shows the
percentage scores and range from 0% to 100%, for example, if the raw score is 80 (out of 200),
the percentage score is 40% in Table 12. The highest mean score occurred among seniors,
M=74.5%, SD=28%; the lowest mean score occurred among juniors, M=62.7%, SD=24%.
73.0%
49.0%45.0%
27.0%
0%
20%
40%
60%
80%
Freshman Sophomore Junior SeniorPerc
en
t o
f E
nro
llees S
co
rin
g 6
0%
or
Hig
he
r
Percent of Original Enrollees Scoring 60% or Higher in College Algebra II by Student Classification, Spring 2012
Note: Data reflect students who withdrew or had no score. Some seniors who were propspective graduates had no score because they took an earlier examination.
2011-12 Assessment of Quantitative Reasoning: Full Report
17
Table 12. Descriptive Statistics for College Algebra II by Student Classification (Percentages)
Spring Semester 2012
Classification Valid N Minimum Maximum Mean Std. Dev.
Freshman 107 0% 100% 75.3% 21.5%
Sophomore 52 0% 100% 66.2% 25.5%
Junior 22 10% 97.5% 62.7% 24.0%
Senior 12 0% 100% 75.4% 28.0%
Institutional Results 193 0% 100% 71.4% 23.6%
Figure 4 presents the mean scores on the College Algebra II final examination by student
classification for valid cases only. The graph shows that freshmen were the only class to meet the
minimum mean criterion performance of at least 60%. Specifically, the mean score for freshmen
on the College Algebra II final examination is 63%. All other student classifications,
sophomores, juniors and seniors, failed to meet the criterion score of 60% or higher with mean
scores of 50.3%, 48.7%, and 47.3%, respectively.
Figure 4
75.3%
66.2%
62.7%
75.4%
0%
20%
40%
60%
80%
Freshman Sophomore Junior Senior
Mean
Sco
re (
%)
on
Fin
al E
xam
Mean Scores of College Algebra II by Student Classification, Spring 2012
2011-12 Assessment of Quantitative Reasoning: Full Report
18
Inferential Statistics by Student Classification: College Algebra II
F-Test and Post Hoc Analyses: An Analysis of Variance (ANOVA) was performance on the
four mean scores by student classification. The results of the F-test in Table 13 show that there is
a statistically significant difference in the mean scores for freshmen, sophomores, juniors and
seniors on the departmental final examination for College Algebra II, F(3,189)=3.00, p=0.03.
Table 13. ANOVA for Final Exam Percentage Scores
by Student Classification in College Algebra II
Sum of
Squares df
Mean
Square F Sig.
Between Groups 4870.296 3 1623.432 2.999 .032
Within Groups 102312.918 189 541.338
Total 107183.214 192
A Post Hoc analysis was also performed in order to examine pair-wise differences in mean
performances by student classification. Table 14 shows that there are no statistically significant
differences between any two pairs of the mean performances by student classification. ANOVA
result shows that there is only a three percent chance (i.e., statistically significant) that all mean
scores for freshmen, sophomores, juniors and seniors are equal. However, the chance for each
pair of mean scores to be equal is higher than 5%, i.e., statistically not significant.
Table 14. Post Hoc Multiple Comparisons for Final Exam Percentage Scores
by Student Classification in College Algebra II
(I) Classification (J) Classification Mean
Difference
(I-J)
Std.
Error Sig.
95% Confidence
Interval
Lower
Bound Upper
Bound
Freshman
Sophomore 9.08 4.10 .16 -1.95 20.11
Junior 12.60 5.42 .16 -2.74 27.90
Senior -.101 8.34 1.00 -26.10 25.90
Sophomore
Freshman -9.08 4.10 .16 -20.11 1.95
Junior 3.50 6.13 .99 -13.40 20.40
Senior -9.18 8.81 .90 -35.73 17.37
Junior
Freshman -12.58 5.42 .16 -27.90 2.74
Sophomore -3.508 6.13 .99 -20.40 13.40
Senior -12.68 9.50 .73 -40.47 15.11
Senior
Freshman .10 8.34 1.00 -25.90 26.10
Sophomore 9.18 8.81 .90 -17.37 35.73
Junior 12.68 9.50 .73 -15.11 40.47
Note: Tamhane’s T2 Post Hoc test is used, and equal variances are not assumed.
2011-12 Assessment of Quantitative Reasoning: Full Report
19
Pre-Calculus
he final examination for Pre-calculus for Spring Semester 2011 consisted of 14 questions
and a total score of 200 points. Table 15 presents the questions that were identified to
measure each of four competencies. A copy of the final examination is in Appendix C.
Table 15. Questions and QR Competencies for Pre-calculus Final Examination
Item # (Points)
Item Description Competency
Measured
4.
(10 pts) Express ln 𝑥 − 2 ln( 𝑥2 + 1) −
1
2ln(𝑥 + 1)2 as a single logarithm
(2) Represent
mathematical
information
symbolically,
visually, numerically,
and verbally.
8.
(10 pts)
Given the trigonometric function
y= 3cos ⌊2 (𝑥 −𝜋
4)⌋
(a). Find the amplitude, period, and phase shift of the graph of
the trigonometric function, if any.
(b.) Graph the function, showing at least two periods.
9.
(20 pts)
Verify the following trigonometric identities:
(a) 1+tan 2𝜃
csc 2𝜃= tan 2 𝜃
(b) (cot 𝑥 − csc 𝑥) (cos 𝑥 + 1) = sin 𝑥
12.
(10 pts)
Graph the feasible region and maximize the objective function
P(x,y)=12x +6y subject to the constraints:
{
𝑥 ≥ 0𝑦 ≥ 0
2𝑥 + 2𝑦 < 82𝑥 + 3𝑦 ≤ 12
5.
(20 pts)
Solve the following logarithmic equations:
(a) ln(𝑥 − 2) = 2
(b) 𝑙𝑜𝑔2x + 𝑙𝑜𝑔2(x+2) = 3.
(3) Use arithmetical,
algebraic, geometric
and statistical
methods to solve
problems.
7.
(20 pts)
Without using your calculator, find the exact values of the following
expressions. You must show your work to get credit.
(a) sin 75° (b) cos −1 (−√3
2)
(c) 𝑠𝑖𝑛−1(sin2𝜋
3) (d) Cos(sin −1
3
5
10.
(20 pts) Solve the trigonometric equation 4𝑐𝑜𝑠2𝜃 − 4 cos 𝜃 + 1 = 0 and list
specific solutions.
14.
(10 pts)
The population of a certain country was given by the exponential model
N(t)=260𝑒0.007𝑡 where N(t) is in millions and t is the number of years
after 2000. (a) What as the population of the country in the year 2000?
(b) In which year did the population reach 270 million?
(c) What will be the size of the population in the year 2012?
T
2011-12 Assessment of Quantitative Reasoning: Full Report
20
RESULTS: Across All Sections, by School/College and Student Classification
Table 16 presents the results of student performance on the Pre-calculus final
examination for all sections by school or college. The results indicate that 149 of 181 or 82.3%
of the enrollees had a final examination score and were considered “valid cases” for these
analyses. Thus, 32 of 181 or 17.7% of the students who did not have a final exam score either
withdrew from the course, remained in the course but did not take the final exam, or took a
different final exam because they were prospective graduates (seniors). The retention rate for
Pre-calculus varied across the three schools and colleges represented, ranging from 79.3% (N=23
of 29) among students enrolled in the College Engineering, Architecture & Computer Science to
100% (N=10 of 10) among students enrolled in the School of Business. Across all sections of
Pre-calculus, the results of data analyses on student performance indicate that for:
• Questions 4, 8, 9, and 12, which measured students’ ability to (2) represent mathematical
information symbolically, visually, numerically, and verbally, 55 of 85 valid cases or
64.7% of the students who took the final exam earned a question score of 60% or higher,
and 55 of 95 or 57.9% of the original enrollees earned a score of 60% or higher.
• Questions 5, 7, 10, and 14, which measured students’ ability to (3) use arithmetical,
algebraic, geometric and statistical methods to solve problems, 34 of 64 valid cases or
53.1% of the students who took the final exam earned an question score of 60% or
higher, and 34 of 86 or 53.1% of the original enrollees earned a score of 60% or higher.
For all questions on the final examination, 90 of 149 valid cases or 60.4% of the students
earned a score of 60% or higher, and 90 of 181 or 49.7% of the original enrollees earned a score
of 60% or higher.
Results by School/College: Pre-calculus
Of the 181 students enrolled in Pre-calculus, the largest representation of students was from
the College of Arts and Science (N=125 of 181 or 69.1%) and the smallest representation was
from the School of Business (N=10 of 181 or 5.5%). No students from the School of Education
were enrolled in Pre-calculus.
The results indicate that the College of Nursing and Allied Health Sciences had the highest
percentage of students who took the final examination and earned a total score of 60% or higher
(N=10 of 14 or 71.4%). The results for the College of Arts and Sciences, which had a much
larger representation in Pre-calculus, were N=62 of 102 or 60.9%. In addition, only one half,
(N=12 or 23 or 52.2%) of the students from the College of Engineering, Architecture and
Computer Sciences who took the final examination earned a total score of 60% or higher.
Table 16 also presents the percentage of original enrollees in Pre-calculus who earned a
score of 60% or higher on the departmental final examination. Across all schools and colleges,
the percentages ranged from 41% to 60%. At the institutional level, the percentage of original
enrollees who earned a score of 60% or higher was 50%. This does not mean that only 50% of
the original enrollees earned a passing grade (grade D or better) in Pre-calculus. Rather, these
2011-12 Assessment of Quantitative Reasoning: Full Report
21
results indicate that about two-fifths of the students were able to demonstrate the minimum level
of competency on their Pre-calculus final examination.
Table 16. Quantitative Reasoning for Spring Semester 2012 by School and College
Pre-calculus Final Examination
Student
Classification
Number
of Cases
Withdrew
or No Score
Valid
Cases
Item #
&
(QR Comp)
No. of Valid
Cases Scoring
60% or
Higher
Percent of
Valid Cases
Scoring 60%
or Higher
Percent of
Original
Enrollees
Scoring 60%
or Higher
College of
Arts &
Sciences
75 9 66 4, 8, 9, & 12
(2) 45 68.1% 60.0%
50 14 36 5, 7, 10 &14
(3) 18 50.0% 36.0%
125 23 102 Total Exam 62 60.9% 49.6%
College
Engineering,
Architecture
& Computer
Science
9 1 8 4, 8, 9, & 12 5 62.5% 55.6%
20 5 15 5, 7, 10 &14 9 60.0% 45.0%
29 6 23 Total Exam 12 52.2% 41.3%
College of
Nursing and
Allied Health
Sciences
7 0 7 4, 8, 9, & 12 3 42.3% 42.8%
10 3 7 5, 7, 10 &14 4 57.1% 40.0%
17 3 14 Total Exam 10 71.4% 58.8%
School of
Business
4 0 4 4, 8, 9, & 12 2 50.0% 50.0%
6 0 6 5, 7, 10 &14 3 50.0% 50.0%
10 0 10 Total Exam 6 60.0% 60.0%
Institutional
Results
95 10 85 4, 8, 9, & 12 55 64.7% 57.9%
86 22 64 5, 7, 10 &14 34 53.1% 39.5%
181 32 149 Total Exam 90 60.4% 49.7%
Note: (1) Institutional Results include Arts & Sciences, Engineering, Architecture and Computer Sciences,
Education, Allied Health Sciences, School of Business, and School of Communications. (2) Number of Cases
indicates the number of students on the official class roster. (3) Withdrew or No Score includes situations in which
students withdrew from the class, did not take the final (including prospective graduating students), or did not
answer the particular item. (4) Valid Cases indicate the number of cases included in the analysis for which there is a
question or exam score.
Results by Student Classification: Pre-calculus
Table 17 presents the results of student performance on the Pre-calculus final examination
for all classifications of students. Of the 181 students enrolled in the course, freshmen had the
largest representation (N=100 of 181 or 55.2%) and juniors had the smallest representation
(N=20 of 181 or 11%). The results also indicate that freshmen had the highest percentage of
students who took the final examination and earned a total score of 60% or higher (N=62 of 91 or
2011-12 Assessment of Quantitative Reasoning: Full Report
22
68.1%). Juniors had the lowest percentage of students who took the final examination and earned
a total score of 60% or higher (N=4 of 12 or 33.3%).
Table 17. Quantitative Reasoning for Spring Semester 2012 by Student Classification
Pre-calculus Final Examination
Student
Classification
Number
of Cases
Withdrew
or No Score
Valid
Cases Item #
No. of Valid
Cases Scoring
60% or
Higher
Percent of
Valid Cases
Scoring 60%
or Higher
Percent of
Original
Enrollees
Scoring 60%
or Higher
Freshman
61 3 58 4, 8, 9, & 12 40 68.9% 65.6%
39 6 33 5, 7, 10 &14 19 57.6% 48.7%
100 9 91 Total Exam 62 68.1% 62.0%
Sophomore
23 3 20 4, 8, 9, & 12 14 70.0% 60.7%
16 8 8 5, 7, 10 &14 3 37.5% 18.8%
39 11 28 Total Exam 15 53.6% 71.8%
Junior
7 3 4 4, 8, 9, & 12 0 0.0% 0.0%
13 5 8 5, 7, 10 &14 3 37.5% 61.5%
20 10 12 Total Exam 4 33.3% 20.0%
Senior
4 1 3 4, 8, 9, & 12 1 33.3% 25.0%
18 3 15 5, 7, 10 &14 9 60.0% 50.0%
22 4 18 Total Exam 9 50.0% 40.9%
Institutional
Results
95 10 85 4, 8, 9, & 12 55 64.7% 57.9%
86 22 64 5, 7, 10 &14 34 53.1% 39.5%
181 32 149 Total Exam 90 60.4% 49.7%
Note: (1) Institutional Results include Arts & Sciences, Engineering, Architecture & Computer Sciences, and Nursing and Allied Health
Sciences. (2) Number of Cases indicates the number of “original enrollees” on the official class roster. (3) Withdrew or No Score includes
situations in which students withdrew from the class, did not take the final (including perspective graduating students), or did not answer the
particular item. (4) Valid Cases indicate the number of cases included in the analysis for which there is a question or exam score.
The results also indicate that retention rates for Pre-calculus by student classification:
freshmen (N=91 of 100 or 91%), sophomores (N=28 of 39 or 71.8%), juniors (N=12 of 20 or
60%), and seniors (N=18 of 22 or 81.8%) (See “valid cases”).
Figure 5 presents the percentage of original enrollees in Pre-calculus who earned a score of
60% or higher on the departmental final examination by student classification -- the percentages
ranged from 34.8% for seniors to 56.3% for juniors.
2011-12 Assessment of Quantitative Reasoning: Full Report
23
Figure 5
Descriptive Statistics by Student Classification: Pre-calculus
Table 18 provides descriptive statistics for the 149 valid cases who took the department final
examination in Pre-calculus in Spring Semester 2012. Valid cases are those students for whom a
final examination score is reported. Raw scores on the final examination could range from 0 to
200. Table 18 shows the percentage scores, which ranges from 10.5% to 96.5%. Table 18
presents the descriptive statistics for student performance by classification in percentage score
units. The highest mean score occurred among freshmen, M=65.8%; the lowest mean score
occurred among juniors, M=47.9%; and the highest variability occurred among seniors,
SD=27.9%.
62.0%
71.8%
20.0%
40.9%
0%
20%
40%
60%
80%
Freshman Sophomore Junior SeniorPerc
en
t o
f E
nro
llees S
co
rin
g 6
0%
or
Hig
her
Percent of Original Enrollees Scoring 60% or Higher in Pre-Calculus by Student Classification, Spring 2012
Note: Data reflect students who withdrew or had no score.Some seniors who were propspective graduates had no score because they took an earlier examination.
2011-12 Assessment of Quantitative Reasoning: Full Report
24
Table 18. Descriptive Statistics for Pre-calculus by Student Classification (Percentages)
Spring Semester 2012
Classification Valid N Minimum Maximum Mean Std. Dev.
Freshman 91 10.5% 96.5% 65.8% 20.2%
Sophomore 28 23% 91% 52.2% 18.0%
Junior 12 17.5% 85% 47.9% 21.5%
Senior 18 18% 91.5% 62.5% 27.9%
Institutional Results 149 10.5% 96.5% 62.2% 21.5%
Figure 6 presents the mean scores on the Pre-calculus final examination by student
classification for valid cases only. The graph shows that sophomores and juniors failed to meet
the minimum mean criterion score of 60%. Freshmen and seniors met the minimum mean
criterion performance of at least 60%. Specifically, the mean scores for freshmen and seniors on
the Pre-calculus final examination were 65.8% and 62.5%, respectively.
Figure 6
65.8%
52.2%47.9%
62.5%
0%
20%
40%
60%
80%
Freshman Sophomore Junior Senior
Mean
Sco
re (
%)
on
Fin
al E
xam
Mean Scores of Pre-Calculusby Student Classification, Spring 2012
2011-12 Assessment of Quantitative Reasoning: Full Report
25
Inferential Statistics by Student Classification: Pre-calculus
F-Test and Post Hoc Analyses: An Analysis of Variance (ANOVA) was performance on the four
mean scores by student classification. The results of the F-test in Table 19 show that there is a
statistically significant difference in the mean scores for freshmen, sophomores, juniors and
seniors on the departmental final examination for Pre-calculus, F(3, 145)=3.29, p=0.02.
Table 19. ANOVA for Final Exam Scores by Student Classification in Pre-calculus
Sum of
Squares df
Mean
Square F Sig.
Between Groups 4351.674 3 1450.558 3.286 .023
Within Groups 64002.669 145 441.398
Total 68354.343 148
The Post Hoc analysis and results in Table 20 shows that there are no statistically significant
pair-wise differences between mean performances by student classification. ANOVA result
shows that there is only a two percent chance (i.e., statistically significant) that all mean scores
for freshmen, sophomores, juniors and seniors are equal. However, the chance for each pair of
mean scores to be equal is higher than 5%, i.e., statistically not significant.
Table 20. Post Hoc Multiple Comparisons for Final Exam Scores
by Student Classification in Pre-calculus
(I) Classification (J) Classification Mean
Difference
(I-J)
Std.
Error Sig.
95% Confidence
Interval
Lower
Bound Upper
Bound
Freshman
Sophomore 8.63 4.01 .20 -2.37 19.62
Junior 17.90 6.58 .10 -2.28 38.08
Senior 4.37 6.91 .99 -15.73 24.47
Sophomore
Freshman -8.63 4.01 .20 -19.62 2.37
Junior 9.27 7.09 .75 -11.69 30.23
Senior -4.26 7.41 .99 -25.34 16.82
Junior
Freshman -17.90 6.58 .10 -38.08 2.28
Sophomore -9.27 7.09 .75 -30.23 11.69
Senior -13.53 9.06 .61 -39.21 12.15
Senior
Freshman -4.37 6.91 .99 -24.47 15.73
Sophomore 4.26 7.41 .99 -16.82 25.34
Junior 13.53 9.06 .61 -12.15 39.21
Note: Tamhane’s T2 Post Hoc test is used, and equal variances are not assumed.
2011-12 Assessment of Quantitative Reasoning: Full Report
26
The Economics of Student Drop-Out in Mathematics Courses
uring the 2009-10 year, the Office of Institutional Assessment and Evaluation began to
estimate the cost of student drop-out in mathematics courses in terms of dollars and cents
and in extended time-to-degree. In the 2010-11 report we noted, “There are costs to students and
to the institution when students drop out of courses, fail to meet certain competencies or earn
failing grades… oftentimes students have to re-enroll in a course and pay for it again…the cost
to the institution is in additional salaries for professors and perhaps lower four-year graduation
rates.”
For Spring Semester 2011, (if these students had to re-enroll in these courses) we estimated
that the potential cost in AY2010-11 dollars would be $654,381 for College Algebra I, $290,836
College Algebra II, $92,684 for Pre-calculus, and $1,037,901 for a total cost to students.
The Spring Semester 2012 estimated costs (for students whose grades were reported to OIAE
and data were submitted in time and followed report requirement), in terms of tuition dollars for
freshmen, sophomores, and juniors who either officially withdrew from a mathematics course or
did not have a final examination score reported for them, are presented in Table 21. The table
presents the cost for retaking the courses.
Table 21. Cost for Retaking College Algebra I, College Algebra II, and Pre-calculus
Course
No. of Students
who Withdrew or
did not have a
final exam score
Number of Credit
Hours per Course
Cost per Credit
Hour* Total Cost
College Algebra I
Freshmen 57 3 $799 $136,629
Sophomores 29 3 69,513
Juniors 15 3 35,955
Sub-Total for CAI 101 $242,097
College Algebra II
Freshmen 13 4 $799 $41,548
Sophomores 19 4 60,724
Juniors 9 4 28,764
Sub-Total for CAII 41 $131,036
Pre-calculus
Freshmen 9 4 $799 $28,764
Sophomores 11 4 35,156
Juniors 10 4 31,960
Sub-Total for Pre-cal 30 $95,880
TOTAL COST $469,013
*Undergraduate part-time rate per credit hour for AY2012-13.
D
2011-12 Assessment of Quantitative Reasoning: Full Report
27
Summary
he improvement of students’ competencies in quantitative reasoning, as defined by
performance in College Algebra I, College Algebra II and Pre-calculus, must begin with
strategies to reduce the attrition rates in these courses. Students who officially withdrew from the
courses, stop attending without officially withdrawing, or failed the courses (earn a grade of F)
will have to re-take the courses in order to fulfill degree requirements and graduate. The
estimated costs to the university in real dollars and cents for students to re-take these courses are
cumulative and prohibitive. The costs are cumulative because each year the university must
provide instructional resources for new entrants as well as for those returning students who must
retake the courses. The costs are prohibitive because (1) they are high and could lead to
increased student debt and time-to-degree, and (2) each year the university invests generously in
professional developmental/remediation programs that are designed to prepare underprepared
students for college level mathematics and reduce the rates of recidivism in the general education
mathematics courses. Hence, while the awarding degrees is important, institutions are
increasingly placing an equally important premium on student learning outcomes; that is, what
students know and are able to do when they graduate. In fact, institutional effectiveness is being
defined, in part, by the extent to which institutions are able to provide credible evidence that
students are achieving the learning goals that institutions have set for themselves.
Disaggregating student performance data by school/college, student classification and gender
allows university personnel to develop specific strategies for targeted student groups. Doing so
demonstrates that a ‘one size fits all’ may not be an effective approach for improving student
learning outcomes or achieving institutional goals. The data clearly show that too many freshmen
are failing to persist and succeed in their mathematics courses.
Analyzing student performance data by competency also reveals areas of strength or
weakness in the university’s instructional programs. The analyses of student performance data
for College Algebra I, College Algebra II and Pre-calculus suggest that students met the
minimum competency in areas which measured procedural knowledge, such as solving
problems; however, students failed to meet minimum competency in areas which measured
higher order and critical thinking skills, such as interpreting mathematical models, drawing
inferences, determining reasonableness of a solution, or selecting optimal results.
Faculty, academic advisors, peer counselors, student affairs personnel, university
administrators, and most importantly, students themselves must work collaboratively to do what
is necessary to improve students’ competencies in quantitative reasoning (See Conclusions and
Recommendations in the “Executive Summary).
T
2011-12 Assessment of Quantitative Reasoning: Full Report
28
Appendix A. College Algebra I
56% (N=330)
62% (N=331)
61% (N=130)
81% (N=106)
0%
20%
40%
60%
80%
100%
MAA Category 1 MAA Category 3
College Algebra I Competency (Institutional Results), Percent of Valid Cases Scoring 60% or Higher
on MAA Category 1 and 3
2011
2012
40% (N=305)
34% (N=285)
71% (N=242)
23% (N=149)
0%
20%
40%
60%
80%
100%
2009 2010 2011 2012
College Algebra I Competency (Institutional Results), Percent of Valid Cases Scoring 60% or Higher on the Final Exam
2011-12 Assessment of Quantitative Reasoning: Full Report
29
2011-12 Assessment of Quantitative Reasoning: Full Report
30
2011-12 Assessment of Quantitative Reasoning: Full Report
31
Appendix B. College Algebra II
40% (N=281)
53% (N=235)
54% (N=281)
66% (N=50)
59% (N=34)
86% (n=132)
0%
20%
40%
60%
80%
100%
MAA Category 1 MAA Category 2 MAA Category 3
College Algebra II Competency (Institutional Results), Percent of Valid Cases Scoring 60% or Higher
on MAA Category 1, 2 and 3
2011
2012
49% (N=279)
76% (N=193)
17%(N=303)
0%
20%
40%
60%
80%
100%
2009 2011 2012
College Algebra II Competency (Institutional Results), Percent of Valid Cases Scoring 60% or Higher
on the Final Exam
2011-12 Assessment of Quantitative Reasoning: Full Report
32
2011-12 Assessment of Quantitative Reasoning: Full Report
33
2011-12 Assessment of Quantitative Reasoning: Full Report
34
Appendix C. Pre-calculus
60% (N=117)
63% (N=115)
65% (N=85)
53% (N=64)
0%
20%
40%
60%
80%
100%
MAA Category 2 MAA Category 3
Pre-Calculus Competency (Institutional Results), Percent of Valid Cases Scoring 60% or Higher
on MAA Category 2 and 3
2011
2012
25% (N=87)
58% (N=117)
60% (N=149)
56% (N=135)
0%
20%
40%
60%
80%
100%
2009 2010 2011 2012
Pre-Calculus Competency (Institutional Results), Percent of Valid Cases Scoring 60% or Higher on the Final Exam
2011-12 Assessment of Quantitative Reasoning: Full Report
35
2011-12 Assessment of Quantitative Reasoning: Full Report