25
2011 Nielsen Case Competition Competition Guide
2011 Nielsen Case Competition
Competition Guide
1
Welcome
Welcome to the inaugural Nielsen Case Competition at the University of Florida. We’re delighted to have such a diverse and talented group of participants this year. In the dynamic world of global business, leaders must be proactive to stay ahead of customer demands and pressure from competitors. This case competition is designed to enrich and challenge your creativity and problem-solving skills to help prepare you for a career in today’s rapidly changing business environment. I encourage you to take full advantage of this opportunity to dive in, connect and learn. Best of luck, and we look forward to receiving your solutions.
Mitchell J. Habib Chief Operating Officer The Nielsen Company
The Nielsen Company As a global leader in measurement and information, we know that a precise understanding of consumers is the key to making the right decisions to enable profitable growth. At Nielsen, we’re always innovating to keep pace with emerging market trends and the increasingly diverse, demanding and connected consumer.
Our mission is to provide clients the most complete global understanding of what consumers watch and buy. Nielsen provides a suite of global practices and measurement solutions serving the media, entertainment and consumer industries.
After nearly a century, we’re more focused and skilled than ever at providing a complete view of what consumers watch and buy through powerful insights that clarify the relationship between content and commerce. For our clients in media, consumer packaged goods, telecom and advertising, our expansive data and measurement capabilities provide market context and confidence with a long history of innovation and integrity.

2
Competition Guide
This guide includes materials to help student teams prepare for the case competition. The guide covers everything from how to delegate work to what to expect at the competition.
The guide will also ensure that each team has the opportunity to take advantage of all aspects of the competition. The competition offers participants not only great business experience, but also the chance to network with prominent leaders attending the event as judges or as organizers. Students are encouraged to relax and socialize between presentations. Enjoy the experience!
Competition Committee The Nielsen Company
Michaela Barbour, Staffing Partner
Robyn Dow, VP, University Relations
Kathie Miller, SVP, Communications, Global Business Services
Betsy Williams, SVP, Human Resources
University of Florida
Josh Funderburke, Asst. Director of Career & Leadership Programs & SIFE Sam Walton Fellow
Sarah Alexander, Student Director
Alli Dreyer, Student Director
Aly Fernandez, Student Director
Kara Jordan, Student Director
Kenny Merritt, Student Director
Daniel Rybin, Student Director
Kathryn Stolarz, Student Director
3
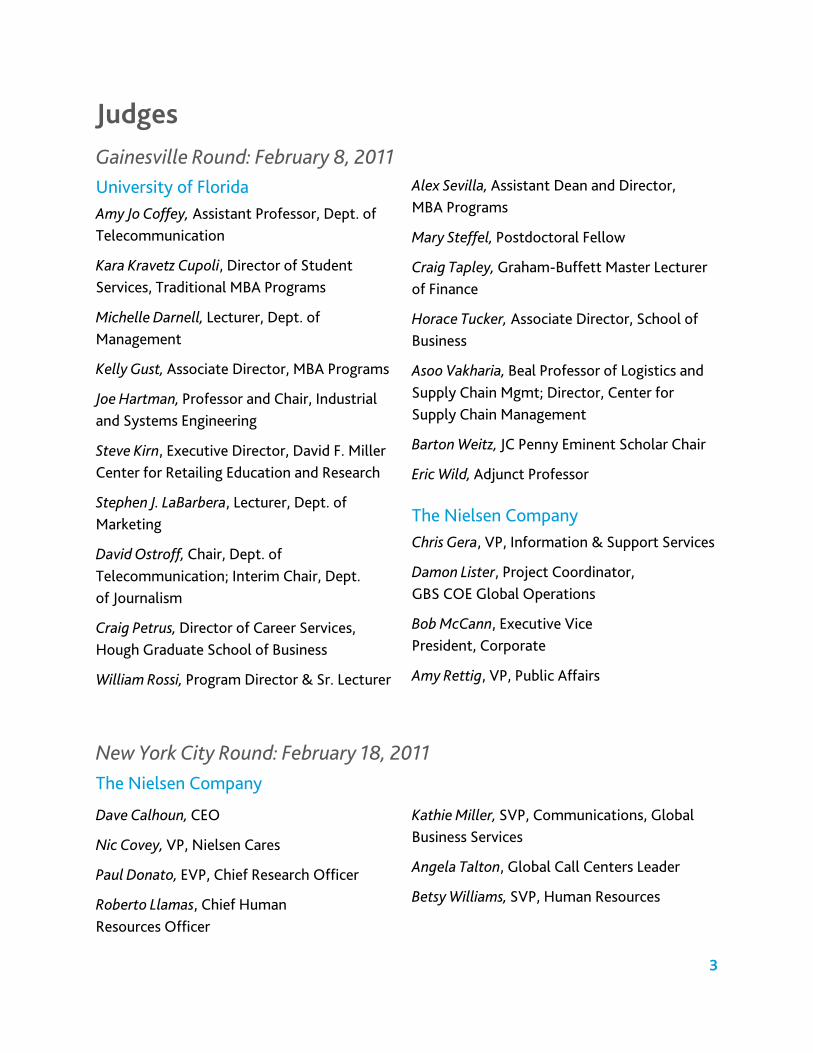
Judges Gainesville Round: February 8, 2011 University of Florida Amy Jo Coffey, Assistant Professor, Dept. of Telecommunication
Kara Kravetz Cupoli, Director of Student Services, Traditional MBA Programs
Michelle Darnell, Lecturer, Dept. of Management
Kelly Gust, Associate Director, MBA Programs
Joe Hartman, Professor and Chair, Industrial and Systems Engineering
Steve Kirn, Executive Director, David F. Miller Center for Retailing Education and Research
Stephen J. LaBarbera, Lecturer, Dept. of Marketing
David Ostroff, Chair, Dept. of Telecommunication; Interim Chair, Dept. of Journalism
Craig Petrus, Director of Career Services, Hough Graduate School of Business
William Rossi, Program Director & Sr. Lecturer
Alex Sevilla, Assistant Dean and Director, MBA Programs
Mary Steffel, Postdoctoral Fellow
Craig Tapley, Graham-Buffett Master Lecturer of Finance
Horace Tucker, Associate Director, School of Business
Asoo Vakharia, Beal Professor of Logistics and Supply Chain Mgmt; Director, Center for Supply Chain Management
Barton Weitz, JC Penny Eminent Scholar Chair
Eric Wild, Adjunct Professor
The Nielsen Company Chris Gera, VP, Information & Support Services
Damon Lister, Project Coordinator, GBS COE Global Operations
Bob McCann, Executive Vice President, Corporate
Amy Rettig, VP, Public Affairs
New York City Round: February 18, 2011 The Nielsen Company
Dave Calhoun, CEO
Nic Covey, VP, Nielsen Cares
Paul Donato, EVP, Chief Research Officer
Roberto Llamas, Chief Human Resources Officer
Kathie Miller, SVP, Communications, Global Business Services
Angela Talton, Global Call Centers Leader
Betsy Williams, SVP, Human Resources
4
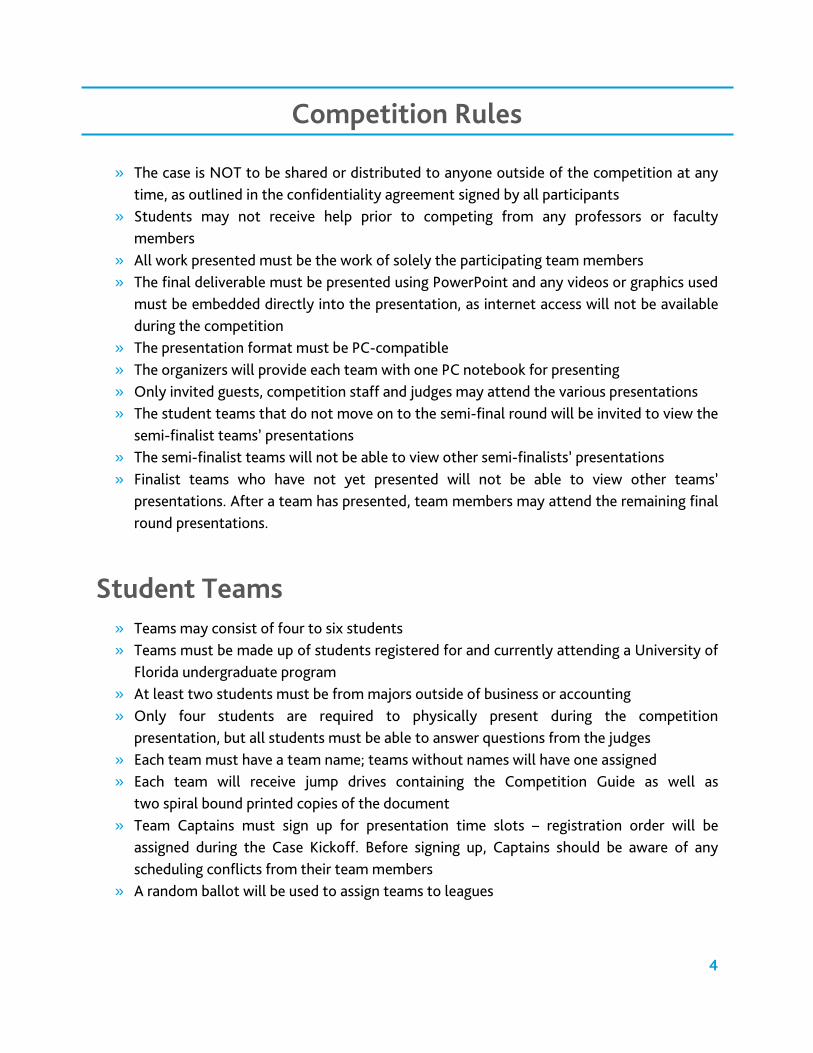
Competition Rules
» The case is NOT to be shared or distributed to anyone outside of the competition at any time, as outlined in the confidentiality agreement signed by all participants
» Students may not receive help prior to competing from any professors or faculty members
» All work presented must be the work of solely the participating team members » The final deliverable must be presented using PowerPoint and any videos or graphics used
must be embedded directly into the presentation, as internet access will not be available during the competition
» The presentation format must be PC-compatible » The organizers will provide each team with one PC notebook for presenting » Only invited guests, competition staff and judges may attend the various presentations » The student teams that do not move on to the semi-final round will be invited to view the
semi-finalist teams’ presentations » The semi-finalist teams will not be able to view other semi-finalists’ presentations » Finalist teams who have not yet presented will not be able to view other teams’
presentations. After a team has presented, team members may attend the remaining final round presentations.
Student Teams » Teams may consist of four to six students » Teams must be made up of students registered for and currently attending a University of
Florida undergraduate program » At least two students must be from majors outside of business or accounting » Only four students are required to physically present during the competition
presentation, but all students must be able to answer questions from the judges » Each team must have a team name; teams without names will have one assigned » Each team will receive jump drives containing the Competition Guide as well as
two spiral bound printed copies of the document » Team Captains must sign up for presentation time slots – registration order will be
assigned during the Case Kickoff. Before signing up, Captains should be aware of any scheduling conflicts from their team members
» A random ballot will be used to assign teams to leagues
5
Question Protocol Any questions regarding the case and/or competition logistics should be sent to
[email protected] Every attempt will be made to provide an answer within 24 hours to the student or team who posed the question. Questions and answers will also be posted on the case competition website:
http://www.nielsen.com/content/corporate/case_competition.html
Final Deliverable » Teams may submit only one final presentation to the judges » The presentation must be in Microsoft PowerPoint » The presentation must be in English
Supplies Laptops and projectors will be provided for the presentations. Teams should bring their presentation on at least two different jump drives, in case there is an issue with one. On February 7 between 7 p.m. and 8 p.m., all teams will have access to the Hilton to view the room size and test their jump drives with the provided laptops.
Prizes
Each participating student, judge and student director will receive a Nielsen gift bag
Each semi-finalist team member will receive a Nielsen fleece
Each finalist team member will receive an iPod Nano, a $100 iTunes gift card and a trip to New York city including transportation, accommodations and meals
The winning team members will receive an Apple iPad and a $200 gift card
6
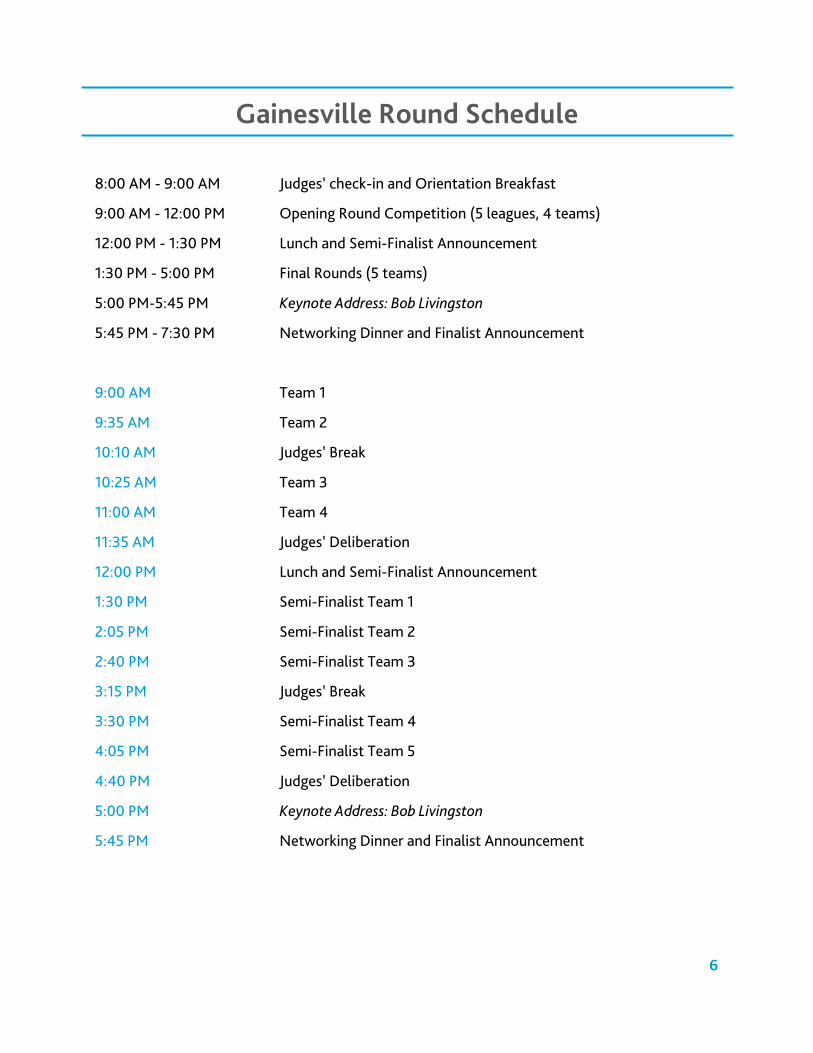
Gainesville Round Schedule
8:00 AM - 9:00 AM Judges’ check-in and Orientation Breakfast
9:00 AM - 12:00 PM Opening Round Competition (5 leagues, 4 teams)
12:00 PM - 1:30 PM Lunch and Semi-Finalist Announcement
1:30 PM - 5:00 PM
5:00 PM-5:45 PM
Final Rounds (5 teams)
Keynote Address: Bob Livingston
5:45 PM - 7:30 PM Networking Dinner and Finalist Announcement
9:00 AM Team 1
9:35 AM Team 2
10:10 AM Judges’ Break
10:25 AM Team 3
11:00 AM Team 4
11:35 AM Judges’ Deliberation
12:00 PM Lunch and Semi-Finalist Announcement
1:30 PM Semi-Finalist Team 1
2:05 PM Semi-Finalist Team 2
2:40 PM Semi-Finalist Team 3
3:15 PM Judges’ Break
3:30 PM Semi-Finalist Team 4
4:05 PM Semi-Finalist Team 5
4:40 PM Judges’ Deliberation
5:00 PM Keynote Address: Bob Livingston
5:45 PM Networking Dinner and Finalist Announcement
7
Keynote Address Today’s graduates will enter into a world of uncertainty. You will be impacted by the remains of the recession, the resultant poor job market and your needs for future earnings. All of these conditions impact how you will need to prepare for business life in a competitive and ever-changing world. It will be essential for you to work hard at uncovering your path to differentiation:
» Competition for initial jobs is unprecedented. » Advancement in careers is very competitive. » Your work skills (“What You Do”) will be the cost
of entry. » But, the ultimate differentiator will be
“How you do What you do.” This suggests a strong focus is necessary on an individual behavior, attitude, beliefs and how you interact with others. The good news is, if you understand these conditions and prepare yourself properly to compete, you will not only survive, you could thrive!
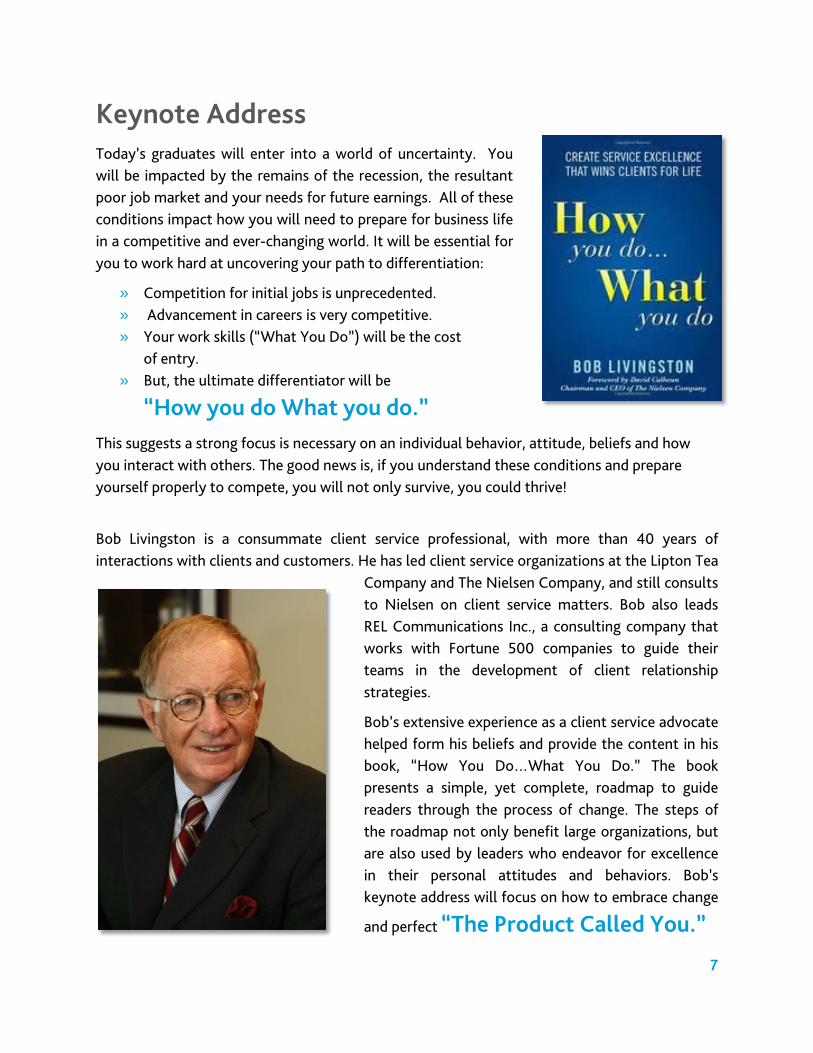
Bob Livingston is a consummate client service professional, with more than 40 years of interactions with clients and customers. He has led client service organizations at the Lipton Tea
Company and The Nielsen Company, and still consults to Nielsen on client service matters. Bob also leads REL Communications Inc., a consulting company that works with Fortune 500 companies to guide their teams in the development of client relationship strategies.
Bob’s extensive experience as a client service advocate helped form his beliefs and provide the content in his book, “How You Do…What You Do.” The book presents a simple, yet complete, roadmap to guide readers through the process of change. The steps of the roadmap not only benefit large organizations, but are also used by leaders who endeavor for excellence in their personal attitudes and behaviors. Bob’s keynote address will focus on how to embrace change
and perfect “The Product Called You.”
8
Gainesville Round Logistics » The day of the competition, students will check-in at least 30 minutes prior their
assigned presentation time and will be given a final itinerary for the day’s events and a Nielsen Case Competition gift bag
» Each round will run as follows: • 10 minutes: Presentation set-up • 15 minutes: Uninterrupted presentation • 10 minutes: Q&A
» There will be a holding area for idle teams » During free time between presentations, groups have may practice their presentations » Each team will prepare and distribute printed handouts of presentation slides to judges » During the first round of the competition, teams will submit their PowerPoint slides to
the organizers immediately following their presentation » Teams are not permitted to revise their slides at any point after the first presentation » All students are invited to attend lunch at 12:30, during which the competition
committee will announce which five teams will advance to the semi-final round » All students are invited and encouraged to attend the keynote address at 5:00 » All semi-finalists are invited to attend dinner at 5:45, during which the competition
committee will announce which three teams will advance to the final round of competition in New York City
» Immediately following dinner, the three finalist teams should meet with Robyn Dow to discuss logistics for the next round
9
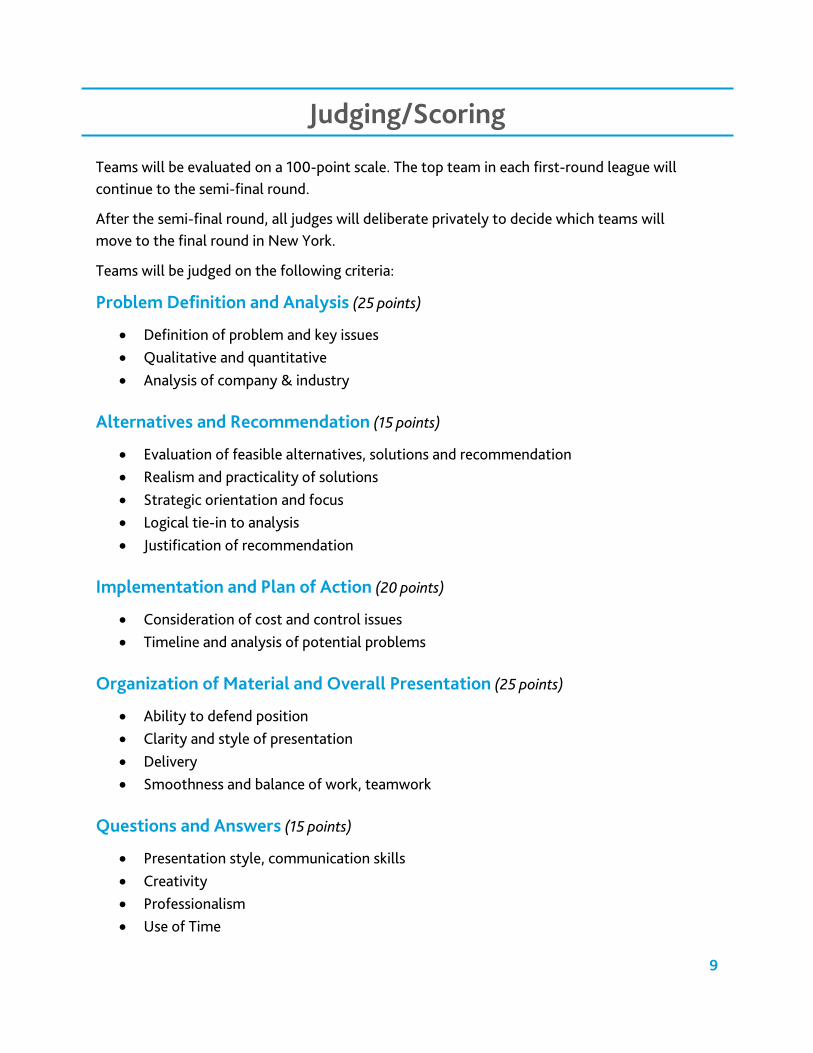
Judging/Scoring
Teams will be evaluated on a 100-point scale. The top team in each first-round league will continue to the semi-final round.
After the semi-final round, all judges will deliberate privately to decide which teams will move to the final round in New York.
Teams will be judged on the following criteria:
Problem Definition and Analysis (25 points)
• Definition of problem and key issues • Qualitative and quantitative • Analysis of company & industry
Alternatives and Recommendation (15 points)
• Evaluation of feasible alternatives, solutions and recommendation • Realism and practicality of solutions • Strategic orientation and focus • Logical tie-in to analysis • Justification of recommendation
Implementation and Plan of Action (20 points)
• Consideration of cost and control issues • Timeline and analysis of potential problems
Organization of Material and Overall Presentation (25 points)
• Ability to defend position • Clarity and style of presentation • Delivery • Smoothness and balance of work, teamwork
Questions and Answers (15 points)
• Presentation style, communication skills • Creativity • Professionalism • Use of Time
10
How to Approach the Case Please remember that Nielsen’s senior management is already working on the issues in the case. We do not want a laundry list of things we should do. We want you to identify a small number of potential initiatives that reflect deep and careful analysis.
There is no prescribed method for dividing the work of preparing the case analysis. One approach is detailed below, but teams are encouraged to work through the case using the method that best fits members’ strengths and preferences.
Dividing the Work Each team member should have a role on the team. It is the captain’s responsibility to guide the team in defining and assigning roles. One approach might include defining roles based the judging criteria, which include:
1. Introduction, key issues, problem statement 2. Analysis 3. Alternatives and recommendation 4. Implementation 5. Financial analysis, conclusion
Problem Statement: The key issues and problem should be clearly stated.
Analysis: The environmental, economical, financial, and political factors of the case should be reviewed in terms of relevancy to the key issues. The analysis should evaluate both external and internal factors. A SWOT analysis is one way participants could review the organization.
Alternatives: Normally, two to three alternatives should be analyzed. The recommended alternative should address the key issues and solve the problem stated.
Implementation: The implementation is an action plan that will be used to execute the recommendation. The implementation must fit the organization and should be attainable. The implementation should address all areas of the organization, including operations, marketing, human resources and finance. The plan should have a timeline and a breakdown of the costs associated with implementation.
Financials: The case should address how the recommendation will affect the organization financially. If the case study does not provide any financial data, students should still address how the plan will generally affect the organization’s finances without using specific numbers. Items that may be included in this section include share price, profits, revenue, expenses, IRR and NPV. Financials presented should be realistic and based on factual information from the case.
11
Presenting When entering the presentation room, team members should introduce themselves to the judges and quickly take their positions. Prior to presenting, it is suggested that the team designates a member or members to change slides. There should be balance and flow between presenters. Practicing these transitions can be as important as the presentation itself. Sloppy or awkward transitions are distracting and show a lack of preparation to the judges. A minimum of four members of the team should present the case, and all team members should be available to answer questions.
Question Period When the team has completed the presentation, all members should stand and wait for the judges to begin the question period. When a judge asks a question, be careful that several team members do not jump in to answer. Team members should discuss prior to the presentation who will answer certain categories of questions. If the question is unclear, ask for clarification before trying to present an answer.
After a team member has answered a question, a follow up answer should only be given by another member of the team if it will add value to what was already said. Teams must also ensure that they do not contradict each other while answering questions.
At no time should a team argue with a judge. Many times judges will tell teams they do not agree at all with the solution presented. Some may even tell the team that they are wrong. When this occurs, becoming confrontational will only hurt the team. It is this time when confidence in the solution must be presented. Teams should support their answers, but should do so by revisiting the facts they presented and assuring the judge that the chosen plan is the optimal solution to the problem.
Teams should also pay attention to the body language of the judges. When a judge begins to nod their head in agreement or present other body language that sends similar signals, the person answering the question should wrap up and allow for the next question to be asked. The objective is to efficiently answer questions in the 10-minute period.
Attire It is important to dress professionally while participating in the competition. Business professional attire is required. It is important that team members not only wear professional clothing, but that they are comfortable in their attire.
12
The First Presentation If this is your first case competition, you may be understandably nervous about the challenging and fast-paced day. Each team can get off to a good start by securing a game plan prior to leaving for the competition. Sometimes the excitement and adrenaline of competing can lead to teams becoming disorganized and unfocused. To combat this, the team should gather and communicate their thoughts prior to entering the preparation room. Before presenting, teams might consider practicing a team ritual (a pre-case cheer, a moment of silence or top 5 keys to success, etc.) to help presenters relax and mentally prepare.
Communication is the key component that will allow teams to stay on track and complete the presentation to the best of their abilities. Vocalizing during practice if a plan is going off track can jolt the team back on track. Communicating key information such as time remaining, potential roadblocks or new information will allow all members to fully prepare for the presentation and work as a strong unit.
The most important thing to remember about presenting is to leave the outcome in the presentation room. Premature celebration or feelings of doubt may cause teams to lose sight of their strategies and not succeed in the competition. Whether teams win or lose, work well or poorly together, every participant will gain valuable experience from the competition.
Winning and Losing In every competition, some teams will win, some will lose and some will experience both outcomes. This section of the guide is not aimed at teaching teams how to do either in terms of strategy or preparation; rather it is designed to help teams to win and lose gracefully, and learn from each experience.
Whether it is the first win or the fourth in a row, teams should understand that there is a proper way to celebrate. Over-celebrating will give the impression that the winning team is not respectful of the teams they competed against. Showing class and respect to all teams is a contributing factor towards a team’s competition scores.
Losing should also be handled appropriately. Review the loss and pick out areas where the team could have approached the case differently to produce a better result. Many times, both teams present a strong case and the judges’ decisions are the result of one particular point. Therefore, a loss does not mean the losing team did not present a good solution to a case, it simply means the other team performed slightly better. After the results are posted, teams can review the judges’ comments and determine how they can perform better at the next case. Whether a team goes undefeated or loses, every participant will leave with a greater ability to tackle the issues that will face them in their careers.
2011 Nielsen Case Competition
Case Study
1
Winning Online With Social Networks
Background The U.S. television industry generates approximately $80 billion in advertising revenue each year. Roughly half of that amount is derived from national advertising and half is derived from local market advertising. Nielsen still uses weekly household diaries to measure viewership in 185 of 210 local U.S. television markets, and in approximately 150 of these, the Diary is the sole source of measurement. As the television environment grows more complex, mobile, fragmented and time-shifted, the Diary becomes more limited in its ability to measure this environment. A more detailed description of the Nielsen Diary Service is contained in Exhibit 1.
Consequently, The Nielsen Company is exploring alternative methods to measure the demographics of television viewers in local markets. Exhibit 2 provides a more complete situation analysis and a comprehensive background to the importance of this initiative.
Nielsen is currently testing the use of server data from cable and satellite companies as a means of measuring household tuning. There are no personal or household demographics associated with such server-based data, so an additional source is needed to provide the associated demographic information. The company wishes to explore the use of social networks as a research tool that might someday replace the Diary as a medium for measuring local television demographics. Exhibit 3 provides background information on Nielsen’s efforts to utilize server (Set Top Box) information to compute ratings.
Facebook, for example, is the largest social networking site (SNS) in the United States. According to Facebook, “The Social Network” has more than 500 million (approaching 600 million) active users worldwide — more than 200 million of whom access the site through their mobile devices—spending over 700 billion minutes per month on the site. Half of all Facebook users log on every day. The business strategies of companies such as Facebook often envision the entities not just as social networks, but as emerging and dominant communications platforms. For example, many businesses now tell customers to “Find us on Facebook,” rather than driving traffic directly to their own websites.
Telecommunications is evolving from one-to-one electronic communication to a system of many-to-many communications. The question is: Can many-to-many communications
The Big Question: How should Nielsen utilize social networks as a research medium – specifically one that
can help replace the Diary as a medium for measuring local television?
2
networks be used to measure who is watching which programs in a local market? Information gathered from social networks could be used to complement cable and satellite server data, and would serve two key functions: 1) it would provide demographics and other personal data about the viewers of programs, and 2) it would provide a means of correcting biases known to exist in the cable and satellite databases (for example, viewing on non-cable sets or in non- cable homes).
The Case Opportunity Teams should develop a business plan for Nielsen’s television division to create a research platform on Facebook that will supplement server-based Set Top Box data as a measure of viewing that is not captured in those databases. The platform should collect demographic information and other characteristics of local market television viewers.
Given access to necessary costs and performance data associated with the current Diary service, teams should establish the business rationale and outline key elements of a strategic plan for Nielsen Media Research to solve this measurement problem in a cost effective way. In addition to an aggressive measurement component, the plan must contain a marketing and communications strategy, including the use of validation studies and client acceptance.
Key Questions to Address » How should Nielsen sample Facebook and adjust for biases that may exist in the
Facebook universe? » How should Nielsen structure the media exposure questions? (How long? How often?
Do you ask about content?) » How should Nielsen integrate Facebook survey data with server-based data?
Exhibit 4 illustrates how the current Diary sample is integrated with meter samples in the 30 Meter/Diary markets that use both data sources.
» How can Nielsen drive a representative sample of people to the measurement site? » Should Nielsen maintain panelists over a period of time, carefully balancing
demographics and other characteristics? » Are there opportunities to add value to the data by collecting behavioral information,
but in a way that complies with privacy policies? » In what ways can Nielsen leverage technology to win? » What organizational considerations should be addressed?
3
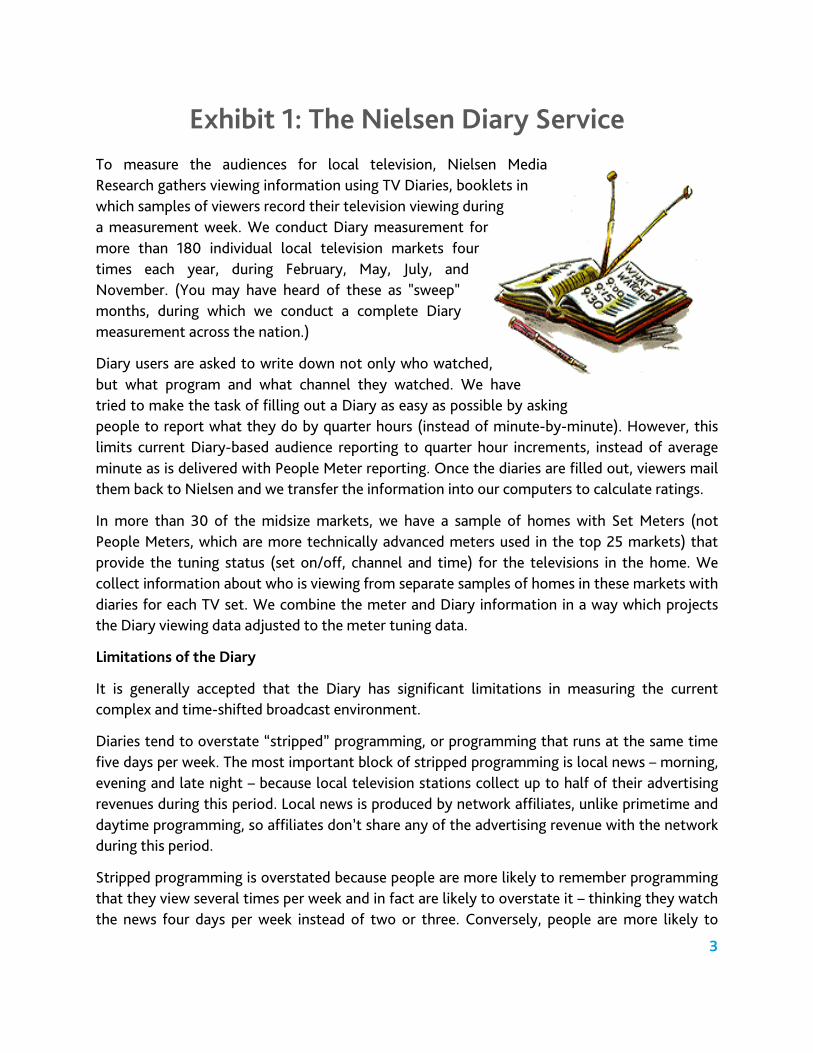
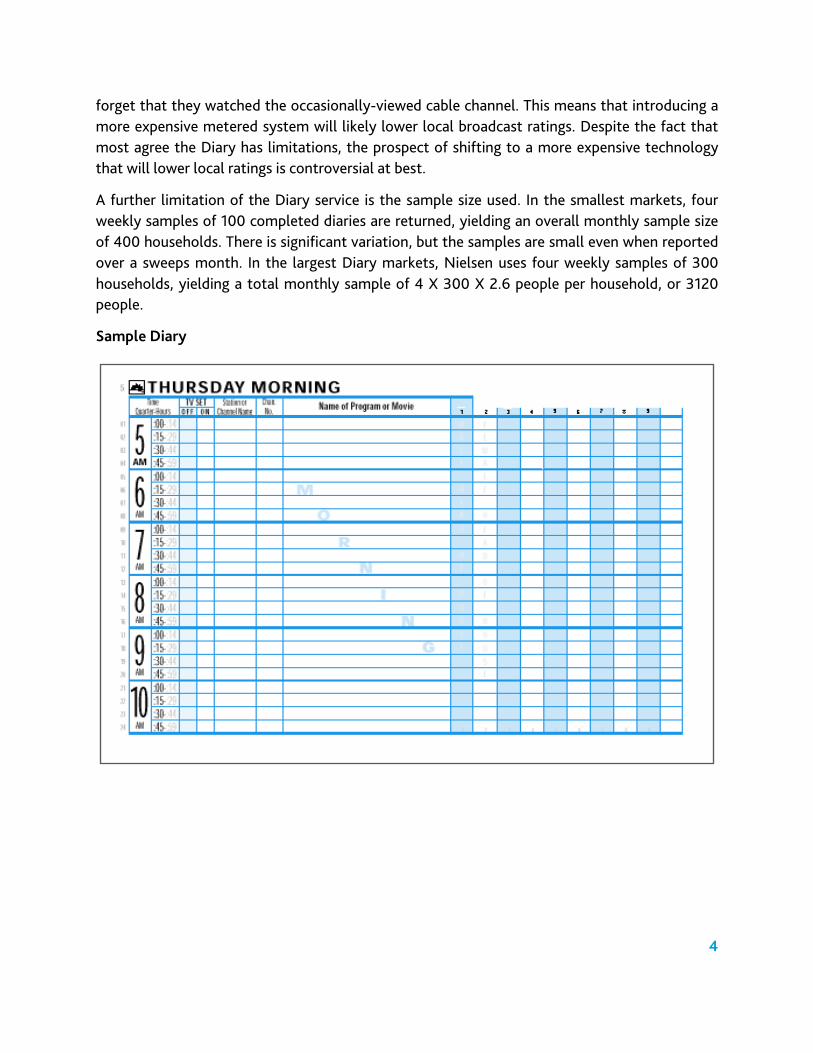
Exhibit 1: The Nielsen Diary Service To measure the audiences for local television, Nielsen Media Research gathers viewing information using TV Diaries, booklets in which samples of viewers record their television viewing during a measurement week. We conduct Diary measurement for more than 180 individual local television markets four times each year, during February, May, July, and November. (You may have heard of these as "sweep" months, during which we conduct a complete Diary measurement across the nation.) Diary users are asked to write down not only who watched, but what program and what channel they watched. We have tried to make the task of filling out a Diary as easy as possible by asking people to report what they do by quarter hours (instead of minute-by-minute). However, this limits current Diary-based audience reporting to quarter hour increments, instead of average minute as is delivered with People Meter reporting. Once the diaries are filled out, viewers mail them back to Nielsen and we transfer the information into our computers to calculate ratings.
In more than 30 of the midsize markets, we have a sample of homes with Set Meters (not People Meters, which are more technically advanced meters used in the top 25 markets) that provide the tuning status (set on/off, channel and time) for the televisions in the home. We collect information about who is viewing from separate samples of homes in these markets with diaries for each TV set. We combine the meter and Diary information in a way which projects the Diary viewing data adjusted to the meter tuning data. Limitations of the Diary
It is generally accepted that the Diary has significant limitations in measuring the current complex and time-shifted broadcast environment.
Diaries tend to overstate “stripped” programming, or programming that runs at the same time five days per week. The most important block of stripped programming is local news – morning, evening and late night – because local television stations collect up to half of their advertising revenues during this period. Local news is produced by network affiliates, unlike primetime and daytime programming, so affiliates don’t share any of the advertising revenue with the network during this period.
Stripped programming is overstated because people are more likely to remember programming that they view several times per week and in fact are likely to overstate it – thinking they watch the news four days per week instead of two or three. Conversely, people are more likely to
4
forget that they watched the occasionally-viewed cable channel. This means that introducing a more expensive metered system will likely lower local broadcast ratings. Despite the fact that most agree the Diary has limitations, the prospect of shifting to a more expensive technology that will lower local ratings is controversial at best.
A further limitation of the Diary service is the sample size used. In the smallest markets, four weekly samples of 100 completed diaries are returned, yielding an overall monthly sample size of 400 households. There is significant variation, but the samples are small even when reported over a sweeps month. In the largest Diary markets, Nielsen uses four weekly samples of 300 households, yielding a total monthly sample of 4 X 300 X 2.6 people per household, or 3120 people.
Sample Diary
5
Exhibit 2: Situation Analysis During the last six years, Nielsen has replaced the Diary with the People Meter in the top 25 U.S. markets. People Meters are the global standard, although many companies including Nielsen are searching for more passive ways to measure people. The national consists of about 25,000 households drawn from these markets and a significant sample in the balance of the country. Client and advertiser satisfaction with the national service is generally good, since the samples are large and representative and the technology is state of the art.
However, there is significant dissatisfaction with the Diary as a measurement tool, especially among buyers of television advertising. It is generally thought to be inaccurate, as Diary keepers cannot consistently remember the programs they watch in the new media environment with hundreds of channels and DVR time-shifting. That said, converting Diary markets or meter/Diary markets to People Meters has been difficult for two significant reasons: 1) cost, and 2) perceived impact to the business.
The structure of television markets is such that there are many local markets with fewer than 500,000 households. This is because television and radio were established by the Communications Act of 1934 to be local mediums serving the information needs of a very tight community. Due to their small size, there is limited advertising revenue to support measurement in local markets. In addition, the cost of People Meters is several times the cost of Diary measurements. The field costs alone may be more than $5,000 per year for a People Meter home and only $100 per home for Diary service. Television stations in small markets simply cannot afford the costs of metered service.
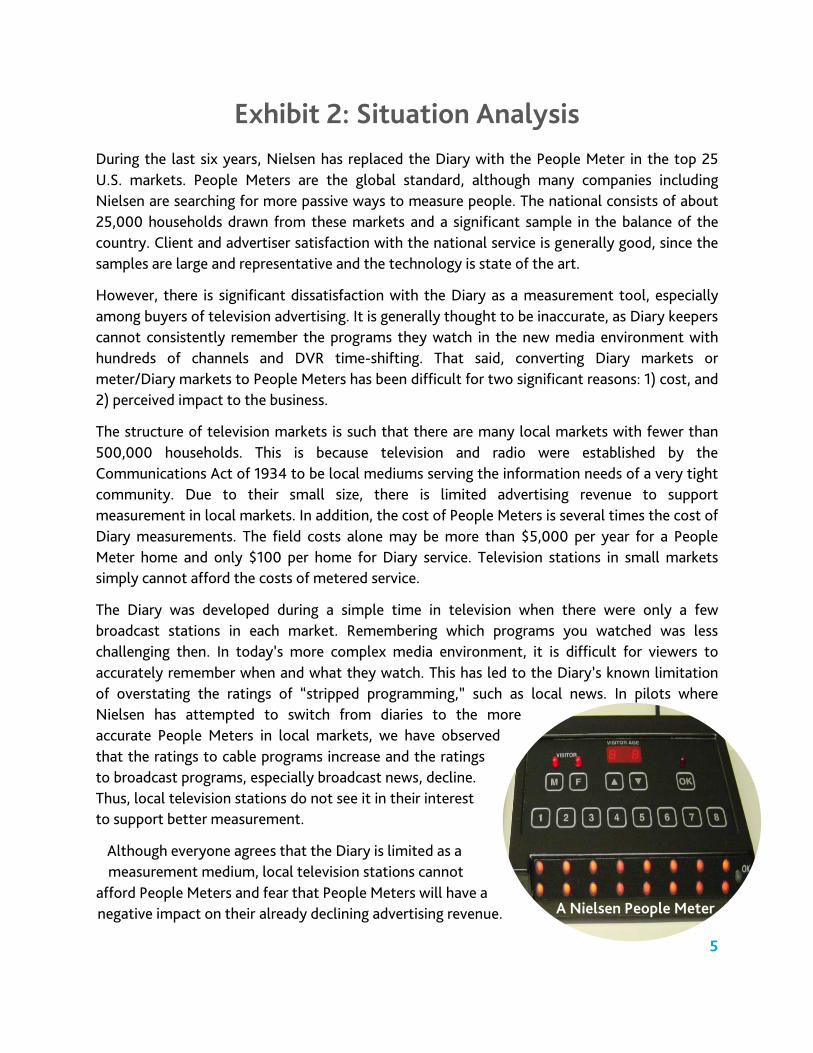
The Diary was developed during a simple time in television when there were only a few broadcast stations in each market. Remembering which programs you watched was less challenging then. In today’s more complex media environment, it is difficult for viewers to accurately remember when and what they watch. This has led to the Diary’s known limitation of overstating the ratings of “stripped programming,” such as local news. In pilots where Nielsen has attempted to switch from diaries to the more accurate People Meters in local markets, we have observed that the ratings to cable programs increase and the ratings to broadcast programs, especially broadcast news, decline. Thus, local television stations do not see it in their interest to support better measurement.
Although everyone agrees that the Diary is limited as a measurement medium, local television stations cannot
afford People Meters and fear that People Meters will have a negative impact on their already declining advertising revenue. A Nielsen People Meter
6
Exhibit 3: Using Server (Set Top Box) Data to Compute Ratings
Nielsen is aggressively seeking ways to replace Diary measurement of television behavior for the reasons listed throughout this case. The most promising technique involves utilizing data from cable and satellite companies to generate household audiences and using another method (apart from diaries) to assign the age and sex demographics to those audiences.
In the ideal system, Nielsen would acquire the rights to access approximately 1,000 to 3,000 households per market from each of the major video providers (cable and satellite) and would use the tuning information recorded on the servers of these providers to compute household ratings. This must be done in accordance with the company’s privacy policy.
The cable and satellite servers are known to be imperfect – not all televisions in each home return data to the server, it is often impossible to determine if a set is actually on or off and many less advanced cable homes do not provide any data at all. All these biases must be estimated and corrected by models based on the National and Local People Meter services.
An additional significant limitation of server-based data is that no estimates of demographics are available. The server data can be used to create overall household tuning levels – that is, what channels people were watching – but we need to explore alternatives to measuring who actually watched the programs.
To date, a few methods have been proposed: 1) online measurement, 2) a simplified log (Diary), 3) mobile phone-based panels that could be pinged periodically for viewing within the last hour, and 4) Surveys on Facebook or Facebook Mobile to determine demographic audiences of local television viewing.
None of these options will be simple to accomplish. There are indeed biases to each one, and effectively controlling and correcting for these biases will be the key to finding an alternative to the Diary.
7
Exhibit 4: Meter Diary Integration The current method for integrating Set Meter (tuning) data with Diary (demographic) data is simple and straight-forward. The procedure is analogous to the issue that will be faced when trying to integrate Facebook or online-based persons viewing (demographic data) with the household tuning estimates derived from servers. There are several integration techniques that could be used, but for the purposes of this case, it will be useful to understand how tuning and demographics are currently integrated.
Meter/Diary adjustment is a simple ratio adjustment:
For each quarter, and a limited number of demographic cells (e.g, age head of household < 35), we take the ratio:
Meter Household Rating (station quarter hour) Diary Household Rating (station quarter hour)
And multiply that ratio by the
Persons Rating (station quarter hour)
To achieve a meter-adjusted persons demographic rating for each demographic building block.
Demographic building blocks may include the following categories: Men 2-5 Men 6-11 Men 12 – 17 ….. Men 55 – 64 Men 65+ Women 2-5 Women 6-11 Women 12 – 17 ….. Women 55 – 64 Women 65+ A complete description of this procedure is available in the reference manual (provided on request). However, the formula presented above describes conceptually how the adjustment works. In words: for each quarter hour and each station rating (a legacy of the Diary), we compute the ratio of the Meter Household rating to the Diary Household rating. If the Meter Household rating is 20% higher than the Diary, that suggests that the Diary underestimates tuning by 20%. So, we apply this 20% (or other percentage) adjustment to the basic Persons Rating (e.g. Men 18-24). The adjustment will raise the M18-24 rating for that station quarter hour by 20%, which is the estimate of the undercount in the Diary for that station quarter hour, as calculated by the household ratio.
There are many statistical ways to make such an adjustment; this is one of the simplest and has been employed in the Meter/Diary services for more than 30 years.
8
Exhibit 5: Reference Documents
1. Local Reference Supplement: This is a detailed technical description of all components of our local measurement service. The document describes People Meter methodology, Set Meter and Diary methodology and Diary-only methods. This attachment was e-mailed to all teams.
2. Reno Market Viewers in Profile: This is the latest Reno Market Ratings Book. It provides you with a technical and demographic description of the Reno, NV market as well as an illustration of the Diary-level person’s ratings. This attachment was e-mailed to all teams.
3. Comparison of Set Top Box ratings and Diary ratings for the Reno market. (See Exhibit 6.)
9
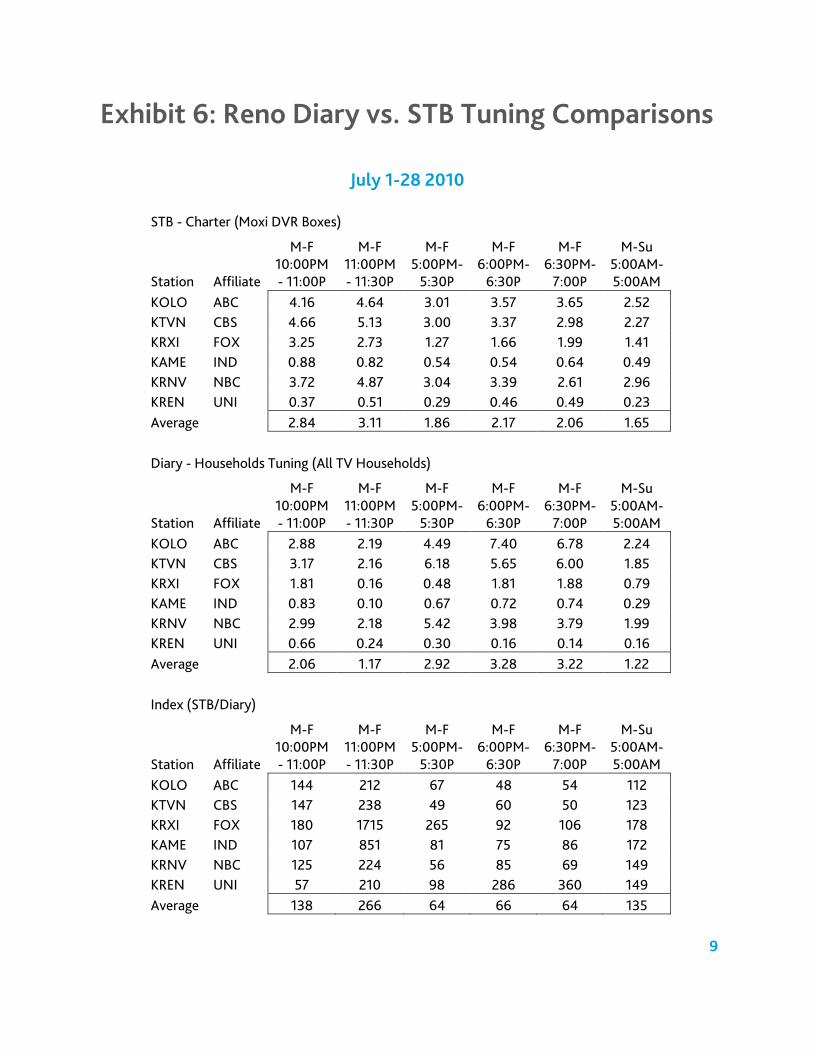
Exhibit 6: Reno Diary vs. STB Tuning Comparisons
July 1-28 2010
STB - Charter (Moxi DVR Boxes)
Station Affiliate
M-F 10:00PM - 11:00P
M-F 11:00PM - 11:30P
M-F 5:00PM-
5:30P
M-F 6:00PM-
6:30P
M-F 6:30PM-
7:00P
M-Su 5:00AM-5:00AM
KOLO ABC 4.16 4.64 3.01 3.57 3.65 2.52 KTVN CBS 4.66 5.13 3.00 3.37 2.98 2.27 KRXI FOX 3.25 2.73 1.27 1.66 1.99 1.41 KAME IND 0.88 0.82 0.54 0.54 0.64 0.49 KRNV NBC 3.72 4.87 3.04 3.39 2.61 2.96 KREN UNI 0.37 0.51 0.29 0.46 0.49 0.23 Average
2.84 3.11 1.86 2.17 2.06 1.65
Diary - Households Tuning (All TV Households)
Station Affiliate
M-F 10:00PM - 11:00P
M-F 11:00PM - 11:30P
M-F 5:00PM-
5:30P
M-F 6:00PM-
6:30P
M-F 6:30PM-
7:00P
M-Su 5:00AM-5:00AM
KOLO ABC 2.88 2.19 4.49 7.40 6.78 2.24 KTVN CBS 3.17 2.16 6.18 5.65 6.00 1.85 KRXI FOX 1.81 0.16 0.48 1.81 1.88 0.79 KAME IND 0.83 0.10 0.67 0.72 0.74 0.29 KRNV NBC 2.99 2.18 5.42 3.98 3.79 1.99 KREN UNI 0.66 0.24 0.30 0.16 0.14 0.16 Average
2.06 1.17 2.92 3.28 3.22 1.22
Index (STB/Diary)
Station Affiliate
M-F 10:00PM - 11:00P
M-F 11:00PM - 11:30P
M-F 5:00PM-
5:30P
M-F 6:00PM-
6:30P
M-F 6:30PM-
7:00P
M-Su 5:00AM-5:00AM
KOLO ABC 144 212 67 48 54 112 KTVN CBS 147 238 49 60 50 123 KRXI FOX 180 1715 265 92 106 178 KAME IND 107 851 81 75 86 172 KRNV NBC 125 224 56 85 69 149 KREN UNI 57 210 98 286 360 149 Average
138 266 64 66 64 135
10
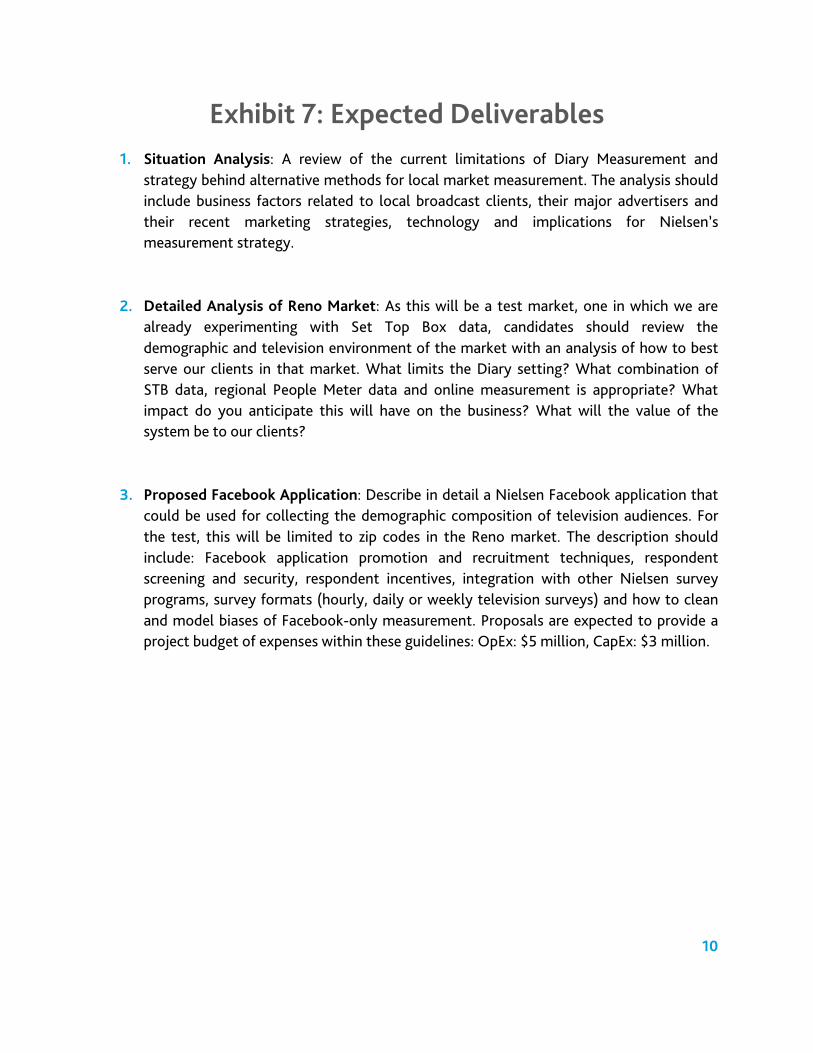
Exhibit 7: Expected Deliverables 1. Situation Analysis: A review of the current limitations of Diary Measurement and
strategy behind alternative methods for local market measurement. The analysis should include business factors related to local broadcast clients, their major advertisers and their recent marketing strategies, technology and implications for Nielsen’s measurement strategy.
2. Detailed Analysis of Reno Market: As this will be a test market, one in which we are already experimenting with Set Top Box data, candidates should review the demographic and television environment of the market with an analysis of how to best serve our clients in that market. What limits the Diary setting? What combination of STB data, regional People Meter data and online measurement is appropriate? What impact do you anticipate this will have on the business? What will the value of the system be to our clients?
3. Proposed Facebook Application: Describe in detail a Nielsen Facebook application that could be used for collecting the demographic composition of television audiences. For the test, this will be limited to zip codes in the Reno market. The description should include: Facebook application promotion and recruitment techniques, respondent screening and security, respondent incentives, integration with other Nielsen survey programs, survey formats (hourly, daily or weekly television surveys) and how to clean and model biases of Facebook-only measurement. Proposals are expected to provide a project budget of expenses within these guidelines: OpEx: $5 million, CapEx: $3 million.

The Nielsen Company770 BroadwayNew York, NY 10003-9595
www.nielsen.com
Copyright © 2011 The Nielsen Company. All rights reserved.Nielsen and the Nielsen logo are trademarks of The Nielsen Company


