29
Chicago Depar tment of Transportation CITY OF CHICAGO 2011 PEDESTRIAN CRASH ANALYSIS SUMMARY REPORT
| Date post: | 03-Apr-2018 |
| Category: |
Documents |
| Upload: | chicago-dept-of-transportation |
| View: | 215 times |
| Download: | 0 times |

7/28/2019 2011 Pedestrian Crash Analysis Summary Report
http://slidepdf.com/reader/full/2011-pedestrian-crash-analysis-summary-report 1/29
Chicago Department of Transportation
CITY OF CHICAG
2011 PEDESTRIAN CRASH ANALYS
SUMMARY REPO

7/28/2019 2011 Pedestrian Crash Analysis Summary Report
http://slidepdf.com/reader/full/2011-pedestrian-crash-analysis-summary-report 2/29
2011 Psra Cras Aass
City of Chicago
CITY OF CHICAGO
2011 PEDESTRIAN CRASH ANALYSIS
(2005-2009 Crash Data)
Summary Report
This document was prepared by T.Y. Lin Internaonal at the direcon of
the Chicago Department of Transportaon. The following persons wereinstrumental in preparing this document.
Chicago Department of Transportaon
Division of Project Development
Luann Hamilton
Chris Wuellner
Kiersten Grove
T.Y. Lin Internaonal
Jim Considine, AICP, PTP
Stacey Meekins, AICP
Mike Amsden, AICP
Nicole Cambridge
Michelle Arnold
Hana Manal
Center for Educaon and Research in Safety
Ron Van Houten
7/28/2019 2011 Pedestrian Crash Analysis Summary Report
http://slidepdf.com/reader/full/2011-pedestrian-crash-analysis-summary-report 3/29
Department of Transportaon
Sar Rpor
Contents
Pedestrian Safety In Chicago ................................................1
Ongoing Pedestrian Programs ......................................2
Pedestrian Crash Trends .......................................................3
Key Findings ..................................................................6
Who Was Involved in Pedestrian Crashes ............................8
Pedestrian Age ..............................................................8
Pedestrian Gender ........................................................9
Pedestrian Race and Ethnicity ..................................10
When Did Pedestrian Crashes Occur ..................................12
Day of Week ...............................................................12
Time of Day .................................................................12
Where Did Pedestrian Crashes Occur .................................14
Central Business District (CBD) ...................................14
Chicago Neighborhoods .............................................15
Intersecons ...............................................................19
CTA Staons ................................................................20
Crime ..........................................................................21
Pedestrian Crash Types .......................................................22
Failure to Yield ............................................................22
Turning Vehicles at Signalized Intersecons ...............22
Hit and Run Crashes .................................................23
Roadway Characteriscs .....................................................23
Roadway Classicaon................................................23
Crossing Locaon .....................................................23
Next Steps ..........................................................................24

7/28/2019 2011 Pedestrian Crash Analysis Summary Report
http://slidepdf.com/reader/full/2011-pedestrian-crash-analysis-summary-report 4/29
2011 Psra Cras Aass
City of Chicago
1
Pedestrian Safety In Chicago
Pedestrian acvity is an essenal part of Chicago’s vibrancy. It livens our
streets and neighborhoods, strengthens local businesses, creates safer neigh-borhoods, provides access to jobs, and leads to healthier Chicagoans. Given
these benets, it is important that we ensure our streets are comfortable and
safe for all users. A crical component of this is pedestrian safety. The City,
residents, visitors, businesses, and community groups must ensure everyone
can travel safely. This shared responsibility relates to how we drive, travel as
pedestrians, design our streets, and enforce our trac laws.
The City of Chicago, Chicago Department of Transportaon (CDOT), and Chi-
cago Police Department (CPD) have a number of ongoing eorts aimed at im-
proving pedestrian safety. These eorts include outreach and policy eorts,
enforcement iniaves, and engineering and design improvements.
To further inform pedestrian safety eorts, CDOT has completed an extensive
pedestrian crash analysis. This analysis included all collisions in Chicago from
2005 through 2009 that involved a pedestrian and a motor vehicle in which
the pedestrian was the rst point of contact for the vehicle1. Specic crash
factors and characteriscs were analyzed to determine populaons who were
involved in pedestrian crashes, when and where pedestrian crashes occurred,
and the contribung factors related to pedestrian crash-
es.
This analysis will be ulized to guide the development of
Chicago’s upcoming Pedestrian Plan and public aware-
ness campaign. The ndings within this report will help
inform the Plan’s goals and objecves and will provide
fundamental informaon needed to make sound, data-
driven policies and programming decisions.
1 Note: 2005 data were originally geocoded in a dierent coordinate system. Some
anomalies in the data may exist as a result.
The pedestrian crash
analysis is the rst stepin the Pedestrian Plan
7/28/2019 2011 Pedestrian Crash Analysis Summary Report
http://slidepdf.com/reader/full/2011-pedestrian-crash-analysis-summary-report 5/29
Department of Transportaon
Sar Rpor 2
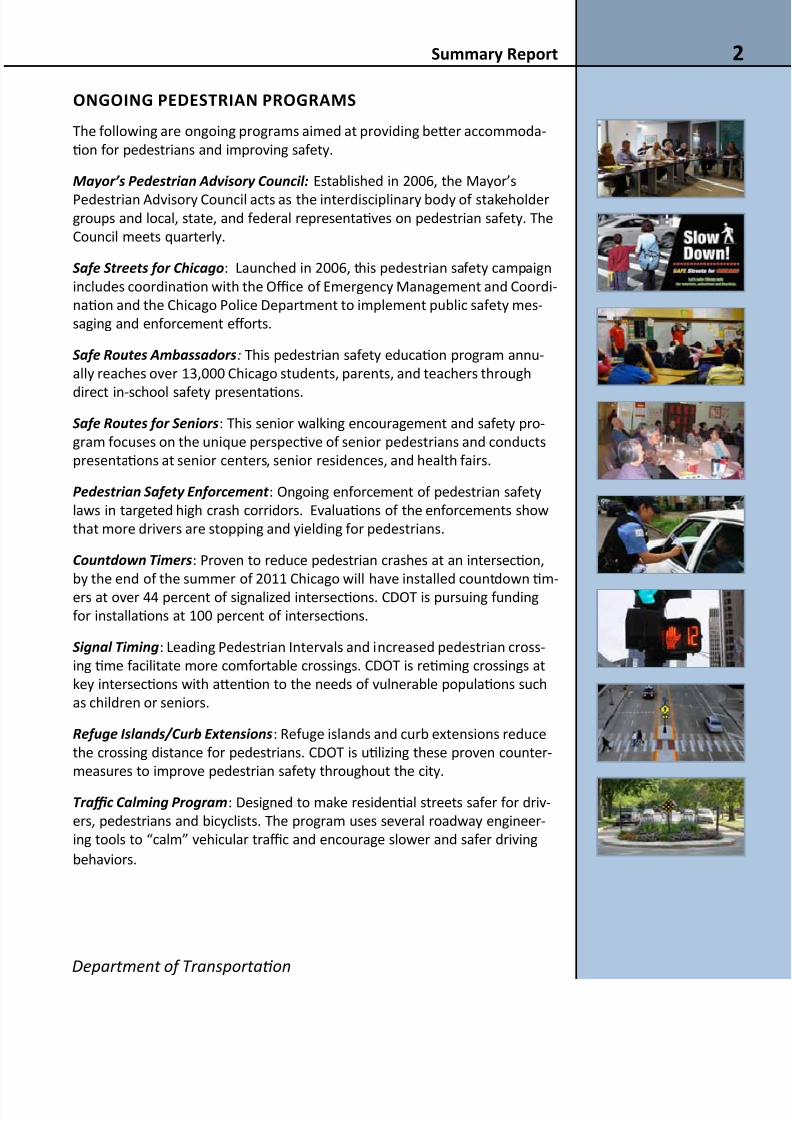
OngOing PedeStRiAn PROgRAmS
The following are ongoing programs aimed at providing beer accommoda-
on for pedestrians and improving safety.
Mayor’s Pedestrian Advisory Council: Established in 2006, the Mayor’s
Pedestrian Advisory Council acts as the interdisciplinary body of stakeholdergroups and local, state, and federal representaves on pedestrian safety. The
Council meets quarterly.
Safe Streets for Chicago: Launched in 2006, this pedestrian safety campaign
includes coordinaon with the Oce of Emergency Management and Coordi-
naon and the Chicago Police Department to implement public safety mes-
saging and enforcement eorts.
Safe Routes Ambassadors: This pedestrian safety educaon program annu-
ally reaches over 13,000 Chicago students, parents, and teachers through
direct in-school safety presentaons.
Safe Routes for Seniors: This senior walking encouragement and safety pro-
gram focuses on the unique perspecve of senior pedestrians and conducts
presentaons at senior centers, senior residences, and health fairs.
Pedestrian Safety Enforcement : Ongoing enforcement of pedestrian safety
laws in targeted high crash corridors. Evaluaons of the enforcements show
that more drivers are stopping and yielding for pedestrians.
Countdown Timers: Proven to reduce pedestrian crashes at an intersecon,
by the end of the summer of 2011 Chicago will have installed countdown m-
ers at over 44 percent of signalized intersecons. CDOT is pursuing funding
for installaons at 100 percent of intersecons.
Signal Timing: Leading Pedestrian Intervals and increased pedestrian cross-
ing me facilitate more comfortable crossings. CDOT is reming crossings at
key intersecons with aenon to the needs of vulnerable populaons such
as children or seniors.
Refuge Islands/Curb Extensions: Refuge islands and curb extensions reduce
the crossing distance for pedestrians. CDOT is ulizing these proven counter-
measures to improve pedestrian safety throughout the city.
Trac Calming Program: Designed to make residenal streets safer for driv-
ers, pedestrians and bicyclists. The program uses several roadway engineer-
ing tools to “calm” vehicular trac and encourage slower and safer driving
behaviors.
7/28/2019 2011 Pedestrian Crash Analysis Summary Report
http://slidepdf.com/reader/full/2011-pedestrian-crash-analysis-summary-report 6/29
2011 Psra Cras Aass
City of Chicago
3
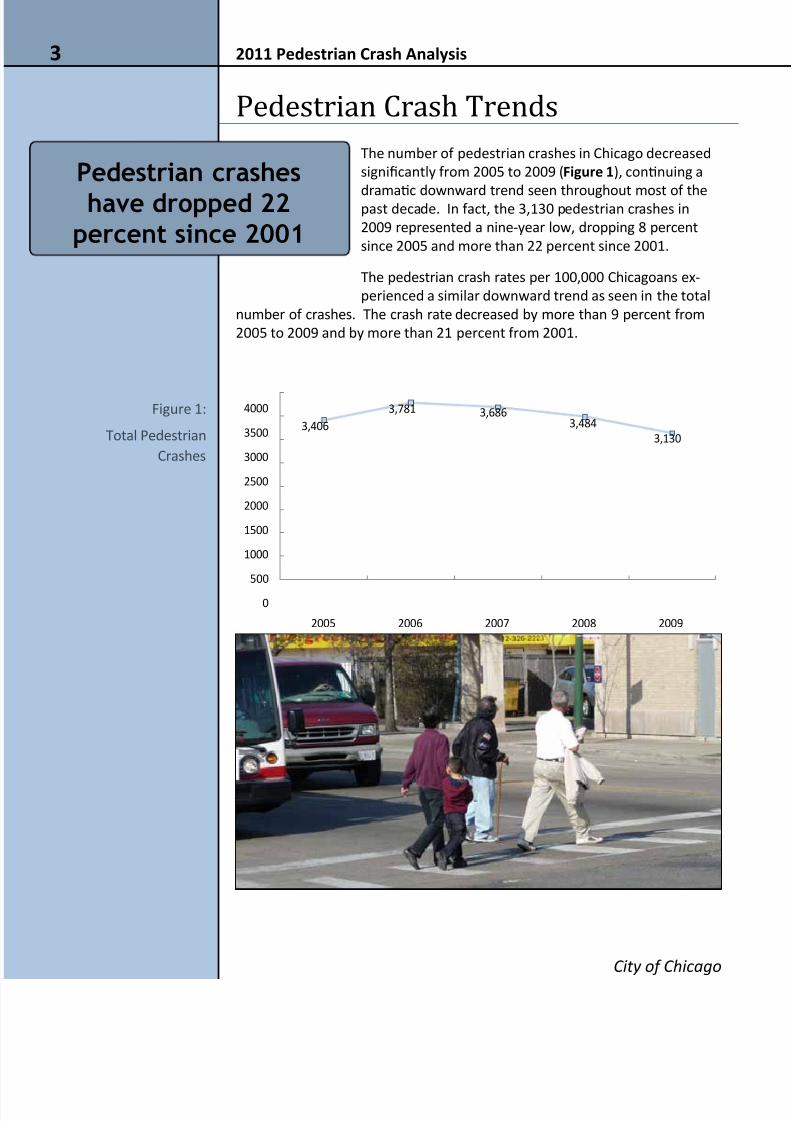
Pedestrian Crash Trends
The number of pedestrian crashes in Chicago decreased
signicantly from 2005 to 2009 (Fr 1), connuing a
dramac downward trend seen throughout most of thepast decade. In fact, the 3,130 pedestrian crashes in
2009 represented a nine-year low, dropping 8 percent
since 2005 and more than 22 percent since 2001.
The pedestrian crash rates per 100,000 Chicagoans ex-
perienced a similar downward trend as seen in the total
number of crashes. The crash rate decreased by more than 9 percent from
2005 to 2009 and by more than 21 percent from 2001.
3,406
3,781 3,6863,484
3,130
0
500
1000
1500
2000
2500
3000
3500
4000
2005 2006 2007 2008 2009
Figure 1:
Total Pedestrian
Crashes
Pedestrian crashes
have dropped 22percent since 2001

7/28/2019 2011 Pedestrian Crash Analysis Summary Report
http://slidepdf.com/reader/full/2011-pedestrian-crash-analysis-summary-report 7/29
Department of Transportaon
Sar Rpor 4
The annual number and
rate of pedestrian fatalies
from 2001 to 2009 also saw
downward trends. The 34
fatalies in 2009 was the
lowest fatality count of thestudy period (Fr 2). In
fact, it represented a 16-
year low from the rst year
the data is available in 1994.
Pedestrian fatalies have
decreased by 61 percent
from the 1994 level of 88.
The rate of pedestrian fatali-
es per 100,000 residents
decreased
over thestudy pe-
riod from
a high
of 2.5 in
2005 to a
low of 1.2
in 2009.
65
4849
55
34
0
10
20
30
40
50
60
70
2005 2006 2007 2008 2009
Figure 2:
Pedestrian Fatalies
Pedestrian fatalitiesreached a 16-year
low in 2009 with 34fatalities
7/28/2019 2011 Pedestrian Crash Analysis Summary Report
http://slidepdf.com/reader/full/2011-pedestrian-crash-analysis-summary-report 8/29
2011 Psra Cras Aass
City of Chicago
5
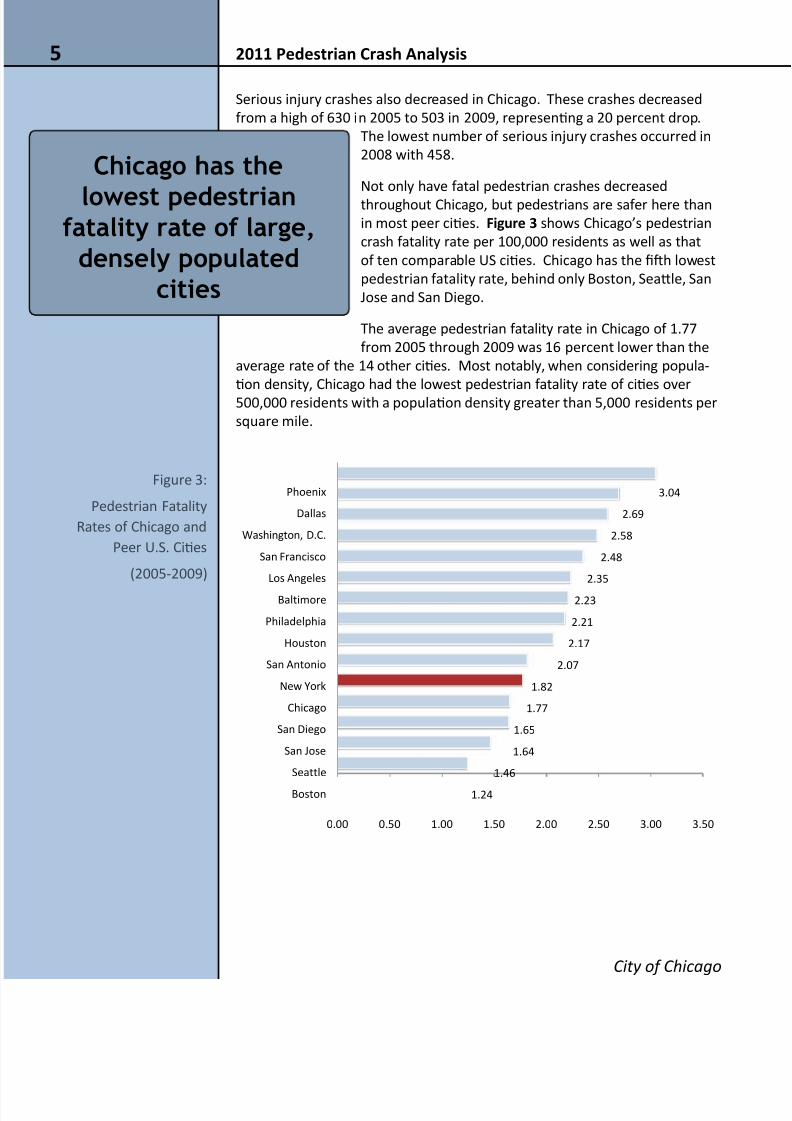
Serious injury crashes also decreased in Chicago. These crashes decreased
from a high of 630 in 2005 to 503 in 2009, represenng a 20 percent drop.
The lowest number of serious injury crashes occurred in
2008 with 458.
Not only have fatal pedestrian crashes decreased
throughout Chicago, but pedestrians are safer here than
in most peer cies. Fr 3 shows Chicago’s pedestrian
crash fatality rate per 100,000 residents as well as that
of ten comparable US cies. Chicago has the h lowest
pedestrian fatality rate, behind only Boston, Seale, San
Jose and San Diego.
The average pedestrian fatality rate in Chicago of 1.77
from 2005 through 2009 was 16 percent lower than the
average rate of the 14 other cies. Most notably, when considering popula-
on density, Chicago had the lowest pedestrian fatality rate of cies over
500,000 residents with a populaon density greater than 5,000 residents per
square mile.
1.24
1.46
1.64
1.65
1.77
1.82
2.07
2.17
2.21
2.23
2.35
2.48
2.58
2.69
3.04
0.00 0.50 1.00 1.50 2.00 2.50 3.00 3.50
Boston
Seattle
San Jose
San Diego
Chicago
New York
San Antonio
Houston
Philadelphia
Baltimore
Los Angeles
San Francisco
Washington, D.C.
Dallas
PhoenixFigure 3:
Pedestrian Fatality
Rates of Chicago and
Peer U.S. Cies
(2005-2009)
Chicago has the
lowest pedestrianfatality rate of large,
densely populatedcities

7/28/2019 2011 Pedestrian Crash Analysis Summary Report
http://slidepdf.com/reader/full/2011-pedestrian-crash-analysis-summary-report 9/29
Department of Transportaon
Sar Rpor 6
Key Findings
Trends in pedestrian crashes from 2005 through 2009
Pedestrian crashes in Chicago have followed a downward trend since
2001
Chicago has a low pedestrian fatality rate among peer cies
Who was involved in pedestrian crashes?
The age group of 15 to 18-year-old pedestrians had the highest crash
rate per populaon
More males than females were involved in crashes as pedestrians and
motorists; however, more females were involved in crashes in Chicago
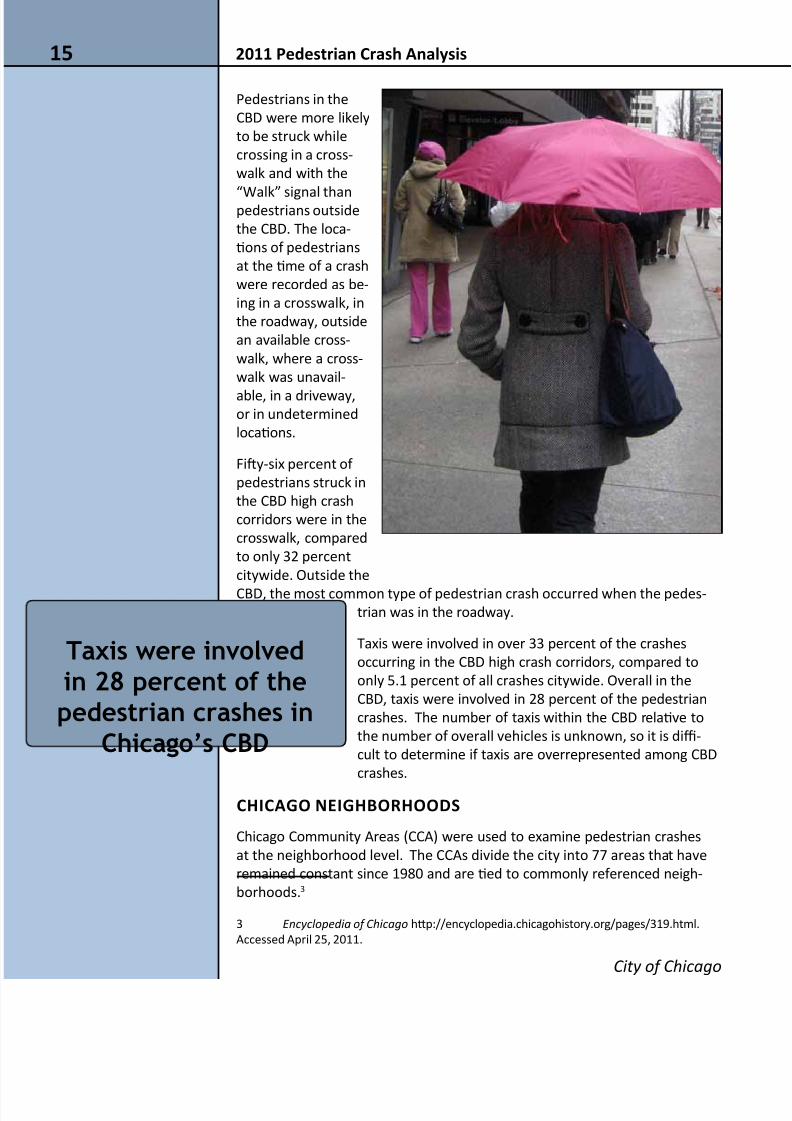
as compared to naonal stascs
Taxi involvement in pedestrian
crashes in the Central Business
District (CBD) was 28 percent
Taxi involvement in crashes out-
side the CBD was 2 percent
When did the pedestrian crashes occur?
From 2005 through 2009, Thurs-
days had the most crashes
3:00 - 6:00 p.m. was the high
crash me period, 6:00 - 9:00
p.m. was the second highest
crash me period
What were the roadway characteriscs of pedestrian crashes?
Fiy percent of fatal and serious injury crashes occurred on arterial
streets, despite accounng for approximately 10 percent of the streetmiles in Chicago, based on IDOT’s roadway classicaon system
Eight out of the top twelve neighborhood high crash corridors were
four-lane roadways; all were arterials
Seventy-eight percent of all crashes and 80 percent of fatal and serious
crashes occurred within 125 feet of the midpoint of an intersecon; 53
percent of all crashes were recorded as intersecon-related on crash
reports
Youth crashes (ages 0 to 14)
were more likely to occur on
local streets than other age
groups (43 percent vs. 23 per-
cent overall)
Overall, the majority (76 per-
cent) of the crashes occurred on
arterial and collector roadways
Youth pedestrians aged 0 to 14
were more likely to be struck
mid-block and not in a crosswalk
than other age groups
Older pedestrians were more
likely to be struck in a crosswalk
than other age groups
7/28/2019 2011 Pedestrian Crash Analysis Summary Report
http://slidepdf.com/reader/full/2011-pedestrian-crash-analysis-summary-report 10/29
2011 Psra Cras Aass
City of Chicago
7
Key Findings (cont’d.)
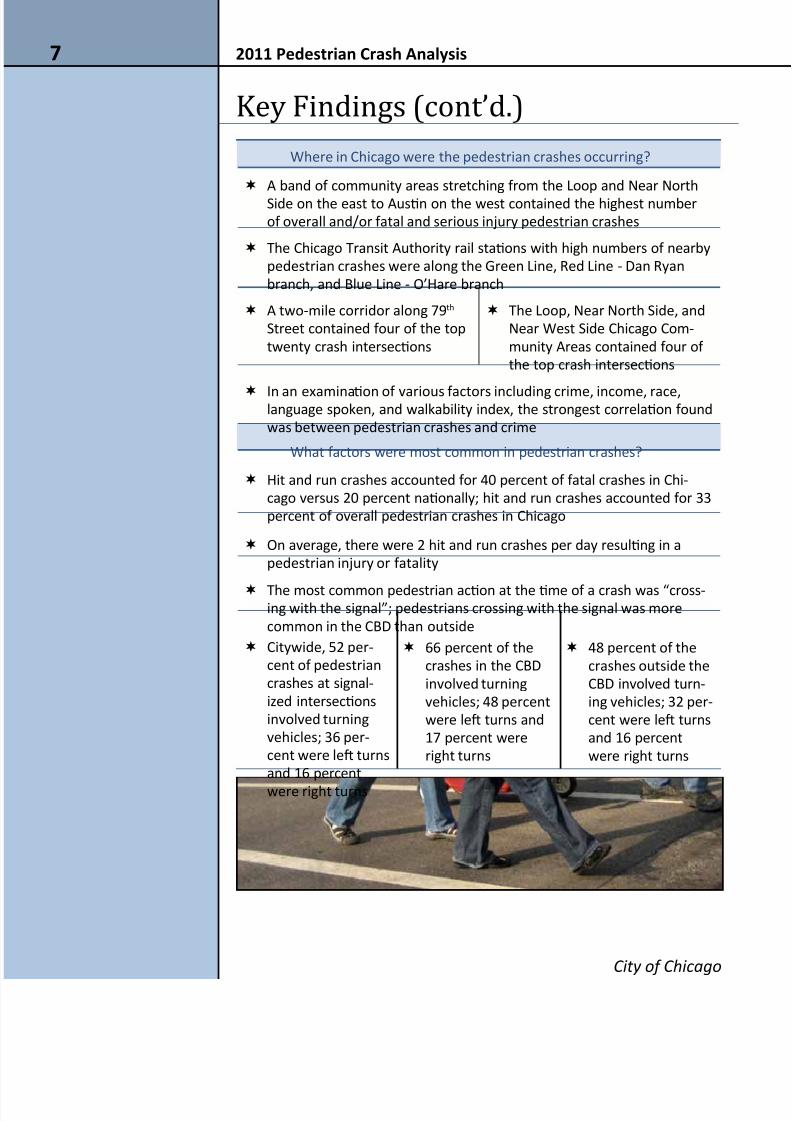
Where in Chicago were the pedestrian crashes occurring?
A band of community areas stretching from the Loop and Near North
Side on the east to Ausn on the west contained the highest number
of overall and/or fatal and serious injury pedestrian crashes
The Chicago Transit Authority rail staons with high numbers of nearby
pedestrian crashes were along the Green Line, Red Line - Dan Ryan
branch, and Blue Line - O’Hare branch
A two-mile corridor along 79th
Street contained four of the top
twenty crash intersecons
The Loop, Near North Side, and
Near West Side Chicago Com-
munity Areas contained four of
the top crash intersecons
In an examinaon of various factors including crime, income, race,language spoken, and walkability index, the strongest correlaon found
was between pedestrian crashes and crime
What factors were most common in pedestrian crashes?
Hit and run crashes accounted for 40 percent of fatal crashes in Chi-
cago versus 20 percent naonally; hit and run crashes accounted for 33
percent of overall pedestrian crashes in Chicago
On average, there were 2 hit and run crashes per day resulng in a
pedestrian injury or fatality
The most common pedestrian acon at the me of a crash was “cross-ing with the signal”; pedestrians crossing with the signal was more
common in the CBD than outside
Citywide, 52 per-
cent of pedestrian
crashes at signal-
ized intersecons
involved turning
vehicles; 36 per-
cent were le turns
and 16 percent
were right turns
66 percent of the
crashes in the CBD
involved turning
vehicles; 48 percent
were le turns and
17 percent were
right turns
48 percent of the
crashes outside the
CBD involved turn-
ing vehicles; 32 per-
cent were le turns
and 16 percent
were right turns

7/28/2019 2011 Pedestrian Crash Analysis Summary Report
http://slidepdf.com/reader/full/2011-pedestrian-crash-analysis-summary-report 11/29
Department of Transportaon
Sar Rpor 8
Who Was Involved in Pedestrian Crashes
PedeStRiAn Age
Children in Chicago were more likely to be involved in
pedestrian crashes than adults. The crash rate for children
of high school age (15 to 18) was highest among all age
groups at 194.6 crashes per 100,000 populaon. Primary
school-aged children (5 to 14-year olds) had the second
highest crash rate at 137.5. The fatal (K) and serious
injury (A) crash rate also was highest among 15 to 18-year
olds. (Fr 4).
40.0
137.5
194.6
127.7122.0
114.2
84.8
6.4
20.429.8
18.7 20.9 21.1 19.1
0
50
100
150
200
250
0-4 5-14 15-18 19-29 30-59 60-64 65+
All Crashes
K&A Crashes
Crashes among children decreased, however. From 2005 through 2009, the
annual number of pedestrian crashes involving 5 to 18-year olds decreased
by 28 percent, from 964 to 698.
Although the pedestrian crash rate of 84.8 per 100,000 for seniors (65+) was
second lowest among all age groups, seniors were overrepresented in fataland serious injury crashes. Despite the fact that seniors were involved in only
6.2 percent of pedestrian crashes overall, they were involved in 9.5 percent
of the fatal crashes. Four percent of senior crashes resulted in a fatality and
18.2 percent resulted in serious injury, compared with 1.4 percent and 14.9
Figure 4:
Pedestrian Crash Rate
per 100,000 Populaon
by Age Group
(2005-2009)
Children 5 to 18years old were mostlikely to be involvedin pedestrian crashes

7/28/2019 2011 Pedestrian Crash Analysis Summary Report
http://slidepdf.com/reader/full/2011-pedestrian-crash-analysis-summary-report 12/29
2011 Psra Cras Aass
City of Chicago
9
percent respecvely, for all age groups. The higher proporon of fatal and
serious injury crashes among seniors is likely related to their higher physical
fragility relave to the overall populaon.
PedeStRiAn gendeR
Male pedestrians in Chicago were involved in 52 percent
of all pedestrian crashes and 54 percent of fatal and seri-
ous injury crashes, despite making up only 48 percent
of Chicago’s populaon. These proporons are lower
than naonal stascs, however as naonally, males are
involved in 69 percent of pedestrian crashes. The larg-
est proporon of males involved in pedestrian crashes
occurred in the 0 to 14 age group, where they were
involved in 62 percent of all crashes and 1.6 mes morelikely to be involved in a crash than females.
Female pedestrians in Chicago were involved in 45 per-
cent of all crashes between 2005 and 2009, 1.5 mes
more than the naonal average of 31 percent. There were three age groups
where females were involved in more crashes than males: 15 to 18, 19 to
29 and 65+. The only age groups where the female crash rate by populaon
Despite a lowercrash rate than otherage groups, seniors(65+) were over-
represented in fataland serious injury
crashes

7/28/2019 2011 Pedestrian Crash Analysis Summary Report
http://slidepdf.com/reader/full/2011-pedestrian-crash-analysis-summary-report 13/29
Department of Transportaon
Sar Rpor 10
was higher than the male rate, however, were the 15 to 18 and 19 to 29 age
groups (Fr 5).
51.2
161.0
186.3
121.4
134.3127.4
103.6
26.9
108.0
197.3
130.6
107.4100.0
69.7
0
50
100
150
200
250
0-4 5-14 15-18 19-29 30-59 60-64 65+
Males
Females
PedeStRiAn RACe And ethniCity
Informaon on the race of the pedestrians involved in crashes was only avail-
able for fatal pedestrian crashes, for all years except 2008. The breakdown
of pedestrian fatalies closely matched the proporon of Chicago’s popu-
Figure 5:
Pedestrian Crash
Rate per 100,000
Populaon by Gender
and Age Group
(2005-2009)

7/28/2019 2011 Pedestrian Crash Analysis Summary Report
http://slidepdf.com/reader/full/2011-pedestrian-crash-analysis-summary-report 14/29
2011 Psra Cras Aass
City of Chicago
11
laon per the 2005-2009 US Census American Community Survey (Fr
6). Pedestrians who idened as black or African American were the only
group overrepresented in crashes as they were involved in 36 percent of fatal
crashes while making up 34 percent of the overall populaon.
30.3%
35.9%
24.2%
3.2%
32.5%33.8%
27.4%
4.9%
0%
5%
10%
15%
20%
25%
30%
35%
40%
White Alone Black/African
American
Hispanic Asian Alone
% of Pedestrian
Fatalities
% of Population
Figure 6:
Pedestrian Fatalies by
Race
7/28/2019 2011 Pedestrian Crash Analysis Summary Report
http://slidepdf.com/reader/full/2011-pedestrian-crash-analysis-summary-report 15/29
Department of Transportaon
Sar Rpor 12
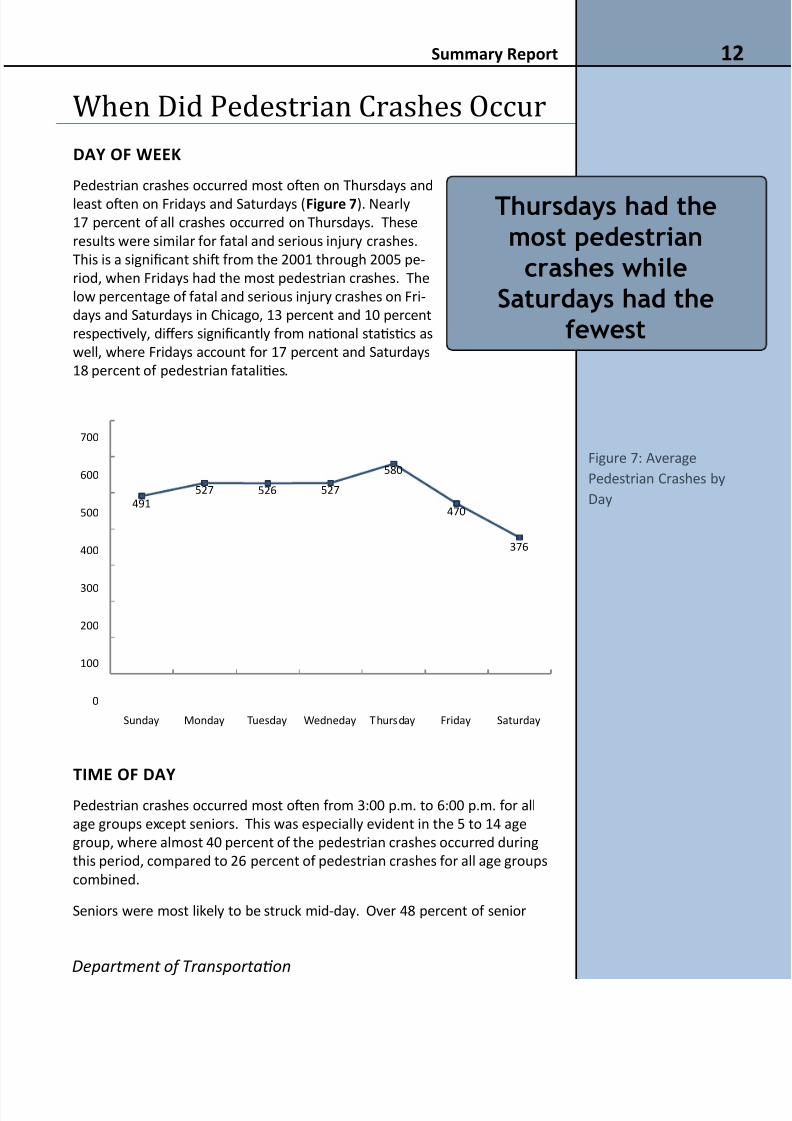
When Did Pedestrian Crashes Occur
dAy OF Week
Pedestrian crashes occurred most oen on Thursdays and
least oen on Fridays and Saturdays (Fr 7). Nearly
17 percent of all crashes occurred on Thursdays. These
results were similar for fatal and serious injury crashes.
This is a signicant shi from the 2001 through 2005 pe-
riod, when Fridays had the most pedestrian crashes. The
low percentage of fatal and serious injury crashes on Fri-
days and Saturdays in Chicago, 13 percent and 10 percent
respecvely, diers signicantly from naonal stascs as
well, where Fridays account for 17 percent and Saturdays
18 percent of pedestrian fatalies.
491
527 526 527
580
470
376
0
100
200
300
400
500
600
700
Sunday Monday Tuesday Wedneday Thursday Friday Saturday
time OF dAy
Pedestrian crashes occurred most oen from 3:00 p.m. to 6:00 p.m. for all
age groups except seniors. This was especially evident in the 5 to 14 age
group, where almost 40 percent of the pedestrian crashes occurred during
this period, compared to 26 percent of pedestrian crashes for all age groups
combined.
Seniors were most likely to be struck mid-day. Over 48 percent of senior
Figure 7: Average
Pedestrian Crashes by
Day
Thursdays had themost pedestrian
crashes whileSaturdays had the
fewest

7/28/2019 2011 Pedestrian Crash Analysis Summary Report
http://slidepdf.com/reader/full/2011-pedestrian-crash-analysis-summary-report 16/29
2011 Psra Cras Aass
City of Chicago
13
crashes occurred between 9:00 a.m. and 3:00 p.m., com-
pared to roughly 29 percent of pedestrian crashes for all
age groups occurring during this period.
Late night crashes were more likely to involve 19 to
29-year olds and to occur on weekends. Ten percent of
crashes among this age group occurred between mid-
night and 3:00 a.m., double the percentage of crashes
for all age groups combined during this period. Over 21
percent of all pedestrian crashes on weekends occurred
between the overnight hours of 9:00 p.m. and 6:00 a.m.,
compared to 16 percent of weekday crashes occurring
during the same period.
Pedestrian crashesoccurred most often
during the eveningpeak period, 3:00p.m. - 6:00 p.m.

7/28/2019 2011 Pedestrian Crash Analysis Summary Report
http://slidepdf.com/reader/full/2011-pedestrian-crash-analysis-summary-report 17/29
Department of Transportaon
Sar Rpor 14
Where Did Pedestrian Crashes Occur
CentRAl BuSineSS diStRiCt (CBd)
Various analyses were performed on pedestrian crashes that occurred in
the Central Business District (CBD) 2. The Near North Side and Loop Chicago
community areas (CCA) comprise most of the CBD and, over the ve-year
study period, experienced the highest number of pedestrian crashes of all 77
CCAs. The CBD is vastly dierent from the rest of Chicago due to the large
concentraon of commuters, tourists, business travelers and residents. The
CBD also has shorter block lengths than most other areas of Chicago and the
majority of intersecons are signalized.
Five high crash corridors were idened within the CBD (map 1). These ve
corridors accounted for 19.5 percent of all fatal and serious injury crashes in
the CBD during the ve-year period.
2 An area bounded by Roosevelt Road to the south, Halsted Street to the west, Divi-
sion Street to the north and Lake Michigan to the east
Map 1:
CBD High Crash
Corridors and
Pedestrian Crashes
7/28/2019 2011 Pedestrian Crash Analysis Summary Report
http://slidepdf.com/reader/full/2011-pedestrian-crash-analysis-summary-report 18/29

7/28/2019 2011 Pedestrian Crash Analysis Summary Report
http://slidepdf.com/reader/full/2011-pedestrian-crash-analysis-summary-report 19/29
Department of Transportaon
Sar Rpor 16
tab 1 lists the CCAs with the highest number of total
fatal (K) and serious injury (A) pedestrian crashes. These
eight CCAs were also among the twelve CCAs with the
most pedestrian crashes overall. The table also lists the
number of total crashes. These CCAs, except for Auburn
Gresham, which is on the southwest side, form an east-west band across Chicago, stretching from the Loop and
Near North Side on the east to Ausn on the west (See
map 2).
CCA k&A Crass toa Crass
Near North Side 139 1,071
Ausn 130 903
Loop 118 924
Near West Side 93 633
Belmont Cragin 83 421
West Town 81 497
Auburn Gresham 73 407
Humboldt Park 71 398
These CCAs also had a high number of hit and run crashes and high rates of
crashes when accounng for factors such as populaon and street mile.
Map 2:
Seven of Eight High
Crash CCAs
A band of ChicagoCommunity Areas
across central Chicagoincludes seven of
the eight areas withthe most pedestrian
crashes
Table 1:
Top CCAs by Total
and K&A Pedestrian
Crashes
7/28/2019 2011 Pedestrian Crash Analysis Summary Report
http://slidepdf.com/reader/full/2011-pedestrian-crash-analysis-summary-report 20/29
2011 Psra Cras Aass
City of Chicago
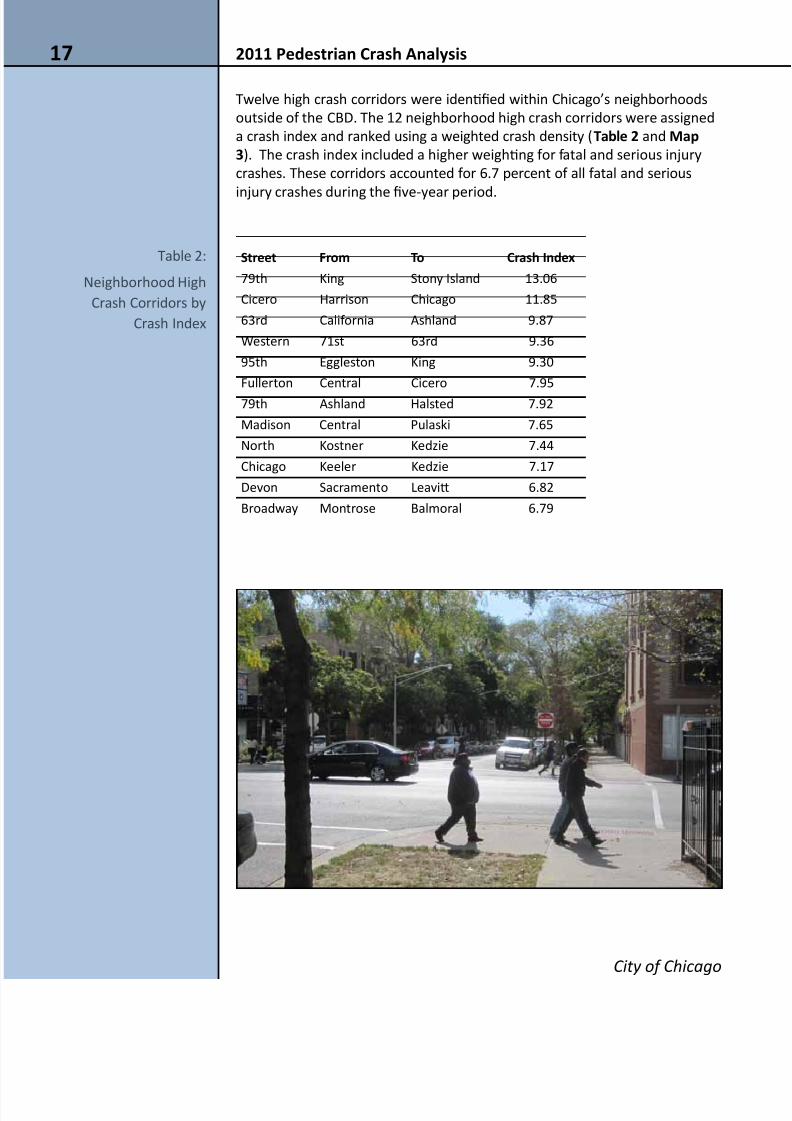
17
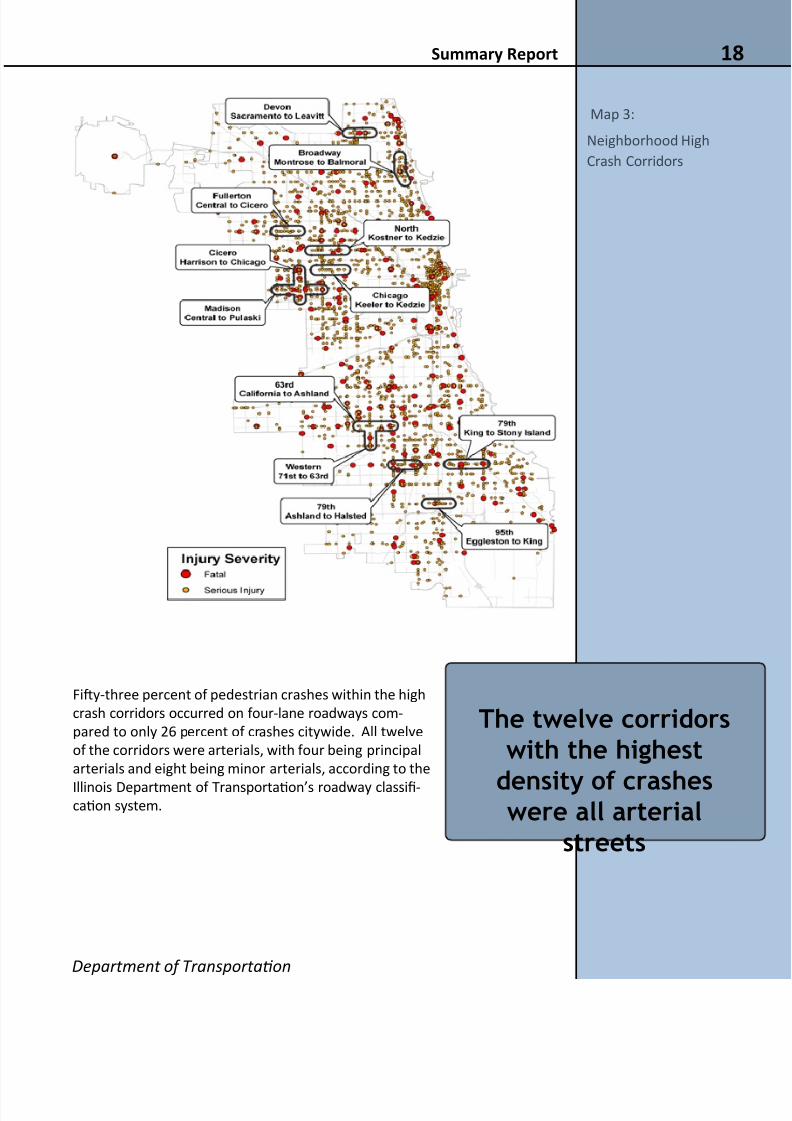
Twelve high crash corridors were idened within Chicago’s neighborhoods
outside of the CBD. The 12 neighborhood high crash corridors were assigned
a crash index and ranked using a weighted crash density (tab 2 and map
3). The crash index included a higher weighng for fatal and serious injury
crashes. These corridors accounted for 6.7 percent of all fatal and serious
injury crashes during the ve-year period.
Sr Fro to Cras ix
79th King Stony Island 13.06
Cicero Harrison Chicago 11.85
63rd California Ashland 9.87
Western 71st 63rd 9.36
95th Eggleston King 9.30
Fullerton Central Cicero 7.95
79th Ashland Halsted 7.92
Madison Central Pulaski 7.65
North Kostner Kedzie 7.44
Chicago Keeler Kedzie 7.17
Devon Sacramento Leavi 6.82
Broadway Montrose Balmoral 6.79
Table 2:
Neighborhood High
Crash Corridors by
Crash Index
7/28/2019 2011 Pedestrian Crash Analysis Summary Report
http://slidepdf.com/reader/full/2011-pedestrian-crash-analysis-summary-report 21/29
Department of Transportaon
Sar Rpor 18
Fiy-three percent of pedestrian crashes within the high
crash corridors occurred on four-lane roadways com-
pared to only 26 percent of crashes citywide. All twelve
of the corridors were arterials, with four being principal
arterials and eight being minor arterials, according to the
Illinois Department of Transportaon’s roadway classi-caon system.
Map 3:
Neighborhood High
Crash Corridors
The twelve corridorswith the highest
density of crasheswere all arterial
streets

7/28/2019 2011 Pedestrian Crash Analysis Summary Report
http://slidepdf.com/reader/full/2011-pedestrian-crash-analysis-summary-report 22/29
2011 Psra Cras Aass
City of Chicago
19
inteRSeCtiOnS
Intersecon crashes were dened as those occurring within 125 feet of the
intersecon midpoint. Based on this denion, 78 percent of all pedestrian
crashes and 80 percent of fatal and serious injury pedestrian crashes from
2005 through 2009 occurred at an intersecon. This is signicantly dierent
from naonal stascs, where 46 percent of crashes are intersecon related.
Chicago’s dense street-grid and short block lengths may account for such a
high proporon of intersecon crashes.
The intersecons with the highest overall pedestrian crashes and the highest
fatal and serious injury pedestrian crashes were idened (map 4). Generally
speaking, these intersecons were scaered throughout the city. Of note,
though, four of the top crash intersecons were along a two-mile corridor
of 79th Street and four were in each of the Loop, Near North Side, and Near
West Side CCAs.
Map 4:
Top Pedestrian Crash
Intersecons

7/28/2019 2011 Pedestrian Crash Analysis Summary Report
http://slidepdf.com/reader/full/2011-pedestrian-crash-analysis-summary-report 23/29
Department of Transportaon
Sar Rpor 20
Pedestrians were most oen crossing with a signal when
struck. Citywide, 49 percent of pedestrians struck at sig-
nalized intersecons were crossing with a “Walk” signal.
This number was slightly higher in the CBD where 60
percent of pedestrians were crossing with the signal and
slightly lower outside of the CBD where 47 percent of pedestrians were crossing with the signal.
Pedestrians crossing against the signal accounted for 16.4
percent of crashes. A total of 19 pedestrian acons were
recorded at the me of a crash. Pedestrians recorded as
taking “unknown” or “other” acons accounted for al-
most 18 percent of the crashes. In the remaining crashes,
the pedestrian acons were spread out across 15 other
crash reporng opons, including “walking with trac,”
“walking against trac,” or “standing/playing/working in
roadway.”
CtA StAtiOnS
Fatal and serious injury pedestrian crashes within 1/8 mile of CTA transit
staons were analyzed to idenfy staons with high crash incidences. While
8 of the top 10 high crash staons were in the CBD, these staons were not
included in this summary because of the high volumes of pedestrians around
these staons who are not using transit.
Seventy-eightpercent of all
pedestrian crashesand eighty percentof fatal and serious
injury crashesoccurred within 125
feet of an intersection
7/28/2019 2011 Pedestrian Crash Analysis Summary Report
http://slidepdf.com/reader/full/2011-pedestrian-crash-analysis-summary-report 24/29
2011 Psra Cras Aass
City of Chicago
21
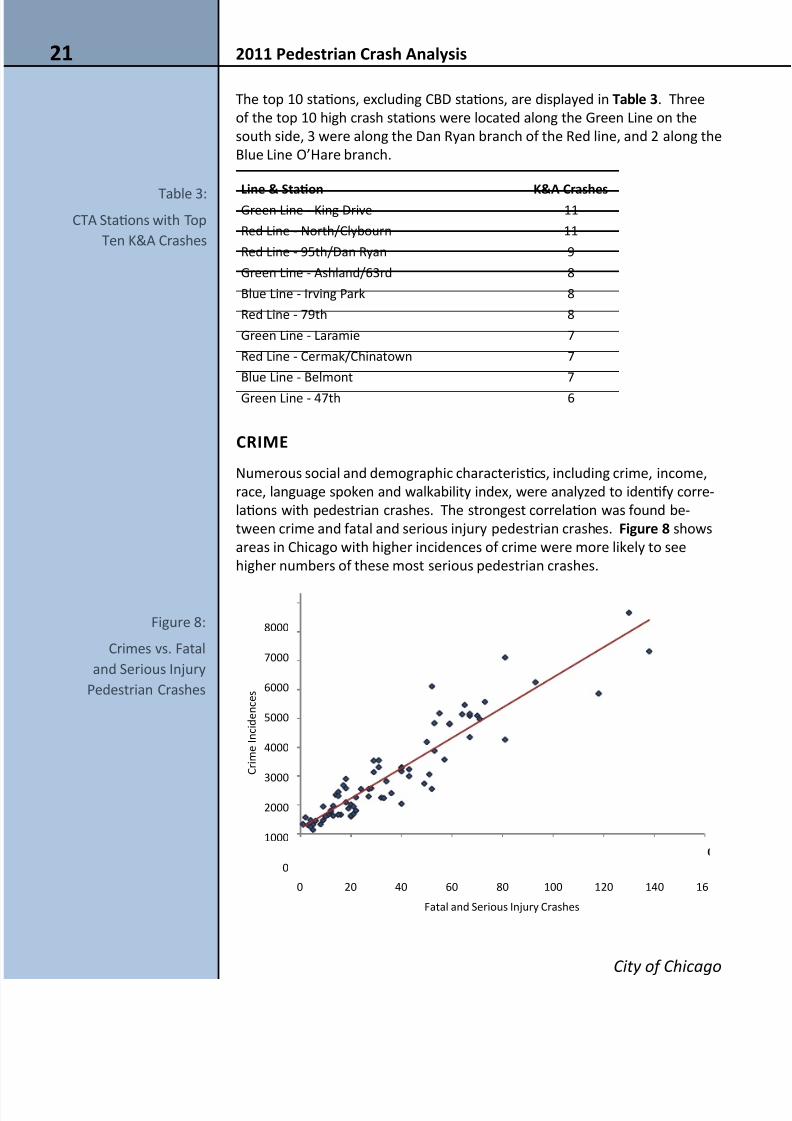
The top 10 staons, excluding CBD staons, are displayed in tab 3. Three
of the top 10 high crash staons were located along the Green Line on the
south side, 3 were along the Dan Ryan branch of the Red line, and 2 along the
Blue Line O’Hare branch.
l & Sao k&A Crass
Green Line - King Drive 11
Red Line - North/Clybourn 11
Red Line - 95th/Dan Ryan 9
Green Line - Ashland/63rd 8
Blue Line - Irving Park 8
Red Line - 79th 8
Green Line - Laramie 7
Red Line - Cermak/Chinatown 7
Blue Line - Belmont 7
Green Line - 47th 6
CRime
Numerous social and demographic characteriscs, including crime, income,
race, language spoken and walkability index, were analyzed to idenfy corre-
laons with pedestrian crashes. The strongest correlaon was found be-
tween crime and fatal and serious injury pedestrian crashes. Fr 8 shows
areas in Chicago with higher incidences of crime were more likely to see
higher numbers of these most serious pedestrian crashes.
0
1000
2000
3000
4000
5000
6000
7000
8000
0 20 40 60 80 100 120 140 16
C r i m e I n c i d e n c e s
Fatal and Serious Injury Crashes
Figure 8:
Crimes vs. Fatal
and Serious Injury
Pedestrian Crashes
Table 3:
CTA Staons with Top
Ten K&A Crashes

7/28/2019 2011 Pedestrian Crash Analysis Summary Report
http://slidepdf.com/reader/full/2011-pedestrian-crash-analysis-summary-report 25/29
Department of Transportaon
Sar Rpor 22
Pedestrian Crash Types
FAiluRe tO yield
Of the 17 motorist acons recorded at the me of a
pedestrian crash, the most common motorist acon was
failing to yield to pedestrians. When accounng only
for known factors for motorist acon, “failure to yield”
was cited as the primary factor in pedestrian crashes 48
percent of the me, for both overall and fatal and serious
injury crashes.
tuRning VehiCleS At SignAlized inteRSeCtiOnS
The most common vehicle maneuvers resulng in a pedestrian crash atsignalized intersecons were turning movements. Fiy-two percent of pe-
destrian crashes at signalized intersecons involved turning vehicles (Fr
9). This number increased to 66 percent of crashes in the CBD. Specically,
le-turning vehicles accounted for 35.5 percent of the crashes citywide and
48 percent of the crashes in the CBD, outnumbering right-turning vehicles by
more than 2 mes.
35.5%
16.4%
34.5%
13.5%
Turning Left
Turning Right
Straight Ahead
Other
The most common
motorist actioncontributing to
pedestrian crashes wasfailure to yield
Figure 9:
Vehicle Maneuvers at
Signalized Intersecon
Pedestrian Crashes
7/28/2019 2011 Pedestrian Crash Analysis Summary Report
http://slidepdf.com/reader/full/2011-pedestrian-crash-analysis-summary-report 26/29
2011 Psra Cras Aass
City of Chicago
23
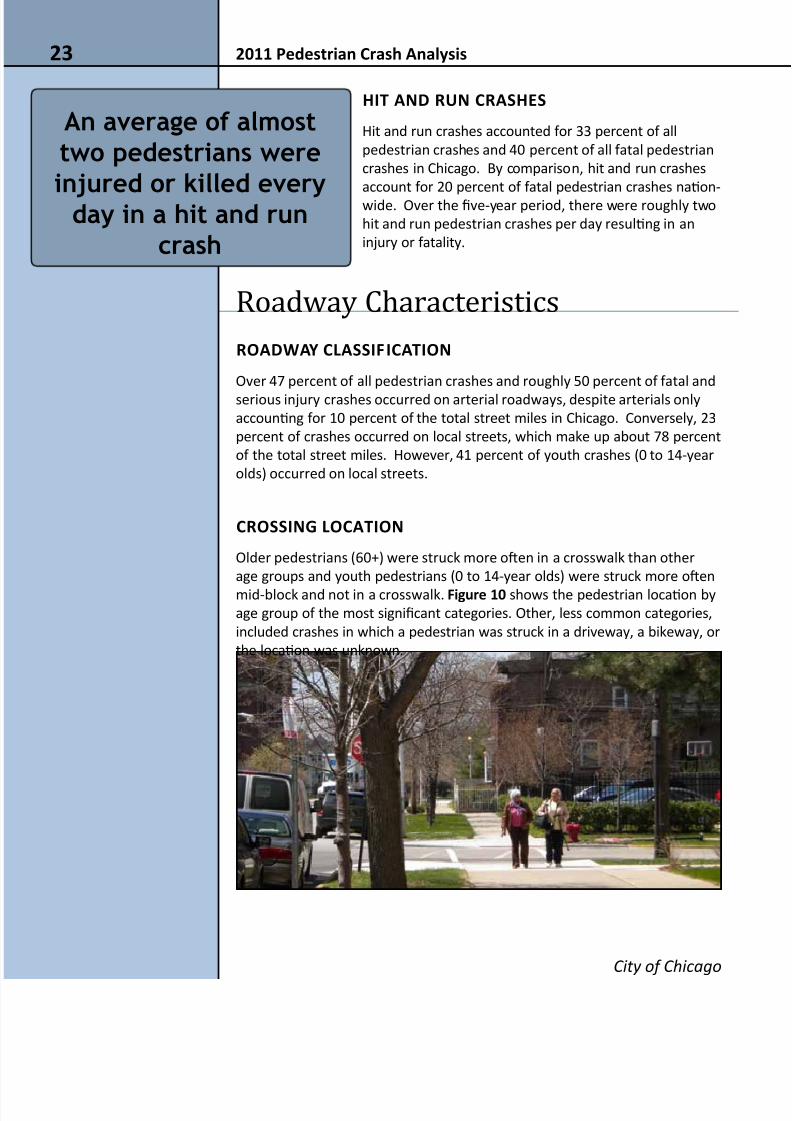
hit And Run CRASheS
Hit and run crashes accounted for 33 percent of all
pedestrian crashes and 40 percent of all fatal pedestrian
crashes in Chicago. By comparison, hit and run crashes
account for 20 percent of fatal pedestrian crashes naon-
wide. Over the ve-year period, there were roughly two
hit and run pedestrian crashes per day resulng in an
injury or fatality.
Roadway Characteristics
ROAdWAy ClASSiFiCAtiOn
Over 47 percent of all pedestrian crashes and roughly 50 percent of fatal and
serious injury crashes occurred on arterial roadways, despite arterials only
accounng for 10 percent of the total street miles in Chicago. Conversely, 23
percent of crashes occurred on local streets, which make up about 78 percent
of the total street miles. However, 41 percent of youth crashes (0 to 14-year
olds) occurred on local streets.
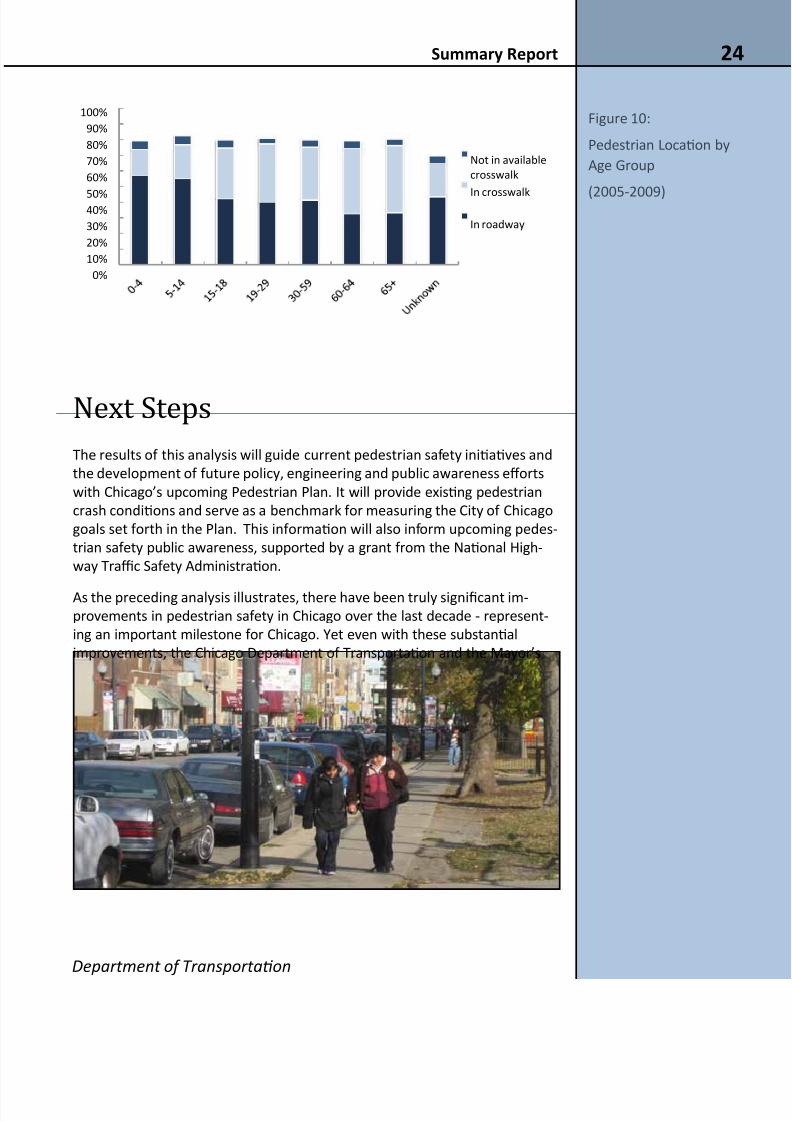
CROSSing lOCAtiOn
Older pedestrians (60+) were struck more oen in a crosswalk than other
age groups and youth pedestrians (0 to 14-year olds) were struck more oen
mid-block and not in a crosswalk. Fr 10 shows the pedestrian locaon by
age group of the most signicant categories. Other, less common categories,
included crashes in which a pedestrian was struck in a driveway, a bikeway, or
the locaon was unknown.
An average of almosttwo pedestrians were
injured or killed everyday in a hit and runcrash
7/28/2019 2011 Pedestrian Crash Analysis Summary Report
http://slidepdf.com/reader/full/2011-pedestrian-crash-analysis-summary-report 27/29
Department of Transportaon
Sar Rpor 24
0%
10%
20%
30%
40%50%
60%
70%
80%
90%
100%
Not in available
crosswalk
In crosswalk
In roadway
Next Steps
The results of this analysis will guide current pedestrian safety iniaves and
the development of future policy, engineering and public awareness eorts
with Chicago’s upcoming Pedestrian Plan. It will provide exisng pedestrian
crash condions and serve as a benchmark for measuring the City of Chicago
goals set forth in the Plan. This informaon will also inform upcoming pedes-
trian safety public awareness, supported by a grant from the Naonal High-
way Trac Safety Administraon.
As the preceding analysis illustrates, there have been truly signicant im-
provements in pedestrian safety in Chicago over the last decade - represent-
ing an important milestone for Chicago. Yet even with these substanal
improvements, the Chicago Department of Transportaon and the Mayor’s
Figure 10:
Pedestrian Locaon by
Age Group
(2005-2009)

7/28/2019 2011 Pedestrian Crash Analysis Summary Report
http://slidepdf.com/reader/full/2011-pedestrian-crash-analysis-summary-report 28/29
2011 Psra Cras Aass
City of Chicago
25
Pedestrian Advisory Council are connuing to work to make Chicago a truly
great city in which to be a pedestrian.
Together, CDOT and MPAC have idened a vision for Chicago’s future as a
pedestrian-focused city. This vision will be used to guide the work on Chi-
cago’s Pedestrian Plan. This vision reads:
The people of Chicago culvate, encourage, and enjoy mutual
respect on our streets. People choose to be pedestrians be-
cause the experience is the safest, most connected, accessible,
and above all, the most enjoyable. Because we are commied
to a strong pedestrian environment as an essenal part of our
complete transportaon system, we are a healthier, more livable
city.
To ensure the realizaon of this vision, the Pedestrian Plan will include the
ndings from this analysis, input from key stakeholders, and an extensive
public involvement process to idenfy strategies related to Safety, Connecv-ity, Livability, and Health. All of this will further strengthen Chicago’s great
pedestrian environment and ensure that the city connues our remarkable
gains in pedestrian safety.
Photo Credits: All photos © CDOT

7/28/2019 2011 Pedestrian Crash Analysis Summary Report
http://slidepdf.com/reader/full/2011-pedestrian-crash-analysis-summary-report 29/29
Sar Rpor 26


