ABSTRACTThis paper presents the identification and validation of adynamic Waste Heat Recovery (WHR) system model. Drivenby upcoming CO2 emission targets and increasing fuel costs,engine exhaust gas heat utilization has recently attractedmuch attention to improve fuel efficiency, especially forheavy-duty automotive applications.
In this study, we focus on a Euro-VI heavy-duty dieselengine, which is equipped with a Waste Heat Recoverysystem based on an Organic Rankine Cycle. The appliedmodel, which combines first principle modelling withstationary component models, covers the two-phase flowbehavior and the effect of control inputs. Furthermore, itdescribes the interaction with the engine on both gas anddrivetrain side.
Using engine dynamometer measurements, an optimal fit ofunknown model parameters is determined for stationaryoperating points. From model validation, it is concluded thatthe identified model shows good accuracy in steady-state andcan reasonably capture the most important dynamics over awide range of operating conditions. The resulting real-timemodel is suitable for model-based control.
INTRODUCTIONStringent CO2 emission legislation and fuel costs directedautomotive industry to focus on using engine exhaust gasheat recovery systems [1]. These energy recovery systems areknown as Waste Heat Recovery (WHR) systems. For heavy-duty applications, the technology used in WHR systems isbased on the Organic Rankine Cycle (ORC) [2], which is asuitable solution for energy recovery from a low-grade heatsource such as engine exhaust gas.
The potential of WHR systems was investigated in [3] forlight-duty automotive applications and has been found toincrease the engine efficiency by 2-3 % compared to aconventional engine. For heavy-duty applications [4], theincrease in engine efficiency is even more significant, up to4%. The net fuel economy strongly depends on the drivecycle [5] and the WHR system configuration [6].Thermodynamic analysis on the WHR system [7], [8],demonstrate that 5% fuel saving can be achieved for aconfiguration where energy is recovered from the ExhaustGas Recirculation (EGR) line only.
Control of engines with a WHR system is challenging,especially for configurations where energy is recovered formthe Exhaust Gas Recirculation (EGR) line as well as theexhaust line. These complex applications are characterized bymultivariable control actions and strong coupling between
Experimental Validation of a Dynamic Waste HeatRecovery System Model for Control Purposes
2013-01-1647Published
04/08/2013
Emanuel FeruTechnische Universiteit Eindhoven
Frank Kupper, Chepa Rojer, Xander Seykens, Fabio Scappin and Frank WillemsTNO Automotive
Jeroen SmitsDAF Trucks
Bram De Jager and Maarten SteinbuchTechnische Universiteit Eindhoven
THIS DOCUMENT IS PROTECTED BY U.S. AND INTERNATIONAL COPYRIGHTIt may not be reproduced, stored in a retrieval system, distributed or transmitted, in whole or in part, in any form or by any means.
Downloaded from SAE International by Oxford Brookes Univ, Monday, July 29, 2013 03:32:15 PM
engine and WHR system on both energy level and emissionslevel. Accurate engine torque control is required in order torealize the required drivability while emission levels are keptlow. Moreover, information on states, e.g., enthalpy andvapor fraction, is crucial for control and damage prevention.Therefore, for control development a model-based approachis essential.
The work and results in the literature are mostly oriented onmodeling and control of steam cycles for large-scale powerplants, with considerably different configurations incomparison with the small-scale types used in automotive. In[9] and [10] a Rankine cycle system model is presented for abiomass-fired power plant. The model is intended to be usedfor equipment dimensioning and control design. Furthermore,in [11], [12] the focus is on ORC basic scheme modeling forenergy recovery from a variable waste heat source. However,for automotive applications, only a few results are presentedin the literature. Although these applications are characterizedby highly transient conditions, validation results of dynamicWHR models are still lacking. This also holds for thecombination of engine and WHR system.
In this paper, a dynamic model of the complete WHR systemis identified and validated. For control purposes, this modelhas to reasonably capture the real WHR system behavior andhas to be computationally efficient. Compared to other work,the main contribution of this study is the combination of:
• Complex WHR system with two parallel evaporators, whichis installed on an automotive diesel engine;
• Systematic identification of WHR model parameters;
• Model validation of steady-state as well as dynamicbehavior over a wide operating range using enginedynamometer results.
This work is organized as follows. First, the examined engineplatform is presented. Second, the modeling of eachcomponent within the WHR recovery system is discussed.Using the Matlab/Simulink environment, the overall WHRmodel is implemented. Third, the model identification andvalidation is performed over a wide range of operating points.Finally, conclusions are drawn and directions for futureresearch are discussed.
EXPERIMENTAL SET-UPCONFIGURATIONThe experimental set-up (Fig. 1) consists of a 340 kW, 12.9liter, 6 cylinder diesel engine, which is equipped with a 2500bar common rail fuel injection system, a cooled high pressureExhaust Gas Recirculation (EGR) system, Variable TurbineGeometry (VTG) and Charge Air Cooling (CAC). Theexhaust aftertreatment system contains a Diesel OxidationCatalyst (DOC), a Diesel Particulate Filter (DPF), a 32.6 literCu-Zeolite SCR catalyst (SCR) and an Ammonia Oxidation
catalyst (AMOX) to avoid unwanted NH3 slip. To meet theupcoming CO2 targets, a WHR system is integrated with theengine.
Figure 1. Schematic representation of a heavy-dutydiesel engine equipped with a WHR system.
In this WHR system, the heat is recovered from both the EGRline and exhaust line using two evaporators, one for each ofthe exhaust circuits. The recovered exhaust heat is convertedto mechanical power, by means of a piston expander [13].The piston expander and pumps are mechanically coupledwith the engine crankshaft. Thus, the recovered power isdirectly transmitted to the engine. The selected working fluidis pure ethanol because of its physical and thermodynamicproperties, which are suitable for this kind of applications.The ethanol mass flow is controlled by two valves such thatthe ethanol state of matter is vapor at the evaporators outlet.The necessity of a low-level controller is crucial for correctsystem operation and expander damage prevention. In orderto close the Rankine cycle, the ethanol is cooled back into thetank by means of a condenser. To keep the cooling capacityof the WHR system under a certain bound, an exhaust bypassvalve is installed before the exhaust evaporator. This valvebypasses the exhaust gas and therefore manipulates theexhaust evaporator recovered heat. Due to drivabilityrequirements, the power delivered by the WHR system mustbe interrupted temporarily, e.g., during braking or gearshifting. In this case an electric bypass valve is activatedwhich closes the vapor flow to the expander and therefore thegenerated torque is reduced. For safety reasons, a 60 barpressure relief valve is used. The electric bypass valve andthe pressure relief valve are located in the valve box.
The considered experimental set-up is furthermore equippedwith various sensors, e.g., temperature sensors, pressure andflow sensors. These sensors are used for low-level controls,monitoring and validation of the developed WHR model.
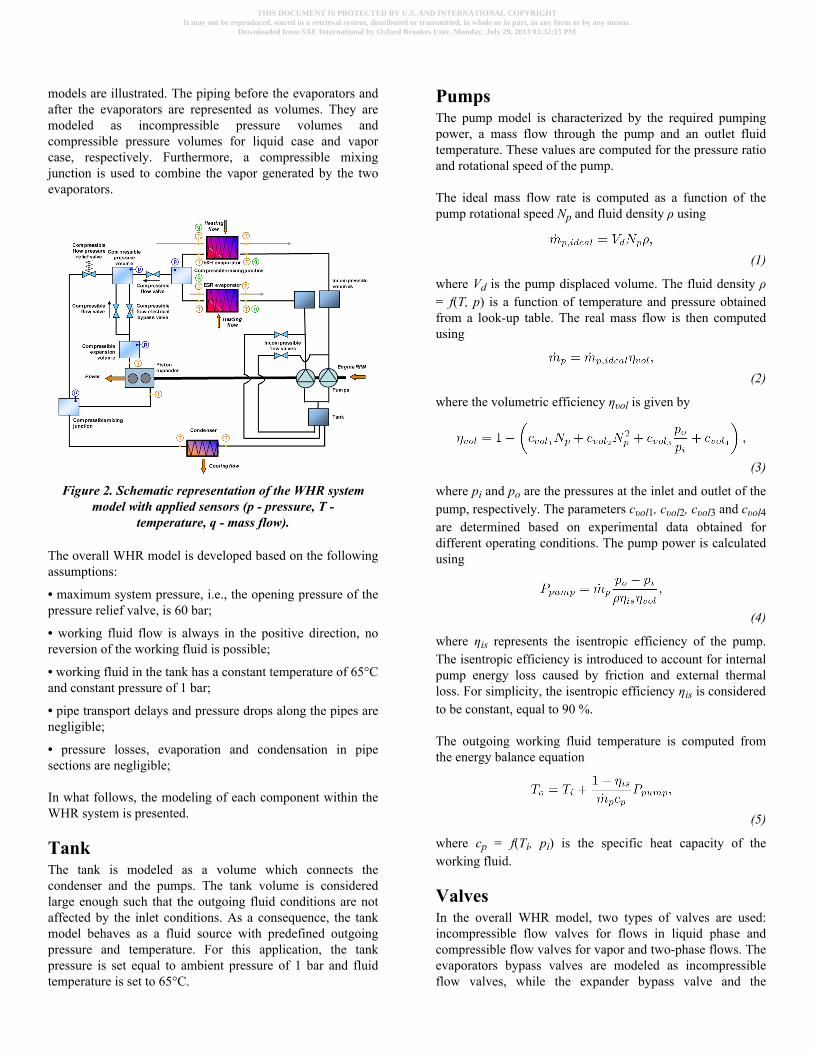
MODEL DESCRIPTIONAn overview of the dynamic WHR model along with themeasurement system is shown in Fig. 2. The components ofthe WHR system corresponding to Fig. 1 can be identified:tank, pumps, valves, evaporators, condenser and expander
THIS DOCUMENT IS PROTECTED BY U.S. AND INTERNATIONAL COPYRIGHTIt may not be reproduced, stored in a retrieval system, distributed or transmitted, in whole or in part, in any form or by any means.
Downloaded from SAE International by Oxford Brookes Univ, Monday, July 29, 2013 03:32:15 PM
models are illustrated. The piping before the evaporators andafter the evaporators are represented as volumes. They aremodeled as incompressible pressure volumes andcompressible pressure volumes for liquid case and vaporcase, respectively. Furthermore, a compressible mixingjunction is used to combine the vapor generated by the twoevaporators.
Figure 2. Schematic representation of the WHR systemmodel with applied sensors (p - pressure, T -
temperature, q - mass flow).
The overall WHR model is developed based on the followingassumptions:
• maximum system pressure, i.e., the opening pressure of thepressure relief valve, is 60 bar;
• working fluid flow is always in the positive direction, noreversion of the working fluid is possible;
• working fluid in the tank has a constant temperature of 65°Cand constant pressure of 1 bar;
• pipe transport delays and pressure drops along the pipes arenegligible;
• pressure losses, evaporation and condensation in pipesections are negligible;
In what follows, the modeling of each component within theWHR system is presented.
TankThe tank is modeled as a volume which connects thecondenser and the pumps. The tank volume is consideredlarge enough such that the outgoing fluid conditions are notaffected by the inlet conditions. As a consequence, the tankmodel behaves as a fluid source with predefined outgoingpressure and temperature. For this application, the tankpressure is set equal to ambient pressure of 1 bar and fluidtemperature is set to 65°C.
PumpsThe pump model is characterized by the required pumpingpower, a mass flow through the pump and an outlet fluidtemperature. These values are computed for the pressure ratioand rotational speed of the pump.
The ideal mass flow rate is computed as a function of thepump rotational speed Np and fluid density ρ using
(1)
where Vd is the pump displaced volume. The fluid density ρ= f(T, p) is a function of temperature and pressure obtainedfrom a look-up table. The real mass flow is then computedusing
(2)
where the volumetric efficiency ηυol is given by
(3)
where pi and po are the pressures at the inlet and outlet of thepump, respectively. The parameters cυol1, cυol2, cυol3 and cυol4are determined based on experimental data obtained fordifferent operating conditions. The pump power is calculatedusing
(4)
where ηis represents the isentropic efficiency of the pump.The isentropic efficiency is introduced to account for internalpump energy loss caused by friction and external thermalloss. For simplicity, the isentropic efficiency ηis is consideredto be constant, equal to 90 %.
The outgoing working fluid temperature is computed fromthe energy balance equation
(5)
where cp = f(Ti, pi) is the specific heat capacity of theworking fluid.
ValvesIn the overall WHR model, two types of valves are used:incompressible flow valves for flows in liquid phase andcompressible flow valves for vapor and two-phase flows. Theevaporators bypass valves are modeled as incompressibleflow valves, while the expander bypass valve and the
THIS DOCUMENT IS PROTECTED BY U.S. AND INTERNATIONAL COPYRIGHTIt may not be reproduced, stored in a retrieval system, distributed or transmitted, in whole or in part, in any form or by any means.
Downloaded from SAE International by Oxford Brookes Univ, Monday, July 29, 2013 03:32:15 PM
pressure relief valve are modeled as compressible flowvalves.
Incompressible Flow ValveThe ideal mass flow rate for a fluid in liquid state through anorifice (Fig. 3) is given by Bernoulli's equation as:
(6)
Here, subscripts 1 and 2 refer to the upstream anddownstream sections, respectively.
Figure 3. Incompressible fluid valve.
Practically, it is advantageous to refer to the orifice area A0rather than to the area A2 by means of a contraction
coefficient . Then, Equation (6) becomes
(7)
The flow through the orifice determines an energy loss,entailing a drop in the fluid flow by means of a coefficient cυ.Let us define a discharge factor cd given by
(8)and let DCcbp represent the duty cycle applied to the input ofthe bypass valve actuator. The duty cycle DCcbp is a signalbetween 0 % and 100 % corresponding to a closed valve andfully opened valve, respectively. Then the incompressiblefluid mass flow through the valve can be expressed as
(9)
The characterization of the valve requires to determine thedischarge coefficient cd. Such parameter can be estimatedusing (9) through a representative set of flow rate andpressure difference p1 - p2 measurements, at a specifiedDCcbp value. This procedure is performed using steady-statemeasurements across the valve. The thermodynamic state ofthe outgoing fluid is calculated assuming an isenthalpicprocess through the valve. Therefore, the outgoing enthalpy isequal to the inlet enthalpy, i.e. ho = hi. The outgoing
temperature To = f(po, ho) is extracted from the fluid propertytable as a function of pressure and enthalpy.
Compressible Flow ValveCompressible fluid flows through the valves are modeledusing the compressible valve flow equation
(10)
In (10), ϕ is the compressibility coefficient defined as
(11)
where γ = cp/cυ is the ration of specific heat at constantpressure and volume ratio. The parameter ψ is determinedafter a comparison of the fluid pressure ratio p2/p1 with the
critical pressure ratio , in order to decide whetherthe flow through the orifice is subsonic or supersonic, i.e.,
(12)
In case the pressure ratio through the valve reaches thecritical pressure ratio value, supersonic flow condition isreached and Equation (11) does not depend on the pressureratio across the valve but only on the gas properties.Accordingly, the mass flow dependency, given in (10),becomes only a function of the inlet pressure. This effect isassociated with so-called chocked flow.
In the compressible flow valve models, ϕ and ψ given inEquation (11) and (12), respectively, are evaluated and themass flow is computed by means of Equation (10).
The inlet fluid enthalpy is evaluated from fluid tables at thespecified inlet state variables
(13)
where f(Ti,pi) denotes the working fluid properties which isused for both working fluid states, i.e., liquid when xi = 0 andvapor when xi = 1. The outgoing vapor fraction and enthalpycalculations arise from isenthalpic process assumption, i.e., hi= ho. The outgoing vapor quality can then be computed as
THIS DOCUMENT IS PROTECTED BY U.S. AND INTERNATIONAL COPYRIGHTIt may not be reproduced, stored in a retrieval system, distributed or transmitted, in whole or in part, in any form or by any means.
Downloaded from SAE International by Oxford Brookes Univ, Monday, July 29, 2013 03:32:15 PM
(14)
where hl(po) and hυ(po) are the saturated liquid enthalpy andsaturated vapor enthalpy at pressure po, respectively. Theoutgoing flow temperature is obtained based on the fluidproperties as
(15)
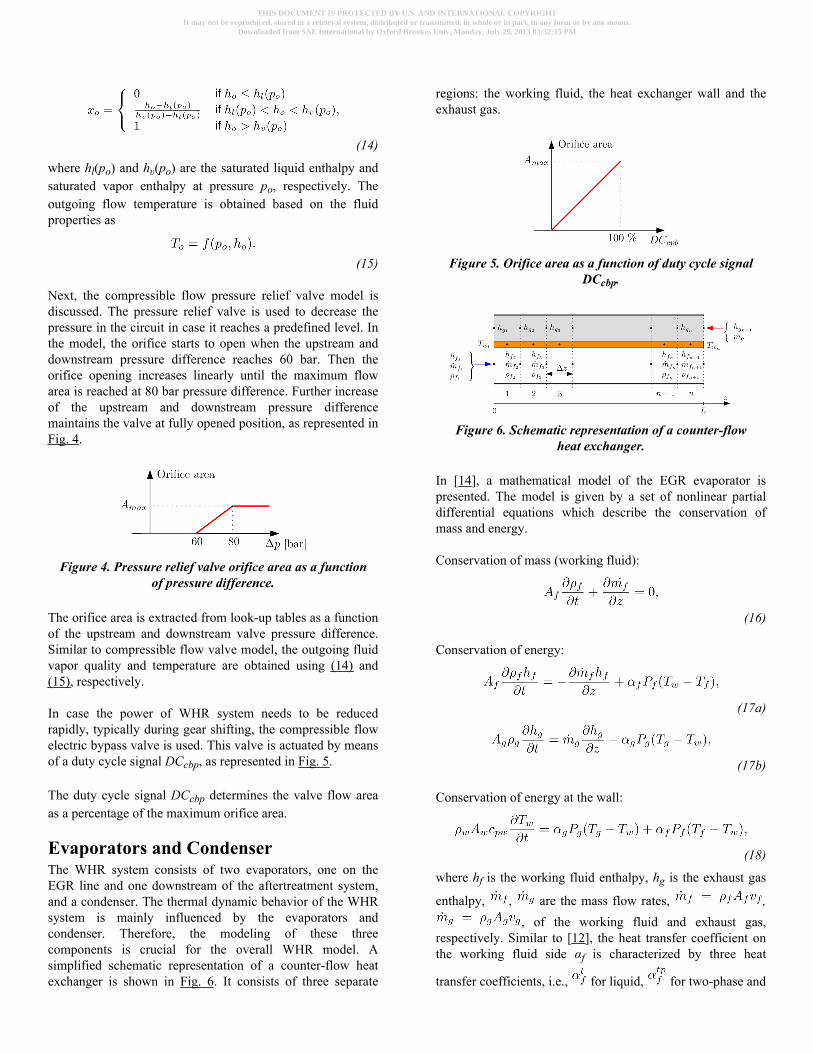
Next, the compressible flow pressure relief valve model isdiscussed. The pressure relief valve is used to decrease thepressure in the circuit in case it reaches a predefined level. Inthe model, the orifice starts to open when the upstream anddownstream pressure difference reaches 60 bar. Then theorifice opening increases linearly until the maximum flowarea is reached at 80 bar pressure difference. Further increaseof the upstream and downstream pressure differencemaintains the valve at fully opened position, as represented inFig. 4.
Figure 4. Pressure relief valve orifice area as a functionof pressure difference.
The orifice area is extracted from look-up tables as a functionof the upstream and downstream valve pressure difference.Similar to compressible flow valve model, the outgoing fluidvapor quality and temperature are obtained using (14) and(15), respectively.
In case the power of WHR system needs to be reducedrapidly, typically during gear shifting, the compressible flowelectric bypass valve is used. This valve is actuated by meansof a duty cycle signal DCcbp, as represented in Fig. 5.
The duty cycle signal DCcbp determines the valve flow areaas a percentage of the maximum orifice area.
Evaporators and CondenserThe WHR system consists of two evaporators, one on theEGR line and one downstream of the aftertreatment system,and a condenser. The thermal dynamic behavior of the WHRsystem is mainly influenced by the evaporators andcondenser. Therefore, the modeling of these threecomponents is crucial for the overall WHR model. Asimplified schematic representation of a counter-flow heatexchanger is shown in Fig. 6. It consists of three separate
regions: the working fluid, the heat exchanger wall and theexhaust gas.
Figure 5. Orifice area as a function of duty cycle signalDCcbp.
Figure 6. Schematic representation of a counter-flowheat exchanger.
In [14], a mathematical model of the EGR evaporator ispresented. The model is given by a set of nonlinear partialdifferential equations which describe the conservation ofmass and energy.
Conservation of mass (working fluid):
(16)
Conservation of energy:
(17a)
(17b)
Conservation of energy at the wall:
(18)
where hf is the working fluid enthalpy, hg is the exhaust gas
enthalpy, , are the mass flow rates, ,, of the working fluid and exhaust gas,
respectively. Similar to [12], the heat transfer coefficient onthe working fluid side αf is characterized by three heat
transfer coefficients, i.e., for liquid, for two-phase and
THIS DOCUMENT IS PROTECTED BY U.S. AND INTERNATIONAL COPYRIGHTIt may not be reproduced, stored in a retrieval system, distributed or transmitted, in whole or in part, in any form or by any means.
Downloaded from SAE International by Oxford Brookes Univ, Monday, July 29, 2013 03:32:15 PM
for vapor. To avoid any inconsistency and negative effectsin the solution process the transition between two heatexchange coefficients is performed based on a sinusinterpolation function.
The change in sign of equation (17b) compared to equation(17a) refers to a counter flow application. To account forphase change mathematical equations for the working fluidproperties (Fig. 7) are derived.
Figure 7. Ethanol temperature as a function of specificenthalpy and pressure.
The model given by (16), (17) and (18) is discretized withrespect to time and space based on a finite differenceapproximation. The resulting expressions are a set ofdifference dynamic equations, which are used to compute theevaporator model output variables.
The predicted output variables are the outlet temperatures forthe exhaust gas and working fluid side. Additionally, themodel outputs the vapor fraction and working fluid density.These variables are important for control of the evaporationprocess within the WHR system. Using similar mathematicaldescription as for the EGR evaporator, models for the EXHevaporator and condenser are developed. The EGRevaporator, EXH evaporator and condenser parameters areidentified based on the procedure given in [14].
Mixing JunctionsThese components are modeled as a constant pressure volumewhere the conservation laws for energy and mass flow areapplied. The outlet fluid thermodynamic properties areobtained by means of the mixture of several homogeneousfluids with different states and flows. The outgoing mass flowis computed through the mass flow balance equation
(19)
where n is the total number of inlet fluid streams and denotes the k-th inlet fluid mass flow. For each inlet stream k,the inlet fluid enthalpy hk,i is evaluated using (13) and fluidproperty tables at the specified inlet state variables, i.e.,temperature Tk,i, pressure pi and vapor fraction xk,i. Using the
computed enthalpies of the inlet flows, the outgoing fluidenthalpy is calculated with the energy balance equation as
(20)
The outgoing vapor quality xo(po) and outgoing flowtemperature To(po, ho) are computed using similarexpressions to (14) and (15), respectively. In order to avoidany inconsistency, note that in (20) the outgoing mass flow
is considered be to be small but different from zero forextreme cases where there is small or no flow through thesystem.
Pressure VolumesThe pressure volume model assumes the working fluid to bein a superheated vapor state and that it behaves as an idealgas. The laws for the mass conservation (21a) and energybalance (21b) are then applied to this ideal gas.
(21a)
(21b)
Next, assume the ideal gas law
(22)
and define
(23)
Then, equation (21a) and equation (21b) become
(24a)
(24b)
where V is the volume of gas and R is the ideal gas constant.Note that these equations both depend on temperature andmass flow rates and for steady state conditions Equation
THIS DOCUMENT IS PROTECTED BY U.S. AND INTERNATIONAL COPYRIGHTIt may not be reproduced, stored in a retrieval system, distributed or transmitted, in whole or in part, in any form or by any means.
Downloaded from SAE International by Oxford Brookes Univ, Monday, July 29, 2013 03:32:15 PM
(24a) and Equation (24b) simplify to and
respectively.
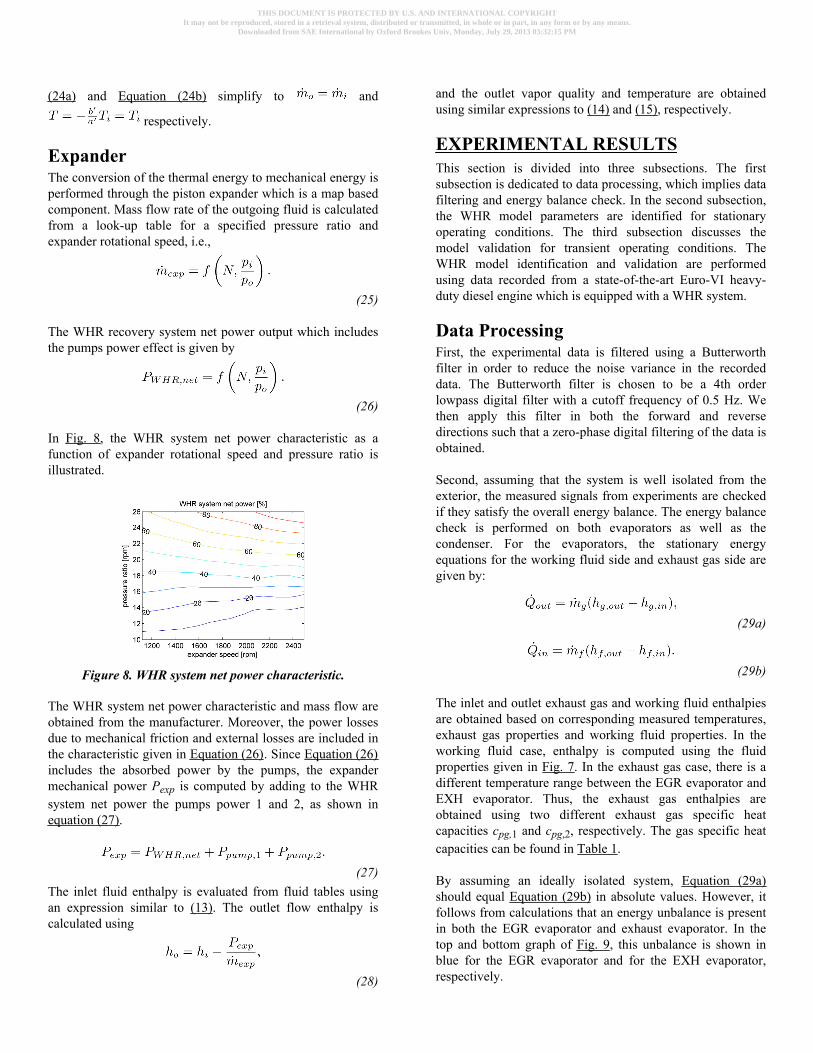
ExpanderThe conversion of the thermal energy to mechanical energy isperformed through the piston expander which is a map basedcomponent. Mass flow rate of the outgoing fluid is calculatedfrom a look-up table for a specified pressure ratio andexpander rotational speed, i.e.,
(25)
The WHR recovery system net power output which includesthe pumps power effect is given by
(26)
In Fig. 8, the WHR system net power characteristic as afunction of expander rotational speed and pressure ratio isillustrated.
Figure 8. WHR system net power characteristic.
The WHR system net power characteristic and mass flow areobtained from the manufacturer. Moreover, the power lossesdue to mechanical friction and external losses are included inthe characteristic given in Equation (26). Since Equation (26)includes the absorbed power by the pumps, the expandermechanical power Pexp is computed by adding to the WHRsystem net power the pumps power 1 and 2, as shown inequation (27).
(27)The inlet fluid enthalpy is evaluated from fluid tables usingan expression similar to (13). The outlet flow enthalpy iscalculated using
(28)
and the outlet vapor quality and temperature are obtainedusing similar expressions to (14) and (15), respectively.
EXPERIMENTAL RESULTSThis section is divided into three subsections. The firstsubsection is dedicated to data processing, which implies datafiltering and energy balance check. In the second subsection,the WHR model parameters are identified for stationaryoperating conditions. The third subsection discusses themodel validation for transient operating conditions. TheWHR model identification and validation are performedusing data recorded from a state-of-the-art Euro-VI heavy-duty diesel engine which is equipped with a WHR system.
Data ProcessingFirst, the experimental data is filtered using a Butterworthfilter in order to reduce the noise variance in the recordeddata. The Butterworth filter is chosen to be a 4th orderlowpass digital filter with a cutoff frequency of 0.5 Hz. Wethen apply this filter in both the forward and reversedirections such that a zero-phase digital filtering of the data isobtained.
Second, assuming that the system is well isolated from theexterior, the measured signals from experiments are checkedif they satisfy the overall energy balance. The energy balancecheck is performed on both evaporators as well as thecondenser. For the evaporators, the stationary energyequations for the working fluid side and exhaust gas side aregiven by:
(29a)
(29b)
The inlet and outlet exhaust gas and working fluid enthalpiesare obtained based on corresponding measured temperatures,exhaust gas properties and working fluid properties. In theworking fluid case, enthalpy is computed using the fluidproperties given in Fig. 7. In the exhaust gas case, there is adifferent temperature range between the EGR evaporator andEXH evaporator. Thus, the exhaust gas enthalpies areobtained using two different exhaust gas specific heatcapacities cpg,1 and cpg,2, respectively. The gas specific heatcapacities can be found in Table 1.
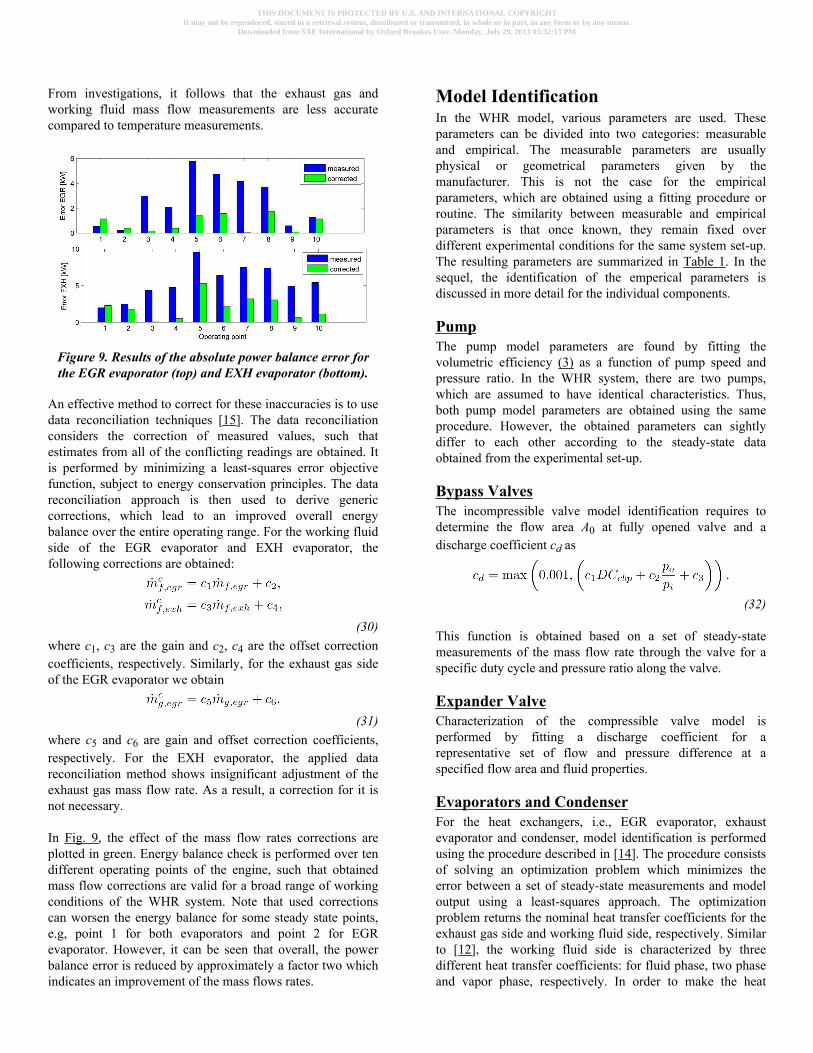
By assuming an ideally isolated system, Equation (29a)should equal Equation (29b) in absolute values. However, itfollows from calculations that an energy unbalance is presentin both the EGR evaporator and exhaust evaporator. In thetop and bottom graph of Fig. 9, this unbalance is shown inblue for the EGR evaporator and for the EXH evaporator,respectively.
THIS DOCUMENT IS PROTECTED BY U.S. AND INTERNATIONAL COPYRIGHTIt may not be reproduced, stored in a retrieval system, distributed or transmitted, in whole or in part, in any form or by any means.
Downloaded from SAE International by Oxford Brookes Univ, Monday, July 29, 2013 03:32:15 PM
From investigations, it follows that the exhaust gas andworking fluid mass flow measurements are less accuratecompared to temperature measurements.
Figure 9. Results of the absolute power balance error forthe EGR evaporator (top) and EXH evaporator (bottom).
An effective method to correct for these inaccuracies is to usedata reconciliation techniques [15]. The data reconciliationconsiders the correction of measured values, such thatestimates from all of the conflicting readings are obtained. Itis performed by minimizing a least-squares error objectivefunction, subject to energy conservation principles. The datareconciliation approach is then used to derive genericcorrections, which lead to an improved overall energybalance over the entire operating range. For the working fluidside of the EGR evaporator and EXH evaporator, thefollowing corrections are obtained:
(30)where c1, c3 are the gain and c2, c4 are the offset correctioncoefficients, respectively. Similarly, for the exhaust gas sideof the EGR evaporator we obtain
(31)where c5 and c6 are gain and offset correction coefficients,respectively. For the EXH evaporator, the applied datareconciliation method shows insignificant adjustment of theexhaust gas mass flow rate. As a result, a correction for it isnot necessary.
In Fig. 9, the effect of the mass flow rates corrections areplotted in green. Energy balance check is performed over tendifferent operating points of the engine, such that obtainedmass flow corrections are valid for a broad range of workingconditions of the WHR system. Note that used correctionscan worsen the energy balance for some steady state points,e.g, point 1 for both evaporators and point 2 for EGRevaporator. However, it can be seen that overall, the powerbalance error is reduced by approximately a factor two whichindicates an improvement of the mass flows rates.
Model IdentificationIn the WHR model, various parameters are used. Theseparameters can be divided into two categories: measurableand empirical. The measurable parameters are usuallyphysical or geometrical parameters given by themanufacturer. This is not the case for the empiricalparameters, which are obtained using a fitting procedure orroutine. The similarity between measurable and empiricalparameters is that once known, they remain fixed overdifferent experimental conditions for the same system set-up.The resulting parameters are summarized in Table 1. In thesequel, the identification of the emperical parameters isdiscussed in more detail for the individual components.
PumpThe pump model parameters are found by fitting thevolumetric efficiency (3) as a function of pump speed andpressure ratio. In the WHR system, there are two pumps,which are assumed to have identical characteristics. Thus,both pump model parameters are obtained using the sameprocedure. However, the obtained parameters can sightlydiffer to each other according to the steady-state dataobtained from the experimental set-up.
Bypass ValvesThe incompressible valve model identification requires todetermine the flow area A0 at fully opened valve and adischarge coefficient cd as
(32)
This function is obtained based on a set of steady-statemeasurements of the mass flow rate through the valve for aspecific duty cycle and pressure ratio along the valve.
Expander ValveCharacterization of the compressible valve model isperformed by fitting a discharge coefficient for arepresentative set of flow and pressure difference at aspecified flow area and fluid properties.
Evaporators and CondenserFor the heat exchangers, i.e., EGR evaporator, exhaustevaporator and condenser, model identification is performedusing the procedure described in [14]. The procedure consistsof solving an optimization problem which minimizes theerror between a set of steady-state measurements and modeloutput using a least-squares approach. The optimizationproblem returns the nominal heat transfer coefficients for theexhaust gas side and working fluid side, respectively. Similarto [12], the working fluid side is characterized by threedifferent heat transfer coefficients: for fluid phase, two phaseand vapor phase, respectively. In order to make the heat
THIS DOCUMENT IS PROTECTED BY U.S. AND INTERNATIONAL COPYRIGHTIt may not be reproduced, stored in a retrieval system, distributed or transmitted, in whole or in part, in any form or by any means.
Downloaded from SAE International by Oxford Brookes Univ, Monday, July 29, 2013 03:32:15 PM
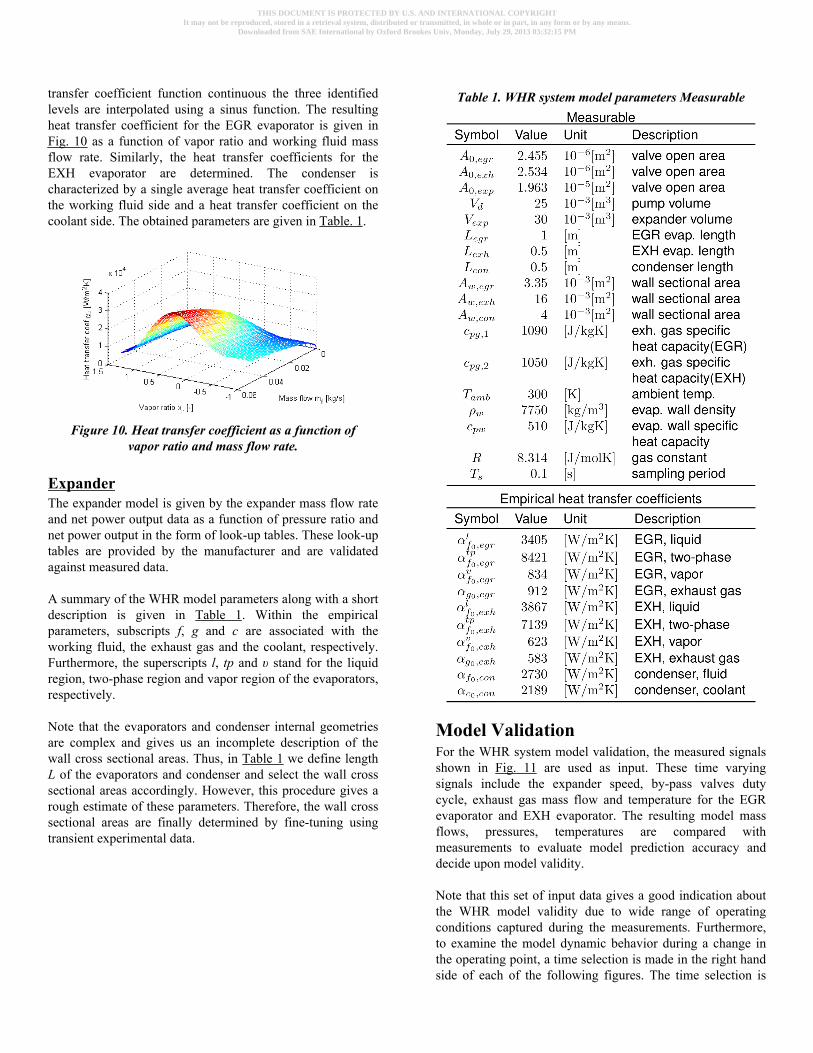
transfer coefficient function continuous the three identifiedlevels are interpolated using a sinus function. The resultingheat transfer coefficient for the EGR evaporator is given inFig. 10 as a function of vapor ratio and working fluid massflow rate. Similarly, the heat transfer coefficients for theEXH evaporator are determined. The condenser ischaracterized by a single average heat transfer coefficient onthe working fluid side and a heat transfer coefficient on thecoolant side. The obtained parameters are given in Table. 1.
Figure 10. Heat transfer coefficient as a function ofvapor ratio and mass flow rate.
ExpanderThe expander model is given by the expander mass flow rateand net power output data as a function of pressure ratio andnet power output in the form of look-up tables. These look-uptables are provided by the manufacturer and are validatedagainst measured data.
A summary of the WHR model parameters along with a shortdescription is given in Table 1. Within the empiricalparameters, subscripts f, g and c are associated with theworking fluid, the exhaust gas and the coolant, respectively.Furthermore, the superscripts l, tp and υ stand for the liquidregion, two-phase region and vapor region of the evaporators,respectively.
Note that the evaporators and condenser internal geometriesare complex and gives us an incomplete description of thewall cross sectional areas. Thus, in Table 1 we define lengthL of the evaporators and condenser and select the wall crosssectional areas accordingly. However, this procedure gives arough estimate of these parameters. Therefore, the wall crosssectional areas are finally determined by fine-tuning usingtransient experimental data.
Table 1. WHR system model parameters Measurable
Model ValidationFor the WHR system model validation, the measured signalsshown in Fig. 11 are used as input. These time varyingsignals include the expander speed, by-pass valves dutycycle, exhaust gas mass flow and temperature for the EGRevaporator and EXH evaporator. The resulting model massflows, pressures, temperatures are compared withmeasurements to evaluate model prediction accuracy anddecide upon model validity.
Note that this set of input data gives a good indication aboutthe WHR model validity due to wide range of operatingconditions captured during the measurements. Furthermore,to examine the model dynamic behavior during a change inthe operating point, a time selection is made in the right handside of each of the following figures. The time selection is
THIS DOCUMENT IS PROTECTED BY U.S. AND INTERNATIONAL COPYRIGHTIt may not be reproduced, stored in a retrieval system, distributed or transmitted, in whole or in part, in any form or by any means.
Downloaded from SAE International by Oxford Brookes Univ, Monday, July 29, 2013 03:32:15 PM
chosen at the first engine speed change for a representativetransient analysis (see top graph of Fig. 11).
Figure 11. Experimental WHR model input signals.
Bypass Valves and EvaporatorsThe valve models are validated after a comparison of theexperimental mass flow rates with the simulation mass flowrates. Since a mass flow sensor for the expander is notavailable the mass flow rate through the expander is obtainedbased on the sum of the two measured evaporators mass flowrates. As it can be seen from Fig. 12, similar behaviorbetween the model and experimental data is achieved.
In Fig. 13, the predicted working fluid temperatures at theevaporators outlet are shown. For certain operating points, theaccuracy of the model temperatures can have degradedaccuracy. The discrepancies between the experimental dataand model values show the sensitivity of the model to theenergy unbalance and predicted mass flow accuracy.However, there are several actions that can be taken forimproving the results which are given in more detail in asection dedicated for discussions.
Expander and CondenserFig. 14 indicates that the model provides an accuraterepresentation of the working fluid temperature before theexpander despite reduced accuracy of the evaporatorstemperature for certain operating conditions. This improvedaccuracy follows from the mixing junction, located after theevaporators, which has an averaging effect upon thetemperature before the expander (see Equation (20)). Theaccuracy of this temperature is important for control andexpander damage prevention. Furthermore, from Fig. 14 it
can be seen that also the temperature after the condenser iswell reproduced.
Figure 12. Working fluid mass flow through the EGRevaporator, EXH evaporator and expander.
Figure 13. Working fluid temperatures at the EGRevaporator and EXH evaporator outlet.
Figure 14. Working fluid temperature before theexpander and before and after the condenser.
In Table 2, the model accuracy is quantified through theaverage and maximum error of predicted mass flows,temperatures and pressure in all conditions by means ofsteady-state analysis. The steady-state error analysis showsthat the model can capture well the steady-state behavior of
THIS DOCUMENT IS PROTECTED BY U.S. AND INTERNATIONAL COPYRIGHTIt may not be reproduced, stored in a retrieval system, distributed or transmitted, in whole or in part, in any form or by any means.
Downloaded from SAE International by Oxford Brookes Univ, Monday, July 29, 2013 03:32:15 PM
the system. However, more significant deviation can be seenin the predicted working fluid temperature after theevaporators. These discrepancies are a consequence of theenergy unbalance, mass flow sensitivity and some effectswhich were not considered in the computed heat transfercoefficients, e.g., pressure dependence.
Table 2. Model accuracy for stationary conditions
In summary, the resulting accuracies are appropriate formodel-based control; particularly, the temperature accuracybefore expander, which is an important variables to bemonitored for expander damage prevention. However, thereis space for model improvements in steady-state and duringtransient conditions. These improvements can be achieved byincluding additional thermal effects which are not consider inthe current model representation.
Overall WHR System PerformanceThe estimated energy flows through the EGR evaporator,exhaust evaporator and condenser are shown in Fig. 15.These energy flows are of interest, since it is important tohave knowledge about the amount of heat present in theWHR system. Using this energy flow information the coolingcapacity of the WHR system can be tracked in such a waythat the engine cooling capacity in not affected. In Fig. 15 thecalculated energy flows are obtained using a combination ofmeasurements and fluid properties. This calculation isrequired since a sensor to directly measure energy flowswithin the system is not available.
In Fig. 16, the net WHR system power and efficiency areillustrated. The calculated net power and efficiency areobtained using the expander maps with measurements asinput. Then the calculated values are compared with the onescoming from the model. As expected a good prediction of thevapor temperature and pressure before the expander, within 2% (see Table. 2), provides a good estimate of the expandergenerated power. The power and efficiency predictions areimportant for a possible high-level torque controlimplementation and maximization of the amount of heatrecovered by the WHR system, respectively.
Figure 15. Energy flow through the EGR evaporator,exhaust evaporator and condenser.
Figure 16. WHR system power and efficiency.
The results shown in this section highlight that the WHRsystem output signals are reasonably well captured by themodel. Mass flow and energy flow dynamics are reproducedcorrectly over the operating range of interest for controlpurposes. However, the evaporators thermal behavior can beimproved for a better performance of the overall system.
DiscussionFrom the model validation, it is seen that there can still besignificant differences between model and experimentalresults in stationary conditions, see also Table 2. Partly, thiserror is caused by the applied measurement corrections; asillustrated in Fig. 9, this correction is not perfect and anenergy unbalance will still occur. Various componentinaccuracies will also affect the overall WHR system result.Furthermore, the evaporator outlet temperature is found to bea function of pressure, see Fig. 17 for the EXH evaporator.This is not captured by the currently applied WHR system
THIS DOCUMENT IS PROTECTED BY U.S. AND INTERNATIONAL COPYRIGHTIt may not be reproduced, stored in a retrieval system, distributed or transmitted, in whole or in part, in any form or by any means.
Downloaded from SAE International by Oxford Brookes Univ, Monday, July 29, 2013 03:32:15 PM
model. Including a pressure dependency in the heat transfercoefficients could overcome this issue. Furthermore, on onehand, the geometry of the evaporators and condenser whichcan influence the steady state results as well as dynamicresults is simplified. A complex geometry dictated by thedesign leads to differences between the heat transfer in theworking fluid side and that on the exhaust gas side. Inpractice, these effects can be taken into account by means ofgeometrical correction factors. On the other hand, errors canalso result from the tank model which in currentrepresentation is ideal, i.e., constant temperature andpressure. In real world, the tank temperature is notnecessarily constant, but it depends on the condenser coolingcapacity.
Figure 17. EXH evaporator outlet temperature as afunction of pressure.
For automotive applications, dynamic behavior is important.It is seen that errors in dynamic model predictions can besignificant. First, the corrections computed in steady-statewill be inaccurate for transient conditions. Second, alsomodel inaccuracies related to the wall heat capacity becomeprone in dynamic conditions. Based on the applied materials,it is suggested to implement a temperature dependent wallspecific heat capacity. Improvements of the dynamical resultscan also be obtained by considering the expander rotationalinertia effects which can induce changes in the mass flow ratethrough the expander as well as generated power duringtransients.
Additionally, the implementation of dynamic parameteridentification procedures could considerably improve theWHR model behavior during transients.
CONCLUSIONSIn this paper, a dynamic WHR system model was identifiedand validated for a heavy-duty automotive application. Thismodel is based on first principles modelling and on empiricalcorrelations from the manufacturer. Using enginedynamometer data, it is shown that the WHR model has goodaccuracy for stationary operating points: average modellingerror between 2% and 6%. However, the prediction accuracyof the evaporators models within the WHR system is
moderate: up to 8%. As seen from the error analysis, mainmodel improvements we recommend include:
• pressure dependency of the heat transfer coefficients
• wall specific heat capacity as a function of temperature
• thermal model of the tank
• expander rotational inertia effects
The validated WHR system model can run in real-time, suchthat it is suitable for control design and optimization.
Besides WHR system model improvements, future researchwill focus on the development of a low-level WHR controlstrategy and on the extension of the supervisory controlstrategy developed in [16], which combines energy andemission management.
ACKNOWLEDGEMENTSThis research is done in the framework of the FERVENTresearch program (Further Emission Reduction, VehicleEfficiency gains and Neutral Thermal loading). This programis partially funded by the Dutch Ministry of Economicalaffairs.
CONTACT INFORMATIONEmanuel FeruEindhoven University of TechnologyP.O. Box 5135600 MB EindhovenThe [email protected]: +31 40 247 2072
REFERENCES1. Hounsham, S., Stobart, R., Cooke, A., and Childs, P.,“Energy Recovery Systems for Engines,” SAE TechnicalPaper 2008-01-0309, 2008, doi: 10.4271/2008-01-0309.
2. Teng, H., Regner, G., and Cowland, C., “Achieving HighEngine Efficiency for Heavy-Duty Diesel Engines by WasteHeat Recovery Using Supercritical Organic-Fluid RankineCycle,” SAE Technical Paper 2006-01-3522, 2006, doi:10.4271/2006-01-3522.
3. Edwards, K., Wagner, R., and Briggs, T., “InvestigatingPotential Light-duty Efficiency Improvements throughSimulation of Turbo-compounding and Waste-heat RecoverySystems,” SAE Technical Paper 2010-01-2209, 2010, doi:10.4271/2010-01-2209.
4. Teng, H. and Regner, G., “Improving Fuel Economy forHD Diesel Engines with WHR Rankine Cycle Driven byEGR Cooler Heat Rejection,” SAE Technical Paper2009-01-2913, 2009, doi: 10.4271/2009-01-2913.
THIS DOCUMENT IS PROTECTED BY U.S. AND INTERNATIONAL COPYRIGHTIt may not be reproduced, stored in a retrieval system, distributed or transmitted, in whole or in part, in any form or by any means.
Downloaded from SAE International by Oxford Brookes Univ, Monday, July 29, 2013 03:32:15 PM
5. Howell T.. Development of an ORC system to improveHD truck fuel efficiency. Technical Report RD.11/353805.1.,DEER Conference, Ricardo Inc, October 2011.6. Nelson C.. Exhaust Energy Recovery. Technical ReportDE-FC26-05NT42419, DEER Conference, Cummins, August2009.7. Park, T., Teng, H., Hunter, G., van der Velde, B. et al., “ARankine Cycle System for Recovering Waste Heat from HDDiesel Engines - Experimental Results,” SAE TechnicalPaper 2011-01-1337, 2011, doi: 10.4271/2011-01-1337.8. Teng, H., Klaver, J., Park, T., Hunter, G. et al., “ARankine Cycle System for Recovering Waste Heat from HDDiesel Engines - WHR System Development,” SAETechnical Paper 2011-01-0311, 2011, doi:10.4271/2011-01-0311.9. Colonna P. and van Putten H.. Dynamic modeling ofsteam power cycles. Part I - Modeling paradigm andvalidation. Applied Thermal Engineering, 27(2-3):467-480,2007.10. van Putten H. and Colonna P.. Dynamic modeling ofsteam power cycles. Part II - Simulation of a small simpleRankine cycle system. Applied Thermal Engineering,27(14-15):2566-2582, 2007.11. Wei D., Lu X., Lu Z., and Gu J.. Dynamic modeling andsimulation of an organic rankine cycle (orc) system for wasteheat recovery. Applied Thermal Engineering, 28(10):1216-1224, 2008.12. Quoilin S.. Sustainable Energy Conversion Through theUse of Organic Rankine Cycles for Waste Heat Recovery andSolar Applications, Ph.D. Thesis. University of Liege, 2011.13. Badami M. and Mura M.. Preliminary design andcontrolling strategies of a small-scale wood waste RankineCycle (RC) with reciprocating steam engine (SE). Energy,34(9):1315-1324, 2009.14. Feru E., Willems F., Rojer C., de Jager B., and SteinbuchM.. Heat Exchanger Model Identification for Control ofWaste Heat Recovery System in Diesel Engines. Accepted to2013 American Control Conference, Washington DC, USA.15. Bagajewicz M. J. and Cabrera E.. Data reconciliation ingas pipeline systems. Ind. Eng. Chem. Res., 42(22):5596-5606, 2003.16. Willems F., Kupper F., and Cloudt R.. IntegratedPowertrain Control for optimal CO2-NOx tradeoff in an
Euro-VI diesel engine with Waste Heat Recovery system. InProceedings of the 2012 American Control Conference,pages 1296-1301, Montreal, Canada, 2012.
The Engineering Meetings Board has approved this paper for publication. It hassuccessfully completed SAE's peer review process under the supervision of the sessionorganizer. This process requires a minimum of three (3) reviews by industry experts.
All rights reserved. No part of this publication may be reproduced, stored in aretrieval system, or transmitted, in any form or by any means, electronic, mechanical,photocopying, recording, or otherwise, without the prior written permission of SAE.
ISSN 0148-7191
Positions and opinions advanced in this paper are those of the author(s) and notnecessarily those of SAE. The author is solely responsible for the content of the paper.
SAE Customer Service:Tel: 877-606-7323 (inside USA and Canada)Tel: 724-776-4970 (outside USA)Fax: 724-776-0790Email: [email protected] Web Address: http://www.sae.orgPrinted in USA
THIS DOCUMENT IS PROTECTED BY U.S. AND INTERNATIONAL COPYRIGHTIt may not be reproduced, stored in a retrieval system, distributed or transmitted, in whole or in part, in any form or by any means.
Downloaded from SAE International by Oxford Brookes Univ, Monday, July 29, 2013 03:32:15 PM