34
©TNS 2012 2013 Economic Review, Trends & 2014 Forecast Ralf Matthaes Regional Managing Director Cambodia | Laos | Myanmar | Vietnam

©TNS 2012
3.14 X AXIS
6.65 BASE MARGIN
5.95 TOP MARGIN
4.52 CHART TOP
11.90 LEFT MARGIN
11.90 RIGHT MARGIN
2013 Economic Review, Trends & 2014 Forecast
Ralf Matthaes Regional Managing Director Cambodia | Laos | Myanmar | Vietnam
©TNS 2012
3.14 X AXIS
6.65 BASE MARGIN
5.95 TOP MARGIN
4.52 CHART TOP
11.90 LEFT MARGIN
11.90 RIGHT MARGIN
Contents
2
1 Economic overview 2012 - 2103
2 Recession impact
3 Retail impact
4 Marketing trends
5 2014 forecast
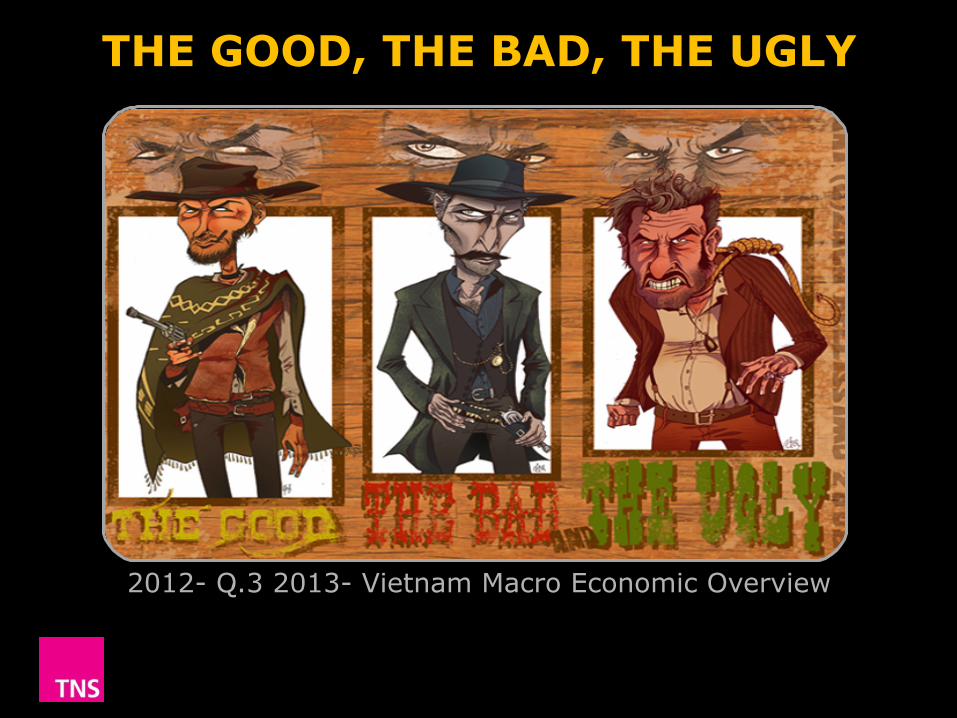
2012- Q.3 2013- Vietnam Macro Economic Overview
THE GOOD, THE BAD, THE UGLY
©TNS 2012
3.14 X AXIS
6.65 BASE MARGIN
5.95 TOP MARGIN
4.52 CHART TOP
11.90 LEFT MARGIN
11.90 RIGHT MARGIN
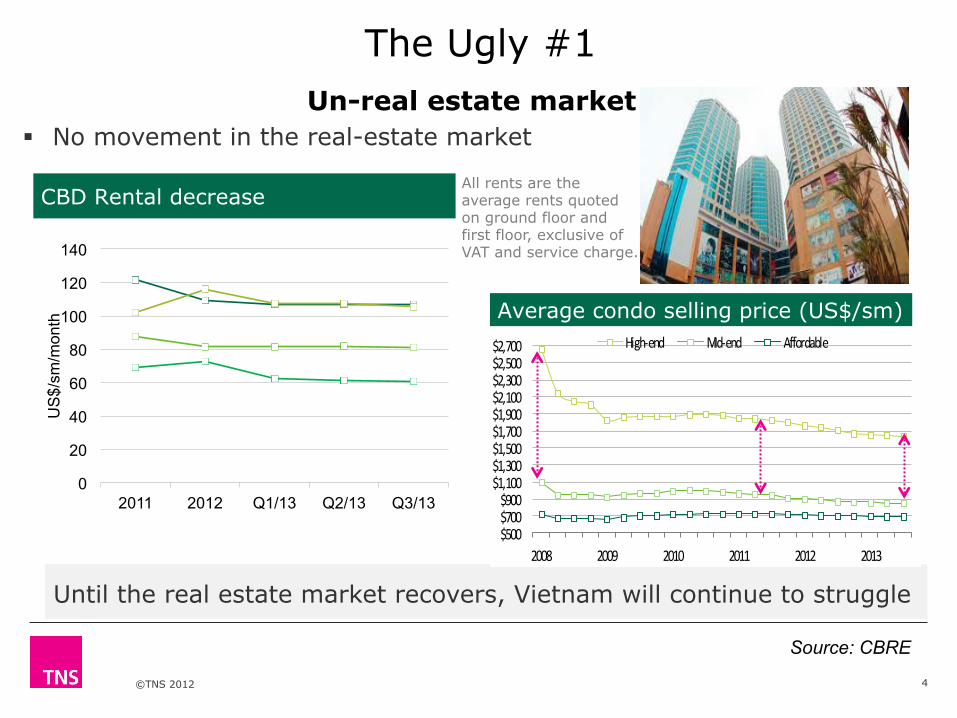
Un-real estate market § No movement in the real-estate market
Until the real estate market recovers, Vietnam will continue to struggle
4
The Ugly #1
0
20
40
60
80
100
120
140
2011 2012 Q1/13 Q2/13 Q3/13
US
$/sm
/mon
th
CBD Rental decrease
Average condo selling price (US$/sm)
$500$700$900
$1,100$1,300$1,500$1,700$1,900$2,100$2,300$2,500$2,700
2008 2009 2010 2011 2012 2013
High-‐end Mid-‐end Affordable
Source: CBRE
All rents are the average rents quoted on ground floor and first floor, exclusive of VAT and service charge.
©TNS 2012
3.14 X AXIS
6.65 BASE MARGIN
5.95 TOP MARGIN
4.52 CHART TOP
11.90 LEFT MARGIN
11.90 RIGHT MARGIN
5
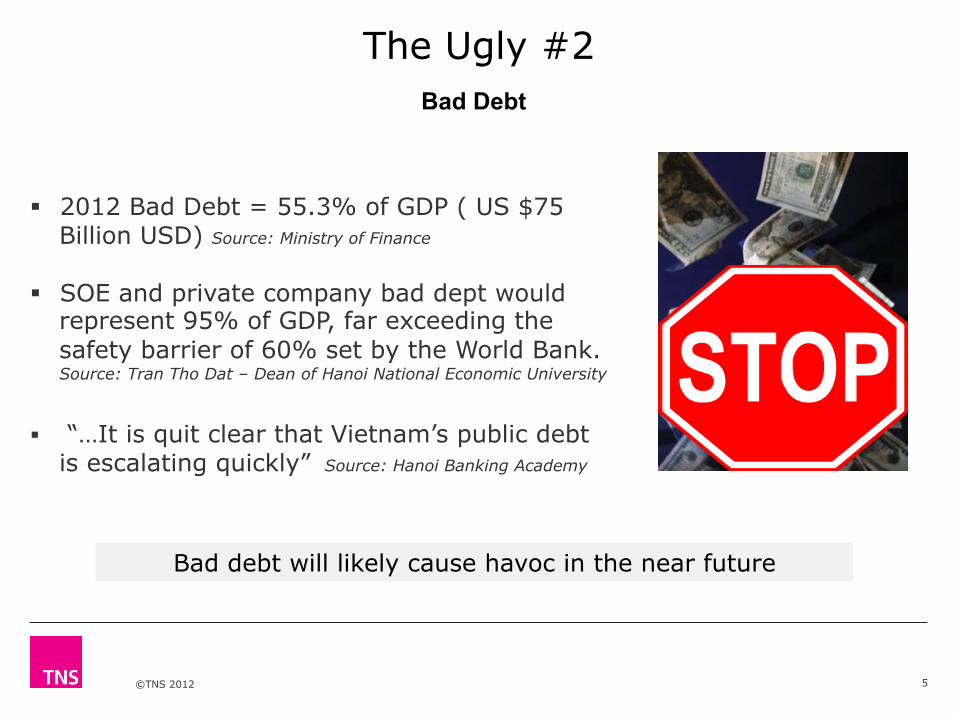
The Ugly #2
§ 2012 Bad Debt = 55.3% of GDP ( US $75
Billion USD) Source: Ministry of Finance
§ SOE and private company bad dept would represent 95% of GDP, far exceeding the safety barrier of 60% set by the World Bank. Source: Tran Tho Dat – Dean of Hanoi National Economic University
§ “…It is quit clear that Vietnam’s public debt
is escalating quickly” Source: Hanoi Banking Academy
Bad debt will likely cause havoc in the near future
Bad Debt
©TNS 2012
3.14 X AXIS
6.65 BASE MARGIN
5.95 TOP MARGIN
4.52 CHART TOP
11.90 LEFT MARGIN
11.90 RIGHT MARGIN
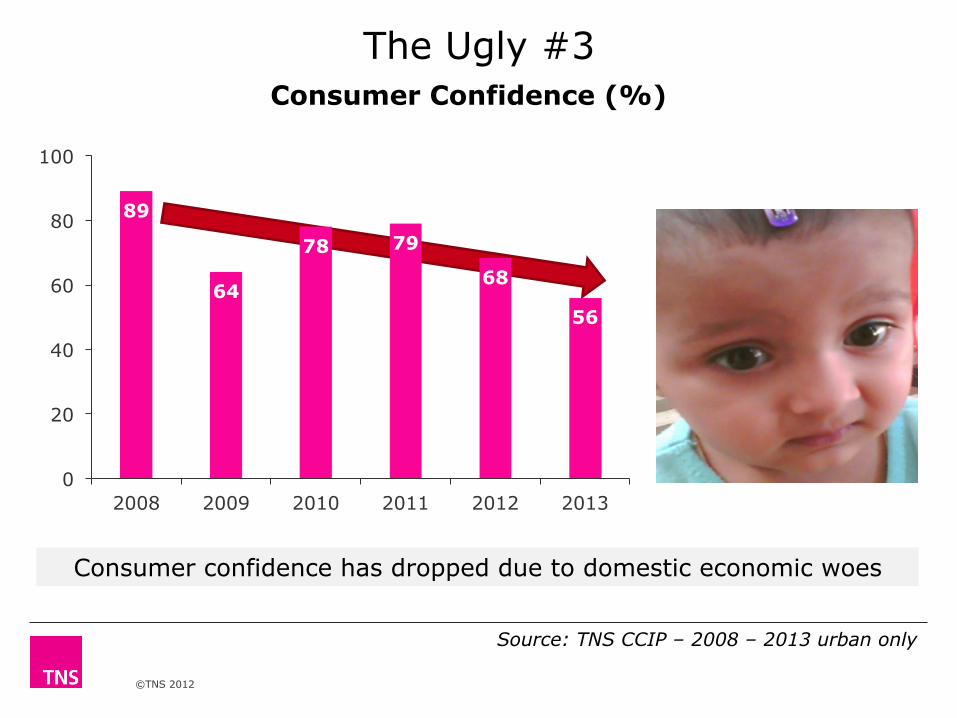
The Ugly #3
Source: TNS CCIP – 2008 – 2013 urban only
Consumer confidence has dropped due to domestic economic woes
Consumer Confidence (%)
89
64
78 79
68
56
0
20
40
60
80
100
2008 2009 2010 2011 2012 2013
©TNS 2012
3.14 X AXIS
6.65 BASE MARGIN
5.95 TOP MARGIN
4.52 CHART TOP
11.90 LEFT MARGIN
11.90 RIGHT MARGIN
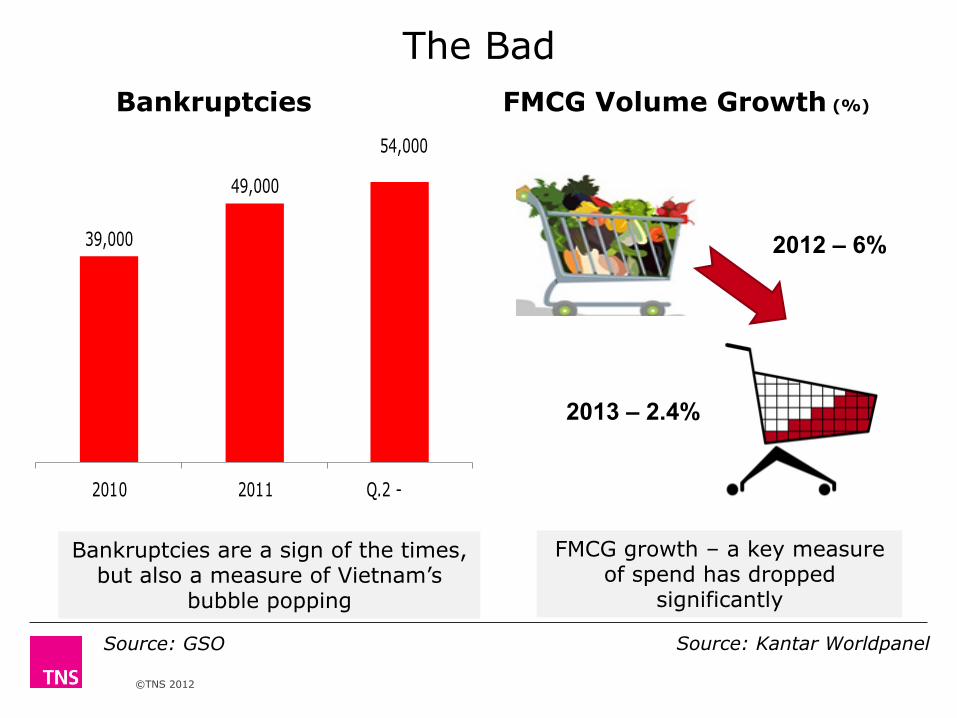
The Bad
Source: GSO
Bankruptcies are a sign of the times, but also a measure of Vietnam’s
bubble popping
Bankruptcies FMCG Volume Growth (%)
39,000
49,000
54,000
2010 2011 Q.2 - 2012
2012 – 6%
2013 – 2.4%
FMCG growth – a key measure of spend has dropped
significantly
Source: Kantar Worldpanel
©TNS 2012
3.14 X AXIS
6.65 BASE MARGIN
5.95 TOP MARGIN
4.52 CHART TOP
11.90 LEFT MARGIN
11.90 RIGHT MARGIN
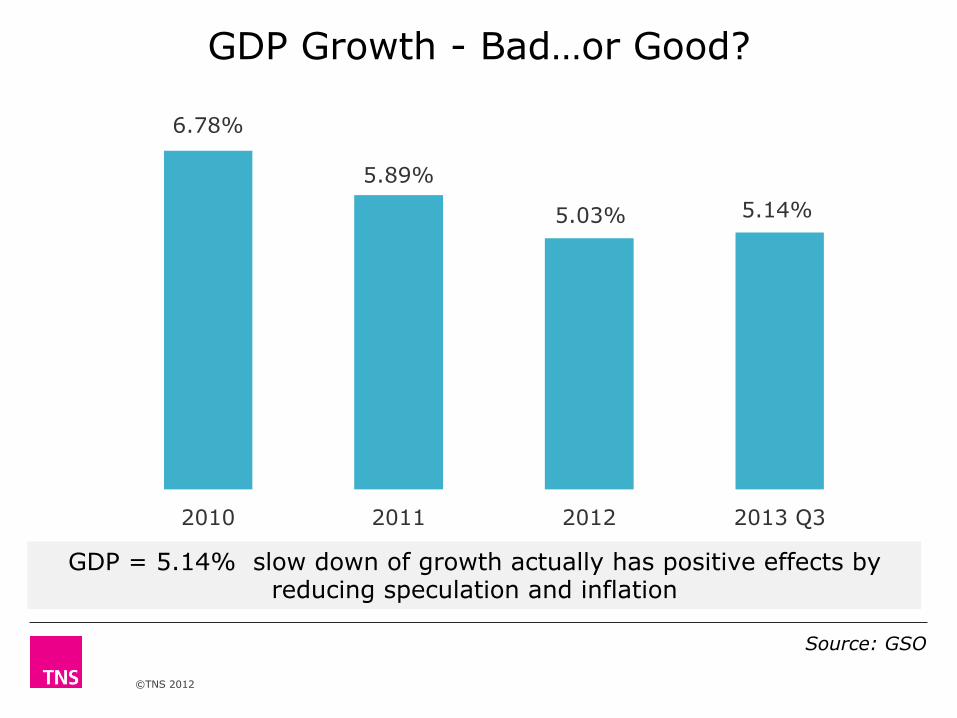
GDP Growth - Bad…or Good?
Source: GSO
GDP = 5.14% slow down of growth actually has positive effects by reducing speculation and inflation
6.78%
5.89%
5.03% 5.14%
2010 2011 2012 2013 Q3
©TNS 2012
3.14 X AXIS
6.65 BASE MARGIN
5.95 TOP MARGIN
4.52 CHART TOP
11.90 LEFT MARGIN
11.90 RIGHT MARGIN
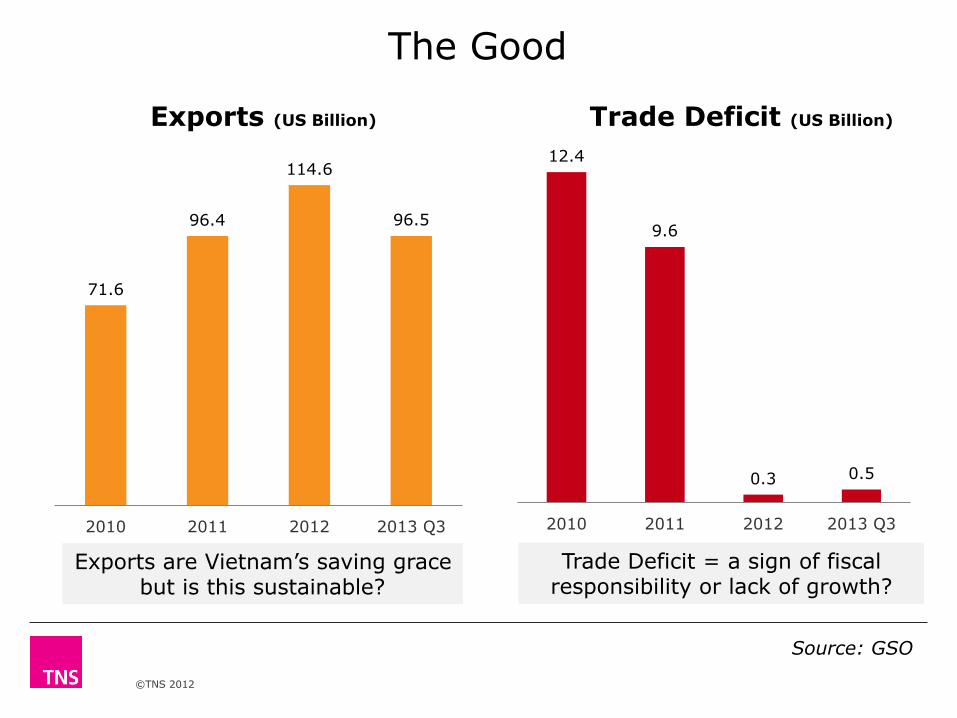
The Good
Source: GSO
Exports are Vietnam’s saving grace but is this sustainable?
Trade Deficit = a sign of fiscal responsibility or lack of growth?
71.6
96.4
114.6
96.5
2010 2011 2012 2013 Q3
12.4
9.6
0.3 0.5
2010 2011 2012 2013 Q3
Exports (US Billion) Trade Deficit (US Billion)
©TNS 2012
3.14 X AXIS
6.65 BASE MARGIN
5.95 TOP MARGIN
4.52 CHART TOP
11.90 LEFT MARGIN
11.90 RIGHT MARGIN
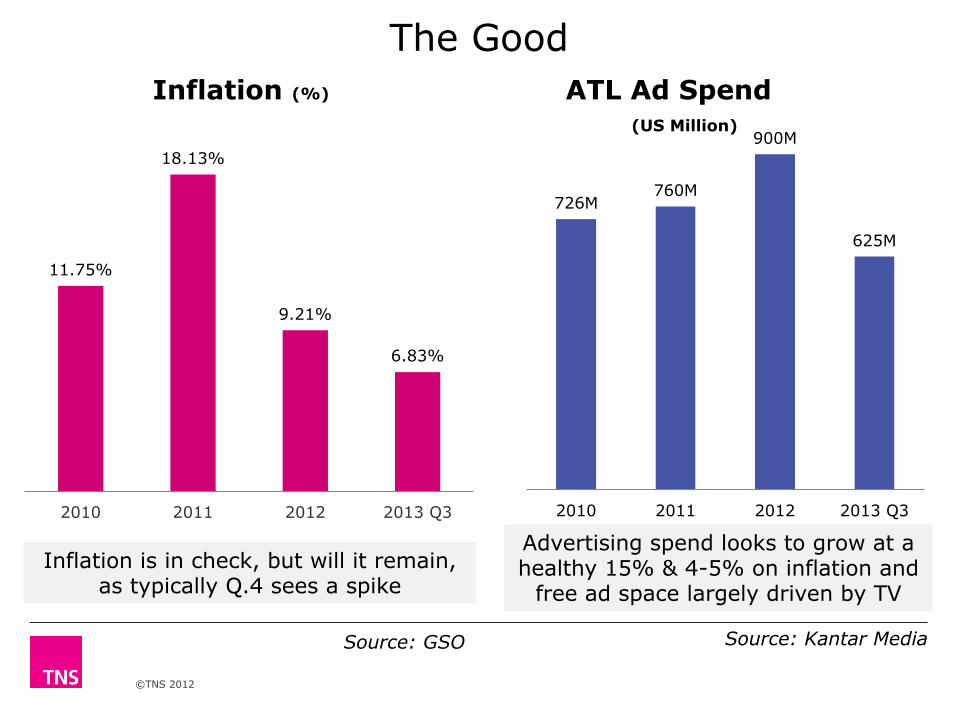
The Good
Inflation is in check, but will it remain, as typically Q.4 sees a spike
Source: GSO
Advertising spend looks to grow at a healthy 15% & 4-5% on inflation and
free ad space largely driven by TV
11.75%
18.13%
9.21%
6.83%
2010 2011 2012 2013 Q3
726M 760M
900M
625M
2010 2011 2012 2013 Q3
Inflation (%) ATL Ad Spend (US Million)
Source: Kantar Media
3.14 X AXIS
6.65 BASE MARGIN
5.95 TOP MARGIN
4.52 CHART TOP
11.90 LEFT MARGIN
11.90 RIGHT MARGIN
TNS Consumer Confidence Poll
© TNS
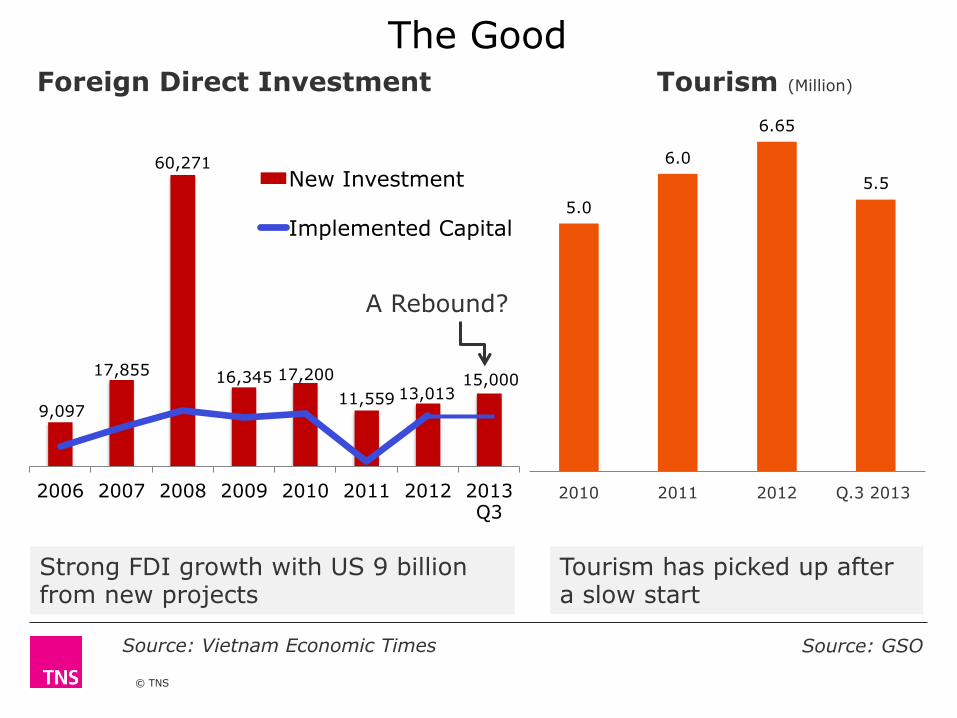
The Good
9,097
17,855
60,271
16,345 17,200 11,559 13,013
15,000
2006 2007 2008 2009 2010 2011 2012 2013 Q3
New Investment
Implemented Capital
A Rebound?
Strong FDI growth with US 9 billion from new projects
Foreign Direct Investment Tourism (Million)
5.0
6.0
6.65
5.5
2010 2011 2012 Q.3 2013
Tourism has picked up after a slow start
Source: Vietnam Economic Times Source: GSO
© TNS 2013
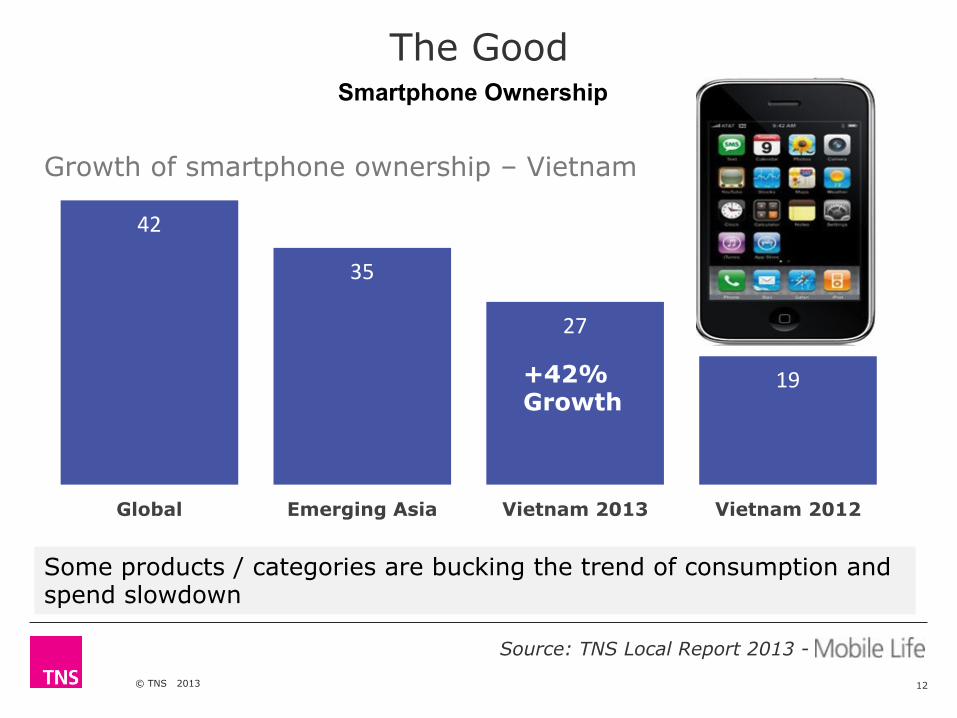
The Good
12
42
35
27
19
Global Emerging Asia Vietnam 2013 Vietnam 2012
Growth of smartphone ownership – Vietnam
Source: TNS Local Report 2013 -
+42% Growth
Some products / categories are bucking the trend of consumption and spend slowdown
Smartphone Ownership
3.14 X AXIS
6.65 BASE MARGIN
5.95 TOP MARGIN
4.52 CHART TOP
11.90 LEFT MARGIN
11.90 RIGHT MARGIN
TNS Consumer Confidence Poll
© TNS
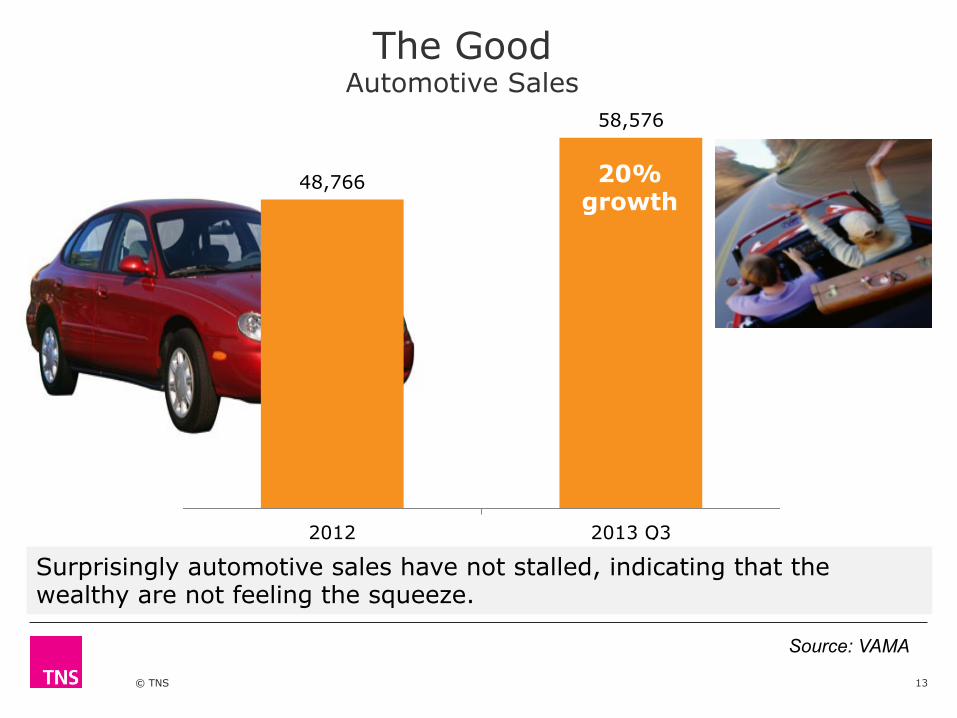
The Good Automotive Sales
13
Surprisingly automotive sales have not stalled, indicating that the wealthy are not feeling the squeeze.
48,766
58,576
2012 2013 Q3
20% growth
Source: VAMA
©TNS 2012
3.14 X AXIS
6.65 BASE MARGIN
5.95 TOP MARGIN
4.52 CHART TOP
11.90 LEFT MARGIN
11.90 RIGHT MARGIN
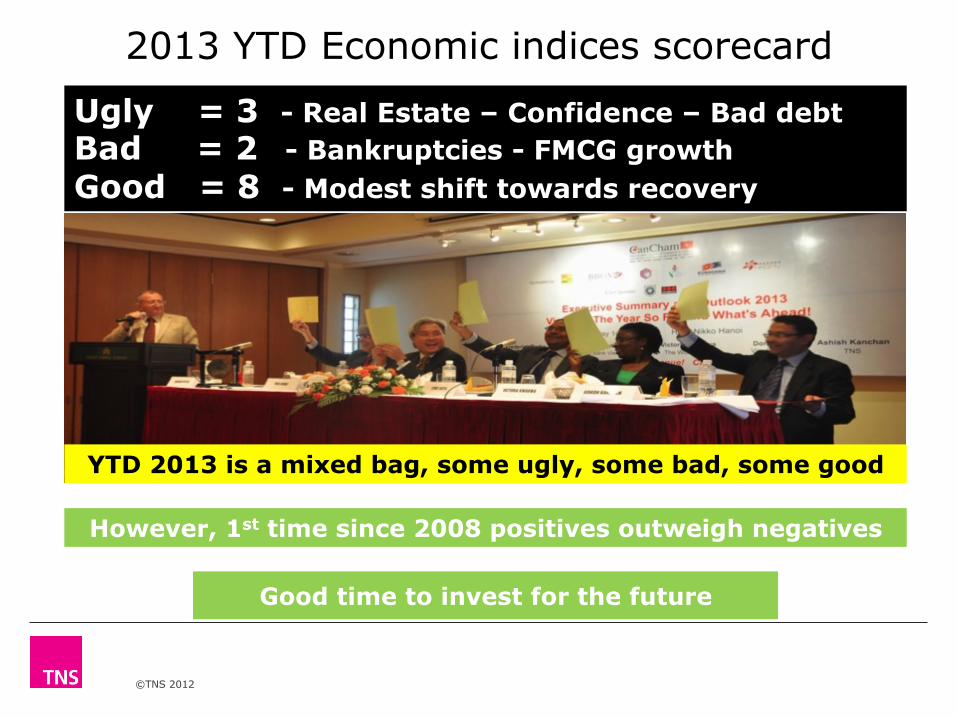
2013 YTD Economic indices scorecard
Ugly = 3 - Real Estate – Confidence – Bad debt Bad = 2 - Bankruptcies - FMCG growth Good = 8 - Modest shift towards recovery
Good time to invest for the future
However, 1st time since 2008 positives outweigh negatives
YTD 2013 is a mixed bag, some ugly, some bad, some good

©TNS 2012
3.14 X AXIS
6.65 BASE MARGIN
5.95 TOP MARGIN
4.52 CHART TOP
11.90 LEFT MARGIN
11.90 RIGHT MARGIN
RECESSION IMPACT
©TNS 2012
3.14 X AXIS
6.65 BASE MARGIN
5.95 TOP MARGIN
4.52 CHART TOP
11.90 LEFT MARGIN
11.90 RIGHT MARGIN
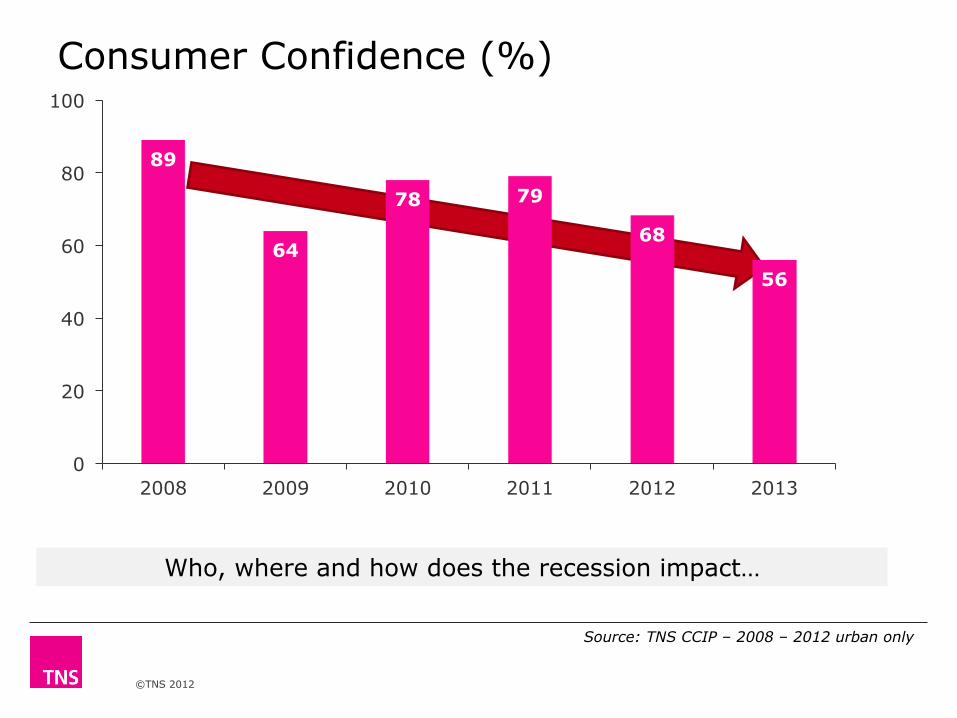
Source: TNS CCIP – 2008 – 2012 urban only
Who, where and how does the recession impact…
Consumer Confidence (%)
89
64
78 79
68
56
0
20
40
60
80
100
2008 2009 2010 2011 2012 2013
©TNS 2012
3.14 X AXIS
6.65 BASE MARGIN
5.95 TOP MARGIN
4.52 CHART TOP
11.90 LEFT MARGIN
11.90 RIGHT MARGIN
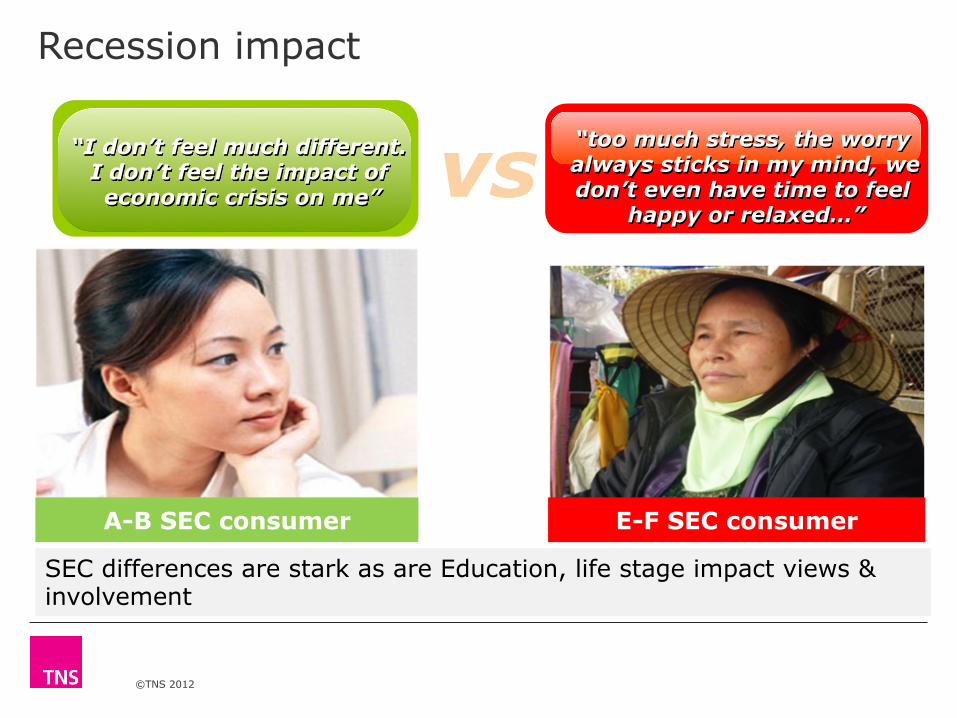
Recession impact “too much stress, the worry
always sticks in my mind, we don’t even have time to feel
happy or relaxed…”
“I don’t feel much different. I don’t feel the impact of economic crisis on me” vs
A-B SEC consumer E-F SEC consumer
SEC differences are stark as are Education, life stage impact views & involvement
©TNS 2012
3.14 X AXIS
6.65 BASE MARGIN
5.95 TOP MARGIN
4.52 CHART TOP
11.90 LEFT MARGIN
11.90 RIGHT MARGIN
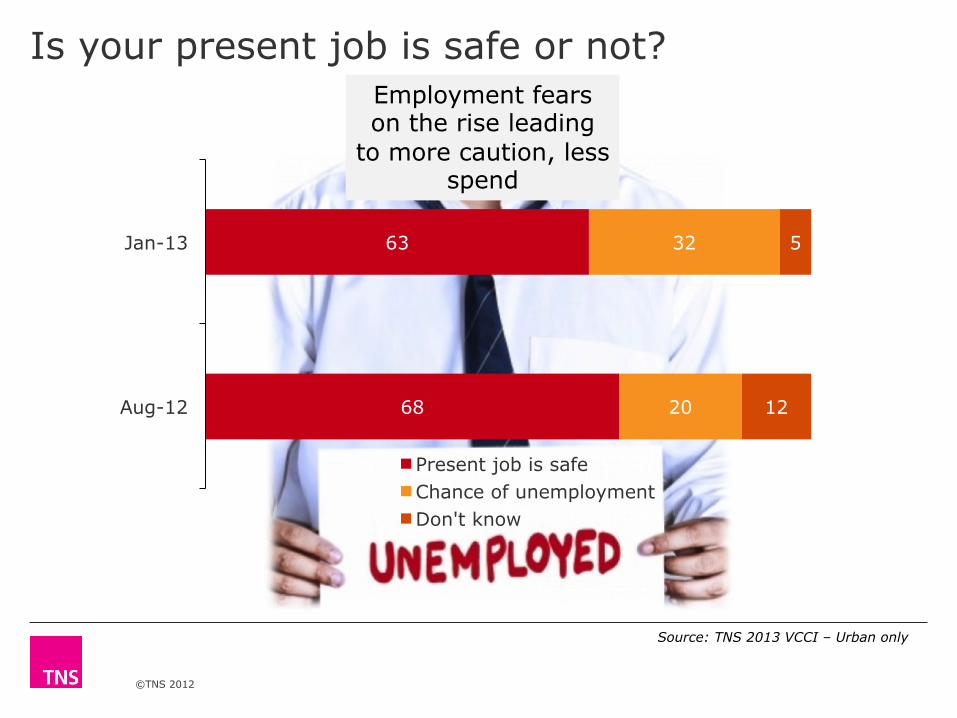
Is your present job is safe or not?
68
63
20
32
12
5
Aug-12
Jan-13
Present job is safe Chance of unemployment Don't know
Employment fears on the rise leading
to more caution, less spend
Source: TNS 2013 VCCI – Urban only
©TNS 2012
3.14 X AXIS
6.65 BASE MARGIN
5.95 TOP MARGIN
4.52 CHART TOP
11.90 LEFT MARGIN
11.90 RIGHT MARGIN
5
6
4
5
2
2
45
38
25
29
12
17
34
30
41
35
48
38
14
23
26
30
33
32
1
3
4
2
6
3 8
25
12
11
9
6
3
40
39
34
40
15
24
24
29
34
18
48
26
8
17
18
24
22
30
2
3
3
8
9
4
1
1
13
Value of the Vietnamese dong
Employment
The cost of living
Vietnam's economy
My personal standard of living
Foreign investment
Far worse A little worse Same A little better Far better DK
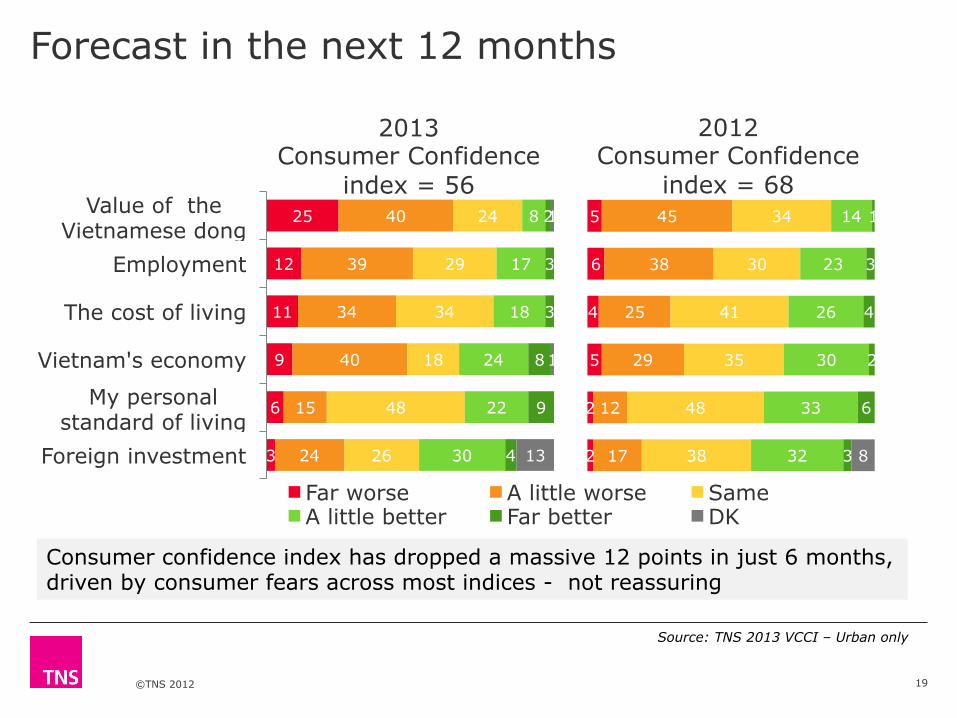
Forecast in the next 12 months
19
2013 Consumer Confidence
index = 56
2012 Consumer Confidence
index = 68
Source: TNS 2013 VCCI – Urban only
Consumer confidence index has dropped a massive 12 points in just 6 months, driven by consumer fears across most indices - not reassuring
©TNS 2012
3.14 X AXIS
6.65 BASE MARGIN
5.95 TOP MARGIN
4.52 CHART TOP
11.90 LEFT MARGIN
11.90 RIGHT MARGIN
40 25 25 25 24 21 21
17 17 15 8
39 54 51 52 54
43 58
58 46
58 45
20 21 24 22 22
36 21
24 36
27 45
1
1
1 1
2
Entertainment & dining out
House hold care products
Household utilities
Personal equipment (mobile
Home appliances (wash
Transportation
Personal care products
Communications (telephone/fax/
Health care products/services
Food & beverages products
Education
Less Same More DK
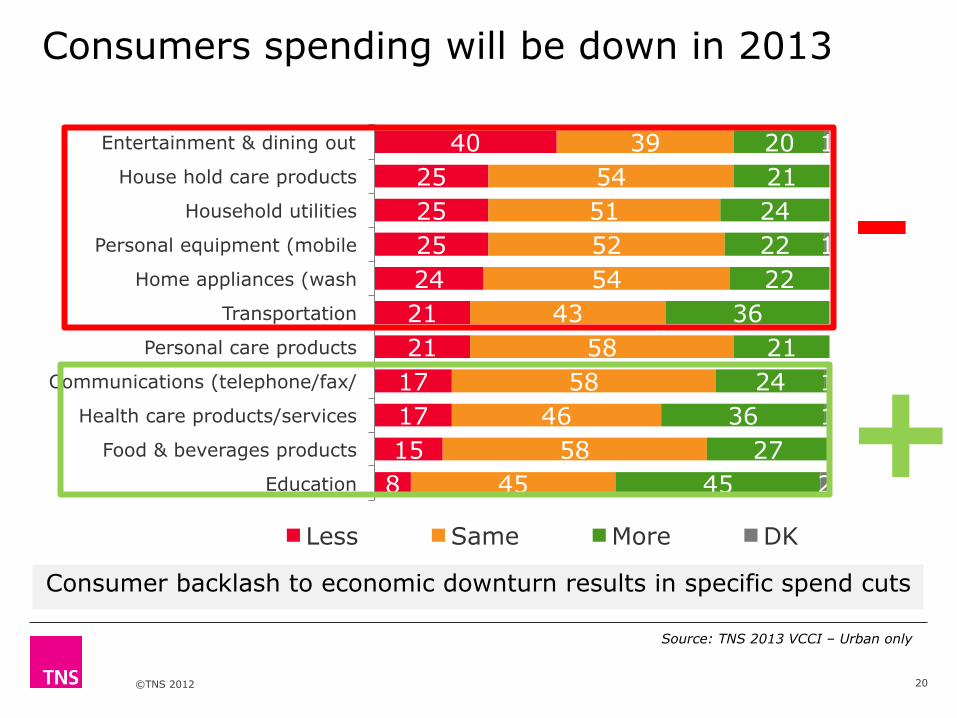
- Consumers spending will be down in 2013
20
Consumer backlash to economic downturn results in specific spend cuts
Source: TNS 2013 VCCI – Urban only
+

RETAIL IMPACT
©TNS 2012
3.14 X AXIS
6.65 BASE MARGIN
5.95 TOP MARGIN
4.52 CHART TOP
11.90 LEFT MARGIN
11.90 RIGHT MARGIN
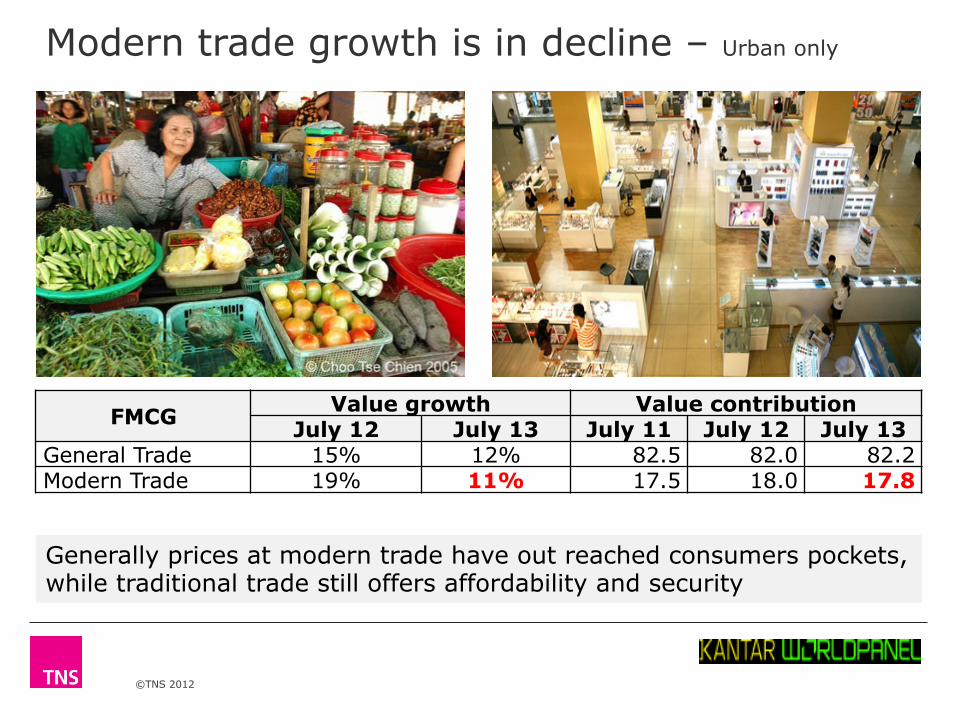
Modern trade growth is in decline – Urban only
Generally prices at modern trade have out reached consumers pockets, while traditional trade still offers affordability and security
FMCG Value growth Value contribution July 12 July 13 July 11 July 12 July 13
General Trade 15% 12% 82.5 82.0 82.2 Modern Trade 19% 11% 17.5 18.0 17.8
©TNS 2012
3.14 X AXIS
6.65 BASE MARGIN
5.95 TOP MARGIN
4.52 CHART TOP
11.90 LEFT MARGIN
11.90 RIGHT MARGIN
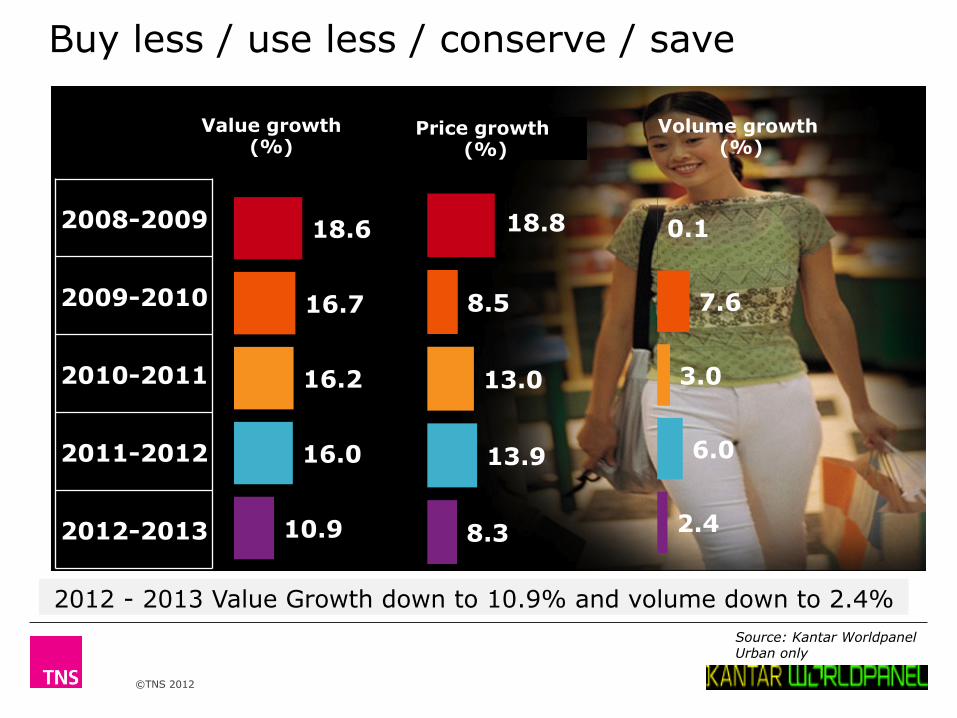
2012 - 2013 Value Growth down to 10.9% and volume down to 2.4%
Buy less / use less / conserve / save
2008-2009
2009-2010
2010-2011
2011-2012
2012-2013
18.6
16.7
16.2
16.0
10.9
Value growth (%)
18.8
8.5
13.0
13.9
8.3
0.1
7.6
3.0
6.0
2.4
Price growth (%)
Volume growth (%)
Source: Kantar Worldpanel Urban only
©TNS 2012
3.14 X AXIS
6.65 BASE MARGIN
5.95 TOP MARGIN
4.52 CHART TOP
11.90 LEFT MARGIN
11.90 RIGHT MARGIN
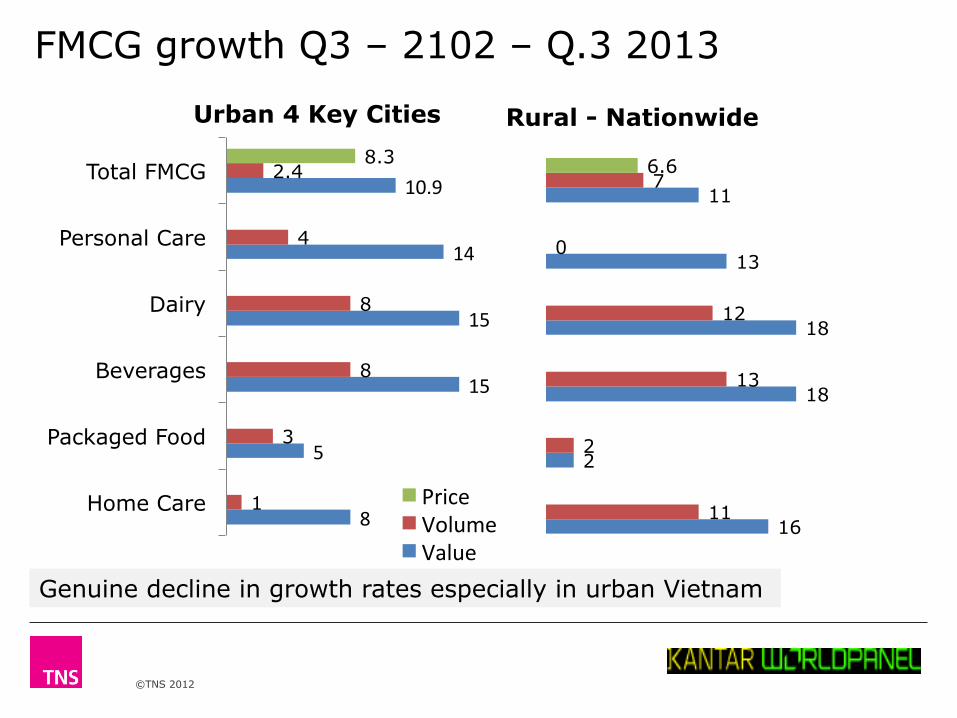
8
5
15
15
14
10.9
1
3
8
8
4
2.4 8.3
Home Care
Packaged Food
Beverages
Dairy
Personal Care
Total FMCG
Price Volume Value
16
2
18
18
13
11
11
2
13
12
0
7 6.6
Urban 4 Key Cities Rural - Nationwide
FMCG growth Q3 – 2102 – Q.3 2013
Genuine decline in growth rates especially in urban Vietnam

©TNS 2012
3.14 X AXIS
6.65 BASE MARGIN
5.95 TOP MARGIN
4.52 CHART TOP
11.90 LEFT MARGIN
11.90 RIGHT MARGIN
SIX MARKETING TRENDS
©TNS 2012
3.14 X AXIS
6.65 BASE MARGIN
5.95 TOP MARGIN
4.52 CHART TOP
11.90 LEFT MARGIN
11.90 RIGHT MARGIN
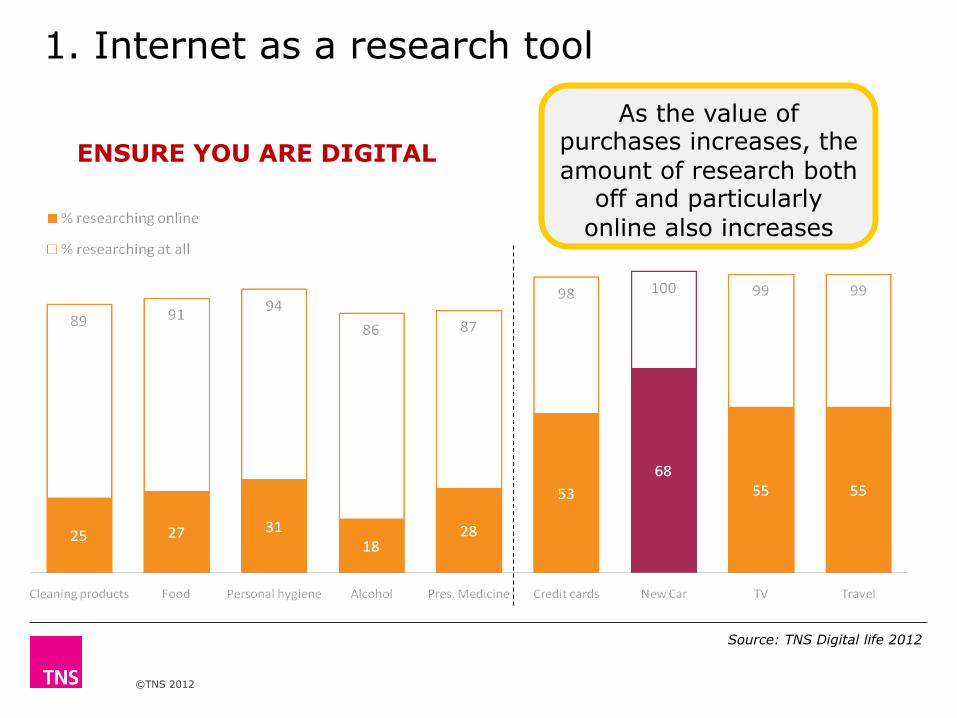
1. Internet as a research tool
Source: TNS Digital life 2012
As the value of purchases increases, the amount of research both
off and particularly online also increases
ENSURE YOU ARE DIGITAL
©TNS 2012
3.14 X AXIS
6.65 BASE MARGIN
5.95 TOP MARGIN
4.52 CHART TOP
11.90 LEFT MARGIN
11.90 RIGHT MARGIN
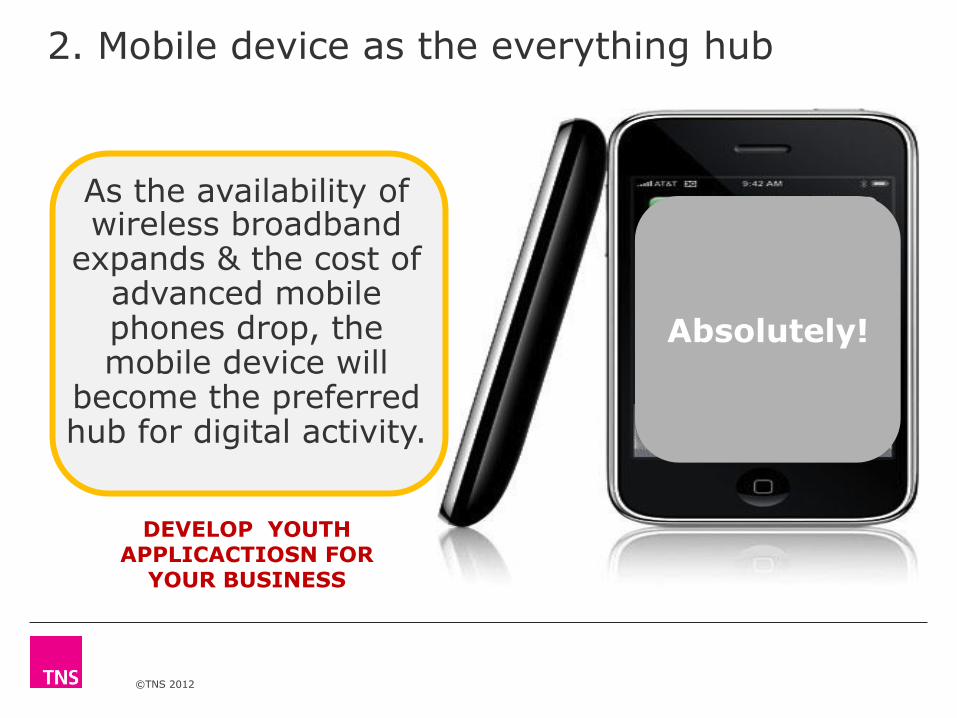
2. Mobile device as the everything hub
Absolutely!
DEVELOP YOUTH APPLICACTIOSN FOR
YOUR BUSINESS
As the availability of wireless broadband
expands & the cost of advanced mobile phones drop, the mobile device will
become the preferred hub for digital activity.
©TNS 2012
3.14 X AXIS
6.65 BASE MARGIN
5.95 TOP MARGIN
4.52 CHART TOP
11.90 LEFT MARGIN
11.90 RIGHT MARGIN
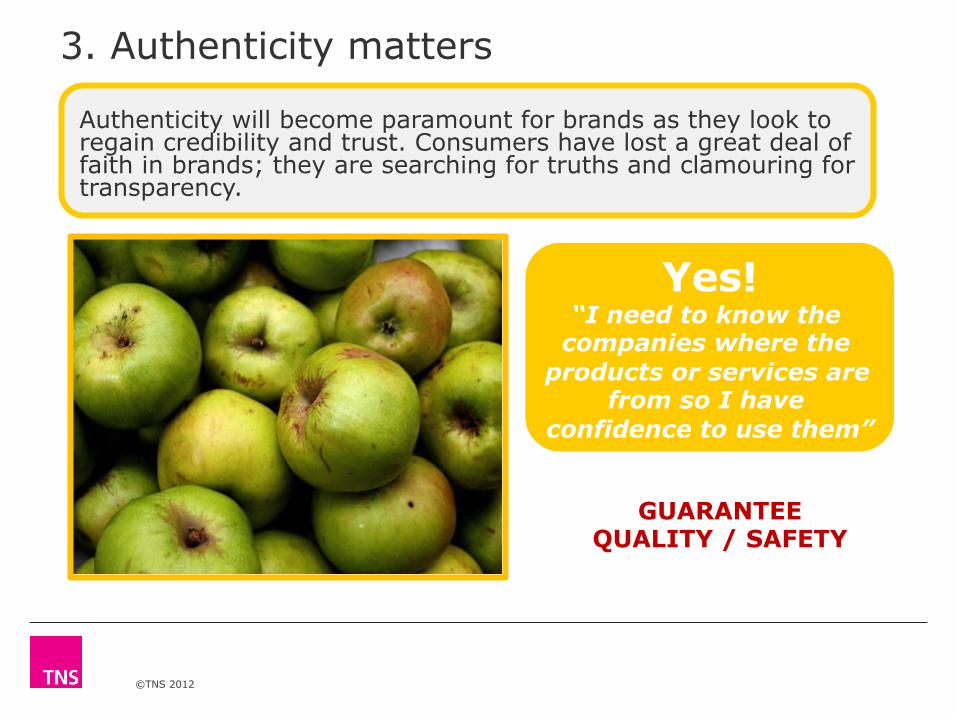
3. Authenticity matters
Yes! “I need to know the
companies where the products or services are
from so I have confidence to use them”
GUARANTEE QUALITY / SAFETY
Authenticity will become paramount for brands as they look to regain credibility and trust. Consumers have lost a great deal of faith in brands; they are searching for truths and clamouring for transparency.
©TNS 2012
3.14 X AXIS
6.65 BASE MARGIN
5.95 TOP MARGIN
4.52 CHART TOP
11.90 LEFT MARGIN
11.90 RIGHT MARGIN
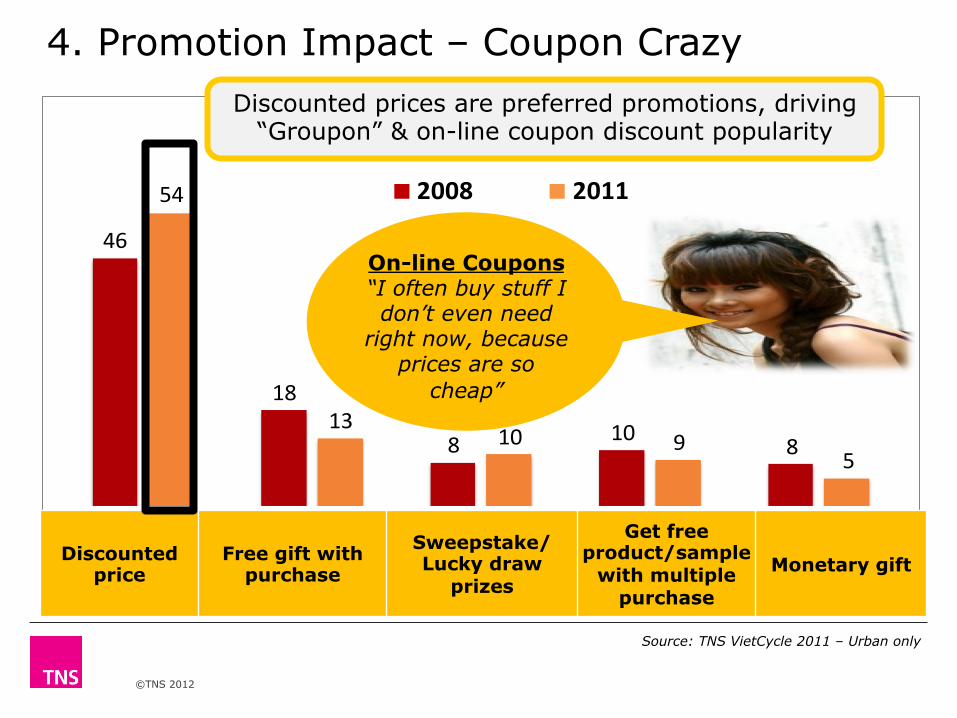
46
18
8 10 8
54
1310 9
5
2008 2011
Discounted price
Free gift with purchase
Sweepstake/Lucky draw
prizes
Get free product/sample
with multiple purchase
Monetary gift
4. Promotion Impact – Coupon Crazy
Source: TNS VietCycle 2011 – Urban only
On-line Coupons “I often buy stuff I don’t even need
right now, because prices are so
cheap”
Discounted prices are preferred promotions, driving “Groupon” & on-line coupon discount popularity
©TNS 2012
3.14 X AXIS
6.65 BASE MARGIN
5.95 TOP MARGIN
4.52 CHART TOP
11.90 LEFT MARGIN
11.90 RIGHT MARGIN
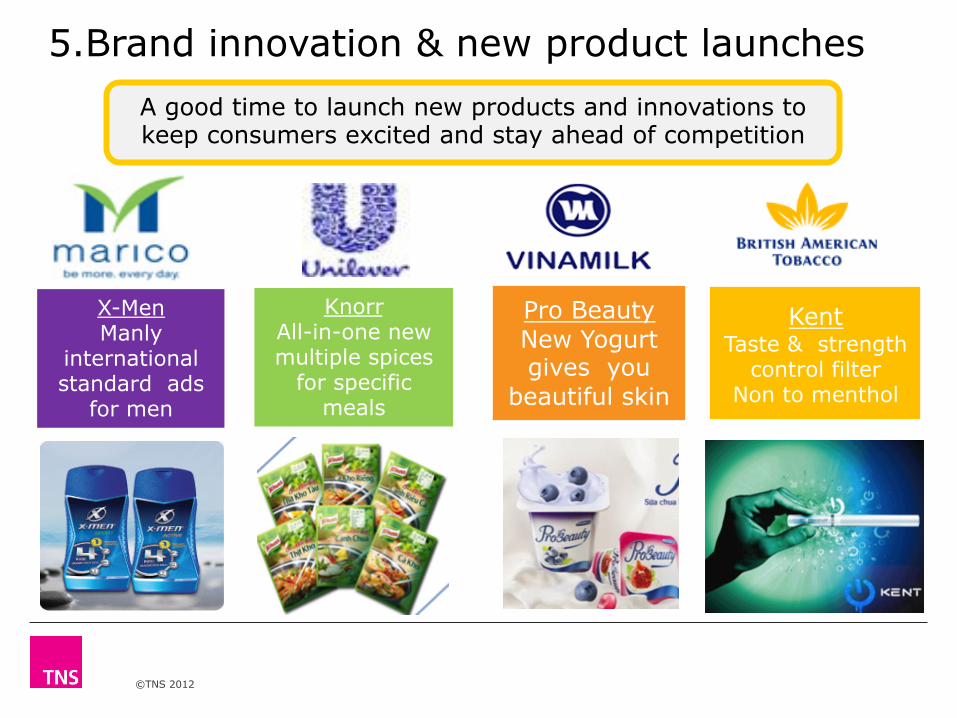
5.Brand innovation & new product launches
X-Men Manly
international standard ads
for men
Knorr All-in-one new multiple spices
for specific meals
Pro Beauty New Yogurt gives you
beautiful skin
Kent
Taste & strength control filter
Non to menthol
A good time to launch new products and innovations to keep consumers excited and stay ahead of competition
3.14 X AXIS
6.65 BASE MARGIN
5.95 TOP MARGIN
4.52 CHART TOP
11.90 LEFT MARGIN
11.90 RIGHT MARGIN
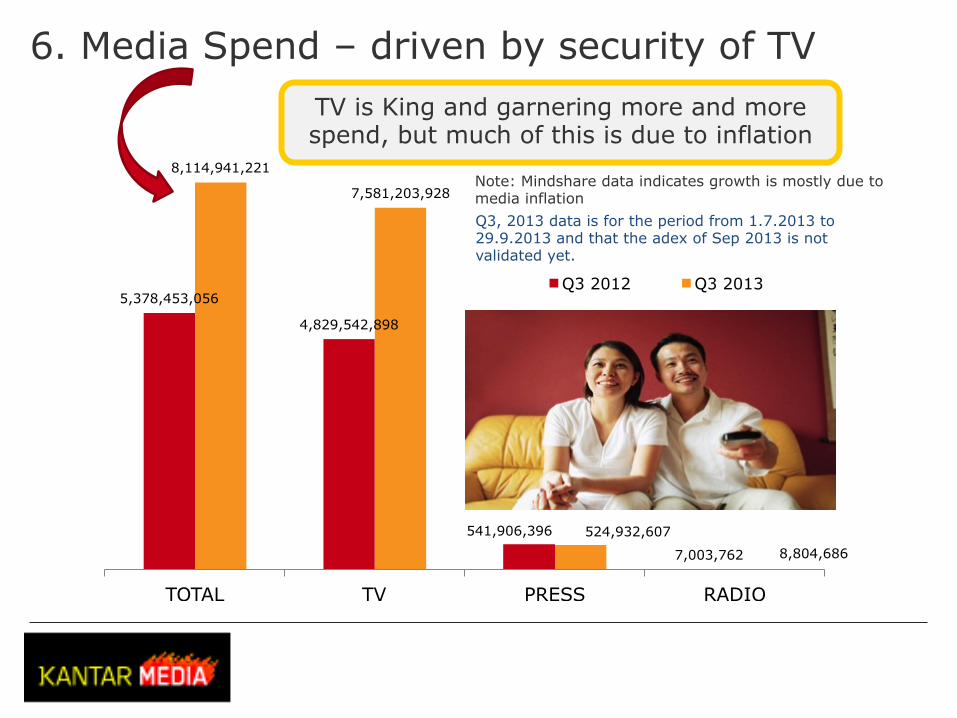
TNS Consumer Confidence Poll
© TNS
5,378,453,056
4,829,542,898
541,906,396
7,003,762
8,114,941,221
7,581,203,928
524,932,607 8,804,686
TOTAL TV PRESS RADIO
Q3 2012 Q3 2013
6. Media Spend – driven by security of TV
Note: Mindshare data indicates growth is mostly due to media inflation Q3, 2013 data is for the period from 1.7.2013 to 29.9.2013 and that the adex of Sep 2013 is not validated yet.
TV is King and garnering more and more spend, but much of this is due to inflation
3.14 X AXIS
6.65 BASE MARGIN
5.95 TOP MARGIN
4.52 CHART TOP
11.90 LEFT MARGIN
11.90 RIGHT MARGIN
TNS Consumer Confidence Poll
© TNS
Key insights and food for thought
32
§ Vietnam is experiencing a long overdue correction caused largely by the countries emergence from 3rd world existence, financial and real estate speculation and overall fiscal mismanagement and lack of transparency
§ The days of “build it they will come” are over - generic organic growth due to sheer emergence are in the past for most sectors
§ Targeted consumer engagement and building a reason to believe and develop trust are key proponents to success
§ Many Vietnamese companies are under capitalized, thus shifting investment focus back onto MNC’s and fleet of foot organizations
§ Size and length of business in Vietnam has impact on ability to grow. Many big companies are able to drowned out competition, so long as they invest and build their capabilities and capacity
§ New Investment in the market shall come from Japan, China and South East Asian countries, which needs to be harnessed for maximum impact
©TNS 2012
3.14 X AXIS
6.65 BASE MARGIN
5.95 TOP MARGIN
4.52 CHART TOP
11.90 LEFT MARGIN
11.90 RIGHT MARGIN
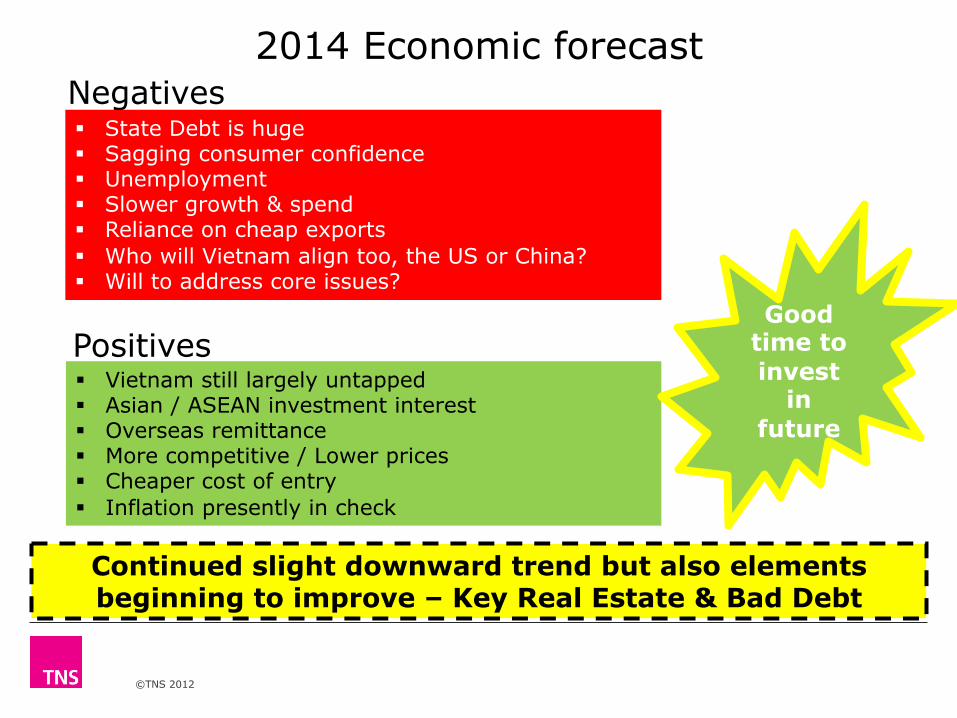
2014 Economic forecast
Continued slight downward trend but also elements beginning to improve – Key Real Estate & Bad Debt
Negatives
Positives
§ State Debt is huge § Sagging consumer confidence § Unemployment § Slower growth & spend § Reliance on cheap exports § Who will Vietnam align too, the US or China? § Will to address core issues?
§ Vietnam still largely untapped § Asian / ASEAN investment interest § Overseas remittance § More competitive / Lower prices § Cheaper cost of entry § Inflation presently in check
Good time to invest
in future
©TNS 2012
3.14 X AXIS
6.65 BASE MARGIN
5.95 TOP MARGIN
4.52 CHART TOP
11.90 LEFT MARGIN
11.90 RIGHT MARGIN
Complete Consumer Insights
§ Please do not hesitate to contact: § Ralf Matthaes § Regional Managing Director
[email protected] § Cambodia | Laos | Myanmar |
Vietnam
§ Vietnam site: www.tnsvietnam.vn § Global site: www.tnsglobal.com
§ Floor 3-4-5 Agrex Building 58 Vo Van Tan Street District 3, Ho Chi Minh City, Vietnam


