+ All Categories
Home > Documents > 2013 Gas outlook

2013 Gas outlook

Date post: 03-Feb-2022
Category:
Upload: others
View: 1 times
Download: 0 times
Share this document with a friend
25
N W G A 2 0 1 3 G A S O U T L O O K This report, compiled by the Northwest Gas Association (NWGA) and its members, provides a consensus industry perspective of the Pacific Northwest’s current and projected natural gas supply, demand, prices and delivery capabilities through 2022. The Pacific Northwest in this case includes British Columbia (B.C.) and the U.S. states of Washington, Oregon and Idaho. Additional information, including white papers on specific natural gas topics, can be found at www.nwga.org. Natural Gas Supply, Demand, Capacity and Prices in the Pacific Northwest Projections through October 2022 2013 Gas Outlook
Transcript

N W G A 2 0 1 3 G A s o u t l o o k

this report, compiled by the Northwest Gas Association (NWGA) and

its members, provides a consensus industry perspective of the Pacific

Northwest’s current and projected natural gas supply, demand, prices

and delivery capabilities through 2022. the Pacific Northwest in this case

includes British Columbia (B.C.) and the u.s. states of Washington, oregon

and Idaho. Additional information, including white papers on specific natural

gas topics, can be found at www.nwga.org.

Natural Gas supply, Demand, Capacity and Prices in the Pacific NorthwestProjections through October 2022

2013 Gas outlook

N W G A 2 0 1 3 G A s o u t l o o k

1

the abundance of North American natural gas continues

to transform the energy landscape and the direction of

public policy. For instance, natural gas figured prominently

in the 2012 u.s. Presidential election, giving our industry

increased access to policy discussions.

likewise, the provincial government of British

Columbia (B.C.) issued a new Natural Gas

strategy in 2012.1 the strategy targets

developing natural gas for transportation

and other uses that will help the

province achieve its greenhouse gas

(GHG) reduction goals, create more

jobs, and boost public coffers with

higher royalty revenues. the strategy

also encourages development of the

liquefied natural gas (lNG) export sector.

What’s NewCommodity prices reached their lowest level in a decade

during early 2012 due to North America’s vast and economic

supply of natural gas. Although gas prices have increased

over the past year, prices are likely to remain favorable for

end-users and consumers for the foreseeable future.2 this

is causing a shift in thinking about the role of natural gas in

our economy. the dramatic swing in North America’s natural

gas supply picture has also slashed the need for lNG imports

while providing market incentives to explore exports – which

could affect the global gas market.

Regionally, the demand growth projections in this 2013

outlook remain modest across most sectors reflecting

expected economic conditions (see 2013 Regional Economic

outlook). Gas use for generating electricity shows the

most significant growth in the forecast period. Meanwhile,

Northwest consumers are benefitting as regional gas

distribution companies (lDCs) pass the lower cost of natural

gas through to customers.

1 B.C. Ministry of Energy and Mines, British Columbia’s Natural Gas Strategy, issued Feb. 3, 2012. http://www.gov.bc.ca/ener/popt/down/natural_gas_strategy.pdf 2 u.s. Energy Information Administration, (EIA), 2013 Annual Energy Outlook - Early Release, December 2012

“We produce more natural

gas than ever before – and

nearly everyone’s energy bill

is lower because of it...[T]he

natural gas boom has led to

cleaner power and greater

energy independence.”

– u.s. President Barack

obama, state of the union

speech, Feb. 12, 2013

“[T]here are new and

expanded uses of natural

gas in North America and

British Columbia, including

transportation, fuel switching

from coal to natural gas for

power generation, and as

a feedstock to make other

products.” – B.C.’s Natural Gas

Strategy, Feb. 3, 2012

N W G A 2 0 1 3 G A s o u t l o o k

2

since natural gas is a fundamental

economic input (e.g. used in industrial and

commercial processes, as a fuel to generate

electricity and for space and water heating

in homes), the economy remains the key

driver influencing natural gas demand in

the Pacific Northwest and across North

America. the speed at which an economic

recovery occurs will dictate how quickly

demand grows over the next 10 years.

Growth will also depend on federal,

state and provincial efforts to maximize

the benefits of this abundant resource

(boosting energy independence, creating

jobs), and actions taken by energy industry

participants and energy consumers to

comply with GHG-reducing mandates.

this, in turn, will influence decisions to

expand or invest in additional delivery

infrastructure such as pipelines and storage

facilities.

For example, in oregon and Washington,

we have seen large investments in

renewable wind power, which may lead

to future investment in new fast-start

gas-fired generation plants to balance

intermittent wind generation. In addition,

the announced closures of two regional

coal plants (in Boardman, oregon, and

Centralia, Washington) portend additional

gas demand for electric generation. Both

plant operators have publicly expressed

their intentions to replace at least some

of that generation capacity with gas-fired

generation.

At the same time, the low price of North

American natural gas is itself playing an

important role in economic recovery by

stimulating growth of industries that use

natural gas3 and, because global prices

are much higher, by bringing overseas

manufacturing and related jobs back to

North America.

thanks to the vast shale gas reserves

unlocked by breakthroughs in production

technologies, the natural gas resource

available to serve our energy needs

is abundant, secure and accessible

across North America. Environmentally

responsible production is the key to

ensuring a lasting legacy. that is why

producers continue their quest to develop

new and improved extraction techniques

that protect ground water, minimize water

use and reduce air emissions.

While the plentiful supply and low cost

of natural gas continue to make headlines,

we want to emphasize one of the unique

attributes of natural gas: its versatility.

Directly heating homes, buildings and

water with natural gas is a common

and highly efficient use of natural gas. It

also provides process heat for regional

industries like aerospace, steel, glass, wood

and paper products, food processing,

fabrication and high technology.

Natural gas is a basic ingredient in a

myriad of products from fertilizer and

pharmaceuticals to pantyhose.4 It is also

a reliable, low-carbon fuel for generating

electricity compared to coal and diesel.

And natural gas is safe, clean and more

affordable than gasoline or diesel for

fueling fleet vehicles like garbage trucks

and transit buses, long-haul trucks, ferries

and marine shipping.

this is where natural gas truly shines – as

a homegrown, low-cost, clean-burning

resource with myriad uses. Regional

stakeholders can capture the benefits of

this newly plentiful resource and help to

ensure supply viability for the long-term

by encouraging its use in all appropriate

industries.

Putting it All Together

3American Gas Association, The Promise of Natural Gas, october 2012.4A recent study by the American Chemistry Council noted the potential for 17,000 new knowledge-intensive, high-paying jobs in the u.s. chemical industry, another 400,000 jobs outside the chemical industry and more than $132 billion in u.s. economic output – all associated with the shale gas revolution. http://www.americanchemistry.com/Policy/Energy/shale-Gas.

N W G A 2 0 1 3 G A s o u t l o o k

3

2013 Regional Economic OutlookAt best, the u.s. and Canadian economies are facing another “2-2” year—that is, real GDP growth and inflation around 2%. As a result, in 2013 we can expect economic growth in Idaho, oregon, Washington, and British Columbia (B.C.) to be similarly modest.

Regional growth will be partly restrained by sequestration-driven Federal budget cuts, the on-going European recession, and a slowing Canadian housing market. In each case, these events will continue to suppress the demand for the Pacific Northwest’s goods and services through the rest

of 2013.

In terms of employment growth, all three u.s. states matched the nation with 1.7%

growth rates in non-farm employment in 2012. B.C.’s employment also grew

at 1.7%, outperforming Canada’s overall rate of 1.2% in 2012. Given

that 2013 will be at best another 2-2 year, regional employment growth will likely remain in the 1.5% to 2% range.

However, metro area growth will continue to outpace overall

state and provincial growth. In 2012, employment growth in the

seattle-Bellevue-tacoma, WA, metro

area was 2.6% and 2.2% in the Boise-Nampa, ID, area. In 2012, the B.C. metro areas of Vancouver, Victoria, and Abbotsford-Mission also outperformed the province.

one source of optimism in 2013 is a u.s. housing market recovery that started to materialize in the second quarter of 2012. Federal Housing Finance Agency (FHFA) data shows that existing home prices in Idaho, oregon, and Washington increased by 9%, 7%, and 2%, respectively, in 2012. According to the FHFA, 2007 was the last year that home prices increased in these states.

With residential property values no longer in decline, the region could expect to see a bump in residential lending and permitting in 2013. In turn, this should help durable goods producers in both the u.s. and Canada, especially in light of Canada’s slowing housing market.

With the u.s. Federal Reserve committed to a low interest rate environment (conditional on inflation and unemployment remaining below its stated targets), the u.s. housing recovery is expected to continue through 2013. Weaker than expected growth in the 2012 fourth quarter gross domestic product (GDP) of both the u.s. and Canada means the Bank of Canada also has room to keep interest rates at current levels in the first half of 2013.

– By Grant D. Forsyth, Chief Economist, Avista Corp.

Primary sources include: Bank of Canada, BCStats, Statistics Canada, U.S Federal Reserve Board of Governors, U.S. Bureau of Labor Statistics and the U.S. Federal Housing Finance Agency.

N W G A 2 0 1 3 G A s o u t l o o k

4

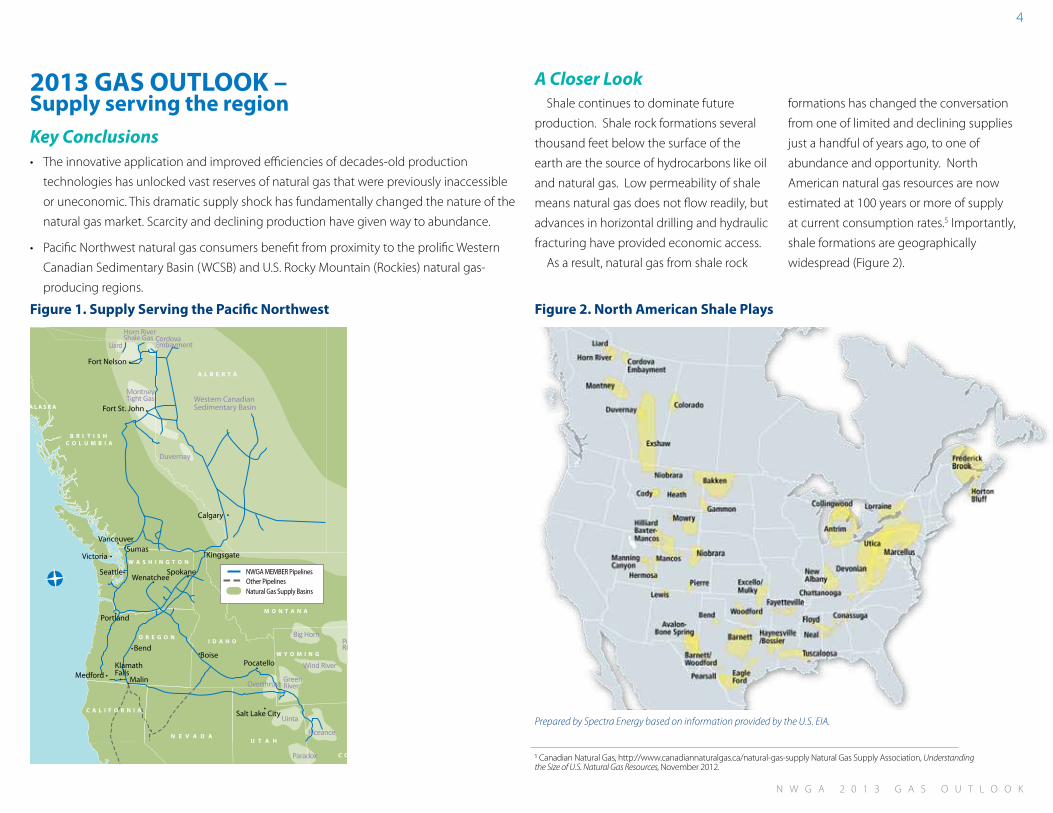
2013 GAS OUTLOOK – Supply serving the regionKey Conclusions

A Closer Look

Figure 2. North American Shale Plays

5 Canadian Natural Gas, http://www.canadiannaturalgas.ca/natural-gas-supply Natural Gas supply Association, Understanding the Size of U.S. Natural Gas Resources, November 2012.

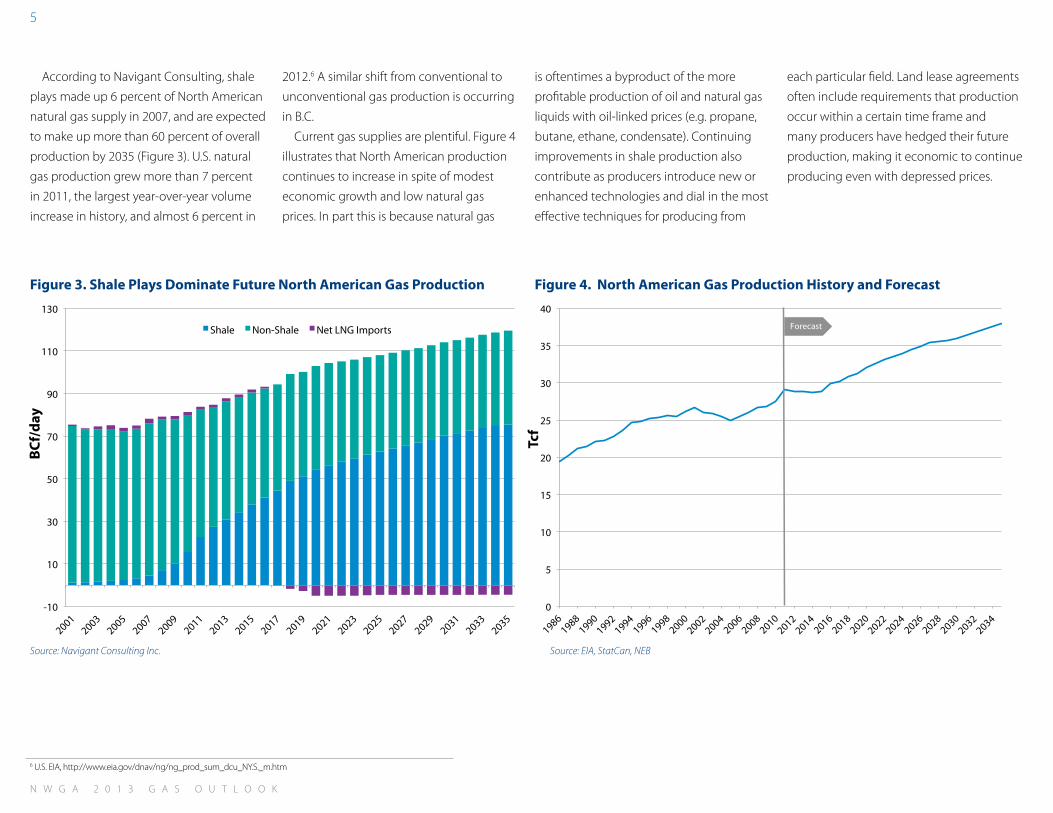
shale continues to dominate future

production. shale rock formations several

thousand feet below the surface of the

earth are the source of hydrocarbons like oil

and natural gas. low permeability of shale

means natural gas does not flow readily, but

advances in horizontal drilling and hydraulic

fracturing have provided economic access.

As a result, natural gas from shale rock

formations has changed the conversation

from one of limited and declining supplies

just a handful of years ago, to one of

abundance and opportunity. North

American natural gas resources are now

estimated at 100 years or more of supply

at current consumption rates.5 Importantly,

shale formations are geographically

widespread (Figure 2).

Prepared by Spectra Energy based on information provided by the U.S. EIA.

• the innovative application and improved efficiencies of decades-old production

technologies has unlocked vast reserves of natural gas that were previously inaccessible

or uneconomic. this dramatic supply shock has fundamentally changed the nature of the

natural gas market. scarcity and declining production have given way to abundance.

• Pacific Northwest natural gas consumers benefit from proximity to the prolific Western

Canadian sedimentary Basin (WCsB) and u.s. Rocky Mountain (Rockies) natural gas-

producing regions.

Figure 1. Supply Serving the Pacific Northwest

Bakken

Denver-Julesburg

Wind River

Piceance

GreenRiver

Big Horn

Overthrust

Uinta

Powder River

Paradox

Horn RiverShale Gas

MontneyTight Gas

CordovaEmbayment

Duvernay

Liard

Natural Gas Supply Basins

NWGA MEMBER PipelinesOther Pipelines

Western CanadianSedimentary Basin

A L B E R T A

B R I T I S H C O L U M B I A

A L A S K A

W A S H I N G T O N

O R E G O NI D A H O

M O N T A N A

W Y O M I N G

U T A H

C O L O R A D O

N E V A D A

C A L I F O R N I A

Calgary

Kingsgate

Fort St. John

Fort Nelson

SumasVancouver

Seattle

Victoria

WenatcheeSpokane

Portland

Bend

MedfordKlamathFalls

Malin

BoisePocatello

Salt Lake City

N W G A 2 0 1 3 G A s o u t l o o k

5

-10

10

30

50

70

90

110

130

Bcfd

Shale Non-Shale Net LNG Imports

Figure 3. Shale Plays Dominate Future North American Gas Production

Source: Navigant Consulting Inc.

Figure 4. North American Gas Production History and Forecast

According to Navigant Consulting, shale

plays made up 6 percent of North American

natural gas supply in 2007, and are expected

to make up more than 60 percent of overall

production by 2035 (Figure 3). u.s. natural

gas production grew more than 7 percent

in 2011, the largest year-over-year volume

increase in history, and almost 6 percent in

2012.6 A similar shift from conventional to

unconventional gas production is occurring

in B.C.

Current gas supplies are plentiful. Figure 4

illustrates that North American production

continues to increase in spite of modest

economic growth and low natural gas

prices. In part this is because natural gas

is oftentimes a byproduct of the more

profitable production of oil and natural gas

liquids with oil-linked prices (e.g. propane,

butane, ethane, condensate). Continuing

improvements in shale production also

contribute as producers introduce new or

enhanced technologies and dial in the most

effective techniques for producing from

each particular field. land lease agreements

often include requirements that production

occur within a certain time frame and

many producers have hedged their future

production, making it economic to continue

producing even with depressed prices.

6 u.s. EIA, http://www.eia.gov/dnav/ng/ng_prod_sum_dcu_NY.s._m.htm

0

5

10

15

20

25

30

35

40

Tcf

Forecast

BC

f/d

ay

Tcf

Source: EIA, StatCan, NEB

N W G A 2 0 1 3 G A s o u t l o o k

6

0

2

4

6

8

10

12

14

16

Bcf

/day

Kinder Morgan Forecast EIA 2013 AEO - Ajusted to Wellhead

Kinder Morgan Low Kinder Morgan High

Production Growth 2012 to 2022 = 2.0 to 2.1 Bcf/d

EIA adjusted to exclude San Juan, Raton, Paradox, and Williston Basins

Closer to home, the Northwest is

immediately adjacent to and supplied by two

large natural gas production areas. the WCsB

includes the Canadian provinces of B.C. and

Alberta and provides about 60 percent of

the natural gas consumed in the Northwest.

the Rockies region7 provides the rest of the

gas consumed here. Combined, these two

production areas produced an average of

almost 25 billion cubic feet per day (Bcf/d) in

20118 – more than one third of North America’s

natural gas supply. to put this into perspective,

the Northwest uses a little more than 3 Bcf/d

on average through the winter months

(November through March), although that

number can go significantly higher when the

weather becomes unusually cold.

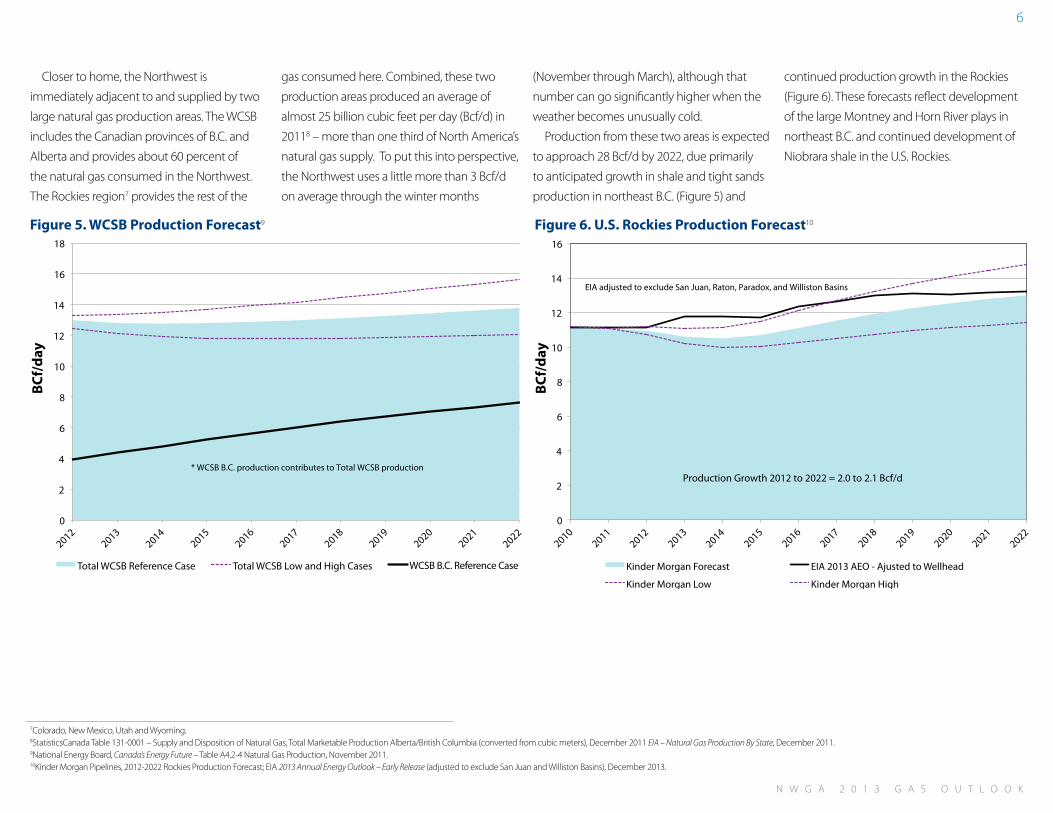
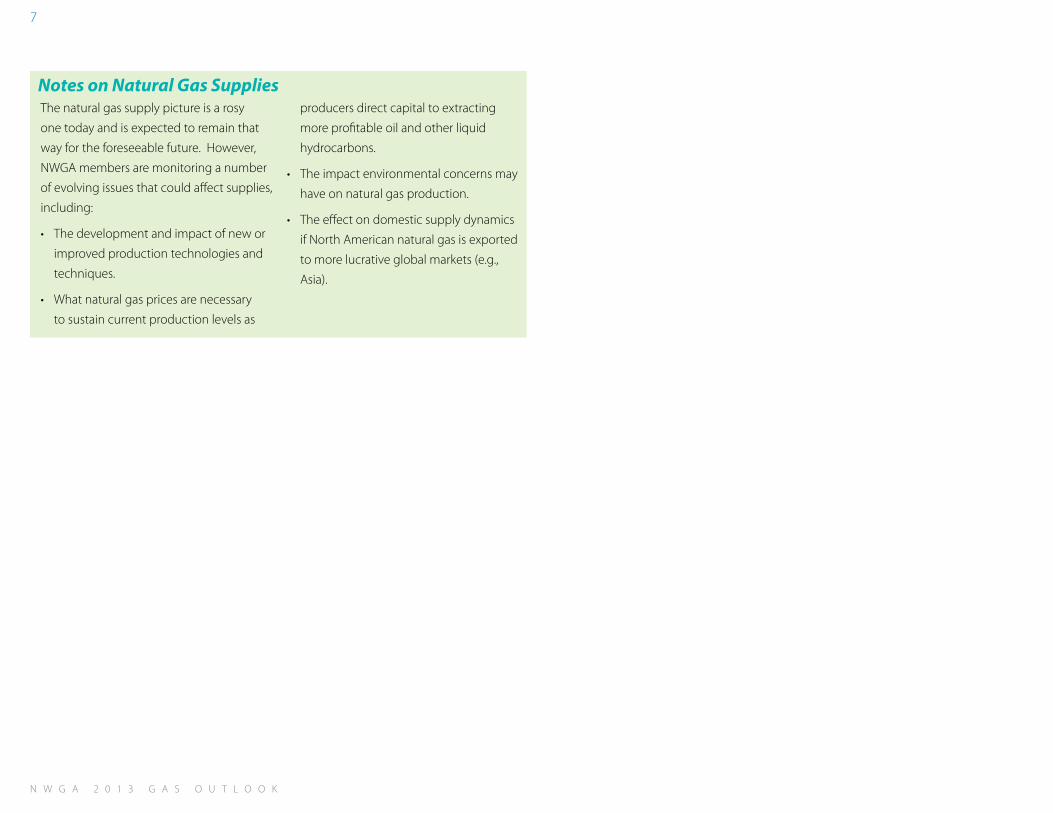
Production from these two areas is expected

to approach 28 Bcf/d by 2022, due primarily

to anticipated growth in shale and tight sands

production in northeast B.C. (Figure 5) and

continued production growth in the Rockies

(Figure 6). these forecasts reflect development

of the large Montney and Horn River plays in

northeast B.C. and continued development of

Niobrara shale in the u.s. Rockies.

Figure 6. U.S. Rockies Production Forecast10Figure 5. WCSB Production Forecast9

7Colorado, New Mexico, utah and Wyoming.8statisticsCanada table 131-0001 – supply and Disposition of Natural Gas, total Marketable Production Alberta/British Columbia (converted from cubic meters), December 2011 EIA – Natural Gas Production By State, December 2011.9National Energy Board, Canada’s Energy Future – table A4.2-4 Natural Gas Production, November 2011. 10kinder Morgan Pipelines, 2012-2022 Rockies Production Forecast; EIA 2013 Annual Energy Outlook – Early Release (adjusted to exclude san Juan and Williston Basins), December 2013.

0

2

4

6

8

10

12

14

16

18

Bcf/

day

Total WCSB Reference Case Total WCSB Low and High Cases WCSB BC Reference Case

* WCSB B.C. production contributes to Total WCSB production

0

2

4

6

8

10

12

14

16

Bcf

/day

Kinder Morgan Forecast EIA 2013 AEO - Ajusted to Wellhead

Kinder Morgan Low Kinder Morgan High

Production Growth 2012 to 2022 = 2.0 to 2.1 Bcf/d

EIA adjusted to exclude San Juan, Raton, Paradox, and Williston Basins

0

2

4

6

8

10

12

14

16

18

Bcf/

day

Total WCSB Reference Case Total WCSB Low and High Cases WCSB BC Reference Case

* WCSB B.C. production contributes to Total WCSB production

WCSB B.C. Reference Case

BC

f/d

ay

BC

f/d

ay

N W G A 2 0 1 3 G A s o u t l o o k

7

Notes on Natural Gas Suppliesthe natural gas supply picture is a rosy

one today and is expected to remain that

way for the foreseeable future. However,

NWGA members are monitoring a number

of evolving issues that could affect supplies,

including:

• the development and impact of new or

improved production technologies and

techniques.

• What natural gas prices are necessary

to sustain current production levels as

producers direct capital to extracting

more profitable oil and other liquid

hydrocarbons.

• the impact environmental concerns may

have on natural gas production.

• the effect on domestic supply dynamics

if North American natural gas is exported

to more lucrative global markets (e.g.,

Asia).

N W G A 2 0 1 3 G A s o u t l o o k

8

2013 GAS OUTLOOK - Regional Natural Gas DemandKey Conclusions

Table 1. Projected Regional Demand Growth through 2022

Total

Residential

Commercial

Industrial

Generation

• over the next 10 years, natural gas consumption in the Pacific Northwest is expected

to grow an average of 1.2 percent per year (see table 1). Cumulative projected growth

through 2022 is 10.3 percent.

• Peak day demand will grow on a year-over-year basis but is lower overall than was

projected in the 2008 outlook. Weather-driven residential and power generation loads

continue to grow as a proportion of overall load, implying more variability in demand.

• the use of natural gas to generate electricity will grow over the next decade. How much,

how quickly and the nature of the demand for natural gas as a generation fuel is the

subject of an ongoing dialogue between regional industry stakeholders.

A Closer Look

Figure 7. Pre-Recession Forecast Comparison, Expected Case

Modest economic growth continues

across the Pacific Northwest, affecting

projections for the demand of natural gas

across every sector.

NWGA members project positive year-

over-year growth in demand (table 1),

although the overall level of the expected

case demand forecast is about 15 percent

lower than the pre-recession 2008 outlook

(Figure 7). Most of the growth is expected

to come from gas-fired electrical generation

and modest but steady growth in core

market demand (residential, commercial) as

the economy recovers (Figure 8).

500

600

700

800

900

1,000

1,100

Mill

ion

Dec

ath

erm

s (D

th)

'08 Expected '13 Expected

-­‐15%  

2013 Outlook Figures-6.xlsxFIGURE8 4/2/133:04 PM

100

120

140

160

180

200

220

240

260

280

Mill

ion

Dth

Residential Commercial Industrial Generation

0.7% 6.4% 1.2% 10.3% 1.8% 14.6%

0.1% 1.0% 0.9% 7.6% 1.6% 13.6%

0.1% 0.6% 0.9% 7.4% 1.6% 13.6%

0.5% 4.0% 0.6% 5.2% 0.7% 6.2%

2.3% 18.4% 2.6% 20.3% 3.0% 23.4%

LowExpectedHigh

Annual Rate Cumulative Annual Rate Cumulative Annual Rate Cumulative

2013 Outlook Figures-6.xlsxFIGURE8 4/2/133:04 PM

100

120

140

160

180

200

220

240

260

280

Mill

ion

Dth

Residential Commercial Industrial Generation

Figure 8. Expected Case Demand Forecast by Economic Sector

11A decatherm (Dth) is 1 million British thermal units (Btu) and is roughly equivalent to 1,000 cubic feet of natural gas. one Btu is about the same amount of energy as is released when a wooden match is struck.

11

Heating Year

Heating Year

33282019

1  2  3  4  

N W G A 2 0 1 3 G A s o u t l o o k

9

Residential– Residential growth remains

slow at 0.9 percent average annual growth (1.1

percent in the 2012 outlook). New housing

construction, long a bastion of dependable

growth for the natural gas industry in the

Pacific Northwest, continues to lag behind

pre-recession levels. Furthermore, natural gas

use per customer continues its decades-long

decline as consumers install more efficient

appliances and weatherize their homes.

Commercial– Institutional and other

commercial uses of natural gas are expected

to grow an average of 0.9 percent per year (1.0

percent in 2012) as modest economic growth

continues across the region.

Industrial– the recession cost the region

more than 20 percent of its industrial gas load

since 2007, although industry remains the

largest user (Figure 9). A significant portion of

that loss of load came from the permanent

closure of several regional wood and paper

products plants. looking ahead, we project 0.6

percent average annual growth in industrial

gas demand (the same as 2012). Most of the

projected growth is in response to favorable

gas prices, which is spurring some existing

industries to resume pre-recession production

levels. some NWGA members are also

reporting increased inquiries for natural gas

for process fuel or feed stock to new industrial

facilities. New markets developed abroad for

North American natural gas would also boost

industrial load growth.

Generation – the trend toward increased

reliance on natural gas to generate electricity

in the region is expected to continue. We

are forecasting an average annual growth

rate of 2.6 percent in gas use for generation

compared to our forecast of 1.0 percent

in 2012. Almost all of the change can be

attributed to a 400 MW base-load power plant

included in Portland General Electric’s (PGE)

2011 Integrated Resource Plan (IRP).12

A trend worth noting is the changing nature

of the region’s load profile. Industrial load

once comprised half of regional natural gas

demand. today, it makes up one third of total

annual demand (Figure 10). this is important

because industrial load is generally constant

year-around, regardless of weather conditions.

Conversely, gas-fired generation – a load

that can be quite variable depending on

weather and other market conditions – once

represented a small portion of natural gas

demand in the region, but claimed more than

20 percent of regional annual gas demand in

2012. Residential and commercial loads are

also largely weather driven and hover around

the same proportionate shares of annual

demand.

Figure 9. Historic Natural Gas Demand by Sector Figure 10. Changing Annual Demand Composition

Industrial: 33%

Commercial: 19%

Residential: 28%

Generation: 20%

0

100

200

300

400

500

600

700

800

900

1000

Mill

ion

Dth

source: US EIA, StatCan

Residential Commercial Industrial Generation

* Q4 BC estimated

12A 400 MW Combined Cycle Gas turbine (CCGt) with a heat rate of 7,200 is assumed. Also assumed are an 85 percent utilization factor and a location in Western oregon off the Williams Northwest Pipeline. All of these assumptions are made by the NWGA and will be adjusted accordingly when PGE completes its RFP process.

0

100

200

300

400

500

600

700

800

900

1000

Mill

ion

Dth

source: US EIA, StatCan

Residential Commercial Industrial Generation

* Q4 BC estimated

Source: US EIE, StatCan

*Q4 BC estimated

0

100

200

300

400

500

600

700

800

900

1000

Mill

ion

Dth

source: US EIA, StatCan

Residential Commercial Industrial Generation

* Q4 BC estimated

5126203

1  

2  

3  

4  

Commercial: 20%

Generation: 3%

Industrial: 51%

Residential: 26%

1996 2012

N W G A 2 0 1 3 G A s o u t l o o k

10

It is important to note that NWGA gas

utility member companies plan beyond

average or annual demand. to ensure

customers are served during extreme

weather conditions, planning standards

address meeting demand on the coldest

day that could occur in their service territory.

these “peak” or “design” days are based on

historical 24-hour average temperatures

actually recorded at representative locations.

While overall demand across the region

is becoming more variable, projected

growth in peak day loads of NWGA member

companies is lower than forecasts issued

prior to the recent recession (Figure 11).

Figure 11. Aggregated Peak Day Forecast Comparison (Expected Demand)

Notes on Natural Gas Demandunderstanding demand – how much,

when, where and for what duration

natural gas is needed – defines the type

and size of infrastructure required to

serve it. Regional growth in the use of

natural gas has historically been driven

by the construction of new housing,

commercial and institutional facilities, and

new industry. the demand projections in

this outlook anticipate continued modest

economic growth.

However, forecast data don’t always reflect

what’s occurring in real-time. the demand

for natural gas in the region is changing

and NWGA members are watching a

number of demand drivers that are yet to

be quantified, including:

• the magnitude and nature of

the growing use of natural gas

for generating electricity to serve

growing power demand, to balance

electrical systems as more intermittent

renewable energy resources come

online, and to help the region transition

from coal-fired generation.

• the possibility of new industrial loads

due to sustained lower natural gas

commodity costs. this may include

new industry (such as developing

methanol and ammonia-based fertilizer

production facilities) as well as fuel-

switching by existing industry. It may

also include new markets abroad

as regional lNG export facilities are

developed.

• the use of natural gas as a

transportation fuel in a variety of

applications. (For more information

about natural gas vehicles, click here to

view the NWGA whitepaper series.)

0

1

2

3

4

5

6

7

8

9

Mill

ion

Dth

'08 Peak Day '13 Peak Day

0

1

2

3

4

5

6

7

8

9

Mill

ion

Dth

'08 Peak Day '13 Peak Day

N W G A 2 0 1 3 G A s o u t l o o k

11

Coordinating Gas and Power in the NorthwestIncreasing reliance on natural gas to fuel both flexible and base-load generation is on the

rise nationally and, as the data in this outlook demonstrate, in the Pacific Northwest. the challenge is to integrate the operations of two very different physical systems (electric and gas) with different regulatory frameworks and

dependability requirements in a way that ensures the reliability of both.

Here are a few facts to consider. A significant driver

in the region’s gas-fired generation growth has

been the development of wind generation. the Renewable Portfolio standards (RPs) of oregon, Washington and California catalyzed the construction of

nearly 8,000 MW of wind generation in the

Northwest.

Intermittent renewable resources – like wind and solar – require backup generation that can deliver electricity on demand. Public policy directly and indirectly limits options for consistent generation resources like coal and nuclear facilities while natural gas generation meets emissions and other environmental standards.

Permitting a natural gas power plant is fairly straightforward and the costs of construction are predictable. the ability to produce natural gas from shale formations has yielded an abundant natural gas resource along with lower, more stable natural gas prices forecast well into the future.

When these dynamics are taken together, it’s no wonder we are relying more and more on clean, safe and plentiful natural gas to fuel the generation of electricity. In fact, gas-fired generation has come right along with wind development in the region.

Due to limits on the Northwest hydropower system, the task of balancing wind generation is increasingly falling to natural gas generation units. A decade ago approximately 1,000 MW of natural gas-fueled generation was available

to meet the Northwest’s power needs. today, over 8,000 MW are installed, a number that is projected to increase according to recent regulatory filings by regional utilities.

With this growing interdependence in mind the Pacific Northwest utility Conference Committee (PNuCC, an association of Northwest investor- and customer-owned electric utilities) and the NWGA are working together to identify and resolve potential issues before they become problems. the joint effort is focused on system operations and planning and on public policies required to promote greater coordination. Click here to see a primer on the issue produced by PNuCC and the NWGA.

Maintaining and improving the reliability of the region’s natural gas and electric delivery systems is of paramount importance as the two become more interdependent. the regional gas and electric industries are working together toward that common objective.

N W G A 2 0 1 3 G A s o u t l o o k

12

$0  

$1  

$2  

$3  

$4  

$5  

$6  

$7  

$8  

$9  

$10  

$11  

$12  

$13  

$14  

US$  per  Dth  

NYMEX  Gas  (03/26/13)  

HH  Spot  Price  HH Spot: $4.00 (03/26/13)

2013 GAS OUTLOOK – Regional PricesKey Conclusions

Figure 12. Natural Gas Prices

Down dramatically from the highs

experienced in 2008, natural gas prices fell to

their lowest levels in more than a decade in

early 2012 (Figure 12). they have rebounded

slightly and are now expected to hover around

$3-$4/MMBtu until the economy begins a

sustained recovery and gas demand and

supply become more balanced. In response,

the region’s utilities, which pass through

purchased gas costs to customers without

markup, have been able to lower commodity

rates for the benefit of customers. Even

factoring in a growing economy, prices are

not expected to rise substantially in the

next decade due to the shale gas dynamics

described earlier (Figure 13).

In addition to delivering price-lowering

volumes to the market, shale gas has

another benefit: geographically diverse

sources of supply across the continent.

shorter distances between production and

consumption reduce transportation costs

and mitigate pricing risks from more distant

and clustered conventional sources that are

more susceptible to disruption (such as by

hurricanes in the Gulf Coast region).

A Closer Look

Source: EIA Monthly NatGas Report; EIA Short Term Energy Outlook; NYMEX

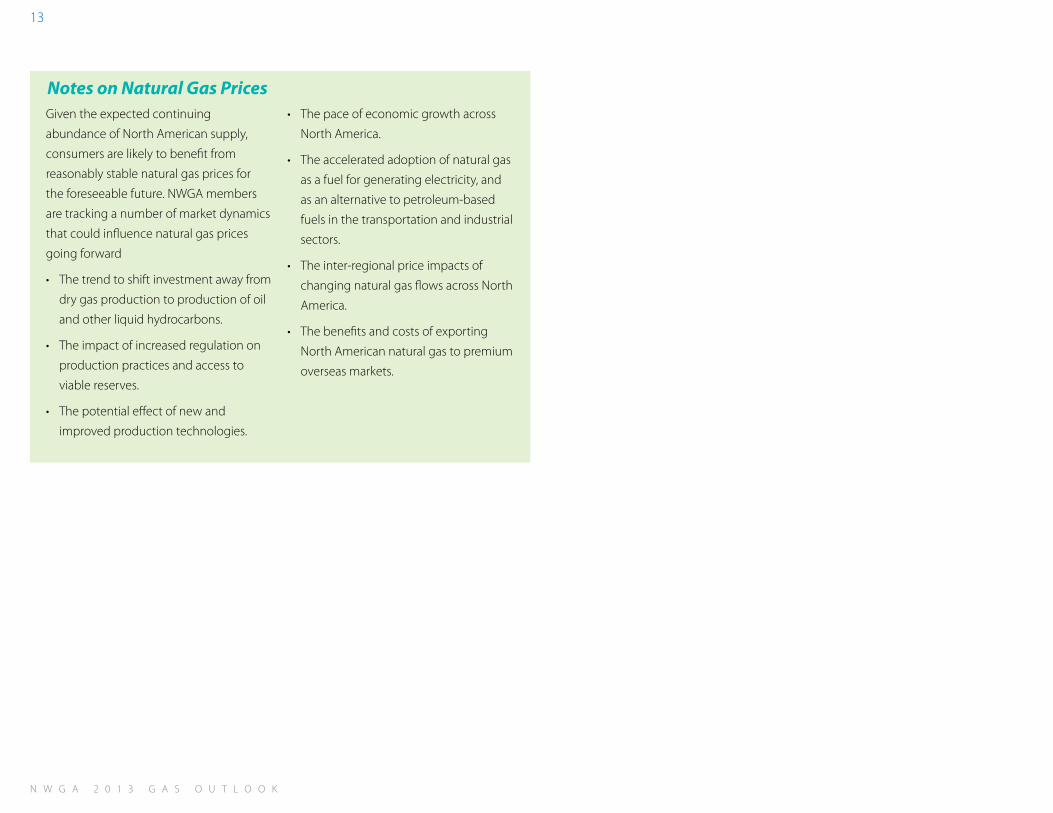
Figure 13. Long-Term Natural Gas Price Forecasts14

13the Henry Hub in louisiana is the pricing point for natural gas futures on the New York Mercantile Exchange (NYMEX). the settlement prices at the Henry Hub are used as benchmarks for the entire North American natural gas market.14Northwest Power and Conservation Council (NWPCC), Update to the Council’s Forecast of Fuel Prices, July 2012; u.s. EIA, 2013 Annual Energy Outlook - Early Release, December 2012.

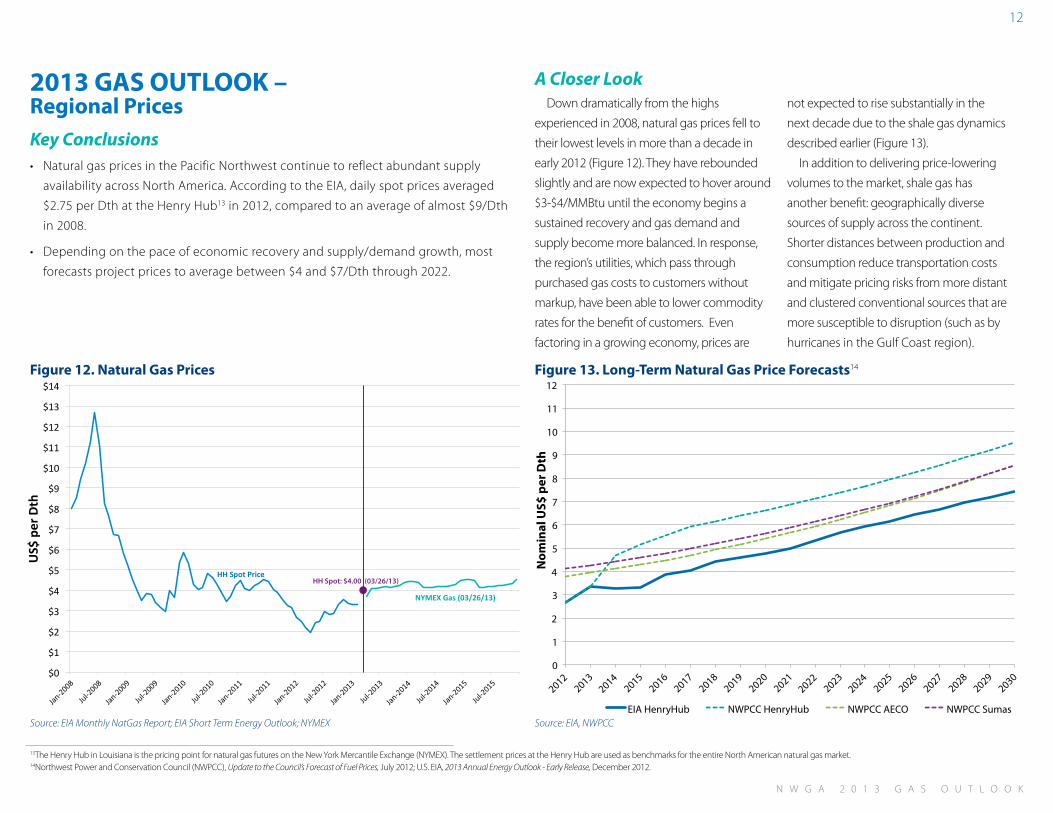
• Natural gas prices in the Pacific Northwest continue to reflect abundant supply

availability across North America. According to the EIA, daily spot prices averaged

$2.75 per Dth at the Henry Hub13 in 2012, compared to an average of almost $9/Dth

in 2008.

• Depending on the pace of economic recovery and supply/demand growth, most

forecasts project prices to average between $4 and $7/Dth through 2022.

0

1

2

3

4

5

6

7

8

9

10

11

12

No

min

al$

EIA HenryHub NWPCC HenryHub NWPCC AECO NWPCC Sumas

Source: EIA, NWPCC

0

1

2

3

4

5

6

7

8

9

10

11

12

No

min

al$

EIA HenryHub NWPCC HenryHub NWPCC AECO NWPCC Sumas

No

min

al U

S$ p

er D

th

N W G A 2 0 1 3 G A s o u t l o o k

13

Notes on Natural Gas PricesGiven the expected continuing

abundance of North American supply,

consumers are likely to benefit from

reasonably stable natural gas prices for

the foreseeable future. NWGA members

are tracking a number of market dynamics

that could influence natural gas prices

going forward

• the trend to shift investment away from

dry gas production to production of oil

and other liquid hydrocarbons.

• the impact of increased regulation on

production practices and access to

viable reserves.

• the potential effect of new and

improved production technologies.

• the pace of economic growth across

North America.

• the accelerated adoption of natural gas

as a fuel for generating electricity, and

as an alternative to petroleum-based

fuels in the transportation and industrial

sectors.

• the inter-regional price impacts of

changing natural gas flows across North

America.

• the benefits and costs of exporting

North American natural gas to premium

overseas markets.

N W G A 2 0 1 3 G A s o u t l o o k

14

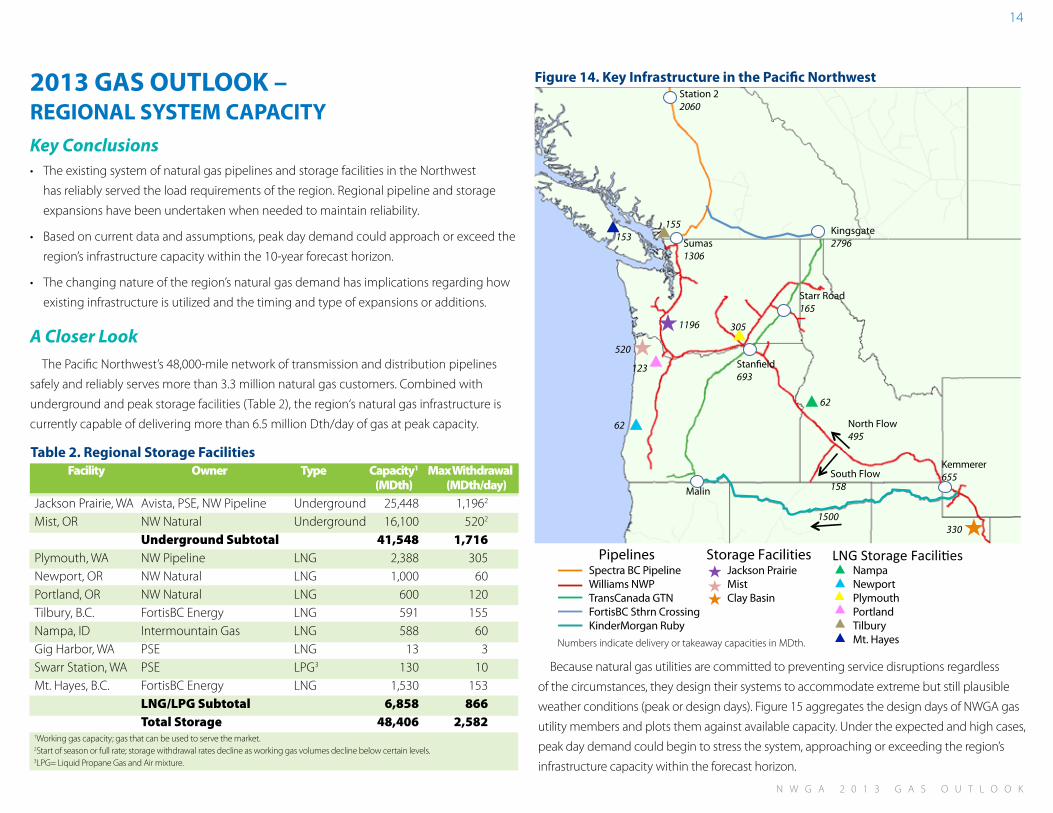
2013 GAS OUTLOOK –REGIONAL SYSTEM CAPACITYKey Conclusions• the existing system of natural gas pipelines and storage facilities in the Northwest

has reliably served the load requirements of the region. Regional pipeline and storage

expansions have been undertaken when needed to maintain reliability.

• Based on current data and assumptions, peak day demand could approach or exceed the

region’s infrastructure capacity within the 10-year forecast horizon.

• the changing nature of the region’s natural gas demand has implications regarding how

existing infrastructure is utilized and the timing and type of expansions or additions.

A Closer Lookthe Pacific Northwest’s 48,000-mile network of transmission and distribution pipelines

safely and reliably serves more than 3.3 million natural gas customers. Combined with

underground and peak storage facilities (table 2), the region‘s natural gas infrastructure is

currently capable of delivering more than 6.5 million Dth/day of gas at peak capacity.

Figure 14. Key Infrastructure in the Pacific Northwest

Table 2. Regional Storage Facilities

Because natural gas utilities are committed to preventing service disruptions regardless

of the circumstances, they design their systems to accommodate extreme but still plausible

weather conditions (peak or design days). Figure 15 aggregates the design days of NWGA gas

utility members and plots them against available capacity. under the expected and high cases,

peak day demand could begin to stress the system, approaching or exceeding the region’s

infrastructure capacity within the forecast horizon.

1Working gas capacity; gas that can be used to serve the market.2start of season or full rate; storage withdrawal rates decline as working gas volumes decline below certain levels.3lPG= liquid Propane Gas and Air mixture.

Facility Owner Type Capacity1 MaxWithdrawal (MDth) (MDth/day)

Jackson Prairie, WA Avista, PsE, NW Pipeline underground 25,448 1,1962

Mist, oR NW Natural underground 16,100 5202

UndergroundSubtotal 41,548 1,716Plymouth, WA NW Pipeline lNG 2,388 305Newport, oR NW Natural lNG 1,000 60Portland, oR NW Natural lNG 600 120tilbury, B.C. FortisBC Energy lNG 591 155Nampa, ID Intermountain Gas lNG 588 60Gig Harbor, WA PsE lNG 13 3swarr station, WA PsE lPG3 130 10Mt. Hayes, B.C. FortisBC Energy lNG 1,530 153 LNG/LPGSubtotal 6,858 866 TotalStorage 48,406 2,582

Station 22060

1500

Starr Road165

Kingsgate2796

Stanfield693

Kemmerer655

155153

1196

520

123

62

305

62

South Flow158

North Flow495

330

Sumas1306

Malin

PipelinesSpectra BC PipelineWilliams NWPTransCanada GTNFortisBC Sthrn Crossing Ruby

Storage FacilitiesJackson PrairieMist

Clay Basin

LNG Storage FacilitiesNampaNewportPlymouthPortlandTilburyMt. Hayes

Station 22060

1500

Starr Road165

Kingsgate2796

Stanfield693

Kemmerer655

155153

1196

520

123

62

305

62

South Flow158

North Flow495

330

Sumas1306

Malin

PipelinesSpectra BC PipelineWilliams NWPTransCanada GTNFortisBC Sthrn Crossing Ruby

Storage FacilitiesJackson PrairieMist

Clay Basin

LNG Storage FacilitiesNampaNewportPlymouthPortlandTilburyMt. HayesNumbers indicate delivery or takeaway capacities in MDth.

Spectra BC PipelineWilliams NWPTransCanada GTNFortisBC Sthrn CrossingKinderMorgan Ruby

Jackson PrairieMistClay Basin

NampaNewportPlymouthPortlandTilburyMt. Hayes

Station 22060

1500

Starr Road165

Kingsgate2796

Stanfield693

Kemmerer655

155153

1196

520

123

62

305

62

South Flow158

North Flow495

330

Sumas1306

Malin

PipelinesSpectra BC PipelineWilliams NWPTransCanada GTNFortisBC Sthrn Crossing Ruby

Storage FacilitiesJackson PrairieMist

Clay Basin

LNG Storage FacilitiesNampaNewportPlymouthPortlandTilburyMt. Hayes

N W G A 2 0 1 3 G A s o u t l o o k

15

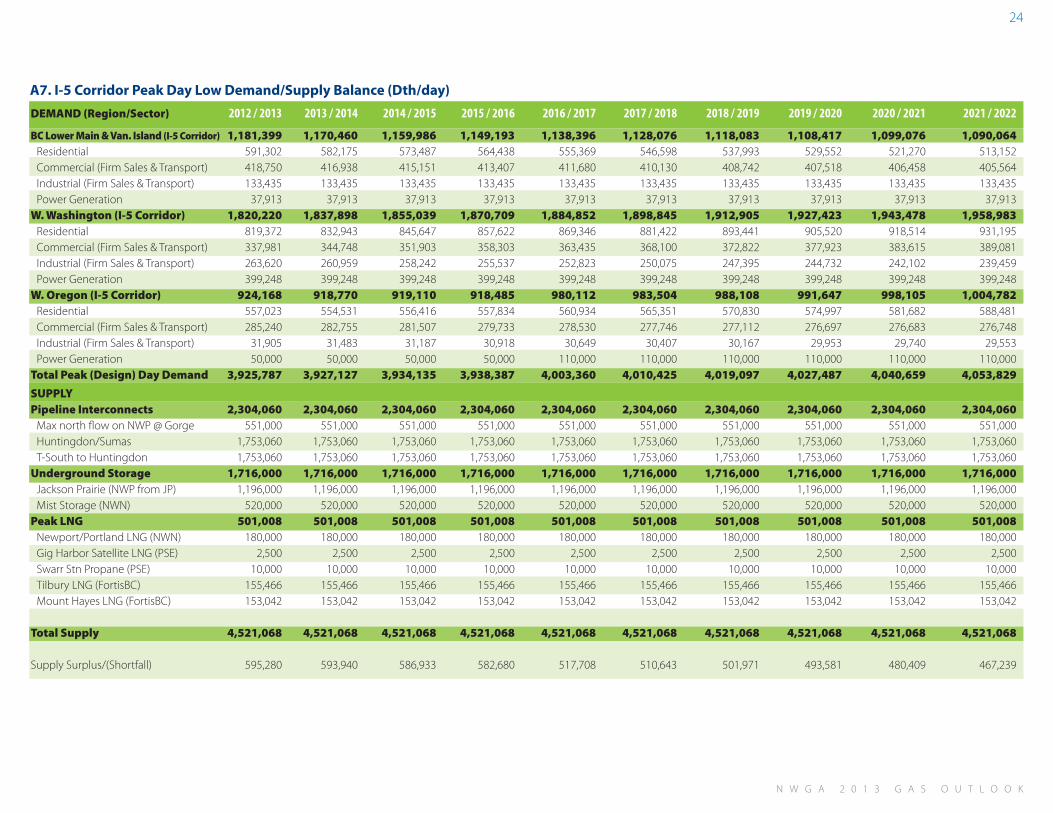
Figure 16. I-5 Peak Supply/Demand Balance including Non-Firm Loads

the Figure 15 forecast assumes that

existing capacity in the region is operating

at 100 percent of its capability.15 the

forecast also assumes that gas will not flow

on a peak day to customers without firm

pipeline transportation contracts (typically

industrial users or electricity generators

with alternate fuels). Finally, it assumes that

a peak or design weather day could occur

simultaneously across the entire region.

While the probability of design days

occurring on every system across the region

on the same day (“coincidental peak day”)

is small, the possibility of very cold weather

occurring simultaneously along the I-5

Corridor is reasonably high. Figure 16 plots

the I-5 Corridor against available I-5 pipeline

and storage resources. Also included for

illustrative purposes is the load without firm

interstate pipeline transportation contracts,

e.g., potential loads that could expect to be

curtailed on a peak weather day.

the states of oregon and Washington

have negotiated two coal plant closures

within the planning horizon of this outlook

(Boardman in 2020 and Centralia in two

phases, 2020 and 2025). Plant owners have

announced their intent to use natural gas-

fired generation to replace some or all of

the output of those plants. the replacement

plants are not included in Figures 15 and

16 because utilities have just begun their

planning and the type and size of the

plants that may be built have not been

determined. However, if these plants are

built, they will represent significant gas

volumes that would require capacity within

the forecast period.

Analyses such as these help send signals

to the market of an impending need for

additional capacity. Market participants

weigh the probability of disruptions and

the costs of various infrastructure options to

make decisions about what is needed and

when.

Figure 15. Regional Peak Supply/Demand Balance

15Regional capacity includes all existing facilities. Proposed projects are not included in capacity.

0

1

2

3

4

5

6

7

8

9

12/13 13/14 14/15 15/16 16/17 17/18 18/19 19/20 20/21 21/22

Mill

ion

Dth

/day

Gas Year (Nov-Oct)

Low Expected High Pipeline Underground Storage Peak LNG

0

1

2

3

4

5

6

Mill

ion

Dth

/day

Gas Year (Nov-Oct)

2021/22 2013/14 2014/15 2016/17 2017/18

Low Expected High Potential Loads Pipeline Underground Storage Peak LNG

2012/13 2015/16 2018/19 2019/20 2020-21

0

1

2

3

4

5

6

7

8

9

12/13 13/14 14/15 15/16 16/17 17/18 18/19 19/20 20/21 21/22

Mil

lio

n D

th/d

ay

Gas Year (Nov-Oct)

Low Expected High Pipeline Underground Storage Peak LNG

0

1

2

3

4

5

6

Mill

ion

Dth

/day

Gas Year (Nov-Oct)

2021/22 2013/14 2014/15 2016/17 2017/18

Low Expected High Potential Loads Pipeline Underground Storage Peak LNG

2012/13 2015/16 2018/19 2019/20 2020-21

2012/13 20213/14 2014/15 2015/16 2016/17 2027/18 2018/19 2019/20 2020/21 2021/22

Non-firm Loads

N W G A 2 0 1 3 G A s o u t l o o k

16

In response to market signals, several

projects have been proposed to

accommodate future delivery capacity

needs. the first completed – the 683-mile

Ruby Pipeline built by El Paso Corporation

(acquired by kinder Morgan in May, 2012)

– began operating in July 2011, connecting

the opal trading hub in southwestern

Wyoming to the Malin trading hub at the

California-oregon border. Ruby’s 1.5 Bcf/d

capacity brings gas supply diversity to

Northern California and Eastern oregon

and Washington by providing additional

access to the prolific Rockies supply basin.

In conjunction with the Ruby Pipeline

development, transCanada GtN developed

a firm northbound service to allow delivery

of Ruby gas to customers along the GtN

system. With this service, GtN became a

bi-directional pipeline that now allows

customers more gas supply options and

flexibility.

Reductions in projected demand and a

slow economic recovery have canceled or

deferred several other projects. Assuming

recovery will occur, and given possible

changes in regional demand due to new

industry and/or lNG exports, it is only

Figure 17. Proposed Pipeline Projects a matter of time before new capacity

within the region will be required.

Figure 17 illustrates the active proposals,

which include:

Washington Expansion Project – In

response to a request for an incremental

750 million cubic feet per day (MMcf/d)

of capacity, Williams Northwest Pipeline

(NWP) is planning to construct the

Washington Expansion Project. the

project consists of 140 miles of 36-inch

diameter pipe to be constructed in 10

different segments in or near NWP’s

existing right-of-way along the I-5

corridor between sumas and Woodland,

plus additional compression at existing

compressor stations. In conjunction

with this project, NWP is also proposing

an incremental scalable expansion from

sumas to markets in the I-5 corridor

as far south as Molalla, oR. this phase

of the project is not contingent upon the

aforementioned expansion and could go in

service as early as fall 2015.

Northwest Market Access Expansion

(N-MAX)/Palomar Expansion – Williams

Northwest Pipeline (NWP) is working

with the current Palomar pipeline project

sponsors – NW Natural and transCanada

GtN – to develop the Cascade (eastern)

section of Palomar in conjunction with an

expansion of the existing NWP system. the

Cascade section of Palomar would consist

of a 106-mile, 30-inch diameter pipeline

that would run from GtN’s mainline in

central oregon to a NW Natural/NWP hub

near Molalla – enhancing delivery capacity

to the I-5 Corridor. Palomar’s initial design

capacity is 300 MMcf/d, expandable to 750

MMcf/d. It would be linked to the N-MAX

on the existing NWP system to deliver gas

to other markets along the I-5 corridor.

Spectra/FortisBC System

Enhancement – FortisBC and spectra

Energy continue to evaluate using

FortisBC’s southern Crossing system to

provide spectra’s t-south shippers with

flexible receipt and delivery options

between station 2 in northeast B.C. and

the sumas (WA) and kingsgate (ID) market

hubs. this would involve expanding

FortisBC’s existing bi-directional southern

Crossing system that connects spectra’s

t-south system at kingsvale, B.C., to

transCanada’s system at Yahk, B.C., and

requires a 100-mile pipeline looping

project on the kingsvale to oliver B.C.

segment. Incremental capacity from

station 2 on the spectra system to

kingsgate could be up to 450 MMcf/d.

Expanded kingsgate-to-sumas (east-to-

west) flow capability could also increase

supply delivered to sumas to serve the B.C.

lower mainland and I-5 Corridor.

PG&

E Ruby

Tuscarira

NWP

GTN

Westc

oast

TCPLSouthernCrossing

Kern

Sumas Kingsgate

Malin

Stanfield

Opal

- Install pipeline loop and compression Washington Expansion Project

- Utilize capacity on GTN and proposed Palomar in combination with NWP expansion in I-5 corridor

Spectra/FortisBC SystemEnhancement Project

- Utilize capacity on Westcoast in combination with Southern Crossing expansion to Kingsgate.

MadrasMolalla

Kingsvale

2Palomar

1

1

3

NWP

N-Max/Palomar Expansion2

3

3

N W G A 2 0 1 3 G A s o u t l o o k

17

Notes on Regional Natural Gas System CapacityNWGA members continuously monitor a number of

dynamics to ensure that regional natural gas consumers

have the gas they need when and where they need it,

including:

• When, where and how much natural gas the region

will require to generate electricity to meet growing

demand and support intermittent renewable sources of

generation.

• Impacts of the region’s changing load profile on existing

natural gas infrastructure. For example, if any of the new

industrial facilities being considered in B.C. are built, they

will require large incremental capacity. Where existing

pipelines are underutilized, they would be filled. Where

pipelines are fully subscribed, expansion will be needed.

• the timing of new or expanded infrastructure. Because

projects can take three to five years to develop, foresight

is imperative.

Investments in SafetyWhile the cost of natural gas itself is lower than it has been in years, the cost of moving that gas from one place to another is increasing. one of the primary drivers of this cost increase is “Integrity Management.”

Previously, pipeline maintenance and inspection focused on the pipeline: investigating its physical qualities, supporting systems and the administration of an operator’s inspection program.

Integrity Management takes a broader view, encompassing the environment in which the pipeline exists. Pipeline operators are

required to know more about the areas their pipelines traverse. Integrity Management requires operators to manage their facilities

in the context of the population proximate to the pipeline and the existence of environmentally sensitive areas nearby.

the principles of Integrity Management drive operators to understand the potential consequences of failure of a specific pipeline in a particular area. operators then set priorities for operations, inspection and maintenance based on the relative risk to people, property or the environment.

the pipeline operators in the Pacific Northwest are investing a significant amount of capital in Integrity

Management to ensure that their systems continue to deliver natural gas safely and reliably.

N W G A 2 0 1 3 G A s o u t l o o k

18

APPENDICES

A1. Maximum Capacity (Dth/d)SUPPLy

PipelineInterconnects

WCSB via TCPL/GTN

stanfield (NWP from GtN)

starr Rd (NWP from GtN)

Palouse (NWP from GtN)

GtN Direct Connects

kingsgate/Yahk BC Interior from tCPl

Rockies via NWP

NWP north from NWP south

Max Demand on Reno lateral

WCSB via SET

t-south to Huntingdon

t-south to BC Interior

t-south to kingsvale

Storage

Jackson Prairie (NWP from JP)

Mist storage (NWN)

Plymouth (NWP from lNG)

Newport/Portland lNG (NWN)

Nampa lNG (IGC)

Gig Harbor satellite lNG (PsE)

swarr stn Propane (PsE)

tilbury lNG (FortisBC)

Mount Hayes lNG (FortisBC)

TotalAvailableSupply

2012 / 2013 2013 / 2014 2014 / 2015 2015 / 2016 2016 / 2017 2017 / 2018 2018 / 2019 2019 / 2020 2020 / 2021 2021 / 2022

4,033,049 4,033,049 4,033,049 4,033,049 4,033,049 4,033,049 4,033,049 4,033,049 4,033,049 4,033,049

1,554,784 1,554,784 1,554,784 1,554,784 1,554,784 1,554,784 1,554,784 1,554,784 1,554,784 1,554,784

692,920 692,920 692,920 692,920 692,920 692,920 692,920 692,920 692,920 692,920

165,000 165,000 165,000 165,000 165,000 165,000 165,000 165,000 165,000 165,000

70,459 70,459 70,459 70,459 70,459 70,459 70,459 70,459 70,459 70,459

439,464 439,464 439,464 439,464 439,464 439,464 439,464 439,464 439,464 439,464

186,941 186,941 186,941 186,941 186,941 186,941 186,941 186,941 186,941 186,941

495,000 495,000 495,000 495,000 495,000 495,000 495,000 495,000 495,000 495,000

655,000 655,000 655,000 655,000 655,000 655,000 655,000 655,000 655,000 655,000

(160,000) (160,000) (160,000) (160,000) (160,000) (160,000) (160,000) (160,000) (160,000) (160,000)

1,983,265 1,983,265 1,983,265 1,983,265 1,983,265 1,983,265 1,983,265 1,983,265 1,983,265 1,983,265

1,753,060 1,753,060 1,753,060 1,753,060 1,753,060 1,753,060 1,753,060 1,753,060 1,753,060 1,753,060

178,705 178,705 178,705 178,705 178,705 178,705 178,705 178,705 178,705 178,705

51,500 51,500 51,500 51,500 51,500 51,500 51,500 51,500 51,500 51,500

2,585,058 2,585,058 2,585,058 2,585,058 2,585,058 2,585,058 2,585,058 2,585,058 2,585,058 2,585,058

1,196,000 1,196,000 1,196,000 1,196,000 1,196,000 1,196,000 1,196,000 1,196,000 1,196,000 1,196,000

520,000 520,000 520,000 520,000 520,000 520,000 520,000 520,000 520,000 520,000

305,300 305,300 305,300 305,300 305,300 305,300 305,300 305,300 305,300 305,300

180,000 180,000 180,000 180,000 180,000 180,000 180,000 180,000 180,000 180,000

60,000 60,000 60,000 60,000 60,000 60,000 60,000 60,000 60,000 60,000

2,500 2,500 2,500 2,500 2,500 2,500 2,500 2,500 2,500 2,500

10,000 10,000 10,000 10,000 10,000 10,000 10,000 10,000 10,000 10,000

155,466 155,466 155,466 155,466 155,466 155,466 155,466 155,466 155,466 155,466

153,042 153,042 153,042 153,042 153,042 153,042 153,042 153,042 153,042 153,0

6,618,107 6,618,107 6,618,107 6,618,107 6,618,107 6,618,107 6,618,107 6,618,107 6,618,107 6,618,107

N W G A 2 0 1 3 G A s o u t l o o k

19

Region/Sector 2012 / 2013 2013 / 2014 2014 / 2015 2015 / 2016 2016 / 2017 2017 / 2018 2018 / 2019 2019 / 2020 2020 / 2021 2021 / 2022

BCLowerMainland&Van.Island 141,469,232141,894,104 142,309,982 142,617,622 142,898,953 143,208,340 143,534,130 143,876,922 144,237,344 144,616,045 Residential 54,664,103 54,644,278 54,659,062 54,642,180 54,598,667 54,567,851 54,539,494 54,513,674 54,490,473 54,469,977 Commercial 39,176,189 39,492,160 39,811,069 40,134,372 40,459,217 40,799,420 41,153,566 41,522,179 41,905,801 42,304,999 Industrial 30,760,642 30,889,366 30,971,552 30,972,770 30,972,770 30,972,770 30,972,770 30,972,770 30,972,770 30,972,770 Power Generation 16,868,299 16,868,299 16,868,299 16,868,299 16,868,299 16,868,299 16,868,299 16,868,299 16,868,299 16,868,299

W.Washington 251,515,847254,216,529 262,518,271 264,395,000 266,135,809 265,965,772 270,741,795 273,862,014 269,523,075 270,494,052Residential 71,344,400 72,540,674 73,716,495 75,145,031 76,038,562 77,196,740 78,372,143 79,875,322 80,804,066 81,992,312 Commercial 42,997,081 43,806,130 44,492,478 45,187,718 45,525,310 46,010,412 46,531,588 47,272,249 47,686,505 48,215,876 Industrial 75,168,349 75,581,951 76,005,067 76,486,560 76,785,973 77,142,328 77,509,338 77,968,441 78,297,993 78,674,772 Power Generation 62,006,017 62,287,773 68,304,232 67,575,692 67,785,965 65,616,292 68,328,726 68,746,001 62,734,511 61,611,093

W.Oregon 121,120,995119,927,262 121,465,786 123,054,032 145,859,625 146,948,413 147,962,119 149,373,495 149,761,963 150,483,561Residential 37,489,972 37,659,062 37,931,245 38,500,454 38,836,451 39,432,642 39,981,311 40,779,532 41,229,364 41,889,379 Commercial 24,488,931 24,390,834 24,427,117 24,514,270 24,454,485 24,519,083 24,593,228 24,774,574 24,773,923 24,868,498 Industrial 42,299,211 42,877,366 44,107,424 45,039,308 45,668,689 46,096,688 46,487,580 46,859,390 46,858,676 46,825,684 Power Generation 16,842,881 15,000,000 15,000,000 15,000,000 36,900,000 36,900,000 36,900,000 36,960,000 36,900,000 36,900,000

BCInterior 49,713,313 49,494,799 49,504,429 49,473,876 49,440,137 49,425,985 49,395,462 49,380,819 49,371,638 49,368,927Residential 16,568,842 16,510,337 16,450,438 16,376,820 16,300,284 16,227,376 16,154,827 16,082,634 16,010,797 15,939,312 Commercial 10,181,300 10,221,486 10,262,880 10,305,483 10,348,280 10,407,035 10,449,062 10,506,611 10,569,268 10,638,041 Industrial 22,963,171 22,762,975 22,791,111 22,791,573 22,791,573 22,791,573 22,791,573 22,791,573 22,791,573 22,791,573 Power Generation - - - - - - - - - -

E.Washington&N.Idaho 71,049,266 71,230,084 72,141,770 73,057,932 74,029,284 75,190,339 76,316,431 77,189,820 78,978,867 80,405,382Residential 19,732,226 19,561,228 19,784,302 20,127,970 20,307,494 20,547,318 20,773,692 21,093,986 21,327,078 21,605,087 Commercial 14,227,910 14,131,375 14,269,471 14,482,152 14,608,328 14,767,786 14,918,388 15,123,584 15,275,016 15,453,300 Industrial 28,083,616 28,434,096 28,779,941 29,018,981 29,305,274 29,613,583 29,926,056 30,244,058 30,556,087 30,868,134 Power Generation 9,005,513 9,103,385 9,308,056 9,428,829 9,808,187 10,261,653 10,698,295 10,728,191 11,820,685 12,478,861

E.Oregon&Medford 106,023,796106,538,544 107,824,497 109,021,708 113,196,751 116,367,069 119,263,080 120,095,331 129,176,215 134,247,272Residential 7,668,618 7,631,605 7,693,128 7,784,112 7,845,863 7,919,449 7,988,227 8,077,278 8,148,414 8,228,299 Commercial 5,496,381 5,487,724 5,530,595 5,587,361 5,626,777 5,673,082 5,716,689 5,772,196 5,813,752 5,860,134 Industrial 9,154,613 9,231,319 9,302,266 9,373,206 9,444,675 9,515,817 9,586,138 9,657,245 9,736,547 9,817,084 Power Generation 83,704,184 84,187,896 85,298,508 86,277,029 90,279,435 93,258,721 95,972,026 96,588,612 105,477,501 110,341,756

S.Idaho 76,735,074 77,615,830 78,156,141 78,853,740 79,215,395 79,813,527 80,436,471 81,063,520 81,699,381 82,335,564Residential 33,987,783 34,327,075 34,699,598 35,212,946 35,462,812 35,817,441 36,175,615 36,537,372 36,902,746 37,271,774 Commercial 11,555,845 11,671,204 11,797,862 11,972,400 12,057,354 12,177,928 12,299,707 12,422,705 12,546,932 12,672,401 Industrial 24,691,446 25,117,551 25,158,682 25,168,394 25,195,228 25,318,158 25,461,149 25,603,443 25,749,703 25,891,389 Power Generation 6,500,000 6,500,000 6,500,000 6,500,000 6,500,000 6,500,000 6,500,000 6,500,000 6,500,000 6,500,000

PNWAnnualDemand-Base 817,627,523 820,917,151 833,920,875 840,473,910 870,775,954 876,919,446 887,649,487 894,841,921 902,748,481 911,950,804Residential 241,455,944 242,874,260 244,934,268 247,789,512 249,390,133 251,708,817 253,985,308 256,959,799 258,912,937 261,396,140 Commercial 148,123,636 149,200,915 150,591,471 152,183,755 153,079,751 154,354,747 155,662,229 157,394,098 158,571,198 160,013,249 Industrial 233,121,047 234,894,623 237,116,042 238,850,793 240,164,184 241,450,917 242,734,605 244,096,921 244,963,350 245,841,407 Power Generation 194,926,895 193,947,353 201,279,094 201,649,849 228,141,886 229,404,965 235,267,345 236,391,103 240,300,996 244,700,008

A2. Annual Expected Demand Summary - (Dth)

N W G A 2 0 1 3 G A s o u t l o o k

20

Region/Sector 2012 / 2013 2013 / 2014 2014 / 2015 2015 / 2016 2016 / 2017 2017 / 2018 2018 / 2019 2019 / 2020 2020 / 2021 2021 / 2022BCLowerMainland&Van.Island141,469,232142,850,133 144,232,236 145,505,321 146,778,834 148,099,252 149,453,431 150,842,726 152,268,554 153,732,401

Residential 54,664,103 55,205,067 55,780,526 56,312,981 56,834,798 57,376,584 57,926,056 58,483,421 59,048,895 59,622,704 Commercial 39,176,189 39,887,402 40,611,859 41,351,271 42,102,966 42,881,599 43,686,306 44,518,235 45,378,589 46,268,627 Industrial 30,760,642 30,889,366 30,971,552 30,972,770 30,972,770 30,972,770 30,972,770 30,972,770 30,972,770 30,972,770 Power Generation 16,868,299 16,868,299 16,868,299 16,868,299 16,868,299 16,868,299 16,868,299 16,868,299 16,868,299 16,868,299

W.Washington 254,138,837257,633,210 277,430,885 282,836,041 284,979,587 293,381,362 300,403,260 305,712,310 298,979,765 299,843,138Residential 72,078,261 73,610,909 75,124,724 76,912,803 78,172,796 79,724,818 81,316,807 83,266,225 84,636,423 86,298,561 Commercial 43,639,906 44,704,290 45,642,195 46,594,644 47,186,607 47,941,927 48,746,542 49,792,298 50,504,696 51,351,296 Industrial 76,414,654 77,030,237 77,659,464 78,348,781 78,850,235 79,412,433 79,987,428 80,659,611 81,197,247 81,787,392 Power Generation 62,006,017 62,287,773 79,004,502 80,979,813 80,769,949 86,302,185 90,352,484 91,994,177 82,641,399 80,405,889

W.Oregon 122,699,006121,742,970 123,556,459 125,406,592 148,495,463 149,886,633 151,216,650 152,973,079 153,674,564 154,727,048Residential 37,577,119 37,880,912 38,289,915 39,019,798 39,548,610 40,351,199 41,110,625 42,123,182 42,775,318 43,650,856 Commercial 24,578,040 24,549,913 24,646,979 24,782,035 24,785,367 24,921,962 25,079,583 25,372,113 25,479,317 25,689,254 Industrial 43,700,966 44,312,145 45,619,565 46,604,758 47,261,487 47,713,473 48,126,441 48,517,785 48,519,929 48,486,937 Power Generation 16,842,881 15,000,000 15,000,000 15,000,000 36,900,000 36,900,000 36,900,000 36,960,000 36,900,000 36,900,000

BCInterior 49,713,313 49,766,732 50,046,851 50,290,695 50,533,370 50,787,430 51,049,029 51,318,594 51,596,590 51,884,308Residential 16,568,842 16,677,470 16,785,207 16,879,333 16,970,627 17,065,820 17,161,581 17,257,913 17,354,819 17,452,305 Commercial 10,181,300 10,324,391 10,470,533 10,619,789 10,771,169 10,930,037 11,095,875 11,269,108 11,450,198 11,640,429 Industrial 22,963,171 22,764,871 22,791,111 22,791,573 22,791,573 22,791,573 22,791,573 22,791,573 22,791,573 22,791,573 Power Generation - - - - - - - - - -

E.Washington&N.Idaho 83,236,602 83,926,935 84,791,965 86,348,287 92,902,870 91,727,781 94,696,086 99,131,618 99,197,328 99,943,255Residential 20,187,186 20,753,603 21,323,079 21,959,641 22,479,109 23,071,560 23,670,470 24,364,447 24,910,872 25,559,949 Commercial 14,413,408 14,750,975 15,103,620 15,500,476 15,843,518 16,227,835 16,617,055 17,062,606 17,422,646 17,843,917 Industrial 28,515,482 28,887,137 29,244,919 29,494,266 29,793,935 30,116,489 30,444,502 30,778,292 31,106,016 31,435,483 Power Generation 20,120,526 19,535,221 19,120,347 19,393,903 24,786,308 22,311,896 23,964,059 26,926,273 25,757,793 25,103,906

E.Oregon&Medford 124,531,761131,745,116 135,496,361 138,156,992 142,159,575 145,204,586 147,607,445 149,068,857 151,178,217 152,690,412Residential 7,875,136 8,024,515 8,185,944 8,363,584 8,521,432 8,695,477 8,871,005 9,066,705 9,231,128 9,417,559 Commercial 5,621,147 5,711,450 5,809,956 5,915,250 6,010,405 6,115,650 6,222,672 6,342,276 6,442,350 6,555,557 Industrial 9,316,622 9,398,486 9,473,640 9,548,511 9,623,803 9,698,914 9,773,432 9,848,690 9,932,114 10,016,881 Power Generation 101,718,855 108,610,666 112,026,822 114,329,647 118,003,934 120,694,547 122,740,336 123,811,186 125,572,624 126,700,414

S.Idaho 78,243,716 79,660,305 80,461,519 81,436,762 82,074,337 82,996,148 83,965,019 84,945,447 85,942,279 86,947,154Residential 34,014,166 34,532,391 35,099,656 35,820,201 36,276,086 36,820,226 37,372,530 37,933,116 38,502,114 39,079,646 Commercial 11,564,815 11,741,011 11,933,881 12,178,867 12,333,867 12,518,875 12,706,658 12,897,258 13,090,717 13,287,078 Industrial 26,164,736 26,886,903 26,927,982 26,937,694 26,964,384 27,157,047 27,385,831 27,615,073 27,849,448 28,080,430 Power Generation 6,500,000 6,500,000 6,500,000 6,500,000 6,500,000 6,500,000 6,500,000 6,500,000 6,500,000 6,500,000

PNWAnnualDemand-Base 854,032,468 867,325,401 896,016,277 909,980,690 947,924,035 962,083,192 978,390,921 993,992,632 992,837,296 999,767,716Residential 242,964,812 246,684,866 250,589,051 255,268,342 258,803,458 263,105,684 267,429,074 272,495,008 276,459,569 281,081,580 Commercial 149,174,805 151,669,431 154,219,023 156,942,332 159,033,900 161,537,883 164,154,691 167,253,894 169,768,513 172,636,160 Industrial 237,836,272 240,169,145 242,688,232 244,698,355 246,258,188 247,862,699 249,481,978 251,183,795 252,369,098 253,571,467 Power Generation 224,056,579 228,801,959 248,519,970 253,071,661 283,828,490 289,576,926 297,325,178 303,059,934 294,240,115 292,478,509

A3. Annual Expected Demand Summary - (Dth)

N W G A 2 0 1 3 G A s o u t l o o k

21

Region/Sector 2012 / 2013 2013 / 2014 2014 / 2015 2015 / 2016 2016 / 2017 2017 / 2018 2018 / 2019 2019 / 2020 2020 / 2021 2021 / 2022

BCLowerMainland&Van.Island141,469,232140,480,811 139,489,596 138,387,441 137,283,780 136,221,064 135,185,308 134,176,263 133,193,690 132,237,361 Residential 54,664,103 53,823,849 53,024,911 52,192,210 51,358,276 50,551,442 49,759,609 48,982,544 48,220,022 47,471,821 Commercial 39,176,189 38,899,298 38,624,835 38,354,161 38,084,434 37,828,553 37,584,630 37,352,649 37,132,599 36,924,471 Industrial 30,760,642 30,889,366 30,971,552 30,972,770 30,972,770 30,972,770 30,972,770 30,972,770 30,972,770 30,972,770 Power Generation 16,868,299 16,868,299 16,868,299 16,868,299 16,868,299 16,868,299 16,868,299 16,868,299 16,868,299 16,868,299

W.Washington 249,734,802251,814,904 259,435,203 260,585,267 261,598,077 260,675,507 264,691,906 267,012,440 261,905,208 262,081,576 Residential 70,763,767 71,778,964 72,728,964 73,896,836 74,520,892 75,393,915 76,279,342 77,469,317 78,098,306 78,971,760 Commercial 42,443,574 43,083,214 43,584,252 44,084,997 44,231,340 44,517,613 44,837,202 45,362,319 45,572,457 45,889,138 Industrial 74,521,444 74,664,952 74,817,755 75,027,742 75,059,880 75,147,686 75,246,636 75,434,802 75,499,933 75,609,586 Power Generation 62,006,017 62,287,773 68,304,232 67,575,692 67,785,965 65,616,292 68,328,726 68,746,001 62,734,511 61,611,093

W.Oregon 119,515,812118,020,287 119,266,679 120,532,182 143,039,397 143,827,073 144,578,147 145,747,265 145,951,952 146,538,754 Residential 37,394,769 37,370,110 37,461,377 37,808,902 37,935,345 38,321,166 38,685,281 39,314,236 39,636,099 40,198,700 Commercial 24,393,771 24,193,833 24,147,714 24,165,010 24,043,161 24,039,700 24,056,190 24,182,075 24,138,820 24,199,009 Industrial 40,884,392 41,456,345 42,657,589 43,558,270 44,160,890 44,566,207 44,936,677 45,290,954 45,277,034 45,241,046 Power Generation 16,842,881 15,000,000 15,000,000 15,000,000 36,900,000 36,900,000 36,900,000 36,960,000 36,900,000 36,900,000

BCInterior 49,713,313 49,089,743 48,701,017 48,279,230 47,861,274 47,458,508 47,066,791 46,686,025 46,316,126 46,356,469 Residential 16,568,842 16,259,638 15,954,606 15,641,906 15,332,251 15,031,802 14,737,271 14,448,541 14,165,497 14,165,497 Commercial 10,181,300 10,067,130 9,955,300 9,845,751 9,737,450 9,635,133 9,537,947 9,445,911 9,359,055 9,399,398 Industrial 22,963,171 22,762,975 22,791,111 22,791,573 22,791,573 22,791,573 22,791,573 22,791,573 22,791,573 22,791,573 Power Generation - - - - - - - - - -

E.Washington&N.Idaho 69,893,987 67,924,278 67,986,609 68,216,438 69,096,517 69,882,552 70,681,710 71,584,161 73,366,041 74,500,312 Residential 19,598,400 18,668,130 18,518,200 18,420,542 18,411,543 18,468,153 18,608,875 18,804,005 18,903,037 19,035,781 Commercial 14,213,754 13,713,251 13,653,878 13,628,601 13,656,053 13,721,511 13,834,102 13,979,120 14,065,596 14,172,951 Industrial 27,943,186 28,287,516 28,632,308 28,868,435 29,155,996 29,465,918 29,782,167 30,103,212 30,417,733 30,732,340 Power Generation 8,138,647 7,255,381 7,182,222 7,298,860 7,872,925 8,226,969 8,456,566 8,697,824 9,979,675 10,559,241

E.Oregon&Medford 99,591,282 92,874,353 92,494,786 93,240,935 98,420,106 101,314,492 103,241,053 104,774,229 115,848,409 120,938,124 Residential 7,606,104 7,444,763 7,449,433 7,466,216 7,504,223 7,556,371 7,626,186 7,707,544 7,768,706 7,837,199 Commercial 5,461,216 5,398,166 5,417,370 5,440,982 5,473,051 5,513,590 5,563,328 5,620,212 5,662,043 5,708,099 Industrial 9,078,770 9,158,139 9,230,199 9,302,329 9,374,183 9,446,663 9,519,087 9,592,184 9,672,317 9,754,591 Power Generation 77,445,192 70,873,285 70,397,785 71,031,408 76,068,648 78,797,868 80,532,453 81,854,289 92,745,343 97,638,234

S.Idaho 76,264,457 76,644,581 76,853,463 77,235,210 77,280,440 77,584,163 77,896,695 78,209,162 78,526,109 78,839,224 Residential 33,956,242 34,086,290 34,228,425 34,503,702 34,515,486 34,688,063 34,861,504 35,035,811 35,210,991 35,387,045 Commercial 11,545,121 11,589,337 11,637,663 11,731,257 11,735,264 11,793,940 11,852,910 11,912,174 11,971,735 12,031,594 Industrial 24,263,094 24,468,955 24,487,375 24,500,251 24,529,691 24,602,160 24,682,281 24,761,177 24,843,383 24,920,585 Power Generation 6,500,000 6,500,000 6,500,000 6,500,000 6,500,000 6,500,000 6,500,000 6,500,000 6,500,000 6,500,000

PNWAnnualDemand-Base 806,182,885 796,848,958 804,227,353 806,476,704 834,579,592 836,963,360 843,341,611 848,189,545 855,107,534 861,491,820 Residential 240,552,227 239,431,744 239,365,917 239,930,314 239,578,017 240,010,914 240,558,068 241,761,999 242,002,658 243,067,803 Commercial 147,414,924 146,944,228 147,021,010 147,250,759 146,960,753 147,050,039 147,266,308 147,854,459 147,902,305 148,324,659 Industrial 230,414,698 231,688,247 233,587,888 235,021,372 236,044,984 236,992,980 237,931,192 238,946,673 239,474,744 240,022,491 Power Generation 187,801,036 178,784,738 184,252,538 184,274,259 211,995,837 212,909,429 217,586,044 219,626,414 225,727,827 230,076,866

A4. Low Annual Demand Summary - (Dth)

N W G A 2 0 1 3 G A S O U T L O O K

22

Region/Sector 2012 / 2013 2013 / 2014 2014 / 2015 2015 / 2016 2016 / 2017 2017 / 2018 2018 / 2019 2019 / 2020 2020 / 2021 2021 / 2022

BCLowerMainland&Van.Island141,469,232140,480,811 139,489,596 138,387,441 137,283,780 136,221,064 135,185,308 134,176,263 133,193,690 132,237,361 Residential 54,664,103 53,823,849 53,024,911 52,192,210 51,358,276 50,551,442 49,759,609 48,982,544 48,220,022 47,471,821 Commercial 39,176,189 38,899,298 38,624,835 38,354,161 38,084,434 37,828,553 37,584,630 37,352,649 37,132,599 36,924,471 Industrial 30,760,642 30,889,366 30,971,552 30,972,770 30,972,770 30,972,770 30,972,770 30,972,770 30,972,770 30,972,770 Power Generation 16,868,299 16,868,299 16,868,299 16,868,299 16,868,299 16,868,299 16,868,299 16,868,299 16,868,299 16,868,299

W.Washington 249,734,802251,814,904 259,435,203 260,585,267 261,598,077 260,675,507 264,691,906 267,012,440 261,905,208 262,081,576 Residential 70,763,767 71,778,964 72,728,964 73,896,836 74,520,892 75,393,915 76,279,342 77,469,317 78,098,306 78,971,760 Commercial 42,443,574 43,083,214 43,584,252 44,084,997 44,231,340 44,517,613 44,837,202 45,362,319 45,572,457 45,889,138 Industrial 74,521,444 74,664,952 74,817,755 75,027,742 75,059,880 75,147,686 75,246,636 75,434,802 75,499,933 75,609,586 Power Generation 62,006,017 62,287,773 68,304,232 67,575,692 67,785,965 65,616,292 68,328,726 68,746,001 62,734,511 61,611,093

W.Oregon 119,515,812118,020,287 119,266,679 120,532,182 143,039,397 143,827,073 144,578,147 145,747,265 145,951,952 146,538,754 Residential 37,394,769 37,370,110 37,461,377 37,808,902 37,935,345 38,321,166 38,685,281 39,314,236 39,636,099 40,198,700 Commercial 24,393,771 24,193,833 24,147,714 24,165,010 24,043,161 24,039,700 24,056,190 24,182,075 24,138,820 24,199,009 Industrial 40,884,392 41,456,345 42,657,589 43,558,270 44,160,890 44,566,207 44,936,677 45,290,954 45,277,034 45,241,046 Power Generation 16,842,881 15,000,000 15,000,000 15,000,000 36,900,000 36,900,000 36,900,000 36,960,000 36,900,000 36,900,000

BCInterior 49,713,313 49,089,743 48,701,017 48,279,230 47,861,274 47,458,508 47,066,791 46,686,025 46,316,126 46,356,469 Residential 16,568,842 16,259,638 15,954,606 15,641,906 15,332,251 15,031,802 14,737,271 14,448,541 14,165,497 14,165,497 Commercial 10,181,300 10,067,130 9,955,300 9,845,751 9,737,450 9,635,133 9,537,947 9,445,911 9,359,055 9,399,398 Industrial 22,963,171 22,762,975 22,791,111 22,791,573 22,791,573 22,791,573 22,791,573 22,791,573 22,791,573 22,791,573 Power Generation - - - - - - - - - -

E.Washington&N.Idaho 69,893,987 67,924,278 67,986,609 68,216,438 69,096,517 69,882,552 70,681,710 71,584,161 73,366,041 74,500,312 Residential 19,598,400 18,668,130 18,518,200 18,420,542 18,411,543 18,468,153 18,608,875 18,804,005 18,903,037 19,035,781 Commercial 14,213,754 13,713,251 13,653,878 13,628,601 13,656,053 13,721,511 13,834,102 13,979,120 14,065,596 14,172,951 Industrial 27,943,186 28,287,516 28,632,308 28,868,435 29,155,996 29,465,918 29,782,167 30,103,212 30,417,733 30,732,340 Power Generation 8,138,647 7,255,381 7,182,222 7,298,860 7,872,925 8,226,969 8,456,566 8,697,824 9,979,675 10,559,241

E.Oregon&Medford 99,591,282 92,874,353 92,494,786 93,240,935 98,420,106 101,314,492 103,241,053 104,774,229 115,848,409 120,938,124 Residential 7,606,104 7,444,763 7,449,433 7,466,216 7,504,223 7,556,371 7,626,186 7,707,544 7,768,706 7,837,199 Commercial 5,461,216 5,398,166 5,417,370 5,440,982 5,473,051 5,513,590 5,563,328 5,620,212 5,662,043 5,708,099 Industrial 9,078,770 9,158,139 9,230,199 9,302,329 9,374,183 9,446,663 9,519,087 9,592,184 9,672,317 9,754,591 Power Generation 77,445,192 70,873,285 70,397,785 71,031,408 76,068,648 78,797,868 80,532,453 81,854,289 92,745,343 97,638,234

S.Idaho 76,264,457 76,644,581 76,853,463 77,235,210 77,280,440 77,584,163 77,896,695 78,209,162 78,526,109 78,839,224 Residential 33,956,242 34,086,290 34,228,425 34,503,702 34,515,486 34,688,063 34,861,504 35,035,811 35,210,991 35,387,045 Commercial 11,545,121 11,589,337 11,637,663 11,731,257 11,735,264 11,793,940 11,852,910 11,912,174 11,971,735 12,031,594 Industrial 24,263,094 24,468,955 24,487,375 24,500,251 24,529,691 24,602,160 24,682,281 24,761,177 24,843,383 24,920,585 Power Generation 6,500,000 6,500,000 6,500,000 6,500,000 6,500,000 6,500,000 6,500,000 6,500,000 6,500,000 6,500,000

PNWAnnualDemand-Base 806,182,885 796,848,958 804,227,353 806,476,704 834,579,592 836,963,360 843,341,611 848,189,545 855,107,534 861,491,820 Residential 240,552,227 239,431,744 239,365,917 239,930,314 239,578,017 240,010,914 240,558,068 241,761,999 242,002,658 243,067,803 Commercial 147,414,924 146,944,228 147,021,010 147,250,759 146,960,753 147,050,039 147,266,308 147,854,459 147,902,305 148,324,659 Industrial 230,414,698 231,688,247 233,587,888 235,021,372 236,044,984 236,992,980 237,931,192 238,946,673 239,474,744 240,022,491 Power Generation 187,801,036 178,784,738 184,252,538 184,274,259 211,995,837 212,909,429 217,586,044 219,626,414 225,727,827 230,076,866

DEMAND(Region/Sector) 2012 / 2013 2013 / 2014 2014 / 2015 2015 / 2016 2016 / 2017 2017 / 2018 2018 / 2019 2019 / 2020 2020 / 2021 2021 / 2022

BCLowerMain&Van.Island(I-5Corridor) 1,181,399 1,185,497 1,189,938 1,193,924 1,197,768 1,201,977 1,206,407 1,211,066 1,215,963 1,221,114Residential 591,302 591,141 591,282 590,912 590,369 589,988 589,636 589,313 589,021 588,767Commercial (Firm Sales & Transport) 418,750 423,009 427,308 431,664 436,052 440,642 445,424 450,405 455,595 460,999Industrial (Firm Sales & Transport) 133,435 133,435 133,435 133,435 133,435 133,435 133,435 133,435 133,435 133,435Power Generation 37,913 37,913 37,913 37,913 37,913 37,913 37,913 37,913 37,913 37,913

W.Washington(I-5Corridor) 1,929,128 1,951,640 1,975,062 1,997,106 2,017,665 2,038,068 2,058,547 2,079,536 2,102,129 2,124,283Residential 827,203 843,840 860,502 876,504 892,281 908,389 924,409 940,500 957,532 974,327Commercial (Firm Sales & Transport) 342,639 350,722 359,699 367,927 374,896 381,402 387,992 394,984 402,586 409,973Industrial (Firm Sales & Transport) 272,937 270,729 268,512 266,326 264,138 261,928 259,797 257,704 255,661 253,634Power Generation 486,349 486,349 486,349 486,349 486,349 486,349 486,349 486,349 486,349 486,349

W.Oregon(I-5Corridor) 983,960 982,671 986,652 990,069 1,055,555 1,062,906 1,070,896 1,077,516 1,086,537 1,095,102Residential 558,321 558,694 563,226 567,878 574,143 581,730 589,954 596,578 605,279 613,540Commercial (Firm Sales & Transport) 285,733 284,492 284,237 283,271 282,760 282,766 282,773 282,983 283,517 284,006Industrial (Firm Sales & Transport) 36,905 36,485 36,189 35,921 35,651 35,410 35,169 34,956 34,742 34,555Power Generation 103,000 103,000 103,000 103,000 163,000 163,000 163,000 163,000 163,000 163,000

TotalPeak(Design)DayDemand 4,094,487 4,119,809 4,151,652 4,181,098 4,270,988 4,302,952 4,335,850 4,368,119 4,404,629 4,440,498 SUPPLY PipelineInterconnects 2,304,060 2,304,060 2,304,060 2,304,060 2,304,060 2,304,060 2,304,060 2,304,060 2,304,060 2,304,060

Max north flow on NWP @ Gorge 551,000 551,000 551,000 551,000 551,000 551,000 551,000 551,000 551,000 551,000Huntingdon/Sumas 1,753,060 1,753,060 1,753,060 1,753,060 1,753,060 1,753,060 1,753,060 1,753,060 1,753,060 1,753,060T-South to Huntingdon 1,753,060 1,753,060 1,753,060 1,753,060 1,753,060 1,753,060 1,753,060 1,753,060 1,753,060 1,753,060

UndergroundStorage 1,716,000 1,716,000 1,716,000 1,716,000 1,716,000 1,716,000 1,716,000 1,716,000 1,716,000 1,716,000Jackson Prairie (NWP from JP) 1,196,000 1,196,000 1,196,000 1,196,000 1,196,000 1,196,000 1,196,000 1,196,000 1,196,000 1,196,000Mist Storage (NWN) 520,000 520,000 520,000 520,000 520,000 520,000 520,000 520,000 520,000 520,000

PeakLNG 501,008 501,008 501,008 501,008 501,008 501,008 501,008 501,008 501,008 501,008Newport/Portland LNG (NWN) 180,000 180,000 180,000 180,000 180,000 180,000 180,000 180,000 180,000 180,000Gig Harbor Satellite LNG (PSE) 2,500 2,500 2,500 2,500 2,500 2,500 2,500 2,500 2,500 2,500Swarr Stn Propane (PSE) 10,000 10,000 10,000 10,000 10,000 10,000 10,000 10,000 10,000 10,000Tilbury LNG (FortisBC) 155,466 155,466 155,466 155,466 155,466 155,466 155,466 155,466 155,466 155,466Mount Hayes LNG (FortisBC) 153,042 153,042 153,042 153,042 153,042 153,042 153,042 153,042 153,042 153,042

TotalSupply 4,521,068 4,521,068 4,521,068 4,521,068 4,521,068 4,521,068 4,521,068 4,521,068 4,521,068 4,521,068 Supply Surplus/(Shortfall) 426,581 401,259 369,416 339,970 250,080 218,116 185,218 152,949 116,438 80,570

A5. I-5 Corridor Peak Day Expected Demand/Supply Balance (Dth/day)

N W G A 2 0 1 3 G A S O U T L O O K

23

DEMAND(Region/Sector) 2012 / 2013 2013 / 2014 2014 / 2015 2015 / 2016 2016 / 2017 2017 / 2018 2018 / 2019 2019 / 2020 2020 / 2021 2021 / 2022

BCLowerMain&Van.Island(I-5Corridor) 1,181,399 1,195,429 1,209,974 1,224,225 1,238,499 1,253,319 1,268,548 1,284,204 1,300,303 1,316,872Residential 591,302 597,118 603,297 609,013 614,604 620,414 626,308 632,289 638,359 644,527Commercial (Firm Sales & Transport) 418,750 426,964 435,329 443,865 452,548 461,558 470,893 480,567 490,596 500,997Industrial (Firm Sales & Transport) 133,435 133,435 133,435 133,435 133,435 133,435 133,435 133,435 133,435 133,435Power Generation 37,913 37,913 37,913 37,913 37,913 37,913 37,913 37,913 37,913 37,913

W.Washington(I-5Corridor) 2,095,196 2,158,830 2,298,773 2,285,414 2,292,480 2,344,473 2,335,698 2,356,027 2,371,612 2,402,757Residential 924,852 967,505 984,010 977,560 984,869 984,087 981,660 997,447 1,010,168 1,032,827Commercial (Firm Sales & Transport) 395,061 416,950 425,754 421,950 424,219 421,533 418,107 424,699 429,755 439,953Industrial (Firm Sales & Transport) 286,934 286,026 283,885 280,779 278,267 275,341 272,419 270,369 268,177 266,464Power Generation 488,349 488,349 605,124 605,124 605,124 663,512 663,512 663,512 663,512 663,512

W.Oregon(I-5Corridor) 987,821 989,314 996,203 1,002,596 1,071,544 1,082,614 1,094,463 1,105,246 1,118,341 1,131,148Residential 559,563 561,843 568,329 575,268 584,328 594,888 606,107 615,696 627,317 638,584Commercial (Firm Sales & Transport) 286,193 285,825 286,274 285,799 285,955 286,706 287,576 288,983 290,671 292,396Industrial (Firm Sales & Transport) 39,065 38,646 38,600 38,530 38,261 38,019 37,780 37,566 37,353 37,167Power Generation 103,000 103,000 103,000 103,000 163,000 163,000 163,000 163,000 163,000 163,000

TotalPeak(Design)DayDemand 4,264,416 4,343,573 4,504,950 4,512,235 4,602,523 4,680,406 4,698,710 4,745,477 4,790,256 4,850,777

SUPPLY PipelineInterconnects 2,304,060 2,304,060 2,304,060 2,304,060 2,304,060 2,304,060 2,304,060 2,304,060 2,304,060 2,304,060

Max north flow on NWP @ Gorge 551,000 551,000 551,000 551,000 551,000 551,000 551,000 551,000 551,000 551,000Huntingdon/Sumas 1,753,060 1,753,060 1,753,060 1,753,060 1,753,060 1,753,060 1,753,060 1,753,060 1,753,060 1,753,060T-South to Huntingdon 1,753,060 1,753,060 1,753,060 1,753,060 1,753,060 1,753,060 1,753,060 1,753,060 1,753,060 1,753,060

UndergroundStorage 1,716,000 1,716,000 1,716,000 1,716,000 1,716,000 1,716,000 1,716,000 1,716,000 1,716,000 1,716,000Jackson Prairie (NWP from JP) 1,196,000 1,196,000 1,196,000 1,196,000 1,196,000 1,196,000 1,196,000 1,196,000 1,196,000 1,196,000Mist Storage (NWN) 520,000 520,000 520,000 520,000 520,000 520,000 520,000 520,000 520,000 520,000

PeakLNG 501,008 501,008 501,008 501,008 501,008 501,008 501,008 501,008 501,008 501,008Newport/Portland LNG (NWN) 180,000 180,000 180,000 180,000 180,000 180,000 180,000 180,000 180,000 180,000Gig Harbor Satellite LNG (PSE) 2,500 2,500 2,500 2,500 2,500 2,500 2,500 2,500 2,500 2,500Swarr Stn Propane (PSE) 10,000 10,000 10,000 10,000 10,000 10,000 10,000 10,000 10,000 10,000Tilbury LNG (FortisBC) 155,466 155,466 155,466 155,466 155,466 155,466 155,466 155,466 155,466 155,466Mount Hayes LNG (FortisBC) 153,042 153,042 153,042 153,042 153,042 153,042 153,042 153,042 153,042 153,042

TotalSupply 4,521,068 4,521,068 4,521,068 4,521,068 4,521,068 4,521,068 4,521,068 4,521,068 4,521,068 4,521,068 Supply Surplus/(Shortfall) 256,651 177,495 16,118 8,833 -81,455 -159,338 -177,642 -224,409 -269,188 -329,709

A6. I-5 Corridor Peak Day High Demand/Supply Balance (Dth/day)

N W G A 2 0 1 3 G A S O U T L O O K

24

DEMAND(Region/Sector) 2012 / 2013 2013 / 2014 2014 / 2015 2015 / 2016 2016 / 2017 2017 / 2018 2018 / 2019 2019 / 2020 2020 / 2021 2021 / 2022

BCLowerMain&Van.Island(I-5Corridor) 1,181,399 1,170,460 1,159,986 1,149,193 1,138,396 1,128,076 1,118,083 1,108,417 1,099,076 1,090,064Residential 591,302 582,175 573,487 564,438 555,369 546,598 537,993 529,552 521,270 513,152Commercial (Firm Sales & Transport) 418,750 416,938 415,151 413,407 411,680 410,130 408,742 407,518 406,458 405,564Industrial (Firm Sales & Transport) 133,435 133,435 133,435 133,435 133,435 133,435 133,435 133,435 133,435 133,435Power Generation 37,913 37,913 37,913 37,913 37,913 37,913 37,913 37,913 37,913 37,913

W.Washington(I-5Corridor) 1,820,220 1,837,898 1,855,039 1,870,709 1,884,852 1,898,845 1,912,905 1,927,423 1,943,478 1,958,983Residential 819,372 832,943 845,647 857,622 869,346 881,422 893,441 905,520 918,514 931,195Commercial (Firm Sales & Transport) 337,981 344,748 351,903 358,303 363,435 368,100 372,822 377,923 383,615 389,081Industrial (Firm Sales & Transport) 263,620 260,959 258,242 255,537 252,823 250,075 247,395 244,732 242,102 239,459Power Generation 399,248 399,248 399,248 399,248 399,248 399,248 399,248 399,248 399,248 399,248

W.Oregon(I-5Corridor) 924,168 918,770 919,110 918,485 980,112 983,504 988,108 991,647 998,105 1,004,782Residential 557,023 554,531 556,416 557,834 560,934 565,351 570,830 574,997 581,682 588,481Commercial (Firm Sales & Transport) 285,240 282,755 281,507 279,733 278,530 277,746 277,112 276,697 276,683 276,748Industrial (Firm Sales & Transport) 31,905 31,483 31,187 30,918 30,649 30,407 30,167 29,953 29,740 29,553Power Generation 50,000 50,000 50,000 50,000 110,000 110,000 110,000 110,000 110,000 110,000

TotalPeak(Design)DayDemand 3,925,787 3,927,127 3,934,135 3,938,387 4,003,360 4,010,425 4,019,097 4,027,487 4,040,659 4,053,829

SUPPLY PipelineInterconnects 2,304,060 2,304,060 2,304,060 2,304,060 2,304,060 2,304,060 2,304,060 2,304,060 2,304,060 2,304,060

Max north flow on NWP @ Gorge 551,000 551,000 551,000 551,000 551,000 551,000 551,000 551,000 551,000 551,000Huntingdon/Sumas 1,753,060 1,753,060 1,753,060 1,753,060 1,753,060 1,753,060 1,753,060 1,753,060 1,753,060 1,753,060T-South to Huntingdon 1,753,060 1,753,060 1,753,060 1,753,060 1,753,060 1,753,060 1,753,060 1,753,060 1,753,060 1,753,060

UndergroundStorage 1,716,000 1,716,000 1,716,000 1,716,000 1,716,000 1,716,000 1,716,000 1,716,000 1,716,000 1,716,000Jackson Prairie (NWP from JP) 1,196,000 1,196,000 1,196,000 1,196,000 1,196,000 1,196,000 1,196,000 1,196,000 1,196,000 1,196,000Mist Storage (NWN) 520,000 520,000 520,000 520,000 520,000 520,000 520,000 520,000 520,000 520,000

PeakLNG 501,008 501,008 501,008 501,008 501,008 501,008 501,008 501,008 501,008 501,008Newport/Portland LNG (NWN) 180,000 180,000 180,000 180,000 180,000 180,000 180,000 180,000 180,000 180,000Gig Harbor Satellite LNG (PSE) 2,500 2,500 2,500 2,500 2,500 2,500 2,500 2,500 2,500 2,500Swarr Stn Propane (PSE) 10,000 10,000 10,000 10,000 10,000 10,000 10,000 10,000 10,000 10,000Tilbury LNG (FortisBC) 155,466 155,466 155,466 155,466 155,466 155,466 155,466 155,466 155,466 155,466Mount Hayes LNG (FortisBC) 153,042 153,042 153,042 153,042 153,042 153,042 153,042 153,042 153,042 153,042

TotalSupply 4,521,068 4,521,068 4,521,068 4,521,068 4,521,068 4,521,068 4,521,068 4,521,068 4,521,068 4,521,068 Supply Surplus/(Shortfall) 595,280 593,940 586,933 582,680 517,708 510,643 501,971 493,581 480,409 467,239

A7. I-5 Corridor Peak Day Low Demand/Supply Balance (Dth/day)


Recommended