© comScore, Inc. Proprietary.
2013 Holiday e-Commerce Trends
Through Green Monday
December 13, 2013
Gian Fulgoni, Chairman, comScore, Inc.
Andrew Lipsman, VP Marketing & Insights, comScore, Inc.
© comScore, Inc. Proprietary. 2
Topics for Today
• Review of Key Macroeconomic Trends
• 2013 Holiday E-Commerce Overview
• Green Monday Dynamics
• Key Holiday Themes for 2013
• Key Takeaways
• Q & A
© comScore, Inc. Proprietary. 3
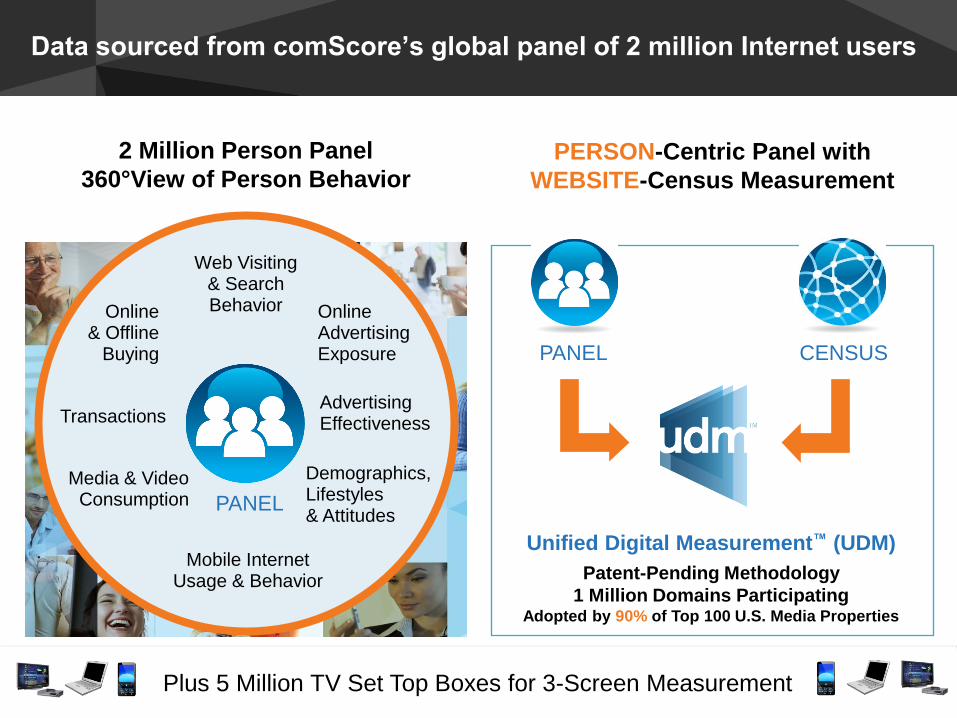
Data sourced from comScore’s global panel of 2 million Internet users
2 Million Person Panel
360°View of Person Behavior
CENSUS
Unified Digital Measurement™ (UDM)
Patent-Pending Methodology
1 Million Domains Participating Adopted by 90% of Top 100 U.S. Media Properties
PANEL
PERSON-Centric Panel with
WEBSITE-Census Measurement
Web Visiting & Search Behavior Online
Advertising Exposure
Advertising Effectiveness
Demographics, Lifestyles & Attitudes
Media & Video Consumption
Transactions
Online & Offline
Buying
Mobile Internet Usage & Behavior
PANEL
V0411 Plus 5 Million TV Set Top Boxes for 3-Screen Measurement
© comScore, Inc. Proprietary. 4
-20%
-10%
0%
10%
20%
30%
40%
50%
Q1'05
Q2'05
Q3'05
Q4'05
Q1'06
Q2'06
Q3'06
Q4'06
Q1'07
Q2'07
Q3'07
Q4'07
Q1'08
Q2'08
Q3'08
Q4'08
Q1'09
Q2'09
Q3'09
Q4'09
Q1'10
Q2'10
Q3'10
Q4'10
Q1'11
Q2'11
Q3'11
Q4'11
Q1'12
Q2'12
Q3'12
Q4'12
Q1'13
Q2'13
Q3'13
Validation of comScore sales data:
Comparison of comScore to U.S. Department of Commerce data
Quarterly U.S. e-Commerce Growth* vs. YA
Source: comScore & U.S. Department of Commerce (DOC)
% G
row
th v
s. Y
A
Dept. of Commerce (DOC) comScore Estimate of DOC
*Note: To be consistent with DOC, comScore estimate excludes travel and event
tickets but includes auction fees and autos.
Correlation: 0.92
© comScore, Inc. Proprietary. © comScore, Inc. Proprietary.
State of the Economy
A Review of Key Macroeconomic Trends
© comScore, Inc. Proprietary. 6
Desktop Retail e-Commerce has reached $148 B through Q3 2013, up
+14% Y/Y and setting up for a $200+ billion year
$42 $53 $67 $82 $102
$123 $130 $130 $142 $162
$186 $148
$30 $40
$51 $61
$69
$77 $84 $80
$85
$94
$103
$87
2002 2003 2004 2005 2006 2007 2008 2009 2010 2011 2012 2013(Q1-Q3)
Retail Travel
Desktop e-Commerce Dollar Sales ($ Billions) Source: comScore e-Commerce Measurement
$72 $93
$117
$143
$171
$200 $214 $209
$228
$289
$256 $235
Bil
lio
ns
($
)
+29%
+26%
+22%
+19%
+17%
+7%
-2%
+9%
+12%
+13%
+26%
+33%
+26%
+28%
+20%
+24% +24%
+13%
+20%
+12%
+6%
+9%
0%
-5%
+10%
+6%
+15%
+9%
+14%
+11%
+12%
+14%
+9%
© comScore, Inc. Proprietary. 7
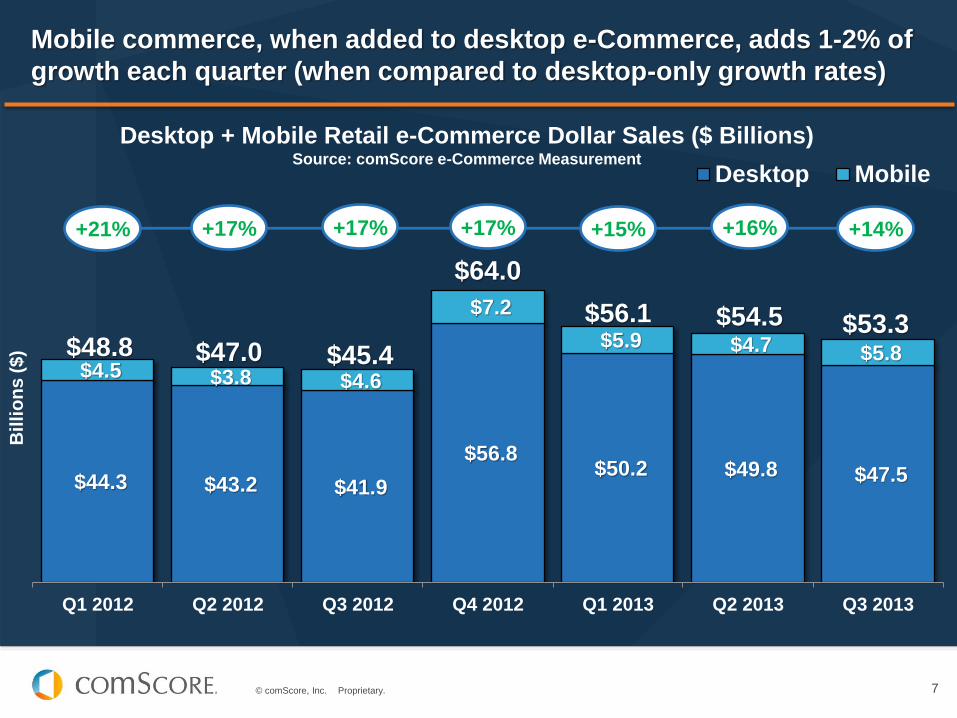
Mobile commerce, when added to desktop e-Commerce, adds 1-2% of
growth each quarter (when compared to desktop-only growth rates)
$44.3 $43.2 $41.9
$56.8 $50.2 $49.8 $47.5
$4.5 $3.8 $4.6
$7.2
$5.9 $4.7 $5.8
Q1 2012 Q2 2012 Q3 2012 Q4 2012 Q1 2013 Q2 2013 Q3 2013
Desktop Mobile
Desktop + Mobile Retail e-Commerce Dollar Sales ($ Billions) Source: comScore e-Commerce Measurement
Bil
lio
ns
($
)
$54.5 $53.3 $56.1
$64.0
$45.4 $47.0 $48.8
+21% +17% +17% +17% +15% +16% +14%
© comScore, Inc. Proprietary. 8
In Q3 2013, desktop e-Commerce accounted for 9.4% percent of
consumers’ discretionary spending, the highest third quarter share
on record
4.3%
3.7% 4.0%
4.6%
5.1%
4.3% 4.5%
5.3%
5.9%
5.0%
5.3%
6.4% 6.7%
5.9%
6.3%
7.4% 7.3%
6.5% 6.6%
7.6% 7.7%
6.8% 6.9%
7.7% 8.1%
7.1% 7.1%
8.0%
8.6%
7.7% 7.6%
8.9%
9.4%
8.7%
8.7%
10.0%
10.6%
9.6%
9.4%
0.0%
2.0%
4.0%
6.0%
8.0%
10.0%
12.0%
*Note: e-Commerce share is shown as a percent of DOC’s Total Retail Sales
excluding Food Service & Drinking, Food & Bev. Stores, Motor Vehicles & Parts,
Gasoline Stations and Health & Personal Care Stores.
Desktop e-Commerce Share of Corresponding Consumer Spending* Source: comScore for e-Commerce & U.S. Department of Commerce (DOC) for Retail
e-C
om
me
rce S
hare
e-Commerce share rose +0.7 points
versus Q3 2012
© comScore, Inc. Proprietary. 9
About 4 in 10 consumers still rate the economy as ‘poor’ -- a level that
has not improved in three quarters
77%
68% 66% 61% 61% 59% 62% 61%
52% 59% 60% 60%
54% 49%
56%
48% 42% 40% 40% 41%
Jan-09 Apr-09 Jul-09 Oct-09 Jan-10 Apr-10 Jul-10 Oct-10 Jan-11 Apr-11 Jul-11 Oct-11 Jan-12 Apr-12 Jul-12 Oct-12 Jan-13 Apr-13 Jul-13 Oct-13
Percent of Consumers Who View The Economy as Poor
Q.How would you rate economic conditions today? Source: comScore Surveys
© comScore, Inc. Proprietary. 10
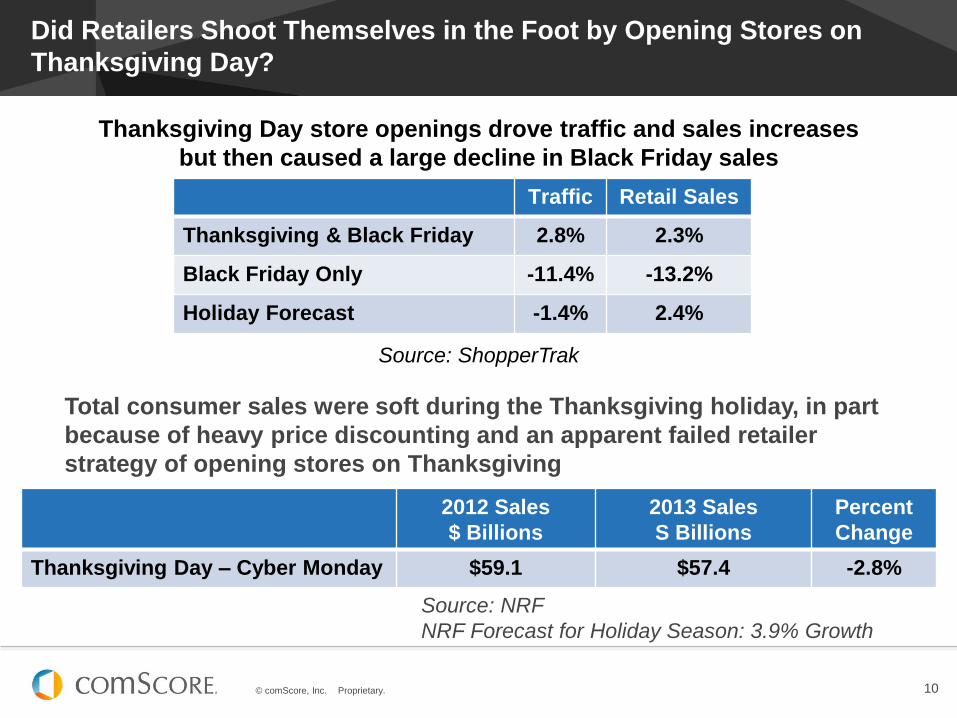
Did Retailers Shoot Themselves in the Foot by Opening Stores on
Thanksgiving Day?
Traffic Retail Sales
Thanksgiving & Black Friday 2.8% 2.3%
Black Friday Only -11.4% -13.2%
Holiday Forecast -1.4% 2.4%
Thanksgiving Day store openings drove traffic and sales increases
but then caused a large decline in Black Friday sales
Source: ShopperTrak
2012 Sales
$ Billions
2013 Sales
S Billions
Percent
Change
Thanksgiving Day – Cyber Monday $59.1 $57.4 -2.8%
Source: NRF
NRF Forecast for Holiday Season: 3.9% Growth
Total consumer sales were soft during the Thanksgiving holiday, in part
because of heavy price discounting and an apparent failed retailer
strategy of opening stores on Thanksgiving
© comScore, Inc. Proprietary.
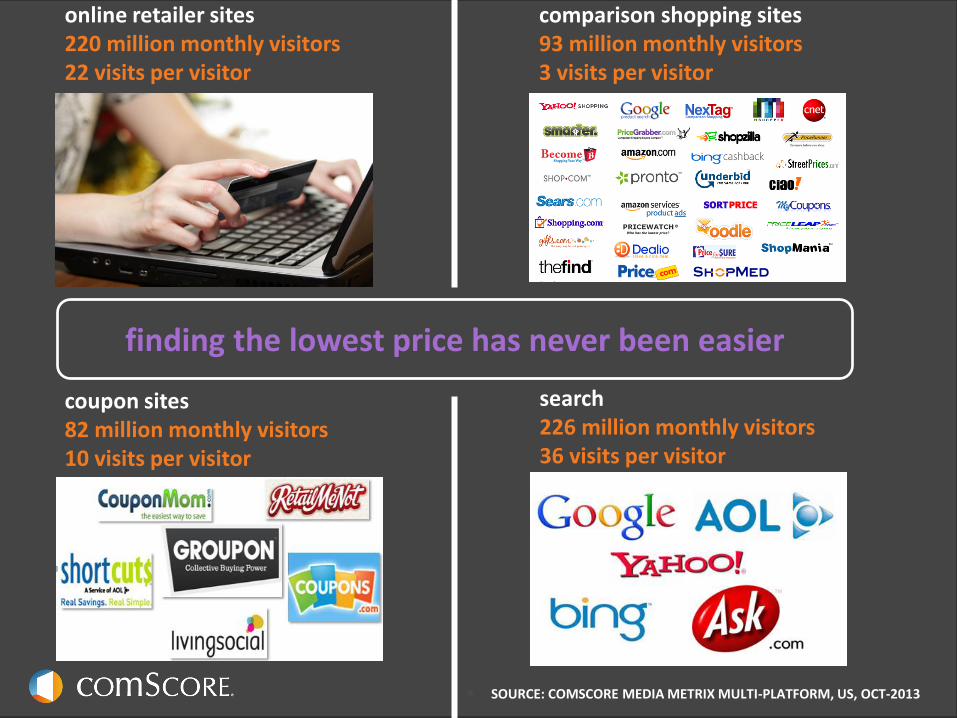
online retailer sites 220 million monthly visitors 22 visits per visitor
comparison shopping sites 93 million monthly visitors 3 visits per visitor
search 226 million monthly visitors 36 visits per visitor
SOURCE: COMSCORE MEDIA METRIX MULTI-PLATFORM, US, OCT-2013
coupon sites 82 million monthly visitors 10 visits per visitor
finding the lowest price has never been easier
© comScore, Inc. Proprietary. © comScore, Inc. Proprietary.
2013 Holiday e-Commerce Overview
© comScore, Inc. Proprietary. 13
Holiday Season includes November and December
* 2013 Forecast
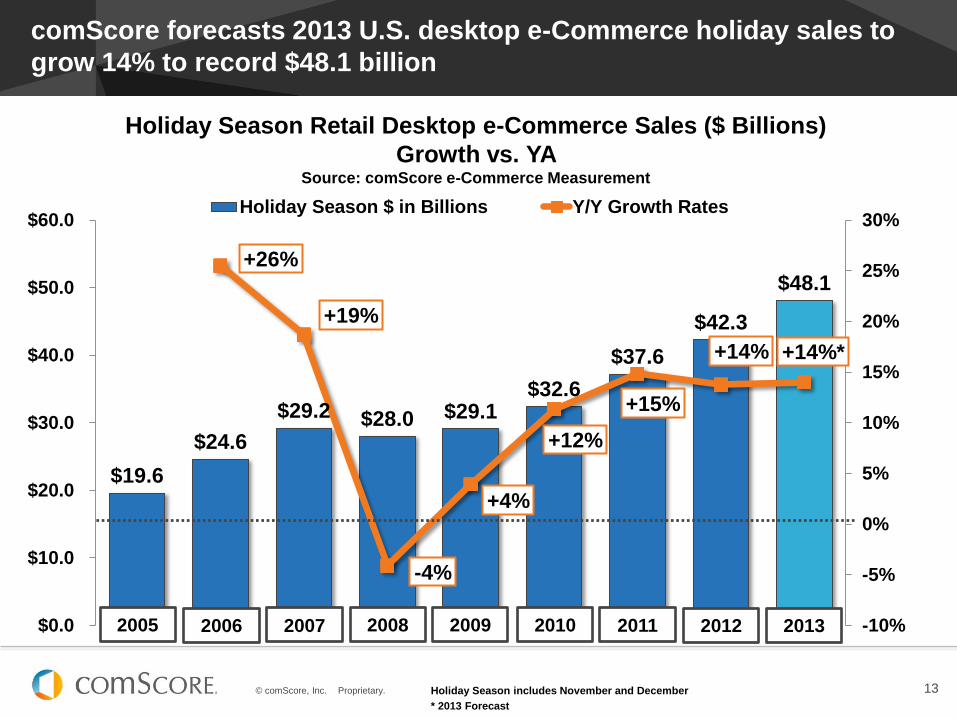
comScore forecasts 2013 U.S. desktop e-Commerce holiday sales to
grow 14% to record $48.1 billion
$19.6
$24.6
$29.2 $28.0 $29.1 $32.6
$37.6
$42.3
$48.1 +26%
+19%
-4%
+4%
+12%
+15%
+14% +14%*
$0.0
$10.0
$20.0
$30.0
$40.0
$50.0
$60.0
-10%
-5%
0%
5%
10%
15%
20%
25%
30%Holiday Season $ in Billions Y/Y Growth Rates
Holiday Season Retail Desktop e-Commerce Sales ($ Billions)
Growth vs. YA Source: comScore e-Commerce Measurement
2013 2012 2011 2010 2009 2008 2007 2006 2005
© comScore, Inc. Proprietary. 14
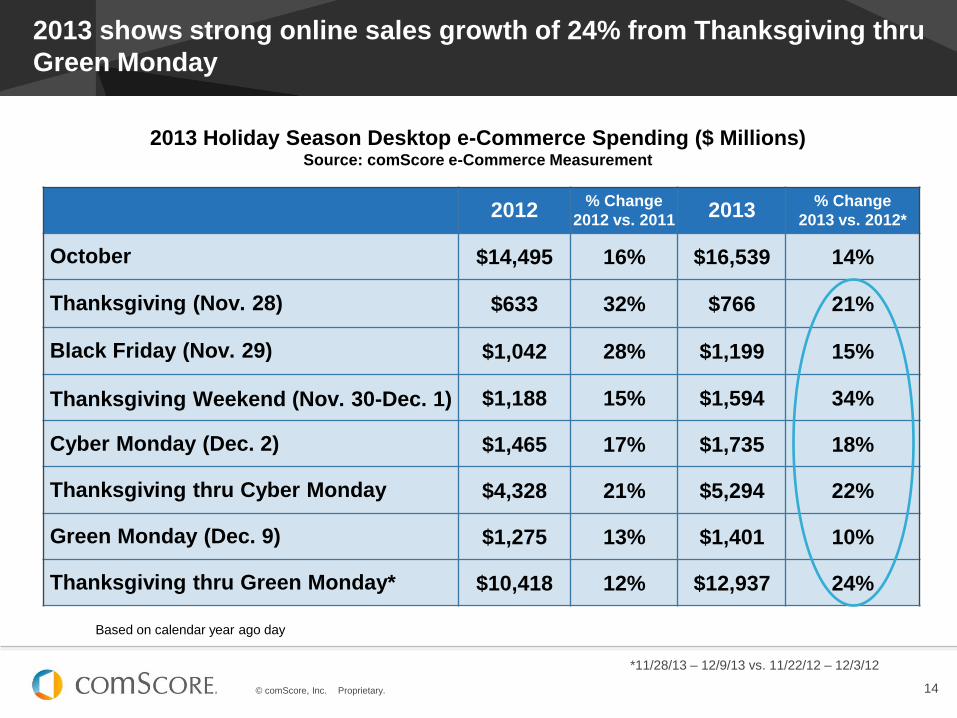
2012 % Change
2012 vs. 2011 2013
% Change
2013 vs. 2012*
October $14,495 16% $16,539 14%
Thanksgiving (Nov. 28) $633 32% $766 21%
Black Friday (Nov. 29) $1,042 28% $1,199 15%
Thanksgiving Weekend (Nov. 30-Dec. 1) $1,188 15% $1,594 34%
Cyber Monday (Dec. 2) $1,465 17% $1,735 18%
Thanksgiving thru Cyber Monday $4,328 21% $5,294 22%
Green Monday (Dec. 9) $1,275 13% $1,401 10%
Thanksgiving thru Green Monday* $10,418 12% $12,937 24%
2013 shows strong online sales growth of 24% from Thanksgiving thru
Green Monday
2013 Holiday Season Desktop e-Commerce Spending ($ Millions) Source: comScore e-Commerce Measurement
Based on calendar year ago day
*11/28/13 – 12/9/13 vs. 11/22/12 – 12/3/12
© comScore, Inc. Proprietary. 15
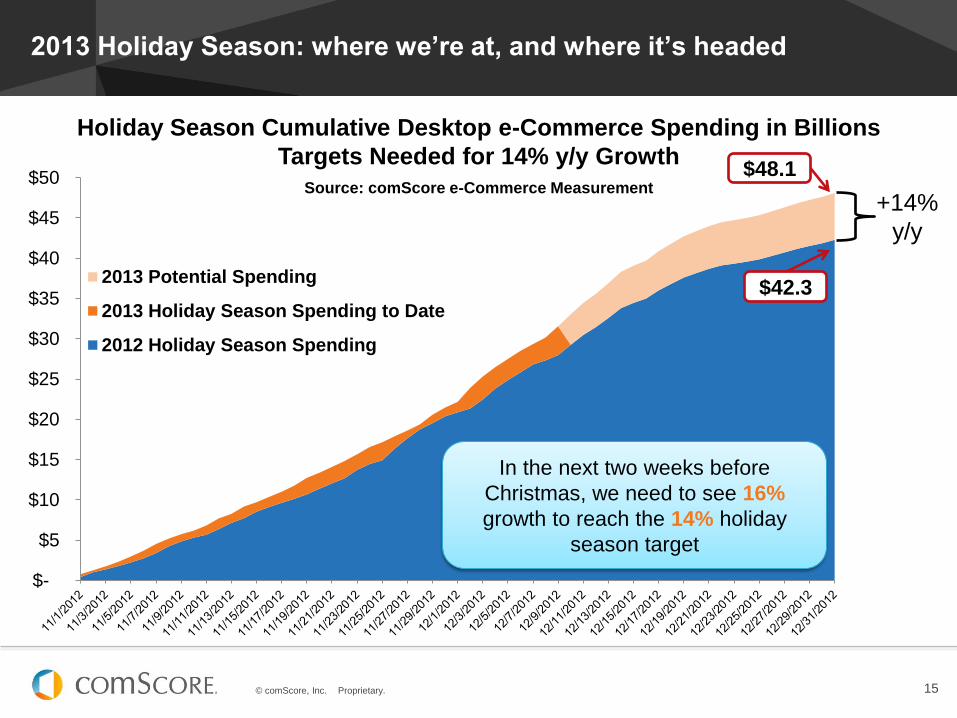
2013 Holiday Season: where we’re at, and where it’s headed
$-
$5
$10
$15
$20
$25
$30
$35
$40
$45
$50
Bil
lio
ns
2013 Potential Spending
2013 Holiday Season Spending to Date
2012 Holiday Season Spending
In the next two weeks before
Christmas, we need to see 16%
growth to reach the 14% holiday
season target
+14%
y/y
$48.1
$42.3
Holiday Season Cumulative Desktop e-Commerce Spending in Billions
Targets Needed for 14% y/y Growth
Source: comScore e-Commerce Measurement
© comScore, Inc. Proprietary. 16
Green Monday ranks #2 of the key online shopping days of 2013, but
overtime the season continues to be pulled forward
$776
$1,198
$1,735
$1,401
$-
$200
$400
$600
$800
$1,000
$1,200
$1,400
$1,600
$1,800
Thanksgiving Black Friday Cyber Monday Green Monday
2010 2011 2012 2013
+91%
+85%
+69%
+47%
Daily Retail Desktop E-Commerce Sales (Millions) Source: comScore e-Commerce Measurement
© comScore, Inc. Proprietary. 17
4 of 5 weekdays during Cyber Week hit $1B in 2013
$-
$200
$400
$600
$800
$1,000
$1,200
$1,400
$1,600
$1,800
2-N
ov-1
2
4-N
ov-1
2
6-N
ov-1
2
8-N
ov-1
2
10-N
ov-1
2
12-N
ov-1
2
14-N
ov-1
2
16-N
ov-1
2
18-N
ov-1
2
20-N
ov-1
2
22-N
ov-1
2
24-N
ov-1
2
26-N
ov-1
2
28-N
ov-1
2
30-N
ov-1
2
2-D
ec-1
2
4-D
ec-1
2
6-D
ec-1
2
8-D
ec-1
2
10-D
ec-1
2
Mill
ions
1-N
ov-1
3
3-N
ov-1
3
5-N
ov-1
3
7-N
ov-1
3
9-N
ov-1
3
11-N
ov-1
3
13-N
ov-1
3
15-N
ov-1
3
17-N
ov-1
3
19-N
ov-1
3
21-N
ov-1
3
23-N
ov-1
3
25-N
ov-1
3
27-N
ov-1
3
29-N
ov-1
3
1-D
ec-1
3
3-D
ec-1
3
5-D
ec-1
3
7-D
ec-1
3
9-D
ec-1
3
2012 2013
Desktop e-Commerce Spending by Day
2012 and 2013 Source: comScore e-Commerce Measurement
Black
Friday
Black
Friday
Cyber
Monday
Cyber
Monday Green
Monday
Green
Monday
© comScore, Inc. Proprietary. 18
With the compressed holiday season, people are relying more on
online shopping during the weekend than ever before
12%
34%
16%
71%
0%
10%
20%
30%
40%
50%
60%
70%
Thanksgiving Week M - F Thanksgiving weekend Cyber Week M - F Cyber weekend
Y/Y Growth of Desktop e-Commerce Transactions – Weekdays vs. Weekends
Source: comScore e-Commerce Measurement
© comScore, Inc. Proprietary. 19
The importance of free shipping can be clearly seen in 2013, with more
than 60% of transactions carrying free shipping each week.
52%
51%
56%
64%
59%
53%
59%
56% 56%
36%
42%
55% 57%
51%
53% 59%
54%
48%
61% 62% 62% 64%
60% 60%
30%
35%
40%
45%
50%
55%
60%
65%
70%
2011 2012 2013
Percentage of Desktop e-Commerce Transactions w/ Free Shipping
Source: comScore e-Commerce Measurement
© comScore, Inc. Proprietary. © comScore, Inc. Proprietary.
Green Monday Dynamics
© comScore, Inc. Proprietary. 21
Green Monday 2013 is the third heaviest online shopping day so far this
year, and has grown 64% since the recession
$556
$661
$881 $859 $854
$954
$1,133
$1,275
$1,401
2005 2006 2007 2008 2009 2010 2011 2012 2013
19%
33% -2% -1%
12%
19%
13%
10%
Green Monday U.S. Desktop e-Commerce Spending in Millions
Source: comScore e-Commerce Measurement
Y/Y % change
© comScore, Inc. Proprietary. 22
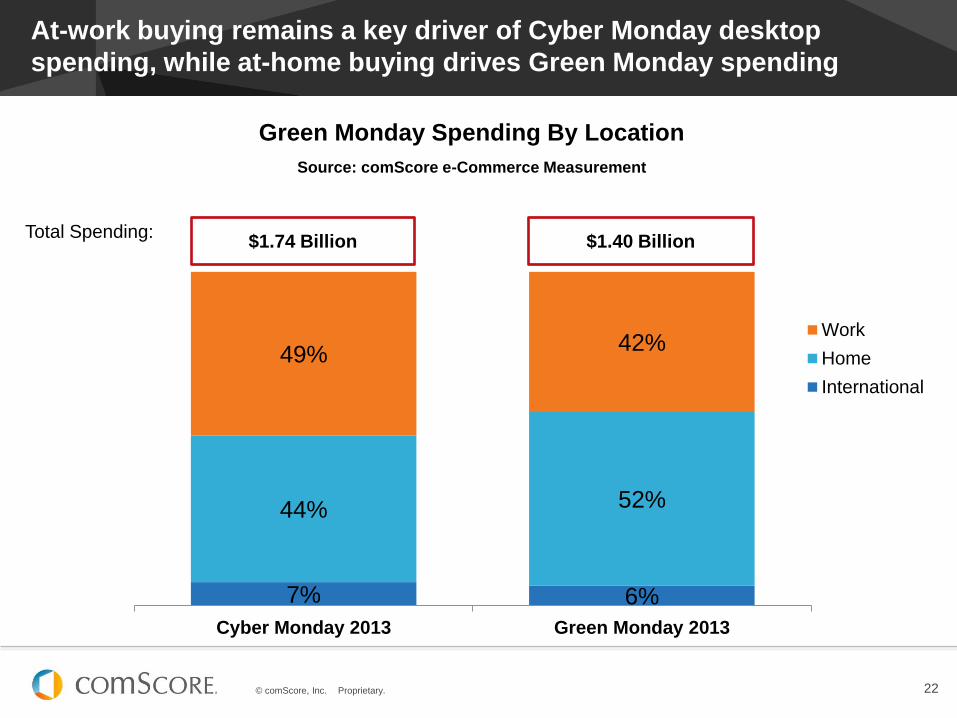
At-work buying remains a key driver of Cyber Monday desktop
spending, while at-home buying drives Green Monday spending
7% 6%
44% 52%
49% 42%
Cyber Monday 2013 Green Monday 2013
Work
Home
International
Green Monday Spending By Location
Source: comScore e-Commerce Measurement
Total Spending: $1.74 Billion $1.40 Billion
© comScore, Inc. Proprietary. 23
$0
$200
$400
$600
$800
$1,000
$1,200
$1,400
$1,600
$1,800
$2,000
2005 2006 2007 2008 2009 2010 2011 2012 2013
+5%
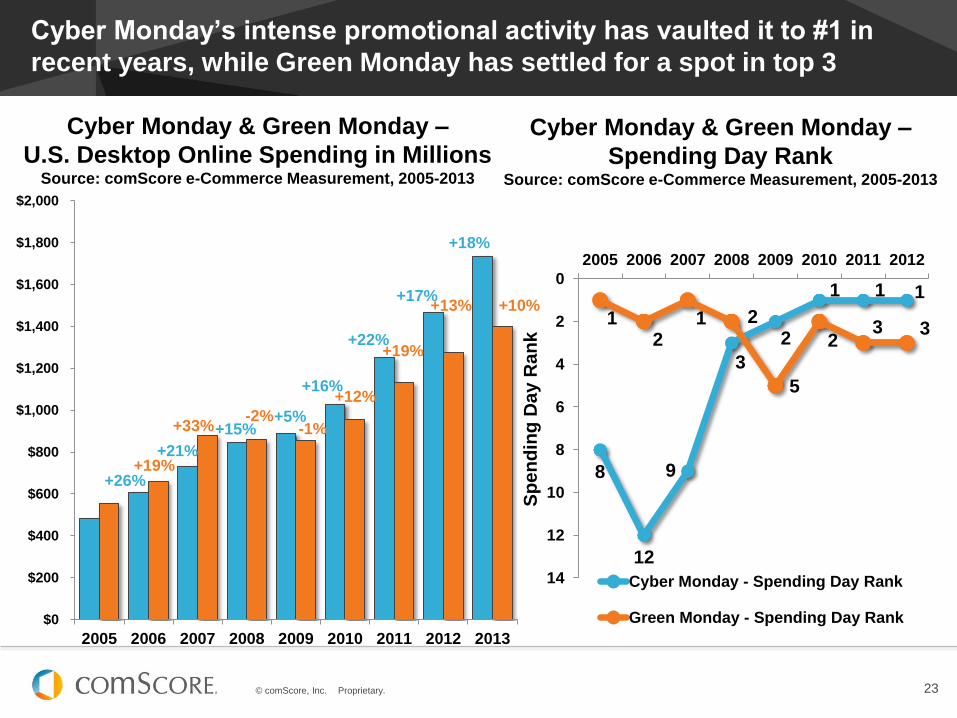
Cyber Monday’s intense promotional activity has vaulted it to #1 in
recent years, while Green Monday has settled for a spot in top 3
8
12
9
3
2
1 1 1
1 2
1 2
5
2 3 3
0
2
4
6
8
10
12
14
2005 2006 2007 2008 2009 2010 2011 2012
Sp
en
din
g D
ay R
an
k
Cyber Monday - Spending Day Rank
Green Monday - Spending Day Rank
Cyber Monday & Green Monday –
U.S. Desktop Online Spending in Millions Source: comScore e-Commerce Measurement, 2005-2013
Cyber Monday & Green Monday –
Spending Day Rank Source: comScore e-Commerce Measurement, 2005-2013
+12%
-1% -2%
+33%
+19%
+19%
+13%
+16%
+15%
+21%
+26%
+22%
+17%
+18%
+10%
© comScore, Inc. Proprietary. 24
Metric 2012* 2013* % change
Dollar Sales ($ MM) $10,418 $12,937 24%
Dollars per Buyer $163.93 $150.58 -8%
Buyers (000) 63,550 85,912 35%
Average Order Value $94.64 $85.05 -10%
Transactions (000) 110,071 152,110 38%
Transactions per Buyer 1.73 1.77 2%
Key Desktop e-Commerce Buyer and Transaction Measures
Thanksgiving thru Green Monday 2013 vs. YA Source: comScore e-Commerce Measurement
Sales growth between Thanksgiving and Green Monday driven by more buyers
buying more often. AOV drop caused by consumers shop across more retailers.
*e-Commerce Sales based on data for
Thanksgiving thru Green Monday,
11/28/13 – 12/9/13 vs. 11/22/12 – 12/3/12
© comScore, Inc. Proprietary. 25
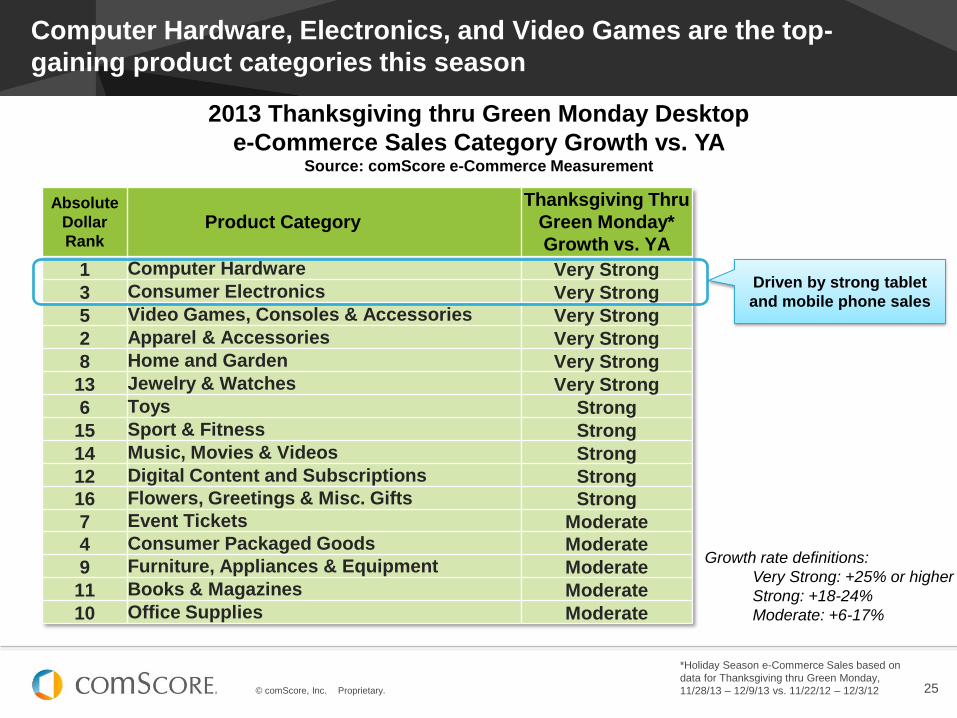
Computer Hardware, Electronics, and Video Games are the top-
gaining product categories this season
2013 Thanksgiving thru Green Monday Desktop
e-Commerce Sales Category Growth vs. YA Source: comScore e-Commerce Measurement
Absolute
Dollar
Rank Product Category
Thanksgiving Thru
Green Monday*
Growth vs. YA
1 Computer Hardware Very Strong
3 Consumer Electronics Very Strong
5 Video Games, Consoles & Accessories Very Strong
2 Apparel & Accessories Very Strong
8 Home and Garden Very Strong
13 Jewelry & Watches Very Strong
6 Toys Strong
15 Sport & Fitness Strong
14 Music, Movies & Videos Strong
12 Digital Content and Subscriptions Strong
16 Flowers, Greetings & Misc. Gifts Strong
7 Event Tickets Moderate
4 Consumer Packaged Goods Moderate
9 Furniture, Appliances & Equipment Moderate
11 Books & Magazines Moderate
10 Office Supplies Moderate
Growth rate definitions:
Very Strong: +25% or higher
Strong: +18-24%
Moderate: +6-17%
*Holiday Season e-Commerce Sales based on
data for Thanksgiving thru Green Monday,
11/28/13 – 12/9/13 vs. 11/22/12 – 12/3/12
Driven by strong tablet
and mobile phone sales
© comScore, Inc. Proprietary. 26
Amazon, Netflix, and eBay were the most visited sites on Green
Monday 2013
Top Retail Category Sites by Number of Desktop Visits between Thanksgiving and Green Monday 2013
Ranking Retailer Property
1 Amazon
2 Netflix
3 eBay
4 Apple
5 Walmart
6 Target
7 Macy’s
8 Kohl’s
9 Best Buy
10 ToysRUs
11 Sears
12 J.C. Penney
13 Home Depot
14 Hewlett-Packard
15 GameStop
16 Liberty Interactive Corporation
17 Limited Brands
18 Newegg
19 Kmart
20 Dell
Source: comScore Custom Solutions
New sites to the
top 20 in 2013
© comScore, Inc. Proprietary. 27
Coupon sites are some of the most visited retail-related sites between
Thanksgiving and Green Monday
Ranking Coupon Property
1 Shopathome.com
2 MyPoints Sites
3 Groupon
4 RetailMeNot
5 Swagbucks.com
6 Coupons Inc.
7 We-care.com
8 Ebates.com
9 LivingSocial
10 Topcouponstoday.com
Top Coupon Category Sites by Number of Desktop Visits between Thanksgiving
and Green Monday 2013 Source: comScore e-Commerce Measurement
© comScore, Inc. Proprietary. 28
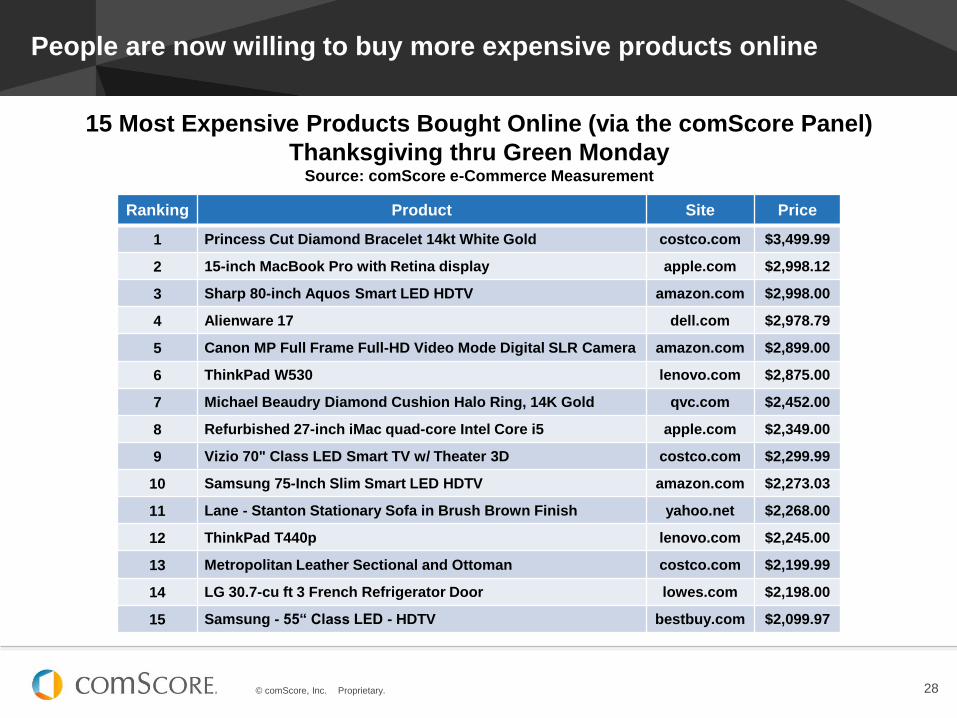
People are now willing to buy more expensive products online
15 Most Expensive Products Bought Online (via the comScore Panel)
Thanksgiving thru Green Monday Source: comScore e-Commerce Measurement
Ranking Product Site Price
1 Princess Cut Diamond Bracelet 14kt White Gold costco.com $3,499.99
2 15-inch MacBook Pro with Retina display apple.com $2,998.12
3 Sharp 80-inch Aquos Smart LED HDTV amazon.com $2,998.00
4 Alienware 17 dell.com $2,978.79
5 Canon MP Full Frame Full-HD Video Mode Digital SLR Camera amazon.com $2,899.00
6 ThinkPad W530 lenovo.com $2,875.00
7 Michael Beaudry Diamond Cushion Halo Ring, 14K Gold qvc.com $2,452.00
8 Refurbished 27-inch iMac quad-core Intel Core i5 apple.com $2,349.00
9 Vizio 70" Class LED Smart TV w/ Theater 3D costco.com $2,299.99
10 Samsung 75-Inch Slim Smart LED HDTV amazon.com $2,273.03
11 Lane - Stanton Stationary Sofa in Brush Brown Finish yahoo.net $2,268.00
12 ThinkPad T440p lenovo.com $2,245.00
13 Metropolitan Leather Sectional and Ottoman costco.com $2,199.99
14 LG 30.7-cu ft 3 French Refrigerator Door lowes.com $2,198.00
15 Samsung - 55“ Class LED - HDTV bestbuy.com $2,099.97
© comScore, Inc. Proprietary. 29
Amazon Prime Air: Did CBS’s coverage give Amazon a Cyber Monday
and season boost?
© comScore, Inc. Proprietary. 30
Pure plays gain share on Cyber Monday and Green Monday—
helped by Amazon?
26% 35%
48% 49%
74% 65%
52% 51%
Thanksgiving Black Friday CyberMonday
GreenMonday
2012 2013
Percent Share of Desktop e-Commerce
Pure Play and Multi-Channel Retailers Source: comScore e-Commerce Measurement
29% 35% 47% 47%
71% 65% 53% 53%
Thanksgiving Black Friday CyberMonday
GreenMonday
Multi-Channel
Pure Play
© comScore, Inc. Proprietary. © comScore, Inc. Proprietary.
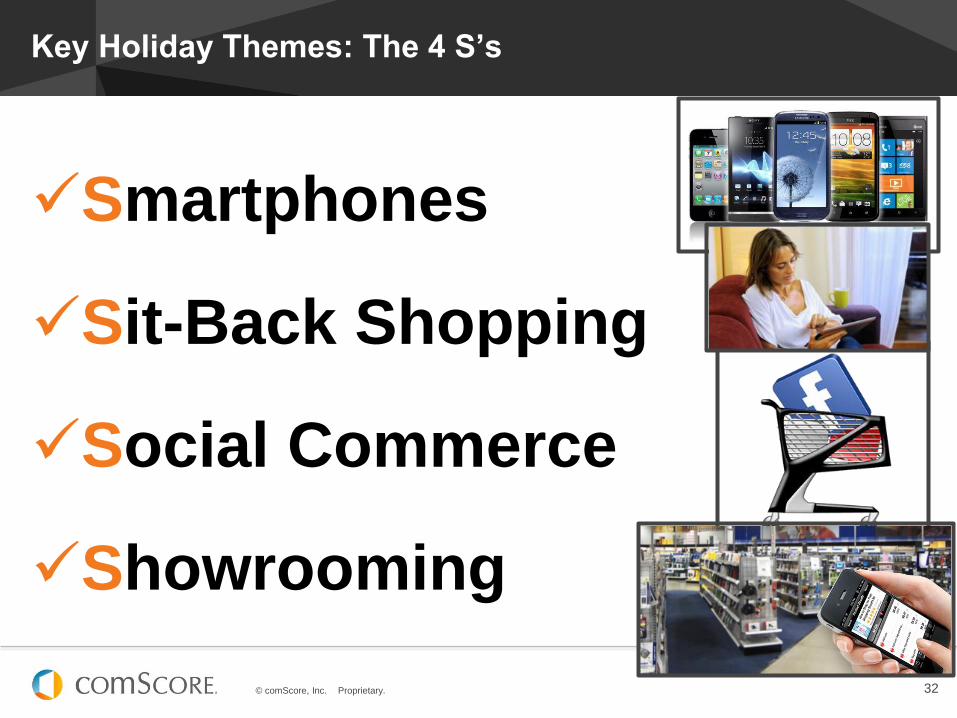
Key 2013 Holiday Themes: The 4 S’s
© comScore, Inc. Proprietary. 32
Key Holiday Themes: The 4 S’s
Smartphones
Sit-Back Shopping
Social Commerce
Showrooming
© comScore, Inc. Proprietary. 33
As of August 2013, the digital population spends more time engaging
with Retail brands on their smartphone than on their desktop
0
5,000
10,000
15,000
20,000
To
tal M
inu
tes (
MM
)
Desktop Smartphone iPad
Total Minutes (MM) Spent in Retail Category by Platform Source: comScore Media Metrix and Mobile Metrix, U.S., Feb-2013 – Oct-2013
49% 42%
37% 43%
14% 15%
0%
10%
20%
30%
40%
50%
60%
70%
80%
90%
100%
Feb-2013 Oct-2013
DesktopSmartphoneiPad
Average Retail Site:
Mobile Only Unique Visitors
Incremental 34%
© comScore, Inc. Proprietary. 34
Retail e-Commerce Dollars Spent in Billions via Mobile (Smartphone & Tablet) Source: comScore E-commerce & M-commerce Measurement
At $5.8 Billion in Q3 2013, m-Commerce accounted for 11% of all
Retail e-Commerce – up vs. year ago, setting up for a strong Q4
$0.6 $0.8
$1.6
$2.4 $2.6
$3.5
$4.9 $4.5
$3.8
$4.6
$7.2
$5.9
$4.7
$5.8
$10.0
Q22010
Q32010
Q42010
Q12011
Q22011
Q32011
Q42011
Q12012
Q22012
Q32012
Q42012
Q12013
Q22013
Q32013
Q42013
Can we hit $10 billion
in Q4?
?
© comScore, Inc. Proprietary. 35
$0
$500
$1,000
$1,500
$2,000
Black Friday (Nov. 29) Cyber Monday (Dec. 2)
Mobile
Desktop
M-Commerce contributed an incremental 20% of dollars spent on
Cyber Monday, making it the first single day to break $2 Billion
$1,512
$2,085
21%
Mobile
17%
Mobile
Multi-Platform Retail e-Commerce Dollars Spent in Millions Source: comScore E-commerce & M-commerce Measurement
© comScore, Inc. Proprietary. 36
Pinterest is gaining influence as a social commerce
channel, and usage is rapidly shifting to mobile
0
5,000
10,000
15,000
20,000
25,000
30,000
35,000
Desktop Mobile
Pinterest Total Unique Visitors (000) by Platform Source: comScore Media Metrix and Mobile Metrix, U.S., Jul-2012 – Oct 2013
© comScore, Inc. Proprietary. 37
For most consumers, showrooming remains an ‘occasional’
shopping tactic
More than 1 in 3 online
consumers have
showroomed…
However, among these
consumers, most only
showroom ‘sometimes’ or
‘occasionally’
Among smartphone
owners, usage of phones to
showroom has increased
significantly
11%
76%
11%
Only for majorpurchases
Sometimes /Occasionally
Often
34%
% who have ever showroomed
Q. Based on this definition, have you ever done this activity? (seen
an item in-store but instead purchased online)
Q. When thinking of your online shopping and the previous
questions, which statement best describes when you use
showrooming?
% among showroomers
Source: comScore Survey – July 2013
Q. Have you ever used your mobile device (smartphone / tablet) to
assist in showrooming?
41%
49%
% smartphone owners who have used theirphone to showroom
Q2 2013 Q3 2013
© comScore, Inc. Proprietary. © comScore, Inc. Proprietary.
Key Takeaways
© comScore, Inc. Proprietary. 39
Key Takeaways
• comScore’s 2013 Holiday Forecast of +14% growth (16% including mobile)
is on target
• The shortened Thanksgiving - Christmas calendar presents a challenge, but thus far daily
spending growth has been strong enough to compensate
• Cyber Monday is once again the heaviest online spending day in history
with a record $1.74 B in desktop spending
• Including m-Commerce, Cyber Monday topped $2 billion
• Record spending day could have been even higher had early promotions not pulled spending
forward to the weekend
• Amazon once again led the pack on Cyber Monday, and appeared to get an additional boost
from cleverly previewing Prime Air on 60 Minutes
• Online spending during the period between Thanksgiving and Green
Monday has been strong
• Thanksgiving Day opening of retail stores appears to have backfired, and may have led to
increased online sales
• Exceptionally strong growth in weekend online sales growth suggests consumers are using
weekend buying to compensate for the shorter holiday season
• Showrooming may also be a factor in driving sales out of brick-and-mortar and into online,
particularly with the dynamics seen on the weekend this year
© comScore, Inc. Proprietary.
www.comscore.com
www.facebook.com/comscoreinc
@comScore
Please contact Irena Simakova ([email protected])
if you have any additional questions or comments.
Questions?


![Conversion Rate Optimization for Holiday Season E-Commerce [Infographic]](https://static.documents.pub/doc/80x56/5474a1cdb4af9fae0a8b577d/conversion-rate-optimization-for-holiday-season-e-commerce-infographic.jpg)


