Date post: | 17-Feb-2017 |
Category: |
Documents |
Upload: | dave-landreth |
View: | 156 times |
Download: | 0 times |
For info about the proprietary technology used in comScore products, refer to http://comscore.com/About_comScore/Patents
2015 Holiday Commerce Trends Through Green Monday Dec.14 December 18, 2015
Gian Fulgoni Co-Founder & Chairman Emeritus, comScore, Inc.
Andrew Lipsman
VP Marketing & Insights, comScore, Inc.
© comScore, Inc. Proprietary. 2
By Q3 2015, Total Digital Commerce had grown to account for about 1 in every 7 discretionary dollars spent by consumers
*Note: e-Commerce share is shown as a percent of DOC’s Total Retail Sales excluding Food Service & Drinking, Food & Bev. Stores, Motor Vehicles & Parts, Gasoline Stations and Health & Personal Care Stores.
Desktop & Mobile Digital Commerce Share of Corresponding Consumer Spending*
0%
1%
2%
3%
4%
5%
6%
7%
8%
9%
10%
11%
12%
13%
14%
15%
16%
Digital Commerce Share (desktop + mobile)
e-Commerce Share (desktop)
11.6% (Q3 ‘14)
11.0% Q3 ‘15
13.1% Q3 ‘15 Digital’s share of consumer spending peaks in Q1 and Q4
Q1 ‘15 saw a 14.7% share, the highest ever
10.3% (Q3 ‘14)
Source: comScore e-Commerce / m-Commerce & U.S. Department of Commerce (DOC) for Retail
© comScore, Inc. Proprietary. 3
2015 HOLIDAY SEASON FORECAST FOR TOTAL COMMERCE Offline (ShopperTrak) + Online (comScore)
* ShopperTrak ** comScore
***estimates
85.0%
15.0%
12.6%
2.4%
2.5%*
14.3%**
9.4%**
47.2%**
2.1%
2.2 %
1.2%
1.1%
Brick and Mortar
Total Digital
Desktop
Mobile
% of Total Consumer Discretionary***
Growth Forecast
Growth Points
+4.3%
NRF:
forecast 3.7% growth
Boston Consulting Group:
forecast 4.5% growth
© comScore, Inc. Proprietary. 4
$-
$500
$1,000
$1,500
$2,000
$2,500
01-N
ov-1
5
02-N
ov-1
5
03-N
ov-1
5
04-N
ov-1
5
05-N
ov-1
5
06-N
ov-1
5
07-N
ov-1
5
08-N
ov-1
5
09-N
ov-1
5
10-N
ov-1
5
11-N
ov-1
5
12-N
ov-1
5
13-N
ov-1
5
14-N
ov-1
5
15-N
ov-1
5
16-N
ov-1
5
17-N
ov-1
5
18-N
ov-1
5
19-N
ov-1
5
20-N
ov-1
5
21-N
ov-1
5
22-N
ov-1
5
23-N
ov-1
5
24-N
ov-1
5
25-N
ov-1
5
26-N
ov-1
5
27-N
ov-1
5
28-N
ov-1
5
29-N
ov-1
5
30-N
ov-1
5
01-D
ec-1
5
02-D
ec-1
5
03-D
ec-1
5
04-D
ec-1
5
05-D
ec-1
5
06-D
ec-1
5
07-D
ec-1
5
08-D
ec-1
5
09-D
ec-1
5
10-D
ec-1
5
11-D
ec-1
5
12-D
ec-1
5
13-D
ec-1
5
14-D
ec-1
5
Mill
ions
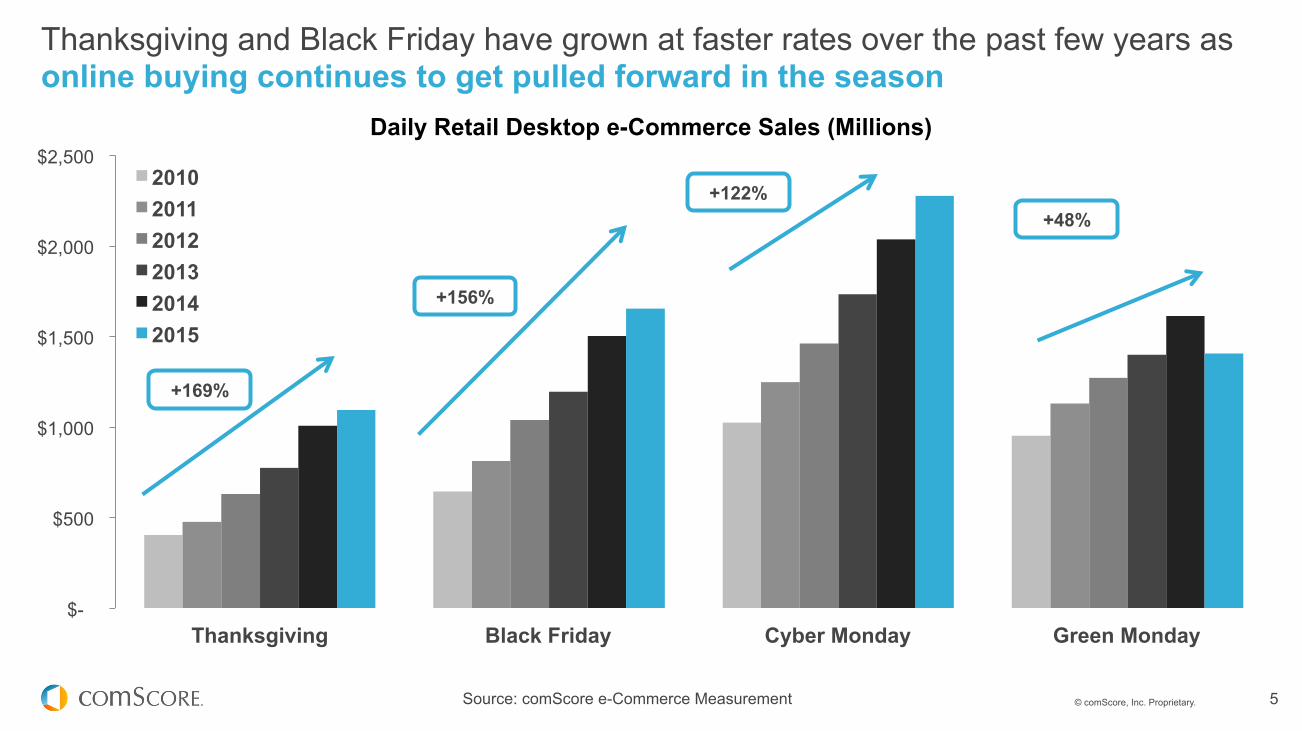
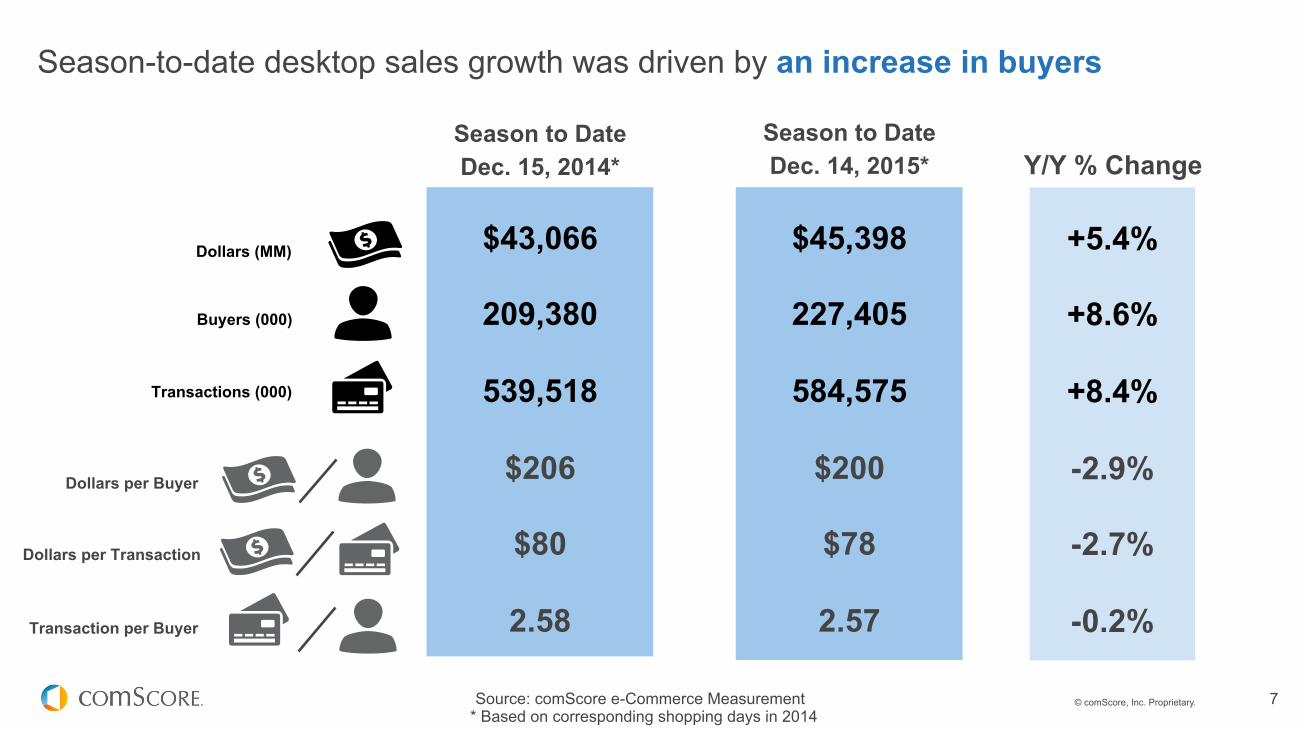
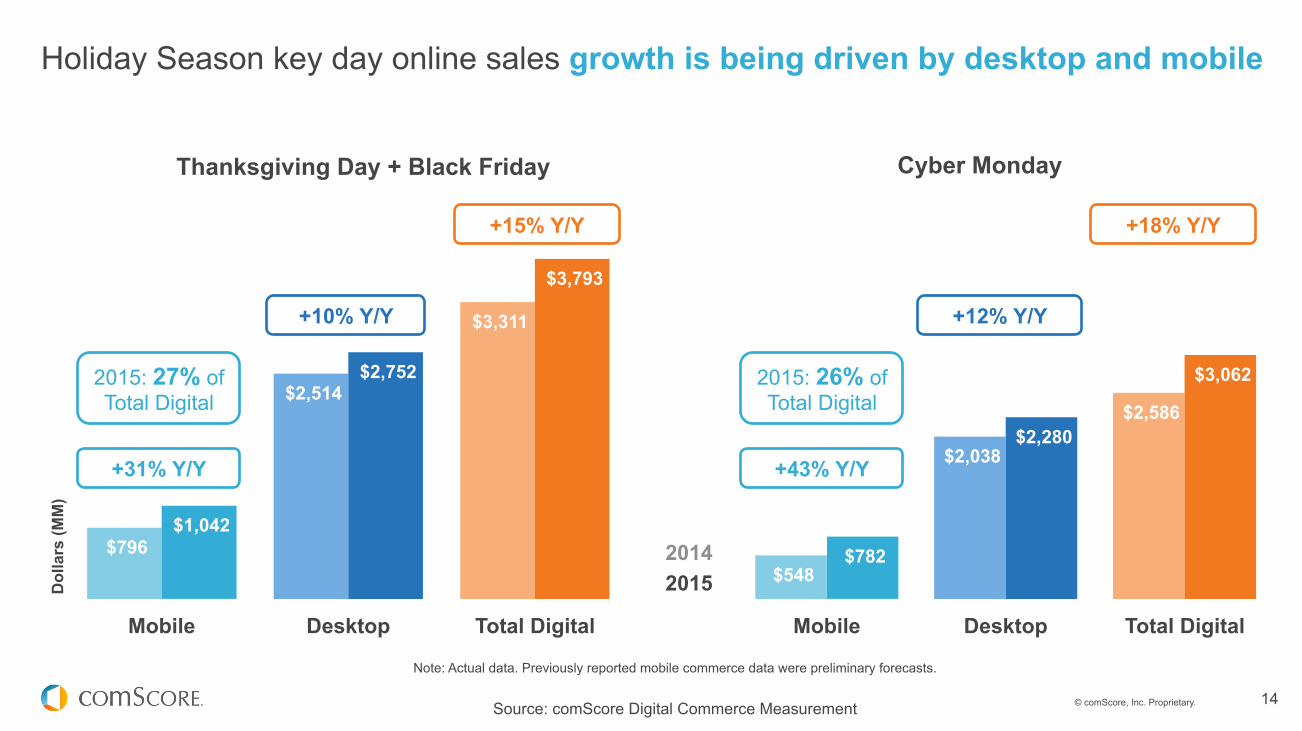
Every weekday since Thanksgiving has exceeded $1 Billion in online spend; Cyber Monday became the highest desktop spending day ever at $2.3B, +11.9% Y/Y
Holiday 2015 U.S. Desktop e-Commerce Spending by Day
Black Friday
Thanksgiving
Source: comScore e-Commerce Measurement
Cyber Monday
Green Monday
© comScore, Inc. Proprietary. 5
$-
$500
$1,000
$1,500
$2,000
$2,500
Thanksgiving Black Friday Cyber Monday Green Monday
2010 2011 2012 2013 2014 2015
+169%
+156%
+122% +48%
Thanksgiving and Black Friday have grown at faster rates over the past few years as online buying continues to get pulled forward in the season
Daily Retail Desktop e-Commerce Sales (Millions)
Source: comScore e-Commerce Measurement
© comScore, Inc. Proprietary. 6
$-
$10
$20
$30
$40
$50
$60
11/1
11
/2
11/3
11
/4
11/5
11
/6
11/7
11
/8
11/9
11
/10
11/1
1 11
/12
11/1
3 11
/14
11/1
5 11
/16
11/1
7 11
/18
11/1
9 11
/20
11/2
1 11
/22
11/2
3 11
/24
11/2
5 11
/26
11/2
7 11
/28
11/2
9 11
/30
12/1
12
/2
12/3
12
/4
12/5
12
/6
12/7
12
/8
12/9
12
/10
12/1
1 12
/12
12/1
3 12
/14
12/1
5 12
/16
12/1
7 12
/18
12/1
9 12
/20
12/2
1 12
/22
12/2
3 12
/24
12/2
5 12
/26
12/2
7 12
/28
12/2
9 12
/30
12/3
1 Bill
ions
2015 Forecast Spending 2015 Holiday Season Spending to Date 2014 Holiday Season Spending
Source: comScore e-Commerce Measurement
2015 Holiday Season: desktop spend may come in slightly short of our estimate, but mobile will likely make up the difference
Holiday Season Cumulative Desktop e-Commerce Spending in Billions Targets Needed for Forecasted 9% y/y Growth
+9% Y/
Y
$58.3B
$53.3B
Currently at +5.4% y/y based on comparable shopping days
© comScore, Inc. Proprietary. 7
Season-to-date desktop sales growth was driven by an increase in buyers
$43,066
209,380
539,518
$206
$80
2.58
$45,398
227,405
584,575
$200
$78
2.57
Source: comScore e-Commerce Measurement
+5.4%
+8.6%
+8.4%
-2.9%
-2.7%
-0.2%
Season to Date Dec. 15, 2014*
Season to Date Dec. 14, 2015* Y/Y % Change
Dollars (MM)
Buyers (000)
Transactions (000)
Dollars per Buyer
Dollars per Transaction
Transaction per Buyer
* Based on corresponding shopping days in 2014
© comScore, Inc. Proprietary. 8
35%
40%
45%
50%
55%
60%
65%
70%
75%
2-Nov-15 9-Nov-15 16-Nov-15 23-Nov-15 30-Nov-15 7-Dec-15 14-Dec-15 21-Dec-15 28-Dec-15
2014
2013
2012
2015
* Based on corresponding shopping days in 2014
Source: comScore e-Commerce Measurement
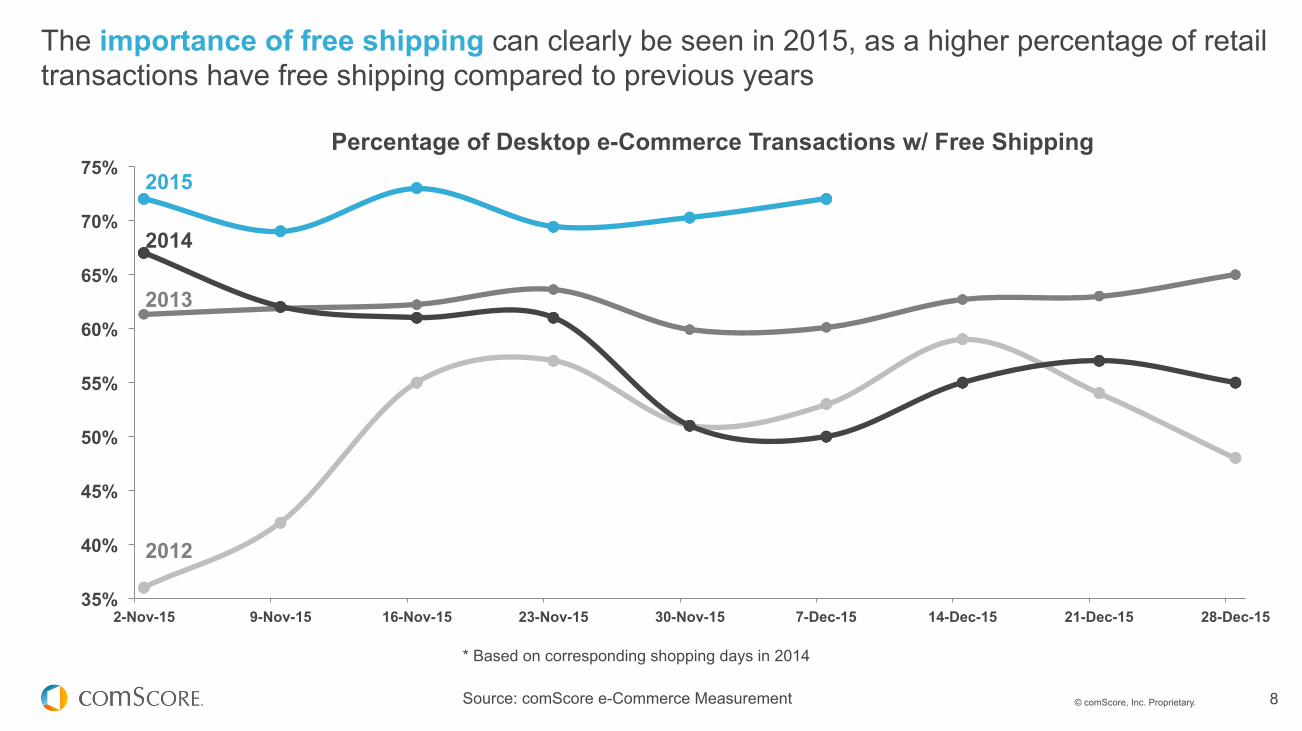
The importance of free shipping can clearly be seen in 2015, as a higher percentage of retail transactions have free shipping compared to previous years
Percentage of Desktop e-Commerce Transactions w/ Free Shipping
© comScore, Inc. Proprietary. 9 Source: comScore e-Commerce Measurement
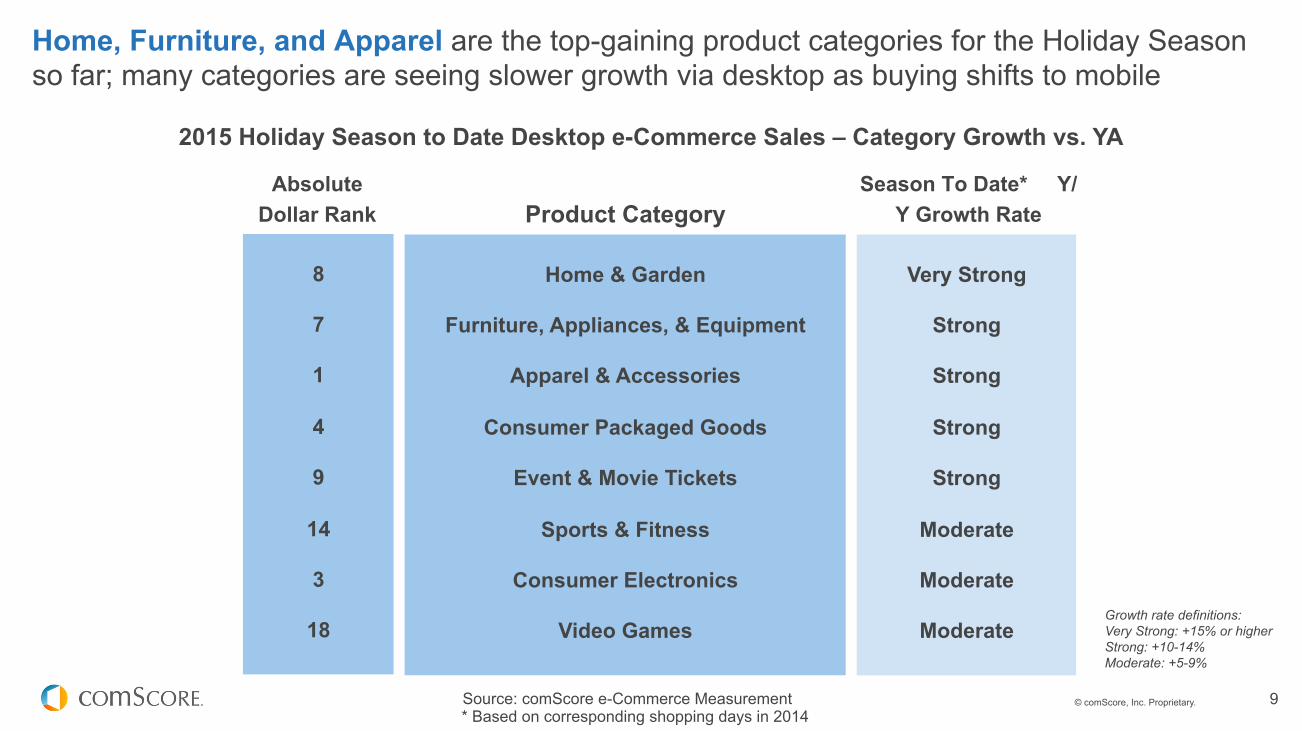
Home, Furniture, and Apparel are the top-gaining product categories for the Holiday Season so far; many categories are seeing slower growth via desktop as buying shifts to mobile
8
7
1
4
9
14
3
18
Home & Garden
Furniture, Appliances, & Equipment
Apparel & Accessories
Consumer Packaged Goods
Event & Movie Tickets
Sports & Fitness
Consumer Electronics
Video Games
Very Strong
Strong
Strong
Strong
Strong
Moderate
Moderate
Moderate Growth rate definitions: Very Strong: +15% or higher Strong: +10-14% Moderate: +5-9%
2015 Holiday Season to Date Desktop e-Commerce Sales – Category Growth vs. YA
Absolute Dollar Rank Product Category
Season To Date* Y/Y Growth Rate
* Based on corresponding shopping days in 2014
© comScore, Inc. Proprietary. 10
TOP RETAILER MULTI-PLATFORM VISITS – 2015 HOLIDAY SEASON TO DATE
1 6 11 16
Source: comScore Custom Solutions
5 10 15 20
2 7 12 17
3
4 9 14 19
8 13 18
Apple Sites
© comScore, Inc. Proprietary. 11
During the holiday season to date*, online retail visits using mobile devices have surged, with mobile browser visits exceeding app visits
MULTI-PLATFORM
20.9B
+34% Y/Y DESKTOP
7.8B
+5% Y/Y
MOBILE
13.1B
+62% Y/Y
MOBILE BROWSER
7.2B
+46% Y/Y
MOBILE APP
5.9B
+88% Y/Y
* Based on corresponding shopping days in 2014
Source: comScore Custom Solutions
© comScore, Inc. Proprietary. 12
0% 2% 9% 0% 6% 7% 11% 4%
54% 52%
40% 36%
58%
80%
64% 60%
Thanksgiving Black Friday
Cyber Monday
Green Monday
Thanksgiving Black Friday
Cyber Monday
Green Monday
Desktop Mobile
High mobile retail visitation growth rates on key holiday shopping days could indicate a strong mobile commerce holiday season
Source: comScore Custom Solutions
Retail Category Visitation by Platform
Visits – Y/Y Growth Unique Visitors – Y/Y Growth
* Based on Corresponding Shopping Days in 2014
© comScore, Inc. Proprietary. 13
-
100
200
300
400
500
600
700
800 11
/1/2
015
11/2
/201
5
11/3
/201
5
11/4
/201
5
11/5
/201
5
11/6
/201
5
11/7
/201
5
11/8
/201
5
11/9
/201
5
11/1
0/20
1
11/1
1/20
1
11/1
2/20
1
11/1
3/20
1
11/1
4/20
1
11/1
5/20
1
11/1
6/20
1
11/1
7/20
1
11/1
8/20
1
11/1
9/20
1
11/2
0/20
1
11/2
1/20
1
11/2
2/20
1
11/2
3/20
1
11/2
4/20
1
11/2
5/20
1
11/2
6/20
1
11/2
7/20
1
11/2
8/20
1
11/2
9/20
1
11/3
0/20
1
12/1
/201
5
12/2
/201
5
12/3
/201
5
12/4
/201
5
12/5
/201
5
12/6
/201
5
12/7
/201
5
12/8
/201
5
12/9
/201
5
12/1
0/20
1
12/1
1/20
1
12/1
2/20
1
12/1
3/20
1
12/1
4/20
1
Mill
ions
Mobile retail site visits spiked on Black Friday, while desktop visits peaked on Cyber Monday
Retail Category Visits by Platform
Mobile
Desktop
Multi-Platform
Black Friday
Cyber Monday
Source: comScore Custom Solutions
Green Monday
© comScore, Inc. Proprietary. 14
$548
$2,038
$2,586
$782
$2,280
$3,062
Mobile Desktop Total Digital
$796
$2,514
$3,311
$1,042
$2,752
$3,793
Mobile Desktop Total Digital
2014 2015
+31% Y/Y
+10% Y/Y
+15% Y/Y
Holiday Season key day online sales growth is being driven by desktop and mobile
Thanksgiving Day + Black Friday
+43% Y/Y
+12% Y/Y
+18% Y/Y
Cyber Monday
2015: 27% of Total Digital
2015: 26% of Total Digital
Note: Actual data. Previously reported mobile commerce data were preliminary forecasts.
Source: comScore Digital Commerce Measurement
Dol
lars
(MM
)
© comScore, Inc. Proprietary. 15
KEY TAKEAWAYS
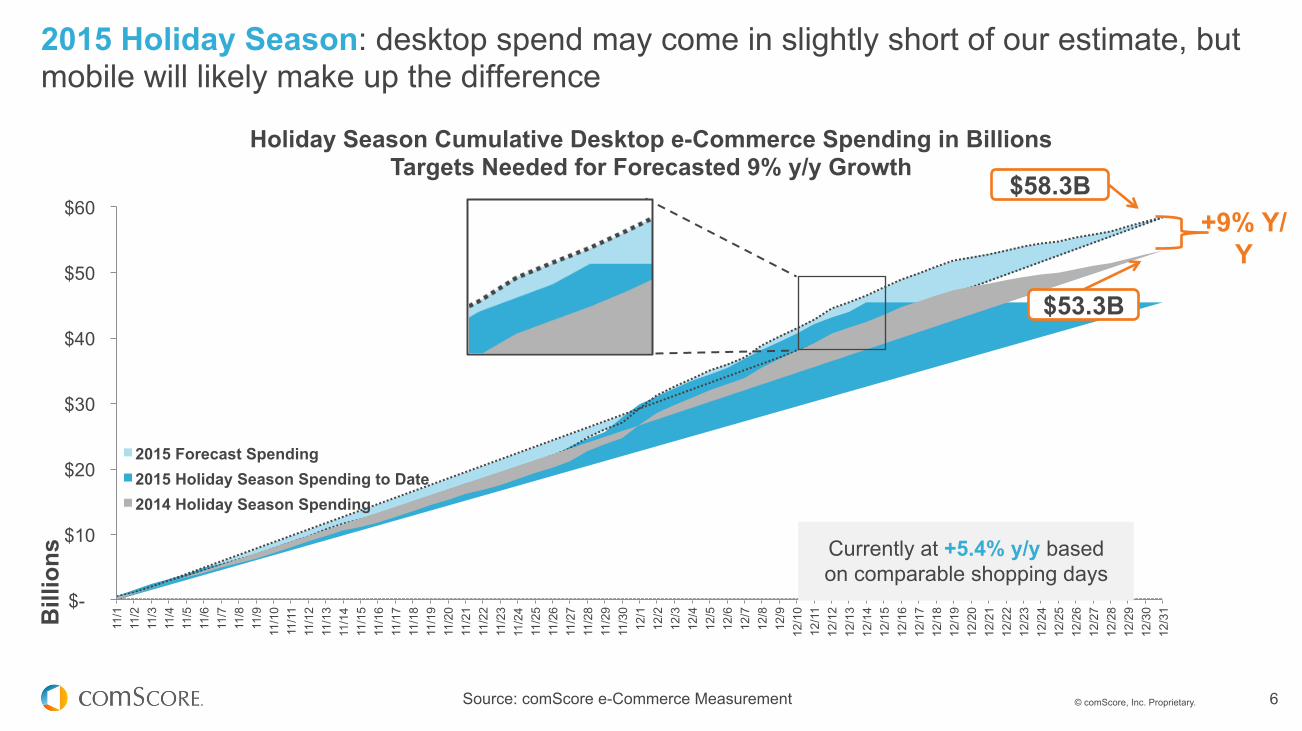
Desktop sales were light so far this season (+5%), but 1 extra day vs. YA and the strength of Green Week will likely push us closer to forecast Mobile is having a larger share of digital dollars than expected this season, but mobile is more important to shopping than buying
1 comScore Forecast Holiday 2015: $70 B +14% Total Digital $ +9% Desktop $ +47% Mobile $
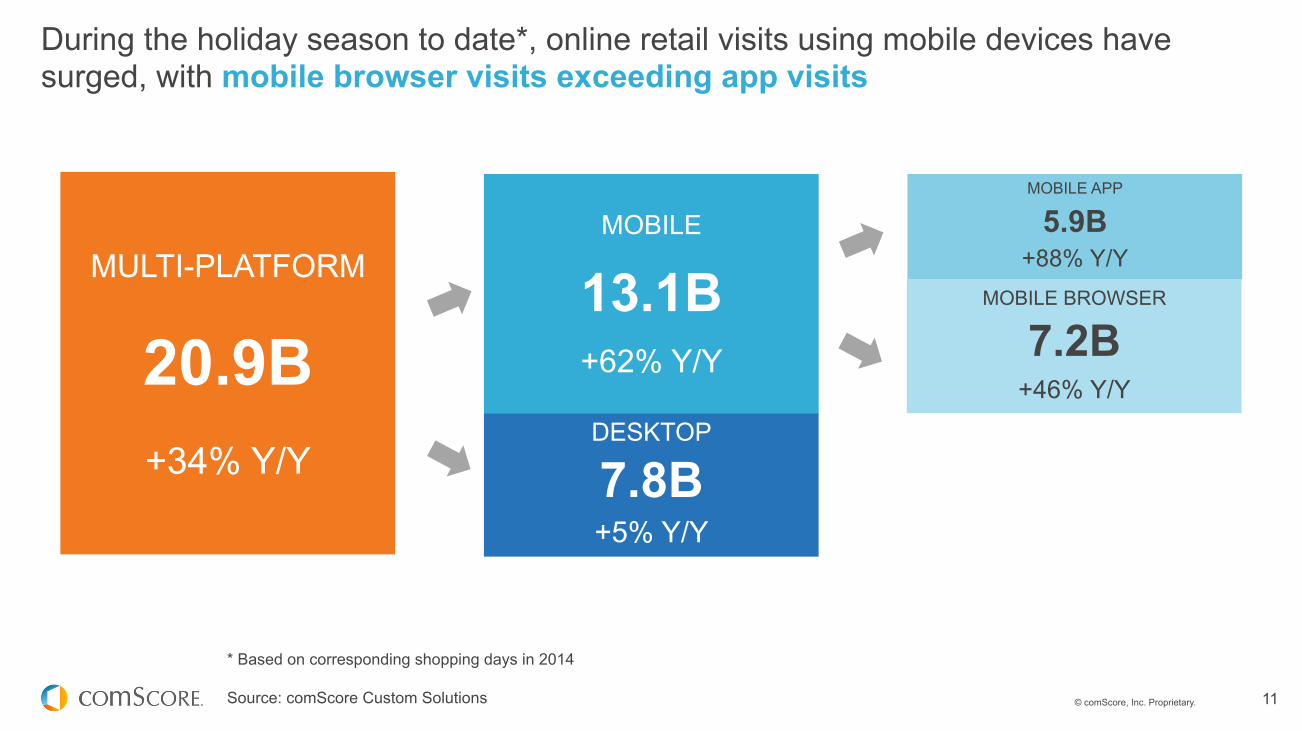
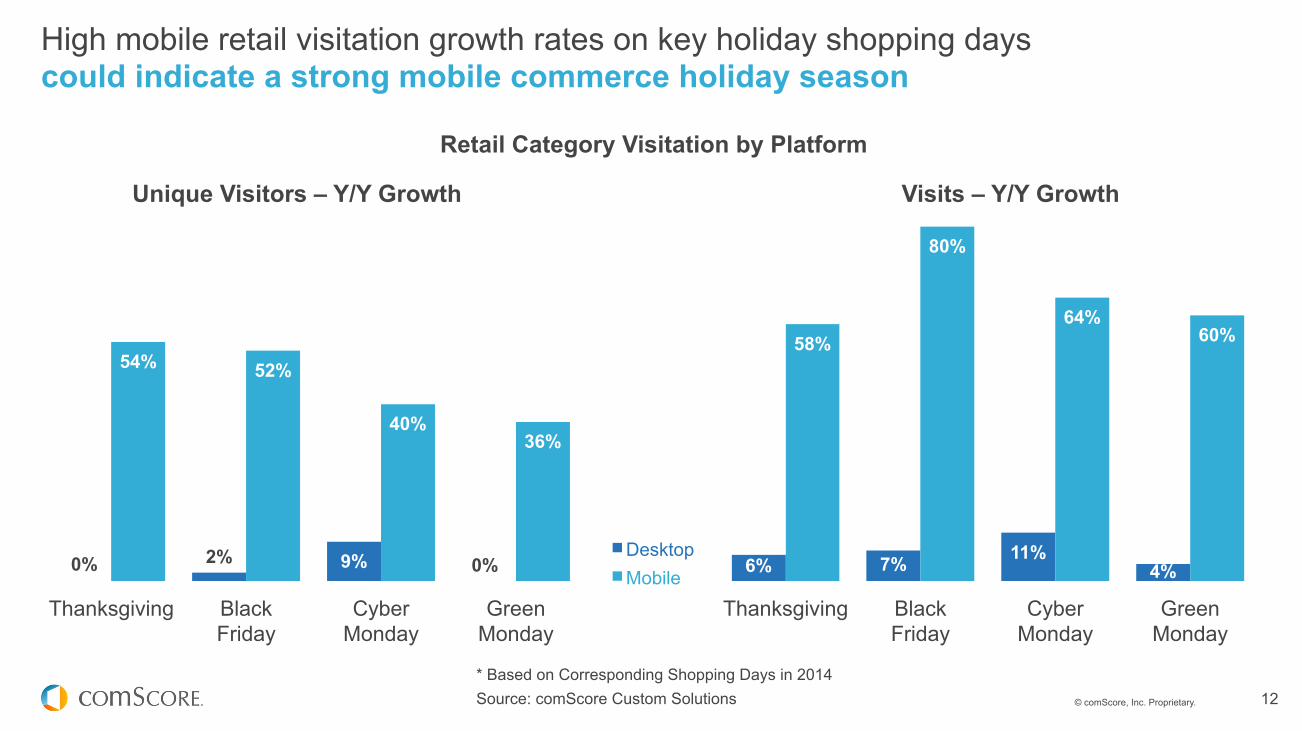
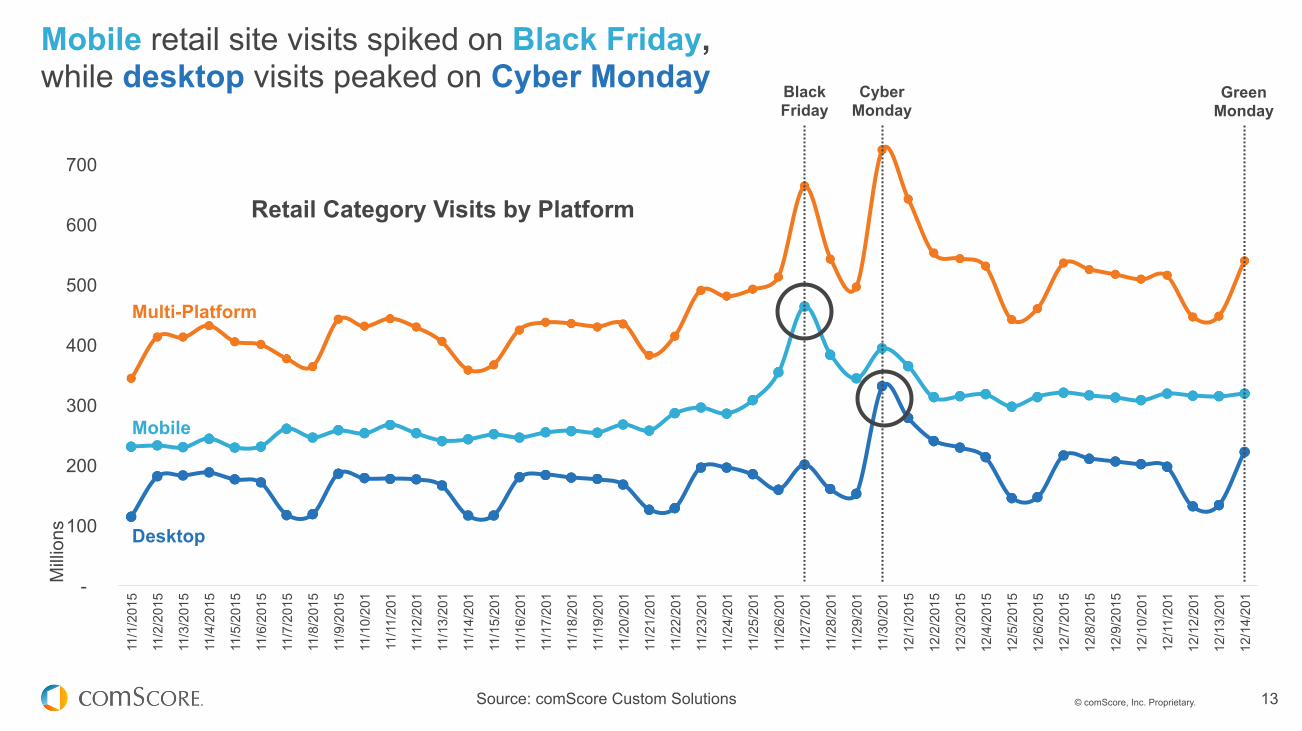
M-Commerce sales were up strongly Y/Y on TG, Black Fri. and Cyber Mon., accounting for nearly 30% of digital commerce sales Mobile retail visits peaked on Black Friday, while desktop visitation remains largely significant on Cyber Monday
2 TG through Cyber Monday online sales exhibited strength, while offline sales declined -10% Y/Y
Free shipping day on Friday this week will promote desktop sales growth as we approach Christmas week With the surge of online traffic and buying this holiday season, it is essential for retailers to make sure their sites and apps can keep up
3 Green Monday kicked off a week that’s likely going to bolster desktop growth rates for the season
For info about the proprietary technology used in comScore products, refer to http://comscore.com/About_comScore/Patents
www.comscore.com @comScore www.linkedin.com/company/comscore www.facebook.com/comscoreinc
Questions?
Please contact:
Irena Simakova, Vice President of Investment Research at comScore
© comScore, Inc. Proprietary. 17
Amazon Sites
Wal-Mart
eBay
Apple.com Worldwide Sites
Target Corporation
Best Buy Sites
The Home Depot, Inc.
ETSY.COM
Kohls Corporation
Macy's Inc.
Browser Only Browser + App App Only
Beginning in August 2015, eBay no longer included traffic from PayPal’s media property. This change resulted in a significant decline in eBay’s unique visitors, which does not reflect the performance of eBay’s branded sites/apps.
A significant percentage of top retailers’ audiences are accessing via mobile browser, while the majority of mobile time spent is via retailers’ apps
Selected Leading Retailers: U.S. Total Mobile Unique Visitors – Browser vs. App
137M 72M
68M 55M
52M 37M
23M 23M 21M 17M
28%
39%
23%
99%
35%
86%
66%
26%
42%
45%
72%
61%
77%
<1%
65%
14%
34%
74%
58%
55%
Browser App
% of Time Spent Browser vs. App
Apple Sites
Source: comScore Mobile Metrix, U.S., November 2015