147
2014 CALIFORNIA GAS REPORT Prepared by the California Gas and Electric Utilities
2014 CALIFORNIA GAS REPORT
Prepared by the California Gas and Electric Utilities

2 0 1 4 C A L I F O R N I A G A S R E P O R T
PREPARED BY THE CALIFORNIA GAS AND ELECTRIC UTILITIES
Southern California Gas Company Pacific Gas and Electric Company
San Diego Gas & Electric Company Southwest Gas Corporation
City of Long Beach Gas & Oil Department Southern California Edison Company


TABLE OF CONTENTS
i
TABLE OF CONTENTS
Page No. FOREWORD ........................................................................................................ 1 EXECUTIVE SUMMARY......................................................................................... 3 Demand Outlook ............................................................................................. 4 Focus on Efficiency and Environmental Quality........................................... 6 Future Gas System Impacts Resulting From Increased Renewable
Generation, and Localized or Distributed Generation Resources ......... 8 Natural Gas Projects: Proposals, Completions, and Liquefied
Natural Gas .............................................................................................. 10 Supply Outlook/Pipeline Capacity ........................................................ 10 Storage Capacity ................................................................................. 10 Liquefied Natural Gas (LNG) ............................................................... 13
Statewide Consolidated Summary Tables .................................................. 14 Statewide Recorded Sources and Disposition ........................................... 25 Statewide Recorded Highest Sendout ......................................................... 31 NORTHERN CALIFORNIA .................................................................................... 32 Introduction ................................................................................................... 33 Gas Demand .................................................................................................. 34
Overview ............................................................................................. 34 Forecast Method ................................................................................. 35 Forecast Scenarios.............................................................................. 35
Temperature Assumptions ....................................................... 35 Hydro Conditions ..................................................................... 36 Gas Price and Rate Assumptions ............................................ 36
Market Sectors .................................................................................... 36 Residential ............................................................................... 36 Commercial .............................................................................. 37 Industrial .................................................................................. 37 Electric Generation .................................................................. 37 SMUD Electric Generation ....................................................... 38
Greenhouse Gas Legislation/AB32 .............................................................. 38 Renewable Electric Generation .................................................................... 38 Energy Efficiency Programs ........................................................................ 39 Gas Supply, Capacity, and Storage ............................................................. 40
Overview ............................................................................................. 40 Gas Supply .......................................................................................... 40
California-Sourced Gas ............................................................ 40 U.S. Southwest Gas ................................................................. 40 Canadian Gas .......................................................................... 40 Rocky Mountain Gas ................................................................ 41 Storage .................................................................................... 41
Interstate Pipeline Capacity ................................................................. 41 U.S. Southwest and Rocky Mountains ..................................... 41 Canada and Rocky Mountains ................................................. 41
TABLE OF CONTENTS
ii
Gas Supplies and Infrastructure Projects........................................ 41 LNG Imports/Exports ............................................................... 42 Rocky Mountains ..................................................................... 42 North American Supply Development ...................................... 43
Gas Storage ....................................................................................... 43 Regulatory Environment ................................................................... 44
State Regulatory Matters ......................................................... 44 Gas Quality .................................................................. 44 Pipeline Safety ............................................................. 44 Core Gas Aggregation Program ................................... 44
Federal Regulatory Matters ...................................................... 45 Ruby Pipeline ............................................................... 45 El Paso ......................................................................... 45 Kern River .................................................................... 45 Transwestern ............................................................... 45 Gas Transmission Northwest ........................................ 45 FERC Notice of Inquiry Regarding Integration of
Variable Energy Resources (Docket RM10-11) ........ 46 FERC Gas-Electric Coordination Actions (AD12-12 &
EL14-22) .................................................................. 46 Other Regulatory Matters ......................................................... 47
Hydraulic Fracturing ..................................................... 47 Gas Exports ................................................................. 47 Greenhouse Gas (GHG) Reporting and
Cap-and-Trade Obligations ...................................... 48 Abnormal Peak Day Demand and Supply ........................................ 49
APD Demand Forecast ............................................................ 49 APD Supply Requirement Forecast ......................................... 49
NORTHERN CALIFORNIA TABULAR DATA ........................................................... 52 SOUTHERN CALIFORNIA GAS COMPANY ............................................................ 58
Introduction ....................................................................................... 59 The Southern California Environment ............................................. 60
Economics and Demographics ................................................. 60 Gas Demand (Requirements) ........................................................... 62
Overview .................................................................................. 62 Market Sensitivity ..................................................................... 63
Temperature ................................................................. 63 Hydro Condition ............................................................ 63
Market Sectors ......................................................................... 64 Residential ................................................................... 64 Commercial .................................................................. 65 Industrial........................................................................ 66
Non-Refinery Industrial Demand ....................... 66 Refinery Industrial Demand ............................... 68
Electric Generation .......................................................... 69 Industrial/Commercial/Cogeneration <20 MW ... 70 Industrial/Commercial Cogeneration >20 MW .... 70 Refinery-Related Cogeneration ......................... 70 Enhanced Oil Recovery-Related Cogeneration .... 71

TABLE OF CONTENTS
iii
Non-Cogeneration Electric Generation................. 71 Enhanced Oil Recovery – Steam .................................. 72 Wholesale and International ......................................... 72
San Diego Gas & Electric.................................. 72 City of Long Beach ........................................... 72 Southwest Gas ................................................. 73 City of Vernon ................................................... 73 Ecogas Mexico, S. de R.L. de C.V. (Ecogas) .... 73
Natural Gas Vehicles (NGV) ......................................... 73 Energy Efficiency Programs ..................................................... 73
Gas Supply, Capacity and Storage .................................................. 76 Gas Supply Sources ................................................................ 76 California Gas .......................................................................... 76 Southwestern U.S. Gas............................................................ 76 Rocky Mountain Gas ................................................................ 76 Canadian Gas .......................................................................... 77 Biogas ...................................................................................... 77 Interstate Pipeline Capacity ..................................................... 78 Firm Receipt Capacity .............................................................. 78 Storage .................................................................................... 79
Regulatory Environment ................................................................... 81 State Regulatory Matters ......................................................... 81
Triennial Cost Allocation Proceeding (TCAP) ............... 81 Pipeline Safety ......................................................................... 81 Southern Gas System Reliability Project .................................. 82 Federal Regulatory Matters ...................................................... 82
El Paso ......................................................................... 82 Kern River .................................................................... 83 Transwestern ............................................................... 83 Gas Transmission Northwest (GTN) ............................. 83 Coordination Between Gas and Electric Markets .......... 83
Greenhouse Gas Issues .................................................................... 83 National Policy ......................................................................... 83 Restriction on New Conventional Coal Generation ................... 84 Motor Vehicle Emissions Reductions ....................................... 84 California Policy ....................................................................... 84 Global Warning Solutions Act of 2006 ...................................... 84 Low Carbon Fuel Standard ...................................................... 84 Cap and Trade Program .......................................................... 85 Programmatic Emission Reduction Measures .......................... 85
Gas Price Forecast ............................................................................ 87 Market Condition ...................................................................... 87 Development of the Forecast ................................................... 87
Peak Day Demand and Deliverability ............................................... 89
SOUTHERN CALIFORNIA GAS COMPANY TABULAR DATA .................................... 91 CITY OF LONG BEACH MUNICIPAL GAS AND OIL DEPARTMENT ........................... 97 CITY OF LONG BEACH MUNICIPAL GAS AND OIL DEPARTMENT TABULAR DATA ... 99
TABLE OF CONTENTS
iv
SAN DIEGO GAS & ELECTRIC COMPANY ........................................................... 106
Introduction ..................................................................................... 107 Gas Demand .................................................................................... 108
Overview ................................................................................ 108 Economics and Demographics .................................................. 108 Market Sectors ....................................................................... 109
Residential ................................................................. 109 Commercial ................................................................ 110 Industrial..................................................................... 111 Electric Generation ..................................................... 111
Cogeneration .................................................. 112 Non-Cogeneration Electric Generation............ 112
Natural Gas Vehicles (NGV) ....................................... 113 Energy Efficiency Programs .......................................... 113
Gas Supply....................................................................................... 115 Peak Day Demand ........................................................................... 116
SAN DIEGO GAS & ELECTRIC COMPANY TABULAR DATA ................................. 117 GLOSSARY ..................................................................................................... 124 RESPONDENTS ............................................................................................... 133 RESERVE YOUR SUBSCRIPTION ....................................................................... 135
TABLE OF CONTENTS
v
LIST OF CHARTS AND TABLES
Page No. EXECUTIVE SUMMARY
California Gas Demand Outlook ............................................................ 5 Impact of Renewable Generation and Energy Efficiency Programs
on Gas Demand .............................................................................. 7 Western North American Natural Gas Pipelines ................................... 12 Potential and Proposed North American West Coast LNG Terminals .. 13 Statewide Total Supply Sources and Requirements
(Avg. & Normal) .................................................................... 15 & 16 Statewide Total Supply Sources-Taken (Avg. & Normal) ..................... 17 Statewide Annual Gas Requirements (Avg & Normal) ................. 18 & 19 Statewide Total Supply Sources and Requirements
(Cold & Dry) ........................................................................ 20 & 21 Statewide Total Supply Sources-Taken (Cold & Dry) ........................... 22 Statewide Annual Gas Requirements (Cold & Dry) ..................... 23 & 24 Recorded 2009 Statewide Sources and Disposition Summary ............ 26 Recorded 2010 Statewide Sources and Disposition Summary ............ 27 Recorded 2011 Statewide Sources and Disposition Summary ............ 28 Recorded 2012 Statewide Sources and Disposition Summary ............ 29 Recorded 2013 Statewide Sources and Disposition Summary ............ 30 Estimated California Highest Summer Sendout (MMcf/d) .................... 31 Estimated California Highest Winter Sendout (MMcf/d) ....................... 31
NORTHERN CALIFORNIA
Composition of PG&E Requirements (Bcf) Average-Year Demand ..... 34 Natural Gas Savings Due to Energy Efficiency .................................... 39 Natural Gas Energy Efficiency Programs ............................................. 39 Forecast of Core Gas Demand and Supply on an APD (MMcf/d) ........ 50 Winter Peak Day Demand (MMcf/d) .................................................... 51 Summer Peak Day Demand (MMcf/d) ................................................. 51 Annual Gas Supply and Requirements ................................................... 53 Annual Gas Supply Forecast (Average Demand Year) ................ 54 & 55 Annual Gas Supply Forecast (High Demand Year) ...................... 56 & 57
SOUTHERN CALIFORNIA
SoCalGas 12-County Area Employment .............................................. 60 SoCalGas Annual Active Meters and Annual Growth Rates
(2013-2035) ................................................................................. 61 Composition of SoCalGas Requirements-Average
Temperature, Normal Hydro Year (2013-2035) ............................ 62 Composition of SoCalGas’ Residential Demand Forecast
(2013-20135) .............................................................................. 65 Commercial Gas Demand by Business Types: Composition of
Industry (2013) ............................................................................. 65 Commercial Demand Forecast (2013-2035) ........................................ 66 Non-Refinery Industrial Gas Demand by Business Types
Composition of Industry Activity (2013) ........................................ 67 Annual Industrial Demand Forecast (Bcf) 2013-2035 .......................... 68 SoCalGas Service Area Total Electric Generation Forecast (Bcf) ........ 69 Annual Energy Efficiency Cumulative Savings Goal (Bcf) .................... 74 Upstream Capacity to Southern California ........................................... 78
TABLE OF CONTENTS
vi
SoCalGas/SDG&E Current Firm Receipt Capacity .............................. 79 Natural Gas Price at the Southern California Border............................ 88 Retail Core Peak Day Demand and Supply Requirements (MMcf/d) .... 89 Winter Peak Day Demand (MMcf/d) ..................................................... 90 Summer High Sendout Day Demand (MMcf/d) ..................................... 90
SOUTHERN CALIFORNIA GAS COMPANY TABULAR DATA
Annual Gas Supply and Sendout - (MMcf/d) - Recorded Years 2009 to 2013 ...................................................... 92
Annual Gas Supply and Requirements - (MMcf/d) - Estimated Years 2014 Thru 2018 (Table 1-SCG) ......................... 93
Annual Gas Supply and Requirements - (MMcf/d) - Estimated Years 2019 Thru 2035 (Table 2-SCG) ......................... 94
Annual Gas Supply and Requirements - (MMcf/d) - Estimated Years 2014 Thru 2018 (Table 3-SCG) ......................... 95
Annual Gas Supply and Requirements - (MMcf/d) - Estimated Years 2019 Thru 2035 (Table 4-SCG) ......................... 96
CITY OF LONG BEACH MUNICIPAL GAS & OIL DEPARTMENT TABULAR DATA
Annual Gas Supply and Sendout - (MMcf/d) - Recorded Years 2009 Thru 2013 (Table 1A-LB) ........................ 100
Annual Gas Supply and Sendout - (MMcf/d) - Recorded Years 2009 Thru 2013 (Table 1-LB) ........................... 101
Annual Gas Supply and Requirements - (MMcf/d) - Estimated Years 2014 Thru 2018 (Table 2-LB) .......................... 102
Annual Gas Supply and Requirements - (MMcf/d) - Estimated Years 2019 Thru 2035 (Table 3-LB) .......................... 103
Annual Gas Supply and Requirements - (MMcf/d) - Estimated Years 2014 Thru 2018 (Table 6-LB) .......................... 104
Annual Gas Supply and Requirements - (MMcf/d) - Estimated Years 2019 Thru 2035 (Table 7-LB) .......................... 105
SAN DIEGO GAS & ELECTRIC COMPANY
Composition of SDG&E Natural Gas Throughput (Bcf)-- Average Temperature, Normal Hydro Year (2013-2035) ............. 109
Composition of SDG&E’s Residential Demand Forecast (2013-2035) . 110 SDG&E Commercial Natural Gas Demand Forecast (2013-2035) ...... 110 SDG&E’s Industrial Natural Demand Forecast (2013-2035) ............... 111 SDG&E’s Service Area Total Electric Generation Forecast (Bcf) ....... 112 SDG&E’s Energy Efficiency Cumulative Savings, Various
Years (2014-2035) ...................................................................... 114 SAN DIEGO GAS & ELECTRIC COMPANY TABULAR DATA
Annual Gas Supply and Sendout (MMcf/d) - Recorded Years 2009-2013 ....................................................... 118
Annual Gas Supply Taken (MMcf/d) - Recorded Years 2009-2013 .... 119 Annual Gas Supply and Requirements - (MMcf/d) -
Estimated Years 2014 Thru 2018 (Table 1-SDGE) ..................... 120 Annual Gas Supply and Requirements - (MMcf/d) -
Estimated Years 2019 Thru 2035 (Table 2-SDGE) ..................... 121 Annual Gas Supply and Requirements - (MMcf/d) -
Estimated Years 2014 Thru 2018 (Table 3-SDGE) ..................... 122 Annual Gas Supply and Requirements - (MMcf/d) -
Estimated Years 2019 Thru 2035 (Table 4-SDGE) ..................... 123
FOREWORD
1
2 0 1 4 C A L I F O R N I A G A S R E P O R T
FOREWORD
FOREWORD
2
FOREWORD
The 2014 California Gas Report presents a comprehensive outlook for natural gas
requirements and supplies for California through the year 2035. This report is prepared in even-numbered years, followed by a supplemental report in odd-numbered years, in
compliance with California Public Utilities Commission Decision (CPUC) D.95-01-039. The
projections in the California Gas Report are for long-term planning and do not necessarily reflect the day-to-day operational plans of the utilities.
The report is organized into three sections: Executive Summary, Northern California,
and Southern California. The Executive Summary provides statewide highlights and consolidated tables on supply and demand. The Northern California section provides details
on the requirements and supplies of natural gas for Pacific Gas and Electric Company (PG&E),
the Sacramento Municipal Utility District (SMUD), Wild Goose Storage, Inc. and Lodi Gas Storage LLC. The Southern California section shows similar detail for Southern California Gas
Company (SoCalGas), the City of Long Beach Municipal Oil and Gas Department, Southwest
Gas Corporation, and San Diego Gas and Electric Company.
Each participating utility has provided a narrative explaining its assumptions and
outlook for natural gas requirements and supplies, including tables showing data on natural
gas availability by source, with corresponding tables showing data on natural gas requirements by customer class. Separate sets of tables are presented for average and cold year temperature
conditions. Any forecast, however, is subject to considerable uncertainty. Changes in the
economy, energy and environmental policies, natural resource availability, and the continually evolving restructuring of the gas and electric industries can significantly affect the reliability of
these forecasts. This report should not be used by readers as a substitute for a full, detailed
analysis of their own specific energy requirements.
A working committee, comprised of representatives from each utility was responsible
for compiling the report. The membership of this committee is listed in the Respondents section
at the end of this report.
Workpapers and next year’s report are available on request from PG&E and
SoCalGas/SDG&E. Write or email us at the address shown in the Reserve Your Subscription
section at the end of this report.
EXECUTIVE SUMMARY
3
2 0 1 4 C A L I F O R N I A G A S R E P O R T
EXECUTIVE SUMMARY
EXECUTIVE SUMMARY
4
EXECUTIVE SUMMARY
DEMAND OUTLOOK
California natural gas demand, including volumes not served by utility systems, is expected to decrease at a modest rate of 0.2 percent per year from 2014 to 2035. The forecast
decline is a combination of moderate growth in the Natural Gas Vehicle (NGV) and Enhanced
Oil Recovery (EOR) markets and across-the-board declines in all other market segments: residential; commercial; electric generation; and industrial markets.
Residential gas demand is expected to decrease at an annual average rate of 0.2 percent.
Demand in the core commercial and core industrial markets are expected to decline at an annual rate of 0.1 percent; whereas demand in the industrial noncore sector is estimated to
decline by 0.25 percent annually as California continues its transition from a manufacturing-
based to a service-based economy. Aggressive energy efficiency programs are expected to make a significant impact in managing growth in the residential, commercial, and industrial
markets.
For the purpose of load following as well as backstopping intermittent renewable resource generation, gas-fired generation will continue to be the technology of choice to meet
the ever growing demand for electric power. However, overall gas demand for electric
generation is expected to decline at a modest 0.2 percent per year for the next 20 years due to
more efficient power plants, statewide efforts to minimize greenhouse gas (GHG) emissions
through aggressive programs pursuing demand side reductions, and the acquisition of
preferred resources that produce little or no carbon emissions.

EXECUTIVE SUMMARY
5
The graph above summarizes statewide demand under base case and high case
scenarios. The base case refers to the expected gas demand for an average temperature year
and normal hydroelectric power (hydro) year, and the high case refers to expected gas demand for a cold-temperature year and dry hydro conditions. Under an average temperature
condition and a normal hydro year, gas demand for the state is projected to average
6,173 MMcf/d in 2014 decreasing to 5,910 MMcf/d by 2035, a decline of 0.2% per year.
In 2014, northern California is projected to require an additional 6% of gas supply to
meet demand for the high gas-demand scenario; whereas southern California is projected to
require an additional 3.5% of supply to meet the demand under the high scenario condition. This spread between the regions is expected; Northern California is colder and tends to rely
more heavily on hydroelectric power than southern California. The weather scenario for each
year is an independent event and each event has the same likelihood of occurring. The annual demand forecast for the base case and high case should, therefore, not be viewed as a combined
event from year to year.

EXECUTIVE SUMMARY
6
FOCUS ON EFFICIENCY AND ENVIRONMENTAL QUALITY
California utilities continue to focus on Customer Energy Efficiency (CEE) and other Demand Side Management (DSM) programs in their utility electric and gas resource plans. The
2000-2001 “energy crisis” in California was not limited to electricity. Gas prices at the southern
California border reached levels nearly ten times greater than had been experienced in previous years. California utilities are committed to helping their customers make the best possible
choices regarding use of this increasingly valuable resource. Gas demand for electric power
generation is expected to be moderated by CPUC-mandated goals for electric energy efficiency programs and renewable power. The base case forecasts in this report assume that the state will
have 33% of its electric needs met with renewable power by 2020 and beyond.
The state’s 2006 Global Warming Solutions Act, also known as Assembly Bill (AB) 32,
has set aggressive targets for the state to reduce its overall GHG production. This law creates
substantial uncertainty on the amount of natural gas that will be used in the outer years of the
forecast. There is a high degree of uncertainty regarding what impact will occur in each sector as a result of the implementation of the measures to meet the GHG reduction goals.
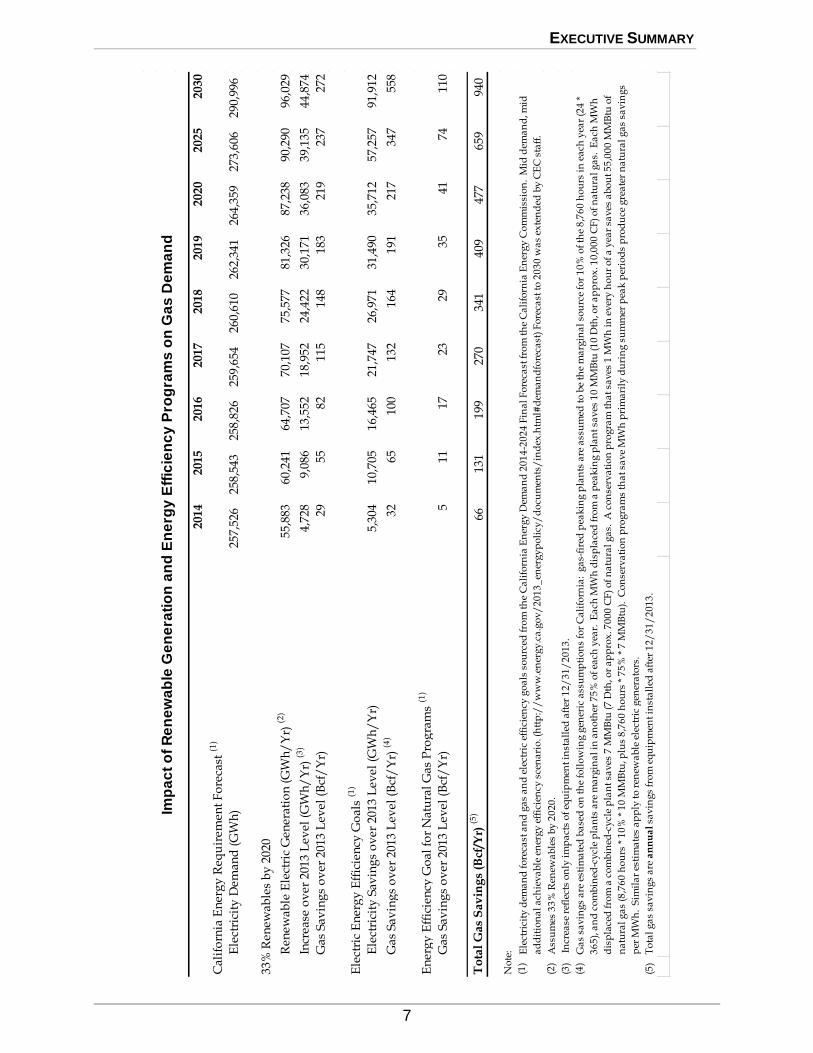
The table on the following page provides estimates of total gas savings based on the
impact of renewables in addition to the impact of electric and gas energy efficiency goals on the CPUC-jurisdictional utilities. Gas savings from electric energy efficiency goals are based on a
generic assumption of heat rate per megawatt-hour of electricity produced at gas-fired peaking
and combined-cycle power plants.
EXECUTIVE SUMMARY
7
2014
2015
2016
2017
2018
2019
2020
2025
2030
Cal
ifo
rnia
En
erg
y R
equ
irem
ent
Fo
reca
st (1
)
Ele
ctri
city
Dem
and
(G
Wh
)25
7,52
6
258,
543
25
8,82
6
259,
654
26
0,61
0
262,
341
26
4,35
9
273,
606
29
0,99
6
33%
Ren
ewab
les
by
202
0
Ren
ewab
le E
lect
ric
Gen
erat
ion
(G
Wh
/Y
r) (2
)55
,883
60,2
4164
,707
70,1
0775
,577
81,3
2687
,238
90,2
9096
,029
Incr
ease
ov
er 2
013
Lev
el (
GW
h/
Yr)
(3)
4,72
89,
086
13,5
5218
,952
24,4
2230
,171
36,0
8339
,135
44,8
74
Gas
Sav
ing
s o
ver
201
3 L
evel
(B
cf/
Yr)
2955
8211
514
818
321
923
727
2
Ele
ctri
c E
ner
gy
Eff
icie
ncy
Go
als
(1)
Ele
ctri
city
Sav
ing
s o
ver
201
3 L
evel
(G
Wh
/Y
r)5,
304
10,7
0516
,465
21,7
4726
,971
31,4
9035
,712
57,2
5791
,912
Gas
Sav
ing
s o
ver
201
3 L
evel
(B
cf/
Yr)
(4)
3265
100
132
164
191
217
347
558
En
erg
y E
ffic
ien
cy G
oal
fo
r N
atu
ral
Gas
Pro
gra
ms
(1)
Gas
Sav
ing
s o
ver
201
3 L
evel
(B
cf/
Yr)
511
1723
2935
4174
110
To
tal
Ga
s S
av
ing
s (B
cf/Y
r) (5
)66
131
19
9
270
34
1
409
47
7
659
94
0
No
te:
(1)
(2)
(3)
(4)
(5)
To
tal
ga
s sa
vin
gs
are
an
nu
al
sav
ing
s fr
om
eq
uip
men
t in
sta
lled
aft
er 1
2/
31
/2
01
3.
Imp
ac
t o
f R
en
ew
ab
le G
en
era
tio
n a
nd
En
erg
y E
ffic
ien
cy
Pro
gra
ms
on
Ga
s D
em
an
d
Ele
ctri
city
dem
an
d f
ore
cast
an
d g
as
an
d e
lect
ric
effi
cien
cy g
oa
ls s
ou
rced
fro
m t
he
Ca
lifo
rnia
En
erg
y D
ema
nd
20
14
-20
24
Fin
al
Fo
reca
st f
rom
th
e C
ali
forn
ia E
ner
gy
Co
mm
issi
on
. M
id d
ema
nd
, mid
ad
dit
ion
al
ach
iev
ab
le e
ner
gy
eff
icie
ncy
sce
na
rio
. (h
ttp
://
ww
w.e
ner
gy
.ca
.go
v/
20
13
_en
erg
yp
oli
cy/
do
cum
ents
/in
dex
.htm
l#d
ema
nd
fore
cast
) F
ore
cast
to
20
30
wa
s ex
ten
ded
by
CE
C s
taff
.
Ass
um
es 3
3%
Ren
ewa
ble
s b
y 2
02
0.
Incr
ease
ref
lect
s o
nly
im
pa
cts
of
equ
ipm
ent
inst
all
ed a
fter
12
/3
1/
20
13
.
Ga
s sa
vin
gs
are
est
ima
ted
ba
sed
on
th
e fo
llo
win
g g
ener
ic a
ssu
mp
tio
ns
for
Ca
lifo
rnia
: g
as-
fire
d p
eak
ing
pla
nts
are
ass
um
ed t
o b
e th
e m
arg
ina
l so
urc
e fo
r 1
0%
of
the
8,7
60
ho
urs
in
ea
ch y
ear
(24
*
36
5),
an
d c
om
bin
ed-c
ycl
e p
lan
ts a
re m
arg
ina
l in
an
oth
er 7
5%
of
each
yea
r. E
ach
MW
h d
isp
lace
d f
rom
a p
eak
ing
pla
nt
sav
es 1
0 M
MB
tu (
10
Dth
, or
ap
pro
x. 1
0,0
00
CF
) o
f n
atu
ral
ga
s. E
ach
MW
h
dis
pla
ced
fro
m a
co
mb
ined
-cy
cle
pla
nt
sav
es 7
MM
Btu
(7
Dth
, or
ap
pro
x. 7
00
0 C
F)
of
na
tura
l g
as.
A c
on
serv
ati
on
pro
gra
m t
ha
t sa
ves
1 M
Wh
in
ev
ery
ho
ur
of
a y
ear
sav
es a
bo
ut
55
,00
0 M
MB
tu o
f
na
tura
l g
as
(8,7
60
ho
urs
* 1
0%
* 1
0 M
MB
tu, p
lus
8,7
60
ho
urs
* 7
5%
* 7
MM
Btu
). C
on
serv
ati
on
pro
gra
ms
tha
t sa
ve
MW
h p
rim
ari
ly d
uri
ng
su
mm
er p
eak
per
iod
s p
rod
uce
gre
ate
r n
atu
ral
ga
s sa
vin
gs
per
MW
h.
Sim
ila
r es
tim
ate
s a
pp
ly t
o r
enew
ab
le e
lect
ric
gen
era
tors
.
EXECUTIVE SUMMARY
8
Future Gas System Impacts Resulting From Increased Renewable Generation, and Localized or Distributed Generation Resources
Electric system operators must balance electrical demand with supply resources on a
real time basis. Historically, system operators have relied on “dispatchable” gas-fired, resources that can respond quickly to changes in demand to keep the system in balance. The
substantial increase in renewable resources will present an additional challenge to system
operators. They must now deal with real time, unanticipated variations in intermittent renewable resources like wind and solar resources. In addition, these resources greatly increase
morning and evening ramps, as both wind and solar resources can come online, as well as,
offline very quickly.
California is currently on track to meet a 33% Renewable Portfolio Standard by 2020. It
is expected that solar and wind generating units will provide the majority of the new,
renewable generation. In addition, the Governor has indicated an interest in significantly increasing the amount of smaller (less than 20 megawatts) generation in the state primarily with
renewable or efficient technology. Much of the smaller incremental renewable energy is
expected to come from solar Photo Voltaic (PV) installations because solar generation costs have declined rapidly in the past few years and solar has siting advantages especially in the urban
areas. All this renewable energy will displace a significant amount of the natural gas currently
being used to generate electricity in California. However, the intermittent nature of renewable generation is likely to cause the electric system to rely more heavily on natural gas-fired electric
generation for providing the ancillary services (load following, ramping, and quick starts)
needed to balance the electric system in the short-term until other technologies like battery or
compressed air storage can mature.
The direct result of the addition of significant amounts of renewable generation
resources to the California generation resource mix is that the gas system is likely to experience increased gas demand volatility for the gas-fired generators required to provide the additional
ancillary service needed. In many months of the year the variability of wind is significant and
in months that have significant cloud formation, or overcast conditions, the solar PV units may also have increased generation variability. The uncertainty in day-ahead gas demands will
likely cause increased gas system inventory fluctuations. The gas system will, therefore, need to
be flexible enough to handle such fluctuations with minimal interruption to gas deliveries to other customers. There will undoubtedly be higher daily fluctuations of gas usage in the future;
especially on days when clouds materialize that were not forecast. The gas system will need to
be able to accommodate such operations.
The challenge of incorporating intermittent resources into the California electric system
is being addressed in several ways. Currently, utility planners are anticipating the use of
increased cycling, gas-fired plants, pumped hydroelectric facilities, price responsive demand reducing programs, energy storage products, and distributed generation at load centers to
handle much of the variability in electricity demand. Recently, the CPUC Storage Mandate
Decision (D).13-10-040 was passed. These energy storage products would use the excess renewables energy to charge the battery or system during the time of low energy demand and
would provide energy back into the grid during periods of high energy demand. In addition,
EXECUTIVE SUMMARY
9
the California Independent System Operator (CAISO) has instituted a number of operational
changes that move the forecasting of wind and solar availability closer to real time, which
should reduce forecasting errors significantly. More accurate forecasting will help reduce the
need for spinning reserves and other ancillary services. Also, the CAISO has broadened its
electrical footprint with the creation of an Energy Imbalance Market (EIM). The EIM will allow both the CAISO and non-CAISO members to optimize resource availability that will allow the
CAISO to better manage the integration of intermittent renewable resources. Broadening the
interconnection to the regional grid will offset some of the intermittent nature of renewable resources and alleviate some of the operational obstacles to renewable integration. In addition,
FERC Order 764, mandated intra-hour scheduling (fifteen minutes instead of on hour) between
electric control areas. The shorter scheduling time interval will increase the accuracy of schedules, thus reducing the reliance on ancillary services to maintain electric system balance.
Even with all of these operational changes to the electric system, there is still a need to have
sufficient quick start resources available, most likely gas-fired resources, to balance the grid, as
the State integrates more intermittent renewable resources into the California electric grid to
achieve its 33% Renewable Portfolio Standard by 2020.
EXECUTIVE SUMMARY
10
NATURAL GAS PROJECTS: PROPOSALS, COMPLETIONS, AND LIQUEFIED
NATURAL GAS
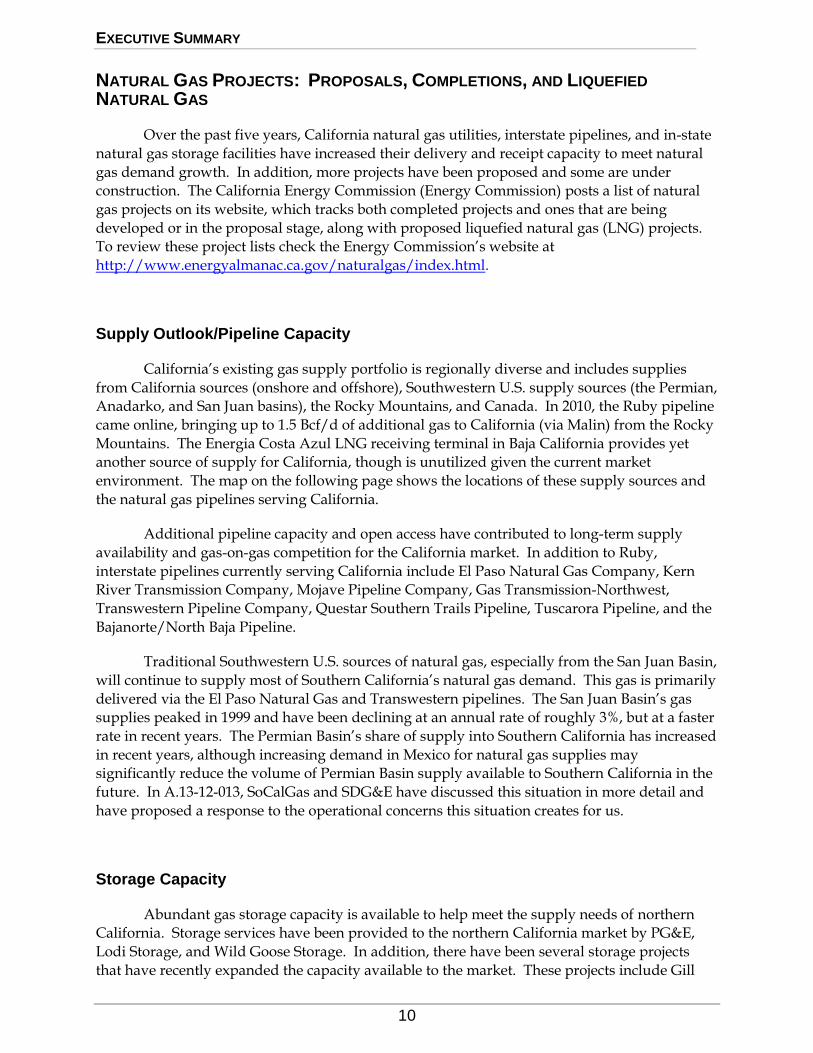
Over the past five years, California natural gas utilities, interstate pipelines, and in-state
natural gas storage facilities have increased their delivery and receipt capacity to meet natural
gas demand growth. In addition, more projects have been proposed and some are under construction. The California Energy Commission (Energy Commission) posts a list of natural
gas projects on its website, which tracks both completed projects and ones that are being
developed or in the proposal stage, along with proposed liquefied natural gas (LNG) projects. To review these project lists check the Energy Commission’s website at
http://www.energyalmanac.ca.gov/naturalgas/index.html.
Supply Outlook/Pipeline Capacity
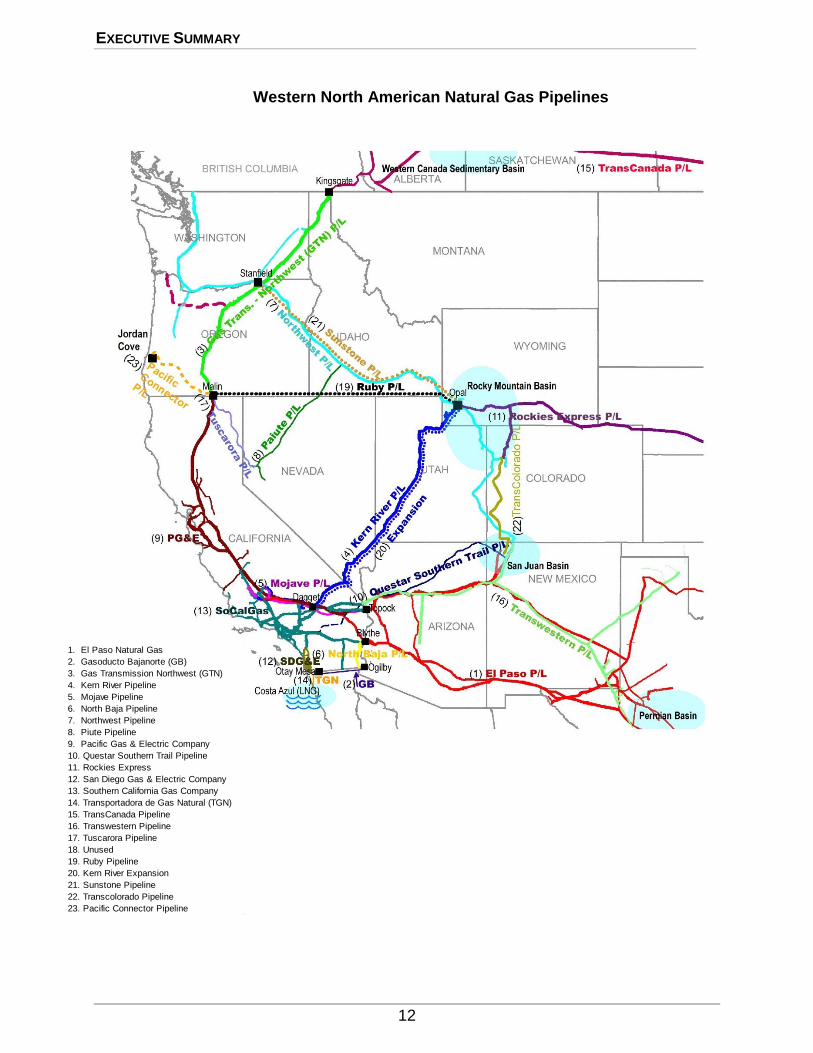
California’s existing gas supply portfolio is regionally diverse and includes supplies
from California sources (onshore and offshore), Southwestern U.S. supply sources (the Permian, Anadarko, and San Juan basins), the Rocky Mountains, and Canada. In 2010, the Ruby pipeline
came online, bringing up to 1.5 Bcf/d of additional gas to California (via Malin) from the Rocky
Mountains. The Energia Costa Azul LNG receiving terminal in Baja California provides yet another source of supply for California, though is unutilized given the current market
environment. The map on the following page shows the locations of these supply sources and
the natural gas pipelines serving California.
Additional pipeline capacity and open access have contributed to long-term supply
availability and gas-on-gas competition for the California market. In addition to Ruby,
interstate pipelines currently serving California include El Paso Natural Gas Company, Kern River Transmission Company, Mojave Pipeline Company, Gas Transmission-Northwest,
Transwestern Pipeline Company, Questar Southern Trails Pipeline, Tuscarora Pipeline, and the
Bajanorte/North Baja Pipeline.
Traditional Southwestern U.S. sources of natural gas, especially from the San Juan Basin,
will continue to supply most of Southern California’s natural gas demand. This gas is primarily
delivered via the El Paso Natural Gas and Transwestern pipelines. The San Juan Basin’s gas supplies peaked in 1999 and have been declining at an annual rate of roughly 3%, but at a faster
rate in recent years. The Permian Basin’s share of supply into Southern California has increased
in recent years, although increasing demand in Mexico for natural gas supplies may significantly reduce the volume of Permian Basin supply available to Southern California in the
future. In A.13-12-013, SoCalGas and SDG&E have discussed this situation in more detail and
have proposed a response to the operational concerns this situation creates for us.
Storage Capacity
Abundant gas storage capacity is available to help meet the supply needs of northern California. Storage services have been provided to the northern California market by PG&E,
Lodi Storage, and Wild Goose Storage. In addition, there have been several storage projects
that have recently expanded the capacity available to the market. These projects include Gill

EXECUTIVE SUMMARY
11
Ranch Storage, which came online in 2010, and Central Valley Storage, which came online in
2012. In addition, Wild Goose had a large expansion that became operational in 2012.
EXECUTIVE SUMMARY
12
1. El Paso Natural Gas
2. Gasoducto Bajanorte (GB)
3. Gas Transmission Northwest (GTN)
4. Kern River Pipeline
5. Mojave Pipeline
6. North Baja Pipeline
7. Northwest Pipeline
8. Piute Pipeline
9. Pacific Gas & Electric Company
10. Questar Southern Trail Pipeline
11. Rockies Express
12. San Diego Gas & Electric Company
13. Southern California Gas Company
14. Transportadora de Gas Natural (TGN)
15. TransCanada Pipeline
16. Transwestern Pipeline
17. Tuscarora Pipeline
18. Unused
19. Ruby Pipeline
20. Kern River Expansion
21. Sunstone Pipeline
22. Transcolorado Pipeline
23. Pacific Connector Pipeline
Western North American Natural Gas Pipelines
EXECUTIVE SUMMARY
13
Liquefied Natural Gas (LNG)
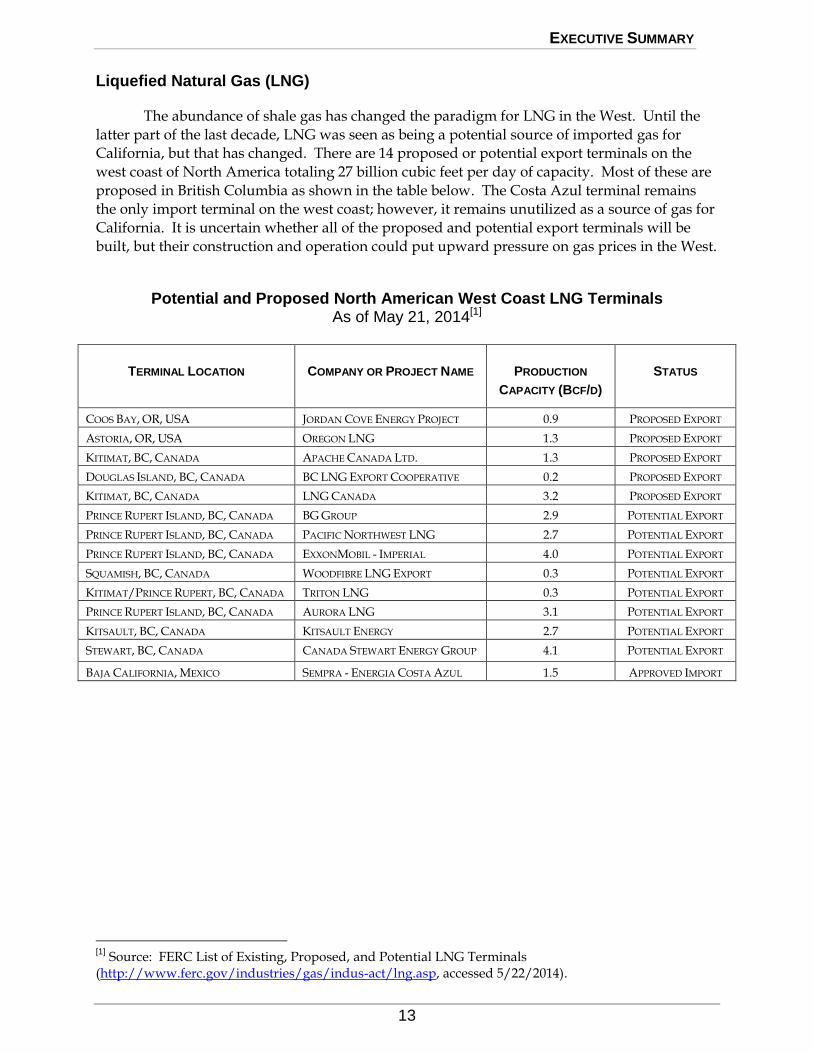
The abundance of shale gas has changed the paradigm for LNG in the West. Until the
latter part of the last decade, LNG was seen as being a potential source of imported gas for California, but that has changed. There are 14 proposed or potential export terminals on the
west coast of North America totaling 27 billion cubic feet per day of capacity. Most of these are
proposed in British Columbia as shown in the table below. The Costa Azul terminal remains the only import terminal on the west coast; however, it remains unutilized as a source of gas for
California. It is uncertain whether all of the proposed and potential export terminals will be
built, but their construction and operation could put upward pressure on gas prices in the West.
Potential and Proposed North American West Coast LNG Terminals As of May 21, 2014[1]
TERMINAL LOCATION COMPANY OR PROJECT NAME PRODUCTION
CAPACITY (BCF/D)
STATUS
COOS BAY, OR, USA JORDAN COVE ENERGY PROJECT 0.9 PROPOSED EXPORT
ASTORIA, OR, USA OREGON LNG 1.3 PROPOSED EXPORT
KITIMAT, BC, CANADA APACHE CANADA LTD. 1.3 PROPOSED EXPORT
DOUGLAS ISLAND, BC, CANADA BC LNG EXPORT COOPERATIVE 0.2 PROPOSED EXPORT
KITIMAT, BC, CANADA LNG CANADA 3.2 PROPOSED EXPORT
PRINCE RUPERT ISLAND, BC, CANADA BG GROUP 2.9 POTENTIAL EXPORT
PRINCE RUPERT ISLAND, BC, CANADA PACIFIC NORTHWEST LNG 2.7 POTENTIAL EXPORT
PRINCE RUPERT ISLAND, BC, CANADA EXXONMOBIL - IMPERIAL 4.0 POTENTIAL EXPORT
SQUAMISH, BC, CANADA WOODFIBRE LNG EXPORT 0.3 POTENTIAL EXPORT
KITIMAT/PRINCE RUPERT, BC, CANADA TRITON LNG 0.3 POTENTIAL EXPORT
PRINCE RUPERT ISLAND, BC, CANADA AURORA LNG 3.1 POTENTIAL EXPORT
KITSAULT, BC, CANADA KITSAULT ENERGY 2.7 POTENTIAL EXPORT
STEWART, BC, CANADA CANADA STEWART ENERGY GROUP 4.1 POTENTIAL EXPORT
BAJA CALIFORNIA, MEXICO SEMPRA - ENERGIA COSTA AZUL 1.5 APPROVED IMPORT
[1]
Source: FERC List of Existing, Proposed, and Potential LNG Terminals (http://www.ferc.gov/industries/gas/indus-act/lng.asp, accessed 5/22/2014).
EXECUTIVE SUMMARY
14
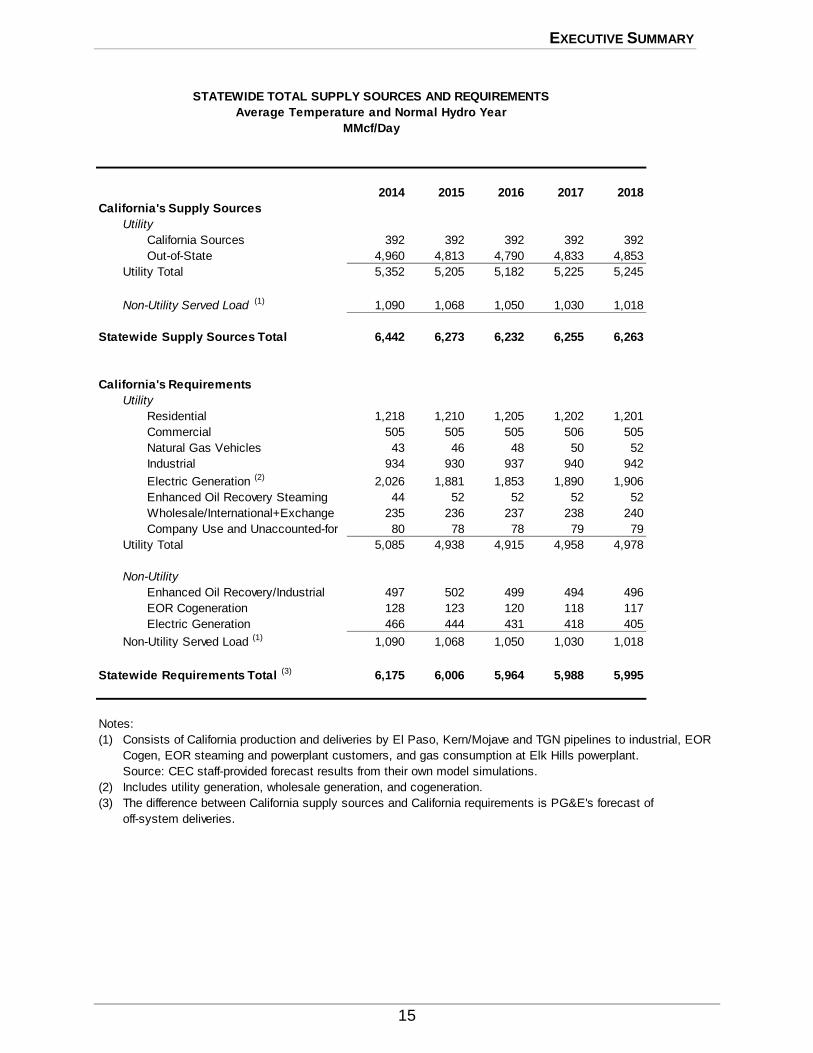
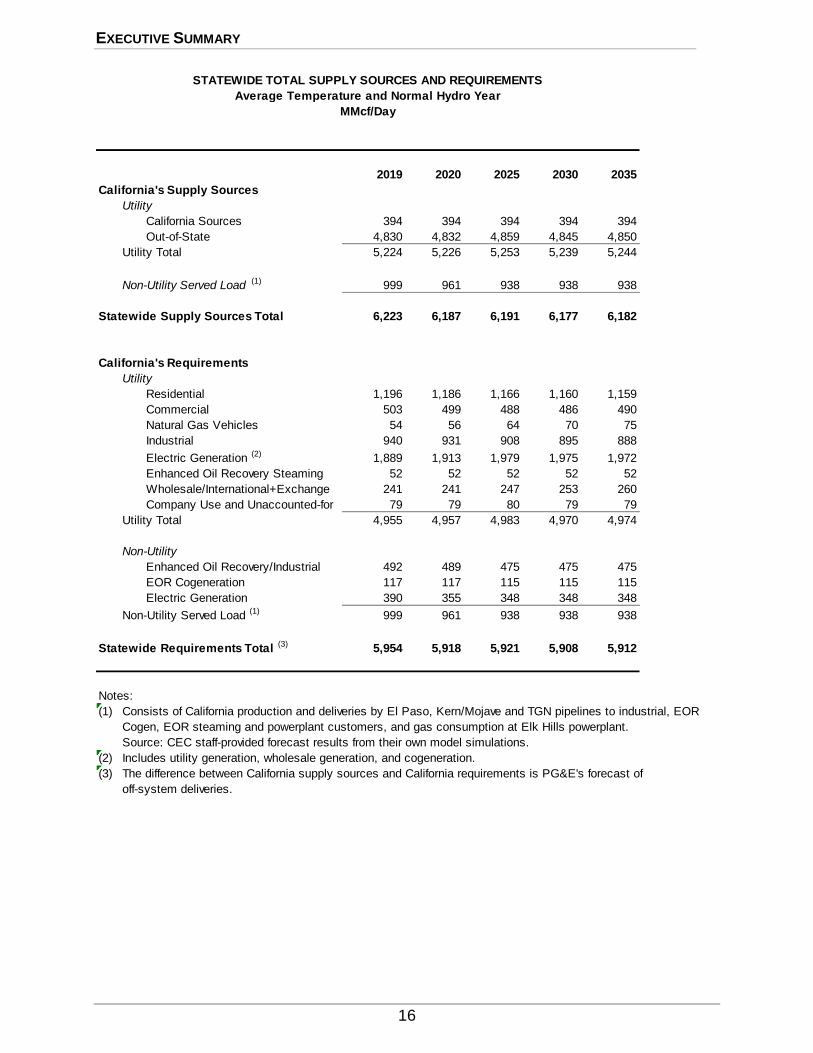
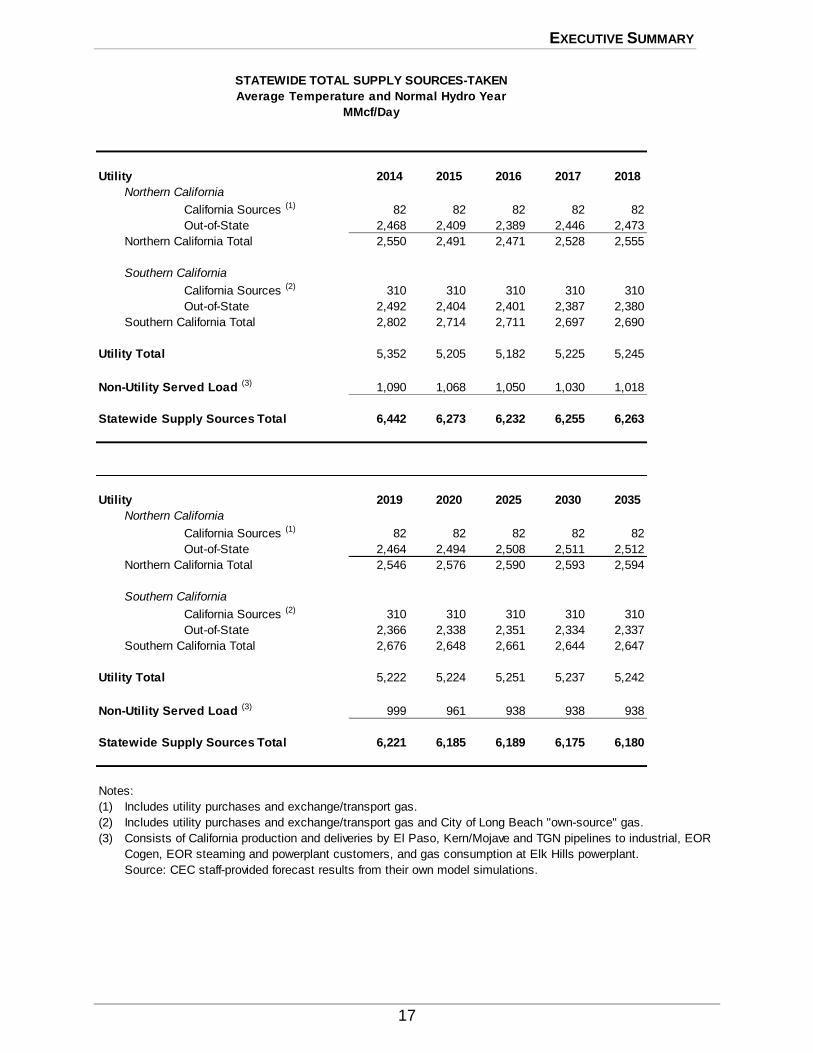
STATEWIDE CONSOLIDATED SUMMARY TABLES
The consolidated summary tables on the following pages show the statewide aggregations of projected gas supplies and gas requirements (demand) from 2014 to 2035 for
average-temperature and normal-hydro years and cold temperature and dry hydro years.
Gas sales and transportation volumes are consolidated under the general category of system gas requirement. Details of gas transportation for individual utilities are given in the
tabular data for northern California and southern California. The wholesale category includes
the City of Long Beach Gas and Oil Department, San Diego Gas & Electric Company, Southwest Gas Corporation, City of Vernon, Alpine Natural Gas, Island Energy, West Coast Gas, Inc., and
the municipalities of Coalinga and Palo Alto.
Some columns may not sum precisely because of modeling accuracy and rounding differences, and do not imply curtailments.
EXECUTIVE SUMMARY
15
2014 2015 2016 2017 2018
California's Supply Sources
Utility
California Sources 392 392 392 392 392
Out-of-State 4,960 4,813 4,790 4,833 4,853
Utility Total 5,352 5,205 5,182 5,225 5,245
Non-Utility Served Load (1) 1,090 1,068 1,050 1,030 1,018
Statewide Supply Sources Total 6,442 6,273 6,232 6,255 6,263
California's Requirements
Utility
Residential 1,218 1,210 1,205 1,202 1,201
Commercial 505 505 505 506 505
Natural Gas Vehicles 43 46 48 50 52
Industrial 934 930 937 940 942
Electric Generation (2) 2,026 1,881 1,853 1,890 1,906
Enhanced Oil Recovery Steaming 44 52 52 52 52
Wholesale/International+Exchange 235 236 237 238 240
Company Use and Unaccounted-for 80 78 78 79 79
Utility Total 5,085 4,938 4,915 4,958 4,978
Non-Utility
Enhanced Oil Recovery/Industrial 497 502 499 494 496
EOR Cogeneration 128 123 120 118 117
Electric Generation 466 444 431 418 405
Non-Utility Served Load (1) 1,090 1,068 1,050 1,030 1,018
Statewide Requirements Total (3) 6,175 6,006 5,964 5,988 5,995
Notes:
(1) Consists of California production and deliveries by El Paso, Kern/Mojave and TGN pipelines to industrial, EOR
Cogen, EOR steaming and powerplant customers, and gas consumption at Elk Hills powerplant.
Source: CEC staff-provided forecast results from their own model simulations.
(2) Includes utility generation, wholesale generation, and cogeneration.
(3) The difference between California supply sources and California requirements is PG&E's forecast of
off-system deliveries.
STATEWIDE TOTAL SUPPLY SOURCES AND REQUIREMENTS
Average Temperature and Normal Hydro Year
MMcf/Day
EXECUTIVE SUMMARY
16
2019 2020 2025 2030 2035
California's Supply Sources
Utility
California Sources 394 394 394 394 394
Out-of-State 4,830 4,832 4,859 4,845 4,850
Utility Total 5,224 5,226 5,253 5,239 5,244
Non-Utility Served Load (1) 999 961 938 938 938
Statewide Supply Sources Total 6,223 6,187 6,191 6,177 6,182
California's Requirements
Utility
Residential 1,196 1,186 1,166 1,160 1,159
Commercial 503 499 488 486 490
Natural Gas Vehicles 54 56 64 70 75
Industrial 940 931 908 895 888
Electric Generation (2) 1,889 1,913 1,979 1,975 1,972
Enhanced Oil Recovery Steaming 52 52 52 52 52
Wholesale/International+Exchange 241 241 247 253 260
Company Use and Unaccounted-for 79 79 80 79 79
Utility Total 4,955 4,957 4,983 4,970 4,974
Non-Utility
Enhanced Oil Recovery/Industrial 492 489 475 475 475
EOR Cogeneration 117 117 115 115 115
Electric Generation 390 355 348 348 348
Non-Utility Served Load (1) 999 961 938 938 938
Statewide Requirements Total (3) 5,954 5,918 5,921 5,908 5,912
Notes:
(1) Consists of California production and deliveries by El Paso, Kern/Mojave and TGN pipelines to industrial, EOR
Cogen, EOR steaming and powerplant customers, and gas consumption at Elk Hills powerplant.
Source: CEC staff-provided forecast results from their own model simulations.
(2) Includes utility generation, wholesale generation, and cogeneration.
(3) The difference between California supply sources and California requirements is PG&E's forecast of
off-system deliveries.
STATEWIDE TOTAL SUPPLY SOURCES AND REQUIREMENTS
Average Temperature and Normal Hydro Year
MMcf/Day
EXECUTIVE SUMMARY
17
Utility 2014 2015 2016 2017 2018
Northern California
California Sources (1) 82 82 82 82 82
Out-of-State 2,468 2,409 2,389 2,446 2,473
Northern California Total 2,550 2,491 2,471 2,528 2,555
Southern California
California Sources (2) 310 310 310 310 310
Out-of-State 2,492 2,404 2,401 2,387 2,380
Southern California Total 2,802 2,714 2,711 2,697 2,690
Utility Total 5,352 5,205 5,182 5,225 5,245
Non-Utility Served Load (3) 1,090 1,068 1,050 1,030 1,018
Statewide Supply Sources Total 6,442 6,273 6,232 6,255 6,263
STATEWIDE TOTAL SUPPLY SOURCES-TAKEN
Average Temperature and Normal Hydro Year
MMcf/Day
Utility 2019 2020 2025 2030 2035
Northern California
California Sources (1) 82 82 82 82 82
Out-of-State 2,464 2,494 2,508 2,511 2,512
Northern California Total 2,546 2,576 2,590 2,593 2,594
Southern California
California Sources (2) 310 310 310 310 310
Out-of-State 2,366 2,338 2,351 2,334 2,337
Southern California Total 2,676 2,648 2,661 2,644 2,647
Utility Total 5,222 5,224 5,251 5,237 5,242
Non-Utility Served Load (3) 999 961 938 938 938
Statewide Supply Sources Total 6,221 6,185 6,189 6,175 6,180
Notes:
(1) Includes utility purchases and exchange/transport gas.
(2) Includes utility purchases and exchange/transport gas and City of Long Beach "own-source" gas.
(3) Consists of California production and deliveries by El Paso, Kern/Mojave and TGN pipelines to industrial, EOR
Cogen, EOR steaming and powerplant customers, and gas consumption at Elk Hills powerplant.
Source: CEC staff-provided forecast results from their own model simulations.
EXECUTIVE SUMMARY
18
2014 2015 2016 2017 2018
Utility
Northern California
Residential 543 545 547 547 549
Commercial - Core 230 232 233 234 234
Natural Gas Vehicles - Core 7 7 7 8 8
Natural Gas Vehicles - Noncore 1 1 1 1 1
Industrial - Noncore 498 492 498 503 507
Wholesale 0 0 0 0 0
SMUD Electric Generation 122 122 122 122 122
Electric Generation (2) 837 780 751 801 821
Exchange (California) 1 1 1 1 1
Company Use and Unaccounted-for 44 43 43 44 44
Northern California Total (3) 2,283 2,224 2,203 2,261 2,287
Southern California
Residential 676 664 658 655 652
Commercial - Core 226 227 228 230 230
Commercial - Noncore 48 46 44 43 41
Natural Gas Vehicles - Core 35 38 40 42 43
Industrial - Core 60 59 59 59 58
Industrial - Noncore 376 379 379 379 377
Wholesale 234 235 236 237 239
SDG&E+Vernon Electric Generation 204 190 196 194 186
Electric Generation (4) 863 789 785 773 777
Enhanced Oil Recovery Steaming 44 52 52 52 52
Company Use and Unaccounted-for 36 35 35 35 35
Southern California Total 2,802 2,714 2,711 2,697 2,690
Utility Total 5,085 4,938 4,915 4,958 4,978
Non-Utility Served Load (5) 1,090 1,068 1,050 1,030 1,018
Statewide Gas Requirements Total (6) 6,175 6,006 5,964 5,988 5,995
Notes:
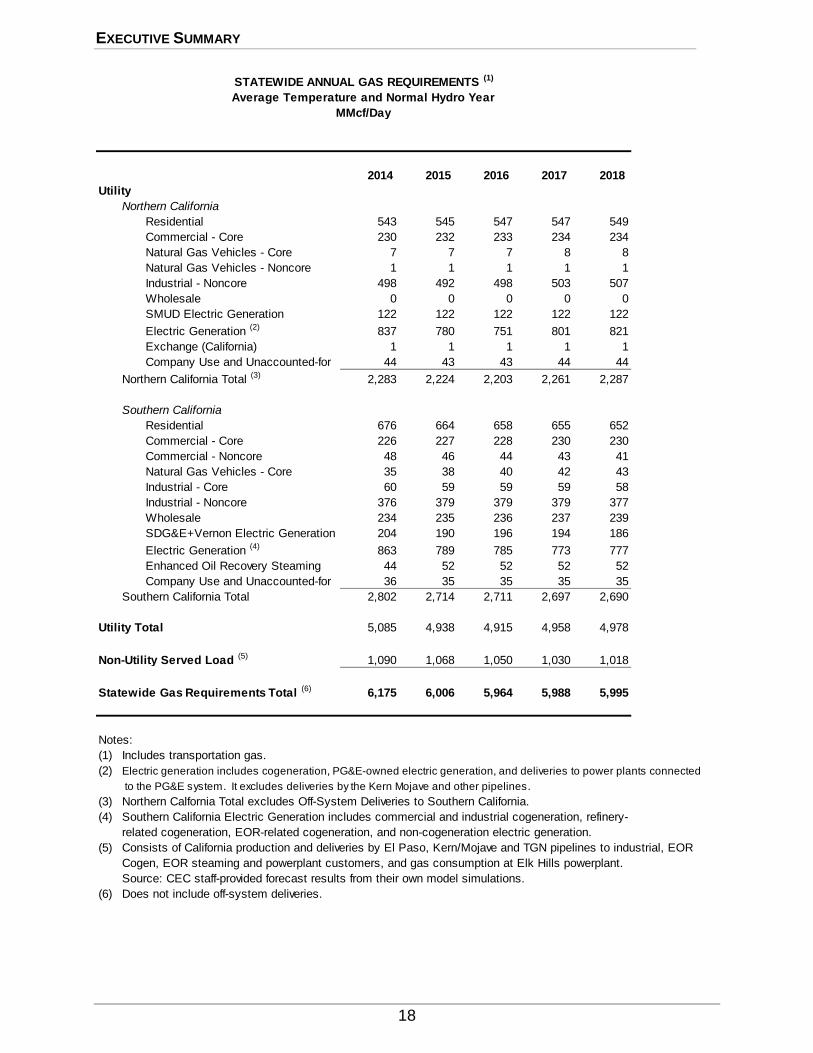
(1) Includes transportation gas.
(2) Electric generation includes cogeneration, PG&E-owned electric generation, and deliveries to power plants connected
to the PG&E system. It excludes deliveries by the Kern Mojave and other pipelines.
(3) Northern Calfornia Total excludes Off-System Deliveries to Southern California.
(4) Southern California Electric Generation includes commercial and industrial cogeneration, refinery-
related cogeneration, EOR-related cogeneration, and non-cogeneration electric generation.
(5) Consists of California production and deliveries by El Paso, Kern/Mojave and TGN pipelines to industrial, EOR
Cogen, EOR steaming and powerplant customers, and gas consumption at Elk Hills powerplant.
Source: CEC staff-provided forecast results from their own model simulations.
(6) Does not include off-system deliveries.
STATEWIDE ANNUAL GAS REQUIREMENTS (1)
Average Temperature and Normal Hydro Year
MMcf/Day

EXECUTIVE SUMMARY
19
2019 2020 2025 2030 2035
Utility
Northern California
Residential 549 548 547 548 548
Commercial - Core 234 234 234 235 235
Natural Gas Vehicles - Core 8 9 9 9 10
Natural Gas Vehicles - Noncore 1 1 1 1 1
Industrial - Noncore 509 508 508 510 511
Wholesale 0 0 0 0 0
SMUD Electric Generation 122 122 122 122 122
Electric Generation (2) 810 841 855 855 855
Exchange (California) 1 1 1 1 1
Company Use and Unaccounted-for 44 45 45 45 45
Northern California Total (3) 2,279 2,309 2,322 2,326 2,327
Southern California
Residential 647 638 619 612 611
Commercial - Core 230 228 226 228 231
Commercial - Noncore 39 37 28 23 24
Natural Gas Vehicles - Core 45 46 54 59 64
Industrial - Core 57 55 48 43 41
Industrial - Noncore 373 367 351 341 336
Wholesale 240 240 246 252 259
SDG&E+Vernon Electric Generation 183 180 181 179 178
Electric Generation (4) 774 770 821 819 817
Enhanced Oil Recovery Steaming 52 52 52 52 52
Company Use and Unaccounted-for 35 34 35 34 34
Southern California Total 2,676 2,648 2,661 2,644 2,647
Utility Total 4,955 4,957 4,983 4,970 4,974
Non-Utility Served Load (5) 999 961 938 938 938
Statewide Gas Requirements Total (6) 5,954 5,918 5,921 5,908 5,912
Notes:
(1) Includes transportation gas.
(2) Electric generation includes cogeneration, PG&E-owned electric generation, and deliveries to power plants connected
to the PG&E system. It excludes deliveries by the Kern Mojave and other pipelines.
(3) Northern Calfornia Total excludes Off-System Deliveries to Southern California.
(4) Southern California Electric Generation includes commercial and industrial cogeneration, refinery-
related cogeneration, EOR-related cogeneration, and non-cogeneration electric generation.
(5) Consists of California production and deliveries by El Paso, Kern/Mojave and TGN pipelines to industrial, EOR
Cogen, EOR steaming and powerplant customers, and gas consumption at Elk Hills powerplant.
Source: CEC staff-provided forecast results from their own model simulations.
(6) Does not include off-system deliveries.
STATEWIDE ANNUAL GAS REQUIREMENTS (1)
Average Temperature and Normal Hydro Year
MMcf/Day
EXECUTIVE SUMMARY
20
2014 2015 2016 2017 2018
California's Supply Sources
Utility
California Sources 394 394 394 394 394
Out-of-State 5,198 5,091 5,073 5,114 5,145
Utility Total 5,592 5,485 5,467 5,508 5,539
Non-Utility Served Load (1) 1,110 1,098 1,080 1,058 1,047
Statewide Supply Sources Total 6,702 6,583 6,547 6,566 6,585
California's Requirements
Utility
Residential 1,329 1,320 1,316 1,314 1,313
Commercial 528 529 530 531 530
Natural Gas Vehicles 43 46 48 50 52
Industrial 935 932 938 942 944
Electric Generation (2) 2,111 2,006 1,982 2,015 2,042
Enhanced Oil Recovery Steaming 44 52 52 52 52
Wholesale/International+Exchange 248 249 250 252 253
Company Use and Unaccounted-for 85 83 82 83 84
Utility Total 5,323 5,216 5,198 5,239 5,270
Non-Utility
Enhanced Oil Recovery/Industrial 497 502 499 494 496
EOR Cogeneration 128 123 120 118 117
Electric Generation 485 473 461 446 434
Non-Utility Served Load (1) 1,110 1,098 1,080 1,058 1,047
Statewide Requirements Total (3) 6,433 6,314 6,278 6,297 6,316
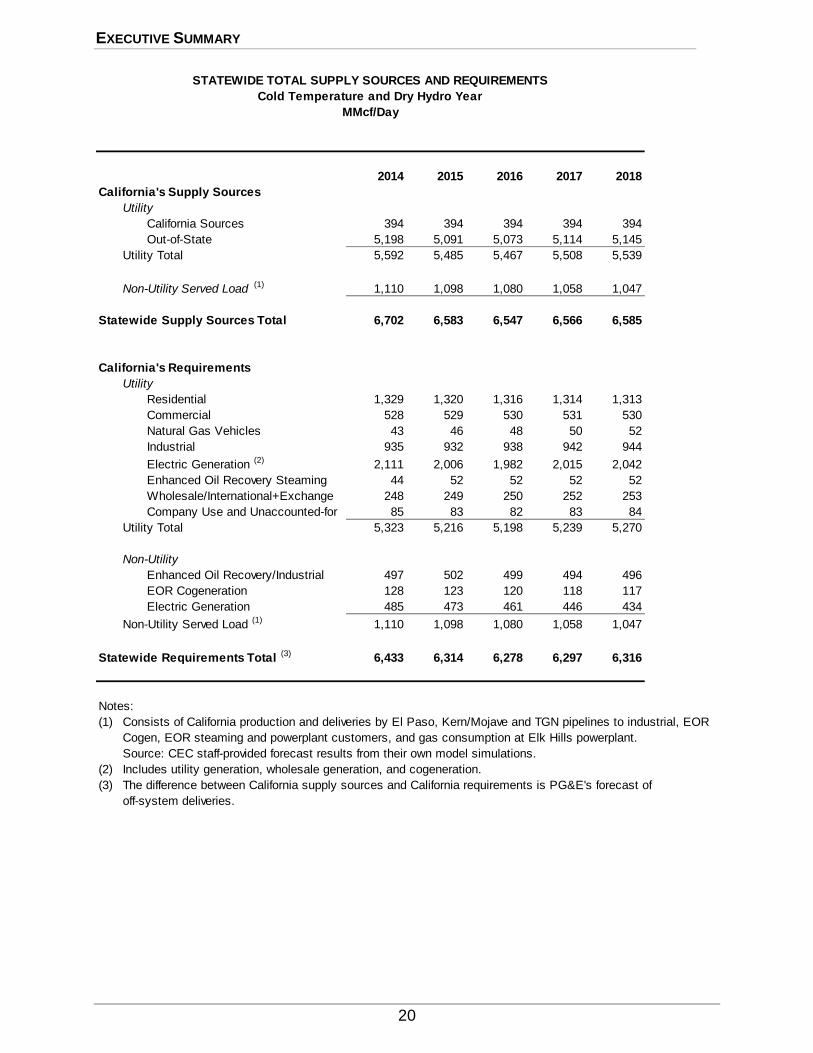
Notes:
(1) Consists of California production and deliveries by El Paso, Kern/Mojave and TGN pipelines to industrial, EOR
Cogen, EOR steaming and powerplant customers, and gas consumption at Elk Hills powerplant.
Source: CEC staff-provided forecast results from their own model simulations.
(2) Includes utility generation, wholesale generation, and cogeneration.
(3) The difference between California supply sources and California requirements is PG&E's forecast of
off-system deliveries.
STATEWIDE TOTAL SUPPLY SOURCES AND REQUIREMENTS
Cold Temperature and Dry Hydro Year
MMcf/Day

EXECUTIVE SUMMARY
21
2019 2020 2025 2030 2035
California's Supply Sources
Utility
California Sources 394 394 394 394 394
Out-of-State 5,119 5,115 5,155 5,144 5,150
Utility Total 5,513 5,509 5,549 5,538 5,544
Non-Utility Served Load (1) 1,026 984 963 963 963
Statewide Supply Sources Total 6,539 6,493 6,512 6,500 6,506
California's Requirements
Utility
Residential 1,308 1,298 1,277 1,271 1,272
Commercial 528 525 514 512 516
Natural Gas Vehicles 54 56 64 70 75
Industrial 941 932 909 895 888
Electric Generation (2) 2,022 2,038 2,119 2,116 2,113
Enhanced Oil Recovery Steaming 52 52 52 52 52
Wholesale/International+Exchange 255 255 261 268 275
Company Use and Unaccounted-for 84 84 85 85 85
Utility Total 5,244 5,240 5,280 5,269 5,275
Non-Utility
Enhanced Oil Recovery/Industrial 492 489 475 475 475
EOR Cogeneration 117 117 117 117 117
Electric Generation 417 379 372 372 372
Non-Utility Served Load (1) 1,026 984 964 964 964
Statewide Requirements Total (3) 6,270 6,224 6,244 6,233 6,239
Notes:
(1) Consists of California production and deliveries by El Paso, Kern/Mojave and TGN pipelines to industrial, EOR
Cogen, EOR steaming and powerplant customers, and gas consumption at Elk Hills powerplant.
Source: CEC staff-provided forecast results from their own model simulations.
(2) Includes utility generation, wholesale generation, and cogeneration.
(3) The difference between California supply sources and California requirements is PG&E's forecast of
off-system deliveries.
STATEWIDE TOTAL SUPPLY SOURCES AND REQUIREMENTS
Cold Temperature and Dry Hydro Year
MMcf/Day
EXECUTIVE SUMMARY
22
Utility 2014 2015 2016 2017 2018
Northern California
California Sources (1) 82 82 82 82 82
Out-of-State 2,609 2,514 2,495 2,557 2,584
Northern California Total 2,691 2,596 2,577 2,639 2,666
Southern California
California Sources (2) 310 310 310 310 310
Out-of-State 2,589 2,577 2,577 2,557 2,560
Southern California Total 2,899 2,887 2,887 2,867 2,870
Utility Total 5,590 5,483 5,465 5,506 5,537
Non-Utility Served Load (3) 1,110 1,098 1,080 1,058 1,047
Statewide Supply Sources Total 6,700 6,581 6,545 6,564 6,583
STATEWIDE TOTAL SUPPLY SOURCES-TAKEN
Cold Temperature and Dry Hydro Year
MMcf/Day
Utility 2019 2020 2025 2030 2035
Northern California
California Sources (1) 82 82 82 82 82
Out-of-State 2,572 2,599 2,627 2,631 2,634
Northern California Total 2,666 2,654 2,681 2,709 2,713
Southern California
California Sources (2) 310 310 310 310 310
Out-of-State 2,547 2,515 2,529 2,512 2,516
Southern California Total 2,857 2,825 2,839 2,822 2,826
Utility Total 5,523 5,480 5,520 5,531 5,539
Non-Utility Served Load (3) 1,026 984 963 963 963
Statewide Supply Sources Total 6,550 6,464 6,482 6,494 6,502
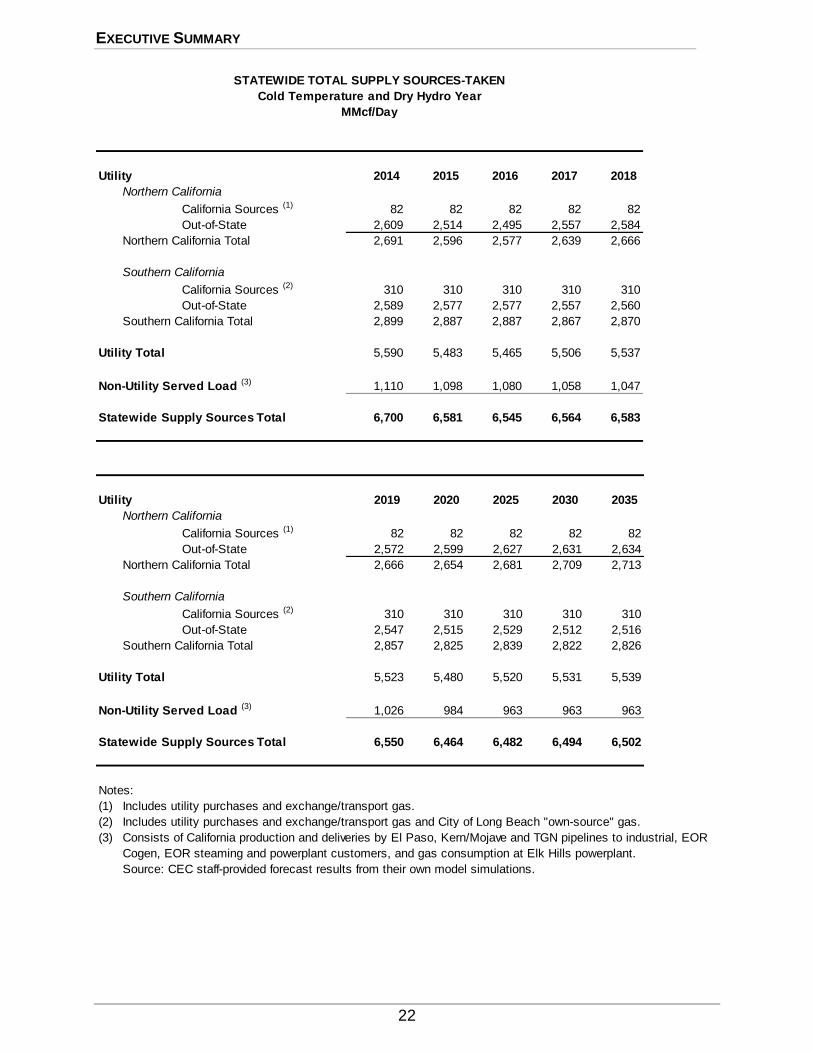
Notes:
(1) Includes utility purchases and exchange/transport gas.
(2) Includes utility purchases and exchange/transport gas and City of Long Beach "own-source" gas.
(3) Consists of California production and deliveries by El Paso, Kern/Mojave and TGN pipelines to industrial, EOR
Cogen, EOR steaming and powerplant customers, and gas consumption at Elk Hills powerplant.
Source: CEC staff-provided forecast results from their own model simulations.
EXECUTIVE SUMMARY
23
2014 2015 2016 2017 2018
Utility
Northern California
Residential 587 590 593 595 597
Commercial - Core 240 242 244 244 245
Natural Gas Vehicles - Core 7 7 7 8 8
Natural Gas Vehicles - Noncore 1 1 1 1 1
Industrial - Noncore 498 492 498 503 507
Wholesale 0 0 0 0 0
SMUD Electric Generation 122 122 122 122 122
Electric Generation (2) 922 828 799 852 872
Exchange (California) 1 1 1 1 1
Company Use and Unaccounted-for 47 46 45 46 47
Northern California Total (3) 2,424 2,329 2,310 2,372 2,399
Southern California
Residential 742 730 723 719 716
Commercial - Core 239 240 241 242 243
Commercial - Noncore 49 47 45 44 42
Natural Gas Vehicles - Core 35 38 40 42 43
Industrial - Core 61 61 61 60 59
Industrial - Noncore 376 379 379 379 377
Wholesale 247 248 249 251 252
SDG&E+Vernon Electric Generation 204 199 208 204 200
Electric Generation (4) 863 857 854 838 848
Enhanced Oil Recovery Steaming 44 52 52 52 52
Company Use and Unaccounted-for 38 37 37 37 37
Southern California Total 2,899 2,887 2,887 2,867 2,870
Utility Total 5,323 5,216 5,198 5,239 5,270
Non-Utility Served Load (5) 1,110 1,098 1,080 1,058 1,047
Statewide Gas Requirements Total (6) 6,433 6,314 6,278 6,297 6,316
Notes:
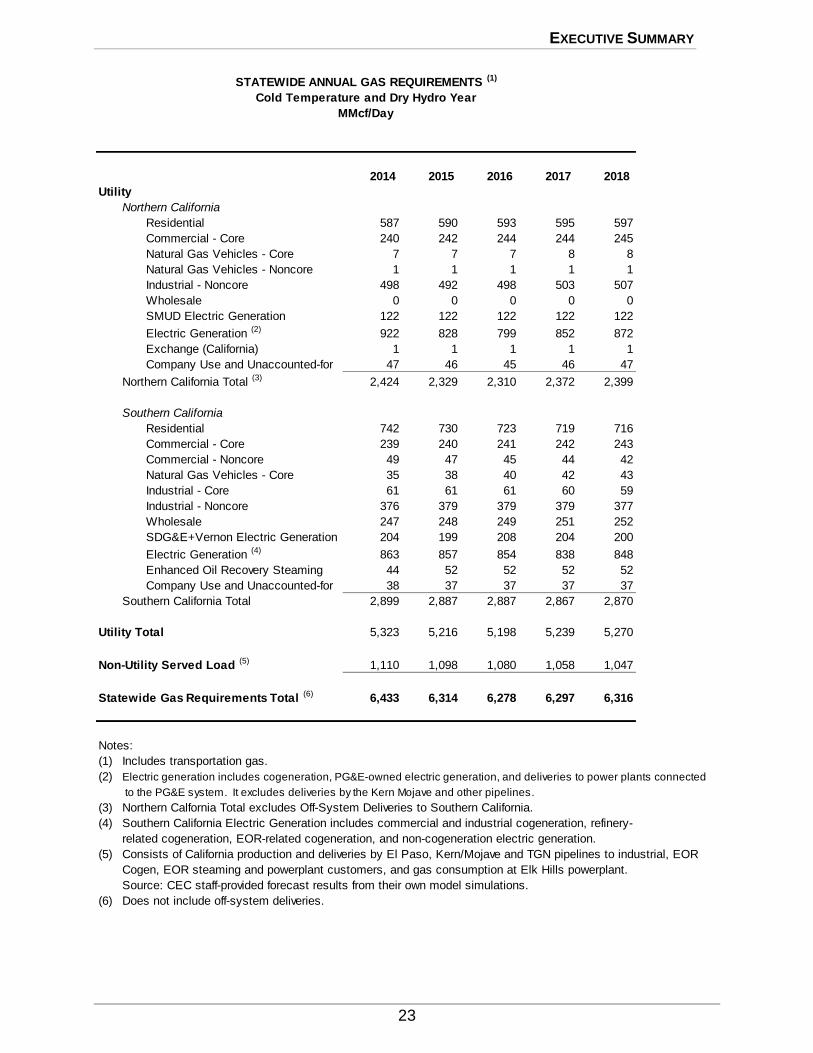
(1) Includes transportation gas.
(2) Electric generation includes cogeneration, PG&E-owned electric generation, and deliveries to power plants connected
to the PG&E system. It excludes deliveries by the Kern Mojave and other pipelines.
(3) Northern Calfornia Total excludes Off-System Deliveries to Southern California.
(4) Southern California Electric Generation includes commercial and industrial cogeneration, refinery-
related cogeneration, EOR-related cogeneration, and non-cogeneration electric generation.
(5) Consists of California production and deliveries by El Paso, Kern/Mojave and TGN pipelines to industrial, EOR
Cogen, EOR steaming and powerplant customers, and gas consumption at Elk Hills powerplant.
Source: CEC staff-provided forecast results from their own model simulations.
(6) Does not include off-system deliveries.
STATEWIDE ANNUAL GAS REQUIREMENTS (1)
Cold Temperature and Dry Hydro Year
MMcf/Day
EXECUTIVE SUMMARY
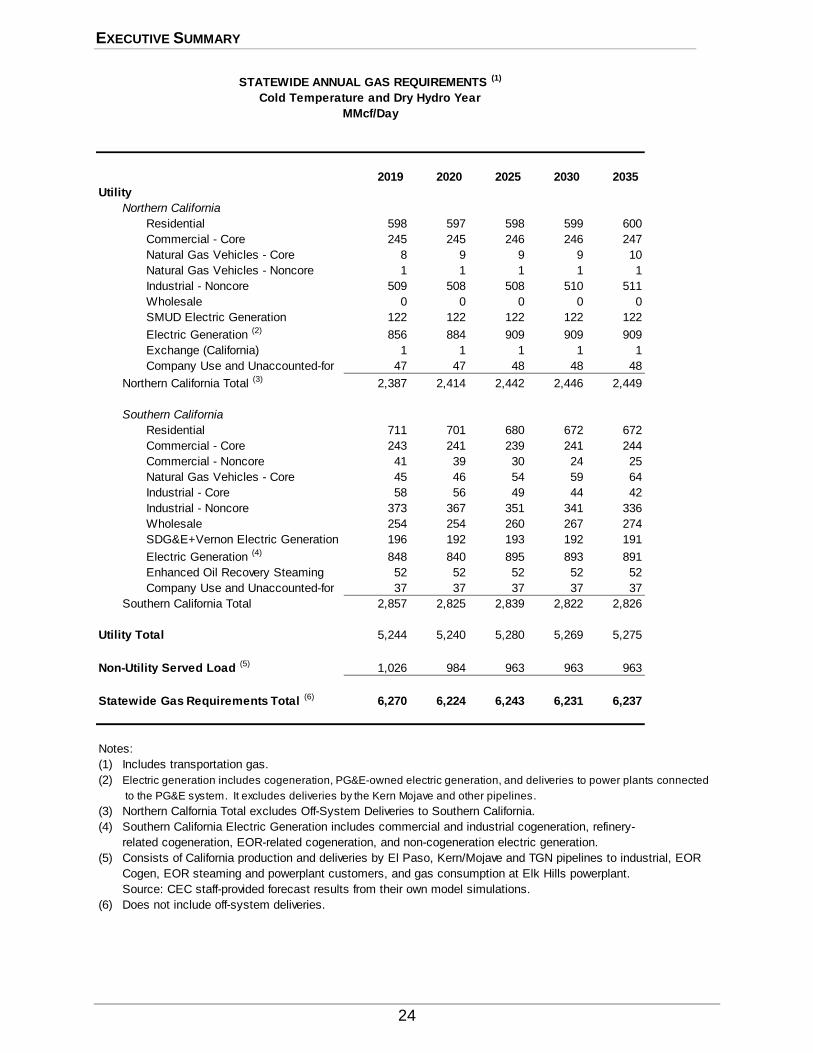
24
2019 2020 2025 2030 2035
Utility
Northern California
Residential 598 597 598 599 600
Commercial - Core 245 245 246 246 247
Natural Gas Vehicles - Core 8 9 9 9 10
Natural Gas Vehicles - Noncore 1 1 1 1 1
Industrial - Noncore 509 508 508 510 511
Wholesale 0 0 0 0 0
SMUD Electric Generation 122 122 122 122 122
Electric Generation (2) 856 884 909 909 909
Exchange (California) 1 1 1 1 1
Company Use and Unaccounted-for 47 47 48 48 48
Northern California Total (3) 2,387 2,414 2,442 2,446 2,449
Southern California
Residential 711 701 680 672 672
Commercial - Core 243 241 239 241 244
Commercial - Noncore 41 39 30 24 25
Natural Gas Vehicles - Core 45 46 54 59 64
Industrial - Core 58 56 49 44 42
Industrial - Noncore 373 367 351 341 336
Wholesale 254 254 260 267 274
SDG&E+Vernon Electric Generation 196 192 193 192 191
Electric Generation (4) 848 840 895 893 891
Enhanced Oil Recovery Steaming 52 52 52 52 52
Company Use and Unaccounted-for 37 37 37 37 37
Southern California Total 2,857 2,825 2,839 2,822 2,826
Utility Total 5,244 5,240 5,280 5,269 5,275
Non-Utility Served Load (5) 1,026 984 963 963 963
Statewide Gas Requirements Total (6) 6,270 6,224 6,243 6,231 6,237
Notes:
(1) Includes transportation gas.
(2) Electric generation includes cogeneration, PG&E-owned electric generation, and deliveries to power plants connected
to the PG&E system. It excludes deliveries by the Kern Mojave and other pipelines.
(3) Northern Calfornia Total excludes Off-System Deliveries to Southern California.
(4) Southern California Electric Generation includes commercial and industrial cogeneration, refinery-
related cogeneration, EOR-related cogeneration, and non-cogeneration electric generation.
(5) Consists of California production and deliveries by El Paso, Kern/Mojave and TGN pipelines to industrial, EOR
Cogen, EOR steaming and powerplant customers, and gas consumption at Elk Hills powerplant.
Source: CEC staff-provided forecast results from their own model simulations.
(6) Does not include off-system deliveries.
STATEWIDE ANNUAL GAS REQUIREMENTS (1)
Cold Temperature and Dry Hydro Year
MMcf/Day
EXECUTIVE SUMMARY
25
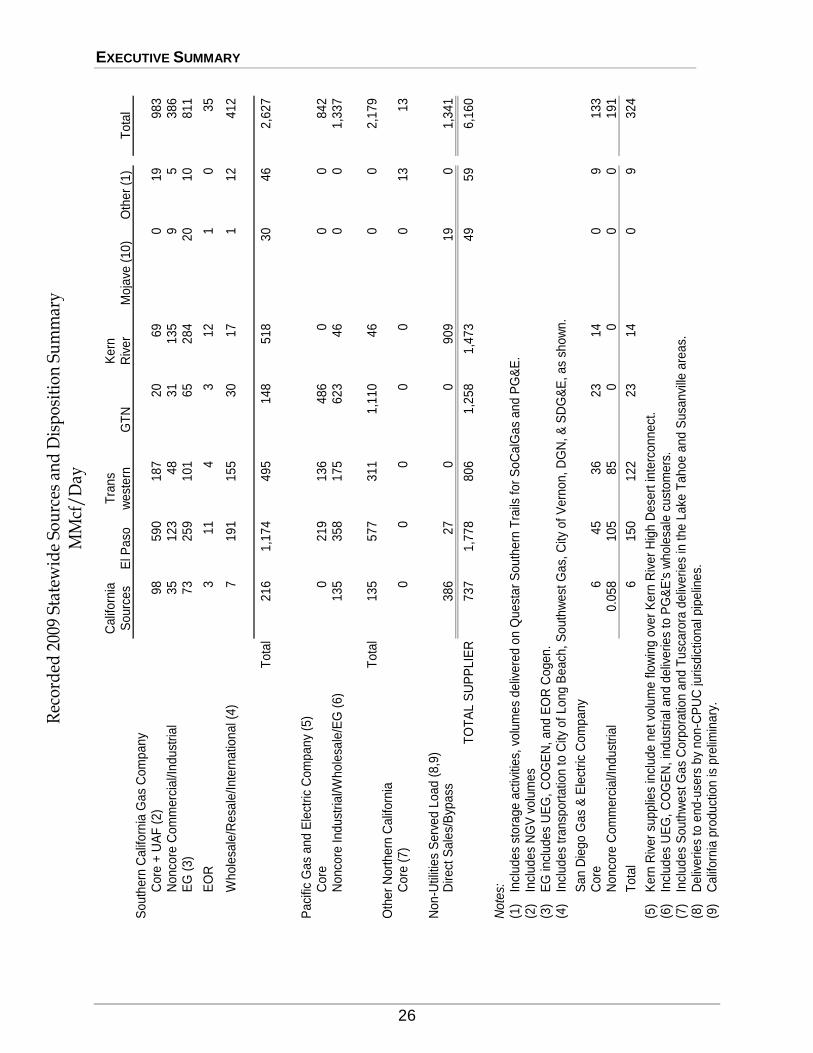
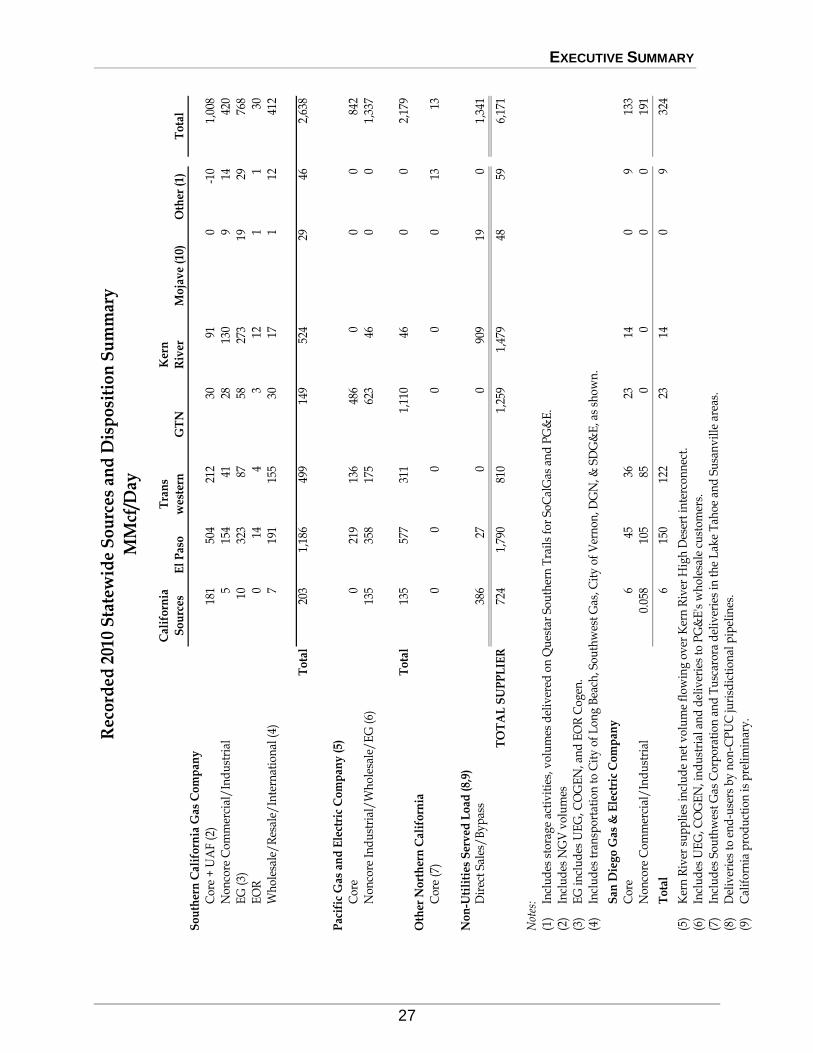
STATEWIDE RECORDED SOURCES AND DISPOSITION
The Statewide Sources and Disposition Summary is intended to complement the existing five-year recorded data tables included in the tabular data sections for each utility.
The information displayed in the following tables shows the composition of supplies
from both out-of-state sources as well as California sources. The data are based on the utilities’ accounting records and on available gas nomination and preliminary gas transaction
information obtained daily from customers or their appointed agents and representatives. It
should be noted that data on daily gas nominations are frequently subject to reconciling adjustments. In addition, some of the data are based on allocations and assignments that, by
necessity, rely on estimated information. These tables have been updated to reflect the most
current information.
Some columns may not sum exactly because of factored allocation and rounding
differences, and do not imply curtailments.
EXECUTIVE SUMMARY
26
Rec
ord
ed 2
009
Stat
ewid
e So
urc
es a
nd
Dis
pos
itio
n S
um
mar
yM
Mcf
/D
ay
Ca
lifo
rnia
Tra
ns
Ke
rnS
ou
rce
sE
l Pa
sow
est
ern
GT
NR
ive
rM
oja
ve (
10
)O
the
r (1
)T
ota
lS
ou
the
rn C
alif
orn
ia G
as
Co
mp
an
yC
ore
+ U
AF
(2
)9
85
90
18
72
06
90
19
98
3N
on
core
Co
mm
erc
ial/I
nd
ust
ria
l3
51
23
48
31
13
59
53
86
EG
(3
)7
32
59
10
16
52
84
20
10
81
1
EO
R3
11
43
12
10
35
Wh
ole
sale
/Re
sale
/In
tern
atio
na
l (4
)7
19
11
55
30
17
11
24
12
To
tal
21
61
,17
44
95
14
85
18
30
46
2,6
27
Pa
cific
Ga
s a
nd
Ele
ctric
Co
mp
an
y (5
)C
ore
02
19
13
64
86
00
08
42
No
nco
re I
nd
ust
ria
l/Wh
ole
sale
/EG
(6
)1
35
35
81
75
62
34
60
01
,33
7
To
tal
13
55
77
31
11
,11
04
60
02
,17
9O
the
r N
ort
he
rn C
alif
orn
iaC
ore
(7
)0
00
00
01
31
3
No
n-U
tiliti
es
Se
rve
d L
oa
d (
8,9
)D
ire
ct S
ale
s/B
ypa
ss3
86
27
00
90
91
90
1,3
41
TO
TA
L S
UP
PL
IER
73
71
,77
88
06
1,2
58
1,4
73
49
59
6,1
60
No
tes:
(1)
Incl
ud
es
sto
rage
act
iviti
es,
vo
lum
es
de
live
red
on
Qu
est
ar
So
uth
ern
Tra
ils f
or
So
Ca
lGa
s a
nd
PG
&E
.(2
)In
clu
de
s N
GV
vo
lum
es
(3)
EG
incl
ud
es
UE
G,
CO
GE
N,
an
d E
OR
Co
ge
n.
(4)
Incl
ud
es
tra
nsp
ort
atio
n t
o C
ity o
f L
on
g B
ea
ch,
So
uth
we
st G
as,
City
of
Ve
rno
n,
DG
N,
& S
DG
&E
, a
s sh
ow
n.
Sa
n D
iego
Ga
s &
Ele
ctric
Co
mp
an
yC
ore
64
53
62
31
40
91
33
No
nco
re C
om
me
rcia
l/In
du
stria
l0
.05
81
05
85
00
00
19
1
To
tal
61
50
12
22
31
40
93
24
(5)
Ke
rn R
ive
r su
pp
lies
incl
ud
e n
et
volu
me
flo
win
g o
ver
Ke
rn R
ive
r H
igh
De
sert
inte
rco
nn
ect
.(6
) In
clu
de
s U
EG
, C
OG
EN
, in
du
stria
l an
d d
eliv
erie
s to
PG
&E
's w
ho
lesa
le c
ust
om
ers
.(7
)In
clu
de
s S
ou
thw
est
Ga
s C
orp
ora
tion
an
d T
usc
aro
ra d
eliv
erie
s in
th
e L
ake
Ta
ho
e a
nd
Su
san
ville
are
as.
(8)
De
live
rie
s to
en
d-u
sers
by
no
n-C
PU
C ju
risd
ictio
na
l pip
elin
es.
(9)
Ca
lifo
rnia
pro
du
ctio
n is
pre
limin
ary
.
EXECUTIVE SUMMARY
27
Rec
ord
ed 2
010
Sta
tew
ide
So
urc
es a
nd
Dis
po
siti
on
Su
mm
ary
MM
cf/D
ay
Cal
ifo
rnia
Tra
ns
Ker
n
So
urc
esE
l P
aso
wes
tern
GT
NR
iver
Mo
jav
e (1
0)O
ther
(1)
To
tal
So
uth
ern
Cal
ifo
rnia
Gas
Co
mp
any
Cor
e +
UA
F (
2)18
150
421
230
910
-10
1,00
8N
onco
re C
omm
erci
al/
Ind
ust
rial
515
441
2813
09
1442
0E
G (
3)10
323
8758
273
1929
768
EO
R0
144
312
11
30W
hol
esal
e/R
esal
e/In
tern
atio
nal
(4)
719
115
530
171
1241
2
To
tal
203
1,18
649
914
952
429
462,
638
Pac
ific
Gas
an
d E
lect
ric
Co
mp
any
(5)
Cor
e0
219
136
486
00
084
2N
onco
re I
nd
ust
rial
/W
hol
esal
e/E
G (
6)13
535
817
562
346
00
1,33
7
To
tal
135
577
311
1,11
046
00
2,17
9O
ther
No
rth
ern
Cal
ifo
rnia
Cor
e (7
)0
00
00
013
13
No
n-U
tili
ties
Ser
ved
Lo
ad (
8,9)
Dir
ect
Sale
s/B
yp
ass
386
270
090
919
01,
341
TO
TA
L S
UP
PL
IER
724
1,79
081
01,
259
1,47
948
596,
171
Not
es:
(1)
Incl
ud
es s
tora
ge
acti
vit
ies,
vol
um
es d
eliv
ered
on
Qu
esta
r So
uth
ern
Tra
ils
for
SoC
alG
as a
nd
PG
&E
.(2
)In
clu
des
NG
V v
olu
mes
(3)
EG
incl
ud
es U
EG
, CO
GE
N, a
nd
EO
R C
ogen
.(4
)In
clu
des
tra
nsp
orta
tion
to
Cit
y o
f L
ong
Bea
ch, S
outh
wes
t G
as, C
ity
of
Ver
non
, DG
N, &
SD
G&
E, a
s sh
own
.
San
Die
go
Gas
& E
lect
ric
Co
mp
any
Cor
e6
4536
2314
09
133
Non
core
Com
mer
cial
/In
du
stri
al0.
058
105
850
00
019
1
To
tal
615
012
223
140
932
4
(5)
Ker
n R
iver
su
pp
lies
incl
ud
e n
et v
olu
me
flow
ing
ov
er K
ern
Riv
er H
igh
Des
ert
inte
rcon
nec
t.(6
) In
clu
des
UE
G, C
OG
EN
, in
du
stri
al a
nd
del
iver
ies
to P
G&
E's
wh
oles
ale
cust
omer
s.(7
)In
clu
des
Sou
thw
est
Gas
Cor
por
atio
n a
nd
Tu
scar
ora
del
iver
ies
in t
he
Lak
e T
ahoe
an
d S
usa
nv
ille
are
as.
(8)
Del
iver
ies
to e
nd
-use
rs b
y n
on-C
PU
C ju
risd
icti
onal
pip
elin
es.
(9)
Cal
ifor
nia
pro
du
ctio
n is
pre
lim
inar
y.
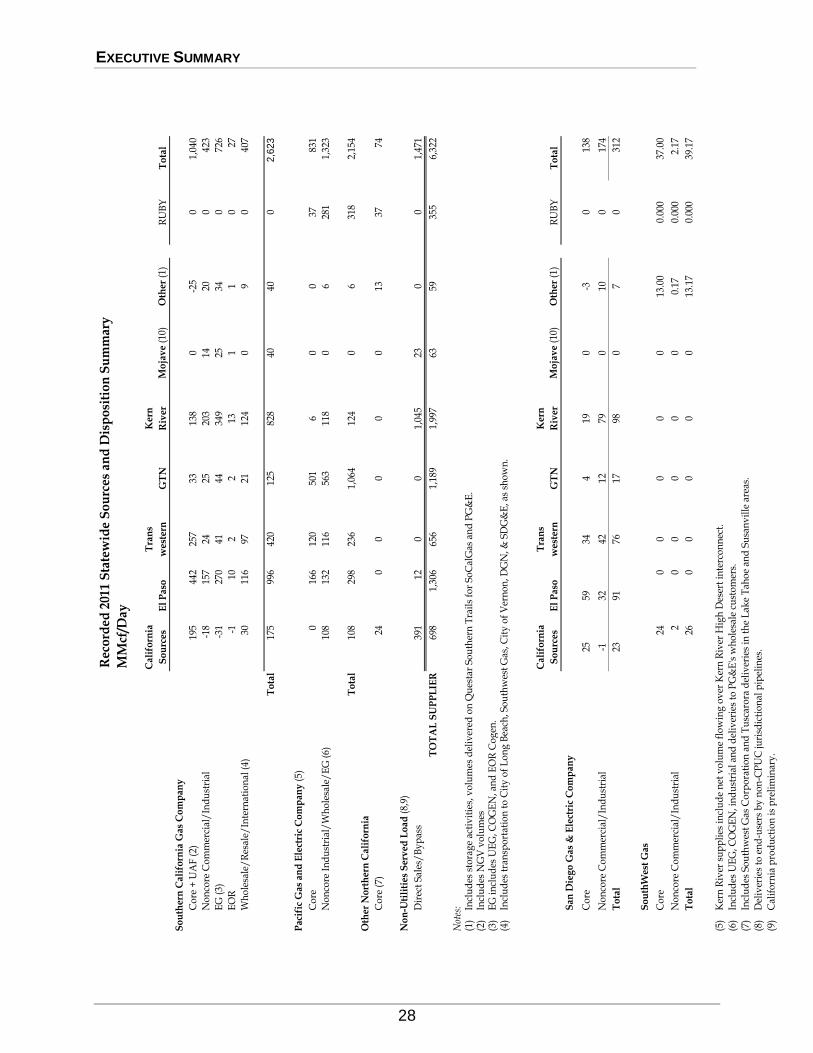
EXECUTIVE SUMMARY
28
R
eco
rded
201
1 S
tate
wid
e S
ou
rces
an
d D
isp
osi
tio
n S
um
mar
y
M
Mcf
/Day
Cal
ifo
rnia
Tra
ns
Ker
n
So
urc
esE
l P
aso
wes
tern
GT
NR
iver
Mo
jav
e (1
0)O
ther
(1)
RU
BY
To
tal
So
uth
ern
Cal
ifo
rnia
Gas
Co
mp
any
Co
re +
UA
F (
2)19
544
225
733
138
0-2
50
1,04
0
No
nco
re C
om
mer
cial
/In
du
stri
al-1
815
724
2520
314
200
423
EG
(3)
-31
270
4144
349
2534
072
6
EO
R-1
102
213
11
027
Wh
ole
sale
/R
esal
e/In
tern
atio
nal
(4)
3011
697
2112
40
90
407
To
tal
175
996
420
125
828
4040
02
,62
3
Pac
ific
Gas
an
d E
lect
ric
Co
mp
any
(5)
Co
re0
166
120
501
60
037
831
No
nco
re I
nd
ust
rial
/W
ho
lesa
le/
EG
(6)
108
132
116
563
118
06
281
1,32
3
To
tal
108
298
236
1,06
412
40
631
82,
154
Oth
er N
ort
her
n C
alif
orn
ia
Co
re (
7)24
00
00
013
3774
No
n-U
tili
ties
Ser
ved
Lo
ad (
8,9)
Dir
ect
Sale
s/B
yp
ass
391
120
01,
045
230
01,
471
TO
TA
L S
UP
PL
IER
698
1,30
665
61,
189
1,99
763
5935
56,
322
Not
es:
(1)
Incl
ud
es s
tora
ge
acti
vit
ies,
vo
lum
es d
eliv
ered
on
Qu
esta
r So
uth
ern
Tra
ils
for
SoC
alG
as a
nd
PG
&E
.(2
)In
clu
des
NG
V v
olu
mes
(3)
EG
in
clu
des
UE
G, C
OG
EN
, an
d E
OR
Co
gen
.(4
)In
clu
des
tra
nsp
ort
atio
n t
o C
ity
of
Lo
ng
Bea
ch, S
ou
thw
est
Gas
, Cit
y o
f V
ern
on
, DG
N, &
SD
G&
E, a
s sh
ow
n.
Cal
ifo
rnia
Tra
ns
Ker
n
So
urc
esE
l P
aso
wes
tern
GT
NR
iver
Mo
jav
e (1
0)O
ther
(1)
RU
BY
To
tal
San
Die
go
Gas
& E
lect
ric
Co
mp
any
Co
re25
5934
419
0-3
013
8
No
nco
re C
om
mer
cial
/In
du
stri
al-1
3242
1279
010
017
4
To
tal
2391
7617
980
70
312
So
uth
Wes
t G
as
Co
re24
00
00
013
.00
0.00
037
.00
No
nco
re C
om
mer
cial
/In
du
stri
al2
00
00
00.
170.
000
2.17
To
tal
260
00
00
13.1
70.
000
39.1
7
(5)
Ker
n R
iver
su
pp
lies
in
clu
de
net
vo
lum
e fl
ow
ing
ov
er K
ern
Riv
er H
igh
Des
ert
inte
rco
nn
ect.
(6)
Incl
ud
es U
EG
, CO
GE
N, i
nd
ust
rial
an
d d
eliv
erie
s to
PG
&E
's w
ho
lesa
le c
ust
om
ers.
(7)
Incl
ud
es S
ou
thw
est
Gas
Co
rpo
rati
on
an
d T
usc
aro
ra d
eliv
erie
s in
th
e L
ake
Tah
oe
and
Su
san
vil
le a
reas
.
(8)
Del
iver
ies
to e
nd
-use
rs b
y n
on
-CP
UC
juri
sdic
tio
nal
pip
elin
es.
(9)
Cal
ifo
rnia
pro
du
ctio
n i
s p
reli
min
ary
.
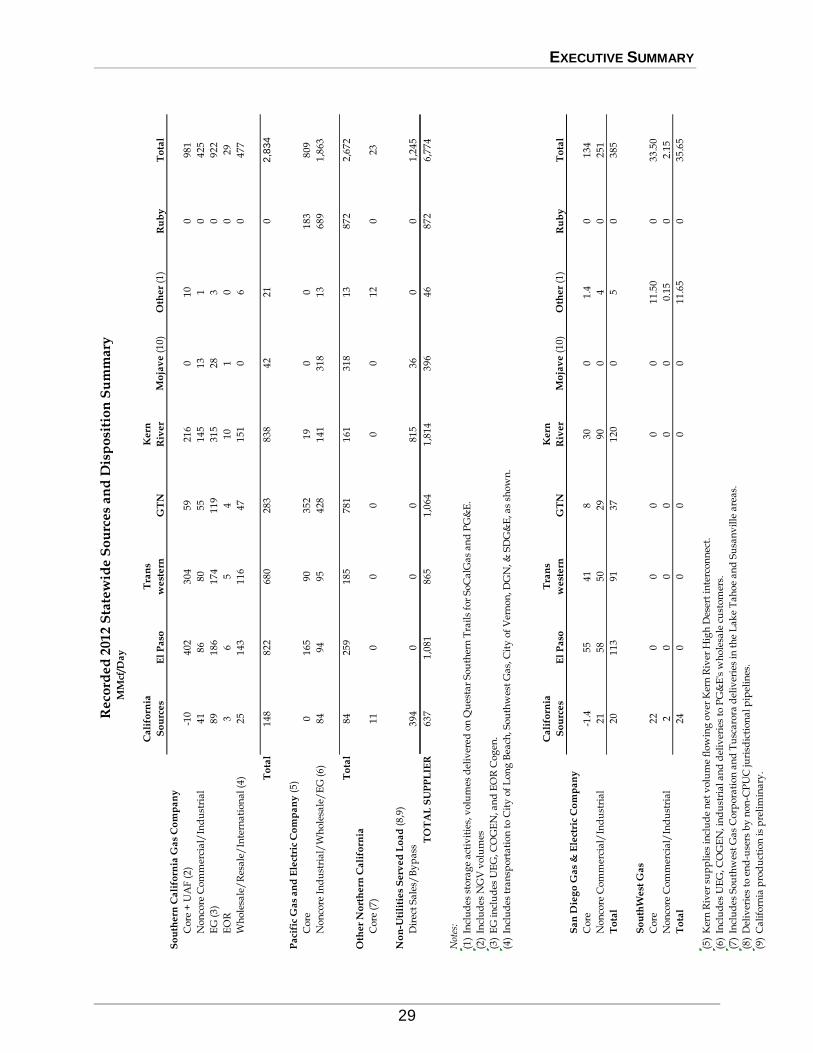
EXECUTIVE SUMMARY
29
Re
cord
ed
20
12
Sta
tew
ide
So
urc
es
an
d D
isp
osi
tio
n S
um
ma
ryM
Mcf
/Da
y
Ca
lifo
rnia
Tra
ns
Ke
rn
So
urc
es
El
Pa
sow
est
ern
GT
NR
ive
rM
oja
ve
(1
0)
Oth
er
(1)
Ru
by
To
tal
So
uth
ern
Ca
lifo
rnia
Ga
s C
om
pa
ny
Co
re +
UA
F (
2)
-10
40
23
04
59
21
60
10
09
81
No
nco
re C
om
mer
cia
l/In
du
stri
al
41
86
80
55
14
51
31
04
25
EG
(3
)8
91
86
17
41
19
31
52
83
09
22
EO
R3
65
41
01
00
29
Wh
ole
sale
/R
esa
le/
Inte
rna
tio
na
l (4
)2
51
43
11
64
71
51
06
04
77
To
tal
14
88
22
68
02
83
83
84
22
10
2,8
34
Pa
cifi
c G
as
an
d E
lect
ric
Co
mp
an
y (
5)
Co
re0
16
59
03
52
19
00
18
38
09
No
nco
re I
nd
ust
ria
l/W
ho
lesa
le/
EG
(6
)8
49
49
54
28
14
13
18
13
68
91
,86
3
To
tal
84
25
91
85
78
11
61
31
81
38
72
2,6
72
Oth
er
No
rth
ern
Ca
lifo
rnia
Co
re (
7)
11
00
00
01
20
23
No
n-U
tili
tie
s S
erv
ed
Lo
ad
(8
,9)
Dir
ect
Sa
les/
By
pa
ss3
94
00
08
15
36
00
1,2
45
TO
TA
L S
UP
PL
IER
63
71
,08
18
65
1,0
64
1,8
14
39
64
68
72
6,7
74
Not
es:
(1)
Incl
ud
es s
tora
ge
act
ivit
ies,
vo
lum
es d
eliv
ered
on
Qu
esta
r S
ou
ther
n T
rail
s fo
r S
oC
alG
as
an
d P
G&
E.
(2)
Incl
ud
es N
GV
vo
lum
es
(3)
EG
in
clu
des
UE
G, C
OG
EN
, an
d E
OR
Co
gen
.
(4)
Incl
ud
es t
ran
spo
rta
tio
n t
o C
ity
of
Lo
ng
Bea
ch, S
ou
thw
est
Ga
s, C
ity
of
Ver
no
n, D
GN
, & S
DG
&E
, as
sho
wn
.
Ca
lifo
rnia
Tra
ns
Ke
rn
So
urc
es
El
Pa
sow
est
ern
GT
NR
ive
rM
oja
ve
(1
0)
Oth
er
(1)
Ru
by
To
tal
Sa
n D
ieg
o G
as
& E
lect
ric
Co
mp
an
y
Co
re-1
.45
54
18
30
01
.40
13
4
No
nco
re C
om
mer
cia
l/In
du
stri
al
21
58
50
29
90
04
02
51
To
tal
20
11
39
13
71
20
05
03
85
So
uth
We
st G
as
Co
re2
20
00
00
11
.50
03
3.5
0
No
nco
re C
om
mer
cia
l/In
du
stri
al
20
00
00
0.1
50
2.1
5
To
tal
24
00
00
01
1.6
50
35
.65
(5)
Ker
n R
iver
su
pp
lies
in
clu
de
net
vo
lum
e fl
ow
ing
ov
er K
ern
Riv
er H
igh
Des
ert
inte
rco
nn
ect.
(6)
Incl
ud
es U
EG
, CO
GE
N, i
nd
ust
ria
l a
nd
del
iver
ies
to P
G&
E's
wh
ole
sale
cu
sto
mer
s.
(7)
Incl
ud
es S
ou
thw
est
Ga
s C
orp
ora
tio
n a
nd
Tu
sca
rora
del
iver
ies
in t
he
La
ke
Ta
ho
e a
nd
Su
san
vil
le a
rea
s.
(8)
Del
iver
ies
to e
nd
-use
rs b
y n
on
-CP
UC
juri
sdic
tio
na
l p
ipel
ines
.
(9)
Ca
lifo
rnia
pro
du
ctio
n i
s p
reli
min
ary
.
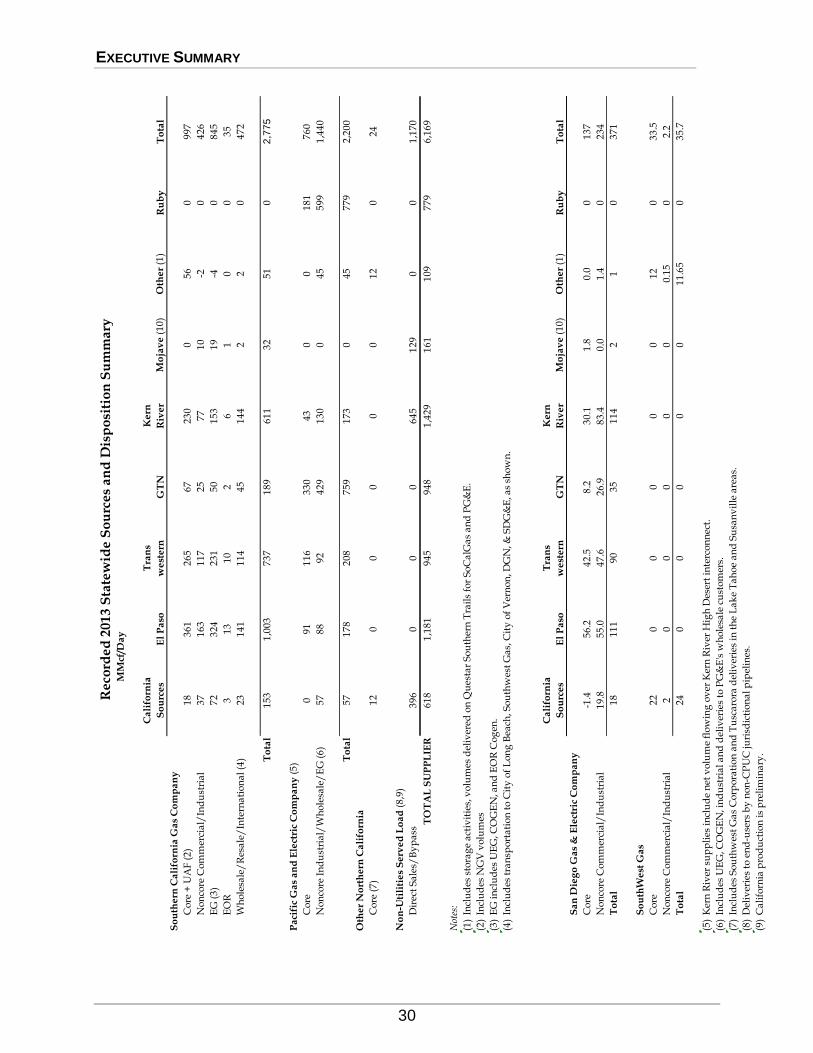
EXECUTIVE SUMMARY
30
R
eco
rde
d 2
01
3 S
tate
wid
e S
ou
rce
s a
nd
Dis
po
siti
on
Su
mm
ary
MM
cf/D
ay
Ca
lifo
rnia
Tra
ns
Ke
rn
So
urc
es
El
Pa
sow
est
ern
GT
NR
ive
rM
oja
ve
(1
0)
Oth
er
(1)
Ru
by
To
tal
So
uth
ern
Ca
lifo
rnia
Ga
s C
om
pa
ny
Co
re +
UA
F (
2)
18
36
12
65
67
23
00
56
09
97
No
nco
re C
om
mer
cia
l/In
du
stri
al
37
16
31
17
25
77
10
-20
42
6
EG
(3
)7
23
24
23
15
01
53
19
-40
84
5
EO
R3
13
10
26
10
03
5
Wh
ole
sale
/R
esa
le/
Inte
rna
tio
na
l (4
)2
31
41
11
44
51
44
22
04
72
To
tal
15
31
,00
37
37
18
96
11
32
51
02
,77
5
Pa
cifi
c G
as
an
d E
lect
ric
Co
mp
an
y (
5)
Co
re0
91
11
63
30
43
00
18
17
60
No
nco
re I
nd
ust
ria
l/W
ho
lesa
le/
EG
(6
)5
78
89
24
29
13
00
45
59
91
,44
0
To
tal
57
17
82
08
75
91
73
04
57
79
2,2
00
Oth
er
No
rth
ern
Ca
lifo
rnia
Co
re (
7)
12
00
00
01
20
24
No
n-U
tili
tie
s S
erv
ed
Lo
ad
(8
,9)
Dir
ect
Sa
les/
By
pa
ss3
96
00
06
45
12
90
01
,17
0
TO
TA
L S
UP
PL
IER
61
81
,18
19
45
94
81
,42
91
61
10
97
79
6,1
69
Not
es:
(1)
Incl
ud
es s
tora
ge
act
ivit
ies,
vo
lum
es d
eliv
ered
on
Qu
esta
r S
ou
ther
n T
rail
s fo
r S
oC
alG
as
an
d P
G&
E.
(2)
Incl
ud
es N
GV
vo
lum
es
(3)
EG
in
clu
des
UE
G, C
OG
EN
, an
d E
OR
Co
gen
.
(4)
Incl
ud
es t
ran
spo
rta
tio
n t
o C
ity
of
Lo
ng
Bea
ch, S
ou
thw
est
Ga
s, C
ity
of
Ver
no
n, D
GN
, & S
DG
&E
, as
sho
wn
.
Ca
lifo
rnia
Tra
ns
Ke
rn
So
urc
es
El
Pa
sow
est
ern
GT
NR
ive
rM
oja
ve
(1
0)
Oth
er
(1)
Ru
by
To
tal
Sa
n D
ieg
o G
as
& E
lect
ric
Co
mp
an
y
Co
re-1
.45
6.2
42
.58
.23
0.1
1.8
0.0
01
37
No
nco
re C
om
mer
cia
l/In
du
stri
al
19
.85
5.0
47
.62
6.9
83
.40
.01
.40
23
4
To
tal
18
11
19
03
51
14
21
03
71
So
uth
We
st G
as
Co
re2
20
00
00
12
03
3.5
No
nco
re C
om
mer
cia
l/In
du
stri
al
20
00
00
0.1
50
2.2
To
tal
24
00
00
01
1.6
50
35
.7
(5)
Ker
n R
iver
su
pp
lies
in
clu
de
net
vo
lum
e fl
ow
ing
ov
er K
ern
Riv
er H
igh
Des
ert
inte
rco
nn
ect.
(6)
Incl
ud
es U
EG
, CO
GE
N, i
nd
ust
ria
l a
nd
del
iver
ies
to P
G&
E's
wh
ole
sale
cu
sto
mer
s.
(7)
Incl
ud
es S
ou
thw
est
Ga
s C
orp
ora
tio
n a
nd
Tu
sca
rora
del
iver
ies
in t
he
La
ke
Ta
ho
e a
nd
Su
san
vil
le a
rea
s.
(8)
Del
iver
ies
to e
nd
-use
rs b
y n
on
-CP
UC
juri
sdic
tio
na
l p
ipel
ines
.
(9)
Ca
lifo
rnia
pro
du
ctio
n i
s p
reli
min
ary
.
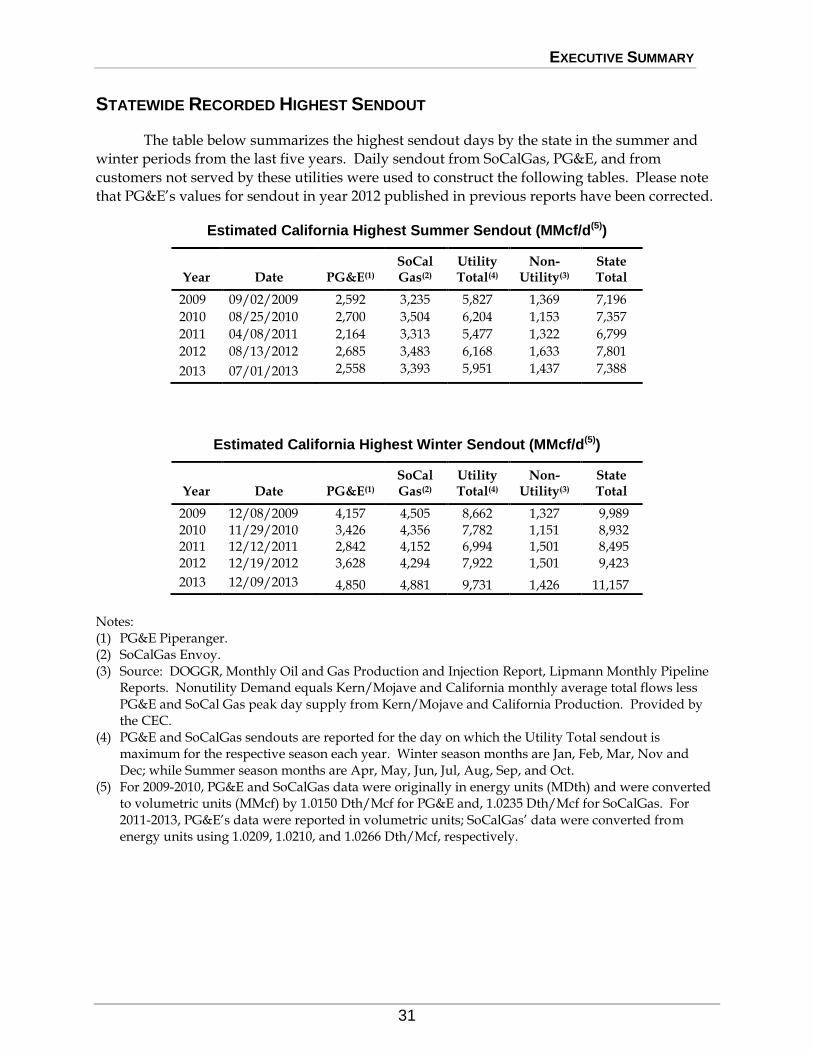
EXECUTIVE SUMMARY
31
STATEWIDE RECORDED HIGHEST SENDOUT
The table below summarizes the highest sendout days by the state in the summer and winter periods from the last five years. Daily sendout from SoCalGas, PG&E, and from
customers not served by these utilities were used to construct the following tables. Please note
that PG&E’s values for sendout in year 2012 published in previous reports have been corrected.
Estimated California Highest Summer Sendout (MMcf/d(5))
Year Date PG&E(1) SoCal Gas(2)
Utility Total(4)
Non-Utility(3)
State Total
2009 09/02/2009 2,592 3,235 5,827 1,369 7,196
2010 08/25/2010 2,700 3,504 6,204 1,153 7,357
2011 04/08/2011 2,164 3,313 5,477 1,322 6,799
2012 08/13/2012 2,685 3,483 6,168 1,633 7,801
2013 07/01/2013 2,558 3,393 5,951 1,437 7,388
Estimated California Highest Winter Sendout (MMcf/d(5))
Year Date PG&E(1) SoCal Gas(2)
Utility Total(4)
Non-Utility(3)
State Total
2009 12/08/2009 4,157 4,505 8,662 1,327 9,989 2010 11/29/2010 3,426 4,356 7,782 1,151 8,932 2011 12/12/2011 2,842 4,152 6,994 1,501 8,495 2012 12/19/2012 3,628 4,294 7,922 1,501 9,423
2013 12/09/2013 4,850 4,881 9,731 1,426 11,157
Notes: (1) PG&E Piperanger. (2) SoCalGas Envoy. (3) Source: DOGGR, Monthly Oil and Gas Production and Injection Report, Lipmann Monthly Pipeline
Reports. Nonutility Demand equals Kern/Mojave and California monthly average total flows less PG&E and SoCal Gas peak day supply from Kern/Mojave and California Production. Provided by the CEC.
(4) PG&E and SoCalGas sendouts are reported for the day on which the Utility Total sendout is maximum for the respective season each year. Winter season months are Jan, Feb, Mar, Nov and Dec; while Summer season months are Apr, May, Jun, Jul, Aug, Sep, and Oct.
(5) For 2009-2010, PG&E and SoCalGas data were originally in energy units (MDth) and were converted to volumetric units (MMcf) by 1.0150 Dth/Mcf for PG&E and, 1.0235 Dth/Mcf for SoCalGas. For 2011-2013, PG&E’s data were reported in volumetric units; SoCalGas’ data were converted from energy units using 1.0209, 1.0210, and 1.0266 Dth/Mcf, respectively.
NORTHERN CALIFORNIA
32
2 0 1 4 C A L I F O R N I A G A S R E P O R T
NORTHERN CALIFORNIA
NORTHERN CALIFORNIA
33
INTRODUCTION
Pacific Gas and Electric Company provides natural gas procurement, transportation, and storage services to 4.2 million residential customers and over 225,000 businesses in northern
and central California. In addition to serving residential, commercial, and industrial markets,
PG&E provides gas transportation and storage services to a variety of gas-fired electric generation plants in its service area. Other wholesale distribution systems, which receive gas
transportation service from PG&E, serve a small portion of the gas customers in the region.
PG&E's customers are located in 37 counties from south of Bakersfield to north of Redding, with high concentrations in the San Francisco Bay Area and the Sacramento and San Joaquin
valleys. In addition, some customers also utilize the PG&E system to meet their gas needs in
southern California.
The northern California section of the report begins with an overview of the gas demand
forecast followed by a discussion of the forecast methodology, economic conditions, and other
factors affecting demand in various markets, including the regulatory environment. Following the gas demand forecast are discussions of gas supply and pipeline capacity. Abnormal peak
day demands and supply resources, as well as gas balances, are discussed at the end of this
section.
The forecast in this report covers the years 2014 through 2035. However, as a matter of
convenience, the tabular data at the end of the section show only the years 2014 through 2020,
and the years 2025, 2030, and 2035.
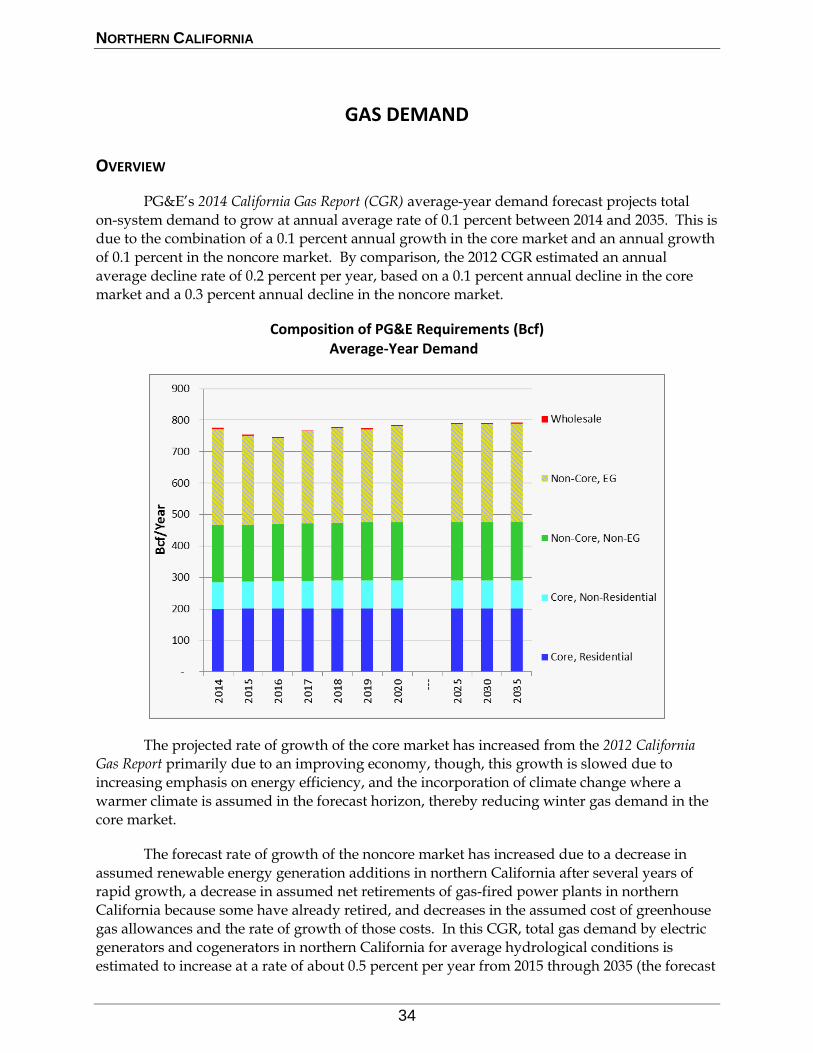
NORTHERN CALIFORNIA
34
GAS DEMAND
OVERVIEW
PG&E’s 2014 California Gas Report (CGR) average-year demand forecast projects total
on-system demand to grow at annual average rate of 0.1 percent between 2014 and 2035. This is due to the combination of a 0.1 percent annual growth in the core market and an annual growth
of 0.1 percent in the noncore market. By comparison, the 2012 CGR estimated an annual
average decline rate of 0.2 percent per year, based on a 0.1 percent annual decline in the core market and a 0.3 percent annual decline in the noncore market.
Composition of PG&E Requirements (Bcf) Average-Year Demand
The projected rate of growth of the core market has increased from the 2012 California
Gas Report primarily due to an improving economy, though, this growth is slowed due to
increasing emphasis on energy efficiency, and the incorporation of climate change where a
warmer climate is assumed in the forecast horizon, thereby reducing winter gas demand in the core market.
The forecast rate of growth of the noncore market has increased due to a decrease in
assumed renewable energy generation additions in northern California after several years of rapid growth, a decrease in assumed net retirements of gas-fired power plants in northern
California because some have already retired, and decreases in the assumed cost of greenhouse
gas allowances and the rate of growth of those costs. In this CGR, total gas demand by electric generators and cogenerators in northern California for average hydrological conditions is
estimated to increase at a rate of about 0.5 percent per year from 2015 through 2035 (the forecast
NORTHERN CALIFORNIA
35
for 2014 includes actual demand for the first quarter, which was affected by drought conditions
in California). This total gas demand excludes gas delivered by nonutility pipelines to electric
generators and cogenerators in PG&E’s service area, such as deliveries by the Kern/Mojave
pipelines to the La Paloma and Sunrise plants in central California. In addition, increasing
quantities of renewable energy generation are expected to increase the need for load following and ancillary services such as regulation. These ancillary services are likely to be provided by
gas-fired power plants, thus, affecting gas demand to some extent. PG&E’s 2014 CGR forecast,
however, does not capture this impact.
FORECAST METHOD
PG&E’s gas demand forecasts for the residential, commercial, and industrial sectors are
developed using econometric models. Forecasts for other sectors (NGV, wholesale) are developed based on market information. Forecasts of gas demand by power plants are
developed based on modeling of the electricity market in the Western Electricity Coordinating
Council using the MarketBuilder model. While variation in short-term gas use depends mainly on prevailing weather conditions, longer-term trends in gas demand are driven primarily by
changes in customer usage patterns influenced by underlying economic, demographic, and
technological changes, such as growth in population and employment, changes in prevailing prices, growth in electricity demand and in electric generation by renewables, changes in the
efficiency profiles of residential and commercial buildings and the appliances within them, and
the response to climate change.
FORECAST SCENARIOS
The average-year gas demand forecast presented here is a reasonable projection for an
uncertain future. However, a point forecast cannot capture the uncertainty in the major determinants of gas demand (e.g., weather, economic activity, appliance saturation, and
efficiencies). To give some flavor of the possible variation in gas demand, PG&E has developed
an alternative forecast of gas demand under assumed high-demand conditions.
For the high-demand scenario, PG&E relied on a weather vintage approach by
considering a year with cold temperatures and dry hydro conditions. Assuming the
demographic conditions and infrastructure likely to exist in each forecast year, PG&E forecasts total gas demand with the weather conditions set to match the conditions that have an
approximately 1-in-10 likelihood of occurrence. PG&E used the weather conditions from
November 1988 through October 1989, as the winter of 1988-1989 was colder than normal, and this time period was dry in both northern California and the Pacific Northwest.
Temperature Assumptions
Because space heating accounts for a high percentage of use, gas requirements for PG&E’s residential and commercial customers are sensitive to prevailing temperature
conditions. In previous CGRs, PG&E’s average-year demand forecast assumed that
temperatures in the forecast period would be equivalent to the average of observed temperatures during the past twenty years. PG&E is now building into its forecast an
assumption of climate change. The climate change scenario is developed from work done at the

NORTHERN CALIFORNIA
36
National Center for Atmospheric Research (Boulder, Colorado), downscaled to the PG&E
service area. Although the near-term temperatures of this scenario differ little from long-term
averages, the years beyond 2015 begin to show the effects of a warming climate. For example,
in 2020, total December/January heating degree days are only 2 percent below the 20-year
average. By 2035, however, the impact is more significant, with the difference at 7 percent.
Of course, actual temperatures in the forecast period will be higher or lower than those
assumed in the climate-change scenario and gas use will vary accordingly. PG&E’s
high-demand forecast assumes that winter temperatures in the forecast horizon will be the same as those that prevailed during November 1988-October 1989.
Seasonal variations in temperature have relatively little effect on power plant gas
demand and, consequently, PG&E’s forecasts of power plant gas demand for average and high demand are both based on average temperatures. (Each summer typically contains a few heat
waves with temperatures 10º or 15º Fahrenheit above normal, which lead to peak electricity
demands and drive up power plant gas demand; however, on a seasonal basis, temperatures seldom deviate more than 2º Fahrenheit from average.)
Hydro Conditions
In contrast to temperature deviations, annual water runoff for hydroelectric plants has varied by 50% above and below the long-term annual average. The impact of dry conditions
was demonstrated during the drought and electricity crisis in 2001 (October 2000 through
September 2001). For the 2014 CGR’s high-demand scenario, as noted above, PG&E used the 1988-1989 conditions.
Gas Price and Rate Assumptions
Inputs for gas prices and rate assumptions are very important for forecasting gas demand; this is especially true for market sectors that are particularly price sensitive, such as
industrial or electric generation. PG&E utilized the gas commodity price forecast described in
detail in the Southern California section on page 87. PG&E currently has two rate cases outstanding that will significantly affect gas transmission and distribution rates, the 2014
General Rate Case and the 2015 Gas Transmission and Storage Rate Case. Because of the
uncertainty in the outcome of these cases, PG&E has elected to hold transmission and distribution rates constant at their 2014 levels.
MARKET SECTORS
Residential
Households in the PG&E service area are forecast to grow 0.8 percent annually from
2015 to 2035. However, gas use per household has been dropping in recent years due to
improvements in appliance and building-shell efficiencies. This decline accelerated sharply in 2001 when gas prices spiked, causing temperature-adjusted residential gas demand to plunge
by more than 8 percent. After recovering somewhat in 2002 and 2003, temperature-adjusted gas
use per household reverted to its long-term trend and, despite slight upticks in 2009 and 2011 due to cold winters, has fallen on average 2 percent per year since 2004. Total residential

NORTHERN CALIFORNIA
37
demand is expected to remain flat despite household growth due to continuing upgrades in
appliance and building efficiencies, as well as warming temperatures.
Commercial
The number of commercial customers in the PG&E service area is projected to grow on
average by 0.5 percent per year from 2015 to 2035. The 2000-2001 noncore-to-core migration wave has caused this class to be less temperature sensitive than it had previously been, and has
also tended to stunt overall growth in both customer base and gas use per customer. Gas use
per commercial customer is projected to decline slightly over the forecast horizon due to continuing energy efficiency efforts as well as warmer temperatures. Over the next 20 years
commercial sales are expected to grow at 0.1 percent per year.
Industrial
Gas requirements for PG&E’s industrial sector are affected by the level and type of
industrial activity in the service area and changes in industrial processes. Gas demand from
this sector plummeted by close to 20 percent in 2001 due to a combination of increasing gas prices, noncore-to-core migration, and a manufacturing sector mired in a severe downturn.
After a slight recovery in 2002, demand from this sector fell another 6 percent in 2003 but has
seen slow growth in the recent past due to very low natural gas prices and increased capacity at local refineries, though these effects have been tempered by the continuing structural change in
California’s manufacturing sector. PG&E observed historically high demand from the
industrial sector in 2012 and 2013 due in part to refinery demand. While the industrial sector has the potential for high year-to-year variability, over the long term, industrial gas
consumption is expected to grow slowly at 0.2 percent annually over the next 20 years.
Electric Generation
This sector includes cogeneration and power plants. Forecasts for this sector are subject
to greater uncertainty due to the retirement of existing power plants with once-through cooling;
the timing, location, and type of new generation, particularly renewable-energy facilities; construction of new electric transmission lines; and the impact of greenhouse gas policies and
regulations on both generation and load. Because of these uncertainties, the forecast is held
constant at 2025 levels for 2030 and 2035.
PG&E forecasts gas demand for most cogenerators by assuming a continuation of past
usage, with modifications for expected expansions or closures. In this CGR, PG&E has assumed
no additions of new onsite and export (demand- and supply-side) combined heat-and-power
plants. Operations at most cogeneration plants are not strongly affected by prices in the
wholesale electricity market, because electricity is generated with some other product, usually
steam, for an industrial process.
PG&E forecasts gas demand by power plants and market-sensitive cogenerators using
the MarketBuilder model. MarketBuilder is an economic-equilibrium model that has been
applied to various markets with geographically distributed supplies and demands, such as the North American natural gas market. PG&E uses MarketBuilder to model the electricity market
NORTHERN CALIFORNIA
38
in the Western Electricity Coordinating Council, which encompasses the electric systems from
Denver to the Pacific coast and from northern Mexico to British Columbia and Alberta.
PG&E’s forecast for 2014-2035 uses the mid-case electricity demand forecast from the
California Energy Commission’s 2013 Integrated Energy Policy Report. The forecast assumes that
renewable energy generation will provide 25% of the state’s retail sales by 2016 and 33% by 2020. PG&E assumed that gas-fired plants that employ once-through cooling will retire by the
compliance date set by the State Water Resources Control Board (with some exceptions where
the plant owner has proposed a different date), generally replaced by new gas-fired plants with comparable capacities.
SMUD Electric Generation
The Sacramento Municipal Utility District (SMUD) is the sixth largest community
owned municipal utility in the United States, and provides electric service to over
575,000 customers within the greater Sacramento area. SMUD operates three cogeneration
plants, a gas-fired combined-cycle plant, and a peaking turbine with a total capacity of approximately 1,000 MW. The peak gas load of these units is approximately 158 MMcf/day,
and the average load is about 122 MMcf/day.
SMUD owns and operates a pipeline connecting the Cosumnes combined-cycle plant and the three cogeneration plants to PG&E’s backbone system near Winters, California. SMUD
owns an equity interest of approximately 3.6 percent in PG&E’s Line 300 and approximately
4.2 percent in Line 401 representing about 87 MMcf/day of capacity.
GREENHOUSE GAS LEGISLATION/AB32
During the forecast horizon covered by this CGR, there are many uncertainties that may
significantly impact the future trajectory of natural gas demand. It is unclear at this time what the ultimate effect on natural gas demand will be from California's landmark California Global
Warming Solutions Act of 2006 (Assembly Bill 32, or AB32). On the one hand, more aggressive
energy efficiency programs and/or increased targets for renewable electricity supplies could significantly reduce the use of natural gas by residential and commercial customers and power
plants. On the other hand, increased penetration of electric and natural gas vehicles could
reduce gasoline use and overall greenhouse gas (GHG) emissions, but increase consumption of natural gas.
PG&E will continue to minimize GHG emissions by aggressively pursuing both demand
side reductions and acquisition of preferred resources, which produce little or no carbon
emissions.
RENEWABLE ELECTRIC GENERATION
PG&E expects the growth of renewable electric generation will result in higher daily and hourly deviations between forecast and actual generation from natural gas-fueled electric
resources. In addition, the intermittent nature of some renewable generation (e.g., wind or solar
power) is likely to cause the electric system to rely more heavily on natural gas-fired electric generation to cover forecast deviations and intra-day and intra-hour variability of intermittent
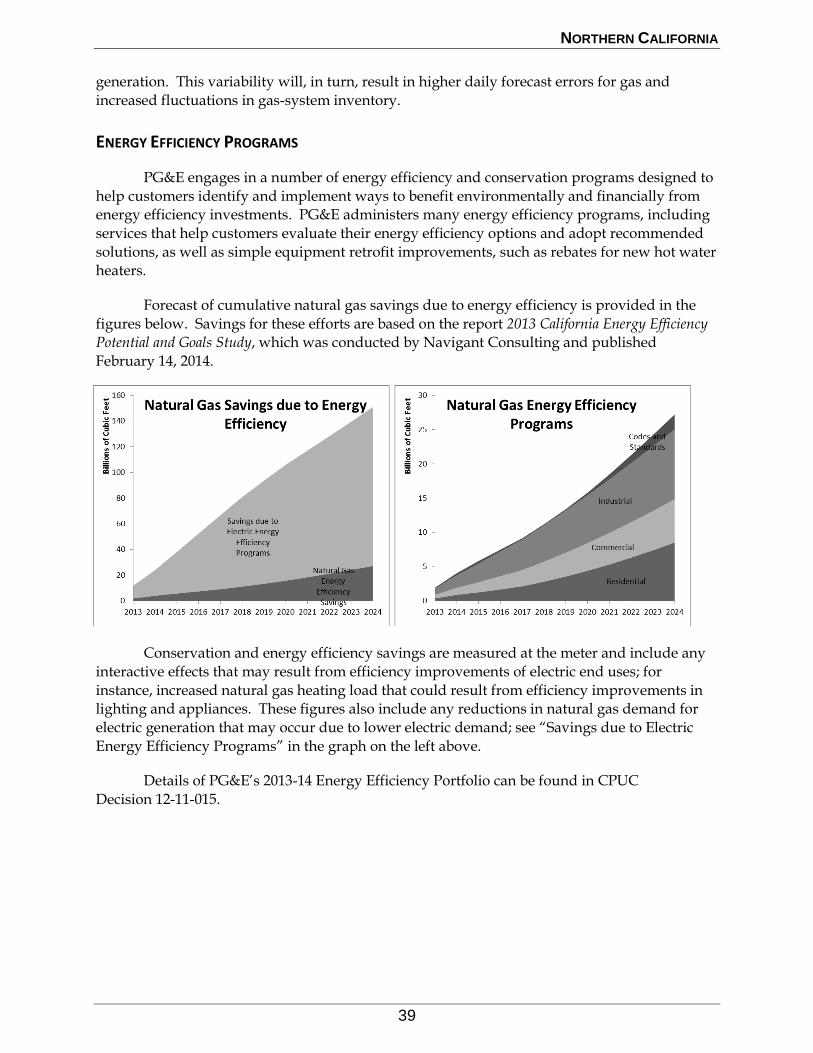
NORTHERN CALIFORNIA
39
generation. This variability will, in turn, result in higher daily forecast errors for gas and
increased fluctuations in gas-system inventory.
ENERGY EFFICIENCY PROGRAMS
PG&E engages in a number of energy efficiency and conservation programs designed to
help customers identify and implement ways to benefit environmentally and financially from energy efficiency investments. PG&E administers many energy efficiency programs, including
services that help customers evaluate their energy efficiency options and adopt recommended
solutions, as well as simple equipment retrofit improvements, such as rebates for new hot water heaters.
Forecast of cumulative natural gas savings due to energy efficiency is provided in the
figures below. Savings for these efforts are based on the report 2013 California Energy Efficiency
Potential and Goals Study, which was conducted by Navigant Consulting and published
February 14, 2014.
Conservation and energy efficiency savings are measured at the meter and include any
interactive effects that may result from efficiency improvements of electric end uses; for
instance, increased natural gas heating load that could result from efficiency improvements in lighting and appliances. These figures also include any reductions in natural gas demand for
electric generation that may occur due to lower electric demand; see “Savings due to Electric
Energy Efficiency Programs” in the graph on the left above.
Details of PG&E’s 2013-14 Energy Efficiency Portfolio can be found in CPUC
Decision 12-11-015.
NORTHERN CALIFORNIA
40
GAS SUPPLY, CAPACITY, AND STORAGE
OVERVIEW
Competition for gas supply, market share, and transportation access has increased
significantly since the late 1990s. Implementation of PG&E’s Gas Accord in March 1998 and the
addition of interstate pipeline capacity and storage capacity have provided all customers with direct access to gas supplies, intra- and inter-state transportation, and related services.
Almost all of PG&E’s noncore customers buy all or most of their gas supply needs
directly from the market. They use PG&E’s transportation and storage services to meet their gas supply needs.
Overall, most of the gas supplies that serve PG&E customers are sourced from out of
state with only a small portion originating in California. This is due to the increasing gas demand in California over the years and the limited amount of native California supply
available.
GAS SUPPLY
California-Sourced Gas
Northern California-sourced gas supplies come primarily from gas fields in the
Sacramento Valley. In 2013, PG&E’s customers obtained on average 57 MMcf/day of
California-sourced gas.
U.S. Southwest Gas
PG&E’s customers have access to three major U.S. Southwest gas producing basins—Permian, San Juan, and Anadarko—via the El Paso, Southern Trails, and Transwestern pipeline
systems.
PG&E’s customers can purchase gas in the producing basins and transport it to California via interstate pipelines. They can also purchase gas at the California-Arizona border
or at the PG&E Citygate from marketers who hold inter- or intra-state pipeline capacity.
Canadian Gas
PG&E’s customers can purchase gas from various suppliers in western Canada (British
Columbia and Alberta) and transport it to California primarily through the Gas Transmission
Northwest Pipeline. Likewise, they can also purchase these supplies at the California-Oregon border or at the PG&E Citygate from marketers who hold inter- or intra-state pipeline capacity.
NORTHERN CALIFORNIA
41
Rocky Mountain Gas
PG&E’s customers have access to gas supplies from the Rocky Mountain area via the Kern River Pipeline, the Ruby Pipeline and via the Gas Transmission Northwest Pipeline
interconnect at Stanfield, Oregon. The Ruby Pipeline came online in July 2011 and brings up to
1.5 Bcf/day of Rocky Mountain gas to Malin, Oregon. With Ruby pipeline, the share of Canadian gas to PG&E’s system has been reduced somewhat while the Redwood path from
Malin to PG&E Citygate has run at a higher utilization rate.
Storage
In addition to storage services offered by PG&E, there are four other storage providers
in northern California—Wild Goose Storage, Inc., Gill Ranch Storage, LLC; Central Valley Gas
Storage, LLC; and Lodi Gas Storage, LLC. As of 2013, these facilities had total working gas
capacity of roughly 240 billion cubic feet and peak withdrawal capacity of 4.8 billion cubic feet
per day.
INTERSTATE PIPELINE CAPACITY
As a result of pipeline expansion and new projects, California utilities and end-users
benefit from improved access to supply basins and enhanced gas-on-gas and
pipeline-to-pipeline competition. Interstate pipelines serving northern and central California include the El Paso, Mojave, Transwestern, Gas Transmission Northwest, Paiute Pipeline
Company, Ruby, Southern Trails, and Kern River pipelines. These pipelines provide northern
and central California with access to gas producing regions in the U.S. Southwest and Rocky Mountain areas, and in western Canada.
U.S. Southwest and Rocky Mountains
PG&E’s Baja Path (Line 300) is connected to U.S. Southwest and Rocky Mountain pipeline systems (Transwestern, El Paso, Southern Trails, and Kern River) at and west of
Topock, Arizona. The Baja Path has a firm capacity of 1,010 MMcf/day.
Canada and Rocky Mountains
PG&E’s Redwood Path (Lines 400/401) is connected to Gas Transmission Northwest
and Ruby at Malin, Oregon. The Redwood Path has a firm capacity of 2,038 MMcf/day.
GAS SUPPLIES AND INFRASTRUCTURE PROJECTS
PG&E anticipates that sufficient supplies will be available from a variety of sources at
market-competitive prices to meet existing and projected market demands in its service area.
The new supplies could be delivered through a variety of sources, including new interstate pipeline facilities and expansion of PG&E’s existing transmission facilities, or PG&E’s or others’
storage facilities.

NORTHERN CALIFORNIA
42
The growth of gas production in the Midcontinent and eastern shale plays (e.g., Barnett
in northeast Texas, Marcellus in Pennsylvania) have had the effect of pushing larger volumes of
Canadian, Rockies, San Juan, and Permian supplies to California, as those supplies are crowded
out of markets to the east.
LNG Imports/Exports
U.S. imports of liquefied natural gas (LNG) have been declining since 2008. Continued
success in developing low-cost domestic shale gas supplies has largely eliminated the need for
LNG imports and positioned the United States as a net exporter of LNG Exports of LNG from the contiguous U.S. are projected to start in 2016.
There are numerous proposed projects to export LNG to world markets. Many of the
projects are “brownfield”, using existing U.S. import terminals to export LNG, but some are
“greenfield”. The “greenfield” LNG export projects targeting the Asian gas market are mostly
in the U.S. West Coast and western Canada. More than 30 Bcf/day of LNG project applications
are in line for approval by the U.S. federal government.
The U.S. Department of Energy (DOE) evaluates the impact of LNG projects proposing
to export LNG to countries without a Free Trade Agreement (FTA) with the U.S. and grants
approval only if the project is deemed in the “public interest.” As of May 2014, the DOE had approved seven non-FTA LNG export applications with a total export capacity of 9.3 Bcf/day.
The U.S. Federal Energy Regulatory Commission (FERC), on the other hand, is focused
on evaluating the environmental impacts of proposed LNG projects, and is responsible for authorizing the siting and construction of LNG facilities. FERC has approved for construction
5.3 Bcf/day of LNG export capacity. Of approved projects, only the Sabine Pass Liquefaction,
LLC, is currently under construction.
The DOE granted authorization to the Jordan Cove project in Oregon with non-FTA
LNG export capacity of 0.8 Bcf/day on March 24, 2014. It could soon approve the Oregon LNG
project with 1.25 Bcf/day export capacity. However, much more work lies ahead to resolve complex issues of commercial contracts, FERC and local approvals, financing, and new
pipelines, before plans can succeed.
The LNG export projects in Oregon, the first on the U.S. West Coast are positioned to source gas from Canada and the U.S. Rockies; thus, they could directly compete for gas supplies
available to northern California.
Rocky Mountains
In July 2011, El Paso Natural Gas Corp (since purchased by Kinder Morgan, Inc.)
completed the 1.5 Bcf/day Ruby Pipeline project, which connects the Rocky Mountain supply
basin at Opal with Malin, Oregon. This project provides a source of supply that competes at Malin with supply from the Western Canadian Sedimentary Basin in Canada.
NORTHERN CALIFORNIA
43
North American Supply Development
The most promising development in the North American gas supply picture in the past several years has been the rapid development of various shale gas resources through horizontal
drilling combined with hydraulic fracturing. While the initial developments were concentrated
in the U.S. midcontinent, the large Marcellus and Utica plays in the eastern U.S. have been ramping up, resulting in record U.S. gas production in 2013. While some of the traditional
supply basins have shown modest declines in production, the Marcellus and Utica plays have
grown from roughly 10 percent of U.S. production in 2012 to 20 percent in 2014, with further strong growth expected in the next few years. Most industry forecasts now expect supply can
increase to meet the most aggressive demand scenario in the future.
GAS STORAGE
Northern California is served by several gas storage facilities in addition to the
long-standing PG&E fields at McDonald Island, Pleasant Creek, and Los Medanos. Other
storage providers include Gill Ranch Storage, LLC (the 20 Bcf facility was co-developed with PG&E, which owns 25% of the capacity), Wild Goose Storage, Inc., Lodi Gas Storage, LLC, and
Central Valley Storage, LLC. Of note are the recent addition of 11 Bcf of working gas capacity at
Central Valley Storage and the recent series of expansions at Wild Goose Storage that increased its working gas capacity from 29 Bcf to 75 Bcf.
The abundant storage capacity in the northern California market has had the effect of
creating additional liquidity in the market both in northern California and in other parts of the West. The extent to which northern California storage helped supply the larger western market
could be seen during much of the winter of 2013-2014; increased storage withdrawals allowed
pipeline supplies to meet demand outside of California.
NORTHERN CALIFORNIA
44
REGULATORY ENVIRONMENT
STATE REGULATORY MATTERS
Gas Quality
Gas quality has received much less attention since 2010 due to the abundance of
domestic gas supply, which has diminished interest in LNG imports, as described in the previous chapter. Hence, the challenges associated with integrating LNG and traditional North
American sources, each typically with different quality characteristics, do not require
immediate resolution.
PG&E has historically used the heating value of gas as an indicator of gas
interchangeability (the ability to substitute gas of one chemical composition for gas of another
different chemical composition). However, based on recent testing, the Wobbe Number is a better indicator of gas quality. The Wobbe Number reflects not only the heating value but the
specific gravity of the gas as well. Specific gravity is an indicator of the relative proportion of
heavier versus lighter hydrocarbons. In its testing, PG&E tentatively concluded that it could accept gas supplies with a Wobbe Number as high as 1,385.
Pipeline Safety
Since 2011, the CPUC and the state legislature have adopted a series of regulations and bills that reinforce the setting of public and employee safety as the top priority for the state’s gas
utilities. In particular, Senate Bill 705 mandated for the first time that gas operators develop
and implement safety plans that are consistent with the best practices in the gas industry.
PG&E filed with the CPUC its Pipeline Safety Enhancement Plan (PSEP) in August 2011
and a PSEP Update in October 2013. That filing presented the first phase of a comprehensive
plan to strength-test or replace all natural gas transmission lines currently in service that have not previously been strength-tested.
In December 2013, PG&E filed its 2015 Gas Transmission and Storage (GT&S) Rate Case,
which proposes increased funding for 2015 through 2017 to continue the implementation of best-practice safety improvements using an investment plan based on risk mitigation. This
filing proposes a substantial increase in revenue requirement from currently authorized 2014
levels that were adopted in the 2011 GT&S Rate Case and the PSEP proceeding.
Core Gas Aggregation Program
As of early 2014, Core Transport Agents (CTAs) serve approximately 19 percent of
PG&E’s core gas demand. PG&E recently began implementing the CTA Settlement Agreement, part of the Gas Accord V Settlement Agreement. The CTA Settlement Agreement modifies the
practice by which PG&E offers a share of its pipeline and storage capacity holdings to CTAs to
serve core customers. Implementation has resulted in numerous revisions to PG&E’s Gas Schedule G-CT (Core Gas Aggregation Service) and to PG&E’s CTA Service Agreement.
NORTHERN CALIFORNIA
45
FEDERAL REGULATORY MATTERS
PG&E actively participates in FERC ratemaking proceedings for interstate pipelines connected to PG&E’s system, because these cases can impact the cost of gas delivered to PG&E’s
gas customers and the services provided. PG&E also participates in FERC proceedings of
general interest to the extent they affect PG&E’s operations and policies or natural gas market policies generally.
Ruby Pipeline, L.L.C. (Ruby)
Ruby Pipeline filed an application with the Federal Energy Regulatory Commission (FERC) on January 27, 2009, authorizing the construction and operation of the Ruby Pipeline
Project. On April 5, 2010, the FERC approved the application. Construction began on July 31,
2010, and the pipeline was placed in service on July 28, 2011. Ruby is capable of transporting
approximately 1.5 Bcf/day to bring Rocky Mountain natural gas supplies the Northwest, and to
California.
El Paso Natural Gas Company, L.L.C. (El Paso)
El Paso filed a rate case application in the Federal Energy Regulatory Commission
(FERC) Docket No. RP10 -1398, for revised rates and terms and conditions effective April 1,
2011. At issue in the rate case are commitments made in a 1996 Settlement, which established rate protections for certain El Paso shippers, and which remain in effect. FERC is conducting a
supplemental proceeding to determine the appropriate level of costs reflected in protected
contracts, and to adjust proposed rates accordingly.
Kern River Gas Transmission (Kern River)
On February 15, 1992, Kern River went into service, providing Rocky Mountain supplies
to the San Joaquin Valley near Bakersfield, Calif. Major expansions occurred in 2002 and 2003, and 2010. Kern River currently has a design capacity of approximately 2.17 billion cubic feet
per day.
Transwestern Pipeline Company, L.L.C. (Transwestern)
Transwestern and its customers agreed to a rate pre-settlement on September 21, 2011 in
FERC Docket No. RP11-2576. Pursuant to Article VI of the FERC-approved settlement,
Transwestern is required to file a Natural Gas Act (NGA) Section 4 general rate case on October 1, 2014.
Gas Transmission Northwest, L.L.C.
Gas Transmission Northwest and its customers agreed to rate settlement, effective January 1, 2012, covering a 4 year period. The FERC-approved settlement requires GTN to file a
Section 4 general rate case for new rates effective January 1, 2016.
NORTHERN CALIFORNIA
46
FERC Notice of Inquiry Regarding Integration of Variable Energy Resources
(Docket RM10-11)
FERC sought comments in April 2010 as to how to more effectively integrate renewable
generation resources into the electric grid. While providing numerous comments from an
electric perspective, PG&E also emphasized that electric system planners need to work closely with gas system planners to confirm that gas systems are sized appropriately and offer the
necessary services to allow gas-fired electric generation projects to respond to sudden changes
in renewable project output. FERC has not taken any specific action in response to the comments.
FERC Gas-Electric Coordination Actions (AD12-12 & EL14-22)
Since 2012, FERC commissioners have raised questions about whether there is sufficient
coordination and harmonization between gas and electric systems regarding reliability.
Concerns have arisen for several reasons: extreme weather events that can affect both the gas
and electric grids; expectations of significant increases in gas-fired electric generation nationwide (less so in PG&E’s service territory since a significant number of gas-fired
generators already exist); and the expanding prevalence of renewable generation portfolio
requirements and the resulting need for non-renewable fuel sources, like natural gas, to support the grid when renewable generation is unavailable or reduced.
In spring 2012, FERC held multiple technical conferences and requested comments from
gas and electric industry stakeholders regarding any impediments to closer coordination/communication. After multiple meetings and comment periods, on March 20,
2014, FERC issued a Notice of Proposed Rulemaking (NOPR) proposing to move the start of the
gas day from the current 9 a.m. to 4 a.m. Central Time and change the natural gas intraday
scheduling practice. The NOPR provided the gas and electricity industry the opportunity to
work through the North American Energy Standards Board (NAESB) to reach consensus on
modification of the proposed gas day and nomination schedule by September 29, 2014, and requested comments on the NOPR by November 28, 2014.
PG&E is actively participating in the NAESB process to create a consensus proposal.
PG&E’s position is that gas-electric coordination may be viewed on a regional basis due to the numerous differences in infrastructure and electric markets across the country. PG&E believes
that a high degree of coordination already exists in California between gas system operators
and the (electric) California Independent System Operator.
Also on March 20, 2014, FERC requested that ISO/RTOs investigate electric scheduling
practices. FERC did not dictate any specific language changes; instead it required each
ISO/RTO, to make a filing 90 days after the gas-day revised final order is published. The filing will contain (1) proposed tariff changes to adjust the electric scheduling; or (2) show why such
changes are not necessary.
NORTHERN CALIFORNIA
47
OTHER REGULATORY MATTERS
Hydraulic Fracturing
Hydraulic fracturing is not a new technology (see www.fracfocus.org). It is the
combination of hydraulic fracturing with horizontal drilling that has unlocked vast shale gas
resources across North America. Given the rapid growth in shale drilling and the number of “fracked” wells, federal, state, and local governments are focusing on better understanding the
water and air quality impacts.
In 2009, the US Congress requested that the Environmental Protection Agency (EPA) conduct a study on the relationship between hydraulic fracturing and drinking water, which the
EPA expects to complete by 2016. In April 2012, the EPA issued its first federal regulation for
natural gas wells that are hydraulically fractured to reduce volatile organic compounds and
methane emissions. Also in 2012, the Department of Energy, the Department of the Interior
(DOI), and the EPA announced that they will jointly develop a multi-agency program to study
the key challenges associated with unconventional oil and gas production. The program takes into consideration the recommendations of the Secretary of Energy Advisory Board
Subcommittee 2011 report on shale gas production.[2] The outcomes of these studies will
support policy decisions at both the federal and state levels. Since 2012, the Bureau of Land Management, within the DOI, has been developing rules to strengthening existing
well-integrity standards, requiring measures for management of wastewater and chemical
disclosure for hydraulic fracturing wells on federal lands. In February 2014, the EPA released final rules restricting the use of diesel fuels in the hydraulic fracturing process; however, the
effects on production will be minimal as “diesel fuels appeared in fewer than two percent of the
wells” according to a 2012 report by FRACFocus.
In November 2013, California passed Senate Bill 4 to strengthen California’s hydraulic
fracturing regulations by requiring permits, notifications, disclosures and impact studies.
California regulators, environmentalists, and the gas and oil industry are continuing the discussion to modify the bill.
Gas Exports
The record rise of natural gas production in the United States over the last five years reverses the U.S. position in the international gas trade.
With low domestic natural gas prices compared to world markets, the United States is
positioned to become a net exporter of natural gas by 2020. Mexico is projected to be a major
importer of U.S. gas. The U.S. natural gas exports to Mexico have grown in recent years from
1.0 Bcf/day in 2008 to approximately 2.0 Bcf/day in 2013. They are projected to reach
5.0 Bcf/day by 2030, due to declining gas production and increasing gas demand for power generation and industrial use in Mexico. Several gas pipeline capacity-expansion projects on
both sides of the U.S.-Mexico border are under way to help meet Mexico’s growing demand for
U.S. gas. These projects are projected to be in service by 2015. When completed, they will significantly increase the total U.S.-to-Mexico pipeline-export capacity. As noted earlier, the
U.S. is expected to become a net exporter of LNG beginning in 2016. While project developers
[2]
http://www.shalegas.energy.gov/resources/111811_final_report.pdf.
NORTHERN CALIFORNIA
48
seek to arbitrage North American gas prices and international oil-linked prices, the U.S. federal
government is assessing the impact of more than 30 Bcf/day of proposed LNG export projects.
The U.S. DOE has approved 9.3 Bcf/day of non-FTA LNG exports, and FERC has authorized
the construction of 5.3 Bcf/day of LNG export capacity. Only one of approved projects, Sabine
Pass Liquefaction, LLC, is currently under construction in the U.S.
The U.S. LNG exports are projected to grow to 4-6 Bcf/day by 2020. Two of the LNG
export projects, the Jordan Cove LNG recently approved by DOE and the Oregon LNG
expected to be approved, are on the U.S. West Coast.
Greenhouse Gas (GHG) Reporting and Cap-and-Trade Obligations
In 2014, PG&E Gas Operations reported to the EPA GHG emissions in accordance with
40 CFR Part 98 in three primary categories: GHG emissions in 2013 resulting from combustion
at seven compressor stations where the annual emissions exceed 25,000 metric tons of CO2
equivalent; the GHG emissions resulting from combustion of all customers except customers
consuming more than 460 MMcf; and certain vented and fugitive emissions from the seven compressor stations and the distribution system.
In 2014, PG&E Gas Operations reported to the California Air Resources Board (CARB)
GHG emissions in the amount of 40.5 million metric tons of CO2 equivalent in three primary categories: GHG emissions resulting from combustion at seven compressor stations and one
underground gas storage station where the annual emissions exceed 25,000 metric tons of CO2
equivalent; the GHG emissions resulting from combustion of delivered gas to all customers; and vented and fugitive emissions from seven compressor stations, one underground gas
storage station and the distribution system.
In 2014, PG&E expects that a total of seven compressor stations and one underground gas storage station will emit more than 25,000 metric tons of CO2 equivalent and, so, is included
in CARB’s cap-and-trade program. The scope of CARB’s cap-and-trade program expands in
2015 to include natural gas suppliers, who will have a compliance obligation for GHG emissions associated with the natural gas use of their small customers (i.e., those customers who are not
covered directly under CARB’s cap-and-trade program). In 2012, CARB determined that
PG&E’s GHG emissions as a natural gas supplier were approximately 18.9 million metric tons of CO2 equivalent.
NORTHERN CALIFORNIA
49
ABNORMAL PEAK DAY DEMAND AND SUPPLY
APD DEMAND FORECAST
The Abnormal Peak Day (APD) forecast is a projection of demand under extremely
adverse conditions. PG&E uses a 1-in-90 year cold-temperature event as the design criterion.
This criterion corresponds to a 27 degree Fahrenheit system-weighted mean temperature across the PG&E gas system. The PG&E core demand forecast corresponding to a 27 degree
Fahrenheit temperature is estimated to be approximately 3.2 Bcf/day. The PG&E load forecast
shown here excludes all noncore demand and, in particular, excludes all electric generation (EG) demand. PG&E estimates that total noncore demand during an APD event would be
approximately 2.5 Bcf/day, with EG demand comprising between one-half to two-thirds of the
total noncore demand.
The APD core forecast is developed using the observed relationship between historical
daily weather and core usage data. This relationship is then used to forecast the core load
under APD conditions.
APD SUPPLY REQUIREMENT FORECAST
For APD planning purposes, supplies will flow under Core Procurement’s firm capacity,
any as-available capacity, and capacity made available pursuant to supply-diversion arrangements. Supplies could also be purchased from noncore suppliers. Flowing supplies
may come from Canada, the U.S. Southwest, the Rocky Mountain region, SoCalGas, and
California. Also, a significant part of the APD demand will be met by storage withdrawals from PG&E’s and independent storage providers’ underground storage facilities located within
northern and central California.
PG&E’s Core Gas Supply Department is responsible for procuring adequate flowing supplies to serve approximately 81 percent of PG&E’s core gas usage. Core aggregators
provide procurement services for the balance of PG&E’s core customers and have the same
obligation as PG&E Core Gas Supply to make and pay for all necessary arrangements to deliver gas to PG&E to match the use of their customers.
In previous extreme-cold weather events, PG&E has observed a drop in flowing pipeline
supplies. Supply from Canada is affected as the cold weather front drops down from Canada with a two-to-three-day lag before hitting PG&E’s service territory. There is also impact on
supply from the Southwest. While prices can influence the availability of supply to our system,
cold weather can affect producing wells in the basins, which in turn can affect the total supply to our system and others.
If core supplies are insufficient to meet core demand, PG&E can divert gas from noncore
customers, including EG customers, to meet it. PG&E’s tariffs contain diversion and Emergency Flow Order (EFO) noncompliance charges that are designed to cause the noncore
market to either reduce or cease its use of gas, if required. Since little, if any, alternate fuel-burn
capability exists today, supply diversions from the noncore would necessitate those noncore customers to curtail operations. The implication for the future is that under supply-shortfall
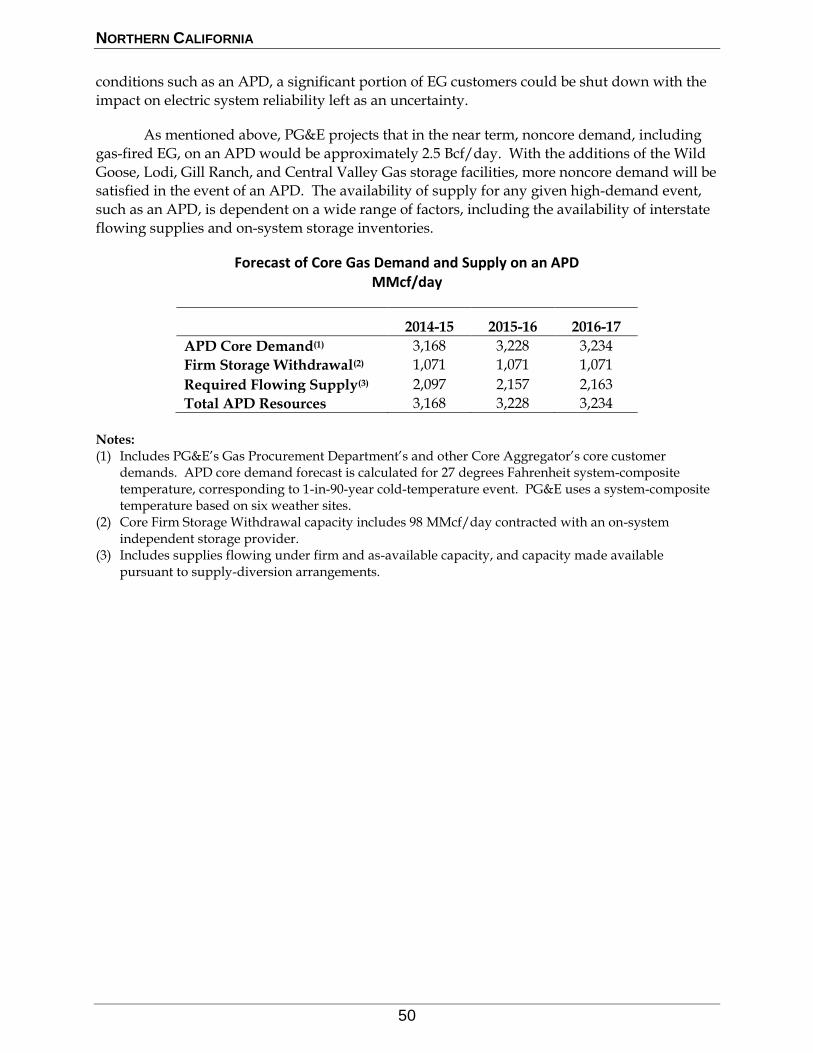
NORTHERN CALIFORNIA
50
conditions such as an APD, a significant portion of EG customers could be shut down with the
impact on electric system reliability left as an uncertainty.
As mentioned above, PG&E projects that in the near term, noncore demand, including
gas-fired EG, on an APD would be approximately 2.5 Bcf/day. With the additions of the Wild
Goose, Lodi, Gill Ranch, and Central Valley Gas storage facilities, more noncore demand will be satisfied in the event of an APD. The availability of supply for any given high-demand event,
such as an APD, is dependent on a wide range of factors, including the availability of interstate
flowing supplies and on-system storage inventories.
Forecast of Core Gas Demand and Supply on an APD MMcf/day
2014-15 2015-16 2016-17
APD Core Demand(1) 3,168 3,228 3,234
Firm Storage Withdrawal(2) 1,071 1,071 1,071
Required Flowing Supply(3) 2,097 2,157 2,163
Total APD Resources 3,168 3,228 3,234
Notes:
(1) Includes PG&E’s Gas Procurement Department’s and other Core Aggregator’s core customer demands. APD core demand forecast is calculated for 27 degrees Fahrenheit system-composite temperature, corresponding to 1-in-90-year cold-temperature event. PG&E uses a system-composite temperature based on six weather sites.
(2) Core Firm Storage Withdrawal capacity includes 98 MMcf/day contracted with an on-system independent storage provider.
(3) Includes supplies flowing under firm and as-available capacity, and capacity made available pursuant to supply-diversion arrangements.
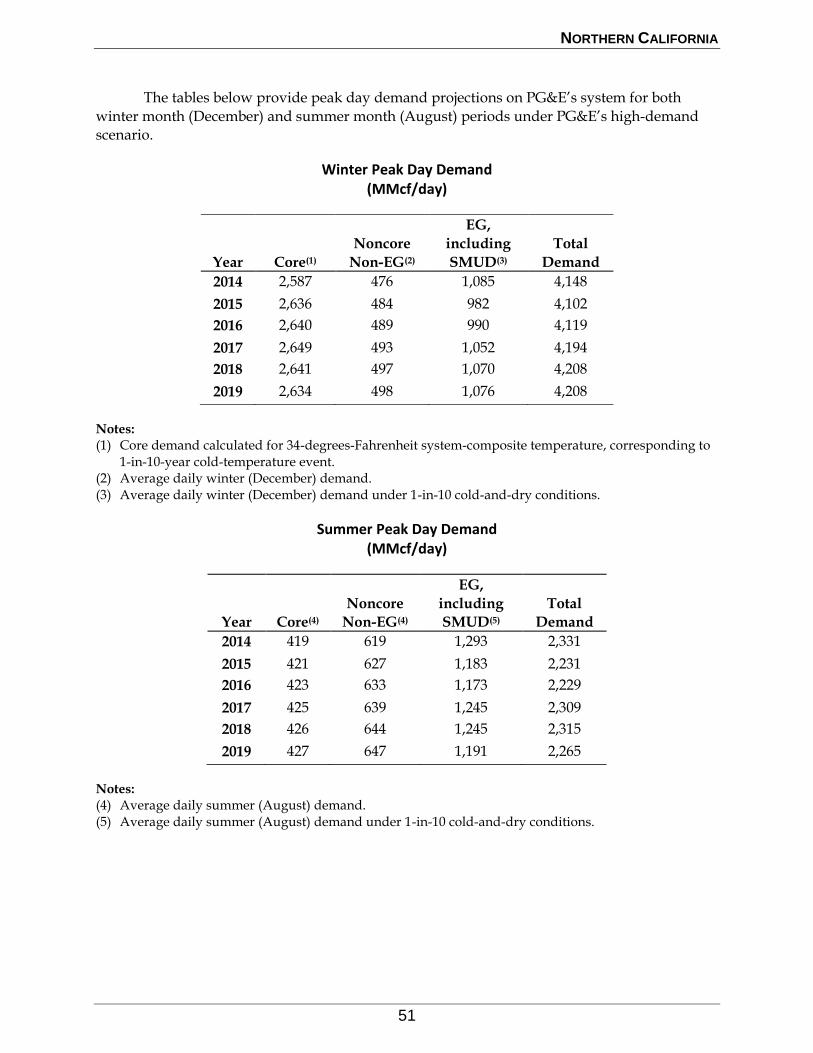
NORTHERN CALIFORNIA
51
The tables below provide peak day demand projections on PG&E’s system for both
winter month (December) and summer month (August) periods under PG&E’s high-demand scenario.
Winter Peak Day Demand (MMcf/day)
Year Core(1)
Noncore
Non-EG(2)
EG,
including
SMUD(3)
Total
Demand
2014 2,587 476 1,085 4,148
2015 2,636 484 982 4,102
2016 2,640 489 990 4,119
2017 2,649 493 1,052 4,194
2018 2,641 497 1,070 4,208
2019 2,634 498 1,076 4,208
Notes: (1) Core demand calculated for 34-degrees-Fahrenheit system-composite temperature, corresponding to
1-in-10-year cold-temperature event. (2) Average daily winter (December) demand. (3) Average daily winter (December) demand under 1-in-10 cold-and-dry conditions.
Summer Peak Day Demand (MMcf/day)
Year Core(4)
Noncore
Non-EG(4)
EG,
including
SMUD(5)
Total
Demand
2014 419 619 1,293 2,331
2015 421 627 1,183 2,231
2016 423 633 1,173 2,229
2017 425 639 1,245 2,309
2018 426 644 1,245 2,315
2019 427 647 1,191 2,265
Notes: (4) Average daily summer (August) demand. (5) Average daily summer (August) demand under 1-in-10 cold-and-dry conditions.

NORTHERN CALIFORNIA
52
2 0 1 4 C A L I F O R N I A G A S R E P O R T
NORTHERN CALIFORNIA TABULAR DATA
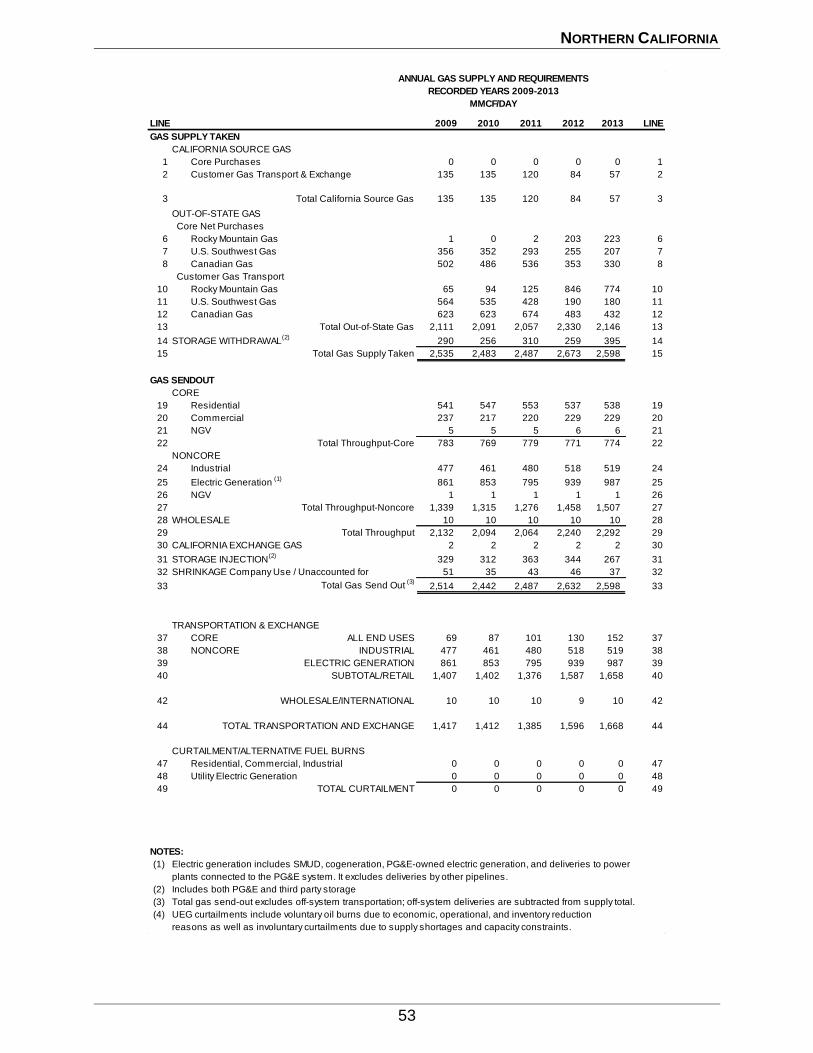
NORTHERN CALIFORNIA
53
ANNUAL GAS SUPPLY AND REQUIREMENTS
RECORDED YEARS 2009-2013
MMCF/DAY
LINE 2009 2010 2011 2012 2013 LINE
GAS SUPPLY TAKEN
CALIFORNIA SOURCE GAS
1 Core Purchases 0 0 0 0 0 1
2 Customer Gas Transport & Exchange 135 135 120 84 57 2
3 Total California Source Gas 135 135 120 84 57 3
OUT-OF-STATE GAS
Core Net Purchases
6 Rocky Mountain Gas 1 0 2 203 223 6
7 U.S. Southwest Gas 356 352 293 255 207 7
8 Canadian Gas 502 486 536 353 330 8
Customer Gas Transport
10 Rocky Mountain Gas 65 94 125 846 774 10
11 U.S. Southwest Gas 564 535 428 190 180 11
12 Canadian Gas 623 623 674 483 432 12
13 Total Out-of-State Gas 2,111 2,091 2,057 2,330 2,146 13
14 STORAGE WITHDRAWAL(2)
290 256 310 259 395 14
15 Total Gas Supply Taken 2,535 2,483 2,487 2,673 2,598 15
GAS SENDOUT
CORE
19 Residential 541 547 553 537 538 19
20 Commercial 237 217 220 229 229 20
21 NGV 5 5 5 6 6 21
22 Total Throughput-Core 783 769 779 771 774 22
NONCORE
24 Industrial 477 461 480 518 519 24
25 Electric Generation (1)
861 853 795 939 987 25
26 NGV 1 1 1 1 1 26
27 Total Throughput-Noncore 1,339 1,315 1,276 1,458 1,507 27
28 WHOLESALE 10 10 10 10 10 28
29 Total Throughput 2,132 2,094 2,064 2,240 2,292 29
30 CALIFORNIA EXCHANGE GAS 2 2 2 2 2 30
31 STORAGE INJECTION(2)
329 312 363 344 267 31
32 SHRINKAGE Company Use / Unaccounted for 51 35 43 46 37 32
33 Total Gas Send Out (3)
2,514 2,442 2,487 2,632 2,598 33
TRANSPORTATION & EXCHANGE
37 CORE ALL END USES 69 87 101 130 152 37
38 NONCORE INDUSTRIAL 477 461 480 518 519 38
39 ELECTRIC GENERATION 861 853 795 939 987 39
40 SUBTOTAL/RETAIL 1,407 1,402 1,376 1,587 1,658 40
42 WHOLESALE/INTERNATIONAL 10 10 10 9 10 42
44 TOTAL TRANSPORTATION AND EXCHANGE 1,417 1,412 1,385 1,596 1,668 44
CURTAILMENT/ALTERNATIVE FUEL BURNS
47 Residential, Commercial, Industrial 0 0 0 0 0 47
48 Utility Electric Generation 0 0 0 0 0 48
49 TOTAL CURTAILMENT 0 0 0 0 0 49
NOTES:
(1) Electric generation includes SMUD, cogeneration, PG&E-owned electric generation, and deliveries to power
plants connected to the PG&E system. It excludes deliveries by other pipelines.
(2) Includes both PG&E and third party storage
(3) Total gas send-out excludes off-system transportation; off-system deliveries are subtracted from supply total.
(4) UEG curtailments include voluntary oil burns due to economic, operational, and inventory reduction
reasons as well as involuntary curtailments due to supply shortages and capacity constraints.
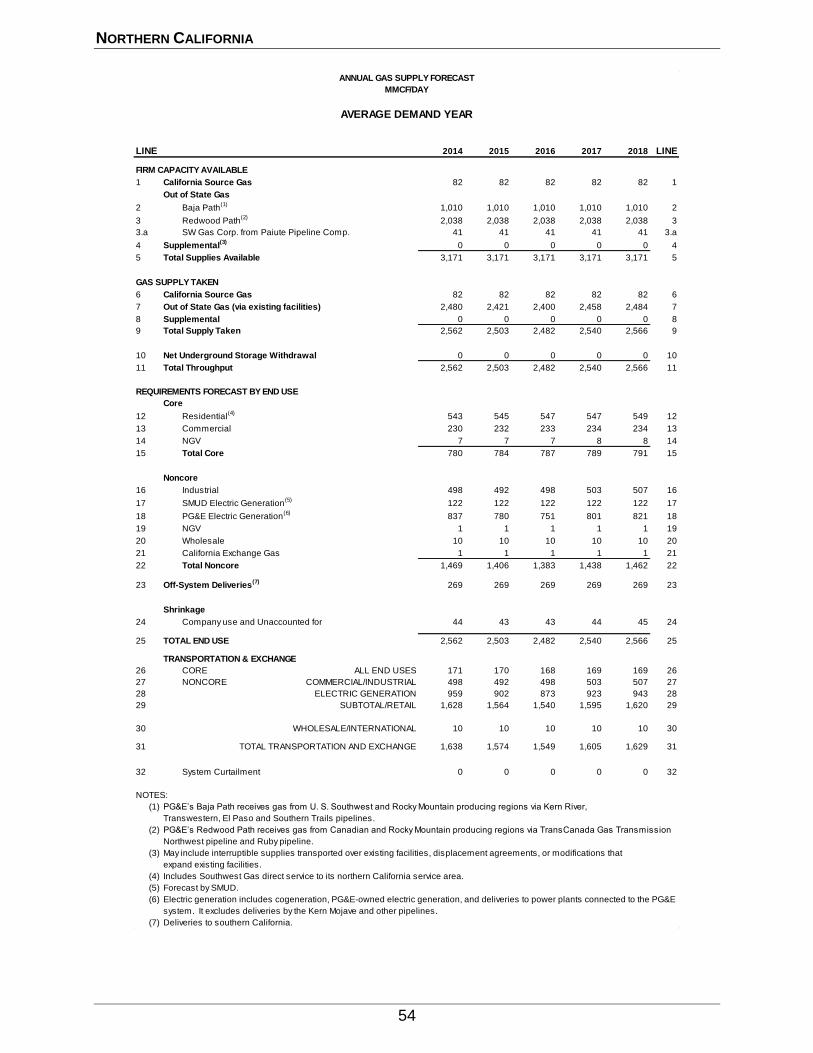
NORTHERN CALIFORNIA
54
ANNUAL GAS SUPPLY FORECAST
MMCF/DAY
AVERAGE DEMAND YEAR
LINE 2014 2015 2016 2017 2018 LINE
FIRM CAPACITY AVAILABLE
1 California Source Gas 82 82 82 82 82 1
Out of State Gas
2 Baja Path(1)
1,010 1,010 1,010 1,010 1,010 2
3 Redwood Path(2)
2,038 2,038 2,038 2,038 2,038 3
3.a SW Gas Corp. from Paiute Pipeline Comp. 41 41 41 41 41 3.a
4 Supplemental(3)
0 0 0 0 0 4
5 Total Supplies Available 3,171 3,171 3,171 3,171 3,171 5
GAS SUPPLY TAKEN
6 California Source Gas 82 82 82 82 82 6
7 Out of State Gas (via existing facilities) 2,480 2,421 2,400 2,458 2,484 7
8 Supplemental 0 0 0 0 0 8
9 Total Supply Taken 2,562 2,503 2,482 2,540 2,566 9
10 Net Underground Storage Withdrawal 0 0 0 0 0 10
11 Total Throughput 2,562 2,503 2,482 2,540 2,566 11
REQUIREMENTS FORECAST BY END USE
Core
12 Residential(4)
543 545 547 547 549 12
13 Commercial 230 232 233 234 234 13
14 NGV 7 7 7 8 8 14
15 Total Core 780 784 787 789 791 15
Noncore
16 Industrial 498 492 498 503 507 16
17 SMUD Electric Generation(5)
122 122 122 122 122 17
18 PG&E Electric Generation(6)
837 780 751 801 821 18
19 NGV 1 1 1 1 1 19
20 Wholesale 10 10 10 10 10 20
21 California Exchange Gas 1 1 1 1 1 21
22 Total Noncore 1,469 1,406 1,383 1,438 1,462 22
23 Off-System Deliveries(7)
269 269 269 269 269 23
Shrinkage
24 Company use and Unaccounted for 44 43 43 44 45 24
25 TOTAL END USE 2,562 2,503 2,482 2,540 2,566 25
TRANSPORTATION & EXCHANGE
26 CORE ALL END USES 171 170 168 169 169 26
27 NONCORE COMMERCIAL/INDUSTRIAL 498 492 498 503 507 27
28 ELECTRIC GENERATION 959 902 873 923 943 28
29 SUBTOTAL/RETAIL 1,628 1,564 1,540 1,595 1,620 29
30 WHOLESALE/INTERNATIONAL 10 10 10 10 10 30
31 TOTAL TRANSPORTATION AND EXCHANGE 1,638 1,574 1,549 1,605 1,629 31
32 System Curtailment 0 0 0 0 0 32
NOTES:
(1) PG&E’s Baja Path receives gas from U. S. Southwest and Rocky Mountain producing regions via Kern River,
Transwestern, El Paso and Southern Trails pipelines.
(2) PG&E’s Redwood Path receives gas from Canadian and Rocky Mountain producing regions via TransCanada Gas Transmission
Northwest pipeline and Ruby pipeline.
(3) May include interruptible supplies transported over existing facilities, displacement agreements, or modifications that
expand existing facilities.
(4) Includes Southwest Gas direct service to its northern California service area.
(5) Forecast by SMUD.
(6) Electric generation includes cogeneration, PG&E-owned electric generation, and deliveries to power plants connected to the PG&E
system. It excludes deliveries by the Kern Mojave and other pipelines.
(7) Deliveries to southern California.
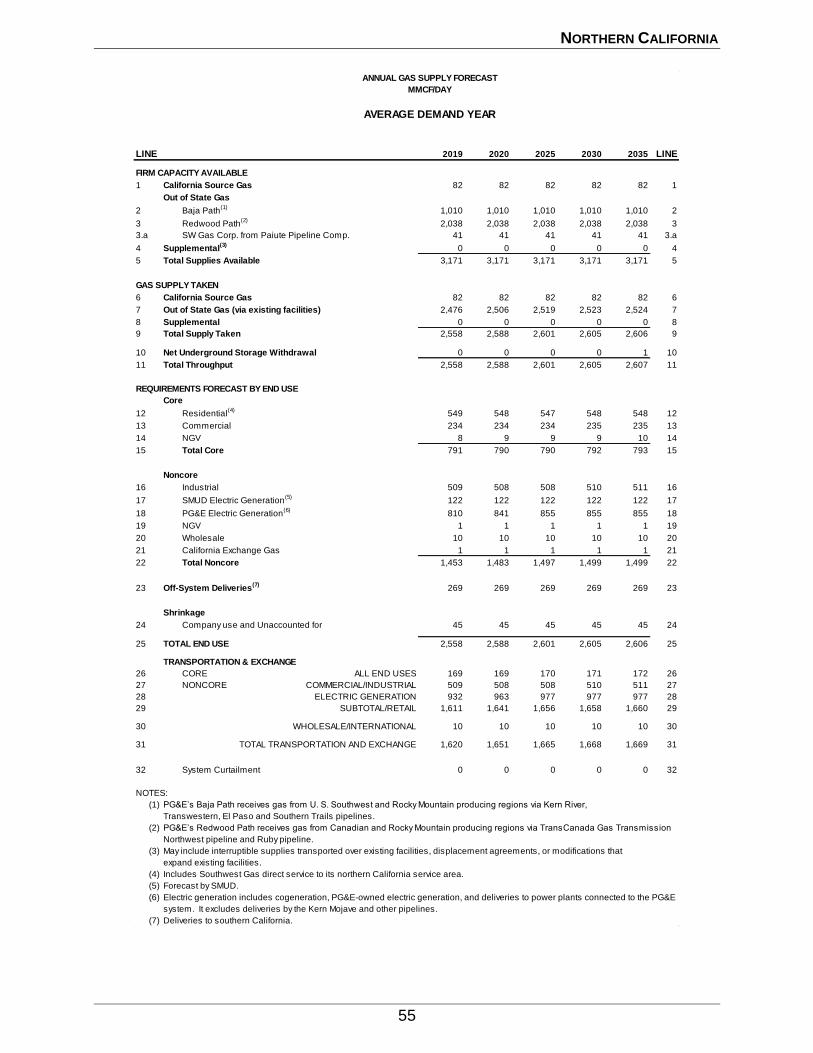
NORTHERN CALIFORNIA
55
ANNUAL GAS SUPPLY FORECAST
MMCF/DAY
AVERAGE DEMAND YEAR
LINE 2019 2020 2025 2030 2035 LINE
FIRM CAPACITY AVAILABLE
1 California Source Gas 82 82 82 82 82 1
Out of State Gas
2 Baja Path(1)
1,010 1,010 1,010 1,010 1,010 2
3 Redwood Path(2)
2,038 2,038 2,038 2,038 2,038 3
3.a SW Gas Corp. from Paiute Pipeline Comp. 41 41 41 41 41 3.a
4 Supplemental(3)
0 0 0 0 0 4
5 Total Supplies Available 3,171 3,171 3,171 3,171 3,171 5
GAS SUPPLY TAKEN
6 California Source Gas 82 82 82 82 82 6
7 Out of State Gas (via existing facilities) 2,476 2,506 2,519 2,523 2,524 7
8 Supplemental 0 0 0 0 0 8
9 Total Supply Taken 2,558 2,588 2,601 2,605 2,606 9
10 Net Underground Storage Withdrawal 0 0 0 0 1 10
11 Total Throughput 2,558 2,588 2,601 2,605 2,607 11
REQUIREMENTS FORECAST BY END USE
Core
12 Residential(4)
549 548 547 548 548 12
13 Commercial 234 234 234 235 235 13
14 NGV 8 9 9 9 10 14
15 Total Core 791 790 790 792 793 15
Noncore
16 Industrial 509 508 508 510 511 16
17 SMUD Electric Generation(5)
122 122 122 122 122 17
18 PG&E Electric Generation(6)
810 841 855 855 855 18
19 NGV 1 1 1 1 1 19
20 Wholesale 10 10 10 10 10 20
21 California Exchange Gas 1 1 1 1 1 21
22 Total Noncore 1,453 1,483 1,497 1,499 1,499 22
23 Off-System Deliveries(7)
269 269 269 269 269 23
Shrinkage
24 Company use and Unaccounted for 45 45 45 45 45 24
25 TOTAL END USE 2,558 2,588 2,601 2,605 2,606 25
TRANSPORTATION & EXCHANGE
26 CORE ALL END USES 169 169 170 171 172 26
27 NONCORE COMMERCIAL/INDUSTRIAL 509 508 508 510 511 27
28 ELECTRIC GENERATION 932 963 977 977 977 28
29 SUBTOTAL/RETAIL 1,611 1,641 1,656 1,658 1,660 29
30 WHOLESALE/INTERNATIONAL 10 10 10 10 10 30
31 TOTAL TRANSPORTATION AND EXCHANGE 1,620 1,651 1,665 1,668 1,669 31
32 System Curtailment 0 0 0 0 0 32
NOTES:
(1) PG&E’s Baja Path receives gas from U. S. Southwest and Rocky Mountain producing regions via Kern River,
Transwestern, El Paso and Southern Trails pipelines.
(2) PG&E’s Redwood Path receives gas from Canadian and Rocky Mountain producing regions via TransCanada Gas Transmission
Northwest pipeline and Ruby pipeline.
(3) May include interruptible supplies transported over existing facilities, displacement agreements, or modifications that
expand existing facilities.
(4) Includes Southwest Gas direct service to its northern California service area.
(5) Forecast by SMUD.
(6) Electric generation includes cogeneration, PG&E-owned electric generation, and deliveries to power plants connected to the PG&E
system. It excludes deliveries by the Kern Mojave and other pipelines.
(7) Deliveries to southern California.
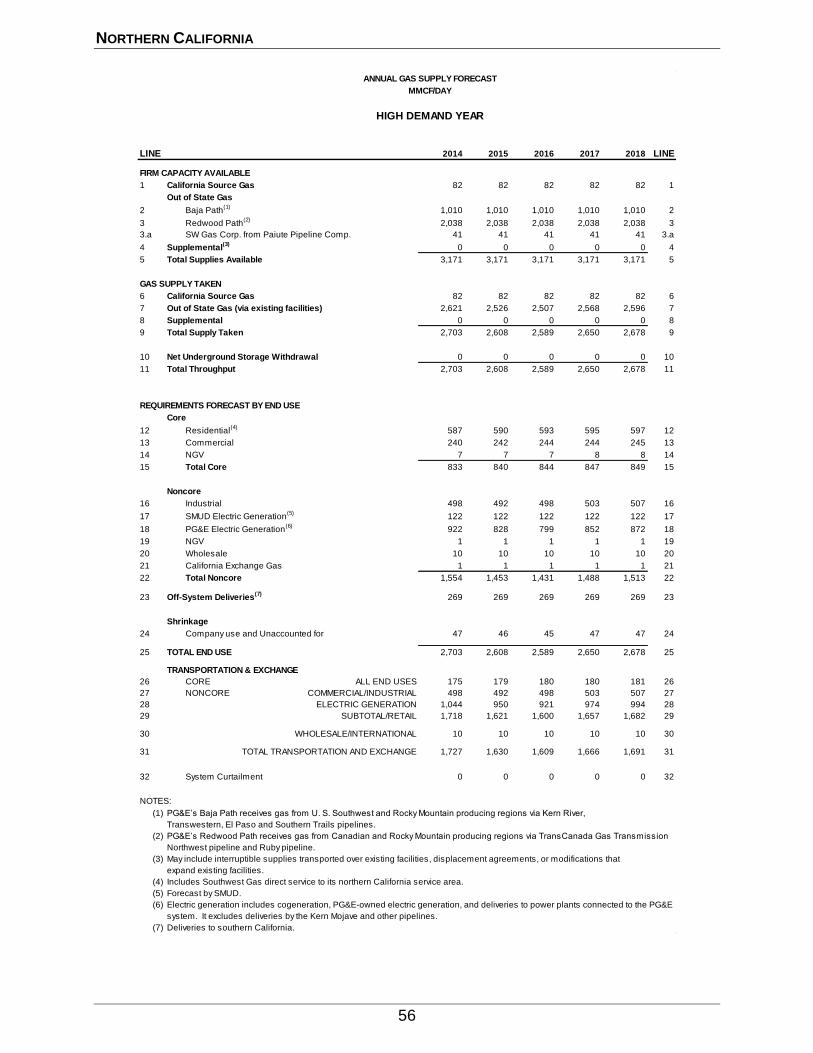
NORTHERN CALIFORNIA
56
ANNUAL GAS SUPPLY FORECAST
MMCF/DAY
HIGH DEMAND YEAR
LINE 2014 2015 2016 2017 2018 LINE
FIRM CAPACITY AVAILABLE
1 California Source Gas 82 82 82 82 82 1
Out of State Gas
2 Baja Path(1)
1,010 1,010 1,010 1,010 1,010 2
3 Redwood Path(2)
2,038 2,038 2,038 2,038 2,038 3
3.a SW Gas Corp. from Paiute Pipeline Comp. 41 41 41 41 41 3.a
4 Supplemental(3)
0 0 0 0 0 4
5 Total Supplies Available 3,171 3,171 3,171 3,171 3,171 5
GAS SUPPLY TAKEN
6 California Source Gas 82 82 82 82 82 6
7 Out of State Gas (via existing facilities) 2,621 2,526 2,507 2,568 2,596 7
8 Supplemental 0 0 0 0 0 8
9 Total Supply Taken 2,703 2,608 2,589 2,650 2,678 9
10 Net Underground Storage Withdrawal 0 0 0 0 0 10
11 Total Throughput 2,703 2,608 2,589 2,650 2,678 11
REQUIREMENTS FORECAST BY END USE
Core
12 Residential(4)
587 590 593 595 597 12
13 Commercial 240 242 244 244 245 13
14 NGV 7 7 7 8 8 14
15 Total Core 833 840 844 847 849 15
Noncore
16 Industrial 498 492 498 503 507 16
17 SMUD Electric Generation(5)
122 122 122 122 122 17
18 PG&E Electric Generation(6)
922 828 799 852 872 18
19 NGV 1 1 1 1 1 19
20 Wholesale 10 10 10 10 10 20
21 California Exchange Gas 1 1 1 1 1 21
22 Total Noncore 1,554 1,453 1,431 1,488 1,513 22
23 Off-System Deliveries(7)
269 269 269 269 269 23
Shrinkage
24 Company use and Unaccounted for 47 46 45 47 47 24
25 TOTAL END USE 2,703 2,608 2,589 2,650 2,678 25
TRANSPORTATION & EXCHANGE
26 CORE ALL END USES 175 179 180 180 181 26
27 NONCORE COMMERCIAL/INDUSTRIAL 498 492 498 503 507 27
28 ELECTRIC GENERATION 1,044 950 921 974 994 28
29 SUBTOTAL/RETAIL 1,718 1,621 1,600 1,657 1,682 29
30 WHOLESALE/INTERNATIONAL 10 10 10 10 10 30
31 TOTAL TRANSPORTATION AND EXCHANGE 1,727 1,630 1,609 1,666 1,691 31
32 System Curtailment 0 0 0 0 0 32
NOTES:
(1) PG&E’s Baja Path receives gas from U. S. Southwest and Rocky Mountain producing regions via Kern River,
Transwestern, El Paso and Southern Trails pipelines.
(2) PG&E’s Redwood Path receives gas from Canadian and Rocky Mountain producing regions via TransCanada Gas Transmission
Northwest pipeline and Ruby pipeline.
(3) May include interruptible supplies transported over existing facilities, displacement agreements, or modifications that
expand existing facilities.
(4) Includes Southwest Gas direct service to its northern California service area.
(5) Forecast by SMUD.
(6) Electric generation includes cogeneration, PG&E-owned electric generation, and deliveries to power plants connected to the PG&E
system. It excludes deliveries by the Kern Mojave and other pipelines.
(7) Deliveries to southern California.
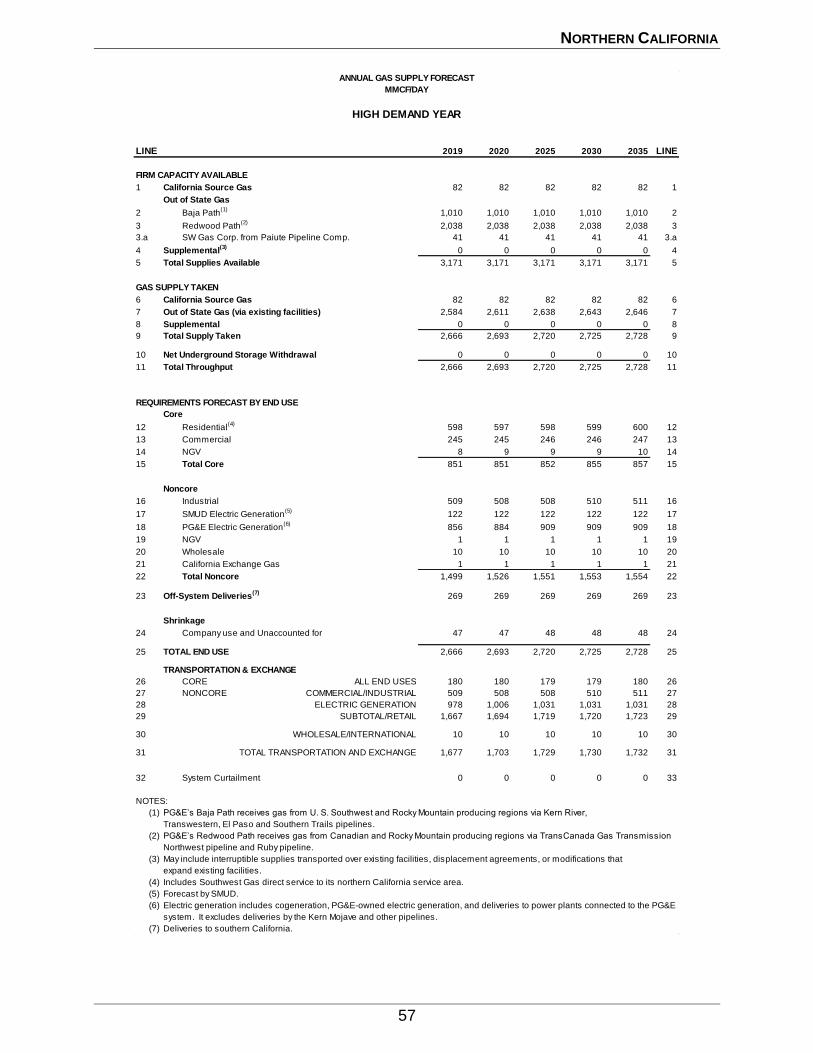
NORTHERN CALIFORNIA
57
ANNUAL GAS SUPPLY FORECAST
MMCF/DAY
HIGH DEMAND YEAR
LINE 2019 2020 2025 2030 2035 LINE
FIRM CAPACITY AVAILABLE
1 California Source Gas 82 82 82 82 82 1
Out of State Gas
2 Baja Path(1)
1,010 1,010 1,010 1,010 1,010 2
3 Redwood Path(2)
2,038 2,038 2,038 2,038 2,038 3
3.a SW Gas Corp. from Paiute Pipeline Comp. 41 41 41 41 41 3.a
4 Supplemental(3)
0 0 0 0 0 4
5 Total Supplies Available 3,171 3,171 3,171 3,171 3,171 5
GAS SUPPLY TAKEN
6 California Source Gas 82 82 82 82 82 6
7 Out of State Gas (via existing facilities) 2,584 2,611 2,638 2,643 2,646 7
8 Supplemental 0 0 0 0 0 8
9 Total Supply Taken 2,666 2,693 2,720 2,725 2,728 9
10 Net Underground Storage Withdrawal 0 0 0 0 0 10
11 Total Throughput 2,666 2,693 2,720 2,725 2,728 11
REQUIREMENTS FORECAST BY END USE
Core
12 Residential(4)
598 597 598 599 600 12
13 Commercial 245 245 246 246 247 13
14 NGV 8 9 9 9 10 14
15 Total Core 851 851 852 855 857 15
Noncore
16 Industrial 509 508 508 510 511 16
17 SMUD Electric Generation(5)
122 122 122 122 122 17
18 PG&E Electric Generation(6)
856 884 909 909 909 18
19 NGV 1 1 1 1 1 19
20 Wholesale 10 10 10 10 10 20
21 California Exchange Gas 1 1 1 1 1 21
22 Total Noncore 1,499 1,526 1,551 1,553 1,554 22
23 Off-System Deliveries(7)
269 269 269 269 269 23
Shrinkage
24 Company use and Unaccounted for 47 47 48 48 48 24
25 TOTAL END USE 2,666 2,693 2,720 2,725 2,728 25
TRANSPORTATION & EXCHANGE
26 CORE ALL END USES 180 180 179 179 180 26
27 NONCORE COMMERCIAL/INDUSTRIAL 509 508 508 510 511 27
28 ELECTRIC GENERATION 978 1,006 1,031 1,031 1,031 28
29 SUBTOTAL/RETAIL 1,667 1,694 1,719 1,720 1,723 29
30 WHOLESALE/INTERNATIONAL 10 10 10 10 10 30
31 TOTAL TRANSPORTATION AND EXCHANGE 1,677 1,703 1,729 1,730 1,732 31
32 System Curtailment 0 0 0 0 0 33
NOTES:
(1) PG&E’s Baja Path receives gas from U. S. Southwest and Rocky Mountain producing regions via Kern River,
Transwestern, El Paso and Southern Trails pipelines.
(2) PG&E’s Redwood Path receives gas from Canadian and Rocky Mountain producing regions via TransCanada Gas Transmission
Northwest pipeline and Ruby pipeline.
(3) May include interruptible supplies transported over existing facilities, displacement agreements, or modifications that
expand existing facilities.
(4) Includes Southwest Gas direct service to its northern California service area.
(5) Forecast by SMUD.
(6) Electric generation includes cogeneration, PG&E-owned electric generation, and deliveries to power plants connected to the PG&E
system. It excludes deliveries by the Kern Mojave and other pipelines.
(7) Deliveries to southern California.
SOUTHERN CALIFORNIA
58
2 0 1 4 C A L I F O R N I A G A S R E P O R T
SOUTHERN CALIFORNIA GAS COMPANY
SOUTHERN CALIFORNIA
59
INTRODUCTION
Southern California Gas Company (SoCalGas) is the principal distributor of natural gas
in Southern California, providing retail and wholesale customers with transportation, exchange and storage services and also procurement services to most retail core customers. SoCalGas is a
gas-only utility and, in addition to serving the residential, commercial, and industrial markets,
provides gas for enhanced oil recovery (EOR) and electric generation (EG) customers in Southern California. San Diego Gas & Electric Company (SDG&E), Southwest Gas Corporation,
the City of Long Beach Municipal Oil and Gas Department, and the City of Vernon are
SoCalGas’ four wholesale utility customers. SoCalGas also provides gas transportation service
across its system to a border crossing point at the California-Mexico border at Mexicali to
ECOGAS Mexico S. de R.L. de C.V which is a wholesale international customer located in
Mexico.
This report covers a 22-year demand and forecast period, from 2014 through 2035; only
the consecutive years 2014 through 2020 and the point years 2025, 2030, and 2035 are shown in
the tabular data in the next sections. These single point forecasts are subject to uncertainty, but represent best estimates for the future, based upon the most current information available.
The Southern California section of the 2014 California Gas Report (CGR) begins with a
discussion of the economic conditions and regulatory issues facing the utilities, followed by a discussion of the factors affecting natural gas demand in various market sectors. The outlook
on natural gas supply availability, which continues to be favorable, is also presented. The
natural gas price forecast methodology used to develop the gas demand forecast is discussed followed by a review of the peak day demand forecast. Summary tables and figures underlying
the forecast are also provided.

SOUTHERN CALIFORNIA
60
THE SOUTHERN CALIFORNIA ENVIRONMENT
ECONOMICS AND DEMOGRAPHICS
The gas demand projections are in large part determined by the long-term economic
outlook for the SoCalGas service territory. As of mid-2014, southern California’s economy is gradually recovering from a severe multi-year slump. After peaking in 2007, SoCalGas’ service
area employment dropped until 2010 and has been growing gradually since then. Overall area
jobs are expected to average 1.4% annual growth from 2013 through 2020. Local industrial
employment (manufacturing and mining) is expected to grow a more modest 0.6% per year
from 2013 to 2020. Commercial jobs should grow by 1.5% per year during the same period.
Construction employment should make a strong comeback--albeit from a low current level, averaging 6% annual growth from 2013 through 2020. Other job sectors with expected strong
growth in the same period include professional and business services (growing 2.7% per year)
and wholesale trade (1.9% per year).
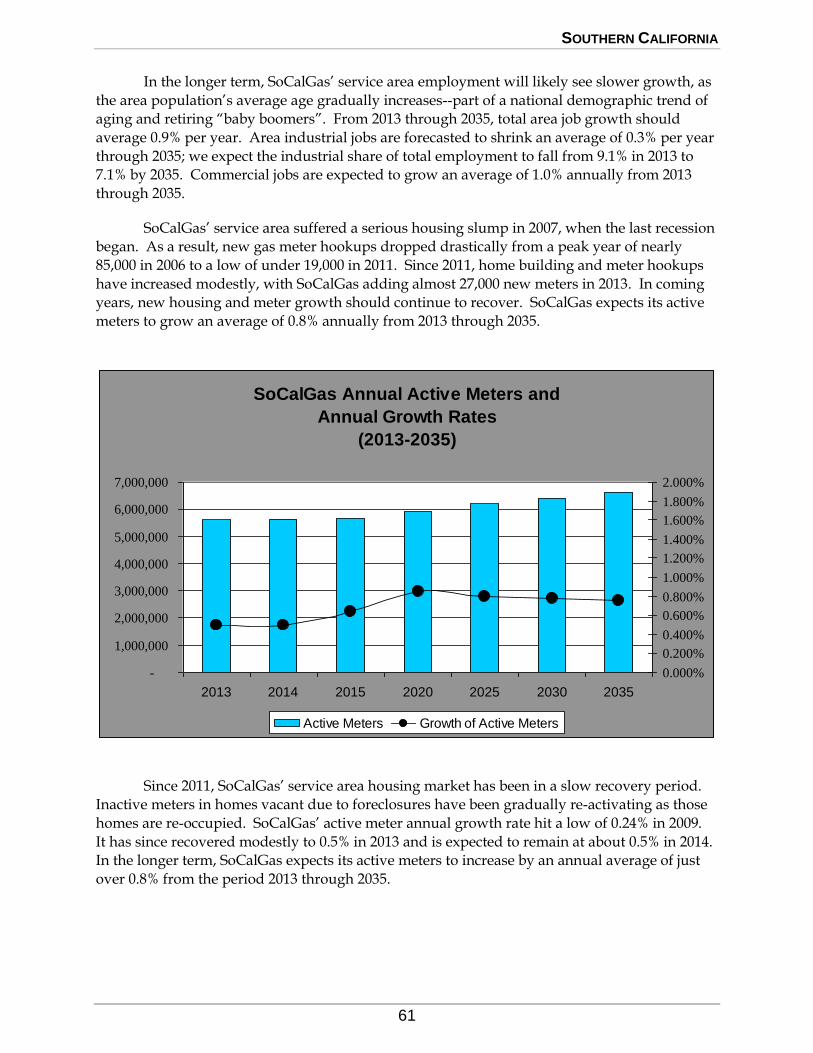
SOUTHERN CALIFORNIA
61
In the longer term, SoCalGas’ service area employment will likely see slower growth, as
the area population’s average age gradually increases--part of a national demographic trend of
aging and retiring “baby boomers”. From 2013 through 2035, total area job growth should
average 0.9% per year. Area industrial jobs are forecasted to shrink an average of 0.3% per year
through 2035; we expect the industrial share of total employment to fall from 9.1% in 2013 to 7.1% by 2035. Commercial jobs are expected to grow an average of 1.0% annually from 2013
through 2035.
SoCalGas’ service area suffered a serious housing slump in 2007, when the last recession began. As a result, new gas meter hookups dropped drastically from a peak year of nearly
85,000 in 2006 to a low of under 19,000 in 2011. Since 2011, home building and meter hookups
have increased modestly, with SoCalGas adding almost 27,000 new meters in 2013. In coming years, new housing and meter growth should continue to recover. SoCalGas expects its active
meters to grow an average of 0.8% annually from 2013 through 2035.
Since 2011, SoCalGas’ service area housing market has been in a slow recovery period.
Inactive meters in homes vacant due to foreclosures have been gradually re-activating as those
homes are re-occupied. SoCalGas’ active meter annual growth rate hit a low of 0.24% in 2009.
It has since recovered modestly to 0.5% in 2013 and is expected to remain at about 0.5% in 2014. In the longer term, SoCalGas expects its active meters to increase by an annual average of just
over 0.8% from the period 2013 through 2035.
SoCalGas Annual Active Meters and
Annual Growth Rates
(2013-2035)
-
1,000,000
2,000,000
3,000,000
4,000,000
5,000,000
6,000,000
7,000,000
2013 2014 2015 2020 2025 2030 2035
0.000%
0.200%
0.400%
0.600%
0.800%
1.000%
1.200%
1.400%
1.600%
1.800%
2.000%
Active Meters Growth of Active Meters
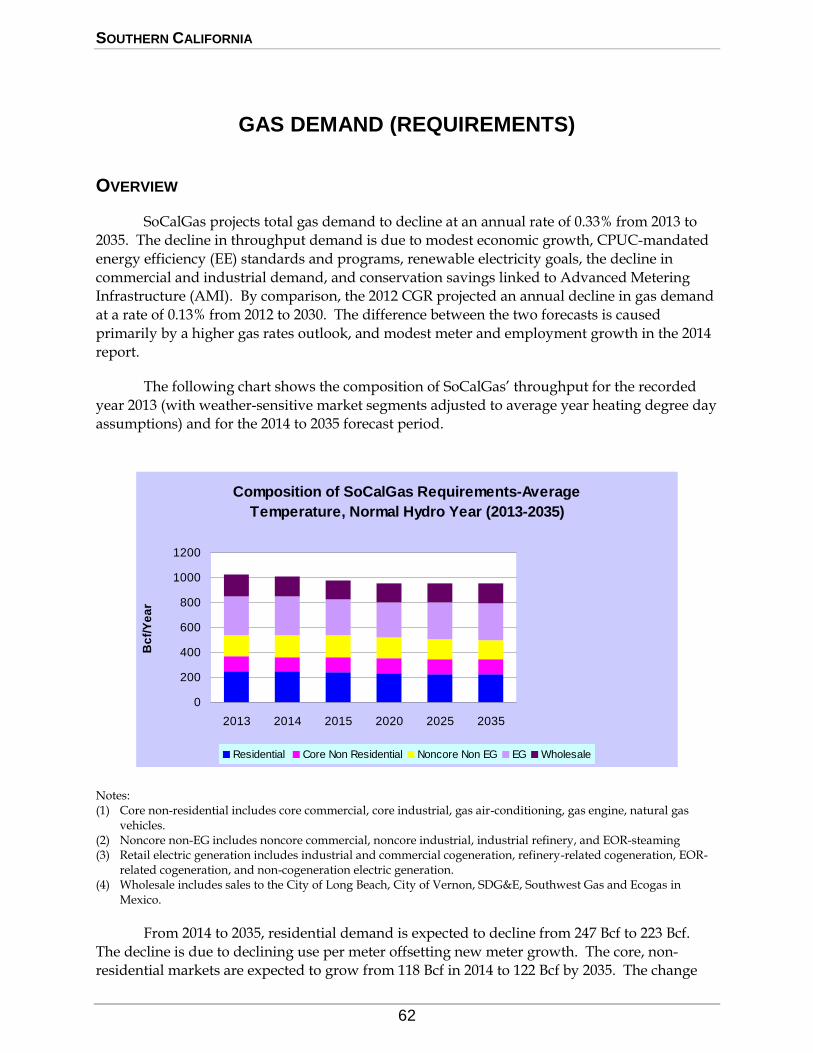
SOUTHERN CALIFORNIA
62
GAS DEMAND (REQUIREMENTS)
OVERVIEW
SoCalGas projects total gas demand to decline at an annual rate of 0.33% from 2013 to 2035. The decline in throughput demand is due to modest economic growth, CPUC-mandated
energy efficiency (EE) standards and programs, renewable electricity goals, the decline in
commercial and industrial demand, and conservation savings linked to Advanced Metering Infrastructure (AMI). By comparison, the 2012 CGR projected an annual decline in gas demand
at a rate of 0.13% from 2012 to 2030. The difference between the two forecasts is caused
primarily by a higher gas rates outlook, and modest meter and employment growth in the 2014
report.
The following chart shows the composition of SoCalGas’ throughput for the recorded
year 2013 (with weather-sensitive market segments adjusted to average year heating degree day assumptions) and for the 2014 to 2035 forecast period.
Notes: (1) Core non-residential includes core commercial, core industrial, gas air-conditioning, gas engine, natural gas
vehicles. (2) Noncore non-EG includes noncore commercial, noncore industrial, industrial refinery, and EOR-steaming (3) Retail electric generation includes industrial and commercial cogeneration, refinery-related cogeneration, EOR-
related cogeneration, and non-cogeneration electric generation. (4) Wholesale includes sales to the City of Long Beach, City of Vernon, SDG&E, Southwest Gas and Ecogas in
Mexico.
From 2014 to 2035, residential demand is expected to decline from 247 Bcf to 223 Bcf.
The decline is due to declining use per meter offsetting new meter growth. The core, non-residential markets are expected to grow from 118 Bcf in 2014 to 122 Bcf by 2035. The change
Composition of SoCalGas Requirements-Average
Temperature, Normal Hydro Year (2013-2035)
0
200
400
600
800
1000
1200
2013 2014 2015 2020 2025 2035
Bc
f/Y
ea
r
Residential Core Non Residential Noncore Non EG EG Wholesale
SOUTHERN CALIFORNIA
63
reflects an annual growth rate of 0.15% over the forecast period. The noncore, non-EG markets
are expected to decline from 169 Bcf in 2013 to 150 Bcf by 2035. The annual rate of decline is
approximately 0.5% due to very aggressive energy efficiency goals and associated programs.
On the other hand, utility gas demand for EOR steaming operations, which had declined since
the FERC-regulated Kern/Mojave interstate pipeline began offering direct service to California customers in 1992, has shown some growth in recent years because of continuing high oil prices
and is expected to show further growth in the early years of the forecast period. EOR demand
is forecast to level off in 2016 and remain relatively flat through 2035 as gains are offset by the depletion of older oil fields. Total electric generation load, including cogeneration and non-
cogeneration EG for a normal hydro year, is expected to decline from 311 Bcf in 2014 to 298 Bcf
in 2035, a decrease of 0.12% per year.
Market Sensitivity
Temperature
Core demand forecasts are prepared for two design temperature conditions – average
and cold – to quantify changes in space heating demand due to weather. Temperature variations can cause significant changes in winter gas demand due to space heating in the
residential and core commercial and industrial markets. The largest demand variations due to
temperature occur in the month of December. Heating Degree Day (HDD) differences between the two conditions are developed from a six-zone temperature monitoring procedure within
SoCalGas’ service territory. One HDD is recorded when the average temperature for the day
drops 1 degree below 65° Fahrenheit. The cold design temperature conditions are based on a statistical likelihood of occurrence of 1-in-35 on an annual basis, with a typical recurrence
period of 35 years.
In our 2014 CGR, average year and cold year HDD totals are 1,385 and 1,677 respectively, on a calendar year basis for SoCalGas. For SDG&E, these values are 1,342 and
1,654 HDDs, respectively. The average year values were computed as the simple average of
annual HDD’s for the years 1994 through 2013.
Hydro Condition
The non-cogen EG forecasts are prepared for two hydro conditions – average and dry. The dry hydro case refers to gas demand in a 1-in-10 dry hydro year.
SOUTHERN CALIFORNIA
64
MARKET SECTORS
Residential
Residential demand adjusted for temperature totaled 251 Bcf in 2013 which is 8 Bcf
higher than 2012 weather adjusted deliveries. The residential load is expected to decline by
0.5% per year from 251 Bcf in 2013 to 223 Bcf in 2035. The decrease in gas demand results from a combination of continued decline in the residential use per meter, increases in the marginal
gas rates, the impact of savings from SoCalGas’ Advanced Meter Infrastructure (AMI) project
deployment which began in 2013 and CPUC authorized energy efficiency program savings in this market.
The total residential customer count for SoCalGas consists of five residential segment
types: single family, small and large multi-family customers, master meter and sub-metered customers. The active meters for all residential customer classes were 5.4 million at the end of
2013. This amount reflects a 29,308 active meter increase between 2012 at year end and 2013 at
year end. The overall observed 2012-2013 residential meter growth was 0.55%. Just six years before, the observed meter growth had been 53,326 new meters between 2006 and 2007, which
amounts to an annual growth rate of 1.03%. The decrease in active meter growth reflects the
overall state of the Southern California economy.
The 2014 CGR shows that in 2013, single family and multi family average annual use per
meter was 493 therms and 323 therms, respectively. Over the forecast period, the demand per
customer is expected to decline at an annual rate of 1.3%. The decline in use per meter for residential customers is explained by conservation and the energy savings resulting from
tightened building and appliance standards and energy efficiency programs and demand
reductions anticipated as a result of the deployment of AMI in the Southern California area. With AMI, customers will have more timely information available about their daily and hourly
gas use and thereby are expected to use gas more efficiently. Mass deployment of SoCalGas’
AMI modules began in 2013 and is expected to be completed by 2017. The deployment of SoCalGas’ AMI will not only provide operating efficiencies but will also generate long term
conservation benefits.
In summary, the projected residential natural gas demand will be influenced primarily by residential meter growth, moderated by the forecasted declining use per customer, and the
gradual conversion of some sub-meter and master meter customers to individual meter use.
The residential load trend over the forecast period is illustrated in the graph below.
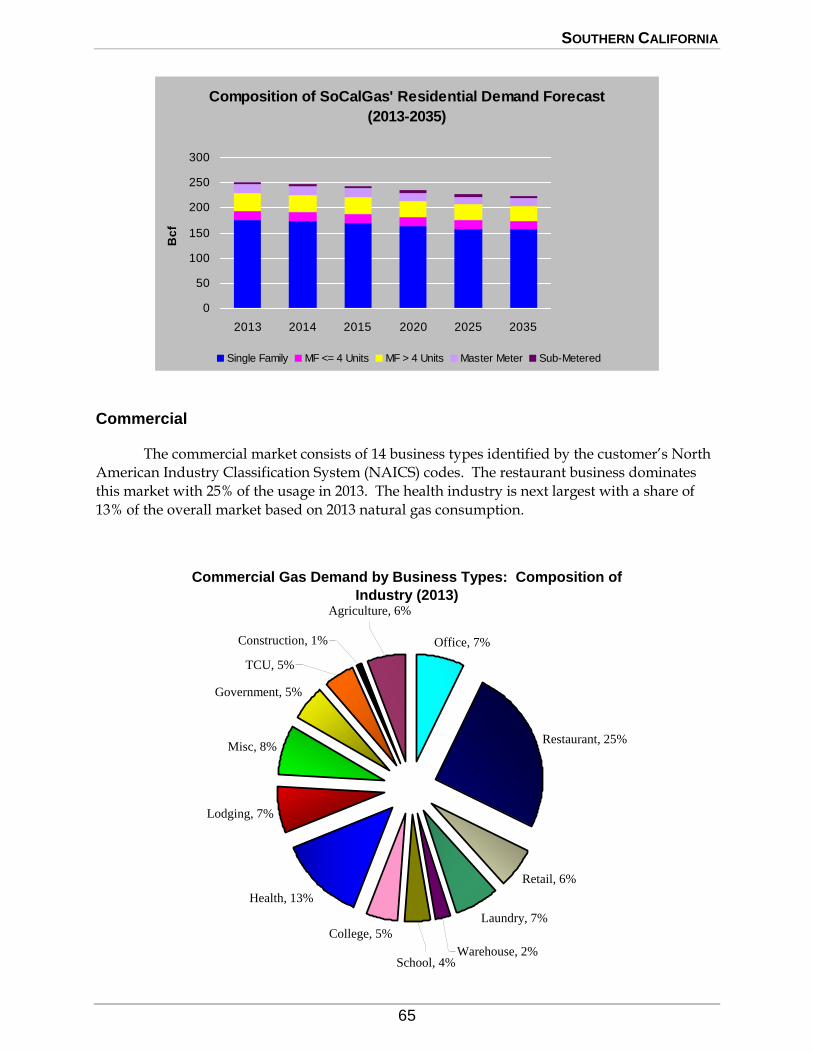
SOUTHERN CALIFORNIA
65
Commercial
The commercial market consists of 14 business types identified by the customer’s North American Industry Classification System (NAICS) codes. The restaurant business dominates
this market with 25% of the usage in 2013. The health industry is next largest with a share of
13% of the overall market based on 2013 natural gas consumption.
Composition of SoCalGas' Residential Demand Forecast
(2013-2035)
0
50
100
150
200
250
300
2013 2014 2015 2020 2025 2035
Bc
f
Single Family MF <= 4 Units MF > 4 Units Master Meter Sub-Metered
Commercial Gas Demand by Business Types: Composition of
Industry (2013)
Office, 7%
Restaurant, 25%
Retail, 6%
Laundry, 7%
College, 5%
Health, 13%
Lodging, 7%
Misc, 8%
Government, 5%
Warehouse, 2%School, 4%
TCU, 5%
Construction, 1%
Agriculture, 6%
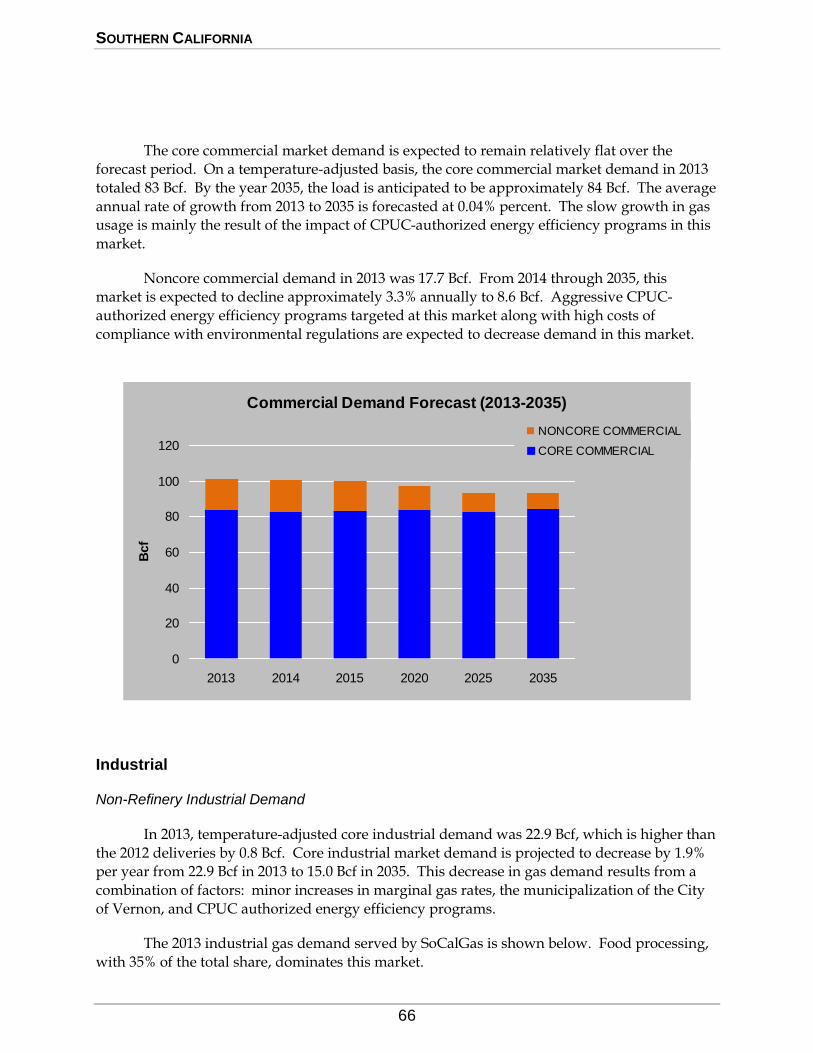
SOUTHERN CALIFORNIA
66
The core commercial market demand is expected to remain relatively flat over the forecast period. On a temperature-adjusted basis, the core commercial market demand in 2013
totaled 83 Bcf. By the year 2035, the load is anticipated to be approximately 84 Bcf. The average
annual rate of growth from 2013 to 2035 is forecasted at 0.04% percent. The slow growth in gas usage is mainly the result of the impact of CPUC-authorized energy efficiency programs in this
market.
Noncore commercial demand in 2013 was 17.7 Bcf. From 2014 through 2035, this market is expected to decline approximately 3.3% annually to 8.6 Bcf. Aggressive CPUC-
authorized energy efficiency programs targeted at this market along with high costs of
compliance with environmental regulations are expected to decrease demand in this market.
Industrial
Non-Refinery Industrial Demand
In 2013, temperature-adjusted core industrial demand was 22.9 Bcf, which is higher than
the 2012 deliveries by 0.8 Bcf. Core industrial market demand is projected to decrease by 1.9% per year from 22.9 Bcf in 2013 to 15.0 Bcf in 2035. This decrease in gas demand results from a
combination of factors: minor increases in marginal gas rates, the municipalization of the City
of Vernon, and CPUC authorized energy efficiency programs.
The 2013 industrial gas demand served by SoCalGas is shown below. Food processing,
with 35% of the total share, dominates this market.
Commercial Demand Forecast (2013-2035)
0
20
40
60
80
100
120
2013 2014 2015 2020 2025 2035
Bcf
NONCORE COMMERCIAL
CORE COMMERCIAL
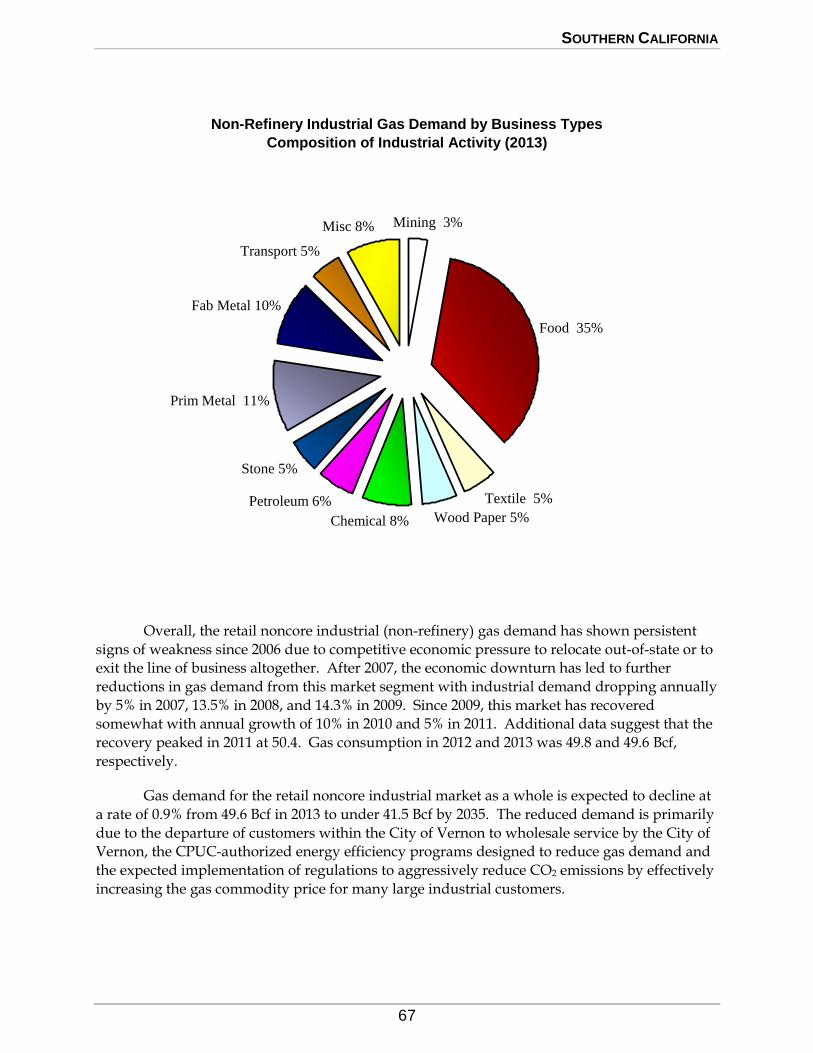
SOUTHERN CALIFORNIA
67
Non-Refinery Industrial Gas Demand by Business Types
Composition of Industrial Activity (2013)
Overall, the retail noncore industrial (non-refinery) gas demand has shown persistent
signs of weakness since 2006 due to competitive economic pressure to relocate out-of-state or to exit the line of business altogether. After 2007, the economic downturn has led to further
reductions in gas demand from this market segment with industrial demand dropping annually
by 5% in 2007, 13.5% in 2008, and 14.3% in 2009. Since 2009, this market has recovered somewhat with annual growth of 10% in 2010 and 5% in 2011. Additional data suggest that the
recovery peaked in 2011 at 50.4. Gas consumption in 2012 and 2013 was 49.8 and 49.6 Bcf,
respectively.
Gas demand for the retail noncore industrial market as a whole is expected to decline at
a rate of 0.9% from 49.6 Bcf in 2013 to under 41.5 Bcf by 2035. The reduced demand is primarily
due to the departure of customers within the City of Vernon to wholesale service by the City of Vernon, the CPUC-authorized energy efficiency programs designed to reduce gas demand and
the expected implementation of regulations to aggressively reduce CO2 emissions by effectively
increasing the gas commodity price for many large industrial customers.
Food 35%
Textile 5%
Wood Paper 5%Chemical 8%
Petroleum 6%
Prim Metal 11%
Fab Metal 10%
Transport 5%
Misc 8% Mining 3%
Stone 5%
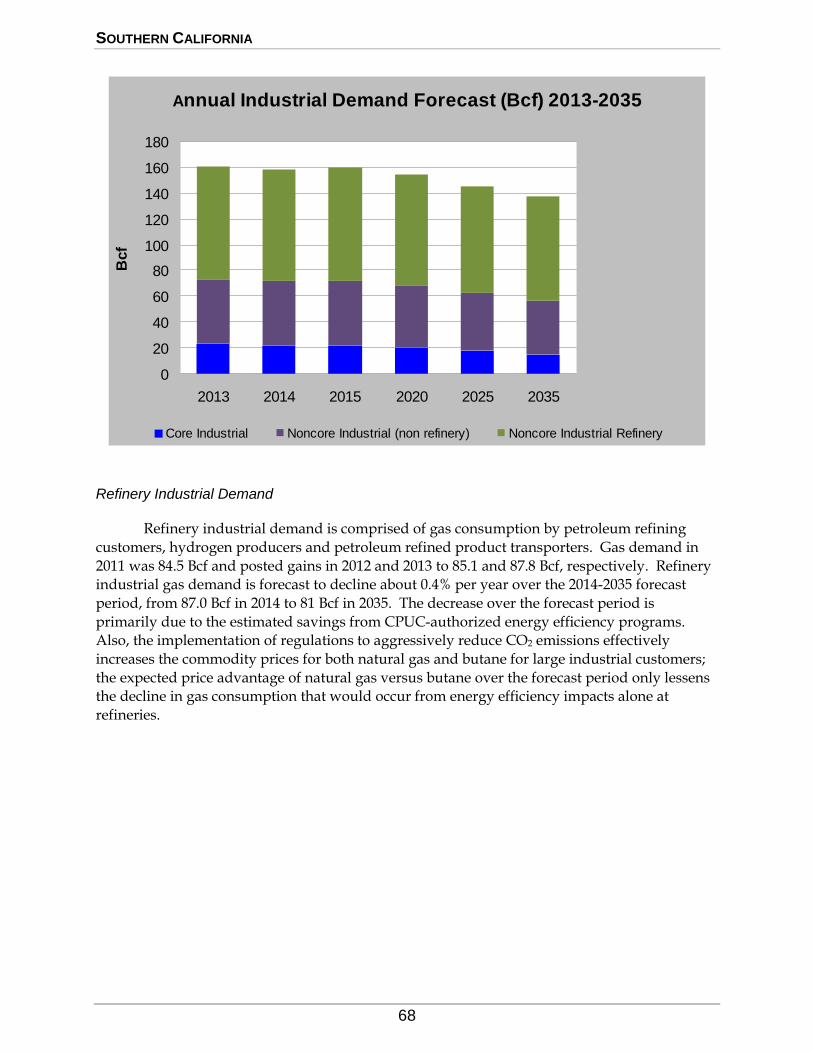
SOUTHERN CALIFORNIA
68
Refinery Industrial Demand
Refinery industrial demand is comprised of gas consumption by petroleum refining
customers, hydrogen producers and petroleum refined product transporters. Gas demand in
2011 was 84.5 Bcf and posted gains in 2012 and 2013 to 85.1 and 87.8 Bcf, respectively. Refinery
industrial gas demand is forecast to decline about 0.4% per year over the 2014-2035 forecast
period, from 87.0 Bcf in 2014 to 81 Bcf in 2035. The decrease over the forecast period is
primarily due to the estimated savings from CPUC-authorized energy efficiency programs. Also, the implementation of regulations to aggressively reduce CO2 emissions effectively
increases the commodity prices for both natural gas and butane for large industrial customers;
the expected price advantage of natural gas versus butane over the forecast period only lessens the decline in gas consumption that would occur from energy efficiency impacts alone at
refineries.
Annual Industrial Demand Forecast (Bcf) 2013-2035
0
20
40
60
80
100
120
140
160
180
2013 2014 2015 2020 2025 2035
Bcf
Core Industrial Noncore Industrial (non refinery) Noncore Industrial Refinery
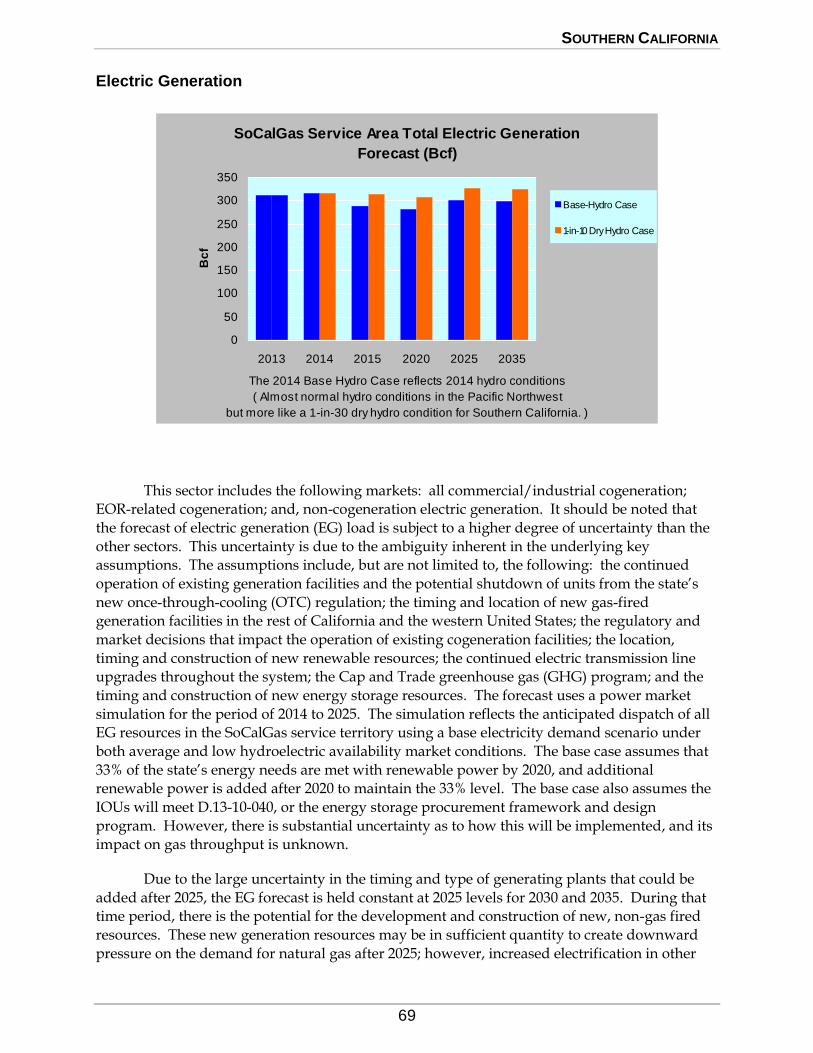
SOUTHERN CALIFORNIA
69
Electric Generation
This sector includes the following markets: all commercial/industrial cogeneration; EOR-related cogeneration; and, non-cogeneration electric generation. It should be noted that
the forecast of electric generation (EG) load is subject to a higher degree of uncertainty than the
other sectors. This uncertainty is due to the ambiguity inherent in the underlying key assumptions. The assumptions include, but are not limited to, the following: the continued
operation of existing generation facilities and the potential shutdown of units from the state’s
new once-through-cooling (OTC) regulation; the timing and location of new gas-fired generation facilities in the rest of California and the western United States; the regulatory and
market decisions that impact the operation of existing cogeneration facilities; the location,
timing and construction of new renewable resources; the continued electric transmission line upgrades throughout the system; the Cap and Trade greenhouse gas (GHG) program; and the
timing and construction of new energy storage resources. The forecast uses a power market
simulation for the period of 2014 to 2025. The simulation reflects the anticipated dispatch of all EG resources in the SoCalGas service territory using a base electricity demand scenario under
both average and low hydroelectric availability market conditions. The base case assumes that
33% of the state’s energy needs are met with renewable power by 2020, and additional renewable power is added after 2020 to maintain the 33% level. The base case also assumes the
IOUs will meet D.13-10-040, or the energy storage procurement framework and design
program. However, there is substantial uncertainty as to how this will be implemented, and its impact on gas throughput is unknown.
Due to the large uncertainty in the timing and type of generating plants that could be
added after 2025, the EG forecast is held constant at 2025 levels for 2030 and 2035. During that time period, there is the potential for the development and construction of new, non-gas fired
resources. These new generation resources may be in sufficient quantity to create downward
pressure on the demand for natural gas after 2025; however, increased electrification in other
SoCalGas Service Area Total Electric Generation
Forecast (Bcf)
0
50
100
150
200
250
300
350
2013 2014 2015 2020 2025 2035
Bc
fBase-Hydro Case
1-in-10 Dry Hydro Case
The 2014 Base Hydro Case reflects 2014 hydro conditions
( Almost normal hydro conditions in the Pacific Northwest
but more like a 1-in-30 dry hydro condition for Southern California. )
like 1-in-30 dry hydro condition for Southern California)
SOUTHERN CALIFORNIA
70
sectors, such as transportation, could create counteracting upward pressure on electricity
demand and associated gas demand.
For electricity demand within California, SoCalGas relies on the California Energy
Commission’s (CEC) California Energy Demand 2014‐ 2024 Final Forecast, dated
December 2013. SoCalGas selected the Mid Energy Demand scenario with Mid Additional Achievable Energy Efficiency (AAEE) scenario. SoCalGas relies on Ventyx’s electric demand
forecast for the remainder of the Western Electricity Coordinating Council (WECC) area.
Industrial/Commercial/Cogeneration <20MW
The commercial/industrial cogeneration market segment is generally comprised of
customers with generating capacity of less than 20 megawatts (MW) of electric power. Most of the cogeneration units in this segment are installed primarily to generate electricity for internal
customer consumption rather than for the sale of power to electric utilities. Customers in this
market segment install their own electric generation equipment for both economic reasons (gas- powered systems produce electricity cheaper than purchasing it from a local electric utility) and
reliability reasons (lower purchased power prices are realized only for interruptible service). In
2008, recorded gas deliveries to this market were 18.7 Bcf. By 2011, the small cogeneration load totaled 20.9 Bcf, which represents an 11.8% increase over the 2008 level. Consumption
continued to increase in 2012 and 2013 to 23.1 and 24.5 Bcf, respectively. Overall, small
cogeneration demand is projected to decline modestly from 21.9 Bcf in 2014 to 19.7 Bcf by the year 2035. From 2014 through 2035, small cogeneration load is anticipated to decline at an
annual average rate of 0.50%. A key factor in stimulating this gas decline is the expected
implementation of regulations to aggressively reduce CO2 emissions which will effectively increase the gas commodity price for many of the larger small cogeneration customers
Industrial/Commercial Cogeneration >20 MW
For commercial/industrial cogeneration customers greater than 20 MW, gas demand is
forecast to remain constant at 51 Bcf from 2014 through 2025. Although there is uncertainty in
this sector with respect to contract renewals, this forecast assumes that the existing facilities will continue to be cost–effective and thus will continue to operate at historical levels. Changes to
this assumption in the future could have a significant impact on the forecast.
Refinery-Related Cogeneration
Refinery cogeneration units are installed primarily to generate electricity for internal
use. This cogeneration segment consumed 20.7 Bcf in 2012 and rose to 22.6 Bcf in 2013. This market is forecast to decline modestly at just over 0.61% per year, from 22.2 Bcf in 2014 to
21.7 Bcf in 2035. The slight decline is mainly due to higher gas costs stemming from California’s
GHG carbon fees.
SOUTHERN CALIFORNIA
71
Enhanced Oil Recovery-Related Cogeneration
In 2013, recorded gas deliveries to the EOR-related cogeneration market were 8.5 Bcf, a 9% increase from 2012. This increase in load was due to changes in operations for some of the
existing EOR-related cogeneration customers. EOR-related cogeneration demand is forecast to
remain at 8.5 Bcf throughout the forecast period.
Non-Cogeneration Electric Generation
For the non-cogeneration EG market, two gas demand forecast scenarios were developed underlying: (i) a base hydro condition and (ii) a 1-in-10 dry hydro condition. For
the base case, gas demand is forecasted to decrease from 211 Bcf in 2014 to 197 Bcf in 2025. It is
important to note that in the base case scenario, the first year of the forecast, 2014, is a dry hydro
year. Consequently, the forecasted non-cogeneration EG demand for 2014 is higher than it
would be under normal hydro conditions. The forecast for the remaining years, 2015-2025, is
based on normal hydro conditions. Demand is forecasted to slightly increase from 183 Bcf in 2015 to 197 Bcf in 2025. This small gain is mostly due to new gas-fired resources beyond 2020.
Due to the large uncertainty in the timing and type of generating plants that could be added
after 2025, SoCalGas holds the EG forecast constant at the 2025 level for 2030 and 2035.
SoCalGas’ forecast includes the addition of approximately 1,950 MW of new gas-fired
combined cycle and peaking generating resources in its service area by 2025. However, the
forecast also assumes 6,900 MW of older plants are retired as a result of the state’s once-through-cooling regulation. Throughout the entire forecast period, SoCalGas assumes that
market participants will construct additional generation resources to meet a minimum planning
reserve margin of 15%.
Starting in 2014, the forecast ramps up renewable electricity generation to meet 33% of
the state’s total electric energy consumption by 2020. The forecast estimates renewable-sourced
energy generation in 2020 by taking 33% of CEC’s forecasted electricity sales load. The forecast shows that close to 80% of the incremental renewable power needed to meet the state’s 33%
target will be physically located in Southern California.
In this forecast, SoCalGas included energy storage resources in the model as required by D.13-10-040. Installed storage capacity data are based on the mid-scenario from the CPUC’s
2014 Long Term Procurement Plan assumptions. Starting in 2017, a state-wide installed
capacity of 141 MW is added. Storage capacity increases to 1,125 MW by 2024.
As mentioned above, to account for dry climate conditions, a dry hydro sensitivity gas
demand forecast was also created. This dry hydro forecast indicates that, under 1-in-10 dry
hydro conditions, gas demand for SoCalGas increases by 25 Bcf, on average, each year over the forecast period.
SOUTHERN CALIFORNIA
72
Enhanced Oil Recovery – Steam
Recorded deliveries to the EOR steaming market in 2013 were 12.8 Bcf, an increase of approximately 15% from 2012. SoCalGas’ EOR steaming demand is expected to increase to
15.9 Bcf in 2014, a 24% increase, and to 18.5 Bcf in 2015, a 16% increase, as current EOR
customers expand their operations and new customers come on-line. Demand is forecast to level off at 18.5 Bcf from 2016 through the end of the forecast period. These figures include gas
delivered to PG&E’s EOR customers through inter-utility exchange. In 2013, less than 0.01 Bcf
of gas was delivered to PG&E through such arrangements. No change in demand is expected in that market. The EOR-related cogeneration demand is discussed in the Electric Generation
section.
Crude oil prices are forecast to remain high over the forecast period which may result in even more expansion of California EOR operations in some fields. However, this expansion is
forecast to be offset by declining oil production in other fields as the fields are depleted. For gas
supplies, oil producers will continue to rely mainly on interstate pipelines in California to supplant traditional supply sources, such as own source gas and SoCalGas’ transportation
system.
Wholesale and International
SoCalGas provides wholesale transportation service to SDG&E, the City of Long Beach
Gas and Oil Department (Long Beach), Southwest Gas Corporation (SWG), the City of Vernon (Vernon) and Ecogas Mexico, L. de R.L. de C.V. The wholesale load is expected to decrease
from 172 Bcf in 2013 to 160 Bcf in 2035.
San Diego Gas & Electric
Under average year temperature and normal hydro conditions, SDG&E gas demand is
expected to decrease at an average rate of 0.7% per year from 137 Bcf in 2013 to 119 Bcf in 2035. Additional information regarding SDG&E’s gas demand is provided in the SDG&E section of
this report.
City of Long Beach
The wholesale load forecast is based on forecast information provided by the City of
Long Beach Municipal Gas & Oil Department. Long Beach’s gas use is expected to remain fairly constant, increasing from 9.0 Bcf in 2014 to 9.6 Bcf by 2035. Long Beach's locally supplied
deliveries are expected to decline from 0.4 Bcf in 2014 to 0.1 Bcf by 2035. SoCalGas’
transportation to Long Beach is expected to increase gradually from 8.6 Bcf in 2014 to 9.5 Bcf by 2035. Refer to the City of Long Beach Municipal Gas & Oil Department for more information.
SOUTHERN CALIFORNIA
73
Southwest Gas
The demand forecast for Southwest Gas is based on a long-term demand forecast prepared by Southwest Gas. In 2014, SoCalGas expects to serve approximately 6.4 Bcf directly,
with another 2.9 Bcf being served by PG&E under exchange arrangements with SoCalGas. The
total load is expected to grow from 9.3 Bcf in 2014 to approximately 12.6 Bcf in 2035.
City of Vernon
The City of Vernon initiated municipal gas service to its electric power plant within the city’s jurisdiction in June, 2005. Since 2005, there has also been a gradual increase of
Commercial/Industrial gas demand as customers within the city boundaries have left the
SoCalGas retail system and interconnected with Vernon’s municipal gas system. The forecasted
throughput starts at 10.5 Bcf in 2014 and increases to 11 Bcf by 2021, after which the demand
remains relatively flat through 2035. Vernon’s commercial and industrial load is based on
recorded historical usage for commercial and industrial customers already served by Vernon plus the customers that are expected to request retail service from Vernon. The throughput
forecast for Vernon’s municipal EG customers is based on a power market simulation.
Ecogas Mexico, S. de R.L. de C.V. (Ecogas)
SoCalGas used the forecast prepared by Ecogas for this report. Ecogas’ use is expected
to gradually increase from approximately 7.3 Bcf/year in 2014 to 7.9 Bcf/year by 2035.
Natural Gas Vehicles (NGV)
The NGV market is expected to continue to grow due to government (federal, state and local) incentives and regulations related to the purchase and operation of alternate fuel vehicles,
growing numbers of natural gas engines and vehicles, and the increasing cost differential
between petroleum (gasoline and diesel) and natural gas. At the end of 2013, there were 289 compressed natural gas (CNG) fueling stations delivering 11.4 Bcf of natural gas during the
year. The NGV market is expected to grow substantially from 11.4 Bcf in 2013 to 23.3 Bcf in
2035, a growth rate of just over 3.3% per year.
ENERGY EFFICIENCY PROGRAMS
Conservation and energy efficiency activities encourage customers to install energy efficient equipment and weatherization measures and adopt energy saving practices that result
in reduced gas usage while still maintaining a comparable level of service. Conservation and
energy efficiency load impacts are shown as positive numbers. The “total net load impact” is the natural gas throughput reduction resulting from the Energy Efficiency programs.
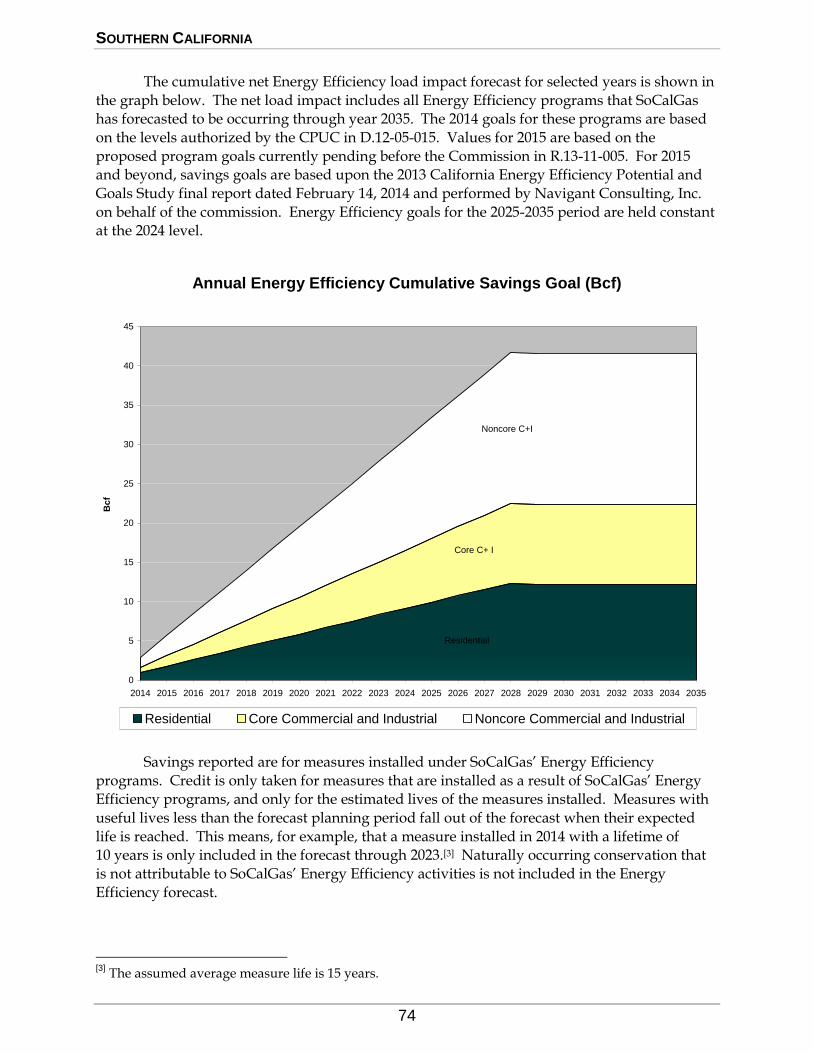
SOUTHERN CALIFORNIA
74
The cumulative net Energy Efficiency load impact forecast for selected years is shown in
the graph below. The net load impact includes all Energy Efficiency programs that SoCalGas
has forecasted to be occurring through year 2035. The 2014 goals for these programs are based
on the levels authorized by the CPUC in D.12-05-015. Values for 2015 are based on the
proposed program goals currently pending before the Commission in R.13-11-005. For 2015 and beyond, savings goals are based upon the 2013 California Energy Efficiency Potential and
Goals Study final report dated February 14, 2014 and performed by Navigant Consulting, Inc.
on behalf of the commission. Energy Efficiency goals for the 2025-2035 period are held constant at the 2024 level.
Annual Energy Efficiency Cumulative Savings Goal (Bcf)
Savings reported are for measures installed under SoCalGas’ Energy Efficiency
programs. Credit is only taken for measures that are installed as a result of SoCalGas’ Energy Efficiency programs, and only for the estimated lives of the measures installed. Measures with
useful lives less than the forecast planning period fall out of the forecast when their expected
life is reached. This means, for example, that a measure installed in 2014 with a lifetime of 10 years is only included in the forecast through 2023.[3] Naturally occurring conservation that
is not attributable to SoCalGas’ Energy Efficiency activities is not included in the Energy
Efficiency forecast.
[3]
The assumed average measure life is 15 years.
0
5
10
15
20
25
30
35
40
45
2014 2015 2016 2017 2018 2019 2020 2021 2022 2023 2024 2025 2026 2027 2028 2029 2030 2031 2032 2033 2034 2035
Bc
f
Residential Core Commercial and Industrial Noncore Commercial and Industrial
Residential
Core C+ I
Noncore C+I
SOUTHERN CALIFORNIA
75
Details of SoCalGas’ Energy Efficiency program portfolio are contained in D.12-05-015
and D.12-15-015. The Energy Efficiency portfolio for program year 2015 and forward is
currently being considered in R.13-11-005.
SOUTHERN CALIFORNIA
76
GAS SUPPLY, CAPACITY, AND STORAGE
GAS SUPPLY SOURCES
Southern California Gas Company and San Diego Gas & Electric Company receive gas supplies from several sedimentary basins in the Western United States and Canada including
supply basins located in New Mexico (San Juan Basin), West Texas (Permian Basin), the Rocky
Mountains, Western Canada, and local California supplies. Recorded 2009 through 2013 receipts from gas supply sources can be found in the Sources and Disposition tables in the
Executive Summary.
CALIFORNIA GAS
Gas supply available to SoCalGas from California sources averaged 153 MMcf/day in
2013.
SOUTHWESTERN U.S. GAS
Traditional Southwestern U.S. sources of natural gas, especially from the San Juan Basin, will continue to supply most of Southern California’s natural gas demand. This gas is primarily
delivered via the El Paso Natural Gas and Transwestern pipelines. The San Juan Basin’s gas
supplies peaked in 1999 and have been declining at an annual rate of roughly 3%, but at a faster rate in recent years. The Permian Basin’s share of supply into Southern California has increased
in recent years, although increasing demand in Mexico for natural gas supplies may
significantly reduce the volume of Permian Basin supply available to Southern California in the future. In A.13-12-013, SoCalGas and SDG&E have discussed this situation in more detail and
have proposed a response to the operational concerns this situation creates for California.
ROCKY MOUNTAIN GAS
Rocky Mountain supply supplements traditional Southwestern U.S. gas sources for
Southern California. This gas is delivered to Southern California primarily on the Kern River Gas Transmission Company’s pipeline, although there is also access to Rockies gas through
pipelines interconnected to the San Juan Basin. Production from the Rocky Mountain region in
2013 has doubled since 2000 due to the successful applications of new technology to drill for coal-bed methane gas. In recent years, Rocky Mountain gas has increasingly flowed to
Midwestern and Pacific Northwest markets.
SOUTHERN CALIFORNIA
77
CANADIAN GAS
SoCalGas anticipates that the role of Canadian gas in meeting Southern California’s demand during the forecast period will not change significantly. Eventually, LNG exports to
Asia may move Canadian gas away from California. Increased gas deliveries to California from
the Rockies and Permian Basin are expected to replace these supplies.
BIOGAS
Biogas is a mixture of methane and carbon dioxide produced by the bacterial degradation of organic matter. Biogas is a byproduct produced from processes including, but
not limited to, anaerobic digestion, anaerobic decomposition, and thermo-chemical
decomposition under sub-stoichiometric conditions. These processes are applied to
biodegradable biomass materials, such as livestock manure, wastewater sewage, food waste,
and green waste. When biogas is conditioned/upgraded to pipeline quality specifications,
commonly referred to as “biomethane,” it can be interconnected to a gas utility’s pipeline and nominated for a specific end-use customer.[4] Biomethane may also be consumed onsite for a
variety of uses, including elected power generation from internal combustion engines, fuel cells,
and turbines, or as a fuel source for natural gas vehicles. Currently, there are instances where biogas is being vented naturally or flared to the atmosphere. Venting and flaring wastes this
valuable renewable resource and fails to support the state in achieving its emission reduction
targets set forth by Assembly Bill (“AB”) 32 and the Renewables Portfolio Standard (“RPS”) goals, as processed renewable natural gas injected into a common carrier natural gas pipeline
system can ultimately count toward satisfying AB 32 and RPS goals.
In February 2013, the CPUC issued an Order Instituting Rulemaking (“Rulemaking”) to adopt standards and requirements, open access rules, and related enforcement provisions,
pursuant to Assembly Bill 1900 (Gatto), which tasked state agencies to address any constituents
of concern specifically found in biomethane, and to identify impediments to interconnecting to utility pipelines.[5] CARB released their report on May 15, 2013 which identifies 17 constituents
of concern found in biomethane and provides direction on monitoring, testing, reporting and
recordkeeping procedures for utilities and biomethane suppliers. The first phase of the Rulemaking - the identification of constituents of concern – resulted in the utilities filing revised
tariff rules governing gas quality specifications in February 2014. The second phase of the
Rulemaking began in April 2014 to determine “who should bear the costs of complying with the CPUC-adopted testing, monitoring, reporting, and recordkeeping requirements.”
[4]
SoCalGas’ Tariff Rule 30 (http://socalgas.com/regulatory/tariffs/tm2/pdf/30.pdf) must be met in order to qualify for pipeline injection into SoCalGas’ gas pipeline system. [5]
February 13, 2013 Order Instituting Rulemaking to Adopt Biomethane Standards and Requirements, Pipeline Open Access Rules, and Related Enforcement Provisions. http://docs.cpuc.ca.gov/PublishedDocs/Published/G000/M050/K674/50674934.PDF.
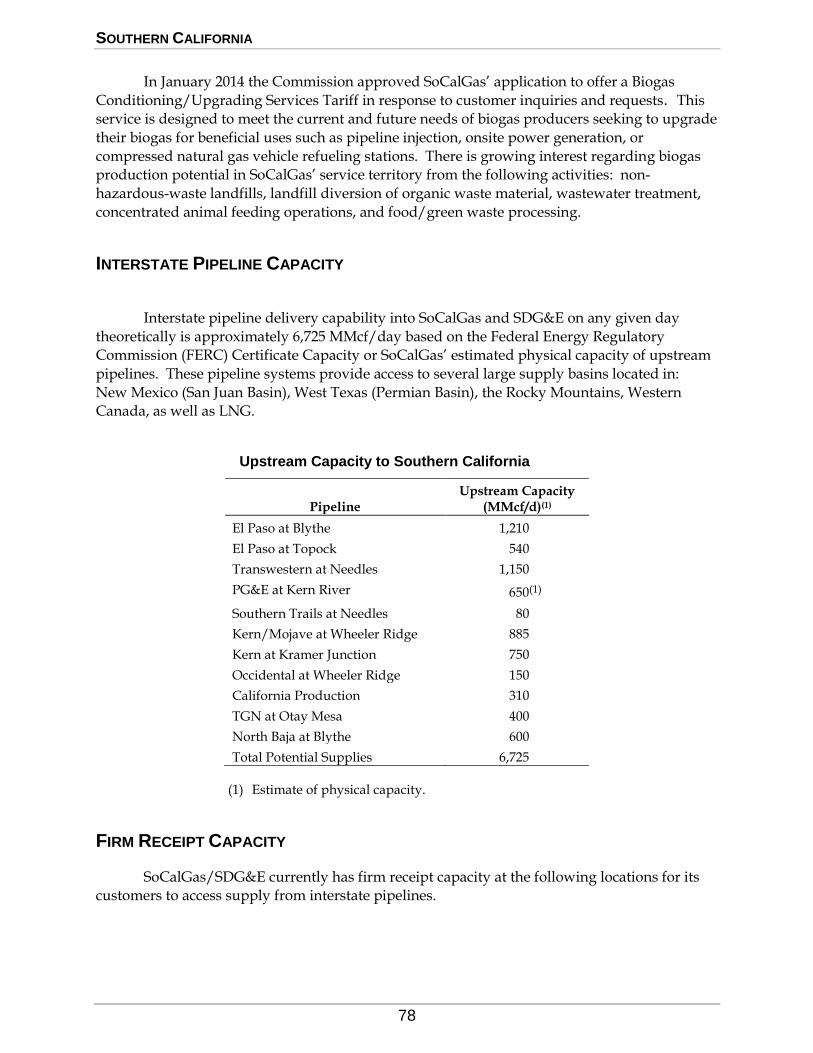
SOUTHERN CALIFORNIA
78
In January 2014 the Commission approved SoCalGas’ application to offer a Biogas
Conditioning/Upgrading Services Tariff in response to customer inquiries and requests. This
service is designed to meet the current and future needs of biogas producers seeking to upgrade
their biogas for beneficial uses such as pipeline injection, onsite power generation, or
compressed natural gas vehicle refueling stations. There is growing interest regarding biogas production potential in SoCalGas’ service territory from the following activities: non-
hazardous-waste landfills, landfill diversion of organic waste material, wastewater treatment,
concentrated animal feeding operations, and food/green waste processing.
INTERSTATE PIPELINE CAPACITY
Interstate pipeline delivery capability into SoCalGas and SDG&E on any given day
theoretically is approximately 6,725 MMcf/day based on the Federal Energy Regulatory
Commission (FERC) Certificate Capacity or SoCalGas’ estimated physical capacity of upstream
pipelines. These pipeline systems provide access to several large supply basins located in:
New Mexico (San Juan Basin), West Texas (Permian Basin), the Rocky Mountains, Western Canada, as well as LNG.
Upstream Capacity to Southern California
Pipeline Upstream Capacity
(MMcf/d)(1)
El Paso at Blythe 1,210
El Paso at Topock 540
Transwestern at Needles 1,150
PG&E at Kern River 650(1)
Southern Trails at Needles 80
Kern/Mojave at Wheeler Ridge 885
Kern at Kramer Junction 750
Occidental at Wheeler Ridge 150
California Production 310
TGN at Otay Mesa 400
North Baja at Blythe 600
Total Potential Supplies 6,725
(1) Estimate of physical capacity.
FIRM RECEIPT CAPACITY
SoCalGas/SDG&E currently has firm receipt capacity at the following locations for its customers to access supply from interstate pipelines.

SOUTHERN CALIFORNIA
79
SoCalGas/SDG&E Current Firm Receipt Capacity
Transmission Zone
Total Transmission Zone Firm Access (MMcf/d)
Specific Point of Access(1) (Limitations)(2) (MMcf/d)
Southern 1,210 EPN Ehrenberg (1,010) TGN Otay Mesa (400) NBP Blythe (600)
Northern 1,590 EPN Topock (540) TW North Needles (800) QST North Needles (120) KR Kramer Junction (550)
Wheeler Ridge 765 KR/MP Wheeler Ridge (765) PG&E Kern River Station (520) OEHI Gosford (150)
Line 85 160 California Supply
Coastal 150 California Supply
Other N/A California Supply
Total 3,875
(1) Pipelines
EPN: El Paso Natural Gas Pipeline TGN: Transportadora de Gas Natural de Baja California NBP: North Baja Pipeline TW: Transwestern Pipeline MP: Mojave Pipeline QST: Questar Southern Trails Pipeline KR: Kern River Pipeline PG&E: Pacific Gas and Electric OEHI: Occidental of Elk Hills
(2) Transmission Zone Contract Limitations:
Southern Zone: In total EPN Ehrenberg and NBP Blythe cannot exceed 1,010 MMcfd. In total EPN Ehrenberg, NBP Blythe and TGN Otay Mesa cannot exceed
1,210 MMcfd. Northern Zone:
In total TW at Topock and EPN at Topock cannot exceed 540 MMcfd. In total TW at North Needles and QST at North Needles cannot exceed 800 MMcfd. In total TW at North Needles, TW Topock, EPN Topock, QST North Needles and
KR Kramer Junction cannot exceed 1,590 MMcfd. Wheeler Ridge Zone:
In total PG&E at Kern River Station and OEHI at Gosford cannot exceed 520 MMcfd.
In total PG&E Kern River Station, OEHI Gosford, and KR/MP Wheeler Ridge cannot exceed 765 MMcfd.
STORAGE
Underground storage of natural gas plays a vital role in balancing the region’s energy supply and demand. SoCalGas owns and operates four underground storage facilities located
SOUTHERN CALIFORNIA
80
at Aliso Canyon, Honor Rancho, Goleta and Playa Del Rey. These facilities play a vital role in
balancing the region’s energy supply and demand.
Of SoCalGas’ total 137.1 Bcf of storage capacity, 83 Bcf is allocated to our core
residential, small industrial and commercial customers. About 4.2 Bcf of space is used for
system balancing. The remaining capacity is available to other customers.
SOUTHERN CALIFORNIA
81
REGULATORY ENVIRONMENT
State Regulatory Matters
TRIENNIAL COST ALLOCATION PROCEEDING (TCAP)
SoCalGas and SDG&E filed their TCAP, A.11-11-002 in November 2011. The application
updated throughput forecasts, cost allocation, and rates by customer class for 2013 through
2015, in addition to addressing issues related to the prior settlement agreements adopted in SoCalGas and SDG&E’s previous cost allocation proceeding. A February 2012 Ruling has
subsequently bifurcated the TCAP into two phases; Phase I addresses the Pipeline Safety
Enhancement Plans (PSEP) originally filed by SoCalGas and SDG&E in Commission Rulemaking R.11-02-019. SoCalGas and SDG&E’s PSEP seeks funding for safety enhancement
projects for the years 2012 through 2015.
Phase 2 of the TCAP addresses cost allocation including all issues raised by SoCalGas and SDG&E in their original TCAP application (A.11-11-002) to allocate the cost of service to
various customer classes to recover the cost of service from the respective rate base. In addition,
Phase 2 includes the costs of the PSEP addressed in Phase 1. A proposed decision was issued in April 2014 addressing both Phase 1 and 2 of the TCAP. A final decision is anticipated in 2014.
PIPELINE SAFETY
On February 24, 2011, the CPUC approved an Order Instituting Rulemaking (OIR) to
develop and adopt new regulations on pipeline safety. Through the OIR, the Commission will
develop and adopt safety regulations that address topics such as construction standards, shut-off valves, maintenance requirements, records management and retention, ratemaking, and penalty
provisions.
On June 9, 2011, the CPUC issued a decision requiring that the utilities file a plan to pressure test or replace transmission pipelines that have not been pressure tested. SoCalGas/SDG&E jointly
filed their comprehensive Pipeline Safety Enhancement Plan (PSEP) on August 26, 2011. The
comprehensive plan covers all of the utilities' approximately 4,000 miles of transmission lines (3,750 miles for SoCalGas and 250 miles for SDG&E) and would be implemented in two phases.
Phase 1 focuses on populated areas of SoCalGas' and SDG&E's service territories and, if approved,
would be implemented over a 10-year period, from 2012 to 2022. Phase 2 covers unpopulated areas of SoCalGas' and SDG&E's service territories and will be filed with the CPUC at a later date.
The Utilities’ Pipeline Safety Enhancement Plan was transferred for consideration from the
Pipeline Safety Rulemaking to the Utilities’ Triennial Cost Allocation Proceeding. A final decision was issued in May 2014 which adopts the overall plan and a process to recover the associated costs
subject to reasonableness reviews.
SOUTHERN CALIFORNIA
82
SOUTHERN GAS SYSTEM RELIABILITY PROJECT
On December 20, 2013, SoCalGas and SDG&E filed an application proposing enhancements to the reliability of its Southern System. The proposal requests authority to collect $628.6 million in
customer rates to construct a North-to-South Pipeline from SoCalGas’ Adelanto compressor station
near Victorville down to the Moreno pressure limiting station in Moreno Valley. The pipeline will be a new source of up to 800 million cubic feet of gas per day to the Southern System and would
provide an additional 300 million cubic feet of backbone capacity per day in the northern part of the
SoCalGas system. Together, these enhancements will increase reliability to Southern System customers and to the generators supporting the electric grid.
The North-South Project consists of three major components:
Adelanto – Moreno Pipeline $331.8M
Adelanto Compressor Station $110.7M
Moreno-Whitewater Pipeline $186.1M
Total $628.6M
A Commission decision is expected in 2015. The expected in-service date for the North-South Project, subject to environmental permitting, is late 2018.
FEDERAL REGULATORY MATTERS
SoCalGas and SDG&E participate in FERC proceedings involving interstate natural gas
pipelines serving California that can affect the cost of gas delivered to their customers. SoCalGas holds contracts for interstate transportation capacity on the El Paso, Kern River, Transwestern, and
GTN pipelines. SoCalGas and SDG&E also participate in FERC proceedings involving the natural
gas industry generally as those proceedings may impact their operations and policies.
El Paso
El Paso’s rates have been the subject of extensive litigation at FERC in recent years. El Paso
filed its third general rate case in five years in September 2010. The 2010 rate case proceeded to a
hearing on all issues in 2011, and we are still awaiting a final decision on these matters in 2014.
During 2012-13, El Paso filed applications to abandon certain compression facilities used to
transport San Juan Basin gas supplies to interconnects with the SoCalGas and PG&E systems. The FERC approved one application to abandon compression facilities and El Paso withdrew the other
application

SOUTHERN CALIFORNIA
83
Also during 2012-13, El Paso filed several applications to build new or expand on existing
interconnections at the U.S.-Mexican border to transport natural gas supplies into Mexico. The FERC
has approved most of these applications.
Kern River
A final ruling was issued in 2013 in Kern River’s 2004 general rate case. The ruling denied many rehearing requests to revisit the issues litigated in this case and accepted a series of orders
retaining Kern River’s original 1992 levelized rate design, resulting in reduced rates for eligible
shippers which extend for periods up to 15 years.
Transwestern
Under the terms of its 2011 rate case settlement, Transwestern agreed to retain its existing
tariff rates. Under the settlement, the fuel rate for San Juan Basin gas supplies delivered to California will decrease annually from 2012-2014. The earliest that Transwestern may file for a change in rates
is October 1, 2014.
Gas Transmission Northwest (GTN)
In December 2011 FERC approved a rate case settlement between GTN and its customers.
Under the settlement, transportation rates for Canadian gas supplies delivered to California are
reduced for the four-year term of 2012-2015.
Coordination Between Gas and Electric Markets
In February 2012, FERC opened a proceeding to receive comments concerning potential
revisions to coordinate scheduling protocols and emergency response measures between gas and electricity markets. Discussions are underway in 2014 to consider changing the start of the nationwide gas day to better accommodate load nominations between gas and electric energy markets. The nationwide gas day is currently set at 9 am Central Time.
GREENHOUSE GAS ISSUES
National Policy
National greenhouse gas (GHG) policy is currently under development. In general, the programs will all be designed to reduce national GHG emissions, and the electric utility sector will
bear much of the reduction requirements.
SOUTHERN CALIFORNIA
84
Restriction on New Conventional Coal Generation
In March 2012, EPA proposed the first Clean Air Act standards for carbon pollution. The proposed standards apply only to new facilities and can be met by a range of power generation
facilities burning fossil fuels, including natural gas or coal with technologies to reduce carbon
emissions. Since carbon sequestration technology is not yet proven, in the near term, new generation will likely be dependent upon natural gas. Therefore, as California’s electricity demand increases,
California, as well as the rest of the country, will likely become more dependent upon new natural
gas generation to meet the electricity demand that cannot be met through renewable resources.
Motor Vehicle Emissions Reductions
National GHG policy-makers realize that motor vehicles are one of the largest sources of
GHG emissions, and one of the potential solutions is the substitution of natural gas and electricity for
the current diesel and gasoline energy sources. This transition to cleaner fuels will also increase the
demand for both natural gas and natural gas-generated electricity. Under EPA’s Mandatory Reporting of Greenhouse Gases rule, all vehicle and engine manufacturers outside of the light-duty
sector must report emission rates of carbon dioxide, nitrous oxide, and methane from their products.
California Policy
California is in the process of implementing a broad portfolio of policies and regulations
aimed at reducing greenhouse gas (GHG) emissions. This process is a collaborative effort underway at the CPUC, the CEC, and CARB. CARB however is statutorily empowered with developing and
implementing the final regulations on GHG regulatory framework and compliance. Approved
policies include both programmatic measures and market-based mechanisms to reduce GHG emissions.
Global Warming Solutions Act of 2006
California enacted the Global Warming Solutions Act, also known as AB 32, to help avoid
potential climate change-related damage to the economy, public health and the environment. The
legislation requires the state to reduce GHG emissions to 1990 levels by 2020 and directs CARB to develop policies and programs to achieve this goal. CARB adopted its final Scoping Plan in 2009,
which includes new and existing emissions reduction measures including a low-carbon fuel
standard, energy efficiency and conservation measures, RPS for electricity generation and a market-based emissions cap-and-trade program.
Low Carbon Fuel Standard
On January 18, 2007, former Governor Schwarzenegger signed an Executive Order
establishing the low carbon fuel standard (LCFS). LCFS requires a 10 percent carbon intensity
SOUTHERN CALIFORNIA
85
reduction by 2020 in the transportation sector. It is recognized that 40 percent of California’s GHG
emissions are attributable to the transportation sector and 96 percent of the state’s transportation
needs require petroleum-based fuels. The LCFS requires fuel providers to ensure that the mix of fuel
they sell into the California market meets, on average, a declining standard for GHG emissions
measured in CO2 equivalent gram per unit of fuel energy sold. As stated above, the transition to cleaner fuels will increase the demand for both natural gas and natural gas-generated electricity in
order to meet the needs of a cleaner state transportation fleet, which will increasingly utilize
electricity and natural gas in the future. Further, the CPUC has recently authorized the utilities to sell LCFS credits generated both by their use of low-carbon fuel vehicles and those generated by public
refueling stations. The revenue generated by the sale of these credits will be returned to the
customers who generated the credits, further enhancing the value of low-carbon fuels.
Cap and Trade Program
The AB 32 Cap and Trade Program was approved by the Office of Administrative Law in December 2011. The Regulation became effective January 1, 2012. The GHG emissions cap drops by
about 2% per year in the initial period and then by about 3% a year through 2020. The 2020 cap is
about 15% below 2012 levels. Approximately 85% of the GHG emissions in California are covered under the cap. Industrial sources, the electricity sector, and natural gas suppliers start out with free
allocations of emissions allowances. The remainder of the allowances will be sold at auctions, which
are being held on a quarterly basis beginning in November 2012.
The first compliance period began January 1, 2013 for electricity, including imports, and large
industrial facilities with CO2 emissions equal to or greater than 25,000 metric tons per year. The
second compliance period is 2015-2017 and adds distributors of transportation fuels, natural gas, and
other fuels. The third compliance period, which includes all covered sectors, is 2018-2020. Currently,
several of SoCalGas’ and one of SDG&E’s compressor stations have a compliance obligation under
the Cap and Trade Program. SoCalGas and SDG&E have begun purchasing emissions allowances to cover their GHG emissions related to the compressor stations.
In 2015, SoCalGas’ and SDG&E’s small and medium-sized customers (fewer than 25,000 tons
CO2/yr or 4.7 million therms/yr) will be part of the AB 32 Cap and Trade Program. CARB allocated free allowances to Electric utilities to help offset the cost of AB 32 programs for customers. CARB
will allocate allowances to gas utilities on behalf of their customers beginning in 2015. The allocation
decreases in conjunction with the overall GHG cap. A portion of these free allowances must be consigned to auction, with the majority of the revenues generated from these sales returned to
ratepayers
The CPUC is currently considering rules that would govern how the natural gas utilities would procure the necessary compliance instruments, the cost recovery and rate design mechanisms,
and the method for returning consignment revenues to ratepayers.
Programmatic Emission Reduction Measures
The CEC, CPUC and CARB are considering or have approved a variety of non market-based
measures to reduce GHG emissions. Some of these programs include: the California Energy
SOUTHERN CALIFORNIA
86
Efficiency Green Building Standards, the Green State Buildings Executive Order, the CPUC’s
adopted goal of “zero net energy” for all new residential construction by 2020 and a similar goal for
commercial buildings by 2030, potential combined heat and power (CHP) and distributed generation
portfolio standards or feed-in tariffs, and increasing the electric renewables portfolio standard to
33%. Energy Efficiency and renewables are considered fundamental to GHG emission reduction in the electric sector. As a result, integration of additional renewables will require quick-start peaking
capacity for firming and shaping of intermittent power, which in the foreseeable future will be gas-
fired combustion turbines.

SOUTHERN CALIFORNIA
87
GAS PRICE FORECAST
MARKET CONDITION
Current North American production from conventional supplies has been declining, particularly at the Western Canadian Sedimentary Basin and offshore production in the Gulf of
Mexico. However, with advanced technology in horizontal drilling, proven reserves from
unconventional resources have been soaring due to the unlocking of trapped gas from shale, tight sands and coal bed methane in the Mid-Continent, the Rockies and the Eastern U.S. The
new technology is successful at finding trapped gas that was not economical before but is now
due to technological breakthroughs that have reduced development costs substantially. The
aggressive expansion in the production of shale gas in the Mid-Continent, the Eastern U.S. and
Canada and continuing growing production of coal bed methane in the Rockies is expected to
moderate some of the price pressure in the next few years although reductions in conventional sources and possible exports of U.S. sourced LNG could offset that price moderation to some
degree.
With world-wide LNG prices still higher than the current price at Henry Hub, LNG imports in the short-term are expected to be limited with only a minor impact on domestic
supply or price. LNG however is expected to moderate winter gas price increases as LNG will
be withdrawn from storage during peak demand periods. LNG deliveries into the Southwest U.S. from the Energia Costa Azul LNG receiving terminal in Baja California, Mexico, have
occurred in limited quantities to date. In the long-run, more LNG will be available when the
new generation of liquefaction trains are reliably operated; although world-wide demand will most likely dictate the amount of LNG supplies delivered to North America. Although some
LNG imports are expected to continue in the forecast period, U.S. sourced LNG exports are also
likely and will possibly reduce natural gas supply availability in the U.S.
Industry experts now forecast that gas supplies can be expected to be more plentiful and
less volatile during the forecast period. Increased shale gas production and increased LNG
liquefaction supplies combined with a mild worldwide economic recovery are expected to moderate prices in the medium term. However, increasing demand for clean natural gas for
electric power generation, natural gas vehicles fuel, and substitution of gas for coal in electric
power production to meet GHG reduction goals will continue to put upward pressure on prices in the longer term.
DEVELOPMENT OF THE FORECAST
In constant 2013 dollars, natural gas prices are expected to average out at $4.91/MMbtu
in 2014 and increase by about 1.2 percent per year through 2035.
Consistent with the prior CGR practices, the 2014 CGR gas price forecast was developed using a combination of market prices and fundamental forecasts. NYMEX futures prices were
used for the 2014-2018 period. Fundamental price forecasts were used for 2021 and beyond.

SOUTHERN CALIFORNIA
88
The forecasts for 2019 and 2020 reflect a blending of market and fundamental prices, with
declining weights for market prices (and corresponding increasing weights for the fundamental
price forecast) over the two-year period. The fundamental gas price forecast represents an
average of the forecasts developed by the CEC and independent consultants.
It is important to recognize that the natural gas price forecast is inherently uncertain.
SoCalGas and the participants of the 2014 CGR do not warrant the accuracy of the gas price
projection. In no event shall SoCalGas or the participants of the 2014 CGR be liable for the use of or reliance on this natural gas price forecast.
Natural Gas Price at the Southern California Border
$0.00
$1.00
$2.00
$3.00
$4.00
$5.00
$6.00
$7.00
20
13
20
14
20
15
20
16
20
17
20
18
20
19
20
20
20
21
20
22
20
23
20
24
20
25
20
26
20
27
20
28
20
29
20
30
20
31
20
32
20
33
20
34
20
35
Co
ns
tan
t 2
01
3 $
/MM
BT
U
Natural Gas Price at the Southern California Border
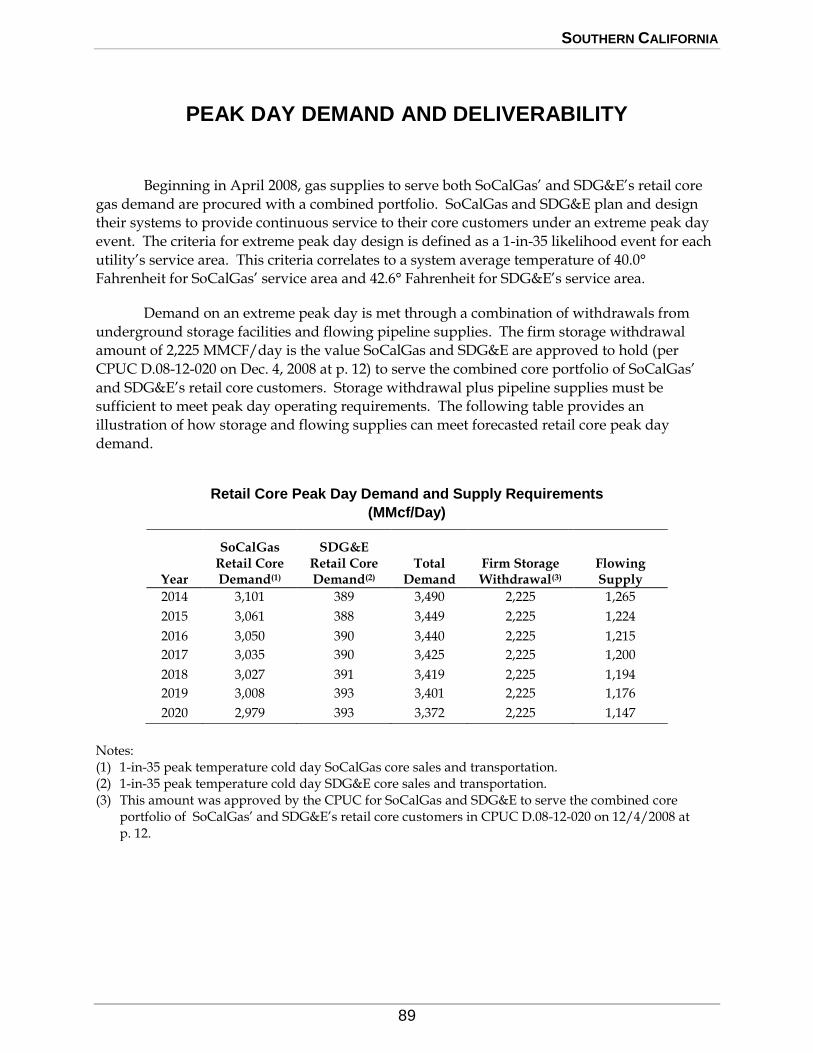
SOUTHERN CALIFORNIA
89
PEAK DAY DEMAND AND DELIVERABILITY
Beginning in April 2008, gas supplies to serve both SoCalGas’ and SDG&E’s retail core
gas demand are procured with a combined portfolio. SoCalGas and SDG&E plan and design their systems to provide continuous service to their core customers under an extreme peak day
event. The criteria for extreme peak day design is defined as a 1-in-35 likelihood event for each
utility’s service area. This criteria correlates to a system average temperature of 40.0° Fahrenheit for SoCalGas’ service area and 42.6° Fahrenheit for SDG&E’s service area.
Demand on an extreme peak day is met through a combination of withdrawals from
underground storage facilities and flowing pipeline supplies. The firm storage withdrawal
amount of 2,225 MMCF/day is the value SoCalGas and SDG&E are approved to hold (per
CPUC D.08-12-020 on Dec. 4, 2008 at p. 12) to serve the combined core portfolio of SoCalGas’
and SDG&E’s retail core customers. Storage withdrawal plus pipeline supplies must be sufficient to meet peak day operating requirements. The following table provides an
illustration of how storage and flowing supplies can meet forecasted retail core peak day
demand.
Retail Core Peak Day Demand and Supply Requirements
(MMcf/Day)
Year
SoCalGas Retail Core Demand(1)
SDG&E Retail Core Demand(2)
Total Demand
Firm Storage Withdrawal(3)
Flowing Supply
2014 3,101 389 3,490 2,225 1,265
2015 3,061 388 3,449 2,225 1,224
2016 3,050 390 3,440 2,225 1,215
2017 3,035 390 3,425 2,225 1,200
2018 3,027 391 3,419 2,225 1,194
2019 3,008 393 3,401 2,225 1,176
2020 2,979 393 3,372 2,225 1,147
Notes: (1) 1-in-35 peak temperature cold day SoCalGas core sales and transportation. (2) 1-in-35 peak temperature cold day SDG&E core sales and transportation. (3) This amount was approved by the CPUC for SoCalGas and SDG&E to serve the combined core
portfolio of SoCalGas’ and SDG&E’s retail core customers in CPUC D.08-12-020 on 12/4/2008 at p. 12.
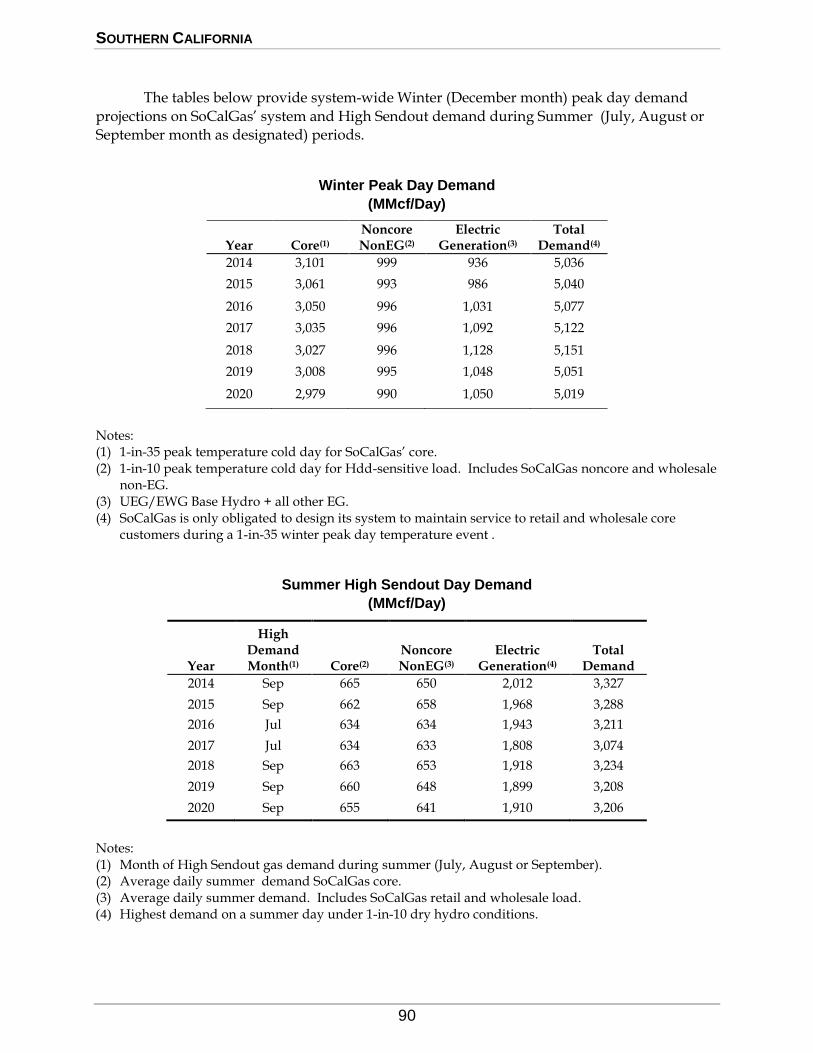
SOUTHERN CALIFORNIA
90
The tables below provide system-wide Winter (December month) peak day demand
projections on SoCalGas’ system and High Sendout demand during Summer (July, August or September month as designated) periods.
Winter Peak Day Demand
(MMcf/Day)
Year Core(1) Noncore NonEG(2)
Electric Generation(3)
Total Demand(4)
2014 3,101 999 936 5,036
2015 3,061 993 986 5,040
2016 3,050 996 1,031 5,077
2017 3,035 996 1,092 5,122
2018 3,027 996 1,128 5,151
2019 3,008 995 1,048 5,051
2020 2,979 990 1,050 5,019
Notes: (1) 1-in-35 peak temperature cold day for SoCalGas’ core. (2) 1-in-10 peak temperature cold day for Hdd-sensitive load. Includes SoCalGas noncore and wholesale
non-EG. (3) UEG/EWG Base Hydro + all other EG. (4) SoCalGas is only obligated to design its system to maintain service to retail and wholesale core
customers during a 1-in-35 winter peak day temperature event .
Summer High Sendout Day Demand
(MMcf/Day)
Year
High Demand Month(1) Core(2)
Noncore NonEG(3)
Electric Generation(4)
Total Demand
2014 Sep 665 650 2,012 3,327
2015 Sep 662 658 1,968 3,288
2016 Jul 634 634 1,943 3,211
2017 Jul 634 633 1,808 3,074
2018 Sep 663 653 1,918 3,234
2019 Sep 660 648 1,899 3,208
2020 Sep 655 641 1,910 3,206
Notes: (1) Month of High Sendout gas demand during summer (July, August or September). (2) Average daily summer demand SoCalGas core. (3) Average daily summer demand. Includes SoCalGas retail and wholesale load. (4) Highest demand on a summer day under 1-in-10 dry hydro conditions.
SOUTHERN CALIFORNIA
91
2 0 1 4 C A L I F O R N I A G A S R E P O R T
SOUTHERN CALIFORNIA GAS COMPANY TABULAR DATA

SOUTHERN CALIFORNIA
92
SOUTHERN CALIFORNIA GAS COMPANY
ANNUAL GAS SUPPLY AND SENDOUT - MMCF/DAY
RECORDED YEARS 2009 TO 2013
Line CAPACITY AVAILABLE 2009 2010 2011 2012 20131 California Source Gas Out-of-State Gas2 California Offshore -POPCO / PIOC3 El Paso Natural Gas Co.4 Transwestern Pipeline Co.5 Kern / Mojave6 PGT / PG&E7 Other8 Total Out-of-State Gas 9 TOTAL CAPACITY AVAILABLE GAS SUPPLY TAKEN
10 California Source Gas 216 203 175 148 153 Out-of-State Gas
11 Other Out-of-State 2,397 2,445 2,452 2,728 2,51412 Total Out-of-State Gas 2,397 2,445 2,452 2,728 2,514
13 TOTAL SUPPLY TAKEN 2,613 2,648 2,627 2,876 2,66714 Net Underground Storage Withdrawal 8 (10) (4) (42) 106
15 TOTAL THROUGHPUT (1)(2) 2,621 2,638 2,623 2,834 2,773 DELIVERIES BY END-USE (3)
16 Core Residential 645 673 696 644 64617 Commercial 210 216 217 216 22218 Industrial 59 61 61 61 6219 NGV 26 27 28 29 3120 Subtotal 940 977 1,002 950 961
21 Noncore Commercial 56 59 60 60 6022 Industrial 324 361 363 365 36823 EOR Steaming 35 30 27 29 3524 Electric Generation 811 768 726 922 84825 Subtotal 1,226 1,218 1,176 1,376 1,311
26 412 412 407 477 465
27 Co. Use & LUAF 43 31 38 31 36
28 SYSTEM TOTAL-THROUGHPUT (1)(2) 2,621 2,638 2,623 2,834 2,773 TRANSPORTATION AND EXCHANGE
29 Core All End Uses 20 25 29 35 4530 Noncore Commercial/Industrial 380 420 423 425 42831 EOR Steaming 35 30 27 29 3532 Electric Generation 811 768 726 922 84833 Subtotal-Retail 1,246 1,243 1,205 1,411 1,356
34 412 412 407 477 465
35 TOTAL TRANSPORTATION & EXCHANGE 1,658 1,655 1,612 1,888 1,821 CURTAILMENT (RETAIL & WHOLESALE)
36 Core 37 Noncore 38 TOTAL - Curtailment39 REFUSAL
40 Total BTU Factor (Dth/Mcf) 1.0273 1.0235 1.0209 1.0210 1.0266 NOTES: (1) Exclude own-source gas supply of 2 2 1 1 2 procurement by City of Long Beach. (2) Deliveries by end-use includes sales, transportation, and exchange volumes.
(3) Data includes effect of prior period adjustments.
Wholesale/International
Wholesale/International
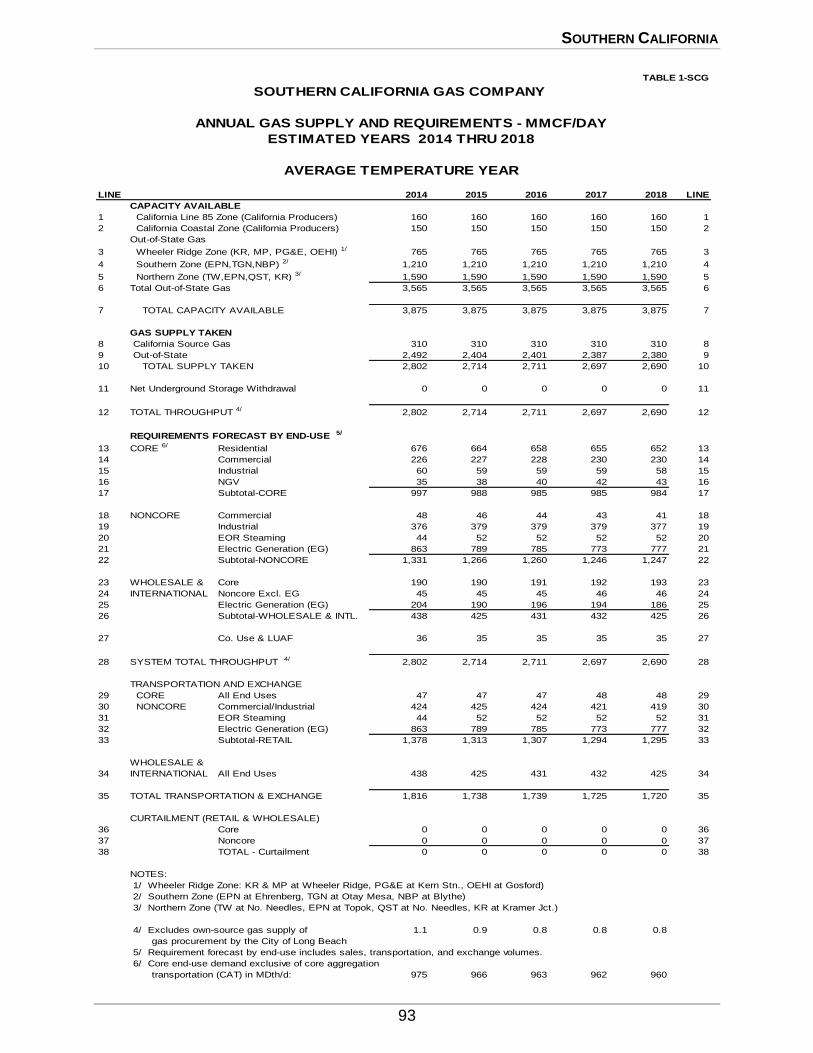
SOUTHERN CALIFORNIA
93
TABLE 1-SCG
SOUTHERN CALIFORNIA GAS COMPANY
ANNUAL GAS SUPPLY AND REQUIREMENTS - MMCF/DAY
ESTIMATED YEARS 2014 THRU 2018
AVERAGE TEMPERATURE YEAR
LINE 2014 2015 2016 2017 2018 LINE
CAPACITY AVAILABLE
1 California Line 85 Zone (California Producers) 160 160 160 160 160 1
2 California Coastal Zone (California Producers) 150 150 150 150 150 2
Out-of-State Gas
3 Wheeler Ridge Zone (KR, MP, PG&E, OEHI) 1/ 765 765 765 765 765 3
4 Southern Zone (EPN,TGN,NBP) 2/ 1,210 1,210 1,210 1,210 1,210 4
5 Northern Zone (TW,EPN,QST, KR) 3/ 1,590 1,590 1,590 1,590 1,590 5
6 Total Out-of-State Gas 3,565 3,565 3,565 3,565 3,565 6
7 TOTAL CAPACITY AVAILABLE 3,875 3,875 3,875 3,875 3,875 7
GAS SUPPLY TAKEN
8 California Source Gas 310 310 310 310 310 8
9 Out-of-State 2,492 2,404 2,401 2,387 2,380 9
10 TOTAL SUPPLY TAKEN 2,802 2,714 2,711 2,697 2,690 10
11 Net Underground Storage Withdrawal 0 0 0 0 0 11
12 TOTAL THROUGHPUT 4/ 2,802 2,714 2,711 2,697 2,690 12
REQUIREMENTS FORECAST BY END-USE 5/
13 CORE 6/ Residential 676 664 658 655 652 13
14 Commercial 226 227 228 230 230 14
15 Industrial 60 59 59 59 58 15
16 NGV 35 38 40 42 43 16
17 Subtotal-CORE 997 988 985 985 984 17
18 NONCORE Commercial 48 46 44 43 41 18
19 Industrial 376 379 379 379 377 19
20 EOR Steaming 44 52 52 52 52 20
21 Electric Generation (EG) 863 789 785 773 777 21
22 Subtotal-NONCORE 1,331 1,266 1,260 1,246 1,247 22
23 WHOLESALE & Core 190 190 191 192 193 23
24 INTERNATIONAL Noncore Excl. EG 45 45 45 46 46 24
25 Electric Generation (EG) 204 190 196 194 186 25
26 Subtotal-WHOLESALE & INTL. 438 425 431 432 425 26
27 Co. Use & LUAF 36 35 35 35 35 27
28 SYSTEM TOTAL THROUGHPUT 4/ 2,802 2,714 2,711 2,697 2,690 28
TRANSPORTATION AND EXCHANGE
29 CORE All End Uses 47 47 47 48 48 29
30 NONCORE Commercial/Industrial 424 425 424 421 419 30
31 EOR Steaming 44 52 52 52 52 31
32 Electric Generation (EG) 863 789 785 773 777 32
33 Subtotal-RETAIL 1,378 1,313 1,307 1,294 1,295 33
WHOLESALE &
34 INTERNATIONAL All End Uses 438 425 431 432 425 34
35 TOTAL TRANSPORTATION & EXCHANGE 1,816 1,738 1,739 1,725 1,720 35
CURTAILMENT (RETAIL & WHOLESALE)
36 Core 0 0 0 0 0 36
37 Noncore 0 0 0 0 0 37
38 TOTAL - Curtailment 0 0 0 0 0 38
NOTES:
1/ Wheeler Ridge Zone: KR & MP at Wheeler Ridge, PG&E at Kern Stn., OEHI at Gosford)
2/ Southern Zone (EPN at Ehrenberg, TGN at Otay Mesa, NBP at Blythe)
3/ Northern Zone (TW at No. Needles, EPN at Topok, QST at No. Needles, KR at Kramer Jct.)
4/ Excludes own-source gas supply of 1.1 0.9 0.8 0.8 0.8
gas procurement by the City of Long Beach
5/ Requirement forecast by end-use includes sales, transportation, and exchange volumes.
6/ Core end-use demand exclusive of core aggregation
transportation (CAT) in MDth/d: 975 966 963 962 960
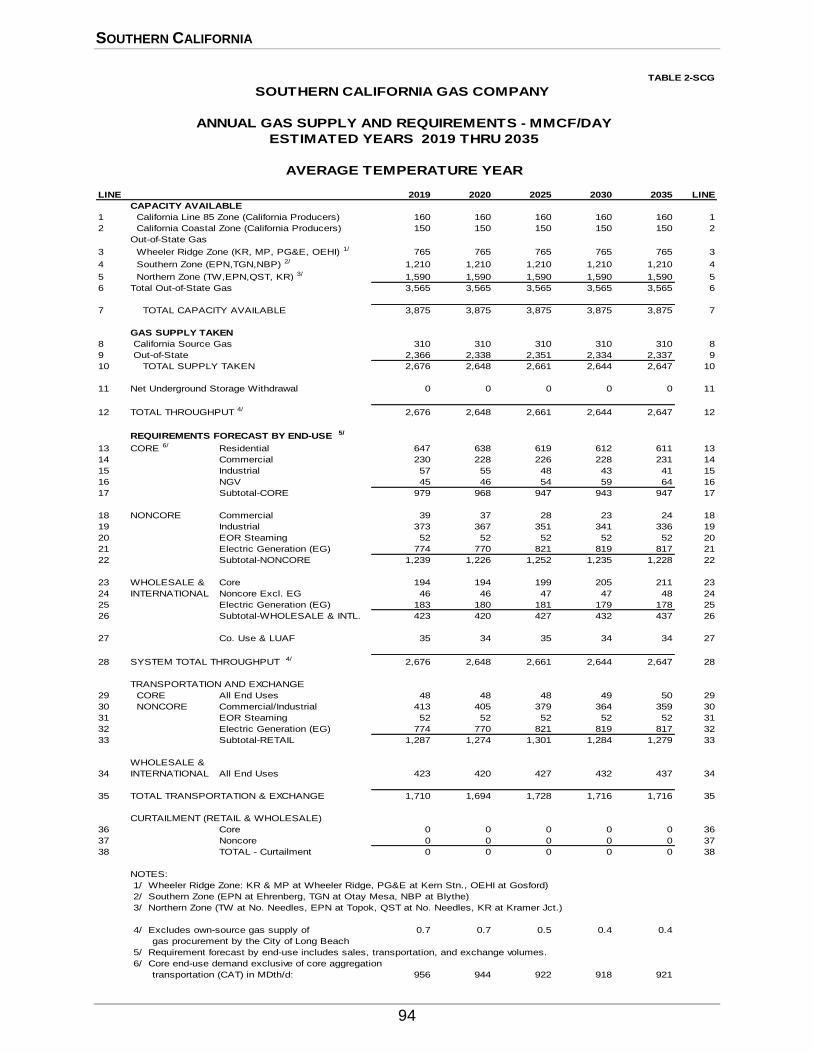
SOUTHERN CALIFORNIA
94
TABLE 2-SCG
SOUTHERN CALIFORNIA GAS COMPANY
ANNUAL GAS SUPPLY AND REQUIREMENTS - MMCF/DAY
ESTIMATED YEARS 2019 THRU 2035
AVERAGE TEMPERATURE YEAR
LINE 2019 2020 2025 2030 2035 LINE
CAPACITY AVAILABLE
1 California Line 85 Zone (California Producers) 160 160 160 160 160 1
2 California Coastal Zone (California Producers) 150 150 150 150 150 2
Out-of-State Gas
3 Wheeler Ridge Zone (KR, MP, PG&E, OEHI) 1/ 765 765 765 765 765 3
4 Southern Zone (EPN,TGN,NBP) 2/ 1,210 1,210 1,210 1,210 1,210 4
5 Northern Zone (TW,EPN,QST, KR) 3/ 1,590 1,590 1,590 1,590 1,590 5
6 Total Out-of-State Gas 3,565 3,565 3,565 3,565 3,565 6
7 TOTAL CAPACITY AVAILABLE 3,875 3,875 3,875 3,875 3,875 7
GAS SUPPLY TAKEN
8 California Source Gas 310 310 310 310 310 8
9 Out-of-State 2,366 2,338 2,351 2,334 2,337 9
10 TOTAL SUPPLY TAKEN 2,676 2,648 2,661 2,644 2,647 10
11 Net Underground Storage Withdrawal 0 0 0 0 0 11
12 TOTAL THROUGHPUT 4/ 2,676 2,648 2,661 2,644 2,647 12
REQUIREMENTS FORECAST BY END-USE 5/
13 CORE 6/ Residential 647 638 619 612 611 13
14 Commercial 230 228 226 228 231 14
15 Industrial 57 55 48 43 41 15
16 NGV 45 46 54 59 64 16
17 Subtotal-CORE 979 968 947 943 947 17
18 NONCORE Commercial 39 37 28 23 24 18
19 Industrial 373 367 351 341 336 19
20 EOR Steaming 52 52 52 52 52 20
21 Electric Generation (EG) 774 770 821 819 817 21
22 Subtotal-NONCORE 1,239 1,226 1,252 1,235 1,228 22
23 WHOLESALE & Core 194 194 199 205 211 23
24 INTERNATIONAL Noncore Excl. EG 46 46 47 47 48 24
25 Electric Generation (EG) 183 180 181 179 178 25
26 Subtotal-WHOLESALE & INTL. 423 420 427 432 437 26
27 Co. Use & LUAF 35 34 35 34 34 27
28 SYSTEM TOTAL THROUGHPUT 4/ 2,676 2,648 2,661 2,644 2,647 28
TRANSPORTATION AND EXCHANGE
29 CORE All End Uses 48 48 48 49 50 29
30 NONCORE Commercial/Industrial 413 405 379 364 359 30
31 EOR Steaming 52 52 52 52 52 31
32 Electric Generation (EG) 774 770 821 819 817 32
33 Subtotal-RETAIL 1,287 1,274 1,301 1,284 1,279 33
WHOLESALE &
34 INTERNATIONAL All End Uses 423 420 427 432 437 34
35 TOTAL TRANSPORTATION & EXCHANGE 1,710 1,694 1,728 1,716 1,716 35
CURTAILMENT (RETAIL & WHOLESALE)
36 Core 0 0 0 0 0 36
37 Noncore 0 0 0 0 0 37
38 TOTAL - Curtailment 0 0 0 0 0 38
NOTES:
1/ Wheeler Ridge Zone: KR & MP at Wheeler Ridge, PG&E at Kern Stn., OEHI at Gosford)
2/ Southern Zone (EPN at Ehrenberg, TGN at Otay Mesa, NBP at Blythe)
3/ Northern Zone (TW at No. Needles, EPN at Topok, QST at No. Needles, KR at Kramer Jct.)
4/ Excludes own-source gas supply of 0.7 0.7 0.5 0.4 0.4
gas procurement by the City of Long Beach
5/ Requirement forecast by end-use includes sales, transportation, and exchange volumes.
6/ Core end-use demand exclusive of core aggregation
transportation (CAT) in MDth/d: 956 944 922 918 921
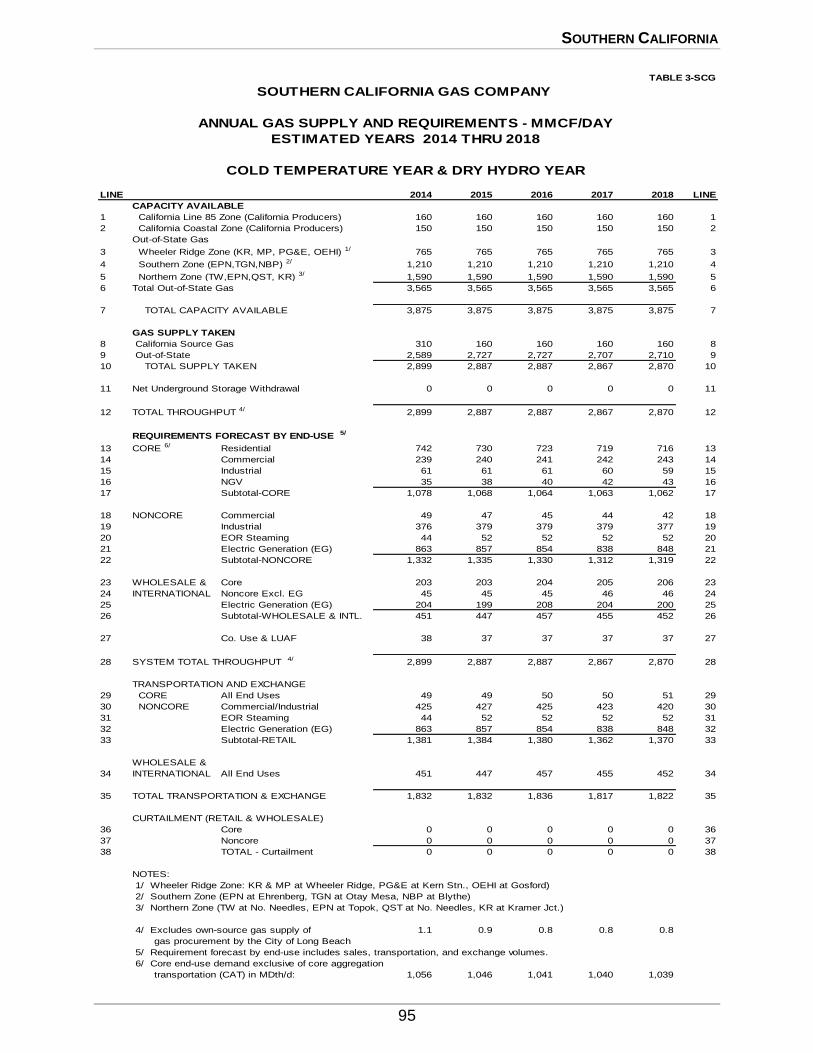
SOUTHERN CALIFORNIA
95
TABLE 3-SCG
SOUTHERN CALIFORNIA GAS COMPANY
ANNUAL GAS SUPPLY AND REQUIREMENTS - MMCF/DAY
ESTIMATED YEARS 2014 THRU 2018
COLD TEMPERATURE YEAR & DRY HYDRO YEAR
LINE 2014 2015 2016 2017 2018 LINE
CAPACITY AVAILABLE
1 California Line 85 Zone (California Producers) 160 160 160 160 160 1
2 California Coastal Zone (California Producers) 150 150 150 150 150 2
Out-of-State Gas
3 Wheeler Ridge Zone (KR, MP, PG&E, OEHI) 1/ 765 765 765 765 765 3
4 Southern Zone (EPN,TGN,NBP) 2/ 1,210 1,210 1,210 1,210 1,210 4
5 Northern Zone (TW,EPN,QST, KR) 3/ 1,590 1,590 1,590 1,590 1,590 5
6 Total Out-of-State Gas 3,565 3,565 3,565 3,565 3,565 6
7 TOTAL CAPACITY AVAILABLE 3,875 3,875 3,875 3,875 3,875 7
GAS SUPPLY TAKEN
8 California Source Gas 310 160 160 160 160 8
9 Out-of-State 2,589 2,727 2,727 2,707 2,710 9
10 TOTAL SUPPLY TAKEN 2,899 2,887 2,887 2,867 2,870 10
11 Net Underground Storage Withdrawal 0 0 0 0 0 11
12 TOTAL THROUGHPUT 4/ 2,899 2,887 2,887 2,867 2,870 12
REQUIREMENTS FORECAST BY END-USE 5/
13 CORE 6/ Residential 742 730 723 719 716 13
14 Commercial 239 240 241 242 243 14
15 Industrial 61 61 61 60 59 15
16 NGV 35 38 40 42 43 16
17 Subtotal-CORE 1,078 1,068 1,064 1,063 1,062 17
18 NONCORE Commercial 49 47 45 44 42 18
19 Industrial 376 379 379 379 377 19
20 EOR Steaming 44 52 52 52 52 20
21 Electric Generation (EG) 863 857 854 838 848 21
22 Subtotal-NONCORE 1,332 1,335 1,330 1,312 1,319 22
23 WHOLESALE & Core 203 203 204 205 206 23
24 INTERNATIONAL Noncore Excl. EG 45 45 45 46 46 24
25 Electric Generation (EG) 204 199 208 204 200 25
26 Subtotal-WHOLESALE & INTL. 451 447 457 455 452 26
27 Co. Use & LUAF 38 37 37 37 37 27
28 SYSTEM TOTAL THROUGHPUT 4/ 2,899 2,887 2,887 2,867 2,870 28
TRANSPORTATION AND EXCHANGE
29 CORE All End Uses 49 49 50 50 51 29
30 NONCORE Commercial/Industrial 425 427 425 423 420 30
31 EOR Steaming 44 52 52 52 52 31
32 Electric Generation (EG) 863 857 854 838 848 32
33 Subtotal-RETAIL 1,381 1,384 1,380 1,362 1,370 33
WHOLESALE &
34 INTERNATIONAL All End Uses 451 447 457 455 452 34
35 TOTAL TRANSPORTATION & EXCHANGE 1,832 1,832 1,836 1,817 1,822 35
CURTAILMENT (RETAIL & WHOLESALE)
36 Core 0 0 0 0 0 36
37 Noncore 0 0 0 0 0 37
38 TOTAL - Curtailment 0 0 0 0 0 38
NOTES:
1/ Wheeler Ridge Zone: KR & MP at Wheeler Ridge, PG&E at Kern Stn., OEHI at Gosford)
2/ Southern Zone (EPN at Ehrenberg, TGN at Otay Mesa, NBP at Blythe)
3/ Northern Zone (TW at No. Needles, EPN at Topok, QST at No. Needles, KR at Kramer Jct.)
4/ Excludes own-source gas supply of 1.1 0.9 0.8 0.8 0.8
gas procurement by the City of Long Beach
5/ Requirement forecast by end-use includes sales, transportation, and exchange volumes.
6/ Core end-use demand exclusive of core aggregation
transportation (CAT) in MDth/d: 1,056 1,046 1,041 1,040 1,039
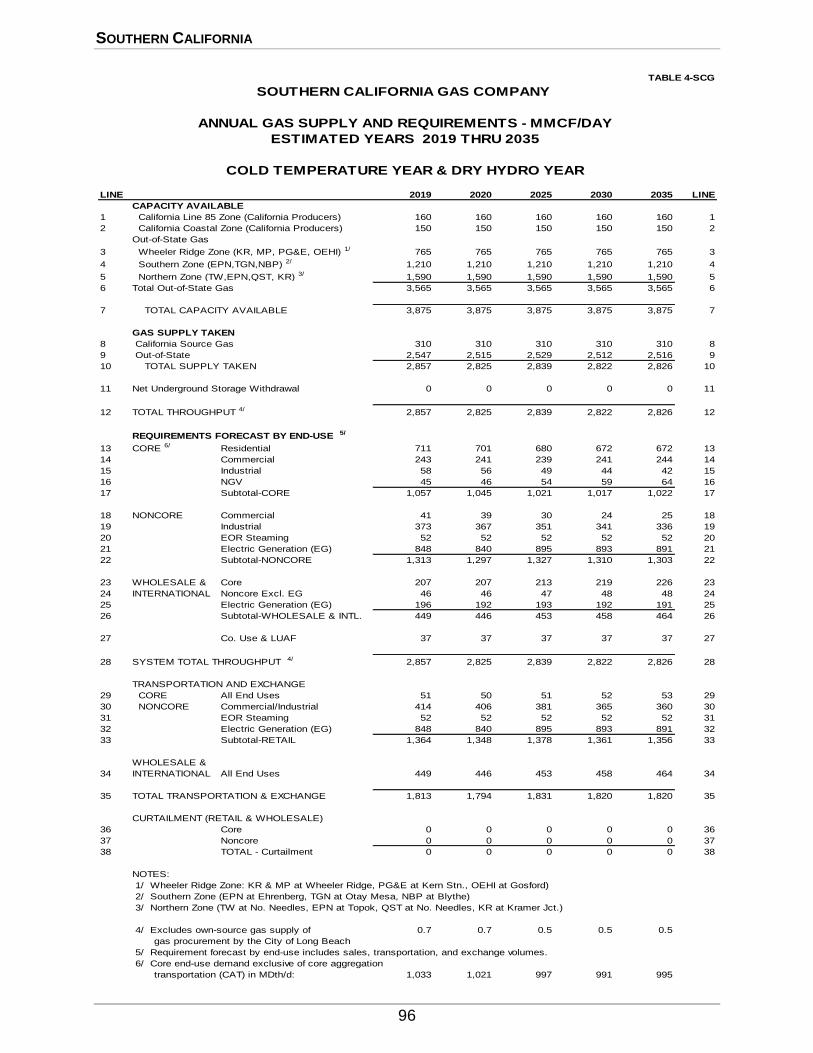
SOUTHERN CALIFORNIA
96
TABLE 4-SCG
SOUTHERN CALIFORNIA GAS COMPANY
ANNUAL GAS SUPPLY AND REQUIREMENTS - MMCF/DAY
ESTIMATED YEARS 2019 THRU 2035
COLD TEMPERATURE YEAR & DRY HYDRO YEAR
LINE 2019 2020 2025 2030 2035 LINE
CAPACITY AVAILABLE
1 California Line 85 Zone (California Producers) 160 160 160 160 160 1
2 California Coastal Zone (California Producers) 150 150 150 150 150 2
Out-of-State Gas
3 Wheeler Ridge Zone (KR, MP, PG&E, OEHI) 1/ 765 765 765 765 765 3
4 Southern Zone (EPN,TGN,NBP) 2/ 1,210 1,210 1,210 1,210 1,210 4
5 Northern Zone (TW,EPN,QST, KR) 3/ 1,590 1,590 1,590 1,590 1,590 5
6 Total Out-of-State Gas 3,565 3,565 3,565 3,565 3,565 6
7 TOTAL CAPACITY AVAILABLE 3,875 3,875 3,875 3,875 3,875 7
GAS SUPPLY TAKEN
8 California Source Gas 310 310 310 310 310 8
9 Out-of-State 2,547 2,515 2,529 2,512 2,516 9
10 TOTAL SUPPLY TAKEN 2,857 2,825 2,839 2,822 2,826 10
11 Net Underground Storage Withdrawal 0 0 0 0 0 11
12 TOTAL THROUGHPUT 4/ 2,857 2,825 2,839 2,822 2,826 12
REQUIREMENTS FORECAST BY END-USE 5/
13 CORE 6/ Residential 711 701 680 672 672 13
14 Commercial 243 241 239 241 244 14
15 Industrial 58 56 49 44 42 15
16 NGV 45 46 54 59 64 16
17 Subtotal-CORE 1,057 1,045 1,021 1,017 1,022 17
18 NONCORE Commercial 41 39 30 24 25 18
19 Industrial 373 367 351 341 336 19
20 EOR Steaming 52 52 52 52 52 20
21 Electric Generation (EG) 848 840 895 893 891 21
22 Subtotal-NONCORE 1,313 1,297 1,327 1,310 1,303 22
23 WHOLESALE & Core 207 207 213 219 226 23
24 INTERNATIONAL Noncore Excl. EG 46 46 47 48 48 24
25 Electric Generation (EG) 196 192 193 192 191 25
26 Subtotal-WHOLESALE & INTL. 449 446 453 458 464 26
27 Co. Use & LUAF 37 37 37 37 37 27
28 SYSTEM TOTAL THROUGHPUT 4/ 2,857 2,825 2,839 2,822 2,826 28
TRANSPORTATION AND EXCHANGE
29 CORE All End Uses 51 50 51 52 53 29
30 NONCORE Commercial/Industrial 414 406 381 365 360 30
31 EOR Steaming 52 52 52 52 52 31
32 Electric Generation (EG) 848 840 895 893 891 32
33 Subtotal-RETAIL 1,364 1,348 1,378 1,361 1,356 33
WHOLESALE &
34 INTERNATIONAL All End Uses 449 446 453 458 464 34
35 TOTAL TRANSPORTATION & EXCHANGE 1,813 1,794 1,831 1,820 1,820 35
CURTAILMENT (RETAIL & WHOLESALE)
36 Core 0 0 0 0 0 36
37 Noncore 0 0 0 0 0 37
38 TOTAL - Curtailment 0 0 0 0 0 38
NOTES:
1/ Wheeler Ridge Zone: KR & MP at Wheeler Ridge, PG&E at Kern Stn., OEHI at Gosford)
2/ Southern Zone (EPN at Ehrenberg, TGN at Otay Mesa, NBP at Blythe)
3/ Northern Zone (TW at No. Needles, EPN at Topok, QST at No. Needles, KR at Kramer Jct.)
4/ Excludes own-source gas supply of 0.7 0.7 0.5 0.5 0.5
gas procurement by the City of Long Beach
5/ Requirement forecast by end-use includes sales, transportation, and exchange volumes.
6/ Core end-use demand exclusive of core aggregation
transportation (CAT) in MDth/d: 1,033 1,021 997 991 995
LONG BEACH GAS & OIL DEPARTMENT
97
2 0 1 4 C A L I F O R N I A G A S R E P O R T
LONG BEACH GAS AND OIL DEPARTMENT
LONG BEACH GAS & OIL DEPARTMENT
98
CITY OF LONG BEACH MUNICIPAL GAS & OIL DEPARTMENT
The annual gas supply and forecast requirements prepared by the Long Beach Gas & Oil Department (Long Beach) are shown on the following tables for the years 2014 through 2035.
Serving approximately 145,000 customers, Long Beach is the largest California
municipal gas utility and the fifth largest municipal gas utility in the United States. Long
Beach's service territory includes the cities of Long Beach and Signal Hill, and sections of
surrounding communities including Lakewood, Bellflower, Compton, Seal Beach, Paramount,
and Los Alamitos. Long Beach's customer load profile is 56 percent residential and 44 percent commercial/industrial.
As a municipal utility, Long Beach's rates and policies are established by the City
Council, which acts as the regulatory authority. The City Charter requires the gas utility to establish its rates comparable to the rates charged by surrounding gas utilities for similar types
of service.
Long Beach receives a small amount of its gas supply directly into its pipeline system from local production fields that are located within Long Beach's service territory, as well as
offshore. Currently, Long Beach receives approximately 5 percent of its gas supply from local
production. The majority of Long Beach supplies are purchased at the California border, primarily from the Southwestern United States. Long Beach, as a wholesale customer, receives
intrastate transmission service for this gas from SoCalGas.
LONG BEACH GAS & OIL DEPARTMENT
99
2 0 1 4 C A L I F O R N I A G A S R E P O R T
LONG BEACH GAS AND OIL DEPARTMENT TABULAR DATA
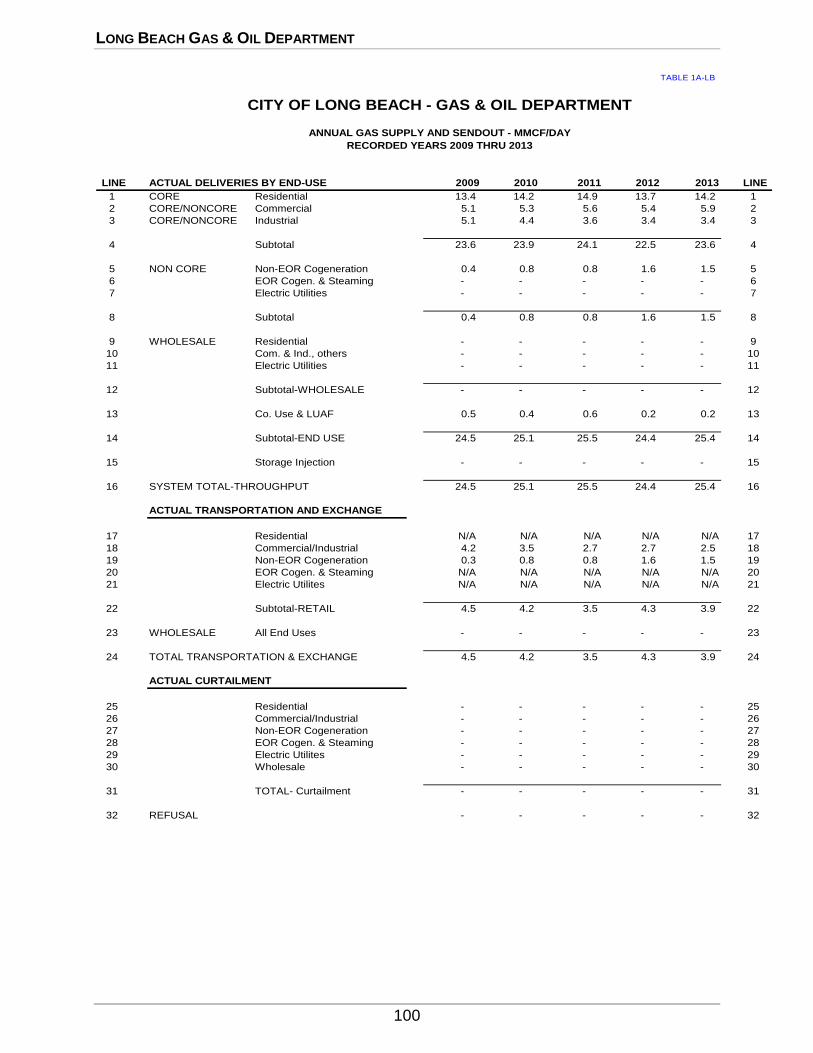
LONG BEACH GAS & OIL DEPARTMENT
100
TABLE 1A-LB
LINE ACTUAL DELIVERIES BY END-USE 2009 2010 2011 2012 2013 LINE
1 CORE Residential 13.4 14.2 14.9 13.7 14.2 1
2 CORE/NONCORE Commercial 5.1 5.3 5.6 5.4 5.9 2
3 CORE/NONCORE Industrial 5.1 4.4 3.6 3.4 3.4 3
4 Subtotal 23.6 23.9 24.1 22.5 23.6 4
5 NON CORE Non-EOR Cogeneration 0.4 0.8 0.8 1.6 1.5 5
6 EOR Cogen. & Steaming - - - - - 6
7 Electric Utilities - - - - - 7
8 Subtotal 0.4 0.8 0.8 1.6 1.5 8
9 WHOLESALE Residential - - - - - 9
10 Com. & Ind., others - - - - - 10
11 Electric Utilities - - - - - 11
12 Subtotal-WHOLESALE - - - - - 12
13 Co. Use & LUAF 0.5 0.4 0.6 0.2 0.2 13
14 Subtotal-END USE 24.5 25.1 25.5 24.4 25.4 14
15 Storage Injection - - - - - 15
16 SYSTEM TOTAL-THROUGHPUT 24.5 25.1 25.5 24.4 25.4 16
ACTUAL TRANSPORTATION AND EXCHANGE
17 Residential N/A N/A N/A N/A N/A 17
18 Commercial/Industrial 4.2 3.5 2.7 2.7 2.5 18
19 Non-EOR Cogeneration 0.3 0.8 0.8 1.6 1.5 19
20 EOR Cogen. & Steaming N/A N/A N/A N/A N/A 20
21 Electric Utilites N/A N/A N/A N/A N/A 21
22 Subtotal-RETAIL 4.5 4.2 3.5 4.3 3.9 22
23 WHOLESALE All End Uses - - - - - 23
24 TOTAL TRANSPORTATION & EXCHANGE 4.5 4.2 3.5 4.3 3.9 24
ACTUAL CURTAILMENT
25 Residential - - - - - 25
26 Commercial/Industrial - - - - - 26
27 Non-EOR Cogeneration - - - - - 27
28 EOR Cogen. & Steaming - - - - - 28
29 Electric Utilites - - - - - 29
30 Wholesale - - - - - 30
31 TOTAL- Curtailment - - - - - 31
32 REFUSAL - - - - - 32
CITY OF LONG BEACH - GAS & OIL DEPARTMENT
ANNUAL GAS SUPPLY AND SENDOUT - MMCF/DAY
RECORDED YEARS 2009 THRU 2013
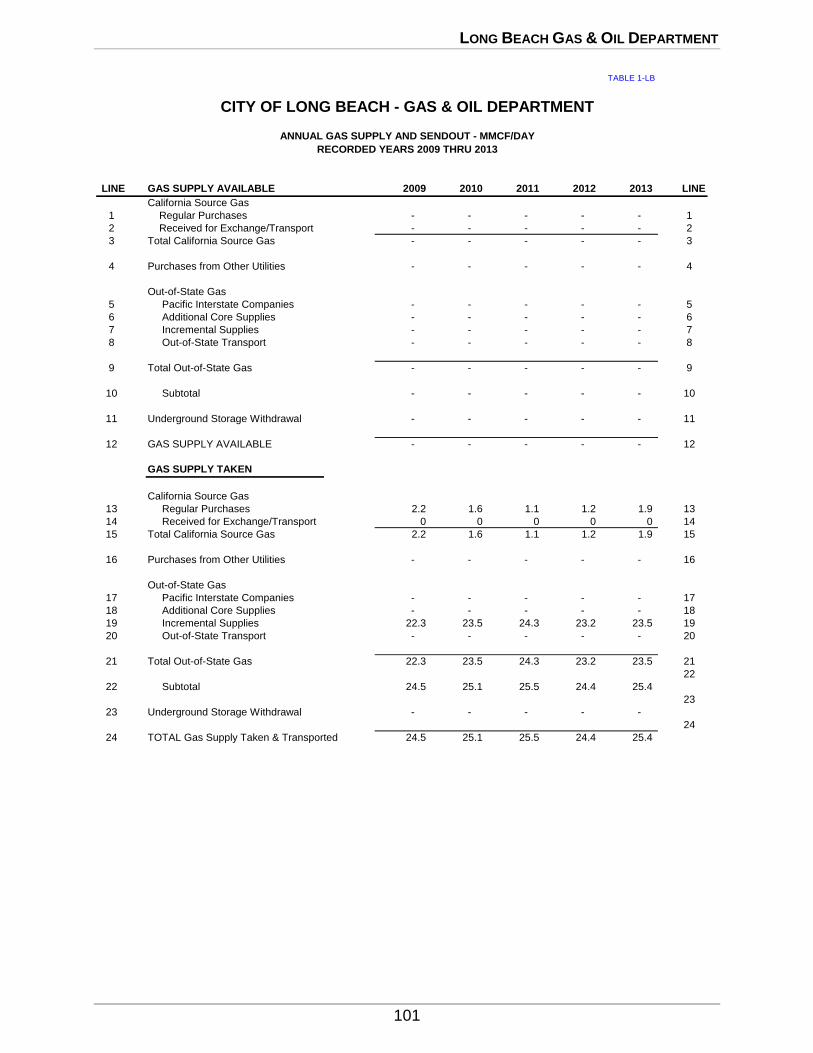
LONG BEACH GAS & OIL DEPARTMENT
101
TABLE 1-LB
LINE GAS SUPPLY AVAILABLE 2009 2010 2011 2012 2013 LINE
California Source Gas
1 Regular Purchases - - - - - 1
2 Received for Exchange/Transport - - - - - 2
3 Total California Source Gas - - - - - 3
4 Purchases from Other Utilities - - - - - 4
Out-of-State Gas
5 Pacific Interstate Companies - - - - - 5
6 Additional Core Supplies - - - - - 6
7 Incremental Supplies - - - - - 7
8 Out-of-State Transport - - - - - 8
9 Total Out-of-State Gas - - - - - 9
10 Subtotal - - - - - 10
11 Underground Storage Withdrawal - - - - - 11
12 GAS SUPPLY AVAILABLE - - - - - 12
GAS SUPPLY TAKEN
California Source Gas
13 Regular Purchases 2.2 1.6 1.1 1.2 1.9 13
14 Received for Exchange/Transport 0 0 0 0 0 14
15 Total California Source Gas 2.2 1.6 1.1 1.2 1.9 15
16 Purchases from Other Utilities - - - - - 16
Out-of-State Gas
17 Pacific Interstate Companies - - - - - 17
18 Additional Core Supplies - - - - - 18
19 Incremental Supplies 22.3 23.5 24.3 23.2 23.5 19
20 Out-of-State Transport - - - - - 20
21 Total Out-of-State Gas 22.3 23.5 24.3 23.2 23.5 21
22
22 Subtotal 24.5 25.1 25.5 24.4 25.4
23
23 Underground Storage Withdrawal - - - - -
24
24 TOTAL Gas Supply Taken & Transported 24.5 25.1 25.5 24.4 25.4
ANNUAL GAS SUPPLY AND SENDOUT - MMCF/DAY
RECORDED YEARS 2009 THRU 2013
CITY OF LONG BEACH - GAS & OIL DEPARTMENT
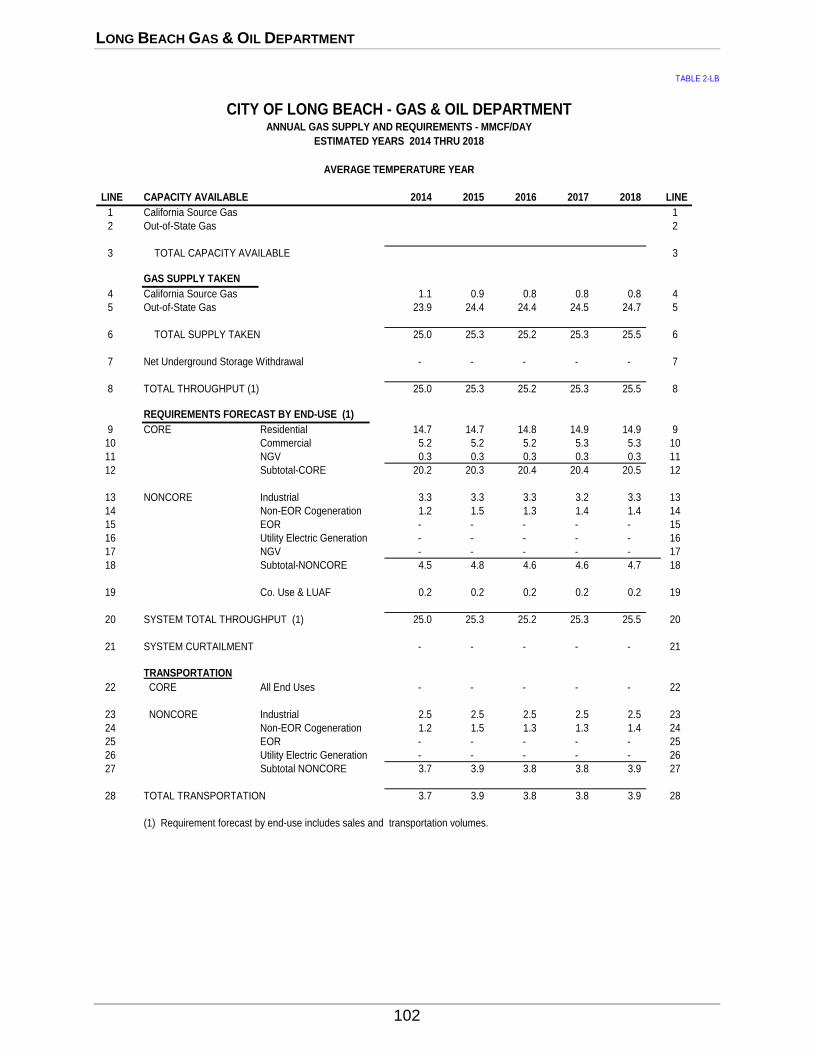
LONG BEACH GAS & OIL DEPARTMENT
102
TABLE 2-LB
LINE CAPACITY AVAILABLE 2014 2015 2016 2017 2018 LINE
1 California Source Gas 1
2 Out-of-State Gas 2
3 TOTAL CAPACITY AVAILABLE 3
GAS SUPPLY TAKEN
4 California Source Gas 1.1 0.9 0.8 0.8 0.8 4
5 Out-of-State Gas 23.9 24.4 24.4 24.5 24.7 5
6 TOTAL SUPPLY TAKEN 25.0 25.3 25.2 25.3 25.5 6
7 Net Underground Storage Withdrawal - - - - - 7
8 TOTAL THROUGHPUT (1) 25.0 25.3 25.2 25.3 25.5 8
REQUIREMENTS FORECAST BY END-USE (1)
9 CORE Residential 14.7 14.7 14.8 14.9 14.9 9
10 Commercial 5.2 5.2 5.2 5.3 5.3 10
11 NGV 0.3 0.3 0.3 0.3 0.3 11
12 Subtotal-CORE 20.2 20.3 20.4 20.4 20.5 12
13 NONCORE Industrial 3.3 3.3 3.3 3.2 3.3 13
14 Non-EOR Cogeneration 1.2 1.5 1.3 1.4 1.4 14
15 EOR - - - - - 15
16 Utility Electric Generation - - - - - 16
17 NGV - - - - - 17
18 Subtotal-NONCORE 4.5 4.8 4.6 4.6 4.7 18
19 Co. Use & LUAF 0.2 0.2 0.2 0.2 0.2 19
20 SYSTEM TOTAL THROUGHPUT (1) 25.0 25.3 25.2 25.3 25.5 20
21 SYSTEM CURTAILMENT - - - - - 21
TRANSPORTATION
22 CORE All End Uses - - - - - 22
23 NONCORE Industrial 2.5 2.5 2.5 2.5 2.5 23
24 Non-EOR Cogeneration 1.2 1.5 1.3 1.3 1.4 24
25 EOR - - - - - 25
26 Utility Electric Generation - - - - - 26
27 Subtotal NONCORE 3.7 3.9 3.8 3.8 3.9 27
28 TOTAL TRANSPORTATION 3.7 3.9 3.8 3.8 3.9 28
(1) Requirement forecast by end-use includes sales and transportation volumes.
CITY OF LONG BEACH - GAS & OIL DEPARTMENTANNUAL GAS SUPPLY AND REQUIREMENTS - MMCF/DAY
ESTIMATED YEARS 2014 THRU 2018
AVERAGE TEMPERATURE YEAR

LONG BEACH GAS & OIL DEPARTMENT
103
TABLE 3-LB
LINE CAPACITY AVAILABLE 2019 2020 2025 2030 2035 LINE
1 California Source Gas 1
2 Out-of-State Gas 2
3 TOTAL CAPACITY AVAILABLE 3
GAS SUPPLY TAKEN
4 California Source Gas 0.7 0.7 0.5 0.4 0.4 4
5 Out-of-State Gas 24.7 24.8 25.3 25.8 26.2 5
6 TOTAL SUPPLY TAKEN 25.4 25.5 25.9 26.2 26.5 6
7 Net Underground Storage Withdrawal 0 0 0 0 0 7
8 TOTAL THROUGHPUT (1) 25.4 25.5 25.9 26.2 26.5 8
REQUIREMENTS FORECAST BY END-USE (1)
9 CORE Residential 15.0 15.0 15.3 15.7 16.0 9
10 Commercial 5.3 5.3 5.3 5.3 5.3 10
11 NGV 0.3 0.3 0.3 0.3 0.3 11
12 Subtotal-CORE 20.6 20.6 21.0 21.3 21.6 12
13 NONCORE Industrial 3.3 3.3 3.3 3.3 3.3 13
14 Non-EOR Cogeneration 1.4 1.4 1.4 1.4 1.4 14
15 EOR 0 0 0 0 0 15
16 Utility Electric Generation 0 0 0 0 0 16
17 NGV 0 0 0 0 0 17
18 Subtotal-NONCORE 4.6 4.7 4.7 4.7 4.7 18
19 Co. Use & LUAF 0.2 0.2 0.2 0.2 0.2 19
20 SYSTEM TOTAL THROUGHPUT (1) 25.4 25.5 25.9 26.2 26.5 20
21 SYSTEM CURTAILMENT 0 0 0 0 0 21
TRANSPORTATION
22 CORE All End Uses 0 0 0 0 0 22
23 NONCORE Industrial 2.5 2.5 2.5 2.5 2.5 23
24 Non-EOR Cogeneration 1.3 1.4 1.3 1.3 1.3 24
25 EOR 0 0 0 0 0 25
26 Utility Electric Generation 0 0 0 0 0 26
27 Subtotal NONCORE 3.8 3.8 3.8 3.8 3.8 27
28 TOTAL TRANSPORTATION 3.8 3.8 3.8 3.8 3.8 28
(1) Requirement forecast by end-use includes sales and transportation volumes.
CITY OF LONG BEACH - GAS & OIL DEPARTMENTANNUAL GAS SUPPLY AND REQUIREMENTS - MMCF/DAY
ESTIMATED YEARS 2019 THRU 2035
AVERAGE TEMPERATURE YEAR
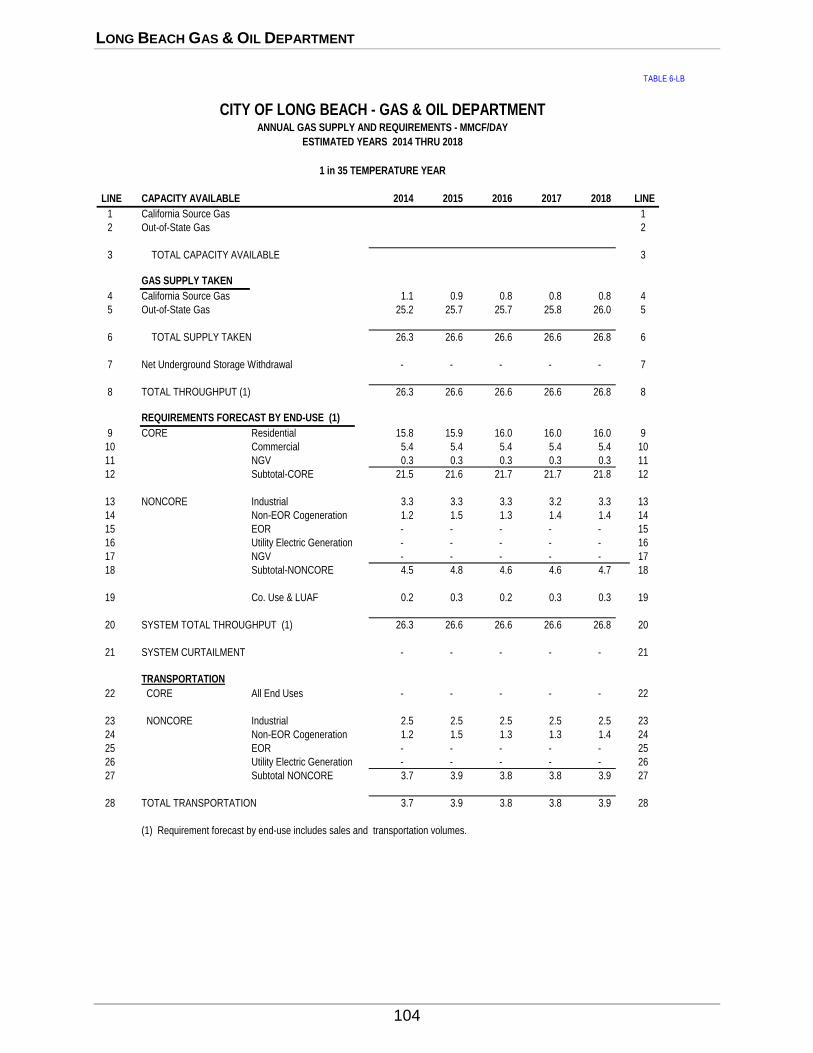
LONG BEACH GAS & OIL DEPARTMENT
104
TABLE 6-LB
LINE CAPACITY AVAILABLE 2014 2015 2016 2017 2018 LINE
1 California Source Gas 1
2 Out-of-State Gas 2
3 TOTAL CAPACITY AVAILABLE 3
GAS SUPPLY TAKEN
4 California Source Gas 1.1 0.9 0.8 0.8 0.8 4
5 Out-of-State Gas 25.2 25.7 25.7 25.8 26.0 5
6 TOTAL SUPPLY TAKEN 26.3 26.6 26.6 26.6 26.8 6
7 Net Underground Storage Withdrawal - - - - - 7
8 TOTAL THROUGHPUT (1) 26.3 26.6 26.6 26.6 26.8 8
REQUIREMENTS FORECAST BY END-USE (1)
9 CORE Residential 15.8 15.9 16.0 16.0 16.0 9
10 Commercial 5.4 5.4 5.4 5.4 5.4 10
11 NGV 0.3 0.3 0.3 0.3 0.3 11
12 Subtotal-CORE 21.5 21.6 21.7 21.7 21.8 12
13 NONCORE Industrial 3.3 3.3 3.3 3.2 3.3 13
14 Non-EOR Cogeneration 1.2 1.5 1.3 1.4 1.4 14
15 EOR - - - - - 15
16 Utility Electric Generation - - - - - 16
17 NGV - - - - - 17
18 Subtotal-NONCORE 4.5 4.8 4.6 4.6 4.7 18
19 Co. Use & LUAF 0.2 0.3 0.2 0.3 0.3 19
20 SYSTEM TOTAL THROUGHPUT (1) 26.3 26.6 26.6 26.6 26.8 20
21 SYSTEM CURTAILMENT - - - - - 21
TRANSPORTATION
22 CORE All End Uses - - - - - 22
23 NONCORE Industrial 2.5 2.5 2.5 2.5 2.5 23
24 Non-EOR Cogeneration 1.2 1.5 1.3 1.3 1.4 24
25 EOR - - - - - 25
26 Utility Electric Generation - - - - - 26
27 Subtotal NONCORE 3.7 3.9 3.8 3.8 3.9 27
28 TOTAL TRANSPORTATION 3.7 3.9 3.8 3.8 3.9 28
(1) Requirement forecast by end-use includes sales and transportation volumes.
CITY OF LONG BEACH - GAS & OIL DEPARTMENTANNUAL GAS SUPPLY AND REQUIREMENTS - MMCF/DAY
ESTIMATED YEARS 2014 THRU 2018
1 in 35 TEMPERATURE YEAR
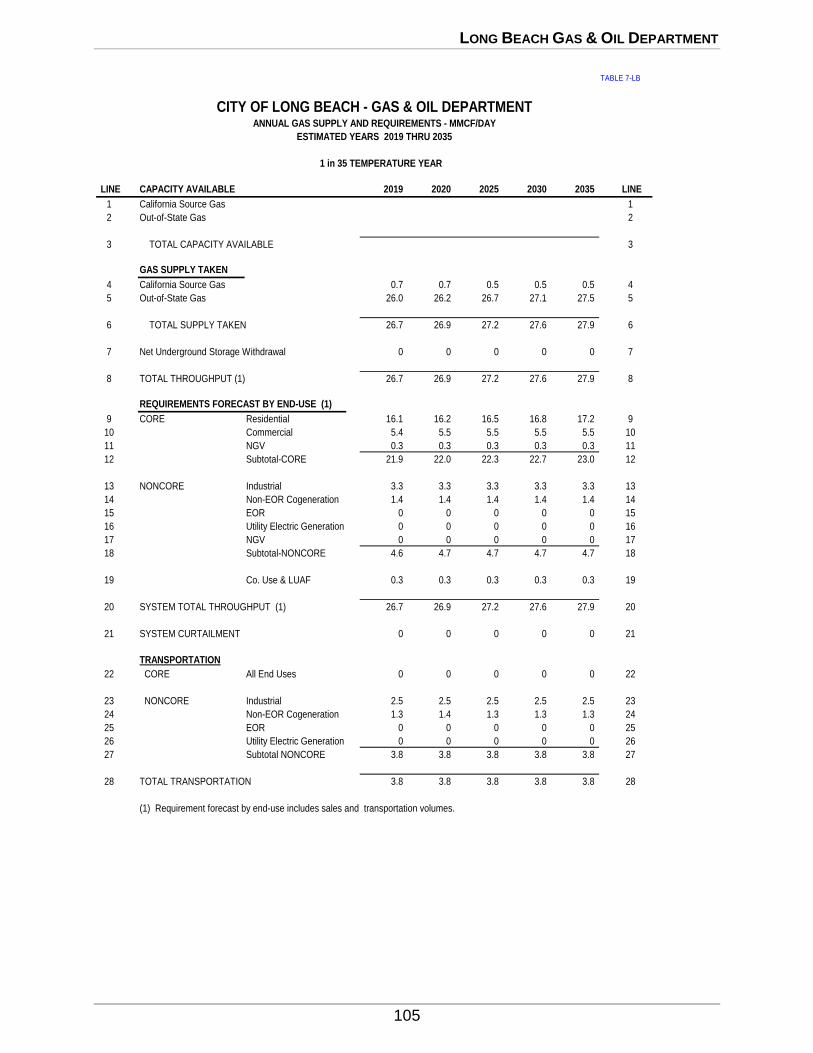
LONG BEACH GAS & OIL DEPARTMENT
105
TABLE 7-LB
LINE CAPACITY AVAILABLE 2019 2020 2025 2030 2035 LINE
1 California Source Gas 1
2 Out-of-State Gas 2
3 TOTAL CAPACITY AVAILABLE 3
GAS SUPPLY TAKEN
4 California Source Gas 0.7 0.7 0.5 0.5 0.5 4
5 Out-of-State Gas 26.0 26.2 26.7 27.1 27.5 5
6 TOTAL SUPPLY TAKEN 26.7 26.9 27.2 27.6 27.9 6
7 Net Underground Storage Withdrawal 0 0 0 0 0 7
8 TOTAL THROUGHPUT (1) 26.7 26.9 27.2 27.6 27.9 8
REQUIREMENTS FORECAST BY END-USE (1)
9 CORE Residential 16.1 16.2 16.5 16.8 17.2 9
10 Commercial 5.4 5.5 5.5 5.5 5.5 10
11 NGV 0.3 0.3 0.3 0.3 0.3 11
12 Subtotal-CORE 21.9 22.0 22.3 22.7 23.0 12
13 NONCORE Industrial 3.3 3.3 3.3 3.3 3.3 13
14 Non-EOR Cogeneration 1.4 1.4 1.4 1.4 1.4 14
15 EOR 0 0 0 0 0 15
16 Utility Electric Generation 0 0 0 0 0 16
17 NGV 0 0 0 0 0 17
18 Subtotal-NONCORE 4.6 4.7 4.7 4.7 4.7 18
19 Co. Use & LUAF 0.3 0.3 0.3 0.3 0.3 19
20 SYSTEM TOTAL THROUGHPUT (1) 26.7 26.9 27.2 27.6 27.9 20
21 SYSTEM CURTAILMENT 0 0 0 0 0 21
TRANSPORTATION
22 CORE All End Uses 0 0 0 0 0 22
23 NONCORE Industrial 2.5 2.5 2.5 2.5 2.5 23
24 Non-EOR Cogeneration 1.3 1.4 1.3 1.3 1.3 24
25 EOR 0 0 0 0 0 25
26 Utility Electric Generation 0 0 0 0 0 26
27 Subtotal NONCORE 3.8 3.8 3.8 3.8 3.8 27
28 TOTAL TRANSPORTATION 3.8 3.8 3.8 3.8 3.8 28
(1) Requirement forecast by end-use includes sales and transportation volumes.
CITY OF LONG BEACH - GAS & OIL DEPARTMENTANNUAL GAS SUPPLY AND REQUIREMENTS - MMCF/DAY
ESTIMATED YEARS 2019 THRU 2035
1 in 35 TEMPERATURE YEAR
SAN DIEGO GAS & ELECTRIC COMPANY
106
2 0 1 4 C A L I F O R N I A G A S R E P O R T
SAN DIEGO GAS & ELECTRIC COMPANY
SAN DIEGO GAS & ELECTRIC COMPANY
107
INTRODUCTION
San Diego Gas & Electric Company (SDG&E) is a combined gas and electric distribution
utility serving more than three million people in San Diego and the southern portions of Orange County. SDG&E delivered natural gas to 861,573 customers in San Diego County in 2013,
including power plants and turbines. Total gas sales and transportation through SDG&E’s
system for 2013 were approximately 135 billion cubic feet (Bcf), which is an average of over 369 million cubic feet per day (MMcf/day).
The Gas Supply, Capacity, and Storage section for SDG&E has been moved to SoCalGas’
due to the integration of gas procurement and system integration functions into one combined SDG&E/SoCalGas system per D.07-12-019 (natural gas operations and service offerings) and
D.06-12-031 (system integration).
SAN DIEGO GAS & ELECTRIC COMPANY
108
GAS DEMAND
OVERVIEW
SDG&E’s gas demand forecast is largely determined by the long-term economic outlook for its San Diego County service area. The county’s economic trends are expected to generally
parallel those of the larger SoCalGas area as discussed above.
This projection of natural gas requirements, excluding electric generation (EG) demand, is derived from models that integrate demographic assumptions, economic growth, energy
prices, energy efficiency programs, customer information programs, building and appliance
standards, weather and other factors. Non-EG gas demand is projected to remain virtually flat between 2013 and 2035. The total load, including EG, is expected to decline from a total of
135 Bcf in 2013 to 117 Bcf by 2035. Assumptions for SDG&E's gas transportation requirements
for EG are included as part of the wholesale market sector description for SoCalGas.
ECONOMICS AND DEMOGRAPHICS
SDG&E’s gas demand forecast is largely determined by the long-term economic outlook for its San Diego County service area. The county’s economic trends are expected to generally
parallel those of the larger SoCalGas area as discussed above. San Diego County’s total
employment is forecasted to grow an average of 1.2% annually from 2013 to 2035; the subset of
industrial (mining and manufacturing) jobs is projected to remain virtually flat over the same
period. From 2013 to 2035, the county’s inflation-adjusted Gross Product is expected to average
3.0% annual growth. (Gross Product, the local equivalent of national Gross Domestic Product, is a measure of the total economic output of the area economy.) The number of SDG&E gas
meters is expected to increase an average of 1.3% annually from 2013 through 2035.

SAN DIEGO GAS AND ELECTRIC COMPANY
109
MARKET SECTORS
Residential
The total residential customer count for SDG&E consists of four residential segment
types. These are single family and multi-family customers, as well as master meter and
sub-metered customers. The active meters for all residential customer classes averaged 831,403 in 2013. This total reflects a 5,206 meter increase relative to the 2012 total. The overall observed
2012-2013 residential meter growth was 0.63%.
Residential demand adjusted for average temperature conditions totaled 33 Bcf in 2013. By the year 2035, residential demand is expected to reach 35 Bcf. The change reflects a 0.29%
annual compound growth rate.
The projected residential natural gas demand will be influenced primarily by residential meter growth moderated by the forecasted declining use per customer due to energy efficiency
improvements in the building shell design, appliance efficiency and CPUC-authorized EE
programs plus the additional efficiency gains associated with advanced metering.
Composition of SDG&E Natural Gas Throughput (Bcf)--
Average Temperature, Normal Hydro Year (2013-2035)
0
20
40
60
80
100
120
140
160
2013 2014 2015 2020 2025 2035
Bc
f
Residential Core Non Residential Noncore C+I (Non EG) EG

SAN DIEGO GAS & ELECTRIC COMPANY
110
Commercial
On a temperature-adjusted basis, the core commercial demand in 2013 totaled 17 Bcf. By
the year 2035, the SDG&E core commercial load is expected to remain at 17 Bcf.
SDG&E’s noncore commercial load in 2013 was 2.2 Bcf. Over the forecast period, gas
demand in this market is projected to show moderate growth mostly driven by increased
economic activity and employment. Noncore commercial load is projected to grow to 3.3 Bcf by 2035, an average annual increase of 1.9%.
Composition of SDG&E's Residential Demand Forecast
(2013-2035)
0
5
10
15
20
25
30
35
40
2013 2014 2015 2020 2025 2035
Bc
f
Single Family Multi Family Master Meter Sub-Metered
SDG&E Commercial Natural Gas Demand Forecast
(2013-2035)
0
5
10
15
20
25
2013 2014 2015 2020 2025 2035
BC
F
CORE COMMERCIAL NONCORE COMMERCIAL

SAN DIEGO GAS AND ELECTRIC COMPANY
111
Industrial
In 2013, temperature-adjusted core industrial demand was 1.4 Bcf. The core industrial market demand is projected to decrease at an average rate of 1% per year from 1.4 Bcf in 2013 to
1.2 Bcf in 2035. This result is due to slightly lower forecasted growth in industrial production
and the impact of savings from CPUC-authorized energy-efficiency programs in the industrial sector.
Noncore industrial load in 2013 was 2.2 Bcf and is expected to decline at an average rate
of 1.5% per year to 1.6 Bcf by 2035. CPUC-mandated energy efficiency programs more than
offset any modest gains from industrial economic growth.
Electric Generation
Total EG, including cogeneration and non-cogeneration EG, is expected to decrease at an annual average rate of 1.4 percent from 79 Bcf in 2013 to 58 Bcf in 2035. The following graph
shows total EG forecasts for a normal hydro year and a 1-in-10 dry hydro year.
SDG&E's Industrial Natural Gas Demand Forecast
(2013-2035)
0
500
1,000
1,500
2,000
2,500
3,000
3,500
4,000
2013 2014 2015 2020 2025 2035
MM
CF
CORE INDUSTRIAL NONCORE INDUSTRIAL
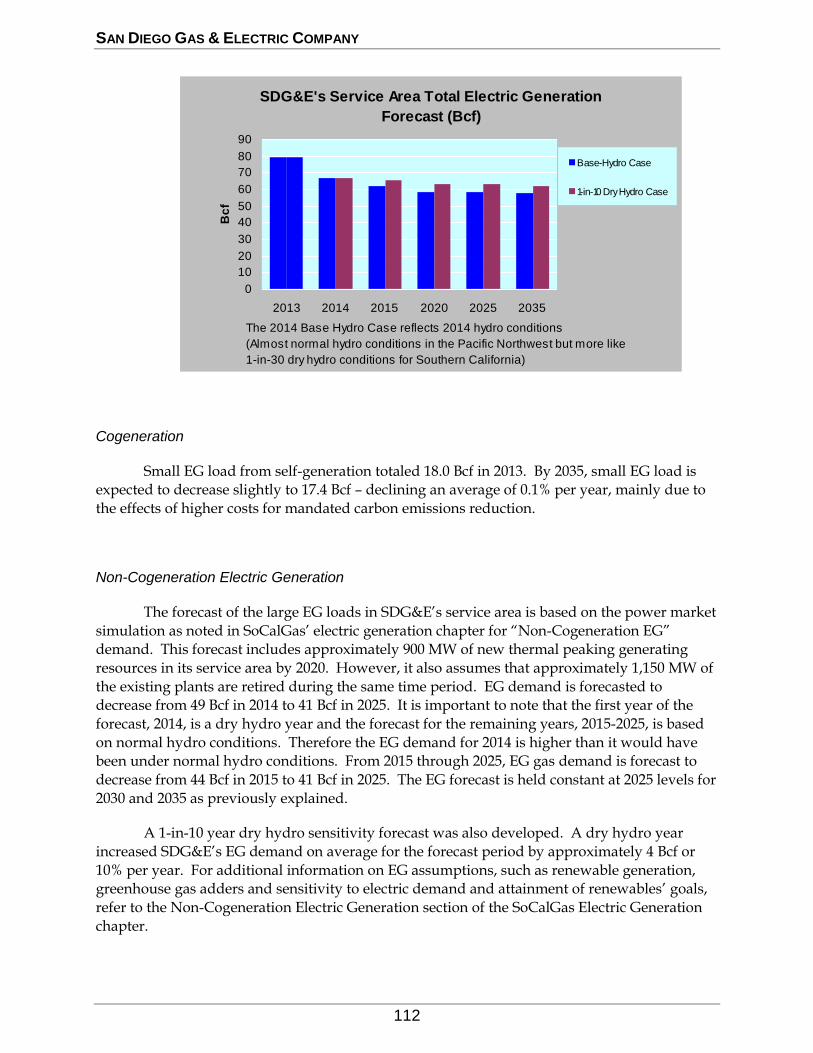
SAN DIEGO GAS & ELECTRIC COMPANY
112
Cogeneration
Small EG load from self-generation totaled 18.0 Bcf in 2013. By 2035, small EG load is expected to decrease slightly to 17.4 Bcf – declining an average of 0.1% per year, mainly due to
the effects of higher costs for mandated carbon emissions reduction.
Non-Cogeneration Electric Generation
The forecast of the large EG loads in SDG&E’s service area is based on the power market
simulation as noted in SoCalGas’ electric generation chapter for “Non-Cogeneration EG” demand. This forecast includes approximately 900 MW of new thermal peaking generating
resources in its service area by 2020. However, it also assumes that approximately 1,150 MW of
the existing plants are retired during the same time period. EG demand is forecasted to decrease from 49 Bcf in 2014 to 41 Bcf in 2025. It is important to note that the first year of the
forecast, 2014, is a dry hydro year and the forecast for the remaining years, 2015-2025, is based
on normal hydro conditions. Therefore the EG demand for 2014 is higher than it would have been under normal hydro conditions. From 2015 through 2025, EG gas demand is forecast to
decrease from 44 Bcf in 2015 to 41 Bcf in 2025. The EG forecast is held constant at 2025 levels for
2030 and 2035 as previously explained.
A 1-in-10 year dry hydro sensitivity forecast was also developed. A dry hydro year
increased SDG&E’s EG demand on average for the forecast period by approximately 4 Bcf or
10% per year. For additional information on EG assumptions, such as renewable generation, greenhouse gas adders and sensitivity to electric demand and attainment of renewables’ goals,
refer to the Non-Cogeneration Electric Generation section of the SoCalGas Electric Generation
chapter.
SDG&E's Service Area Total Electric Generation
Forecast (Bcf)
0
10
20
30
40
50
60
70
80
90
2013 2014 2015 2020 2025 2035
Bc
f
Base-Hydro Case
1-in-10 Dry Hydro Case
The 2014 Base Hydro Case reflects 2014 hydro conditions
(Almost normal hydro conditions in the Pacific Northwest but more like
1-in-30 dry hydro conditions for Southern California)
SAN DIEGO GAS AND ELECTRIC COMPANY
113
Natural Gas Vehicles (NGV)
The NGV market is expected to continue to grow due to government (federal, state and local) incentives and regulations related to the purchase and operation of alternate fuel vehicles,
growing numbers of natural gas engines and vehicles, and the increasing cost differential
between petroleum (gasoline and diesel) and natural gas. At the end of 2013, there were 31 compressed natural gas (CNG) fueling stations delivering about 1.4 Bcf of natural gas during
the year. The NGV market is forecast to essentially triple in size to 4.6 Bcf in 2035, a growth rate
of nearly 5.6% per year.
ENERGY EFFICIENCY PROGRAMS
Conservation and energy efficiency activities encourage customers to install energy
efficient equipment and weatherization measures and adopt energy saving practices that result
in reduced gas usage while still maintaining a comparable level of service. Conservation and
energy efficiency load impacts are shown as positive numbers. The “total net load impact” is the natural gas throughput reduction resulting from the Energy Efficiency programs.
The cumulative net load impact forecast from SDG&E’s integrated gas and electric
energy efficiency programs for selected years is shown in the graph below. The net load impact includes all Energy Efficiency programs, both gas and electric, that SDG&E has forecasted to be
implemented beginning in year 2014 and occurring through the year 2035. Savings and goals
for these programs are based on the program goals authorized by the Commission in D.12-05-015 and D.12-15-015.
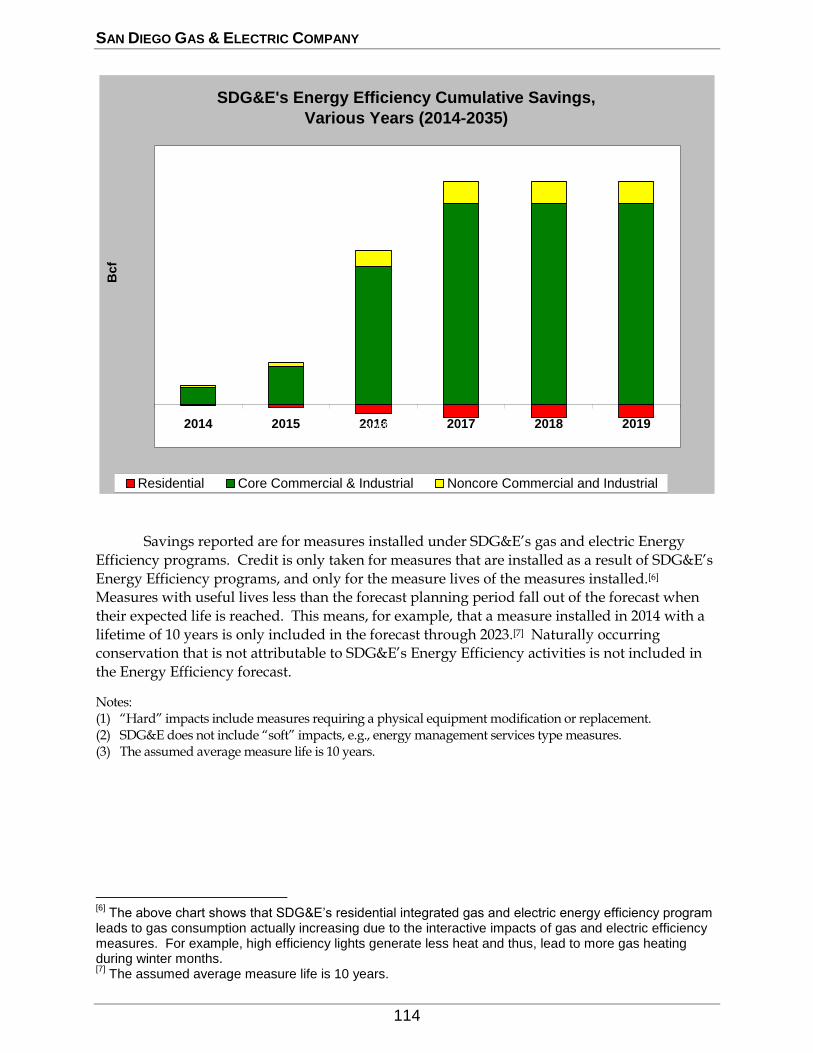
SAN DIEGO GAS & ELECTRIC COMPANY
114
Savings reported are for measures installed under SDG&E’s gas and electric Energy
Efficiency programs. Credit is only taken for measures that are installed as a result of SDG&E’s
Energy Efficiency programs, and only for the measure lives of the measures installed.[6] Measures with useful lives less than the forecast planning period fall out of the forecast when
their expected life is reached. This means, for example, that a measure installed in 2014 with a
lifetime of 10 years is only included in the forecast through 2023.[7] Naturally occurring conservation that is not attributable to SDG&E’s Energy Efficiency activities is not included in
the Energy Efficiency forecast.
Notes: (1) “Hard” impacts include measures requiring a physical equipment modification or replacement. (2) SDG&E does not include “soft” impacts, e.g., energy management services type measures. (3) The assumed average measure life is 10 years.
[6]
The above chart shows that SDG&E’s residential integrated gas and electric energy efficiency program leads to gas consumption actually increasing due to the interactive impacts of gas and electric efficiency measures. For example, high efficiency lights generate less heat and thus, lead to more gas heating during winter months. [7]
The assumed average measure life is 10 years.
SDG&E's Energy Efficiency Cumulative Savings,
Various Years (2014-2035)
2014 2015 2016 2017 2018 2019
Bcf
Residential Core Commercial & Industrial Noncore Commercial and Industrial
RESIDENTIAL
SAN DIEGO GAS AND ELECTRIC COMPANY
115
GAS SUPPLY
Beginning April 2008, gas supplies to serve both SoCalGas’ and SDG&E’s retail core gas
demand are procured with a combined SoCalGas/SDG&E portfolio per D.07-12-019 December 6, 2007. Refer to the Gas Supply, Capacity and Storage section in the Southern
California area for more information.
SAN DIEGO GAS & ELECTRIC COMPANY
116
PEAK DAY DEMAND
Beginning in April 2008, gas supplies to serve both SoCalGas’ and SDG&E’s retail core
gas demand are procured with a combined portfolio with a total firm storage withdrawal capacity designed to serve the utilities’ combined retail core peak-day gas demand. Please see
the corresponding discussion of “Peak Day Demand and Deliverability” under the SoCalGas
portion of this report for an illustration of how storage and flowing supplies can meet the growth in forecasted load for the combined (SoCalGas plus SDG&E) retail core peak day
demand.
SAN DIEGO GAS AND ELECTRIC COMPANY
117
2 0 1 4 C A L I F O R N I A G A S R E P O R T
SAN DIEGO GAS & ELECTRIC COMPANY TABULAR DATA
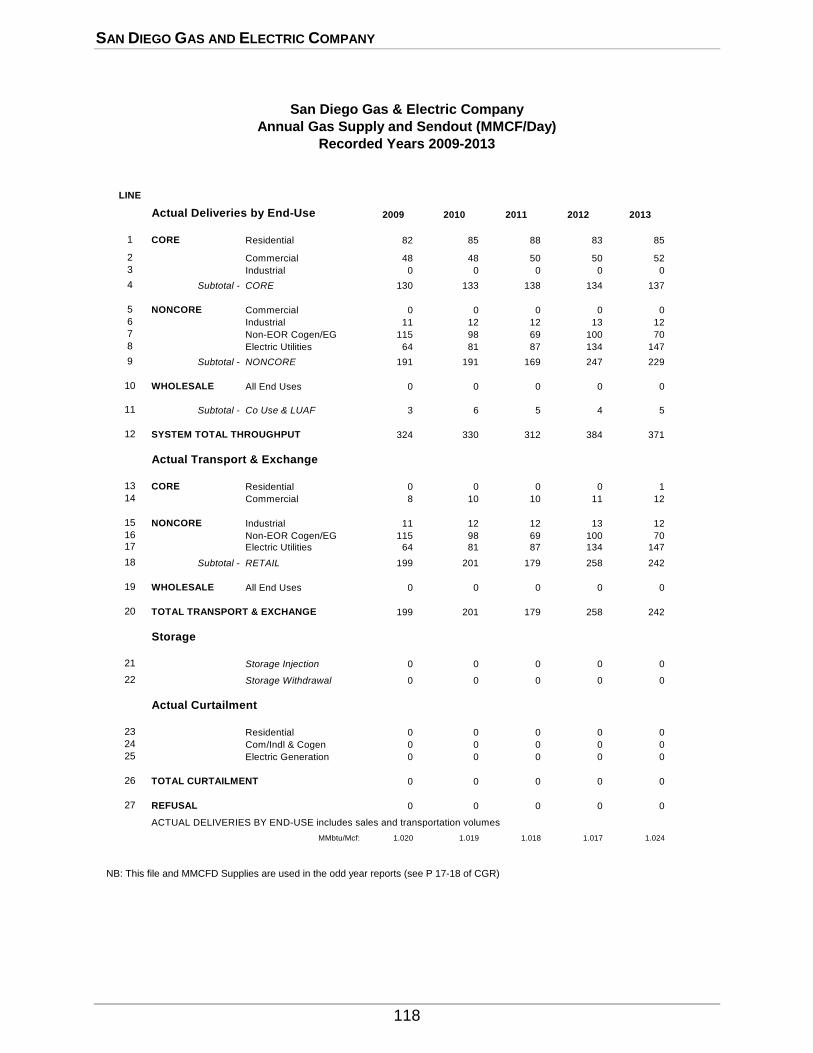
SAN DIEGO GAS AND ELECTRIC COMPANY
118
San Diego Gas & Electric Company
Annual Gas Supply and Sendout (MMCF/Day)
Recorded Years 2009-2013
LINE
Actual Deliveries by End-Use 2009 2010 2011 2012 2013
1 CORE Residential 82 85 88 83 85
2 Commercial 48 48 50 50 52
3 Industrial 0 0 0 0 0
4 Subtotal - CORE 130 133 138 134 137
5 NONCORE Commercial 0 0 0 0 0
6 Industrial 11 12 12 13 12
7 Non-EOR Cogen/EG 115 98 69 100 70
8 Electric Utilities 64 81 87 134 147
9 Subtotal - NONCORE 191 191 169 247 229
10 WHOLESALE All End Uses 0 0 0 0 0
11 Subtotal - Co Use & LUAF 3 6 5 4 5
12 SYSTEM TOTAL THROUGHPUT 324 330 312 384 371
Actual Transport & Exchange
13 CORE Residential 0 0 0 0 1
14 Commercial 8 10 10 11 12
15 NONCORE Industrial 11 12 12 13 12
16 Non-EOR Cogen/EG 115 98 69 100 7017 Electric Utilities 64 81 87 134 147
18 Subtotal - RETAIL 199 201 179 258 242
19 WHOLESALE All End Uses 0 0 0 0 0
20 TOTAL TRANSPORT & EXCHANGE 199 201 179 258 242
Storage
21 Storage Injection 0 0 0 0 0
22 Storage Withdrawal 0 0 0 0 0
Actual Curtailment
23 Residential 0 0 0 0 0
24 Com/Indl & Cogen 0 0 0 0 0
25 Electric Generation 0 0 0 0 0
26 TOTAL CURTAILMENT 0 0 0 0 0
27 REFUSAL 0 0 0 0 0
ACTUAL DELIVERIES BY END-USE includes sales and transportation volumes
MMbtu/Mcf: 1.020 1.019 1.018 1.017 1.024
NB: This file and MMCFD Supplies are used in the odd year reports (see P 17-18 of CGR)
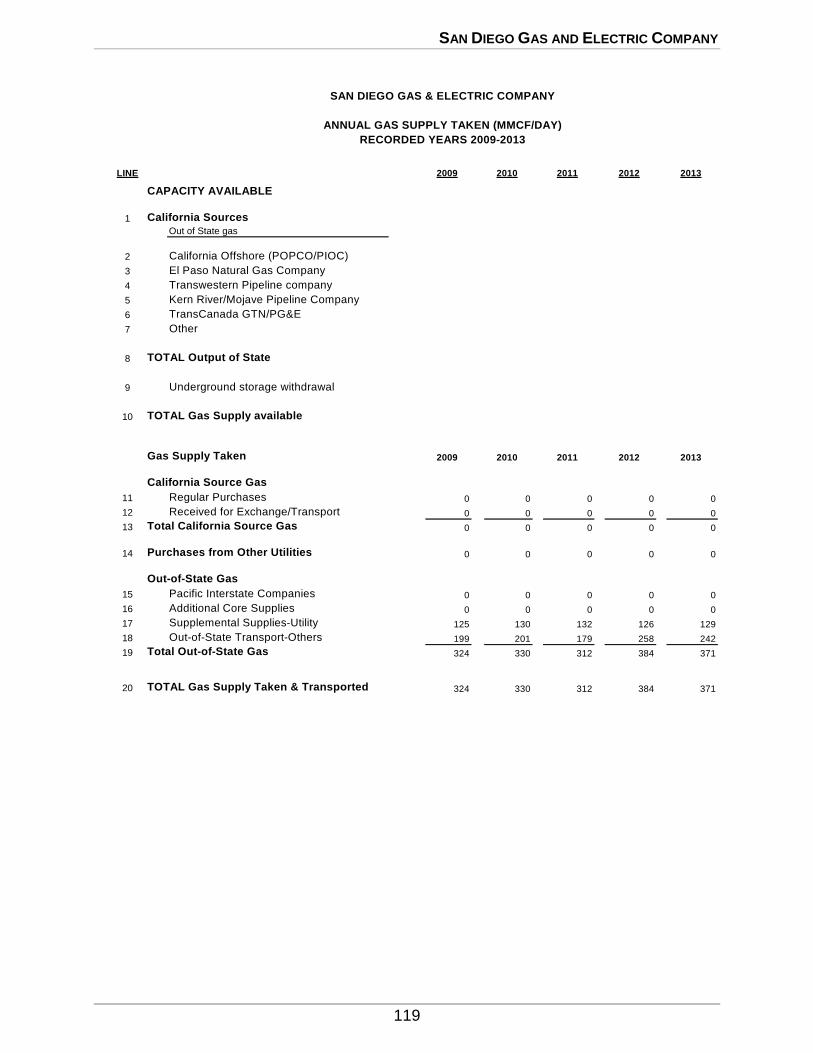
SAN DIEGO GAS AND ELECTRIC COMPANY
119
LINE 2009 2010 2011 2012 2013
CAPACITY AVAILABLE
1 California Sources
Out of State gas
2 California Offshore (POPCO/PIOC)
3 El Paso Natural Gas Company
4 Transwestern Pipeline company
5 Kern River/Mojave Pipeline Company
6 TransCanada GTN/PG&E
7 Other
8 TOTAL Output of State
9 Underground storage withdrawal
10 TOTAL Gas Supply available
Gas Supply Taken 2009 2010 2011 2012 2013
California Source Gas
11 Regular Purchases 0 0 0 0 0
12 Received for Exchange/Transport 0 0 0 0 0
13 Total California Source Gas 0 0 0 0 0
14 Purchases from Other Utilities 0 0 0 0 0
Out-of-State Gas
15 Pacific Interstate Companies 0 0 0 0 0
16 Additional Core Supplies 0 0 0 0 0
17 Supplemental Supplies-Utility 125 130 132 126 129
18 Out-of-State Transport-Others 199 201 179 258 242
19 Total Out-of-State Gas 324 330 312 384 371
20 TOTAL Gas Supply Taken & Transported 324 330 312 384 371
SAN DIEGO GAS & ELECTRIC COMPANY
ANNUAL GAS SUPPLY TAKEN (MMCF/DAY)
RECORDED YEARS 2009-2013

SAN DIEGO GAS AND ELECTRIC COMPANY
120
TABLE 1-SDGE SAN DIEGO GAS & ELECTRIC COMPANY
ANNUAL GAS SUPPLY AND REQUIREMENTS - MMCF/DAY ESTIMATED YEARS 2014 THRU 2018
AVERAGE TEMPERATURE YEAR
LINE 2014 2015 2016 2017 2018 LINE
CAPACITY AVAILABLE 1/ & 2/
1 California Source Gas 0 0 0 0 0 1
2 Southern Zone of SoCalGas 1/
607 607 607 607 607 23 TOTAL CAPACITY AVAILABLE 607 607 607 607 607 3
GAS SUPPLY TAKEN4 California Source Gas 0 0 0 0 0 45 Southern Zone of SoCalGas 341 325 332 330 323 56 TOTAL SUPPLY TAKEN 341 325 332 330 323 6
7 Net Underground Storage Withdrawal 0 0 0 0 0 7
8 TOTAL THROUGHPUT 341 325 332 330 323 8
REQUIREMENTS FORECAST BY END-USE 3/
9 CORE 4/
Residential 88 87 88 88 88 910 Commercial 47 47 47 47 47 1011 Industrial 4 4 4 4 4 1112 NGV 2 2 2 2 2 1213 Subtotal-CORE 141 140 141 141 141 13
14 NONCORE Commercial 7 7 7 7 8 1415 Industrial 5 5 5 5 5 1516 Electric Generation (EG) 183 169 175 173 165 1617 Subtotal-NONCORE 195 181 187 185 178 17
18 Co. Use & LUAF 5 4 4 4 4 18
19 SYSTEM TOTAL THROUGHPUT 341 325 332 330 323 19
TRANSPORTATION AND EXCHANGE20 CORE All End Uses 11 12 12 12 12 2021 NONCORE Commercial/Industrial 12 12 12 12 12 2122 Electric Generation (EG) 183 169 175 173 165 2223 TOTAL TRANSPORTATION & EXCHANGE 206 193 199 197 189 23
CURTAILMENT 24 Core 0 0 0 0 0 2425 Noncore 0 0 0 0 0 2526 TOTAL - Curtailment 0 0 0 0 0 26
NOTES: 1/ Capacity to receive gas from the Southern Zone of SoCalGas is an annual value based on weighting winter and non-winter season values: 607 = (630 winter) x (151/365) + (590 non-winter) x (214/365). 2/ For 2010 and after, assume capacity at same levels. 3/ Requirement forecast by end-use includes sales, transportation, and exchange volumes. 4/ Core end-use demand exclusive of core aggregation transportation (CAT) in MDth/d: 133 131 132 132 132
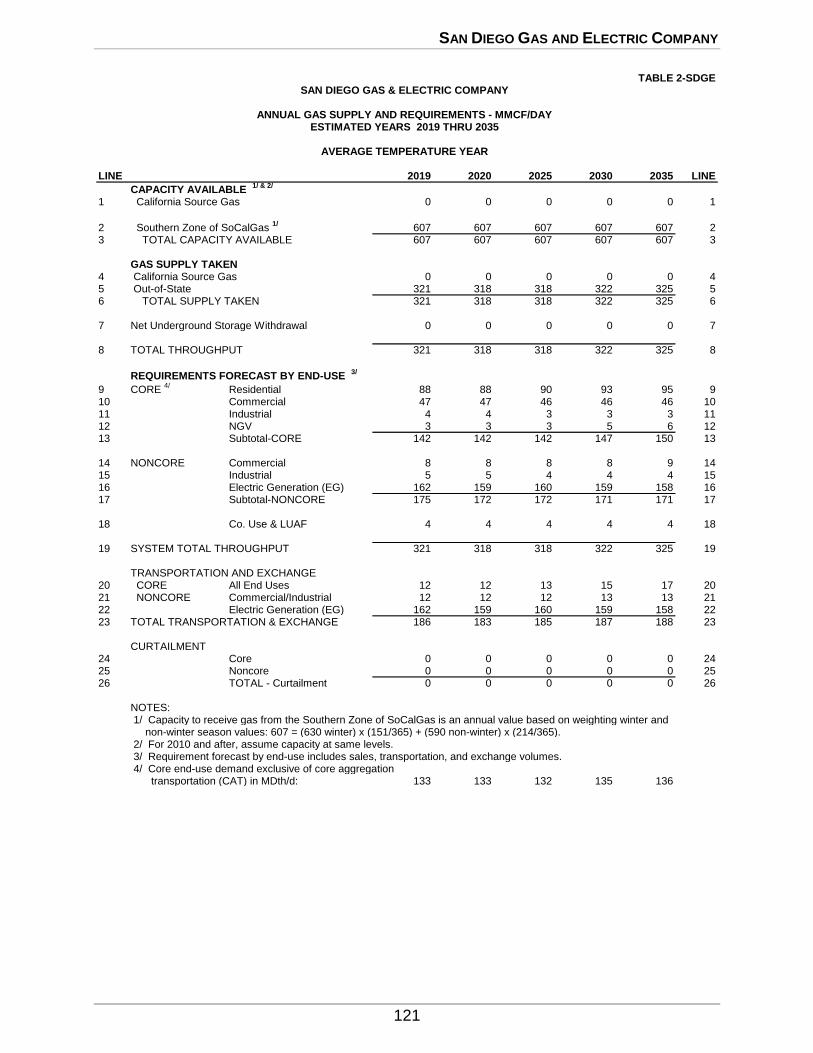
SAN DIEGO GAS AND ELECTRIC COMPANY
121
TABLE 2-SDGE SAN DIEGO GAS & ELECTRIC COMPANY
ANNUAL GAS SUPPLY AND REQUIREMENTS - MMCF/DAY ESTIMATED YEARS 2019 THRU 2035
AVERAGE TEMPERATURE YEAR
LINE 2019 2020 2025 2030 2035 LINE
CAPACITY AVAILABLE 1/ & 2/
1 California Source Gas 0 0 0 0 0 1
2 Southern Zone of SoCalGas 1/
607 607 607 607 607 23 TOTAL CAPACITY AVAILABLE 607 607 607 607 607 3
GAS SUPPLY TAKEN4 California Source Gas 0 0 0 0 0 45 Out-of-State 321 318 318 322 325 56 TOTAL SUPPLY TAKEN 321 318 318 322 325 6
7 Net Underground Storage Withdrawal 0 0 0 0 0 7
8 TOTAL THROUGHPUT 321 318 318 322 325 8
REQUIREMENTS FORECAST BY END-USE 3/
9 CORE 4/
Residential 88 88 90 93 95 910 Commercial 47 47 46 46 46 1011 Industrial 4 4 3 3 3 1112 NGV 3 3 3 5 6 1213 Subtotal-CORE 142 142 142 147 150 13
14 NONCORE Commercial 8 8 8 8 9 1415 Industrial 5 5 4 4 4 1516 Electric Generation (EG) 162 159 160 159 158 1617 Subtotal-NONCORE 175 172 172 171 171 17
18 Co. Use & LUAF 4 4 4 4 4 18
19 SYSTEM TOTAL THROUGHPUT 321 318 318 322 325 19
TRANSPORTATION AND EXCHANGE20 CORE All End Uses 12 12 13 15 17 2021 NONCORE Commercial/Industrial 12 12 12 13 13 2122 Electric Generation (EG) 162 159 160 159 158 2223 TOTAL TRANSPORTATION & EXCHANGE 186 183 185 187 188 23
CURTAILMENT 24 Core 0 0 0 0 0 2425 Noncore 0 0 0 0 0 2526 TOTAL - Curtailment 0 0 0 0 0 26
NOTES: 1/ Capacity to receive gas from the Southern Zone of SoCalGas is an annual value based on weighting winter and non-winter season values: 607 = (630 winter) x (151/365) + (590 non-winter) x (214/365). 2/ For 2010 and after, assume capacity at same levels. 3/ Requirement forecast by end-use includes sales, transportation, and exchange volumes. 4/ Core end-use demand exclusive of core aggregation transportation (CAT) in MDth/d: 133 133 132 135 136
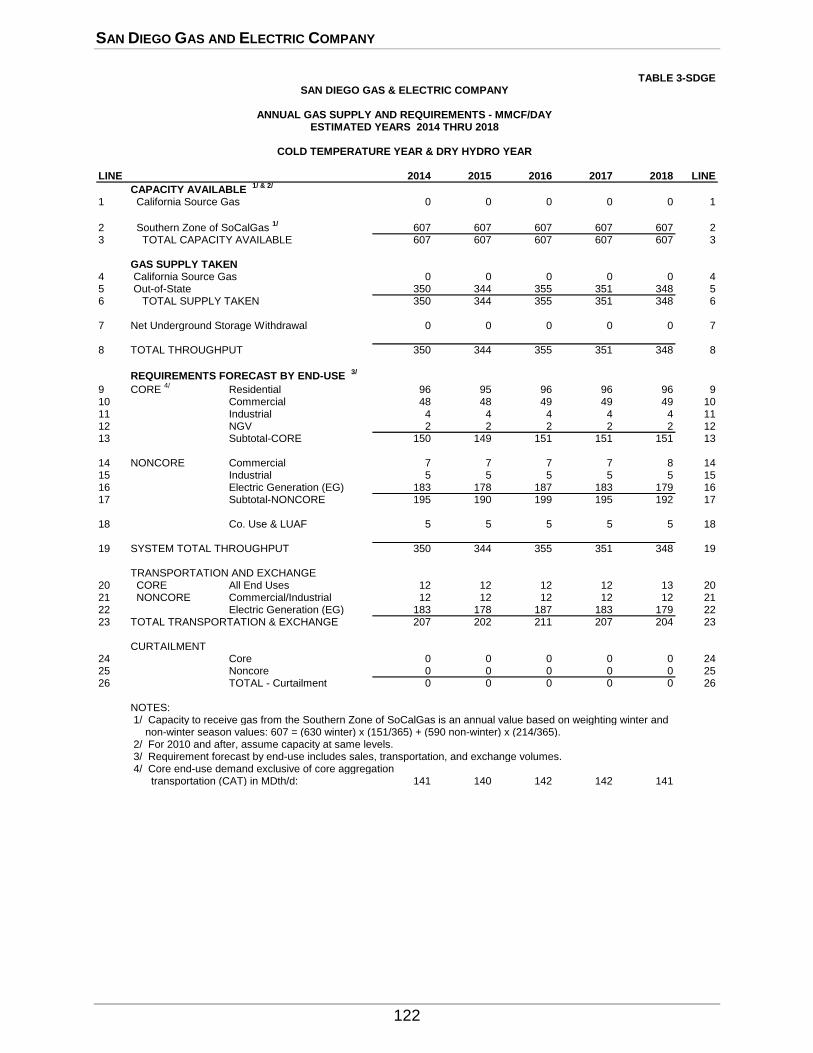
SAN DIEGO GAS AND ELECTRIC COMPANY
122
TABLE 3-SDGE SAN DIEGO GAS & ELECTRIC COMPANY
ANNUAL GAS SUPPLY AND REQUIREMENTS - MMCF/DAY ESTIMATED YEARS 2014 THRU 2018
COLD TEMPERATURE YEAR & DRY HYDRO YEAR
LINE 2014 2015 2016 2017 2018 LINE
CAPACITY AVAILABLE 1/ & 2/
1 California Source Gas 0 0 0 0 0 1
2 Southern Zone of SoCalGas 1/
607 607 607 607 607 23 TOTAL CAPACITY AVAILABLE 607 607 607 607 607 3
GAS SUPPLY TAKEN4 California Source Gas 0 0 0 0 0 45 Out-of-State 350 344 355 351 348 56 TOTAL SUPPLY TAKEN 350 344 355 351 348 6
7 Net Underground Storage Withdrawal 0 0 0 0 0 7
8 TOTAL THROUGHPUT 350 344 355 351 348 8
REQUIREMENTS FORECAST BY END-USE 3/
9 CORE 4/
Residential 96 95 96 96 96 910 Commercial 48 48 49 49 49 1011 Industrial 4 4 4 4 4 1112 NGV 2 2 2 2 2 1213 Subtotal-CORE 150 149 151 151 151 13
14 NONCORE Commercial 7 7 7 7 8 1415 Industrial 5 5 5 5 5 1516 Electric Generation (EG) 183 178 187 183 179 1617 Subtotal-NONCORE 195 190 199 195 192 17
18 Co. Use & LUAF 5 5 5 5 5 18
19 SYSTEM TOTAL THROUGHPUT 350 344 355 351 348 19
TRANSPORTATION AND EXCHANGE20 CORE All End Uses 12 12 12 12 13 2021 NONCORE Commercial/Industrial 12 12 12 12 12 2122 Electric Generation (EG) 183 178 187 183 179 2223 TOTAL TRANSPORTATION & EXCHANGE 207 202 211 207 204 23
CURTAILMENT 24 Core 0 0 0 0 0 2425 Noncore 0 0 0 0 0 2526 TOTAL - Curtailment 0 0 0 0 0 26
NOTES: 1/ Capacity to receive gas from the Southern Zone of SoCalGas is an annual value based on weighting winter and non-winter season values: 607 = (630 winter) x (151/365) + (590 non-winter) x (214/365). 2/ For 2010 and after, assume capacity at same levels. 3/ Requirement forecast by end-use includes sales, transportation, and exchange volumes. 4/ Core end-use demand exclusive of core aggregation transportation (CAT) in MDth/d: 141 140 142 142 141
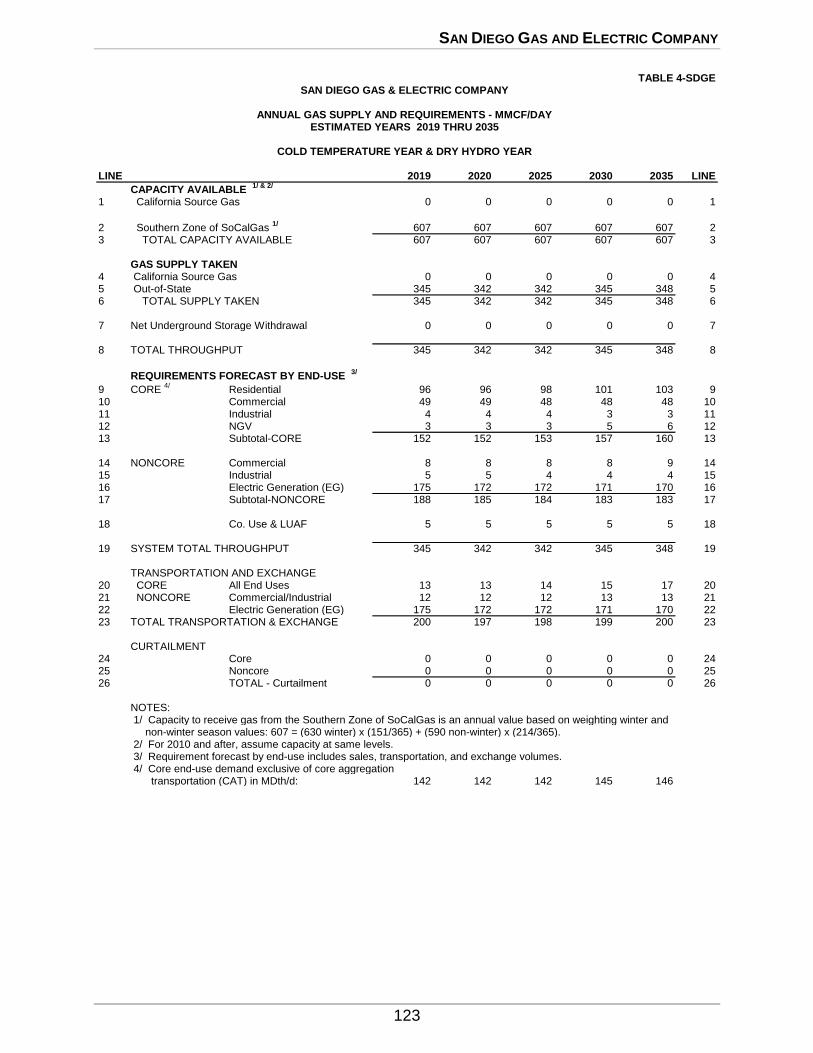
SAN DIEGO GAS AND ELECTRIC COMPANY
123
TABLE 4-SDGE SAN DIEGO GAS & ELECTRIC COMPANY
ANNUAL GAS SUPPLY AND REQUIREMENTS - MMCF/DAY ESTIMATED YEARS 2019 THRU 2035
COLD TEMPERATURE YEAR & DRY HYDRO YEAR
LINE 2019 2020 2025 2030 2035 LINE
CAPACITY AVAILABLE 1/ & 2/
1 California Source Gas 0 0 0 0 0 1
2 Southern Zone of SoCalGas 1/
607 607 607 607 607 23 TOTAL CAPACITY AVAILABLE 607 607 607 607 607 3
GAS SUPPLY TAKEN4 California Source Gas 0 0 0 0 0 45 Out-of-State 345 342 342 345 348 56 TOTAL SUPPLY TAKEN 345 342 342 345 348 6
7 Net Underground Storage Withdrawal 0 0 0 0 0 7
8 TOTAL THROUGHPUT 345 342 342 345 348 8
REQUIREMENTS FORECAST BY END-USE 3/
9 CORE 4/
Residential 96 96 98 101 103 910 Commercial 49 49 48 48 48 1011 Industrial 4 4 4 3 3 1112 NGV 3 3 3 5 6 1213 Subtotal-CORE 152 152 153 157 160 13
14 NONCORE Commercial 8 8 8 8 9 1415 Industrial 5 5 4 4 4 1516 Electric Generation (EG) 175 172 172 171 170 1617 Subtotal-NONCORE 188 185 184 183 183 17
18 Co. Use & LUAF 5 5 5 5 5 18
19 SYSTEM TOTAL THROUGHPUT 345 342 342 345 348 19
TRANSPORTATION AND EXCHANGE20 CORE All End Uses 13 13 14 15 17 2021 NONCORE Commercial/Industrial 12 12 12 13 13 2122 Electric Generation (EG) 175 172 172 171 170 2223 TOTAL TRANSPORTATION & EXCHANGE 200 197 198 199 200 23
CURTAILMENT 24 Core 0 0 0 0 0 2425 Noncore 0 0 0 0 0 2526 TOTAL - Curtailment 0 0 0 0 0 26
NOTES: 1/ Capacity to receive gas from the Southern Zone of SoCalGas is an annual value based on weighting winter and non-winter season values: 607 = (630 winter) x (151/365) + (590 non-winter) x (214/365). 2/ For 2010 and after, assume capacity at same levels. 3/ Requirement forecast by end-use includes sales, transportation, and exchange volumes. 4/ Core end-use demand exclusive of core aggregation transportation (CAT) in MDth/d: 142 142 142 145 146

GLOSSARY
124
2 0 1 4 C A L I F O R N I A G A S R E P O R T
GLOSSARY
GLOSSARY
125
GLOSSARY
Average Day (Operational Definition)
Annual gas sales or requirements assuming average temperature year conditions divided by 365 days.
Average Temperature year
Long-term average recorded temperature.
BTU (British Thermal Unit)
Unit of measurement equal to the amount of heat energy required to raise the
temperature of one pound of water one degree Fahrenheit. This unit is commonly used
to measure the quantity of heat available from complete combustion of natural gas.
California-Source Gas
1. Regular Purchases – All gas received or forecast from California producers, excluding exchange volumes. Also referred to as Local Deliveries.
2. Received for Exchange/Transport – All gas received or forecast from California
producers for exchange, payback, or transport.
CEC
California Energy Commission.
CNG (Compressed Natural Gas)
Fuel for natural gas vehicles, typically natural gas compressed to 3000 pounds per square inch.
Cogeneration
Simultaneous production of electricity and thermal energy from the same fuel source.
Also used to designate a separate class of gas customers.
Cold Temperature Year
Cold design-temperature conditions based on long-term recorded weather data.
Commercial (SoCalGas & SDG&E)
Category of gas customers whose establishments consist of services, manufacturing
nondurable goods, dwellings not classified as residential, and farming (agricultural).
Commercial (PG&E)
Non-residential gas customers not engaged in electric generation, enhanced oil recovery, or gas resale activities with usage less than 20,800 therms per month.
GLOSSARY
126
Company Use
Gas used by utilities for operational purposes, such as fuel for line compression and
injection into storage.
Conversion Factor (Natural Gas)
1 CF (Cubic Feet) = Approx. 1,000 BTUs
1 CCF = 100 CF = Approximately 1 Therm
1 Therm = 100,000 BTUs = Approximately 100 CF = 0.1 MCF 10 Therms = 1 Dth (dekatherm) = Approximately 1 MCF
1 MCF = 1,000 CF = Approximately 10 Therms = 1 MMBTU
1 MMCF = 1 million cubic feet = Approximately 1 MDth (1 thousand dekatherm) 1 BCF = 1 billion CF = Approximately 1 million MMBTU
Conversion Factor (Petroleum Products)
Approximate heat content of petroleum products (Million BTU per Barrel)
Crude Oil 5.800
Residual Fuel Oil 6.287 Distillate Fuel Oil 5.825
Petroleum Coke 6.024
Butane 4.360 Propane 3.836
Pentane Plus 4.620
Motor Gasoline 5.253
Conversion Factor (LNG)
Approximate LNG liquid conversion factor for one therm (High-Heat Value) Pounds 4.2020
Gallons 1.1660
Cubic Feet 0.1570 Barrels 0.0280
Cubic Meters 0.0044
Metric Tonnes 0.0019
Core Aggregator
Individuals or entities arranging natural gas commodity procurement activities on behalf of core customers. Also, sometimes known as an Energy Service Provider (ESP),
a Core Transport Agent (CTA), or a Retail Service Provider (RSP).
Core customers (SoCalGas & SDG&E)
All residential customers; all commercial and industrial customers with average usage
less than 20,800 therms per month who typically cannot fuel switch. Also, those commercial and industrial customers (whose average usage is more than 20,800 therms
per year) who elect to remain a core customer receiving bundled gas service from the
LDC.
Core Customer (PG&E)
All customers with average usage less than 20,800 therms per month.
GLOSSARY
127
Core Subscription
Noncore customers who elect to use the LDC as a procurement agent to meet their
commodity gas requirements.
CPUC
California Public Utilities Commission.
Cubic Foot of Gas
Volume of natural gas, which, at a temperature of 60º F and an absolute pressure of
14.73 pounds per square inch, occupies one cubic foot.
Curtailment
Temporary suspension, partial or complete, of gas deliveries to a customer or customers.
EG
Electric generation (including cogeneration) by a utility, customer, or independent
power producer.
Energy Service Provider (ESP)
Individuals or entities engaged in providing retail energy services on behalf of customers. ESP’s may provide commodity procurement, but could also provide other
services, e.g., metering and billing.
Enhanced Oil Recovery (EOR)
Injection of steam into oil-holding geologic zones to increase ability to extract oil by
lowering its viscosity. Also used to designate a special category of gas customers.
Exchange
Delivery of gas by one party to another and the delivery of an equivalent quantity by the second party to the first. Such transactions usually involve different points of delivery
and may or may not be concurrent.
Exempt Wholesale Generators (EWG)
A category of customers consuming gas for the purpose of generating electric power.
FERC
Federal Energy Regulatory Commission.
Futures (Gas)
Unit of natural gas futures contract trades in units of 10,000 million British thermal units
(MMBtu) at the New York Mercantile Exchange (NYMEX). The price is based on delivery at Henry Hub in Louisiana.
Gas Accord
The Gas Accord is a multi-party settlement agreement, which restructured PG&E's gas
transportation and storage services. The settlement was filed with the CPUC in
August 1996, approved by the CPUC in August 1997 (D.97-08-055) and implemented by
GLOSSARY
128
PG&E in March 1998. In D.03-12-061, the CPUC ordered the Gas Accord structure to
continue for 2004 and 2005.
Key features of the Gas Accord structure include the following: unbundling of PG&E's
gas transmission service and a portion of its storage service; placing PG&E at risk for transmission service and a portion of its storage service; placing PG&E at risk for
transmission and storage costs and revenues; establishing firm, tradable transmission
and storage rights; and establishing transmission and storage rates.
Gas Sendout
That portion of the available gas supply that is delivered to gas customers for consumption, plus shrinkage.
GHG
Greenhouse gases are the gases present in the atmosphere which reduce the loss of heat
into space and therefore contribute to global temperatures through the greenhouse
effect. The most the most abundant greenhouse gases are, in order of relative abundance are water vapor, carbon dioxide, methane, nitrous oxide, ozone and CFCs.
Heating Degree Day (HDD) A heating degree day is accumulated for every degree Fahrenheit the daily average
temperature is below a standard reference temperature (SoCalGas and SDG&E: 65ºF;
PG&E 60ºF). A basis for computing how much electricity and gas are needed for space heating purposes. For example, for a 50ºF average temperature day, SoCalGas and
SDG&E would accumulate 15 HDD, and PG&E would accumulate 10 HDD.
Heating Value
Number of BTU’s liberated by the complete combustion at constant pressure of one
cubic foot of natural gas at a base temperature of sixty degrees Fahrenheit (60°F) and a pressure base of fourteen and seventy-three hundredths (14.73) psia, with air at the same
temperature and pressure as the natural gas, after the products of combustion are cooled
to the initial temperature of natural gas, and after the water vapor of the combustion is condensed to the liquid state. The heating value of the natural gas shall be corrected for
the water vapor content of the natural gas being delivered except that, if such content is
seven (7) pounds or less per one million cubic feet, the natural gas shall be considered dry.
Industrial (SoCalGas & SDG&E) Category of gas customers who are engaged in mining and in manufacturing durable
goods.
Industrial (PG&E)
Non-residential customers not engaged in electric generation, enhanced oil recovery, or gas resale activities using more than 20,800 therms per month.
LDC
Local electric and/or natural gas distribution company.
GLOSSARY
129
LNG (Liquefied Natural Gas)
Natural gas that has been super cooled to -260° F (-162° C) and condensed into a liquid
that takes up 600 times less space than in its gaseous state.
Load Following
A utility’s practice of adding additional generation to available energy supplies to meet
moment-to-moment demand in the distribution system served by the utility, and for
keeping generating facilities informed of load requirements to insure that generators are producing neither too little nor too much energy to supply the utilities customers.
MMBTU
Million British Thermal Units. One MMBTU is equals to 10 therms or one dekatherm.
MCF
The volume of natural gas which occupies 1,000 cubic feet when such gas is at a
temperature of 60º Fahrenheit and at a standard pressure of approximately 15 pounds
per square inch.
MMCF/DAY
Million cubic feet of gas per day.
NGV (Natural Gas Vehicle)
Vehicle that uses CNG or LNG as its source of fuel for its internal combustion engine.
Noncore Customers
Commercial and industrial customers whose average usage exceeds 20,800 therms per month, including qualifying cogeneration and solar electric projects. Noncore customers
assume gas procurement responsibilities and receive gas transportation service from the
utility under firm or interruptible intrastate transmission arrangements.
Non-Utility Served Load
The volume of gas delivered directly to customers by an interstate or intrastate pipeline or other independent source instead of the local distribution company.
Off-System Sales
Gas sales to customers outside the utility’s service area.
Out-Of-State Gas
Gas from sources outside the state of California.
Priority of Service (SoCalGas & SDG&E) In the event of a curtailment situation, utilities curtail gas usage to customers based on
the following end-use priorities:
1. Firm Service – All noncore customers served through firm intrastate transmission service, including core subscription service.
2. Interruptible – All noncore customers served through interruptible intrastate
transmission service, including inter-utility deliveries.

GLOSSARY
130
Priority of Service (PG&E)
In the event of a curtailment situation, PG&E curtails gas usage to customers based on
the following end-use priorities:
1. Core Residential
2. Non-residential Core 3. Noncore using firm backbone service (including UEG)
4. Noncore using as-available backbone service (including UEG)
5. Market Center Services
PSIA
Pounds per square inch absolute. Equal to gauge pressure plus local atmospheric pressure.
PSEP
Pipeline Safety Enhancement Plan.
Purchase from Other Utilities
Gas purchased from other utilities in California.
Requirements
Total potential demand for gas, including that served by transportation, assuming the
availability of unlimited supplies at reasonable cost.
Resale
Gas customers who are either another utility or a municipal entity that, in turn, resells
gas to end-use customers.
Residential
A category of gas customers whose dwellings are single-family units, multi-family units, mobile homes or other similar living facilities.
Short-Term Supplies
Gas purchased usually involving 30-day, short-term contract or spot gas supplies.
Spot Purchases Short-term purchases of gas typically not under contract and generally categorized as
surplus or best efforts.
Storage Banking
The direct use of local distribution company gas storage facilities by customers or other
entities to store self-procured commodity gas supplies.
Storage Injection
Volume of natural gas injected into underground storage facilities.
Storage Withdrawal
Volume of natural gas taken from underground storage facilities.
GLOSSARY
131
Supplemental Supplies
A utility’s best estimate for additional gas supplies that may be realized, from
unspecified sources, during the forecast period.
System Capacity or Normal System Capacity (Operational Definition)
The physical limitation of the system (pipelines and storage) to deliver or flow gas to
end-users.
System Utilization or Nominal System Capacity (Operational Definition)
The use of system capacity or nominal system capacity at less then 100 percent
utilization.
Take-or-Pay
A term used to describe a contract agreement to pay for a product (natural gas) whether
or not the product is delivered.
Tariff
All rate schedules, sample forms, rentals, charges, and rules approved by regulatory
agencies for used by the utility.
TCF
Trillion cubic feet of gas.
Therm
A unit of energy measurement, nominally 100,000 BTUs.
Total Gas Supply Available
Total quantity of gas estimated to be available to meet gas requirements.
Total Gas Supply Taken
Total quantity of gas taken from all sources to meet gas requirements.
Total Throughput
Total gas volumes passing through the system including sales, company use, storage,
transportation and exchange.
Transportation Gas
Non-utility-owned gas transported for another party under contractual agreement.
UEG
Utility electric generation.
Unaccounted-For
Gas received into the system but unaccounted for due to measurement, temperature, pressure, or accounting discrepancies.
GLOSSARY
132
Unbundling
The separation of natural gas utility services into its separate service components such as
gas procurement, transportation, and storage with distinct rates for each service.
WACOG
Weighted average cost of gas.
Wholesale
A category of customer, either a utility or municipal entity, that resells gas.
Wobbe
The Wobbe number of a fuel gas is found by dividing the high heating value of the gas
in BTU per standard cubic feet (scf) by the square root of a specific gravity with respect
to air. The higher a gases’ Wobbe number, the greater the heating value of the quality of
gas that will flow through a hole of a given size in a given amount of time.
RESPONDENTS
133
2 0 1 4 C A L I F O R N I A G A S R E P O R T
RESPONDENTS
RESPONDENTS
134
RESPONDENTS
The following utilities have been designated by the California Public Utilities
Commission as respondents in the preparation of the California Gas Report.
Pacific Gas and Electric Company
San Diego Gas and Electric Company Southern California Gas Company
The following utilities also cooperated in the preparation of the report.
City of Long Beach Municipal Gas and Oil Department
Sacramento Municipal Utilities District Southern California Edison Company
Southwest Gas Corporation
ECOGAS Mexico, S. de R.L. de C.V.
A statewide committee has been formed by the respondents and cooperating utilities to
prepare this report. The following individuals served on this committee.
Working Committee
Jeff Swanson (Chairperson) – PG&E
Rose-Marie Payan-SoCalGas/SDG&E
Sharim Chaudhury- SoCalGas/SDG&E Jeff Huang – SoCalGas/SDG&E
Michelle Clay-Ijomah-SDG&E
Eric Hsu-PG&E David Sanchez- City of Long Beach Gas and Oil
Robert Kennedy- CEC
Angela Tanghetti – CEC
Observers
Richard Myers– CPUC Energy Division
RESPONDENTS
135
RESERVE YOUR SUBSCRIPTION
2015 CALIFORNIA GAS REPORT – SUPPLEMENT
Southern California Gas Company
2015 CGR Reservation Form
Box 3249, Mail Location GT14D6
Los Angeles, CA 90051-1249
or
Fax: (213) 244-4957 Email: Sharim Chaudhury [email protected]
Send me a 2015 CGR Supplement
New subscriber
Change of address
Company Name: ____________________________________________
C/O: ______________________________________________________
Address: ___________________________________________________
City: __________________ State: _____________ Zip: _________
Phone: ( _____ ) ________________ Fax: ( _____ ) ______________
Also, please visit our website at: www.socalgas.com www.sdge.com
RESPONDENTS
136
RESERVE YOUR SUBSCRIPTION
2015 CALIFORNIA GAS REPORT – SUPPLEMENT
Pacific Gas and Electric Company
2015 CGR Reservation Form
Attention: Jeff Swanson
Mail Code B10B P. O. Box 770000
San Francisco, CA 94177
or
Email: Jeff Swanson [email protected]
Send me a 2015 CGR Supplement
New subscriber Change of address
Company Name: ____________________________________________
C/O: ______________________________________________________
Address: ___________________________________________________
City: __________________ State: _____________ Zip: _________
Phone: ( _____ ) ________________ Fax: ( _____ ) ______________
Digital copies available on our website at: http://www.pge.com/pipeline/library/regulatory/cgr_index.shtml
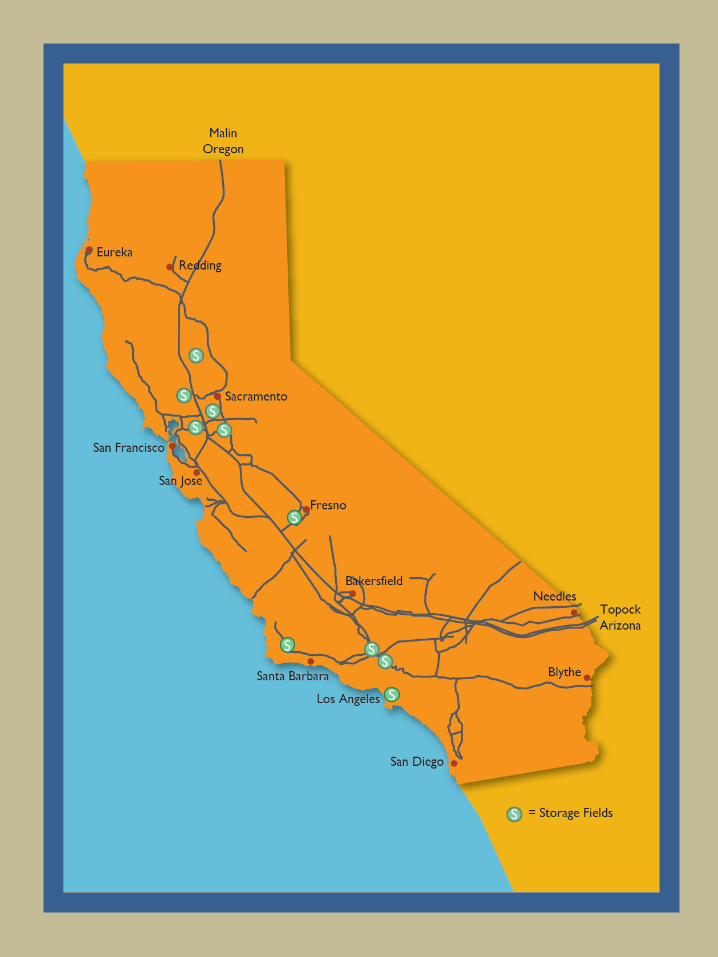
S
S
S


