Workload Estimation in PhysicalHuman–Robot Interaction Using
Physiological Measurements
Domen Novak∗, Benjamin Beyeler, Ximena Omlin and Robert Riener
Sensory-Motor Systems Laboratory, ETH Zurich, TAN E3, Tannenstrasse 1, CH-8092 Zurich, Switzerland∗Corresponding author: [email protected]
This paper uses physiological measurements to estimate human workload and effort in physicalhuman–robot interaction. Ten subjects performed 19 consecutive task periods using the ARMinrobot while difficulty was varied along two scales. Three physiological modalities were measured:electroencephalography, autonomic nervous system (ANS) responses (electrocardiography, skinconductance, respiration, skin temperature) and eye tracking. After each task period, referenceworkload and effort values were collected using the NASA Task Load Index. Machine learning wasused to estimate workload and effort from physiological data. All three physiological modalitiesperformed significantly better than random, particularly using nonlinear estimation algorithms. Themost important ANS responses were respiration and skin conductance, while the most importantelectroencephalographic information was obtained from frontal and central sites. However, all threephysiological modalities were outperformed by task performance and movement data. This suggeststhat future studies should try to demonstrate advantages of physiological measurements over other
information sources.
RESEARCH HIGHLIGHTS
• Workload and effort estimation in physical human–robot interaction using physiological measurements.• Electroencephalography, autonomic nervous system, eye tracking.• Machine learning algorithms: linear regression, random forests.• Good estimation accuracy, most relevant signals identified.• Physiological measurements outperformed by task performance and movement data.
Received 6 July 2013; Revised 14 March 2014; Accepted 18 April 2014
1. INTRODUCTION
As machines become more advanced, they need new waysof communicating with humans. The paradigm of affectivecomputing posits that one important communication channelis for computers to recognize human emotions (Picard et al.,2001). Such ‘affective’ machines could better interact withhumans in real time. In their seminal work on the topic, Picardet al. (2001) demonstrated that physiological measurementssuch as electrocardiography can be used to differentiate betweenemotions. Since then, these measurements have been promoted
as an excellent emotion recognition tool, as they capture bothconscious and subconscious facets of user state without the needfor direct user input (Fairclough, 2009). For example, bloodpressure or skin conductance may increase when the user isexcited, frustrated or stressed.
One important psychological quantity in affective computingis subjective (felt or perceived) workload. To perform at anoptimal level, a user should be provided with enough workloadto avoid boredom, but not so much as to be overwhelmed. Asthe optimal workload is user-specific, it is frequently recognizedthrough physiological measurements. Such recognition was first
Interacting with Computers, 2014
Interacting with Computers Advance Access published May 21, 2014 at U
applied in adaptive automation, where computers took overtasks from users in cases of high workload (see Byrne andParasuraman (1996) for an early review). Work on adaptiveautomation has progressed considerably since then (Tinget al., 2010; Wilson and Russell, 2007), and physiology-based workload recognition has expanded into other fields.For instance, games have been proposed where the computeradapts game difficulty based on the player’s enjoyment, stressor workload (Chanel et al., 2011; Liu et al., 2009).
Human–robot interaction was another early application ofaffective computing, with physiological measurements usedto recognize stress, anxiety and enjoyment (Liu et al., 2008;Rani et al., 2002, 2004). Recently, several physiological studieshave been performed in rehabilitation robotics, with the goalof using physiological measurements to adapt workload so thatpatients are appropriately challenged and gain optimal benefitfrom rehabilitation. Closed-loop examples of physiology-based workload adaptation in upper (Novak et al., 2011a)and lower (Koenig et al., 2011) extremity rehabilitationrobotics were first presented in 2011. Workload was recognizedthrough four autonomic nervous system (ANS) responses:electrocardiography (ECG), skin conductance, respiration andskin temperature. However, these responses are very susceptibleto both mental and physical workload. In physical human–robot interaction, effects of physical activity on ANS responsescan overshadow indicators of mental workload (Novak et al.,2011b). For this reason, previous studies (Novak et al., 2011a)suggested combiningANS responses with measures such as eyetracking in order to improve accuracy.
Several authors have proposed alternative setups forphysiology-based workload adaptation in rehabilitation, mostnotably Badesa et al. (2012) and Guerrero et al. (2013). WhileNovak et al. (2011a) and Koenig et al. (2011) use a classifierto assign discrete workload levels (low/high) to physiologicalresponses, Badesa et al. (2012) and Guerrero et al. (2013)use fuzzy logic to estimate continuous workload values. Forinstance, workload could be any number between 0 and 100.Such estimation of continuous values had been used withphysiological measurements in computer games (Mandryk andAtkins, 2007) and adaptive automation (Ting et al., 2010),but is not used in affective computing nearly as frequently asclassification (Novak et al., 2012).
Estimation has potential advantages over classification forworkload recognition in rehabilitation robotics. A classifiertreats classes as unrelated, which is false when distinguish-ing workload levels. For example, Koenig et al. (2011) dis-tinguished four workload levels (very high, high, low and verylow), but the classifier was not aware that all four are levelsof a single psychological quantity. Novak et al. (2011a) dis-tinguished two difficulty levels (low/high), and highlighted theproblem of cases near the border between low and high diffi-culty. This could be addressed with an estimator that wouldmodel the relationship between physiological responses andworkload as a continuous function. Such continuous functions
are also intuitive for rehabilitation robots, which generally donot choose between discrete actions, but adjust their parame-ters between a minimum and maximum. For example, Guer-rero et al. (2013) map the level of haptic assistance (which canbe anywhere between 0 and 100%) to workload (which has acontinuous range of 0 to 1). The rehabilitation game of Novaket al. (2011a) changes difficulty by changing the speed of a vir-tual ball, another variable that could be set to any value over acontinuous range.
While we believe that estimation rather than classificationof workload using physiological measurements is a promisingapproach, there are some weaknesses with the work of Badesaet al. (2012) and Guerrero et al. (2013). The fuzzy estimatorof Badesa et al. (2012) was not validated; although its outputchanges during a task, the changes do not affect the task andthere is no indication of whether they correspond to actualworkload changes. The estimator of Guerrero et al. (2013),on the other hand, adapted robotic assistance and resulted inincreased user enjoyment. However, there was no evaluation ofwhether the system intelligently estimates workload or simplyincreases enjoyment by providing any assistance at all: theonly evaluated conditions were ‘no assistance’and ‘physiology-triggered assistance’.
This problem was partially addressed in physical human–robot interaction by George et al. (2012), who classifiedelectroencephalography (EEG) into ‘high workload’ and ‘lowworkload’, then activated assistance during high workload.They tested three conditions: ‘no assistance’, ‘always assis-tance’and ‘physiology-based assistance’and found physiology-triggered assistance to be intelligent, with participants reportinga high correlation between computed and felt mental workload.The authors suggested that a combination of EEG and ANSresponses may allow better workload recognition.
To summarize, estimation of continuous values may be anefficient (though unproven) alternative to classification, andcombining ANS responses with other physiological measure-ments may allow the most accurate workload estimation. Ourstudy evaluates these possibilities by estimating workload andeffort using three physiological modalities: ANS responses(ECG, skin conductance, respiration and skin temperature),EEG and eye tracking. The goal is not to provide closed-loopcontrol of the task; it is to evaluate the accuracy of the threemodalities with reference to a self-report questionnaire. This isa significant challenge not only in human–robot interaction, butin general affective computing (Novak et al., 2012). As everyperson reacts differently to workload, we analyze not only work-load itself, but also effort put into the task, which represents thesubjective reaction to workload.
Physiology-based workload estimation has another signifi-cant challenge. Most laboratory studies estimate workload inwell-controlled conditions; for instance, by providing a briefrest after every task condition during which no stimuli are pre-sented, allowing physiological effects of the task to be ‘washedout’ before the next condition. They often also induce a single
Workload Estimation in Physical Human−Robot Interaction 3
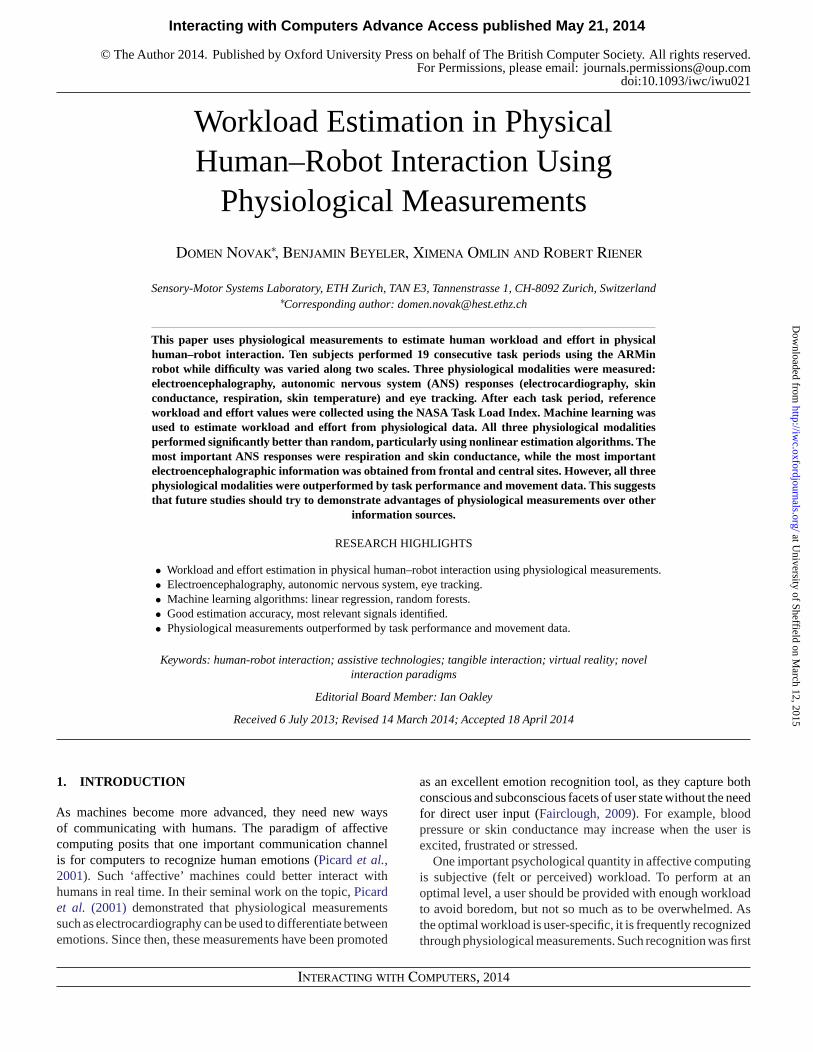
Figure 1. Study flowchart. ANS, autonomic nervous system; EEG, electroencephalography; NASA-TLX, Task Load Index questionnaire.
workload type (e.g. mental workload) while minimizing, e.g.physical activity. Such experiments are not ecologically valid,as a real session with a rehabilitation robot would not includeregular rest periods and since a rehabilitation task requires bothmental and physical workload. We instead designed our studyto include different workload types and a single initial baselineperiod. All work is done with a rehabilitation robot and healthysubjects.
2. MATERIALS AND METHODS
The general flowchart of our study is shown in Fig. 1. Subjects(Section 2.1) used a robot (Section 2.2) to perform a task(Section 2.3). The NASA-TLX questionnaire (2.4) was usedto collect reference workload and effort data following thestudy protocol (Section 2.5). During the protocol, physiologicaldata were also recorded and features were extracted fromthem (Section 2.6). These features were input into machinelearning algorithms that estimated the subject’s workload andeffort (Section 2.7). Estimated values were compared with self-reported values, and estimation accuracy was evaluated usingcross-validation (Section 2.8).
2.1. Subjects
Ten healthy right-handed subjects (8 males, 2 females,27.6 ± 3.7 years old) participated in the study. They were askednot to drink alcohol and coffee or smoke on the day of theexperiment. They were also asked not to wear thick-rimmedglasses as this degraded the eye tracker performance. All gavetheir informed consent after the purpose and procedure of thestudy were explained.
2.2. Robot
We used the ARMin III (Nef et al., 2009), a rehabilitationrobot with an exoskeletal structure with six actuated degreesof freedom, including a hand module. The subject’s dominantarm is connected to the robot with cuffs on the upper arm and
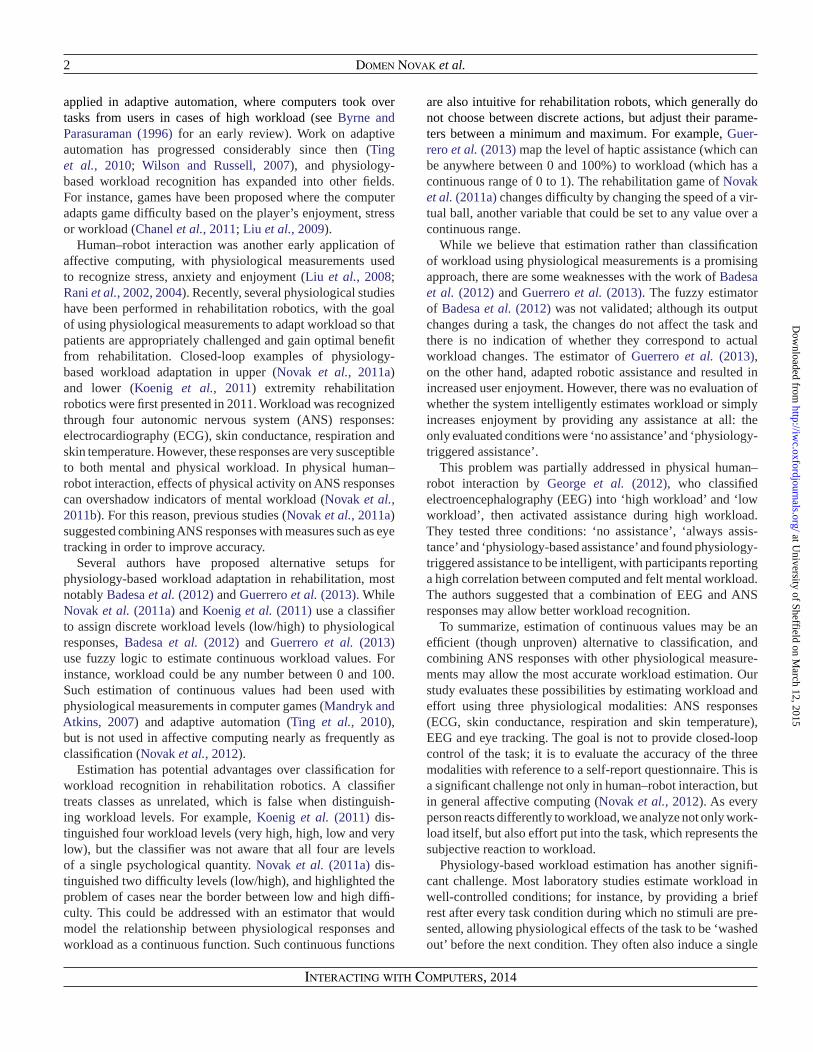
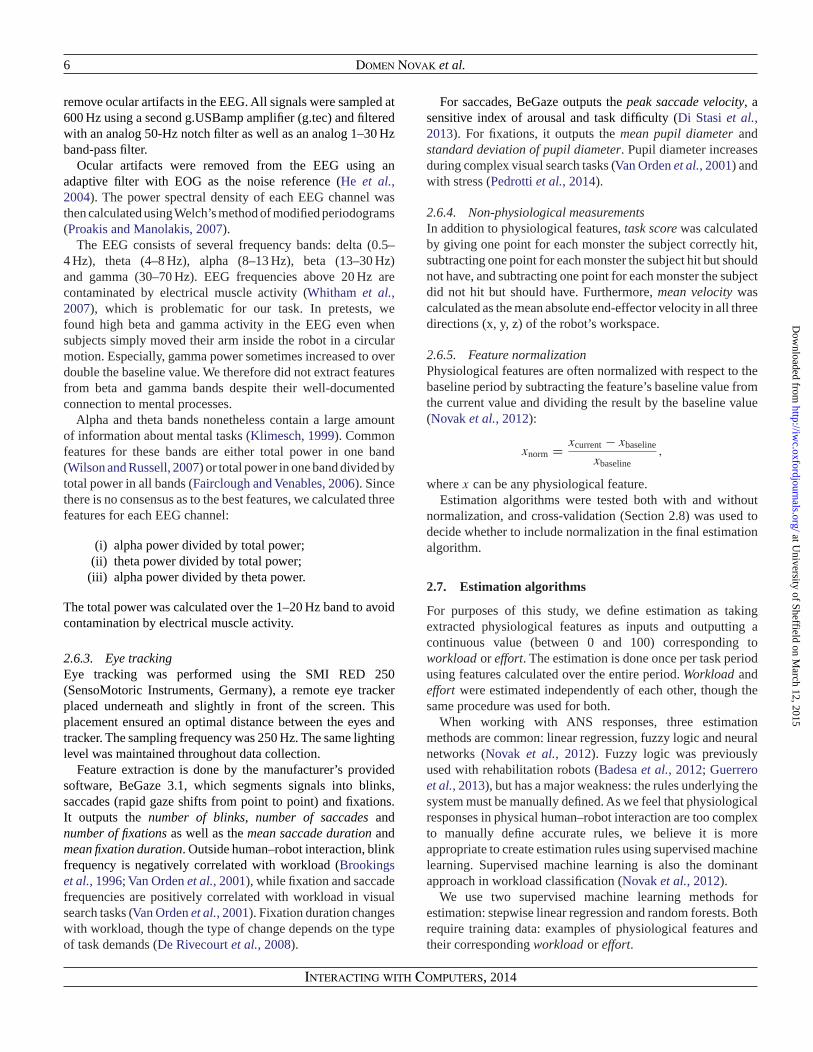
Figure 2. A subject performing the task with the ARMin robot whilebeing monitored by physiological sensors.
forearm, and the hand is strapped to the hand module. Thedimensions of the device are adjustable to each subject. Positionsensors allow interaction between the subject and robot to bemeasured at the joint level. Gravity and friction compensationis provided by the robot, allowing the arm to be moved withoutresistance.
Although the ARMin III is a rehabilitation robot, we usedit as a general physical human–robot interaction set-up. Whilerehabilitation is a relevant application for this study, we do notwish to emphasize it as the only possibility. A photo of a subjectperforming the task with the ARMin is shown in Fig. 2.
2.3. Task
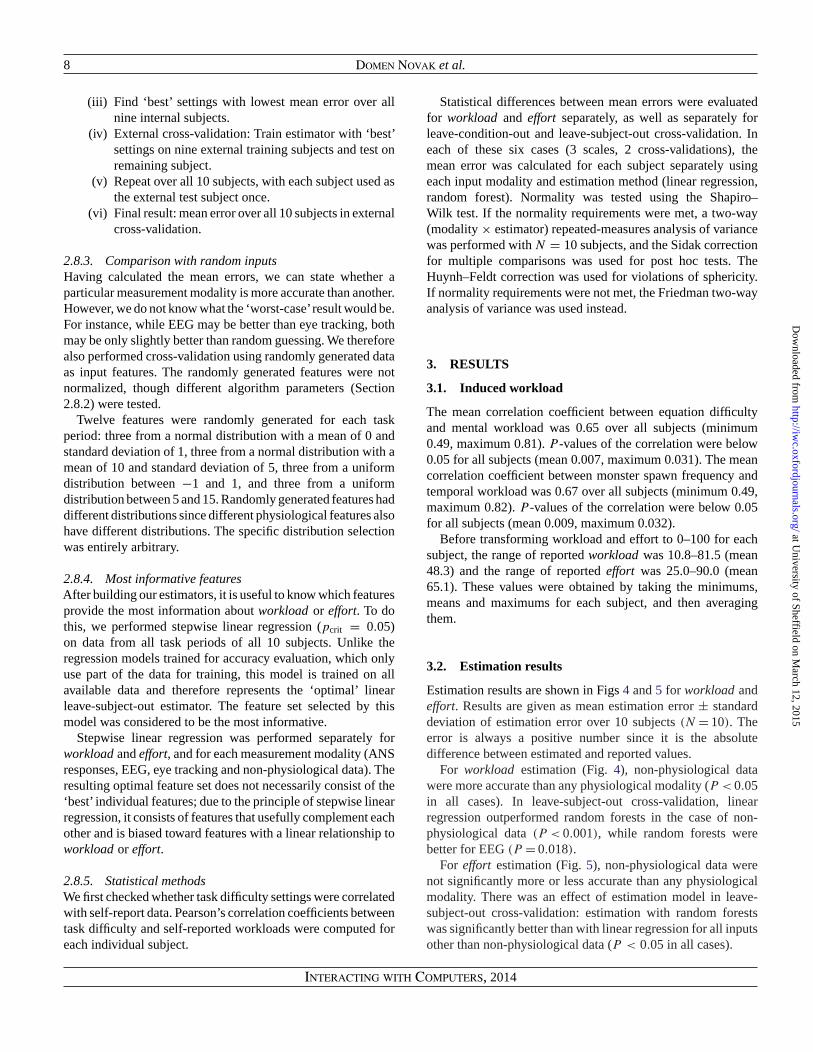
The principle of our ‘whack-a-mole’ task is to hit monsterswith a hammer before they disappear (Fig. 3). The hammeris moved around the screen with the robot’s end-effector, anda ‘hitting’ movement is performed with forearm pronation.Monsters appear at one of nine locations (3 × 3 layout) anddisappear if not hit within a certain amount of time. However, thesubject should not hit all monsters: each monster has an equationattached to it, and the subject should only hit correct equations.
Figure 3. A screenshot of the task with the hammer, the monsters andthe equations on the monsters.
Equations are restricted to addition and range from simple tovery difficult. The probability of an equation being correct is50%, though individual equations are generated randomly.
The task has two adjustable parameters: the equationdifficulty and the frequency with which monsters are spawned.A monster can spawn every 1.5, 2.5, 4 or 6 s. Each monsterremains on the screen 2.5 times the spawn interval, so thereare never more than three monsters on the screen. The equationdifficulty has five possible levels. Example equations are:
A higher equation difficulty requires the subject to perform morecomplex mental arithmetic, while a higher spawn frequencygives the subject less time to move the robot and to performthe mental arithmetic. With 5 equation difficulty levels and 4temporal difficulty levels, there are 20 possible conditions.
Initially, we also considered the possibility of force feedback,which was used in other rehabilitation robots to adapt physicalworkload (Novak et al., 2011b). However, pretests showed thatforce feedback in theARMin was either very fatiguing or had noeffect on the task. Therefore, no force feedback was provided.
2.4. NASA-TLX questionnaire
To evaluate the subjects’ responses to the task, we chose theNASA Task Load Index (NASA-TLX) questionnaire (Hart and
Staveland, 1988), which is extensively used in human workloadstudies, including physiological studies (Gonzalez et al., 2012;Wilson and Russell, 2007). It consists of six scales, of whichperformance was omitted since objective performance measuresare generally available in rehabilitation robotics. The other fivescales (with simplified descriptions) are:
(i) mental workload (‘How much mental and perceptualactivity was required?’);
(ii) temporal workload (‘How much time pressure did youfeel?’);
(iii) physical workload (‘How much physical activity wasrequired?’);
(iv) effort (‘How hard did you have to work, bothmentally and physically, to accomplish your level ofperformance?’);
(v) frustration (‘How discouraged, irritated, stressed andannoyed were you?’).
A computerized version of the NASA-TLX was applied severaltimes during the task. The value on each scale was selectedby moving a slider along a horizontal line marked ‘very low’and ‘very high’ at the extremes. The slider was moved byforearm pronation/supination in the robot, and the selection wasconfirmed verbally. The chosen value was saved as a numberbetween 0 and 100. After the experiment, results for each scalewere linearly transformed so that the lowest reported value wastransformed to 0 and the highest reported value was transformedto 100. This ensured that all subjects have the same range ofreported values.
The three workload scales (mental, temporal, physical) areoften correlated with each other (Hart, 2006) and difficult toseparate in physical human–robot interaction (Novak et al.,2011b). They were combined into workload—the mean ofthe mental, temporal and physical workload values. Thoughwe originally planned to analyze both effort and frustration, apreliminary analysis showed that frustration in the task can beexpressed as a function of workload and effort, and we thereforedo not report frustration results. The two remaining self-reportscales were workload and effort. Both were analyzed sinceworkload depends mainly on task characteristics, while effortrepresents the individual’s response to the workload.
2.5. Study protocol
Upon the subject’s arrival, the purpose and procedure of thestudy were explained. Subjects sat at the ARMin and placedtheir arm in the cuffs. The robot settings (arm length, gravitycompensation, etc.) were adapted to the subject. Subjects thenpracticed the game at a medium difficulty level (equation level 3,spawn once per 2.5 s) until they felt comfortable and understoodthe task. Subjects were required to practice for a minimumof 1 min, with all but one practicing for at least 3 min. Afterpractice, the NASA-TLX was demonstrated. The physiologicalsensors were applied and calibrated, and some final instructions
Workload Estimation in Physical Human−Robot Interaction 5
were given. Subjects were told to move their arm only duringthe experiment, to only speak when answering the NASA-TLXand to try their best even if they thought the task was impossible.
The experiment began with a 60-s baseline condition. Forthe baseline, subjects were told to relax, not move, keeptheir eyes open and remain silent. After the baseline, subjectsperformed 19 60-s task periods, with each task period having adifferent combination of equation difficulty and monster spawnfrequency. Of the 20 possible combinations, only the easiest one(level 1 equations, lowest spawn frequency) was omitted as itwas found to be extremely boring. The 19 combinations werepresented in a random order that was different for each subject.
Each task period was followed by the NASA-TLX before thenext task period. Subjects were told to answer the NASA-TLXfor the preceding 60-s period. If subjects moved their head orentire body too much during the preceding period, they werereminded to move only the arm before the next period began.After the 19th task period and NASA-TLX, the experiment wasconcluded.
2.6. Measurements and feature extraction
Raw data were collected from four measurement modalities:ANS, EEG, eye tracking and non-physiological measurements.Several features were extracted from these data for each 60-sbaseline and task period. Each feature was calculated over theentire 60-s period. The extracted features can optionally also benormalized (Section 2.6.5).
2.6.1. ANS responsesFour ANS signals were recorded: ECG, skin conductance,respiration and skin temperature. ECG was measured with threesurface electrodes. One electrode was affixed 2 cm below theright clavicula between the first and second ribs, one at thefifth intercostal space on the mid-axillary line of the left sideof the body, and one at the right acromion. Respiration wasmeasured using a thermistor flow sensor underneath the nose.Skin conductance was measured using a g.GSR sensor (g.tecMedical Engineering GmbH, Austria) at the medial phalangesof the second and third fingers of the non-dominant hand. Theperipheral skin temperature was measured using a g.TEMPsensor (g.tec) at the distal phalanx of the fifth finger of thenon-dominant hand. All signals were sampled at 600 Hz usinga g.USBamp signal amplifier (g.tec) and filtered with an analog50-Hz notch filter. Additional analog filters were 0.5-Hz high-pass for ECG and 30-Hz low-pass for the other three signals.
Before feature extraction, signals were visually examined formotion artifacts. Artifacts were manually removed from therespiration, temperature and ECG signals. In the respirationand temperature signals, <0.5% of the data contained artifacts.In the ECG, ∼5% of the task periods required manual artifactremoval. In rare cases where an R-peak could not be preciselyidentified in the ECG, it was defined halfway between theprevious and next R-peak. Artifacts in the skin conductance
signal, however, were only removed if they were obviouslyartifacts; in several cases, we could not determine whetherevents were artifacts or actual skin conductance changes, anddid not remove them.
From the ECG, intervals between two normal heartbeats(NN intervals) were extracted. Then, mean heart rate, thestandard deviation of NN intervals (SDNN) and the squareroot of the mean squared differences of successive NN intervals(RMSSD) were calculated as described in Task Force (1996).These metrics have been extensively used both in generalpsychophysiology (Kreibig, 2010) and physical human–robotinteraction (Badesa et al., 2012; Guerrero et al., 2013; Novaket al., 2011b).
From the skin conductance signal, we first calculatedthe mean skin conductance derivative. The signal was thenfiltered with a third-order Butterworth high-pass filter (cut-off: 0.05 Hz), and skin conductance responses (SCRs) weredetected. An SCR is a transient increase in skin conductancewhose amplitude exceeds 0.05 μS and whose peak occurs<5 s after the beginning of the increase. SCR frequency andmean SCR amplitude were calculated. SCRs are a strongindicator of both mental and physical workload (Novak et al.,2011b) and have been frequently used with rehabilitation robots(Badesa et al., 2012; Guerrero et al., 2013). The mean skinconductance derivative represents the tonic component of skinconductance, which is more strongly affected by physical thanmental workload (Novak et al., 2011b).
From the respiration signal, we calculated the meanrespiratory rate and the standard deviation of respiratoryrate. The respiratory rate increases with arousal and workload(Brookings et al., 1996; Veltman and Gaillard, 1998), whilerespiratory rate variability generally decreases with increasingworkload but increases again if the workload becomes too high(Boiten, 1993; Novak et al., 2011b).
From the temperature signal, we calculated the final skintemperature as the mean temperature during the last 5 s of eachperiod. Additionally, the mean derivative of skin temperaturewas calculated over the entire period. Skin temperaturegenerally decreases with increasing mental workload inphysical human–robot interaction (Badesa et al., 2012; Novaket al., 2011b).
2.6.2. ElectroencephalographyThe EEG was measured with the g.GAMMAcap (g.tec) andg.Butterfly active electrodes. Electrodes were placed at 11locations of the International 10–20 system: Fz, F3, F4, Cz,C3, C4, Pz, P3, P4, O1 and O2. Signals were referenced to anelectrode at position FPz and grounded with an electrode onthe left earlobe. These locations are commonly used in EEGstudies of mental workload (Berka et al., 2007; George et al.,2012; Wilson and Russell, 2007). Additionally, the electro-oculogram (EOG) was recorded with two gold electrodes (GrassTechnologies, USA): one to the upper right side of the right eyeand one to the lower left side of the left eye. It was used only to
remove ocular artifacts in the EEG. All signals were sampled at600 Hz using a second g.USBamp amplifier (g.tec) and filteredwith an analog 50-Hz notch filter as well as an analog 1–30 Hzband-pass filter.
Ocular artifacts were removed from the EEG using anadaptive filter with EOG as the noise reference (He et al.,2004). The power spectral density of each EEG channel wasthen calculated usingWelch’s method of modified periodograms(Proakis and Manolakis, 2007).
The EEG consists of several frequency bands: delta (0.5–4 Hz), theta (4–8 Hz), alpha (8–13 Hz), beta (13–30 Hz)and gamma (30–70 Hz). EEG frequencies above 20 Hz arecontaminated by electrical muscle activity (Whitham et al.,2007), which is problematic for our task. In pretests, wefound high beta and gamma activity in the EEG even whensubjects simply moved their arm inside the robot in a circularmotion. Especially, gamma power sometimes increased to overdouble the baseline value. We therefore did not extract featuresfrom beta and gamma bands despite their well-documentedconnection to mental processes.
Alpha and theta bands nonetheless contain a large amountof information about mental tasks (Klimesch, 1999). Commonfeatures for these bands are either total power in one band(Wilson and Russell, 2007) or total power in one band divided bytotal power in all bands (Fairclough and Venables, 2006). Sincethere is no consensus as to the best features, we calculated threefeatures for each EEG channel:
(i) alpha power divided by total power;(ii) theta power divided by total power;
(iii) alpha power divided by theta power.
The total power was calculated over the 1–20 Hz band to avoidcontamination by electrical muscle activity.
2.6.3. Eye trackingEye tracking was performed using the SMI RED 250(SensoMotoric Instruments, Germany), a remote eye trackerplaced underneath and slightly in front of the screen. Thisplacement ensured an optimal distance between the eyes andtracker. The sampling frequency was 250 Hz. The same lightinglevel was maintained throughout data collection.
Feature extraction is done by the manufacturer’s providedsoftware, BeGaze 3.1, which segments signals into blinks,saccades (rapid gaze shifts from point to point) and fixations.It outputs the number of blinks, number of saccades andnumber of fixations as well as the mean saccade duration andmean fixation duration. Outside human–robot interaction, blinkfrequency is negatively correlated with workload (Brookingset al., 1996; Van Orden et al., 2001), while fixation and saccadefrequencies are positively correlated with workload in visualsearch tasks (Van Orden et al., 2001). Fixation duration changeswith workload, though the type of change depends on the typeof task demands (De Rivecourt et al., 2008).
For saccades, BeGaze outputs the peak saccade velocity, asensitive index of arousal and task difficulty (Di Stasi et al.,2013). For fixations, it outputs the mean pupil diameter andstandard deviation of pupil diameter. Pupil diameter increasesduring complex visual search tasks (Van Orden et al., 2001) andwith stress (Pedrotti et al., 2014).
2.6.4. Non-physiological measurementsIn addition to physiological features, task score was calculatedby giving one point for each monster the subject correctly hit,subtracting one point for each monster the subject hit but shouldnot have, and subtracting one point for each monster the subjectdid not hit but should have. Furthermore, mean velocity wascalculated as the mean absolute end-effector velocity in all threedirections (x, y, z) of the robot’s workspace.
2.6.5. Feature normalizationPhysiological features are often normalized with respect to thebaseline period by subtracting the feature’s baseline value fromthe current value and dividing the result by the baseline value(Novak et al., 2012):
xnorm = xcurrent − xbaseline
xbaseline,
where x can be any physiological feature.Estimation algorithms were tested both with and without
normalization, and cross-validation (Section 2.8) was used todecide whether to include normalization in the final estimationalgorithm.
2.7. Estimation algorithms
For purposes of this study, we define estimation as takingextracted physiological features as inputs and outputting acontinuous value (between 0 and 100) corresponding toworkload or effort. The estimation is done once per task periodusing features calculated over the entire period. Workload andeffort were estimated independently of each other, though thesame procedure was used for both.
When working with ANS responses, three estimationmethods are common: linear regression, fuzzy logic and neuralnetworks (Novak et al., 2012). Fuzzy logic was previouslyused with rehabilitation robots (Badesa et al., 2012; Guerreroet al., 2013), but has a major weakness: the rules underlying thesystem must be manually defined. As we feel that physiologicalresponses in physical human–robot interaction are too complexto manually define accurate rules, we believe it is moreappropriate to create estimation rules using supervised machinelearning. Supervised machine learning is also the dominantapproach in workload classification (Novak et al., 2012).
We use two supervised machine learning methods forestimation: stepwise linear regression and random forests. Bothrequire training data: examples of physiological features andtheir corresponding workload or effort.
Workload Estimation in Physical Human−Robot Interaction 7
2.7.1. Stepwise linear regressionLinear regression estimates workload or effort as a weightedlinear sum of physiological features. The weights are calculatedfrom training data using the least squares method. To select onlythe most relevant features, we used stepwise linear regression,implemented in MATLAB 2011a through the stepwisefitfunction. Stepwise linear regression uses the features’P -valuesto select the most informative features. It was set to add featuresuntil at least Ncrit features have been included and no remainingfeature has a P -value below pcrit . The parameters Ncrit andpcrit are set in cross-validation (Section 2.8). Stepwise linearregression is simple and robust, but cannot handle nonlinearrelationships in the data.
2.7.2. Random forestA random forest (Breiman, 2001) is a nonlinear regressionmethod and should have an advantage over stepwise linearregression if strong nonlinear trends are present in the data. It isan ensemble model, consisting of many individual regressiontrees. A single regression tree creates a branching structure ofIF-THEN rules to predict the output from all possible inputfeatures, with each IF-THEN rule based on a single feature.A random forest generates Ntrees, each trained with a randomlyselected subset of Ntinput features. The individual trees’ outputsare combined to generate the final output.
While individual trees are commonly used to recognizeworkload from physiological data, random forests and otherensemble methods are far less popular (Novak et al., 2012).However, random forests are more robust with regard tooverfitting than individual trees (Breiman, 2001). Randomforests were implemented using the MATLAB algorithmsavailable from http://code.google.com/p/randomforest-matlab/(downloaded February 2013);Ntrees andNtinput were set in cross-validation (Section 2.8).
2.8. Cross-validation
2.8.1. Estimation accuracyEstimation accuracy was evaluated through cross-validation:the algorithms were trained on a subset of the available data,and then tested on a different subset of the data, ensuringgeneralizability to new data. We used leave-condition-out andleave-subject-out cross-validation:
(i) Leave-condition-out cross-validation is performedseparately for each subject. The estimation algorithmis trained on 18 task periods, and then tested on theremaining task period. The process is performed 19times per subject, with each task period used as the‘test’ condition once.
(ii) Leave-subject-out cross-validation combines datafrom different subjects. The estimation algorithm istrained on all task periods from 9 subjects (total19 × 9 = 171), and then tested on the 19 task periods
of the remaining subject. The process is performed 10times, with each subject used as the ‘test’ subject once.
In both cross-validation types, the algorithm produced workloadand effort estimates for all 190 task conditions. We must thendetermine the accuracy of these estimates. For this, we can usethe self-reported workload and effort values as a reference thatis assumed to be correct. This assumption is not always true, butquestionnaires are, nonetheless, a common reference measurein physiological inference of psychological states (see Novaket al. (2012) for a review).
Estimated workload and effort were compared with self-reported values. The final result was the mean error, defined asthe mean absolute difference between estimated and reportedvalues across all 190 conditions. It was obtained separately forworkload and effort. Furthermore, it was calculated separatelyfor:
(i) leave-condition-out and leave-subject-out cross-validation;
(ii) each measurement modality (ANS, EEG, eyetracking, non-physiological), all three physiologicalmodalities together and all four modalities together;
(iii) both estimation algorithms (stepwise linear regres-sion, random forest).
2.8.2. Setting optimal parametersThe estimation algorithms have several parameters that can beset:
These settings must be chosen intelligently, but we again shouldnot train and test on the same data. We therefore use a doublecross-validation procedure. The data are first split into ‘external’training and test groups as described in Section 2.8.1. Eachexternal training group is further split into ‘internal’ trainingand test subgroups according to the leave-one-out principle.All possible parameter settings are evaluated in internal cross-validation, and the best settings (those with the lowest meanerror) are used in external cross-validation.
As an example, let us look at leave-subject-out cross-validation:
(i) Split subjects into nine external training and oneexternal test subject. Perform internal cross-validationon nine training subjects.
(ii) Internal cross-validation: eight training, one testsubject. Train estimators with all possible settings, andcalculate differences between reported and estimatedvalues. Repeat over all nine subjects, with each subjectused as the internal test subject once.
(iii) Find ‘best’ settings with lowest mean error over allnine internal subjects.
(iv) External cross-validation: Train estimator with ‘best’settings on nine external training subjects and test onremaining subject.
(v) Repeat over all 10 subjects, with each subject used asthe external test subject once.
(vi) Final result: mean error over all 10 subjects in externalcross-validation.
2.8.3. Comparison with random inputsHaving calculated the mean errors, we can state whether aparticular measurement modality is more accurate than another.However, we do not know what the ‘worst-case’result would be.For instance, while EEG may be better than eye tracking, bothmay be only slightly better than random guessing. We thereforealso performed cross-validation using randomly generated dataas input features. The randomly generated features were notnormalized, though different algorithm parameters (Section2.8.2) were tested.
Twelve features were randomly generated for each taskperiod: three from a normal distribution with a mean of 0 andstandard deviation of 1, three from a normal distribution with amean of 10 and standard deviation of 5, three from a uniformdistribution between −1 and 1, and three from a uniformdistribution between 5 and 15. Randomly generated features haddifferent distributions since different physiological features alsohave different distributions. The specific distribution selectionwas entirely arbitrary.
2.8.4. Most informative featuresAfter building our estimators, it is useful to know which featuresprovide the most information about workload or effort. To dothis, we performed stepwise linear regression (pcrit = 0.05)on data from all task periods of all 10 subjects. Unlike theregression models trained for accuracy evaluation, which onlyuse part of the data for training, this model is trained on allavailable data and therefore represents the ‘optimal’ linearleave-subject-out estimator. The feature set selected by thismodel was considered to be the most informative.
Stepwise linear regression was performed separately forworkload and effort, and for each measurement modality (ANSresponses, EEG, eye tracking and non-physiological data). Theresulting optimal feature set does not necessarily consist of the‘best’ individual features; due to the principle of stepwise linearregression, it consists of features that usefully complement eachother and is biased toward features with a linear relationship toworkload or effort.
2.8.5. Statistical methodsWe first checked whether task difficulty settings were correlatedwith self-report data. Pearson’s correlation coefficients betweentask difficulty and self-reported workloads were computed foreach individual subject.
Statistical differences between mean errors were evaluatedfor workload and effort separately, as well as separately forleave-condition-out and leave-subject-out cross-validation. Ineach of these six cases (3 scales, 2 cross-validations), themean error was calculated for each subject separately usingeach input modality and estimation method (linear regression,random forest). Normality was tested using the Shapiro–Wilk test. If the normality requirements were met, a two-way(modality × estimator) repeated-measures analysis of variancewas performed with N = 10 subjects, and the Sidak correctionfor multiple comparisons was used for post hoc tests. TheHuynh–Feldt correction was used for violations of sphericity.If normality requirements were not met, the Friedman two-wayanalysis of variance was used instead.
3. RESULTS
3.1. Induced workload
The mean correlation coefficient between equation difficultyand mental workload was 0.65 over all subjects (minimum0.49, maximum 0.81). P -values of the correlation were below0.05 for all subjects (mean 0.007, maximum 0.031). The meancorrelation coefficient between monster spawn frequency andtemporal workload was 0.67 over all subjects (minimum 0.49,maximum 0.82). P -values of the correlation were below 0.05for all subjects (mean 0.009, maximum 0.032).
Before transforming workload and effort to 0–100 for eachsubject, the range of reported workload was 10.8–81.5 (mean48.3) and the range of reported effort was 25.0–90.0 (mean65.1). These values were obtained by taking the minimums,means and maximums for each subject, and then averagingthem.
3.2. Estimation results
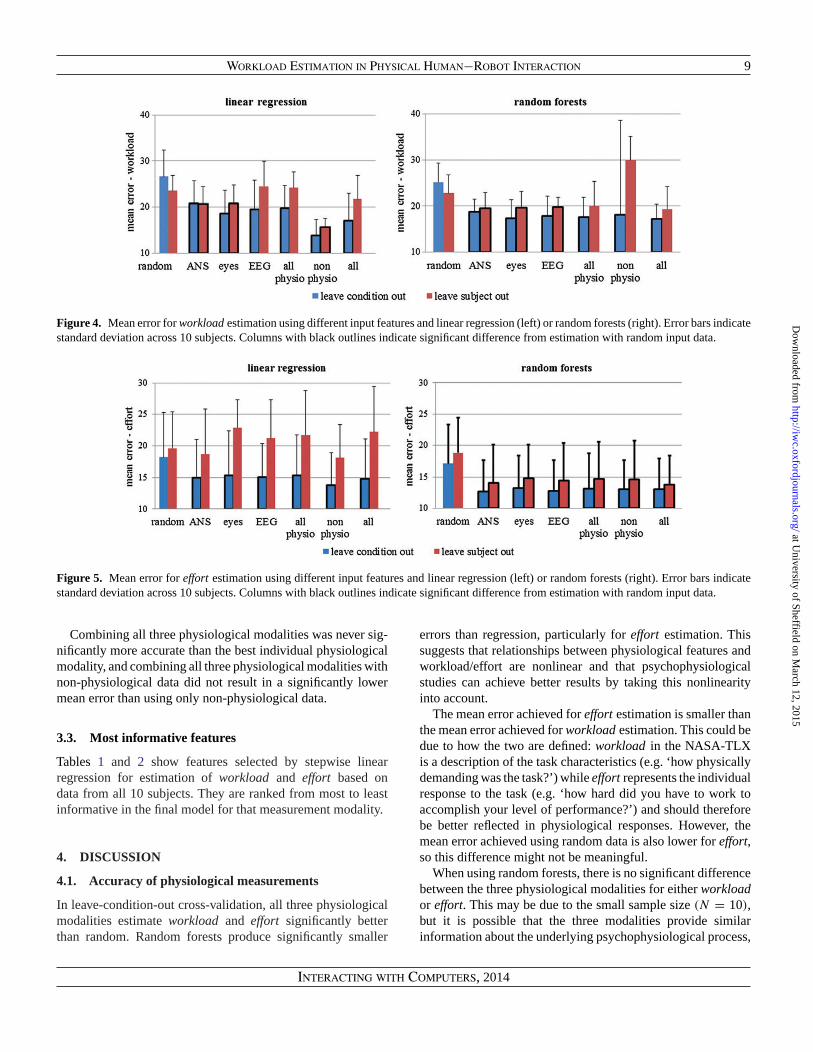
Estimation results are shown in Figs 4 and 5 for workload andeffort. Results are given as mean estimation error ± standarddeviation of estimation error over 10 subjects (N = 10). Theerror is always a positive number since it is the absolutedifference between estimated and reported values.
For workload estimation (Fig. 4), non-physiological datawere more accurate than any physiological modality (P < 0.05in all cases). In leave-subject-out cross-validation, linearregression outperformed random forests in the case of non-physiological data (P < 0.001), while random forests werebetter for EEG (P = 0.018).
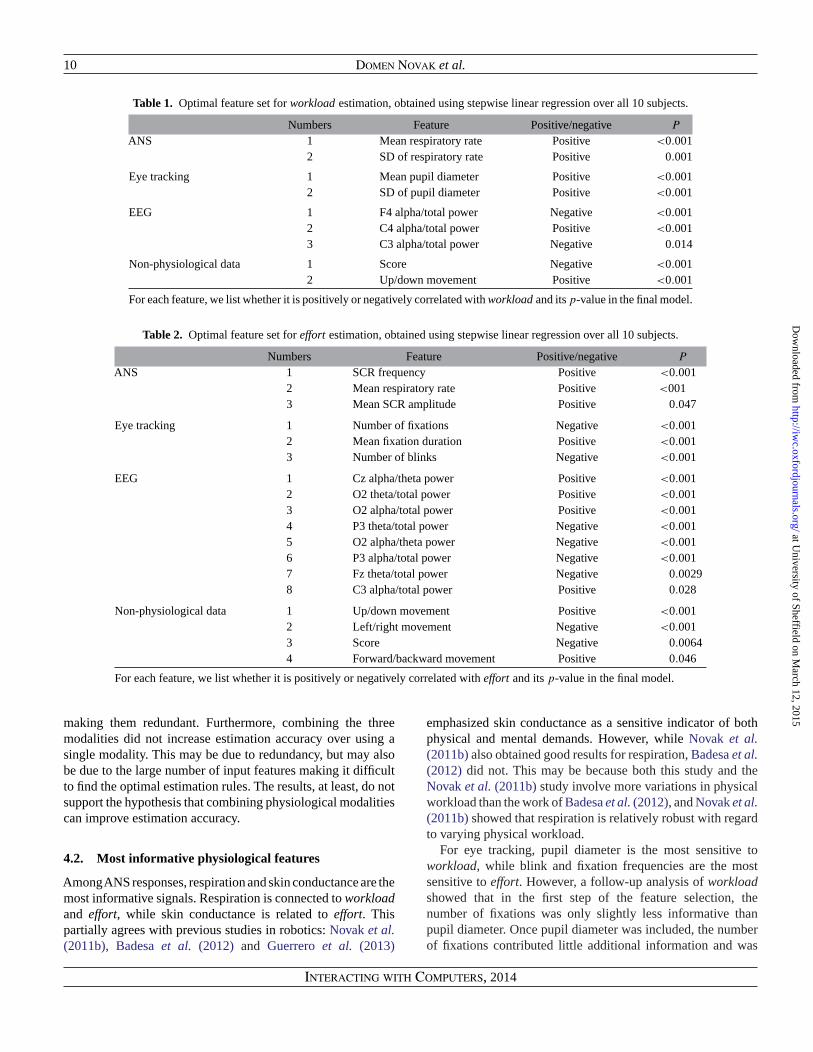
For effort estimation (Fig. 5), non-physiological data werenot significantly more or less accurate than any physiologicalmodality. There was an effect of estimation model in leave-subject-out cross-validation: estimation with random forestswas significantly better than with linear regression for all inputsother than non-physiological data (P < 0.05 in all cases).
Workload Estimation in Physical Human−Robot Interaction 9
Figure 4. Mean error for workload estimation using different input features and linear regression (left) or random forests (right). Error bars indicatestandard deviation across 10 subjects. Columns with black outlines indicate significant difference from estimation with random input data.
Figure 5. Mean error for effort estimation using different input features and linear regression (left) or random forests (right). Error bars indicatestandard deviation across 10 subjects. Columns with black outlines indicate significant difference from estimation with random input data.
Combining all three physiological modalities was never sig-nificantly more accurate than the best individual physiologicalmodality, and combining all three physiological modalities withnon-physiological data did not result in a significantly lowermean error than using only non-physiological data.
3.3. Most informative features
Tables 1 and 2 show features selected by stepwise linearregression for estimation of workload and effort based ondata from all 10 subjects. They are ranked from most to leastinformative in the final model for that measurement modality.
4. DISCUSSION
4.1. Accuracy of physiological measurements
In leave-condition-out cross-validation, all three physiologicalmodalities estimate workload and effort significantly betterthan random. Random forests produce significantly smaller
errors than regression, particularly for effort estimation. Thissuggests that relationships between physiological features andworkload/effort are nonlinear and that psychophysiologicalstudies can achieve better results by taking this nonlinearityinto account.
The mean error achieved for effort estimation is smaller thanthe mean error achieved for workload estimation. This could bedue to how the two are defined: workload in the NASA-TLXis a description of the task characteristics (e.g. ‘how physicallydemanding was the task?’) while effort represents the individualresponse to the task (e.g. ‘how hard did you have to work toaccomplish your level of performance?’) and should thereforebe better reflected in physiological responses. However, themean error achieved using random data is also lower for effort,so this difference might not be meaningful.
When using random forests, there is no significant differencebetween the three physiological modalities for either workloador effort. This may be due to the small sample size (N = 10),but it is possible that the three modalities provide similarinformation about the underlying psychophysiological process,
Table 1. Optimal feature set for workload estimation, obtained using stepwise linear regression over all 10 subjects.
Numbers Feature Positive/negative P
ANS 1 Mean respiratory rate Positive <0.0012 SD of respiratory rate Positive 0.001
Eye tracking 1 Mean pupil diameter Positive <0.0012 SD of pupil diameter Positive <0.001
EEG 1 F4 alpha/total power Negative <0.0012 C4 alpha/total power Positive <0.0013 C3 alpha/total power Negative 0.014
Non-physiological data 1 Score Negative <0.0012 Up/down movement Positive <0.001
For each feature, we list whether it is positively or negatively correlated with workload and its p-value in the final model.
Table 2. Optimal feature set for effort estimation, obtained using stepwise linear regression over all 10 subjects.
Numbers Feature Positive/negative P
ANS 1 SCR frequency Positive <0.0012 Mean respiratory rate Positive <0013 Mean SCR amplitude Positive 0.047
Eye tracking 1 Number of fixations Negative <0.0012 Mean fixation duration Positive <0.0013 Number of blinks Negative <0.001
EEG 1 Cz alpha/theta power Positive <0.0012 O2 theta/total power Positive <0.0013 O2 alpha/total power Positive <0.0014 P3 theta/total power Negative <0.0015 O2 alpha/theta power Negative <0.0016 P3 alpha/total power Negative <0.0017 Fz theta/total power Negative 0.00298 C3 alpha/total power Positive 0.028
Non-physiological data 1 Up/down movement Positive <0.0012 Left/right movement Negative <0.0013 Score Negative 0.00644 Forward/backward movement Positive 0.046
For each feature, we list whether it is positively or negatively correlated with effort and its p-value in the final model.
making them redundant. Furthermore, combining the threemodalities did not increase estimation accuracy over using asingle modality. This may be due to redundancy, but may alsobe due to the large number of input features making it difficultto find the optimal estimation rules. The results, at least, do notsupport the hypothesis that combining physiological modalitiescan improve estimation accuracy.
4.2. Most informative physiological features
AmongANS responses, respiration and skin conductance are themost informative signals. Respiration is connected to workloadand effort, while skin conductance is related to effort. Thispartially agrees with previous studies in robotics: Novak et al.(2011b), Badesa et al. (2012) and Guerrero et al. (2013)
emphasized skin conductance as a sensitive indicator of bothphysical and mental demands. However, while Novak et al.(2011b) also obtained good results for respiration, Badesa et al.(2012) did not. This may be because both this study and theNovak et al. (2011b) study involve more variations in physicalworkload than the work of Badesa et al. (2012), and Novak et al.(2011b) showed that respiration is relatively robust with regardto varying physical workload.
For eye tracking, pupil diameter is the most sensitive toworkload, while blink and fixation frequencies are the mostsensitive to effort. However, a follow-up analysis of workloadshowed that in the first step of the feature selection, thenumber of fixations was only slightly less informative thanpupil diameter. Once pupil diameter was included, the numberof fixations contributed little additional information and was
Workload Estimation in Physical Human−Robot Interaction 11
considered redundant. A similar result was found in a follow-up analysis of effort, leading us to believe that pupil diameter,blink frequency and fixation frequency provide very similar,redundant information in our task.
For EEG, workload information is mostly found in centraland frontal areas, while effort information is found at manydifferent sites. In a follow-up analysis, we found that excludingoccipital and parietal signals had little effect on effort estimationresults, but that excluding frontal or central signals noticeablydecreased the accuracy. Therefore, we conclude that both frontaland central sites should be used in physical human–robotinteraction.
4.3. Accuracy of non-physiological measurements
Task score and movement velocity estimated workload andeffort better than any physiological modality. Furthermore,combining non-physiological and physiological data did notgive a lower estimation error than non-physiological data alone.This implication is somewhat troublesome for physiology-based workload estimation in rehabilitation. If physiologicalmeasurements do not give more information than score andmovement velocity, which are readily available in rehabilitationrobotics, there is no point in using them, especially sinceperformance-based difficulty adaptation has been successfullydemonstrated in rehabilitation (Cameirão et al., 2010).
Interestingly, our current results are worse than previousclassification work in rehabilitation robotics. In Novak et al.(2011a), physiological measurements usefully supplementedtask performance information. In Koenig et al. (2011),physiological measurements outperformed task performancein several cases. Studies outside robotics (e.g. Hussain et al.,2014) have also found that task performance can outperformphysiological measurements, but showed an improvement whencombining physiological and non-physiological measures.
A possible reason for the worse result (physiologicalmeasurements are less accurate than task score) in this studyis the greater challenge faced: there are 19 consecutive taskperiods compared with, e.g. 6 in Novak et al. (2011a), andonly a single initial baseline period. As some physiologicalresponses (e.g. skin conductance) exhibit noticeable drift,laboratory studies commonly include frequent rest conditionswhere physiological responses can return to a baseline state.This is not possible in an actual rehabilitation session, where thegoal is to maximize exercise intensity. Any additional baselineperiods would not be accepted by therapists since they woulddirectly decrease exercise intensity. This study design, however,likely decreased accuracy of physiological measurements sincefinding an estimation rule that holds true across 19 consecutiveconditions can be very difficult. In a real rehabilitation session,it may be possible to use parts of the session (e.g. when thepatient rests and talks to the therapist) as baseline periods.
A second reason for the poor result may be the workloadlevels used in the study. When workload increases from low to
moderate levels, task performance often remains stable whileperceived workload increases—performance and workloaddissociate (Vidulich and Tsang, 2012). On the other hand,when workload changes from moderate to high, physiologicalmeasures and task performance often correlate. It is possiblethat the task used in our study was generally at least moderatelydemanding, so changes in performance were as predictive ofworkload as physiological measurements (or more so). This isa weakness of our task, but also presents a general problem forphysiological measurements in rehabilitation: as patients shouldbe exercising at high intensities, physiological measurementsand task performance can be expected to correlate.
In general, rehabilitation robotics represents a difficult appli-cation for psychophysiological measurements. Psychophysio-logical assessment may be more suitable for applications wherephysical workload is low and task performance information isunavailable or irrelevant. This is rarely the case in rehabilitation,where excess workload would result in degraded performance.
4.4. How accurate is enough?
A common problem in applied psychophysiological studiesis that relationships between inference accuracy and useracceptance are unclear, as noted in a recent review (Novaket al., 2012). When classifying psychological states, it ishard to say whether, for example, 80% classification accuracyis sufficient in a two-class (low/high workload) scenariowithout implementing the classifier online and examining useracceptance.
Determining the acceptable accuracy is an even biggerproblem when using estimation rather than classification,as accuracy metrics for estimation are underdeveloped andunintuitive compared with metrics for classification (Novaket al., 2012). For example, perfect classification accuracy isalways 100%, and random classification accuracy is 100%divided by the number of classes (assuming all classes areequally probable). In our estimation study, the mean errorusing random data is 22.8 for workload and 17.1 for effort;so different quantities can have different ‘random’ error levels.Furthermore, our lowest mean errors are 13.9 for workloadestimation (using non-physiological data) and 12.7 for effortestimation (using ANS). This represents a reduction of ∼40 and25% over random errors, respectively. However, it is difficultto even visualize what a mean error of 17 points or an errorreduction of 40% represents. The lowest realistically achievablemean error is definitely not zero: that would not only requireperfect knowledge of psychophysiological relationships, butwould also require subjects to perfectly identify their ownworkload or effort via the NASA-TLX.
As estimation of continuous psychological values fromphysiological measurements is still relatively unexplored, ourstudy is one of the first to raise these issues specifically withregard to estimation, and it is difficult to say whether ourresults are ‘good’ or ‘bad’ in an absolute sense. There are,
however, some things that could be done. First, we couldtry to relate estimation accuracy to classification accuracy bydiscretizing workload and effort into low/high and using thesame input features to perform classification in addition toestimation. This would allow better comparison with previousclassification studies. Secondly, we could simply create themost accurate estimation algorithm possible, and then test usersatisfaction of the algorithm. While this would not tell us theminimum acceptable accuracy, it would allow us to say whethera particular accuracy is acceptable for a given application.A stepin this direction was taken by Guerrero et al. (2013), whoshowed that their rehabilitation robotics algorithm can increaseenjoyment in healthy subjects.
While not as popular as classification, psychophysiologicalestimation has been suggested as a promising approach inrehabilitation robotics. However, proponents of estimationshould consider the additional problems that it introduces withregard to accuracy evaluation.
4.5. Closing the loop
Our study focused on psychophysiological inference, andtherefore studied workload and effort estimation in an open-loop setting. Ultimately we would need to close the loop, withthe robot and virtual task adapting in response to the inferenceresults. With our setup, the intuitive way to do this is to changethe task difficulty, with the robot behaving the same in allcases—similarly to Novak et al. (2011a) and Koenig et al.(2011).
There is another possibility: change the level of hapticfeedback, for example, George et al. (2012), who turned therobot’s haptic assistance on and off depending on workload.In a more complex implementation, Guerrero et al. (2013)treated the level of haptic assistance as a continuous variable,providing different levels depending on workload. Shirzadand Van der Loos (2013), on the other hand, demonstratedthe opposite approach: rather than provide assistance, therobot’s haptic feedback amplifies the user’s errors dependingon workload. While this represents an interesting possibility forrehabilitation robotics, it could not be done based on our study,which does not provide haptic feedback.
4.6. Study limitations
Though we did our best to select relevant features foreach physiological modality, other features may result inhigher estimation accuracy. For example, sympathetic andparasympathetic power bands were not analyzed in the ECGsince they require at least 2-min uninterrupted task periods(Task Force, 1996). However, they may provide additionalinformation, as may e.g. more complex analysis of therespiration signals. Furthermore, the EEG was contaminatedwith muscle and motion artifacts that could not simply be cutfrom the signal due to the use of spectral features. Future studies
should consider reducing artifacts through methods such asindependent component analysis.
Reference values of workload and effort were obtainedthrough the NASA-TLX questionnaire. Though the NASA-TLX is well established, it has some weaknesses (Hart,2006). For example, subjects likely rated a task perioddifferently when preceded by a difficult period than whenpreceded by an easy one. Furthermore, since subjects practicedthe task as they progressed through the task periods,a difficulty setting was likely rated as easier if it appearedtoward the end of the experiment. On the other hand,increased fatigue may cause physical workload ratings toincrease with time. These weaknesses should be taken intoaccount when interpreting the results, though we feel thatthey are not only a weakness of our study, but a fundamentalproblem of applying psychophysiological measurements tomotor rehabilitation. Rehabilitation is a process of motorlearning, and the patient should be learning throughout asession. Furthermore, as exercise intensity would be high,fatigue effects are unavoidable. A final NASA-TLX weaknessspecific to our study was the high frequency of its use. EveryNASA-TLX response requires a break from the task duringwhich physiological responses may drift unpredictably. Thisadditional drift is an unrealistic factor that would not appear ina real application, but may have contributed to the poor accuracyof physiological inference.
Though it is difficult to separate effects such as habituation,physiological drift and fatigue using the data we have collected,we can at least test for temporal trends. In a final follow-up analysis, we checked whether NASA-TLX scales andphysiological features are significantly correlated with taskperiod (1–19). Results were mixed, with large differencesamong subjects. For example: in two subjects, self-reportedworkload and effort decrease significantly with time, but inanother subject, workload increases significantly with time.Four subjects showed physiological trends consistent withdecreasing workload (decreasing heart rate, respiration rate andpupil diameter over time). In eight subjects, skin temperatureincreased significantly over time, which is likely due to the bodyheating up with sustained exercise. Several time-related factorsare therefore present in the study, though they do not affect allsubjects in the same way.
5. CONCLUSIONS
Our contributions to the state of the art are as follows.We used three physiological modalities (ANS, EEG and eyetracking) to estimate workload and effort in physical human–robot interaction. Previous studies in this field focused ona single physiological modality (mainly ANS) and a singlepsychological quantity. Psychophysiological inference wasperformed using estimation of continuous values rather than themore popular classification into discrete classes. We evaluated
Workload Estimation in Physical Human−Robot Interaction 13
the accuracy of such physiological estimation, comparing thethree modalities to each other and to non-physiological datasources. Finally, we used both linear and nonlinear estimationmethods, and identified the most relevant signals for eachmodality.
All three physiological modalities estimated workload andeffort significantly better than random. Since our study wasconducted in realistic, relatively uncontrolled environmentalconditions, this result is encouraging. Among ANS responses,respiration and skin conductance appear to be the most relevantfor physical human–robot interaction. For EEG, measurementsshould be taken from frontal and central sites. Furthermore,nonlinear estimation methods such as random forests should beused to obtain the best results.
No physiological modality was significantly more accuratethan another, and combining multiple physiological modalitiesdid not increase accuracy. Our findings thus do not supportsuggestions that combining physiological modalities may bebeneficial. Furthermore, non-physiological data (task score andmovement velocity) give a more accurate estimate of workloadand effort than any physiological modality, and combining non-physiological data with physiological data does not improveaccuracy further. Therefore, future studies in robotics should notonly aim to show that psychophysiological inference is possible.Instead, they should also try to demonstrate concrete advantagesof physiological measurements over other, more easily obtaineddata such as task performance.
ACKNOWLEDGEMENTS
The authors would like to thank Aniket Nagle for programmingassistance.
FUNDING
This work was supported by the Swiss National ScienceFoundation through the National Centre of Competence inResearch Robotics.
REFERENCES
Badesa, F., Morales, R., Garcıa-Aracil, N., Sabater, J., Perez-Vidal,C. and Fernandez, E. (2012) Multimodal interfaces to improvetherapeutic outcomes in robot-assisted rehabilitation. IEEE Trans.Syst. Man Cybern. - Part C: Appl. Rev., 42, 1152–1158.
Berka, C., Levendowski, D.J., Lumicao, M.N., Yau, A., Davis, G.,Zivkovic, V.T., Olmstead, R.E., Tremoulet, P.D. and Craven, P.L.(2007) EEG correlates of task engagement and mental workload invigilance, learning, and memory tasks. Aviat. Space Environ. Med.,78, B231–B2344.
Boiten, F. (1993) Component analysis of task-related respiratorypatterns. Int. J. Psychophysiol., 15, 91–104.
Breiman, L. (2001) Random forests. Mach. Learn., 45, 5–32.
Brookings, J.B., Wilson, G.F. and Swain, C.R. (1996) Psychophys-iological responses to changes in workload during simulated airtraffic control. Biol. Psychol., 42, 361–377.
Byrne, E.A. and Parasuraman, R. (1996) Psychophysiology andadaptive automation. Biol. Psychol., 42, 249–268.
Cameirão, M.S., Badia, S.B.I., Oller, E.D. and Verschure, P.F.M.J.(2010) Neurorehabilitation using the virtual reality based Reha-bilitation Gaming System: methodology, design, psychometrics,usability and validation. J. NeuroEng. Rehabil., 7, 1–14.
Chanel, G., Rebetez, C., Bétrancourt, M. and Pun, T. (2011) Emotionassessment from physiological signals for adaptation of gamedifficulty. IEEE Trans. Syst. Man Cybern. - Part A: Syst. Hum.,41, 1052–1063.
De Rivecourt, M., Kuperus, M.N., Post,W.J. and Mulder, L.J.M. (2008)Cardiovascular and eye activity measures as indices for momentarychanges in mental effort during simulated flight. Ergonomics, 51,1295–1319.
Di Stasi, L.L., Catena, A., Cañas, J.J., Macknik, S.L. and Martinez-Conde, S. (2013) Saccadic velocity as an arousal index innaturalistic tasks. Neurosci. Biobehav. Rev., 37, 968–975.
Fairclough, S.H. (2009) Fundamentals of physiological computing.Interact. Comput., 21, 133–145.
Fairclough, S.H. andVenables, L. (2006) Prediction of subjective statesfrom psychophysiology: a multivariate approach. Biol. Psychol.,71, 100–110.
George, L., Marchal, M., Glondu, L. and Lecuyer, A. (2012)Combining brain-computer interfaces and haptics?: detectingmental workload to adapt haptic assistance. In: Proceedings ofEuroHaptics 2012, pp. 124–135. Tampere, Finland.
Gonzalez, J., Soma, H., Sekine, M. and Yu, W. (2012) Psycho-physiological assessment of a prosthetic hand sensory feedbacksystem based on an auditory display: a preliminary study. J.NeuroEng. Rehabil., 9, 1–14.
Guerrero, C.R., Fraile Marinero, J.C., Turiel, J.P. and Muñoz,V. (2013)Using ‘human state aware’robots to enhance physical human–robotinteraction in a cooperative scenario. Comput. Methods ProgramsBomed., 112, 250–259.
Hart, S. (2006) NASA-Task Load Index (NASA-TLX); 20 years later.In Proceedings of the Human Factors and Ergonomics Society 50thAnnual Meeting, San Francisco, USA, pp. 904–908.
Hart, S. and Staveland, L.E. (1988) Development of NASA-TLX(Task Load Index): results of empirical and theoretical research.In: Hancock, P.A. & Meshkati, N. (eds), Human Mental Workload.Amsterdam: North Holland Press.
He, P., Wilson, G. & Russell, C. (2004) Removal of ocular artifactsfrom electro-encephalogram by adaptive filtering. Med. Biol. Eng.Comput., 42, 407–12.
Hussain, M.S., Calvo R.A. and Chen, F. (2014) Automatic cognitiveload detection from face, physiology, task performance and fusionduring affective interference. Interact. Comput., 26, 256–268.
Klimesch, W. (1999) EEG alpha and theta oscillations reflect cognitiveand memory performance: a review and analysis. Brain Res. Rev.,29, 169–195.
Koenig, A., Novak, D., Omlin, X., Pulfer, M., Perreault, E., Zimmerli,L., Mihelj, M. and Riener, R. (2011) Real-time closed-loopcontrol of cognitive load in neurological patients during robot-assisted gait training. IEEE Trans. Neural Syst. Rehabil. Eng., 19,453–464.
Kreibig, S.D. (2010) Autonomic nervous system activity in emotion:a review. Biol. Psychol., 84, 394–421.
Liu, C., Conn, K., Sarkar, N. and Stone, W. (2008) Online affectdetection and robot behavior adaptation for intervention of childrenwith autism. IEEE Trans. Robotics, 24, 883–896.
Liu, C.,Agrawal, P., Sarkar, N. and Chen, S. (2009) Dynamic difficultyadjustment in computer games through real-time anxiety-basedaffective feedback. Int. J. Hum.-Comput. Interact., 25, 506–529.
Mandryk, R.L. and Atkins, M.S. (2007) A fuzzy physiologicalapproach for continuously modeling emotion during interactionwith play technologies. Int. J. Hum.-Comput. Stud., 65, 329–347.
Nef, T., Guidali, M. and Riener, R. (2009). ARMin III—arm therapyexoskeleton with an ergonomic shoulder actuation. Appl. BionicsBiomech., 6, 127–142.
Novak, D., Mihelj, M., Ziherl, J., Olenšek, A. and Munih, M. (2011a).Psychophysiological measurements in a biocooperative feedbackloop for upper extremity rehabilitation. IEEE Trans. Neural Syst.Rehabil. Eng., 19, 400–410.
Novak, D., Mihelj, M. and Munih, M. (2011b) Psychophysiologicalresponses to different levels of cognitive and physical workload inhaptic interaction. Robotica, 29, 367–374.
Novak, D., Mihelj, M. and Munih, M. (2012) A survey of methodsfor data fusion and system adaptation using autonomic nervoussystem responses in physiological computing. Interact. Comput.,24, 154–172.
Pedrotti, M., Mirzaei, M. A., Tedesco, A., Chardonnet, J.-R.,Mérienne, F., Benedetto, S. and Baccino, T. (2014)Automatic stressclassification with pupil diameter analysis. Int. J. Hum.-Comput.Interact., 30, 220–236.
Picard, R.W., Vyzas, E. and Healey, J. (2001) Toward machineemotional intelligence: Analysis of affective physiological state.IEEE Trans. Pattern Anal. Mach. Intell., 23, 1175–1191.
Proakis, J.G. and Manolakis, D.K. (2007) Digital Signal Processing(4th edn). Prentice Hall, Upper Saddle River, NJ.
Rani, P., Sims, J., Brackin, R. and Sarkar, N. (2002). Online stressdetection using psychophysiological signals for implicit human–robot cooperation. Robotica, 20, 673–685.
Shirzad, N. and Van der Loos, H.F.M. (2013) Adaptation of taskdifficulty in rehabilitation exercises based on the user’s motorperformance and physiological responses. In Proceedings of the2013 IEEE International Conference on Rehabilitation Robotics,Seattle, USA.
Task Force of the European Society of Cardiology and the NorthAmerican Society of Pacing and Electrophysiology. (1996)Heart rate variability: Standards of measurement, physiologicalinterpretation, and clinical use. Eur. Heart J., 17, 354–381.
Ting, C.-H., Mahfouf, M., Nassef, A., Linkens, D.A., Panoutsos, G.,Nickel, P., Roberts, A.C. and Hockey, G. (2010) Real-time adaptiveautomation system based on identification of operator functionalstate in simulated process control operations. IEEE Trans. Syst.Man Cybernet. - Part A: Syst. Hum., 40, 251–262.
Van Orden, K.F., Limbert, W., Makeig, S. and Jung, T.-P. (2001) Eyeactivity correlates of workload during a visuospatial memory task.Hum. Factors, 43, 111–121.
Veltman, J.A. and Gaillard, A.W.K. (1998) Physiological workloadreactions to increasing levels of task difficulty. Ergonomics, 41,656–659.
Vidulich, M.A. and Tsang, P.S. (2012) Mental workload and situationawareness. In Salvendy, G. (ed.), Handbook of Human Factors andErgonomics (4th edn). John Wiley & Sons, Inc., Hoboken, NJ.
Whitham, E.M. et al. (2007) Scalp electrical recording duringparalysis: Quantitative evidence that EEG frequencies above 20 Hzare contaminated by EMG. Clin. Neurophysiol., 118, 1877–1888.
Wilson, G.F. and Russell, C.a. (2007). Performance enhancementin an uninhabited air vehicle task using psychophysiologicallydetermined adaptive aiding. Hum. Factors, 49, 1005–1018.