52
2014 Report on Workers’ Compensation Insurance MSAR#802 August 27, 2014

2014 Report on Workers’ Compensation Insurance
MSAR#802
August 27, 2014

Table of Contents
Executive Summary .............................................................................................................1
Introduction ..........................................................................................................................2
Overview… ..........................................................................................................................2
2014 Legislative Changes Impacting Workers’ Compensation...........................................3
Workers’ Compensation Insurers ........................................................................................4
Premium Rates .....................................................................................................................6
Terrorism Risk Insurance Program ......................................................................................9
Conclusion ...........................................................................................................................9
Exhibits
Exhibit 1 Maryland Workers’ Compensation Share of Overall Property & Casualty Industry Written Premium
Exhibit 2 Comparison of Large Insurance Group Market Shares for 2003
through 2013 Exhibit 3 Maryland Workers’ Compensation Market Share by Insurer Group Exhibit 4 Maryland Workers’ Compensation Insurance Groups Including Each Company Within the Group Exhibit 4a Maryland Excess Workers’ Compensation Insurers Including Each
Company Within the Group Exhibit 5 Maryland Industry vs. CEIC Written Premium for 2003 through
2013 (in millions) (page 1)
Maryland Market Share of Top 8 Carriers - with and without CEIC (page 2)
i

Exhibit 6 Maryland Re-entrants and New Entrants Exhibit 7 Maryland Industry vs. CEIC Loss Ratios from 2003 through 2013 Exhibit 8 Comparison of Changes in NCCI Maryland Pure Premium Loss
Cost Filings with the Maryland Insurance Administration for the Years 1998 through 2015
Exhibit 9 History of NCCI Maryland Pure Premium Loss Cost Changes by
Industry Group for the Years 2003 through 2015 Exhibit 10 Largest Payroll Classes by Industry Group for Maryland Exhibit 11 Changes in the Components of NCCI Maryland Pure Premium
Loss Cost Filings from 2004 through 2015 Exhibit 12 Cumulative Impact of NCCI Maryland Pure Premium Loss Cost
Filings for the Years 1988 through 2015 (page 1)
Cumulative Impact of NCCI Maryland Pure Premium Loss Cost Changes by Industry Group from 1988 through 2015 (page 2)
ii

1
Executive Summary
Employers are required to purchase or self-insure for workers’ compensation insurance. They may buy workers’ compensation insurance from an insurer authorized to write workers’ compensation insurance in the State or from Chesapeake Employers’ Insurance Company (“CEIC”)1. Subject to regulatory approval, an employer may self-insure.2
Ninety seven insurance groups offer workers’ compensation insurance to Maryland
employers. Workers’ compensation insurance is the third largest line in property and casualty insurance following auto insurance and homeowners insurance.
The top eight workers’ compensation insurance groups, including CEIC, wrote
approximately 67 percent of the market in 2013 (Exhibit 3). CEIC is the largest writer, accounting for about 24.6 percent of the market in 2013. The second largest writer is Hartford Fire and Casualty Group, accounting for about 12.5 percent of the market in 2013.
The National Council on Compensation Insurance, Inc. (“NCCI”) files pure premium loss
costs rates with the MIA on behalf of all insurers who write workers’ compensation insurance in the State with the exception of CEIC. No insurer may use the NCCI’s pure premium loss costs until those pure premium loss costs are approved by the MIA.
NCCI filed decreases to the pure premium loss costs for calendar years 2007 through 2009
(ranging from a low of -5.4 percent for 2009 to a high of -1.7 percent for 2008), then increases for calendar years 2010 through 2014 (ranging from a high of 5.7 percent in 2011 to a low of 1.4 percent for 2012 and 2014) and a decrease of 2.7% for calendar year 2015. The increase in pure premium loss costs of 1.4 percent for 2014 was primarily due to an increase in medical costs and a slight deterioration in loss experience. For 2015, the decrease of 2.7% is primarily due to a reduction in rate of growth of the experience, trend and benefit costs.
Maryland’s workers’ compensation insurance market remains competitive.
1 As of October 1, 2013, the Injured Workers’ Insurance Fund (“IWIF”) became the Chesapeake Employers’ Insurance Company. For this report, all references will be to CEIC. 2 In order to be self-insured, approval must be obtained from either the Workers’ Compensation Commission or the Maryland Insurance Administration depending on the nature of the employer seeking to self-insure.

2
Introduction
Pursuant to §2-10A-03 of the State Government Article of the Annotated Code of
Maryland, the Maryland Insurance Commissioner issues an Annual Report to the Joint
Committee on Workers’ Compensation Benefit and Insurance Oversight (“Committee”)3
regarding the condition of workers’ compensation benefits and workers’ compensation insurance
in Maryland, and the effect of Chapters 590 and 591 of the Laws of Maryland of 1987 on those
benefits and that insurance.4
Overview
Since the early 1900s, every state has required employers to provide some form of
protection for their employees who are injured while working. Workers’ compensation laws are
based on a no-fault system designed to compensate workers who sustain accidental injuries
arising out of and in the course of their employment. The forms of compensation may include
payment for medical services, rehabilitation services, lost or replacement income, and any
permanent partial or permanent total disability the worker may sustain as a result of the work-
related injury or occupational disease. When a worker dies as a result of a work-related injury or
disease, the benefits also may include funeral expenses and survivor benefits.
Employers may purchase workers’ compensation insurance from an insurer authorized to
3 The Workers’ Compensation Commission (“WCC”) also submits a report to the Committee pursuant to § 2-10A-03. 4 Among other things, Chapter 590 established competitive rating for workers’ compensation insurance under certain circumstances. It also requires workers’ compensation insurers to adhere to a uniform classification system and uniform experience rating plan; permits an insurer to develop subclassifications in certain cases; requires workers’ compensation insurers to record and report certain workers’ compensation experience; requires a rating organization to develop and file certain rules; prohibits insurers from agreeing with other insurers to adhere to certain rules; specifies the contents of an experience rating plan; and permits insurers to file rating plans providing for retrospective premium adjustments. Chapter 591 provides, among other things, that the allowable fees and other charges for medical treatment and services established by the WCC shall be reviewed by the WCC at least once every two years for completeness and reasonableness, and that WCC-adopted guidelines be revised accordingly.

3
write workers’ compensation insurance in the State or from the CEIC. Subject to regulatory
approval, an employer may self-insure.
Workers’ compensation insurance is a “long-tail” line of business, as claims may be open
for long periods of time, benefits may be awarded in stages and in various combinations of
disability determinations, and claims may be reopened at a later point in time resulting in the
payment of additional benefits. All of these factors can make it difficult to accurately predict
costs of workers’ compensation claims.
Maryland’s Workers’ Compensation Commission’s Medical Fee Guide is one tool
Maryland has used to curtail medical cost increases and make it easier for workers’
compensation insurers to predict cost of claims. In an effort to further decrease medical cost
trends, some workers’ compensation insurers have entered into contracts with Preferred Provider
Organizations (PPOs). Providers contracting with a PPO may agree to accept a lower fee than
that established by the Workers’ Compensation Commission’s Fee Guide. If an injured worker
receives services from such a provider, the workers’ compensation insurer pays the provider in
accordance with the PPO contracted rate or the Workers’ Compensation Commission’s Medical
Fee Guide, whichever is less. Furthermore, under the State’s all-payer hospital rate setting
system, workers’ compensation insurers pay the same amount for hospital services as all other
payers.
2014 Legislative Changes Impacting Workers’ Compensation
In 2014, the following changes were made to the laws governing workers’ compensation
insurance and CEIC:
SENATE BILL 16 (Chapter 4) – Chesapeake Employers' Insurance Company – Issuance, Renewal, and Cancellation of Policies – Authority
Expands CEIC’s authority to issue policies for employer’s liability insurance and insurance under a federal compensation law.
4
Adds additional grounds for a cancellation or nonrenewal of a CEIC workers’ compensation policy for failure of an employer to reimburse CEIC for payment of a deductible.
Effective Date: April 8, 2014
SENATE BILL 479 (Chapter 172) – Chesapeake Employers' Insurance Company – Board Structure
Requires, to the extent practicable, that board membership of CEIC reflect the geographic and demographic, including race and gender, diversity of the State.
Requires that of the nine members of the board: (1) at least two members must have
substantial experience as officers or employees of an insurer, but they may not be employed by an insurer that is in direct competition with CEIC while serving on the board; (2) at least two members must be policyholders of CEIC; (3) at least one member must have significant experience in the investment business; (4) at least one member must have significant experience in the accounting or auditing field; and (5) at least one member must have significant experience as a representative, employee, or member of a labor union.
Effective Date: October 1, 2014 SENATE BILL 1099 (Chapter 374) - Workers' Compensation – Occupational Disease Presumptions Paid Rescue Squad Members and Paid Advanced Life Support Unit Members
Extends the list of occupational disease presumptions under workers’ compensation law for firefighters and related personnel to paid rescue squad members and paid advanced life support members.
Effective Date: October 1, 2014
Workers’ Compensation Insurers
Ninety seven insurance groups, including CEIC, offer workers’ compensation insurance
to Maryland employers. Together, these insurers had $889,651,738 direct written premium in
2013. This represents 9.0% of the direct written premiums written by all property and casualty
(“P&C”) insurers, making workers’ compensation insurance the third largest line in P&C
insurance following auto insurance and homeowner’s insurance. Exhibit 1 displays the workers’

5
compensation share of total Property and Casualty industry (“Industry”) written premium in the
State for the period 2002 to 2013.
The top eight workers’ compensation insurance groups, including CEIC, wrote 67.0% of
the market in 2013. Table 1 below displays the market share for each of these insurance groups.
CEIC is the largest writer of workers’ compensation insurance in Maryland, with a market share
of 24.6 percent in 2013.
Table 1: Market Share Largest Writers, 2012 and 2013
Insurance Group Percentage Market Share, 2013
Percentage Market Share, 2012
Chesapeake Employers Insurance Company 24.6 23.3 Hartford Fire and Casualty Group 12.5 13.8 Travelers Group 7.8 7.5 Liberty Mutual Group 6.2 7.8 Erie Insurance Group 6.1 5.5 Zurich Insurance Group 3.5 4.6 American International Group 3.5 3.4 WR Berkley Corp Group 2.7 2.4 Exhibits 2 through 6 provide additional related data as follows:
Exhibit 2 displays a comparison of the top eight workers’ compensation insurance
groups’ market shares as referenced in Table 1. This exhibit shows market shares for
these top eight workers’ compensation writers for an eleven-year period from 2003
through 2013.
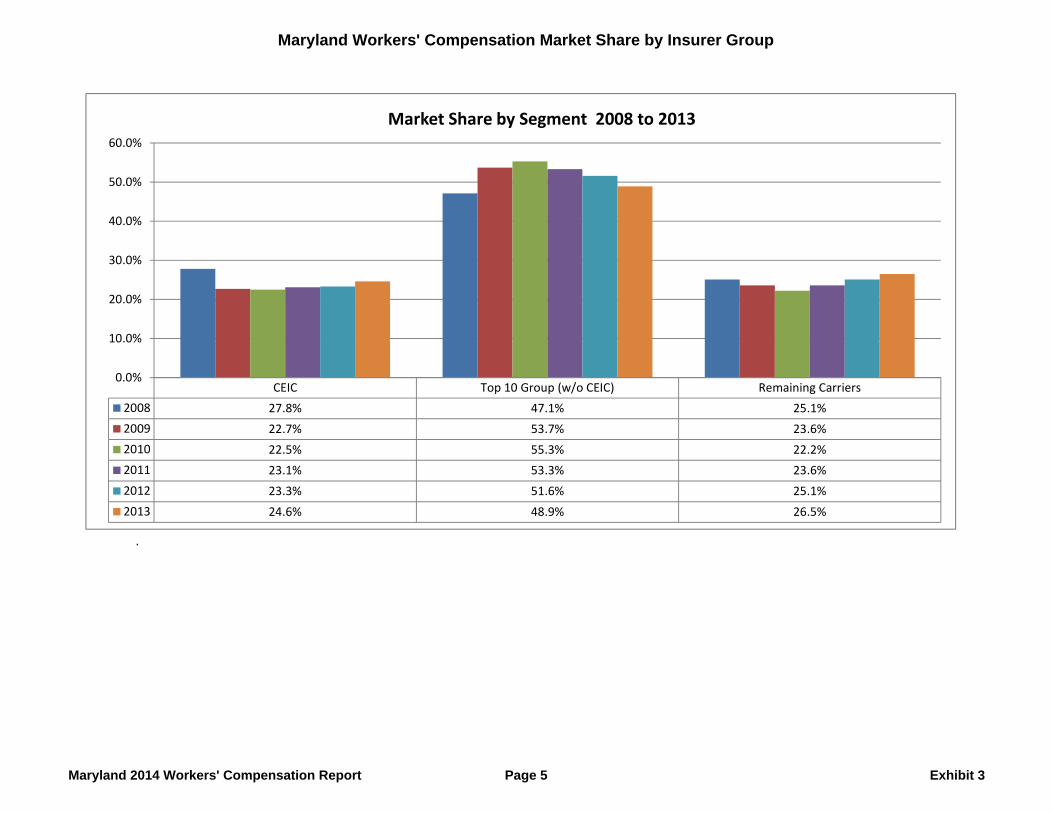
Exhibit 3 displays a complete listing of the market shares for all Maryland workers’
compensation insurer groups operating in Maryland. This information represents 2013
written premiums.
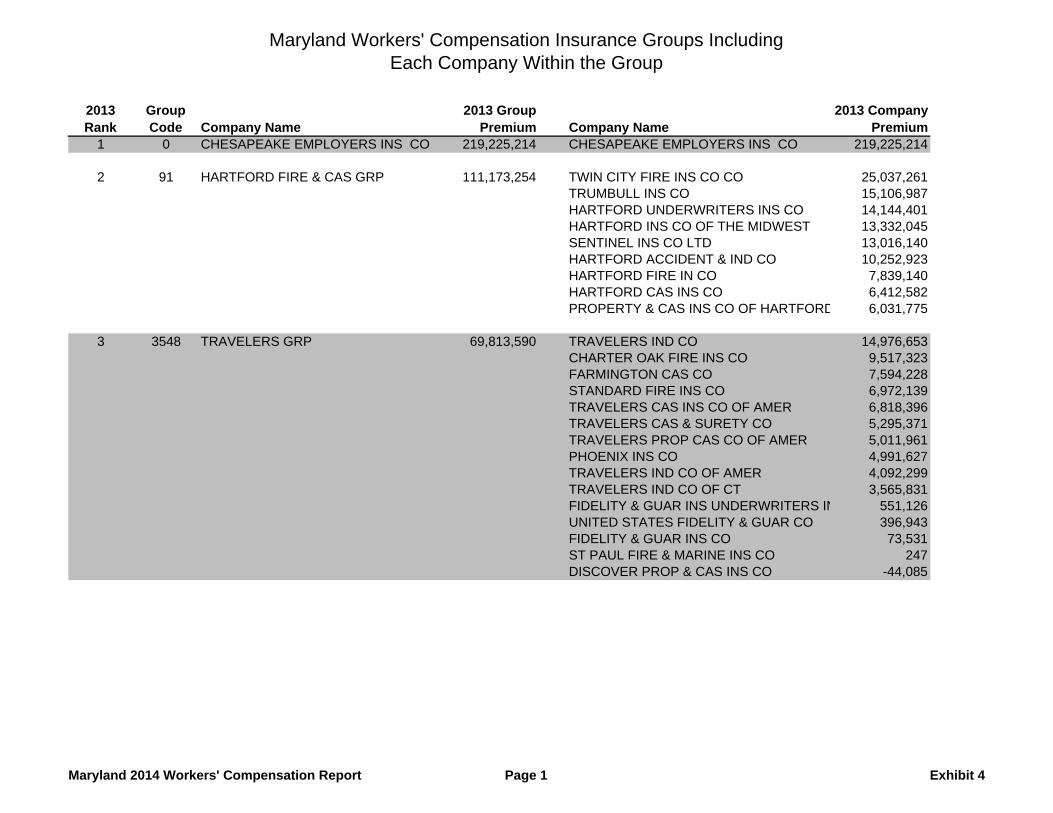
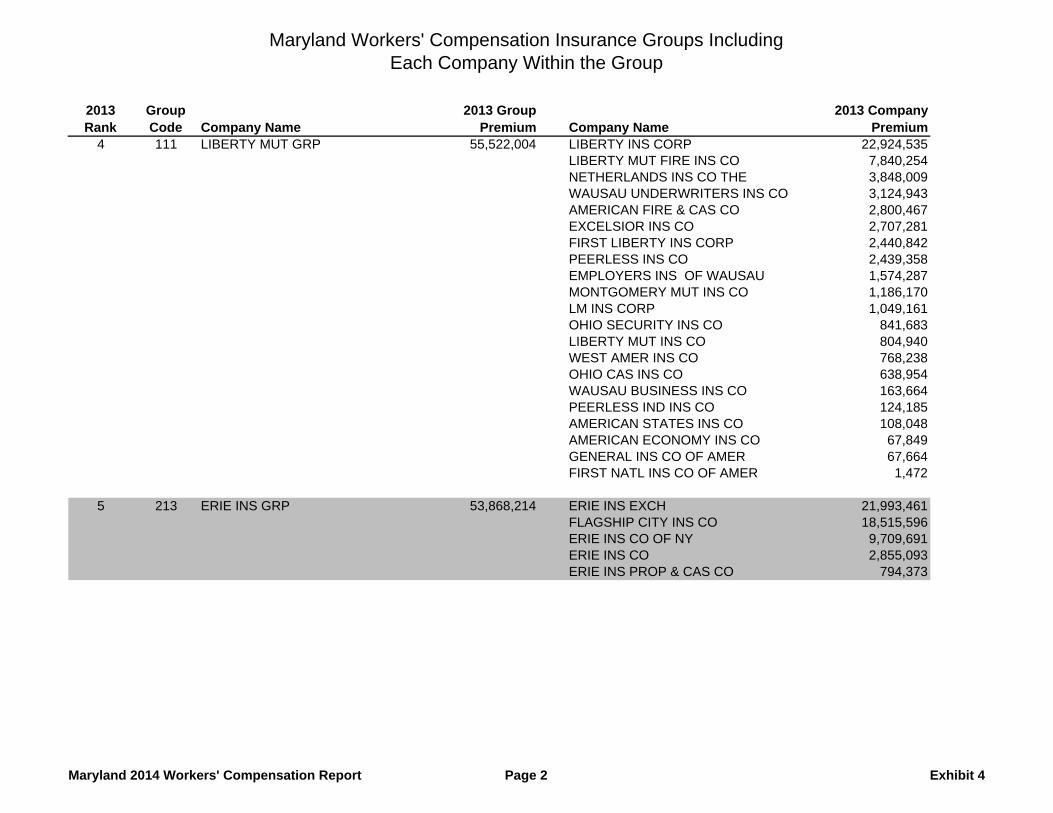
Exhibit 4 displays the individual insurers associated with each workers’ compensation
insurer group.
Exhibit 4a lists Maryland Excess Workers’ Compensation Insurers. This coverage is

6
designed for employers that self-insure up to a certain point, and then purchase additional
coverage for risk beyond that point.
Exhibit 5, page 1, compares CEIC’s written premium to the Industry for the period 2002
through 2013.
Exhibit 5, Page 2 illustrates that CEIC remains the largest workers’ compensation insurer
in Maryland. CEIC lost market share to other workers’ compensation insurance groups
in the insurance industry from 2005 through 2010, but reversed that trend in 2011and
gained an additional 1.3 % of the market in 2013.
Exhibit 6 lists new entrants and re-entrants into the market for 2013. New entrants are
companies with no written premium in 2011 and 2012. Re-entrants are those carriers that
had premium in 2011, but no premium in 2012.
Premium Rates
Insurance premium rates can be regulated either through prior approval or through
competitive rating (also known as “file and use”). Under prior approval, insurers must file their
proposed rates with the MIA and may only begin to use those rates to determine the premium for
a particular risk after the MIA has approved them. Under competitive rating, insurers file their
proposed rates with the MIA and may begin to use those rates to determine the premium for a
particular risk as soon as the MIA has received the filing.
In Maryland, workers’ compensation insurance is a blend of prior approval and
competitive rating. In this line, all insurers, with the exception of CEIC, are required to
subscribe to the NCCI. NCCI is a licensed rating and advisory organization which files pure
premium loss costs with the MIA. Pure premium loss costs reflect actual claim information
submitted by insurers to the NCCI. Claim information includes lost wages and medical costs.

7
The NCCI then aggregates this claim information for use in its pure premium loss costs filings.
Pure premium loss costs do not, however, include any other costs associated with writing
workers’ compensation insurance, such as profit, commissions, taxes and the expenses associated
with providing the benefits to the injured worker (known as loss adjustment expenses). No
insurer may use NCCI’s pure premium loss costs until those costs have been approved by the
MIA. The rates usually are effective beginning January 1 of each year.
Once the MIA has approved the NCCI’s pure premium loss costs, insurers submit
independent rate filings. These filings adopt the NCCI pure premium loss costs and then include
the insurer’s expense multipliers. The expense multiplier consists of the following elements
from an insurer’s expense and profit information: (1) commission; (2) general expense; (3) taxes,
licenses and fees; and (4) profit. In addition, since the NCCI does not include loss adjustment
expense in its pure premium loss cost filings, companies modify their expense multiplier to
include a component for loss adjustment expense. The insurer’s rates are derived by multiplying
NCCI’s pure premium loss costs by the insurer’s calculated expense multiplier. These rate
filings are made under competitive rating, which means that insurers may begin to charge
premiums based on the specific expense multiplier as soon as it has been filed with the MIA.
CEIC is not required to join NCCI or adhere to the policy forms filed by NCCI.
However, CEIC’s ratemaking practices are reviewed by the MIA at least once every five years
through the financial examination process.
A common measure to determine how much of the premium dollar is used to cover
benefits is the loss ratio. A loss ratio of 70 percent, for example, means the insurer spent 70
cents of each dollar collected through direct written premium on benefits. As a group, workers’
compensation insurers had a collective loss ratio of 71.9 percent. CEIC’s loss ratio was 87.8
percent in 2012, and 76.4% in 2013. From the period of 2003 to 2013, CEIC’s loss ratios

8
generally have been higher than the rest of the Industry. (See Exhibit 7 for a comparison of
CEIC’s loss ratios to those of the Industry for the period 2003 to 2013).
Exhibits 8 through 12 illustrate various aspects of the history of NCCI pure premium loss
costs filings in the state of Maryland as follows:
Exhibit 8 shows NCCI’s Maryland statewide pure premium loss costs changes from 1998
through 2015 (the years represent the effective dates of each pure premium loss costs
filing).
Exhibit 9 displays Maryland’s history of changes in pure premium loss costs by each
industry group.
Exhibit 10 displays, based on statewide payroll for the listed classifications, changes in
the pure premium loss costs for businesses within each classification listed.
Exhibit 11 displays the history of the component changes within each NCCI pure
premium loss costs filing. This information is not available prior to 2004.
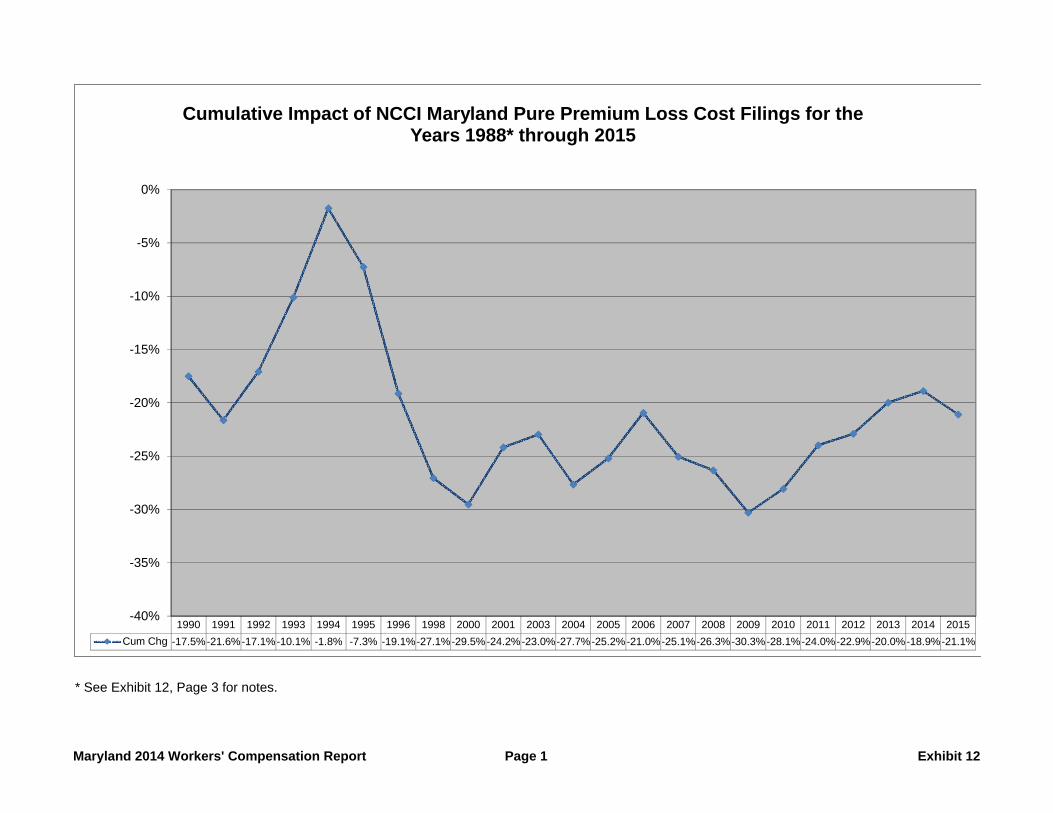
Exhibit 12, Page 1 represents the cumulative impact of all NCCI statewide pure premium
loss costs filings since 1988. Exhibit 12, Page 2 shows this cumulative impact on an
industry group basis.
The NCCI filed its pure premium loss costs for Maryland with the MIA on July 24, 2014.
The filing was approved by the MIA on August 20, 2014 with an effective date of January 1,
2015. The overall approved change for this filing is a decrease of 2.7 percent, of which 2.6
percent of the decrease is due to experience and 0.1 percent, due to the cost of benefits. These
decreases are based on a relatively flat claims frequency for the last seven years and an
expectation that indemnity benefits will increase at a slower rate than workers’ wages.
A decrease in pure premium loss costs does not mean all employers will see a premium

9
decrease. The premium an employer is charged depends on the employer’s classification and
other factors. Some employers may receive premium decreases while others may see premium
increases.
Terrorism Risk Insurance Program
In 2002, Congress enacted the Terrorism Risk Insurance Act (“TRIA”), creating a federal
reinsurance program to assist insurance companies in paying for claims relating to acts of
terrorism. The program was intended to be a temporary measure to allow time for insurers to
develop solutions and products to insure against acts of terrorism. TRIA was set to expire in
2005, but was extended until 2007. In December of 2007, it was extended for another seven
years until December 31, 2014. NCCI filed the loss costs with the MIA on July 24, 2014 to
ensure time for a proper review and for insurers to adopt the filing and/or make changes to the
loss costs multipliers they have on file; however, Congress had not extended this program as of
the date of NCCI’s filing. NCCI has indicated that if TRIA is not extended, or is not extended in
its current form, the organization may make additional filings as a result of the increased
exposure presented.
Conclusion
Ninety seven insurance groups reported workers’ compensation insurance premium
earned in Maryland. This line of insurance remains competitive. NCCI’s pure premium loss
costs increased modestly each year for the five-year period from 2010 to 2014, but will decrease
slightly (2.7 percent) in 2015.

2002 2003 2004 2005 2006 2007 2008 2009 2010 2011 2012 2013WC Share 10.3% 10.4% 10.8% 11.4% 11.3% 10.8% 9.9% 8.2% 8.2% 8.5% 9.0% 9.0%
0.0%
2.0%
4.0%
6.0%
8.0%
10.0%
12.0%
14.0%
Maryland Workers' Compensation Share of Overall Property & Casualty Industry Written Premium
Maryland 2014 Workers' Compensation Report Exhibit 1

2003 2004 2005 2006 2007 2008 2009 2010 2011 2012 2013
CEIC 32.6% 34.3% 33.2% 31.0% 27.8% 24.9% 22.7% 22.5% 23.1% 23.3% 24.6%
Hartford Group 7.9% 9.1% 11.6% 10.2% 10.7% 11.2% 12.2% 12.5% 14.3% 13.8% 12.5%
Travelers Group 5.2% 5.0% 4.2% 4.9% 5.3% 6.4% 7.7% 7.6% 8.1% 7.5% 7.8%
Liberty Mutual Group 6.6% 6.6% 6.4% 7.2% 8.0% 9.5% 8.8% 9.6% 7.6% 7.8% 6.2%
Erie Insurance Group 5.5% 5.6% 5.2% 5.2% 4.7% 4.7% 4.8% 4.7% 5.4% 5.5% 6.1%
American International Group 5.3% 6.3% 6.9% 8.3% 8.2% 7.3% 5.4% 5.6% 2.9% 3.4% 3.5%
Zurich Group 4.5% 4.5% 4.6% 3.9% 3.7% 4.3% 4.2% 4.8% 3.8% 4.6% 3.5%
WR Berkley Group 0.4% 0.6% 0.8% 1.1% 1.3% 1.5% 1.9% 2.2% 2.9% 2.4% 2.7%
0.0%
5.0%
10.0%
15.0%
20.0%
25.0%
30.0%
35.0%
40.0%
Comparison of Large Insurance Group Market Sharesin Maryland for 2003 through 2013
Maryland 2014 Workers' Compensation Report Exhibit 2

Maryland Workers' Compensation Market Share by Insurer Group
2013 Rank
2013 Group Code
NAIC Cocode Group Name
2013 Written Premium
2013 Group Market Share
2013 Cumulative
Group Market Share
1 0 11039 CHESAPEAKE EMPLOYERS INS CO 219,225,214 24.6% 24.6%2 91 HARTFORD FIRE & CAS GRP 111,173,254 12.5% 37.1%3 3548 TRAVELERS GRP 69,813,590 7.8% 45.0%4 111 LIBERTY MUT GRP 55,522,004 6.2% 51.2%5 213 ERIE INS GRP 53,868,214 6.1% 57.3%6 12 AMERICAN INTL GRP 31,527,728 3.5% 60.8%7 212 ZURICH INS GRP 31,315,437 3.5% 64.3%8 98 WR BERKLEY CORP GRP 23,735,023 2.7% 67.0%9 242 SELECTIVE INS GRP 22,640,715 2.5% 69.6%
10 150 OLD REPUBLIC GRP 19,328,656 2.2% 71.7%11 140 NATIONWIDE CORP GRP 15,722,190 1.8% 73.5%12 31 BERKSHIRE HATHAWAY GRP 14,378,590 1.6% 75.1%13 218 CNA INS GRP 14,276,319 1.6% 76.7%14 38 CHUBB INC GRP 13,940,976 1.6% 78.3%15 244 CINCINNATI FIN GRP 12,871,683 1.4% 79.7%16 2538 AMTRUST NGH GRP 12,771,924 1.4% 81.2%17 447 HARFORD GRP 10,105,174 1.1% 82.3%18 572 BCBS OF MI GRP 9,679,168 1.1% 83.4%19 626 ACE LTD GRP 9,488,166 1.1% 84.5%20 4507 BUILDERS GRP 8,650,956 1.0% 85.4%21 680 AMERISAFE GRP 7,808,423 0.9% 86.3%22 176 STATE FARM GRP 7,071,807 0.8% 87.1%23 175 STATE AUTO MUT GRP 6,779,922 0.8% 87.9%24 250 DONEGAL GRP 6,661,203 0.7% 88.6%25 1279 ARCH INS GRP 6,318,498 0.7% 89.3%26 457 ARGONAUT GRP 6,263,143 0.7% 90.0%27 3158 EASTERN INS HOLDING INC GRP 5,979,959 0.7% 90.7%28 88 THE HANOVER INS GRP 5,435,565 0.6% 91.3%29 271 PENNSYLVANIA NATL INS GRP 5,056,584 0.6% 91.9%30 3363 EMPLOYERS HOLDINGS GRP 4,956,129 0.6% 92.4%
Maryland 2014 Workers' Compensation Report Page 1 Exhibit 3

Maryland Workers' Compensation Market Share by Insurer Group
2013 Rank
2013 Group Code
NAIC Cocode Group Name
2013 Written Premium
2013 Group Market Share
2013 Cumulative
Group Market Share
31 84 AMERICAN FINANCIAL GRP 3,954,353 0.4% 92.9%32 796 QBE INS GRP 3,513,539 0.4% 93.3%33 661 BCBS OF SC GRP 3,428,864 0.4% 93.7%34 867 BALDWIN & LYONS GRP 3,009,641 0.3% 94.0%35 0 13501 BRETHREN MUT INS CO 2,905,773 0.3% 94.3%36 1285 XL AMER GRP 2,877,880 0.3% 94.7%37 408 AMERICAN NATL FIN GRP 2,814,036 0.3% 95.0%38 748 MEADOWBROOK INS GRP 2,635,634 0.3% 95.3%39 201 UTICA GRP 2,488,656 0.3% 95.5%40 169 SENTRY INS GRP 2,206,711 0.2% 95.8%41 158 FAIRFAX FIN GRP 2,153,807 0.2% 96.0%42 640 MUTUAL BENEFIT GRP 2,105,420 0.2% 96.3%43 7 FEDERATED MUT GRP 2,096,673 0.2% 96.5%44 0 11398 GUARANTEE INS CO 2,056,123 0.2% 96.7%45 3098 TOKIO MARINE HOLDINGS INC GRP 1,816,567 0.2% 96.9%46 1120 EVEREST REINS HOLDINGS GRP 1,715,252 0.2% 97.1%47 0 13528 BROTHERHOOD MUT INS CO 1,696,819 0.2% 97.3%48 311 MAIN STREET AMER GRP 1,617,610 0.2% 97.5%49 4670 STARR GRP 1,612,624 0.2% 97.7%50 228 WESTFIELD GRP 1,518,265 0.2% 97.9%51 474 FCCI MUT INS GRP 1,461,274 0.2% 98.0%52 761 ALLIANZ INS GRP 1,430,815 0.2% 98.2%53 1129 WHITE MOUNTAINS GRP 1,427,748 0.2% 98.3%54 4715 MS & AD INS GRP 1,383,640 0.2% 98.5%55 57 ELECTRIC INS GRP 1,268,920 0.1% 98.6%56 0 18767 CHURCH MUT INS CO 1,089,500 0.1% 98.8%57 69 FARMERS INS GRP 869,043 0.1% 98.9%58 124 AMERISURE CO GRP 867,777 0.1% 99.0%59 4702 SPARTA GRP 824,240 0.1% 99.1%60 1332 MAINE EMPLOYERS MUT INS GRP 767,024 0.1% 99.1%
Maryland 2014 Workers' Compensation Report Page 2 Exhibit 3

Maryland Workers' Compensation Market Share by Insurer Group
2013 Rank
2013 Group Code
NAIC Cocode Group Name
2013 Written Premium
2013 Group Market Share
2013 Cumulative
Group Market Share
61 517 HANNOVER GRP 720,917 0.1% 99.2%62 785 MARKEL CORP GRP 592,217 0.1% 99.3%63 812 HIGHMARK GRP 583,006 0.1% 99.4%64 4725 ENSTAR GRP 578,574 0.1% 99.4%65 349 FLORISTS MUT GRP 535,270 0.1% 99.5%66 0 15709 SOUTHERN STATES INS EXCH 482,388 0.1% 99.5%67 4381 HOUSTON INTL INS GRP 409,314 0.0% 99.6%68 3219 NKSJ HOLDINGS INC GRP 393,838 0.0% 99.6%69 1302 BUILDERS INS GRP 383,262 0.0% 99.7%70 0 10642 CHEROKEE INS CO 378,593 0.0% 99.7%71 303 GUIDEONE INS GRP 332,386 0.0% 99.7%72 0 23108 LUMBERMENS UNDERWRITING ALLIANCE 291,102 0.0% 99.8%73 361 MUNICH RE GRP 264,801 0.0% 99.8%74 0 12866 T H E INS CO 243,006 0.0% 99.8%75 256 PROSIGHT GRP 215,931 0.0% 99.9%76 594 AMERICAN CONTRACTORS INS GRP 205,898 0.0% 99.9%77 775 PHARMACISTS MUT GRP 139,809 0.0% 99.9%78 853 PUBLIC SERV GRP 122,166 0.0% 99.9%79 3703 TOWER GRP 118,748 0.0% 99.9%80 225 IAT REINS CO GRP 116,023 0.0% 99.9%81 783 RLI INS GRP 94,842 0.0% 99.9%82 62 EMC INS CO GRP 76,102 0.0% 100.0%83 222 GREATER NY GRP 75,251 0.0% 100.0%84 0 38300 SAMSUNG FIRE & MARINE INS CO LTD 74,742 0.0% 100.0%85 0 40517 ADVANTAGE WORKERS COMP INS CO 65,896 0.0% 100.0%86 0 11075 LION INS CO 62,094 0.0% 100.0%87 0 11600 FRANK WINSTON CRUM INS CO 49,696 0.0% 100.0%88 922 AMERICAN ASSETS GRP 30,099 0.0% 100.0%89 3489 DELEK GRP 27,466 0.0% 100.0%90 0 31232 WORK FIRST CAS CO 12,256 0.0% 100.0%
Maryland 2014 Workers' Compensation Report Page 3 Exhibit 3

Maryland Workers' Compensation Market Share by Insurer Group
2013 Rank
2013 Group Code
NAIC Cocode Group Name
2013 Written Premium
2013 Group Market Share
2013 Cumulative
Group Market Share
91 553 ARROWPOINT CAPITAL GRP 11,663 0.0% 100.0%92 0 11118 FEDERATED RURAL ELECTRIC INS EXCH 10,025 0.0% 100.0%93 4743 CHRISTUS HLTH GRP 402 0.0% 100.0%94 0 23663 NATIONAL AMER INS CO 244 0.0% 100.0%95 4795 ATLAS FINANCIAL HOLDINGS GRP -2,696 0.0% 100.0%96 0 41394 BENCHMARK INS CO -7,491 0.0% 100.0%97 0 12297 PETROLEUM CAS CO -16,544 0.0% 100.0%
Grand Total 889,651,738
Maryland 2014 Workers' Compensation Report Page 4 Exhibit 3
Maryland Workers' Compensation Market Share by Insurer Group
.
CEIC Top 10 Group (w/o CEIC) Remaining Carriers2008 27.8% 47.1% 25.1%2009 22.7% 53.7% 23.6%2010 22.5% 55.3% 22.2%2011 23.1% 53.3% 23.6%2012 23.3% 51.6% 25.1%2013 24.6% 48.9% 26.5%
0.0%
10.0%
20.0%
30.0%
40.0%
50.0%
60.0%
Market Share by Segment 2008 to 2013
Maryland 2014 Workers' Compensation Report Page 5 Exhibit 3
Maryland Workers' Compensation Insurance Groups IncludingEach Company Within the Group
2013 Rank
Group Code Company Name
2013 Group Premium Company Name
2013 Company Premium
1 0 CHESAPEAKE EMPLOYERS INS CO 219,225,214 CHESAPEAKE EMPLOYERS INS CO 219,225,214
2 91 HARTFORD FIRE & CAS GRP 111,173,254 TWIN CITY FIRE INS CO CO 25,037,261TRUMBULL INS CO 15,106,987HARTFORD UNDERWRITERS INS CO 14,144,401HARTFORD INS CO OF THE MIDWEST 13,332,045SENTINEL INS CO LTD 13,016,140HARTFORD ACCIDENT & IND CO 10,252,923HARTFORD FIRE IN CO 7,839,140HARTFORD CAS INS CO 6,412,582PROPERTY & CAS INS CO OF HARTFORD 6,031,775
3 3548 TRAVELERS GRP 69,813,590 TRAVELERS IND CO 14,976,653CHARTER OAK FIRE INS CO 9,517,323FARMINGTON CAS CO 7,594,228STANDARD FIRE INS CO 6,972,139TRAVELERS CAS INS CO OF AMER 6,818,396TRAVELERS CAS & SURETY CO 5,295,371TRAVELERS PROP CAS CO OF AMER 5,011,961PHOENIX INS CO 4,991,627TRAVELERS IND CO OF AMER 4,092,299TRAVELERS IND CO OF CT 3,565,831FIDELITY & GUAR INS UNDERWRITERS IN 551,126UNITED STATES FIDELITY & GUAR CO 396,943FIDELITY & GUAR INS CO 73,531ST PAUL FIRE & MARINE INS CO 247DISCOVER PROP & CAS INS CO -44,085
Maryland 2014 Workers' Compensation Report Page 1 Exhibit 4
Maryland Workers' Compensation Insurance Groups IncludingEach Company Within the Group
2013 Rank
Group Code Company Name
2013 Group Premium Company Name
2013 Company Premium
4 111 LIBERTY MUT GRP 55,522,004 LIBERTY INS CORP 22,924,535LIBERTY MUT FIRE INS CO 7,840,254NETHERLANDS INS CO THE 3,848,009WAUSAU UNDERWRITERS INS CO 3,124,943AMERICAN FIRE & CAS CO 2,800,467EXCELSIOR INS CO 2,707,281FIRST LIBERTY INS CORP 2,440,842PEERLESS INS CO 2,439,358EMPLOYERS INS OF WAUSAU 1,574,287MONTGOMERY MUT INS CO 1,186,170LM INS CORP 1,049,161OHIO SECURITY INS CO 841,683LIBERTY MUT INS CO 804,940WEST AMER INS CO 768,238OHIO CAS INS CO 638,954WAUSAU BUSINESS INS CO 163,664PEERLESS IND INS CO 124,185AMERICAN STATES INS CO 108,048AMERICAN ECONOMY INS CO 67,849GENERAL INS CO OF AMER 67,664FIRST NATL INS CO OF AMER 1,472
5 213 ERIE INS GRP 53,868,214 ERIE INS EXCH 21,993,461FLAGSHIP CITY INS CO 18,515,596ERIE INS CO OF NY 9,709,691ERIE INS CO 2,855,093ERIE INS PROP & CAS CO 794,373
Maryland 2014 Workers' Compensation Report Page 2 Exhibit 4

Maryland Workers' Compensation Insurance Groups IncludingEach Company Within the Group
2013 Rank
Group Code Company Name
2013 Group Premium Company Name
2013 Company Premium
6 12 AMERICAN INTL GRP 31,527,728 NEW HAMPSHIRE INS CO 12,913,074INSURANCE CO OF THE STATE OF PA 8,826,456COMMERCE & INDUSTRY INS CO 6,621,245NATIONAL UNION FIRE INS CO OF PITTS 3,759,310GRANITE STATE INS CO 2,019,608ILLINOIS NATL INS CO 879,527AIG ASSUR CO 761,592AIU INS CO -953AIG PROP CAS CO -1,157,303AMERICAN HOME ASSUR CO -3,094,828
7 212 ZURICH INS GRP 31,315,437 AMERICAN ZURICH INS CO 13,562,152ZURICH AMER INS CO 13,174,513NORTHERN INS CO OF NY 1,793,889AMERICAN GUAR & LIAB INS 1,380,981ZURICH AMER INS CO OF IL 1,109,410MARYLAND CAS CO 171,874ASSURANCE CO OF AMER 122,618
8 98 WR BERKLEY CORP GRP 23,735,023 STARNET INS CO 7,017,269KEY RISK INS CO 3,626,561FIREMENS INS CO OF WASHINGTON DC 3,381,009GREAT DIVIDE INS CO 2,794,141CAROLINA CAS INS CO 2,435,361CONTINENTAL WESTERN INS CO 2,132,513UNION INS CO 1,340,567ACADIA INS CO 648,216AMERICAN MINING INS CO 178,261BERKLEY NATL INS CO 163,021BERKLEY REGIONAL INS CO 28,077TRI STATE INS CO OF MN 6,049RIVERPORT INS CO 3,356MIDWEST EMPLOYERS CAS CO -19,378
Maryland 2014 Workers' Compensation Report Page 3 Exhibit 4

Maryland Workers' Compensation Insurance Groups IncludingEach Company Within the Group
2013 Rank
Group Code Company Name
2013 Group Premium Company Name
2013 Company Premium
9 242 SELECTIVE INS GRP 22,640,715 SELECTIVE INS CO OF AMER 8,279,188SELECTIVE WAY INS CO 8,243,188SELECTIVE INS CO OF THE SOUTHEAST 3,943,237SELECTIVE INS CO OF SC 2,175,102
10 150 OLD REPUBLIC GRP 19,328,656 PENNSYLVANIA MANUFACTURERS ASSO 8,630,659MANUFACTURERS ALLIANCE INS CO 2,947,882OLD REPUBLIC INS CO 2,882,026OLD REPUBLIC GEN INS CORP 2,271,447PENNSYLVANIA MANUFACTURERS IND C 934,468GREAT WEST CAS CO 922,607BITUMINOUS CAS CORP 488,501BITUMINOUS FIRE & MARINE INS CO 251,066
11 140 NATIONWIDE CORP GRP 15,722,190 NATIONWIDE MUT FIRE INS CO 3,863,070NATIONWIDE PROP & CAS INS CO 3,195,614NATIONWIDE MUT INS CO 2,673,703AMCO INS CO 1,401,842HARLEYSVILLE WORCESTER INS CO 1,287,506NATIONWIDE AGRIBUSINESS INS CO 899,971DEPOSITORS INS CO 717,897HARLEYSVILLE INS CO 666,783NATIONAL CAS CO 373,241ALLIED PROP & CAS INS CO 369,036HARLEYSVILLE PREFERRED INS CO 239,529FARMLAND MUT INS CO 33,998
12 31 BERKSHIRE HATHAWAY GRP 14,378,590 BERKSHIRE HATHAWAY HOMESTATE INS 4,363,097CONTINENTAL IND CO 3,807,206NORGUARD INS CO 3,069,204AMGUARD INS CO 2,748,051EASTGUARD INS CO 391,032
Maryland 2014 Workers' Compensation Report Page 4 Exhibit 4

Maryland Workers' Compensation Insurance Groups IncludingEach Company Within the Group
2013 Rank
Group Code Company Name
2013 Group Premium Company Name
2013 Company Premium
13 218 CNA INS GRP 14,276,319 CONTINENTAL CAS CO 3,638,697TRANSPORTATION INS CO 2,997,325AMERICAN CAS CO OF READING PA 2,653,329NATIONAL FIRE INS CO OF HARTFORD 2,388,880VALLEY FORGE INS CO 2,203,111CONTINENTAL INS CO 394,977
14 38 CHUBB INC GRP 13,940,976 FEDERAL INS CO 6,415,946PACIFIC IND CO 2,787,978CHUBB IND INS CO 2,729,764GREAT NORTHERN INS CO 1,180,122VIGILANT INS CO 820,947CHUBB NATL INS CO 6,219
15 244 CINCINNATI FIN GRP 12,871,683 CINCINNATI CAS CO 5,169,824CINCINNATI INS CO 3,942,316THE CINCINNATI IND CO 3,759,543
16 2538 AMTRUST NGH GRP 12,771,924 TECHNOLOGY INS CO INC 7,687,014WESCO INS CO 3,773,369SECURITY NATL INS CO 1,008,108FIRST NONPROFIT INS CO 303,314SEQUOIA INS CO 119
17 447 HARFORD GRP 10,105,174 HARFORD MUT INS CO 9,848,224FIRSTLINE NATL INS CO 256,950
18 572 BCBS OF MI GRP 9,679,168 ACCIDENT FUND INS CO OF AMER 5,602,648ACCIDENT FUND GEN INS CO 2,886,131ACCIDENT FUND NATL INS CO 1,103,947UNITED WI INS CO 86,442
Maryland 2014 Workers' Compensation Report Page 5 Exhibit 4

Maryland Workers' Compensation Insurance Groups IncludingEach Company Within the Group
2013 Rank
Group Code Company Name
2013 Group Premium Company Name
2013 Company Premium
19 626 ACE LTD GRP 9,488,166 INDEMNITY INS CO OF NORTH AMER 6,268,168ACE AMER INS CO 2,769,716ACE FIRE UNDERWRITERS INS CO 232,138INSURANCE CO OF N AMER 211,402BANKERS STANDARD INS CO 101,100PENN MILLERS INS CO 52,146ACE PROP & CAS INS CO 27,928PACIFIC EMPLOYERS INS CO -174,432
20 4507 BUILDERS GRP 8,650,956 BUILDERS MUT INS CO 8,098,147BUILDERS PREMIER INS CO 552,809
21 680 AMERISAFE GRP 7,808,423 AMERICAN INTERSTATE INS CO 7,808,423
22 176 STATE FARM GRP 7,071,807 STATE FARM FIRE & CAS CO 7,071,807
23 175 STATE AUTO MUT GRP 6,779,922 AMERICAN COMPENSATION INS CO 2,235,604MERIDIAN SECURITY INS CO 1,971,015STATE AUTOMOBILE MUT INS CO 1,424,577STATE AUTO PROP & CAS INS CO 1,173,380PLAZA INS CO -24,654
24 250 DONEGAL GRP 6,661,203 ATLANTIC STATES INS CO 2,683,872PENINSULA IND CO 2,543,798DONEGAL MUT INS CO 1,004,639PENINSULA INS CO 428,894
25 1279 ARCH INS GRP 6,318,498 ARCH INS CO 6,318,498
26 457 ARGONAUT GRP 6,263,143 ROCKWOOD CAS INS CO 3,744,418COLONY SPECIALTY INS CO 1,123,512ARGONAUT INS CO 874,760ARGONAUT MIDWEST INS CO 520,453
Maryland 2014 Workers' Compensation Report Page 6 Exhibit 4

Maryland Workers' Compensation Insurance Groups IncludingEach Company Within the Group
2013 Rank
Group Code Company Name
2013 Group Premium Company Name
2013 Company Premium
27 3158 EASTERN INS HOLDING INC GRP 5,979,959 EASTERN ALLIANCE INS CO 3,623,745ALLIED EASTERN IND CO 1,955,956EASTERN ADVANTAGE ASSUR CO 400,258
28 88 THE HANOVER INS GRP 5,435,565 MASSACHUSETTS BAY INS CO 1,939,396HANOVER INS CO 1,218,439HANOVER AMER INS CO 1,091,687ALLMERICA FIN BENEFIT INS CO 992,062NOVA CAS CO 193,981
29 271 PENNSYLVANIA NATL INS GRP 5,056,584 PENN NATL SECURITY INS CO 3,102,584PENNSYLVANIA NATL MUT CAS INS CO 1,954,000
30 3363 EMPLOYERS HOLDINGS GRP 4,956,129 EMPLOYERS PREFERRED INS CO 3,423,888EMPLOYERS ASSUR CO 1,532,241
31 84 AMERICAN FINANCIAL GRP 3,954,353 VANLINER INS CO 1,678,961NATIONAL INTERSTATE INS CO 877,645GREAT AMER INS CO OF NY 703,652GREAT AMER ALLIANCE INS CO 661,781GREAT AMER ASSUR CO 29,199GREAT AMER INS CO 3,115
32 796 QBE INS GRP 3,513,539 QBE INS CORP 1,781,662PRAETORIAN INS CO 1,245,808NORTH POINTE INS CO 275,047STONINGTON INS CO 142,698GENERAL CAS CO OF WI 53,188REGENT INS CO 15,136
33 661 BCBS OF SC GRP 3,428,864 COMPANION PROP & CAS INS CO 2,325,562COMPANION COMMERCIAL INS CO 1,103,302
34 867 BALDWIN & LYONS GRP 3,009,641 PROTECTIVE INS CO 3,009,641
Maryland 2014 Workers' Compensation Report Page 7 Exhibit 4

Maryland Workers' Compensation Insurance Groups IncludingEach Company Within the Group
2013 Rank
Group Code Company Name
2013 Group Premium Company Name
2013 Company Premium
35 0 BRETHREN MUT INS CO 2,905,773 BRETHREN MUT INS CO 2,905,773
36 1285 XL AMER GRP 2,877,880 XL SPECIALTY INS CO 1,744,647XL INS AMER INC 943,295GREENWICH INS CO 189,938
37 408 AMERICAN NATL FIN GRP 2,814,036 UNITED FARM FAMILY INS CO 2,814,036
38 748 MEADOWBROOK INS GRP 2,635,634 STAR INS CO 2,635,634
39 201 UTICA GRP 2,488,656 REPUBLIC FRANKLIN INS CO 1,182,051UTICA MUT INS CO 811,411GRAPHIC ARTS MUT INS CO 495,194
40 169 SENTRY INS GRP 2,206,711 SENTRY INS A MUT CO 1,545,144SENTRY SELECT INS CO 599,107MIDDLESEX INS CO 62,460
41 158 FAIRFAX FIN GRP 2,153,807 UNITED STATES FIRE INS CO 907,772ZENITH INS CO 643,017NORTH RIVER INS CO 287,570CRUM & FORSTER IND CO 260,484SENECA INS CO INC 54,964
42 640 MUTUAL BENEFIT GRP 2,105,420 MUTUAL BENEFIT INS CO 1,817,535SELECT RISK INS CO 287,885
43 7 FEDERATED MUT GRP 2,096,673 FEDERATED MUT INS CO 1,960,571FEDERATED SERV INS CO 136,102
44 0 GUARANTEE INS CO 2,056,123 GUARANTEE INS CO 2,056,123
Maryland 2014 Workers' Compensation Report Page 8 Exhibit 4

Maryland Workers' Compensation Insurance Groups IncludingEach Company Within the Group
2013 Rank
Group Code Company Name
2013 Group Premium Company Name
2013 Company Premium
45 3098 TOKIO MARINE HOLDINGS INC GRP 1,816,567 SAFETY NATL CAS CORP 1,144,825TOKIO MARINE AMER INS CO 504,523TNUS INS CO 144,349SAFETY FIRST INS CO 12,271TRANS PACIFIC INS CO 10,599
46 1120 EVEREST REINS HOLDINGS GRP 1,715,252 EVEREST NATL INS CO 1,715,252
47 0 BROTHERHOOD MUT INS CO 1,696,819 BROTHERHOOD MUT INS CO 1,696,819
48 311 MAIN STREET AMER GRP 1,617,610 NGM INS CO 1,617,610
49 4670 STARR GRP 1,612,624 STARR IND & LIAB CO 1,612,624
50 228 WESTFIELD GRP 1,518,265 WESTFIELD INS CO 1,002,370AMERICAN SELECT INS CO 351,781WESTFIELD NATL INS CO 164,114
51 474 FCCI MUT INS GRP 1,461,274 NATIONAL TRUST INS CO 1,017,910FCCI INS CO 419,159MONROE GUAR INS CO 24,205
52 761 ALLIANZ INS GRP 1,430,815 ASSOCIATED IND CORP 513,989AMERICAN INS CO 474,615NATIONAL SURETY CORP 264,124FIREMANS FUND INS CO 158,528AMERICAN AUTOMOBILE INS CO 19,559
53 1129 WHITE MOUNTAINS GRP 1,427,748 ATLANTIC SPECIALTY INS CO 1,253,862EMPLOYERS FIRE INS CO 88,985ONEBEACON INS CO 40,126ONEBEACON AMER INS CO 31,071OBI NATL INS CO 13,704
Maryland 2014 Workers' Compensation Report Page 9 Exhibit 4

Maryland Workers' Compensation Insurance Groups IncludingEach Company Within the Group
2013 Rank
Group Code Company Name
2013 Group Premium Company Name
2013 Company Premium
54 4715 MS & AD INS GRP 1,383,640 MITSUI SUMITOMO INS CO OF AMER 1,300,526MITSUI SUMITOMO INS USA INC 83,114
55 57 ELECTRIC INS GRP 1,268,920 ELECTRIC INS CO 1,268,920
56 0 CHURCH MUT INS CO 1,089,500 CHURCH MUT INS CO 1,089,500
57 69 FARMERS INS GRP 869,043 FOREMOST INS CO GRAND RAPIDS MI 502,867TRUCK INS EXCH 189,831FOREMOST SIGNATURE INS CO 99,308FOREMOST PROP & CAS INS CO 47,821MID CENTURY INS CO 24,201FARMERS INS EXCH 5,015
58 124 AMERISURE CO GRP 867,777 AMERISURE INS CO 490,790AMERISURE MUT INS CO 376,987
59 4702 SPARTA GRP 824,240 SPARTA INS CO 824,240
60 1332 MAINE EMPLOYERS MUT INS GRP 767,024 MEMIC IND CO 767,024
61 517 HANNOVER GRP 720,917 HDI GERLING AMER INS CO 720,917
62 785 MARKEL CORP GRP 592,217 MARKEL INS CO 592,217
63 812 HIGHMARK GRP 583,006 HIGHMARK CAS INS CO 583,006
64 4725 ENSTAR GRP 578,574 SEABRIGHT INS CO 578,574
65 349 FLORISTS MUT GRP 535,270 FLORISTS MUT INS CO 535,270
66 0 SOUTHERN STATES INS EXCH 482,388 SOUTHERN STATES INS EXCH 482,388
67 4381 HOUSTON INTL INS GRP 409,314 IMPERIUM INS CO 409,314
Maryland 2014 Workers' Compensation Report Page 10 Exhibit 4

Maryland Workers' Compensation Insurance Groups IncludingEach Company Within the Group
2013 Rank
Group Code Company Name
2013 Group Premium Company Name
2013 Company Premium
68 3219 NKSJ HOLDINGS INC GRP 393,838 SOMPO JAPAN INS CO OF AMER 378,493NIPPONKOA INS CO LTD US BR 15,345
69 1302 BUILDERS INS GRP 383,262 ASSOCIATION INS CO 375,922VININGS INS CO 7,340
70 0 CHEROKEE INS CO 378,593 CHEROKEE INS CO 378,593
71 303 GUIDEONE INS GRP 332,386 GUIDEONE MUT INS CO 253,068GUIDEONE SPECIALTY MUT INS CO 79,318
72 0 LUMBERMENS UNDERWRITING ALLIAN 291,102 LUMBERMENS UNDERWRITING ALLIANC 291,102
73 361 MUNICH RE GRP 264,801 AMERICAN ALT INS CORP 264,801
74 0 T H E INS CO 243,006 T H E INS CO 243,006
75 256 PROSIGHT GRP 215,931 NEW YORK MARINE & GEN INS CO 215,931
76 594 AMERICAN CONTRACTORS INS GRP 205,898 ACIG INS CO 205,898
77 775 PHARMACISTS MUT GRP 139,809 PHARMACISTS MUT INS CO 139,809
78 853 PUBLIC SERV GRP 122,166 PUBLIC SERV INS CO 122,166
79 3703 TOWER GRP 118,748 TOWER NATL INS CO 128,389CASTLEPOINT NATL INS CO 108,223PRESERVER INS CO 2,008TOWER INS CO OF NY -119,872
80 225 IAT REINS CO GRP 116,023 TRANSGUARD INS CO OF AMER INC 116,023
81 783 RLI INS GRP 94,842 RLI INS CO 94,842
Maryland 2014 Workers' Compensation Report Page 11 Exhibit 4

Maryland Workers' Compensation Insurance Groups IncludingEach Company Within the Group
2013 Rank
Group Code Company Name
2013 Group Premium Company Name
2013 Company Premium
82 62 EMC INS CO GRP 76,102 EMPLOYERS MUT CAS CO 64,022EMCASCO INS CO 12,080
83 222 GREATER NY GRP 75,251 GREATER NY MUT INS CO 75,251
84 0 SAMSUNG FIRE & MARINE INS CO LTD 74,742 SAMSUNG FIRE & MARINE INS CO LTD 74,742
85 0 ADVANTAGE WORKERS COMP INS CO 65,896 ADVANTAGE WORKERS COMP INS CO 65,896
86 0 LION INS CO 62,094 LION INS CO 62,094
87 0 FRANK WINSTON CRUM INS CO 49,696 FRANK WINSTON CRUM INS CO 49,696
88 922 AMERICAN ASSETS GRP 30,099 INSURANCE CO OF THE WEST 30,099
89 3489 DELEK GRP 27,466 SOUTHERN INS CO 27,466
90 0 WORK FIRST CAS CO 12,256 WORK FIRST CAS CO 12,256
91 553 ARROWPOINT CAPITAL GRP 11,663 ARROWOOD IND CO 11,663
92 0 FEDERATED RURAL ELECTRIC INS EXC 10,025 FEDERATED RURAL ELECTRIC INS EXCH 10,025
93 4743 CHRISTUS HLTH GRP 402 PREFERRED PROFESSIONAL INS CO 402
94 0 NATIONAL AMER INS CO 244 NATIONAL AMER INS CO 244
95 4795 ATLAS FINANCIAL HOLDINGS GRP -2,696 GATEWAY INS CO -2,696
96 0 BENCHMARK INS CO -7,491 BENCHMARK INS CO -7,491
97 0 PETROLEUM CAS CO -16,544 PETROLEUM CAS CO -16,544
Maryland 2014 Workers' Compensation Report Page 12 Exhibit 4
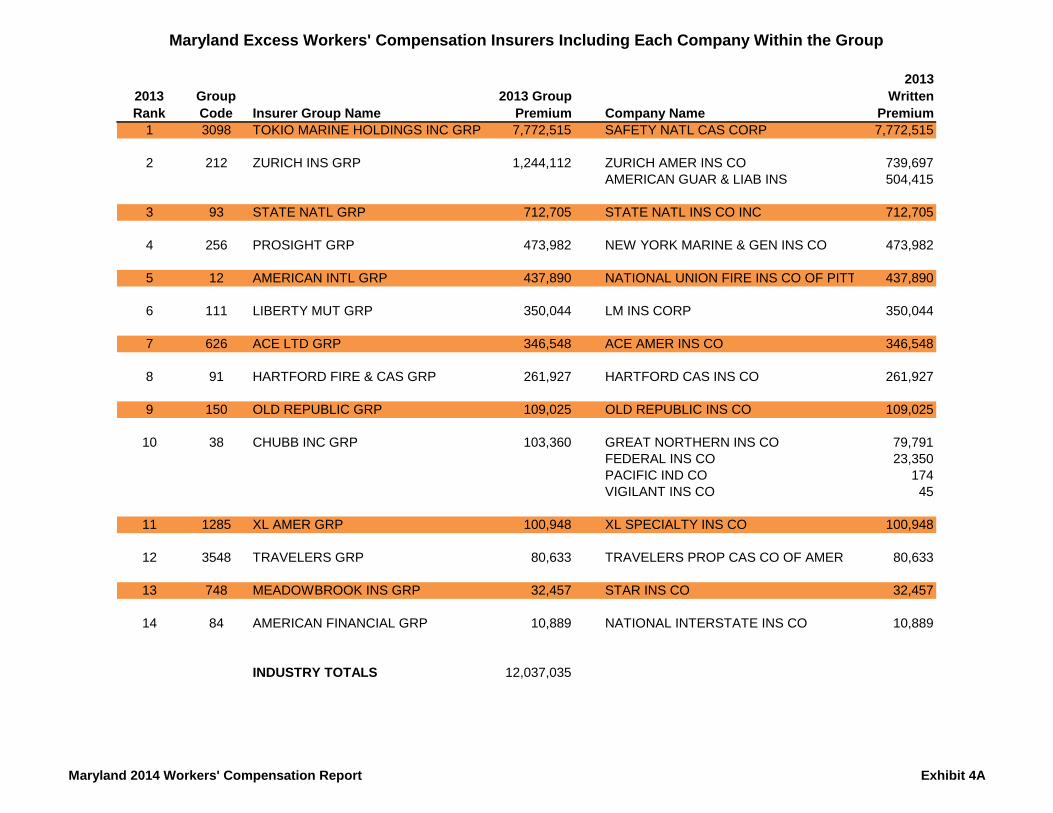
Maryland Excess Workers' Compensation Insurers Including Each Company Within the Group
2013 Rank
Group Code Insurer Group Name
2013 Group Premium Company Name
2013 Written
Premium1 3098 TOKIO MARINE HOLDINGS INC GRP 7,772,515 SAFETY NATL CAS CORP 7,772,515
2 212 ZURICH INS GRP 1,244,112 ZURICH AMER INS CO 739,697AMERICAN GUAR & LIAB INS 504,415
3 93 STATE NATL GRP 712,705 STATE NATL INS CO INC 712,705
4 256 PROSIGHT GRP 473,982 NEW YORK MARINE & GEN INS CO 473,982
5 12 AMERICAN INTL GRP 437,890 NATIONAL UNION FIRE INS CO OF PITT 437,890
6 111 LIBERTY MUT GRP 350,044 LM INS CORP 350,044
7 626 ACE LTD GRP 346,548 ACE AMER INS CO 346,548
8 91 HARTFORD FIRE & CAS GRP 261,927 HARTFORD CAS INS CO 261,927
9 150 OLD REPUBLIC GRP 109,025 OLD REPUBLIC INS CO 109,025
10 38 CHUBB INC GRP 103,360 GREAT NORTHERN INS CO 79,791FEDERAL INS CO 23,350PACIFIC IND CO 174VIGILANT INS CO 45
11 1285 XL AMER GRP 100,948 XL SPECIALTY INS CO 100,948
12 3548 TRAVELERS GRP 80,633 TRAVELERS PROP CAS CO OF AMER 80,633
13 748 MEADOWBROOK INS GRP 32,457 STAR INS CO 32,457
14 84 AMERICAN FINANCIAL GRP 10,889 NATIONAL INTERSTATE INS CO 10,889
INDUSTRY TOTALS 12,037,035
Maryland 2014 Workers' Compensation Report Exhibit 4A

Industry information includes CEIC. Numbers may not add up exactly due to rounding.
2003 2004 2005 2006 2007 2008 2009 2010 2011 2012 2013
Industry 788 875 966 995 944 868 703 709 741 835 890
CEIC 258 300 320 308 263 216 160 159 171 195 219
w/o CEIC 530 575 645 687 681 652 544 550 570 640 670
0
200
400
600
800
1000
1200
Maryland Industry vs CEIC Written Premium for 2003 through 2013 (in millions)
Maryland 2014 Workers' Compensation Report Page 1 Exhibit 5
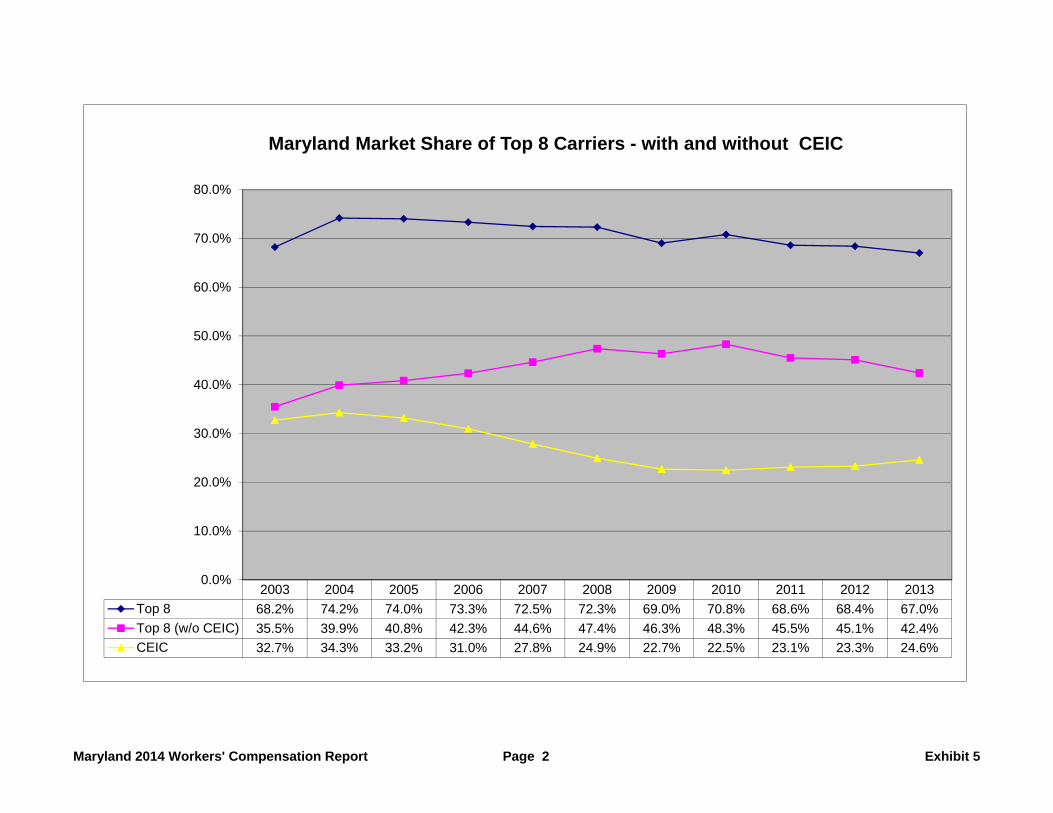
2003 2004 2005 2006 2007 2008 2009 2010 2011 2012 2013
Top 8 68.2% 74.2% 74.0% 73.3% 72.5% 72.3% 69.0% 70.8% 68.6% 68.4% 67.0%
Top 8 (w/o CEIC) 35.5% 39.9% 40.8% 42.3% 44.6% 47.4% 46.3% 48.3% 45.5% 45.1% 42.4%
CEIC 32.7% 34.3% 33.2% 31.0% 27.8% 24.9% 22.7% 22.5% 23.1% 23.3% 24.6%
0.0%
10.0%
20.0%
30.0%
40.0%
50.0%
60.0%
70.0%
80.0%
Maryland Market Share of Top 8 Carriers - with and without CEIC
Maryland 2014 Workers' Compensation Report Page 2 Exhibit 5

Maryland
RE-ENTRANTS2013
Group Code
2013 Company
Code 2013 Company Name 2013 Premium4381 35408 IMPERIUM INS CO 409,314626 20702 ACE FIRE UNDERWRITERS INS CO 232,1383703 43702 TOWER NATL INS CO 128,3893703 40134 CASTLEPOINT NATL INS CO 108,223626 18279 BANKERS STANDARD INS CO 101,1000 23663 NATIONAL AMER INS CO 244
NEW ENTRANTS2013
Group Code
2013 Company
Code 2013 Company Name 2013 Premium3098 10945 TOKIO MARINE AMER INS CO 504,52369 11185 FOREMOST INS CO GRAND RAPIDS MI 502,867796 10340 STONINGTON INS CO 142,69869 41513 FOREMOST SIGNATURE INS CO 99,30869 11800 FOREMOST PROP & CAS INS CO 47,82198 29580 BERKLEY REGIONAL INS CO 28,077
1129 14190 OBI NATL INS CO 13,70498 31003 TRI STATE INS CO OF MN 6,049
3703 15586 PRESERVER INS CO 2,008
Maryland 2014 Workers' Compensation Report Exhibit 6

Industry information includes CEIC. Source - NAIC Line of Business Summary Report, which is compiled from information contained in the State Pages of the Insurers' Annual Statements. Loss Ratio equals Direct Incurred Losses divided by Direct Premiums Earned. Loss Adjustment Expenses are excluded.
2003 2004 2005 2006 2007 2008 2009 2010 2011 2012 2013CEIC 88.2% 72.2% 80.9% 84.5% 95.3% 86.1% 100.1% 95.9% 90.4% 87.8% 76.4%w/o CEIC 82.4% 70.1% 60.6% 70.0% 80.0% 68.0% 71.4% 89.9% 81.7% 67.9% 70.5%Industry 84.2% 70.8% 67.4% 74.6% 84.4% 72.7% 78.2% 91.3% 83.7% 72.4% 71.9%
0%
10%
20%
30%
40%
50%
60%
70%
80%
90%
100%
110%
120%
Maryland Industry vs CEIC Loss Ratios from 2003 through 2013
Maryland 2014 Workers' Compensation Report Exhibit 7
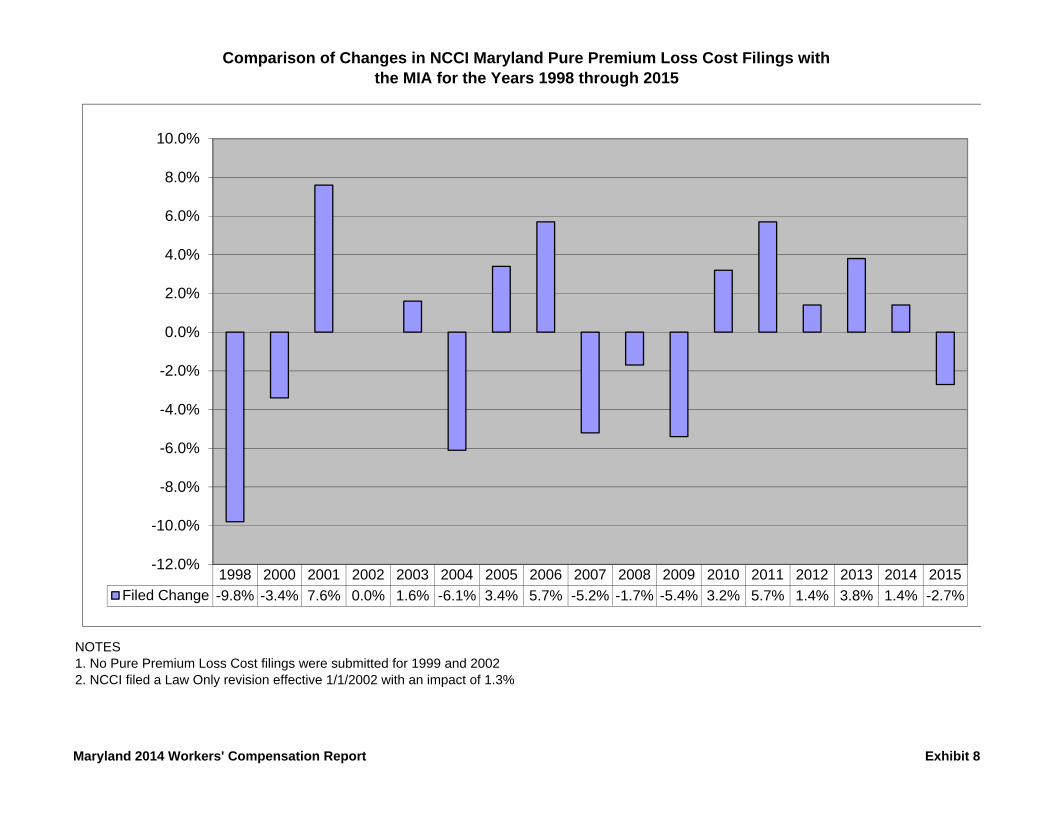
Comparison of Changes in NCCI Maryland Pure Premium Loss Cost Filings withthe MIA for the Years 1998 through 2015
NOTES1. No Pure Premium Loss Cost filings were submitted for 1999 and 20022. NCCI filed a Law Only revision effective 1/1/2002 with an impact of 1.3%
1998 2000 2001 2002 2003 2004 2005 2006 2007 2008 2009 2010 2011 2012 2013 2014 2015
Filed Change -9.8% -3.4% 7.6% 0.0% 1.6% -6.1% 3.4% 5.7% -5.2% -1.7% -5.4% 3.2% 5.7% 1.4% 3.8% 1.4% -2.7%
-12.0%
-10.0%
-8.0%
-6.0%
-4.0%
-2.0%
0.0%
2.0%
4.0%
6.0%
8.0%
10.0%
Maryland 2014 Workers' Compensation Report Exhibit 8

History of NCCI Maryland Pure Premium Loss Costs Changes by IndustryGroup for the Years 2003 through 2015
2003 2004 2005 2006 2007 2008 2009 2010 2011 2012 2013 2014 2015
Maufacturing 7.1% -11.7% 1.4% 1.0% -2.0% 0.1% 0.7% 2.8% 3.9% -2.3% 4.3% -0.2% -0.4%
Contracting 3.6% -1.7% 1.2% 2.7% -9.2% 0.2% -6.7% -4.2% 5.8% 0.8% 4.1% -0.6% -3.4%
Office/Clerical -8.6% -8.0% 6.7% 9.9% 0.8% -8.9% -11.7% 5.2% 1.4% -2.5% -1.3% -3.0% -3.4%
Goods/Services 4.2% -6.8% 3.3% 6.8% -2.8% 0.1% -5.7% 5.6% 6.0% 2.6% 2.7% 2.6% -3.2%
Miscellaneous -4.2% -7.7% 8.5% 10.1% -10.3% -3.5% 0.3% 13.5% 10.4% 5.6% 9.7% 5.7% -1.3%
-15.0%
-10.0%
-5.0%
0.0%
5.0%
10.0%
15.0%
Maryland 2014 Workers' Compensation Report Exhibit 9
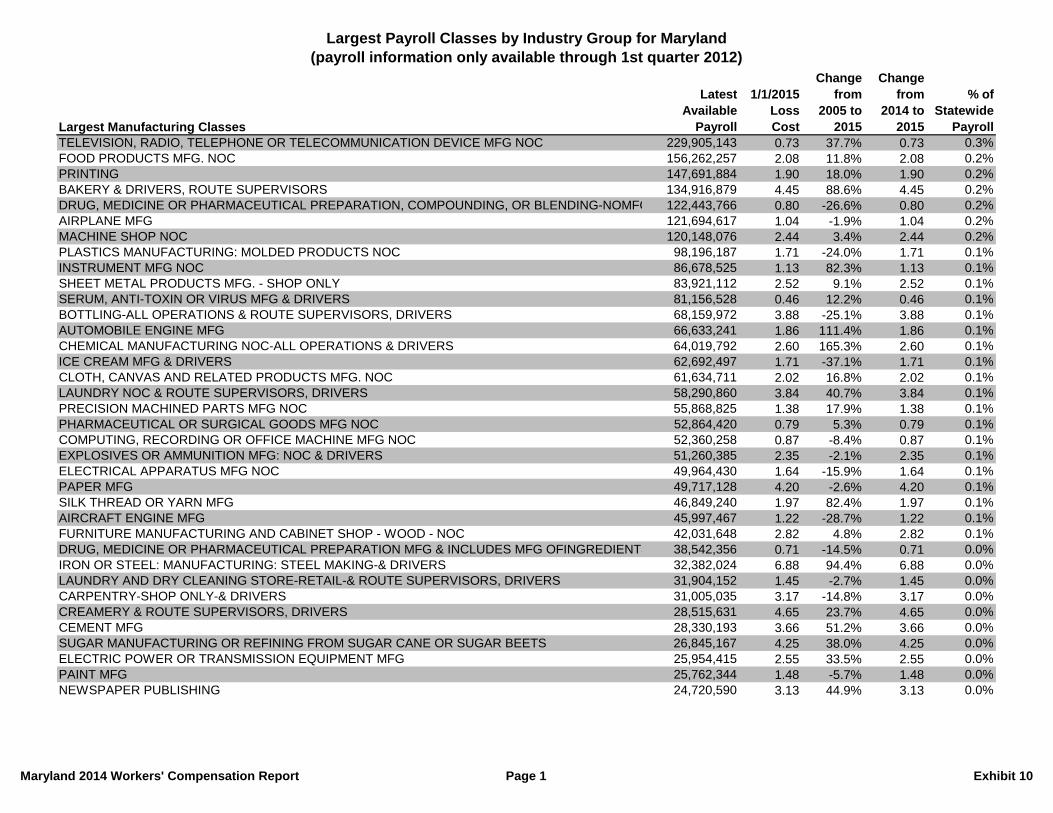
Largest Payroll Classes by Industry Group for Maryland(payroll information only available through 1st quarter 2012)
Largest Manufacturing Classes
Latest Available
Payroll
1/1/2015 Loss Cost
Change from
2005 to 2015
Change from
2014 to 2015
% of Statewide
PayrollTELEVISION, RADIO, TELEPHONE OR TELECOMMUNICATION DEVICE MFG NOC 229,905,143 0.73 37.7% 0.73 0.3%FOOD PRODUCTS MFG. NOC 156,262,257 2.08 11.8% 2.08 0.2%PRINTING 147,691,884 1.90 18.0% 1.90 0.2%BAKERY & DRIVERS, ROUTE SUPERVISORS 134,916,879 4.45 88.6% 4.45 0.2%DRUG, MEDICINE OR PHARMACEUTICAL PREPARATION, COMPOUNDING, OR BLENDING-NOMFG 122,443,766 0.80 -26.6% 0.80 0.2%AIRPLANE MFG 121,694,617 1.04 -1.9% 1.04 0.2%MACHINE SHOP NOC 120,148,076 2.44 3.4% 2.44 0.2%PLASTICS MANUFACTURING: MOLDED PRODUCTS NOC 98,196,187 1.71 -24.0% 1.71 0.1%INSTRUMENT MFG NOC 86,678,525 1.13 82.3% 1.13 0.1%SHEET METAL PRODUCTS MFG. - SHOP ONLY 83,921,112 2.52 9.1% 2.52 0.1%SERUM, ANTI-TOXIN OR VIRUS MFG & DRIVERS 81,156,528 0.46 12.2% 0.46 0.1%BOTTLING-ALL OPERATIONS & ROUTE SUPERVISORS, DRIVERS 68,159,972 3.88 -25.1% 3.88 0.1%AUTOMOBILE ENGINE MFG 66,633,241 1.86 111.4% 1.86 0.1%CHEMICAL MANUFACTURING NOC-ALL OPERATIONS & DRIVERS 64,019,792 2.60 165.3% 2.60 0.1%ICE CREAM MFG & DRIVERS 62,692,497 1.71 -37.1% 1.71 0.1%CLOTH, CANVAS AND RELATED PRODUCTS MFG. NOC 61,634,711 2.02 16.8% 2.02 0.1%LAUNDRY NOC & ROUTE SUPERVISORS, DRIVERS 58,290,860 3.84 40.7% 3.84 0.1%PRECISION MACHINED PARTS MFG NOC 55,868,825 1.38 17.9% 1.38 0.1%PHARMACEUTICAL OR SURGICAL GOODS MFG NOC 52,864,420 0.79 5.3% 0.79 0.1%COMPUTING, RECORDING OR OFFICE MACHINE MFG NOC 52,360,258 0.87 -8.4% 0.87 0.1%EXPLOSIVES OR AMMUNITION MFG: NOC & DRIVERS 51,260,385 2.35 -2.1% 2.35 0.1%ELECTRICAL APPARATUS MFG NOC 49,964,430 1.64 -15.9% 1.64 0.1%PAPER MFG 49,717,128 4.20 -2.6% 4.20 0.1%SILK THREAD OR YARN MFG 46,849,240 1.97 82.4% 1.97 0.1%AIRCRAFT ENGINE MFG 45,997,467 1.22 -28.7% 1.22 0.1%FURNITURE MANUFACTURING AND CABINET SHOP - WOOD - NOC 42,031,648 2.82 4.8% 2.82 0.1%DRUG, MEDICINE OR PHARMACEUTICAL PREPARATION MFG & INCLUDES MFG OFINGREDIENTS 38,542,356 0.71 -14.5% 0.71 0.0%IRON OR STEEL: MANUFACTURING: STEEL MAKING-& DRIVERS 32,382,024 6.88 94.4% 6.88 0.0%LAUNDRY AND DRY CLEANING STORE-RETAIL-& ROUTE SUPERVISORS, DRIVERS 31,904,152 1.45 -2.7% 1.45 0.0%CARPENTRY-SHOP ONLY-& DRIVERS 31,005,035 3.17 -14.8% 3.17 0.0%CREAMERY & ROUTE SUPERVISORS, DRIVERS 28,515,631 4.65 23.7% 4.65 0.0%CEMENT MFG 28,330,193 3.66 51.2% 3.66 0.0%SUGAR MANUFACTURING OR REFINING FROM SUGAR CANE OR SUGAR BEETS 26,845,167 4.25 38.0% 4.25 0.0%ELECTRIC POWER OR TRANSMISSION EQUIPMENT MFG 25,954,415 2.55 33.5% 2.55 0.0%PAINT MFG 25,762,344 1.48 -5.7% 1.48 0.0%NEWSPAPER PUBLISHING 24,720,590 3.13 44.9% 3.13 0.0%
Maryland 2014 Workers' Compensation Report Page 1 Exhibit 10

Largest Payroll Classes by Industry Group for Maryland(payroll information only available through 1st quarter 2012)
Largest Manufacturing Classes
Latest Available
Payroll
1/1/2014 Loss Cost
Change from
2005 to 2014
Change from
2013 to 2014
% of Statewide
PayrollCORRUGATED OR FIBER BOARD CONTAINER MFG 24,486,009 2.79 -36.2% 2.79 0.0%OXYGEN OR HYDROGEN MFG & DRIVERS 24,352,000 3.15 76.0% 3.15 0.0%SOAP OR SYNTHETIC DETERGENT MFG 22,840,476 1.97 25.5% 1.97 0.0%FURNITURE MANUFACTURING AND CABINET SHOP - ASSEMBLY BY HAND - WOOD 22,550,370 1.86 2.2% 1.86 0.0%CONSTRUCTION OR AGRICULTURAL MACHINERY MFG 22,278,642 3.00 28.8% 3.00 0.0%PLASTICS MFG: FABRICATED PRODUCTS NOC 21,103,127 2.51 1.2% 2.51 0.0%CONCRETE PRODUCTS MFG & DRIVERS 20,809,899 6.95 -2.9% 6.95 0.0%MEAT PRODUCTS MFG NOC 20,606,172 3.37 5.3% 3.37 0.0%FABRIC COATING OR IMPREGNATING NOC 19,083,938 1.82 -27.5% 1.82 0.0%HOUSE FURNISHINGS INSTALLATION NOC & UPHOLSTERING 18,517,147 3.47 16.1% 3.47 0.0%SPIRITUOUS LIQUOR BOTTLING 17,688,851 5.45 54.0% 5.45 0.0%IRON OR STEEL: FABRICATION: IRON WORKS-SHOP-ORNAMENTAL-& DRIVERS 17,339,435 6.30 13.5% 6.30 0.0%POTATO CHIP, POPCORN & SNACK CHIP MFG. NOC 15,704,576 1.17 Note (6) 1.17 0.0%CAN MFG 15,467,433 1.78 -33.3% 1.78 0.0%WIRE GOODS MFG NOC 15,119,194 3.33 32.7% 3.33 0.0%VALVE MFG 14,608,310 1.45 -16.2% 1.45 0.0%IRON OR STEEL: FABRICATION: IRON OR STEEL WORKS-SHOP-STRUCTURAL-& DRIVERS 14,298,580 7.97 1.4% 7.97 0.0%METAL STAMPED GOODS MFG NOC 13,528,613 2.86 -7.4% 2.86 0.0%PAINTING: SHOP ONLY & DRIVERS 12,571,108 2.32 3.1% 2.32 0.0%PUMP MFG 12,393,720 1.58 1.9% 1.58 0.0%OPTICAL GOODS MFG. NOC 12,031,129 0.54 Note (7) 0.54 0.0%DENTAL LABORATORY 11,657,811 0.53 23.3% 0.53 0.0%CHEMICAL BLENDING AND MIXING NOC-ALL OPERATIONS & DRIVERS 11,535,694 1.78 76.2% 1.78 0.0%KNIT GOODS MFG NOC 11,330,042 1.14 -13.0% 1.14 0.0%ASPHALT OR TAR DISTILLING OR REFINING & DRIVERS 11,208,220 1.88 43.5% 1.88 0.0%ASPHALT WORKS OPERATED BY PAVING CONTRACTORS - PERMANENT LOCATION & DRIVERS 10,986,580 6.57 -24.5% 6.57 0.0%BUILDING OR ROOFING PAPER OR FELT PREPARATION-NO INSTALLATION 10,559,942 2.23 -25.4% 2.23 0.0%PAPER GOODS MFG NOC 10,523,698 2.11 68.8% 2.11 0.0%MATTRESS OR BOX SPRING MFG 10,030,460 2.95 -28.7% 2.95 0.0%PLASTER BOARD OR PLASTER BLOCK MFG & DRIVERS 9,881,497 1.44 -23.4% 1.44 0.0%GLASS MERCHANT 9,284,133 3.98 1.3% 3.98 0.0%BOX MFG-FOLDING PAPER-NOC 8,624,220 1.64 10.8% 1.64 0.0%GEAR MFG OR GRINDING 8,433,521 2.14 -8.5% 2.14 0.0%BATTERY MFG-STORAGE 8,272,550 1.70 46.6% 1.70 0.0%STONE CUTTING OR POLISHING NOC & DRIVERS 8,177,290 8.37 58.5% 8.37 0.0%
Maryland 2014 Workers' Compensation Report Page 2 Exhibit 10

Largest Payroll Classes by Industry Group for Maryland(payroll information only available through 1st quarter 2012)
Largest Contracting Classes
Latest Available
Payroll
1/1/2014 Loss Cost
Change from
2005 to 2014
Change from
2013 to 2014
% of Statewide
PayrollCONTRACTOR--PROJECT MANAGER, CONSTRUCTION EXECUTIVE, CONSTRUCTION MANAGERO 574,141,052 1.09 -46.0% 1.09 0.7%ELECTRICAL WIRING-WITHIN BUILDINGS & DRIVERS 460,556,282 3.20 -33.9% 3.20 0.6%PLUMBING NOC & DRIVERS 355,378,325 4.56 -7.5% 4.56 0.5%HEATING, VENTILATION, AIR-CONDITIONING AND REFRIGERATIONSYSTEMS-INSTALLATION, SE 281,443,940 4.50 -32.2% 4.50 0.4%CONCRETE OR CEMENT WORK-FLOORS, DRIVEWAYS, YARDS OR SIDEWALKS-& DRIVERS 189,091,988 4.36 -5.2% 4.36 0.2%MACHINERY OR EQUIPMENT ERECTION OR REPAIR NOC & DRIVERS 186,464,364 4.85 0.4% 4.85 0.2%BURGLAR AND FIRE ALARM INSTALLATION OR REPAIR & DRIVERS 184,956,056 1.84 -16.4% 1.84 0.2%LANDSCAPE GARDENING & DRIVERS 174,490,959 5.86 51.4% 5.86 0.2%CARPENTRY-DETACHED ONE OR TWO FAMILY DWELLINGS 142,570,028 8.32 10.2% 8.32 0.2%EXCAVATION & DRIVERS 141,268,621 4.79 16.5% 4.79 0.2%CARPENTRY NOC 139,681,653 5.86 -13.7% 5.86 0.2%PAINTING NOC & SHOP OPERATIONS, DRIVERS 115,199,256 5.12 -1.9% 5.12 0.1%CARPENTRY-INSTALLATION OF CABINET WORK OR INTERIOR TRIM 87,316,758 7.11 34.4% 7.11 0.1%MASONRY NOC 78,225,456 7.03 -5.3% 7.03 0.1%CONSTRUCTION OR ERECTION PERMANENT YARD 75,816,205 5.05 1.6% 5.05 0.1%ELEVATOR ERECTION OR REPAIR 75,607,566 2.20 -49.5% 2.20 0.1%WALLBOARD, SHEETROCK, DRYWALL, PLASTERBOARD, OR CEMENT BOARD INSTALLATION- W 68,323,370 5.89 -3.6% 5.89 0.1%CONCRETE CONSTRUCTION NOC 66,380,639 7.61 4.2% 7.61 0.1%STREET OR ROAD CONSTRUCTION: PAVING OR REPAVING & DRIVERS 65,039,568 5.28 -22.8% 5.28 0.1%GAS MAIN OR CONNECTION CONSTRUCTION & DRIVERS 58,058,896 4.54 -8.7% 4.54 0.1%ELECTRIC LIGHT OR POWER LINE CONSTRUCTION & DRIVERS 55,418,959 6.37 -64.9% 6.37 0.1%FURNITURE OR FIXTURES INSTALLATION-PORTABLE-NOC 53,636,052 5.55 24.2% 5.55 0.1%SHEET METAL WORK - INSTALLATION & DRIVERS 48,774,017 4.98 Note (1) 4.98 0.1%SEWER CONSTRUCTION-ALL OPERATIONS & DRIVERS 42,997,623 4.40 19.2% 4.40 0.1%AUTOMATIC SPRINKLER INSTALLATION & DRIVERS 37,481,668 4.66 -16.0% 4.66 0.0%CERAMIC TILE, INDOOR STONE, MARBLE, OR MOSAIC WORK 33,781,799 5.39 14.2% 5.39 0.0%CONDUIT CONSTRUCTION-FOR CABLES OR WIRES-& DRIVERS 32,681,182 5.46 12.8% 5.46 0.0%ROOFING-ALL KINDS & DRIVERS 30,464,598 16.23 -16.6% 16.23 0.0%DOOR AND WINDOW INSTALLATION - ALL TYPES - RESIDENTIAL AND COMMERCIAL 30,185,399 6.02 -25.8% 6.02 0.0%FLOOR COVERING INSTALLATION--RESILIENT FLOORING -- CARPET AND LAMINATEFLOORING 28,874,987 4.69 -2.7% 4.69 0.0%INSULATION WORK NOC & DRIVERS 27,763,725 6.77 11.0% 6.77 0.0%GLAZIER-AWAY FROM SHOP & DRIVERS 24,438,303 8.85 -10.2% 8.85 0.0%STREET OR ROAD CONSTRUCTION: SUBSURFACE WORK & DRIVERS 20,763,079 3.64 -30.5% 3.64 0.0%CONCRETE CONSTRUCTION IN CONNECTION WITH BRIDGES OR CULVERTS 18,216,896 6.07 -25.7% 6.07 0.0%CONCRETE WORK-INCIDENTAL TO THE CONSTRUCTION OF PRIVATE RESIDENCE 15,254,890 5.01 -0.6% 5.01 0.0%
Maryland 2014 Workers' Compensation Report Page 3 Exhibit 10

Largest Payroll Classes by Industry Group for Maryland(payroll information only available through 1st quarter 2012)
Largest Contracting Classes
Latest Available
Payroll
1/1/2014 Loss Cost
Change from
2005 to 2014
Change from
2013 to 2014
% of Statewide
PayrollMOBILE CRANE AND HOISTING SERVICE CONTRACTORS-NOC-ALL OPERATIONS-INCLUDINGYA 15,068,180 9.65 16.1% 9.65 0.0%DRILLING NOC & DRIVERS 13,544,133 10.57 30.3% 10.57 0.0%CLEANER - DEBRIS REMOVAL - CONSTRUCTION 13,041,751 3.76 -8.5% 3.76 0.0%BOILER INSTALLATION OR REPAIR-STEAM 12,925,453 4.57 -56.6% 4.57 0.0%FENCE INSTALLATION AND REPAIR - METAL, VINYL, WOOD, OR PREFABRICATEDCONCRETE PA 12,217,673 7.29 17.0% 7.29 0.0%IRON OR STEEL: ERECTION NOC 11,878,171 6.30 -47.7% 6.30 0.0%SWIMMING POOL CONSTRUCTION-NOT IRON OR STEEL- & DRIVERS 7,162,426 6.80 1.6% 6.80 0.0%SIGN INSTALLATION, MAINTENANCE, REPAIR OR REMOVAL & DRIVERS 6,786,081 9.26 2.4% 9.26 0.0%IRRIGATION OR DRAINAGE SYSTEM CONSTRUCTION & DRIVERS 6,701,511 3.50 -19.0% 3.50 0.0%WELDING OR CUTTING NOC & DRIVERS 5,916,112 4.45 -36.9% 4.45 0.0%OIL OR GAS PIPELINE CONSTRUCTION & DRIVERS 5,887,669 6.26 -12.8% 6.26 0.0%IRON OR STEEL: ERECTION-FRAME STRUCTURES 5,588,356 17.36 -37.7% 17.36 0.0%PAINTING: METAL STRUCTURES-OVER TWO STORIES IN HEIGHT-& DRIVERS 4,800,177 15.81 -48.3% 15.81 0.0%FARM MACHINERY OPERATION-BY CONTRACTOR-& DRIVERS 4,740,365 5.22 5.7% 5.22 0.0%ASBESTOS CONTRACTOR-NOC & DRIVERS 4,138,992 19.22 101.7% 19.22 0.0%PAPERHANGING & DRIVERS 3,605,024 1.75 -2.2% 1.75 0.0%RAILROAD CONSTRUCTION: LAYING OR RELAYING OF TRACKS OR MAINTENANCE OF WAYBY C 2,918,515 4.24 -41.8% 4.24 0.0%PILE DRIVING 2,404,567 9.31 36.5% 9.31 0.0%ASBESTOS CONTRACTOR-PIPE AND BOILER WORK EXCLUSIVELY & DRIVERS 1,819,785 5.11 -43.9% 5.11 0.0%CEILING INSTALLATION-SUSPENDED ACOUSTICAL GRID TYPE 1,812,089 5.38 -25.3% 5.38 0.0%SHAFT SINKING-ALL OPERATIONS 1,216,405 4.26 -17.0% 4.26 0.0%PLASTERING NOC & DRIVERS 707,886 4.73 -64.6% 4.73 0.0%BUILDING RAISING OR MOVING 574,124 16.62 -15.8% 16.62 0.0%STREET OR ROAD CONSTRUCTION: ROCK EXCAVATION & DRIVERS 565,110 13.90 58.0% 13.90 0.0%IRON OR STEEL: ERECTION-FRAME STRUCTURES NOT OVER TWO STORIES IN HEIGHT 310,283 33.92 18.3% 33.92 0.0%OIL STILL ERECTION OR REPAIR 190,488 1.69 -26.5% 1.69 0.0%HOTHOUSE ERECTION-ALL OPERATIONS 103,868 3.91 -42.1% 3.91 0.0%LATHING & DRIVERS 90,025 3.55 -19.9% 3.55 0.0%SALVAGE OPERATION-NO WRECKING OR ANY STRUCTURAL OPERATIONS 45,920 11.12 34.5% 11.12 0.0%OIL OR GAS - LEASE WORK NOC - BY SPECIALIST CONTRACTOR & DRIVERS 44,801 6.02 25.4% 6.02 0.0%MANUFACTURED, MODULAR, OR PREFABRICATED HOME SETUP, HOOKUP, ORINSTALLATION A 32,525 2.96 #DIV/0! 2.96 0.0%JETTY OR BREAKWATER CONSTRUCTION-ALL OPERATIONS TO COMPLETION & DRIVERS 21,509 3.64 -33.5% 3.64 0.0%OIL OR GAS WELL: INSTRUMENT LOGGING OR SURVEY WORK & DRIVERS 20,255 1.67 -32.1% 1.67 0.0%OIL OR GAS - WELL - SPECIALTY TOOL & EQUIPMENT LEASING NOC - ALL EMPLOYEESAND DRI 1,839 2.21 -53.1% 2.21 0.0%
Maryland 2014 Workers' Compensation Report Page 4 Exhibit 10

Largest Payroll Classes by Industry Group for Maryland(payroll information only available through 1st quarter 2012)
Largest Office & Clerical Classes
Latest Available
Payroll
1/1/2014 Loss Cost
Change from
2005 to 2014
Change from
2013 to 2014
% of Statewide
PayrollCLERICAL OFFICE EMPLOYEES NOC 29,336,360,051 0.12 -29.4% 0.12 37.6%SALESPERSONS OR COLLECTORS-OUTSIDE 6,209,794,144 0.26 -10.3% 0.26 8.0%PHYSICIAN & CLERICAL 4,139,349,613 0.23 4.5% 0.23 5.3%AUDITOR, ACCOUNTANT, OR COMPUTER SYSTEM DESIGNER OR PROGRAMMER - TRAVELING 4,017,628,570 0.06 -25.0% 0.06 5.2%COLLEGE: PROFESSIONAL EMPLOYEES & CLERICAL 2,350,622,967 0.26 4.0% 0.26 3.0%ATTORNEY-ALL EMPLOYEES & CLERICAL, MESSENGERS, DRIVERS 1,295,892,027 0.10 -9.1% 0.10 1.7%ARCHITECTURAL OR ENGINEERING FIRM - INCLUDING SALESPERSONS & DRIVERS 1,139,903,098 0.40 -13.0% 0.40 1.5%HOSPITAL: PROFESSIONAL EMPLOYEES 889,814,938 0.71 36.5% 0.71 1.1%BUILDING OR PROPERTY MANAGEMENT - PROPERTY MANAGERS AND LEASING AGENTS &CLE 760,729,613 0.84 15.1% 0.84 1.0%TELECOMMUNICATIONS CO.: OFFICE OR EXCHANGE EMPLOYEES & CLERICAL 642,064,625 0.16 -11.1% 0.16 0.8%ARCHITECTURAL OR ENGINEERING FIRM - CLERICAL 499,508,889 0.08 Note (5) 0.08 0.6%BANKS AND TRUST COMPANIES - ALL EMPLOYEES, SALESPERSONS, DRIVERS & CLERICAL 410,626,563 0.14 Note (9) 0.14 0.5%RADIO OR TELEVISION BROADCASTING STATION-ALL EMPLOYEES & CLERICAL, DRIVERS 356,561,890 0.30 -36.2% 0.30 0.5%CHILD CARE CENTER - ALL EMPLOYEES INCLUDING CLERICAL, SALESPERSONS &DRIVERS 212,980,525 0.77 51.0% 0.77 0.3%AUTOMOBILE SALESPERSONS 210,295,662 0.66 3.1% 0.66 0.3%CLERICAL TELECOMMUTER EMPLOYEES 183,368,429 0.08 -60.0% 0.08 0.2%INSURANCE COMPANIES - INCLUDING CLERICAL & SALESPERSONS 106,678,609 0.12 Note (9) 0.12 0.1%PHOTOGRAPHER-ALL EMPLOYEES & CLERICAL, SALESPERSONS, DRIVERS 61,359,234 0.73 -1.4% 0.73 0.1%LABOR UNION-ALL EMPLOYEES 46,866,728 0.38 -2.6% 0.38 0.1%MAILING OR ADDRESSING COMPANY OR LETTER SERVICE SHOP 43,366,340 1.09 16.0% 1.09 0.1%REAL ESTATE APPRAISAL COMPANIES-OUTSIDE EMPLOYEES 41,250,978 0.22 -26.7% 0.22 0.1%THEATER NOC: PLAYERS, ENTERTAINERS OR MUSICIANS 31,219,220 2.15 20.8% 2.15 0.0%SURVEYORS, TIMBER CRUISERS, OIL OR GAS GEOLOGISTS OR SCOUTS, & DRIVERS 29,064,655 0.46 Note (5) 0.46 0.0%MAILING OR ADDRESSING COMPANY OR LETTER SERVICE SHOP - CLERICAL STAFF 18,231,695 0.42 Note (1) 0.42 0.0%AVIATION-AIR TRAFFIC CONTROLLERS UNDER CONTRACT WITH THE FAA 1,759,988 0.11 Note (5) 0.11 0.0%
Maryland 2014 Workers' Compensation Report Page 5 Exhibit 10

Largest Payroll Classes by Industry Group for Maryland(payroll information only available through 1st quarter 2012)
Largest Goods & Services Classes
Latest Available
Payroll
1/1/2014 Loss Cost
Change from
2005 to 2014
Change from
2013 to 2014
% of Statewide
PayrollSTORE: RETAIL NOC 1,433,458,785 1.32 9.1% 1.32 1.8%RESTAURANT NOC 1,250,659,347 1.12 -18.8% 1.12 1.6%CONVALESCENT OR NURSING HOME-ALL EMPLOYEES 878,623,842 1.78 1.7% 1.78 1.1%AUTOMOBILE SERVICE OR REPAIR CENTER & DRIVERS 795,349,668 2.64 33.3% 2.64 1.0%ANALYTICAL LABORATORIES OR ASSAYING - INCLUDING LABORATORY, OUTSIDEEMPLOYEES, 729,062,137 0.33 13.8% 0.33 0.9%RESTAURANT: FAST FOOD 724,623,865 1.15 -13.5% 1.15 0.9%STORE: MEAT, GROCERY AND PROVISION STORES COMBINED-RETAIL NOC 711,479,548 3.41 48.3% 3.41 0.9%OFFICE MACHINE INSTALLATION, INSPECTION, ADJUSTMENT OR REPAIR 529,967,518 0.68 15.3% 0.68 0.7%BUILDING OR PROPERTY MANAGEMENT - ALL OTHER EMPLOYEES 513,311,947 2.72 39.5% 2.72 0.7%JANITORIAL SERVICES BY CONTRACTORS - NO WINDOW CLEANING ABOVE GROUND LEVEL& D 498,187,580 2.28 14.0% 2.28 0.6%STORE: CLOTHING, WEARING APPAREL OR DRY GOODS-RETAIL 456,218,698 1.10 34.1% 1.10 0.6%STORE: WHOLESALE NOC 374,438,770 2.80 15.7% 2.80 0.5%GASOLINE STATION: SELF-SERVICE AND CONVENIENCE/GROCERY-RETAIL 305,270,061 1.82 7.1% 1.82 0.4%HOTEL: ALL OTHER EMPLOYEES & SALESPERSONS, DRIVERS 299,184,181 1.59 15.2% 1.59 0.4%BARBERSHOP, BEAUTY PARLOR OR HAIR STYLING SALON 269,208,033 0.41 -6.8% 0.41 0.3%HOSPITAL-VETERINARY & DRIVERS 267,861,405 1.14 2.7% 1.14 0.3%YMCA, YWCA, YMHA OR YWHA, INSTITUTION - ALL EMPLOYEES & CLERICAL 216,394,159 0.71 36.5% 0.71 0.3%RETIREMENT LIVING CENTERS: HEALTH CARE EMPLOYEES 214,039,568 2.12 -0.5% 2.12 0.3%STORE: DRUG - RETAIL 187,186,447 0.95 35.7% 0.95 0.2%HOME, PUBLIC, AND TRAVELING HEALTHCARE--ALL EMPLOYEES 183,296,326 1.66 -27.5% 1.66 0.2%AUTOMOBILE BODY REPAIR 173,450,868 1.83 72.6% 1.83 0.2%STORE: FURNITURE & DRIVERS 170,315,565 3.51 68.8% 3.51 0.2%CLUB - COUNTRY, GOLF, FISHING, OR YACHT - ALL EMPLOYEES & CLERICAL,SALESPERSONS, 169,463,933 1.13 -35.8% 1.13 0.2%LUMBERYARD NEW MATERIALS ONLY: ALL OTHER EMPLOYEES & YARD, WAREHOUSE,DRIVER 165,125,210 2.91 -11.0% 2.91 0.2%STORE: HARDWARE 158,374,511 1.82 36.8% 1.82 0.2%COLLEGE: ALL OTHER EMPLOYEES 149,550,264 1.94 30.2% 1.94 0.2%BUILDING MATERIAL DEALER-NEW MATERIALS ONLY: STORE EMPLOYEES 148,164,016 2.22 44.2% 2.22 0.2%STORE: DEPARTMENT-RETAIL 148,133,207 1.20 -21.6% 1.20 0.2%STORE: JEWELRY 142,080,298 0.28 -33.3% 0.28 0.2%STORE: AUTOMOBILE PARTS & ACCESSORIES- NOC & DRIVERS 124,724,090 2.22 27.6% 2.22 0.2%HOSPITAL: ALL OTHER EMPLOYEES 123,957,389 1.46 -39.7% 1.46 0.2%SOCIAL SERVICES ORGANIZATION-ALL EMPLOYEES & SALESPERSONS, DRIVERS 115,279,833 1.78 Note (1) 1.78 0.1%HOTEL: RESTAURANT EMPLOYEES 112,848,791 1.03 -25.9% 1.03 0.1%RETIREMENT LIVING CENTERS: ALL OTHER EMPLOYEES, SALESPERSONS & DRIVERS 100,397,860 2.25 26.4% 2.25 0.1%STORAGE WAREHOUSE NOC 80,740,833 3.99 -15.5% 3.99 0.1%INSPECTION OF RISKS FOR INSURANCE OR VALUATION PURPOSES NOC 71,757,126 1.05 8.2% 1.05 0.1%MACHINERY DEALER NOC-STORE OR YARD-& DRIVERS 69,707,393 4.25 37.5% 4.25 0.1%
Maryland 2014 Workers' Compensation Report Page 6 Exhibit 10

Largest Payroll Classes by Industry Group for Maryland(payroll information only available through 1st quarter 2012)
Largest Goods & Services Classes
Latest Available
Payroll
1/1/2014 Loss Cost
Change from
2005 to 2014
Change from
2013 to 2014
% of Statewide
PayrollGROUP HOMES-ALL EMPLOYEES & SALESPERSONS, DRIVERS 62,581,512 1.82 Note (1) 1.82 0.1%STORE: MEAT, FISH OR POULTRY DEALER-WHOLESALE 59,867,547 3.07 35.2% 3.07 0.1%RETIREMENT LIVING CENTERS: FOOD SERVICE EMPLOYEES 58,084,310 1.28 36.2% 1.28 0.1%AUTOMOBILE RENTAL CO.: ALL OTHER EMPLOYEES & COUNTER PERSONNEL, DRIVERS 57,550,536 1.31 -3.7% 1.31 0.1%HOUSEHOLD AND COMMERCIAL APPLIANCES-ELECTRICAL-INSTALLATION, SERVICE ORREPAIR 56,163,977 3.25 69.3% 3.25 0.1%ELECTRONIC EQUIPMENT - INSTALLATION, SERVICE, OR REPAIR - SHOP AND OUTSIDE& DRIVE 55,274,823 3.35 124.8% 3.35 0.1%VENDING OR COIN OPERATED MACHINES-INSTALLATION, SERVICE OR REPAIR &SALESPERSO 53,970,981 3.18 18.2% 3.18 0.1%FUNERAL DIRECTOR & DRIVERS 51,444,349 0.78 -1.3% 0.78 0.1%AUTOMOBILE STORAGE GARAGE, PARKING LOT OR PARKING STATION, VALET SERVICE,CASH 48,771,240 2.32 13.2% 2.32 0.1%STORE: FLORIST & DRIVERS 48,677,429 1.78 12.7% 1.78 0.1%BUS CO.: GARAGE EMPLOYEES 47,721,210 2.13 -57.0% 2.13 0.1%GASOLINE DEALER & DRIVERS 44,368,704 4.98 9.2% 4.98 0.1%STORAGE WAREHOUSE-FURNITURE & DRIVERS 43,754,385 6.97 50.9% 6.97 0.1%PLUMBERS SUPPLIES DEALER & DRIVERS 42,135,790 2.60 -40.5% 2.60 0.1%QUICK PRINTING-COPYING OR DUPLICATION SERVICE-ALL EMPLOYEES & CLERICAL,SALESPER 42,110,803 0.62 -11.4% 0.62 0.1%CLUB NOC & CLERICAL 41,696,216 1.09 5.8% 1.09 0.1%AMUSEMENT PARK OR EXHIBITION OPERATION AND DRIVERS 39,965,052 1.89 51.2% 1.89 0.1%FARM: NURSERY EMPLOYEES & DRIVERS 28,890,077 1.99 0.0% 0.14 0.0%STORE: DRUG-WHOLESALE 27,779,165 0.73 2.8% 0.73 0.0%STORE: BOOK, RECORD, COMPACT DISC, SOFTWARE, VIDEO OR AUDIO CASSETTE RETAIL 25,061,678 0.62 26.5% 0.62 0.0%BOTTLE DEALER-USED & DRIVERS 24,856,061 5.36 7.8% 5.36 0.0%MUNICIPAL, TOWNSHIP, COUNTY OR STATE EMPLOYEE NOC 22,842,218 1.85 -35.8% 1.85 0.0%FARM: FIELD CROPS & DRIVERS 19,462,467 3.73 46.9% 3.73 0.0%FARM MACHINERY DEALER-ALL OPERATIONS & DRIVERS 18,796,745 3.12 119.7% 3.12 0.0%FARM: FLORIST & DRIVERS 18,582,697 2.72 51.1% 2.72 0.0%STORE: MEAT, FISH OR POULTRY-RETAIL 18,308,633 1.69 4.3% 1.69 0.0%STABLE OR BREEDING FARM & DRIVERS 18,297,365 9.42 73.5% 9.42 0.0%IRON OR STEEL MERCHANT & DRIVERS 17,431,886 5.75 35.3% 5.75 0.0%BEER OR ALE DEALER-WHOLESALE & DRIVERS 16,752,755 5.96 13.5% 5.96 0.0%ROLLER-SKATING RINK OPERATION 16,514,155 1.31 50.6% 1.31 0.0%CEMETERY OPERATIONS & DRIVERS 13,853,551 6.15 43.7% 6.15 0.0%SASH, DOOR OR ASSEMBLED MILLWORK DEALER & DRIVERS 13,514,503 3.36 -6.7% 3.36 0.0%RESIDENTIAL CLEANING SERVICES BY CONTRACTOR - INSIDE 13,096,037 4.36 53.5% 4.36 0.0%FEED, FERTILIZER, HAY, OR GRAIN DEALER & LOCAL MANAGERS, DRIVERS - NO MFG 12,701,742 2.33 22.0% 2.33 0.0%BAR, DISCOTHEQUE, LOUNGE, NIGHT CLUB OR TAVERN 11,736,455 1.17 42.7% 1.17 0.0%GASOLINE STATION:SELF-SERVICE ONLY-RETAIL 11,539,158 1.52 32.2% 1.52 0.0%
Maryland 2014 Workers' Compensation Report Page 7 Exhibit 10

Largest Payroll Classes by Industry Group for Maryland(payroll information only available through 1st quarter 2012)
Largest Miscellaneous Classes
Latest Available
Payroll
1/1/2014 Loss Cost
Change from
2005 to 2014
Change from
2013 to 2014
% of Statewide
PayrollDRIVERS, CHAUFFEURS, MESSENGERS AND THEIR HELPERS NOC-COMMERCIAL 443,845,095 4.78 43.1% 4.78 0.6%POLICE OFFICERS & DRIVERS 436,271,320 2.47 38.8% 2.47 0.6%TRUCKING - LOCAL HAULING ONLY & DRIVERS 349,461,773 5.79 0.9% 5.79 0.4%TELEPHONE OR TELEGRAPH CO.: ALL OTHER EMPLOYEES & DRIVERS 269,561,324 3.43 74.1% 3.43 0.3%TRUCKING - LONG DISTANCE HAULING & DRIVERS 227,291,659 9.31 62.5% 9.31 0.3%AVIATION: ALL OTHER EMPLOYEES & DRIVERS 219,932,801 5.04 128.1% 5.04 0.3%AVIATION: AIR CARRIER - SCHEDULED, COMMUTER OR SUPPLEMENTAL - FLYING CREW 209,517,910 1.21 236.1% 1.21 0.3%PARK NOC-ALL EMPLOYEES & DRIVERS 160,654,529 2.20 5.3% 2.20 0.2%BUS CO.: ALL OTHER EMPLOYEES & DRIVERS 110,136,224 4.64 8.7% 4.64 0.1%GARBAGE, ASHES OR REFUSE COLLECTION & DRIVERS 109,240,282 8.35 70.4% 8.35 0.1%ELECTRIC LIGHT OR POWER CO. NOC-ALL EMPLOYEES & DRIVERS 104,778,172 0.98 7.7% 0.98 0.1%THEATER NOC: ALL OTHER EMPLOYEES 52,609,680 1.61 4.5% 1.61 0.1%SCHOOL BUS CONTRACTOR-INCLUDING INCIDENTAL CHARTER SERVICE: ALL OTHEREMPLOYE 44,733,503 3.49 135.8% 3.49 0.1%MARINA & DRIVERS 32,893,325 3.71 32.5% 3.71 0.0%STREET CLEANING & DRIVERS 27,461,131 6.09 37.5% 6.09 0.0%SEWAGE DISPOSAL PLANT OPERATION & DRIVERS 22,301,184 1.99 56.7% 1.99 0.0%QUARRY NOC & DRIVERS 21,945,215 4.12 -1.2% 4.12 0.0%TAXICAB CO.: ALL OTHER EMPLOYEES & DRIVERS 21,740,435 5.28 10.2% 5.28 0.0%TREE PRUNING, SPRAYING, REPAIRING -- ALL OPERATIONS & DRIVERS 20,038,888 14.42 17.7% 14.42 0.0%MAIL, PARCEL OR PACKAGE DELIVERY AND COURIER OR MESSENGER SERVICECOMPANIES -- 18,935,882 14.49 192.7% 14.49 0.0%ATHLETIC SPORTS OR PARK: CONTACT SPORTS 18,303,389 3.07 153.7% 3.07 0.0%ATHLETIC SPORTS OR PARK: NONCONTACT SPORTS 15,654,602 2.81 8.5% 2.81 0.0%WATERWORKS OPERATION & DRIVERS 15,556,943 2.87 48.7% 2.87 0.0%OIL OR GAS PIPELINE OPERATION & DRIVERS 14,712,208 1.86 82.4% 1.86 0.0%COAL MINING-SURFACE & DRIVERS 14,221,055 3.91 -55.2% 3.91 0.0%TRUCKING: MAIL PARCEL OR PACKAGE DELIVERY-UNDER CONTRACT WITH THE U.S.POSTAL S 14,206,796 8.50 115.2% 8.50 0.0%SAND OR GRAVEL DIGGING & DRIVERS 12,914,281 4.09 -1.7% 4.09 0.0%AVIATION:NOC - OTHER THAN HELICOPTERS - FLYING CREW 12,653,851 1.74 -16.3% 1.74 0.0%FREIGHT HANDLING NOC 12,624,567 5.87 38.1% 5.87 0.0%AVIATION - TRANSPORTATION OF PERSONNEL IN CONDUCT OF EMPLOYER'S BUSINESS -FLYIN 11,434,651 1.15 -56.1% 1.15 0.0%ATHLETIC SPORTS OR PARK: OPERATIONS & DRIVERS 9,924,848 1.73 66.3% 1.73 0.0%BOAT BUILDING OR REPAIR & DRIVERS 9,205,983 2.88 41.9% 2.88 0.0%GAS COMPANY: GAS CO.-NATURAL GAS-LOCAL DISTRIBUTION & DRIVERS 8,566,894 2.75 161.9% 2.75 0.0%AVIATION: AIR CHARTER OR AIR TAXI - FLYING CREW 8,459,413 0.86 -48.8% 0.86 0.0%AMBULANCE SERVICE COMPANIES AND EMS (EMERGENCY MEDICAL SERVICE) PROVIDERS& D 8,102,395 6.77 Note (1) 6.77 0.0%
Maryland 2014 Workers' Compensation Report Page 8 Exhibit 10

Largest Payroll Classes by Industry Group for Maryland(payroll information only available through 1st quarter 2012)
Largest Miscellaneous Classes
Latest Available
Payroll
1/1/2014 Loss Cost
Change from
2005 to 2014
Change from
2013 to 2014
% of Statewide
PayrollGARBAGE WORKS 6,478,256 2.98 19.2% 2.98 0.0%ELECTRIC LIGHT OR POWER COOPERATIVE-REA PROJECT ONLY-ALL EMPLOYEES &DRIVERS 6,274,331 2.72 51.1% 2.72 0.0%AMUSEMENT DEVICE OPERATION NOC-NOT TRAVELING-& DRIVERS 5,596,010 6.74 146.0% 6.74 0.0%AVIATION: HELICOPTERS - FLYING CREW 4,156,330 2.60 -49.6% 2.60 0.0%STONE CRUSHING & DRIVERS 1,992,982 5.71 16.5% 5.71 0.0%RAILROAD OPERATION: NOC-ALL EMPLOYEES & DRIVERS 1,407,995 4.26 13.9% 4.26 0.0%CARNIVAL, CIRCUS OR AMUSEMENT DEVICE OPERATOR-TRAVELING-ALL EMPLOYEES &DRIVE 1,394,921 10.94 22.0% 10.94 0.0%BRIDGE OR VEHICULAR TUNNEL OPERATION & DRIVERS 1,107,907 1.74 -15.1% 1.74 0.0%QUARRY-CEMENT ROCK-SURFACE-& DRIVERS 944,085 8.83 47.2% 8.83 0.0%LOGGING OR TREE REMOVAL - LOG HAULING & DRIVERS 903,041 10.30 Note (1) 10.30 0.0%DREDGING-ALL TYPES-PROGRAM II-STATE ACT WITH PROGRAM I AND PROGRAM II USLDATA A 811,580 3.25 -34.2% 3.25 0.0%VESSELS-NOC-PROGRAM II-STATE ACT WITH PROGRAM I AND PROGRAM II USL DATAADDED F 674,718 2.40 -79.1% 2.40 0.0%TRUCKING: PARCEL OR PACKAGE DELIVERY-ALL EMPLOYEES & DRIVERS 630,187 9.46 87.7% 9.46 0.0%LOGGING OR TREE REMOVAL - MECHANIZED EQUIPMENT OPERATORS 472,619 10.75 Note (1) 10.75 0.0%LOGGING OR TREE REMOVAL - NONMECHANIZED OPERATIONS 400,761 18.90 24.0% 18.90 0.0%LIME MFG-QUARRY-SURFACE-& DRIVERS 265,465 7.90 159.9% 7.90 0.0%IRRIGATION WORKS OPERATION & DRIVERS 262,271 3.49 1.5% 3.49 0.0%MINING NOC-NOT COAL-UNDERGROUND-& DRIVERS 260,655 5.25 -20.0% 5.25 0.0%MINING NOC-NOT COAL-SURFACE & DRIVERS 100,543 4.40 99.1% 4.40 0.0%DIVING, SALVAGE, WRECKING-MARINE-PROGRAM II-STATE ACT WITH PROGRAM I ANDPROGRA 52,212 9.19 -33.5% 9.19 0.0%OIL OR GAS LEASE OPERATOR-ALL OPERATIONS & DRIVERS 42,120 4.39 121.7% 4.39 0.0%
Maryland 2014 Workers' Compensation Report Page 9 Exhibit 10

Largest Payroll Classes by Industry Group for Maryland(payroll information only available through 1st quarter 2012)
Notes to Certain Classifications:(1) - Loss Cost effective 1/1/2008(2) - No payroll reported for the time period ending 3/31/2009(3) - Class no longer exists effective 1/1/2003(4) - Loss Cost effective 1/1/2010 and no payroll reported for the time ending 3/31/2009(5) - Loss Cost effective 1/1/2010 (6) - Loss Cost efective 1/1/2011, and no payroll prior to 2011 (7) - Data being incorporated into another class(8) - No payroll reported for period ending 1st quarter 2010, but had payroll for period ending 1st quarter 2011(9) - Loss Cost effective 1/1/2012
Maryland 2014 Workers' Compensation Report Page 10 Exhibit 10
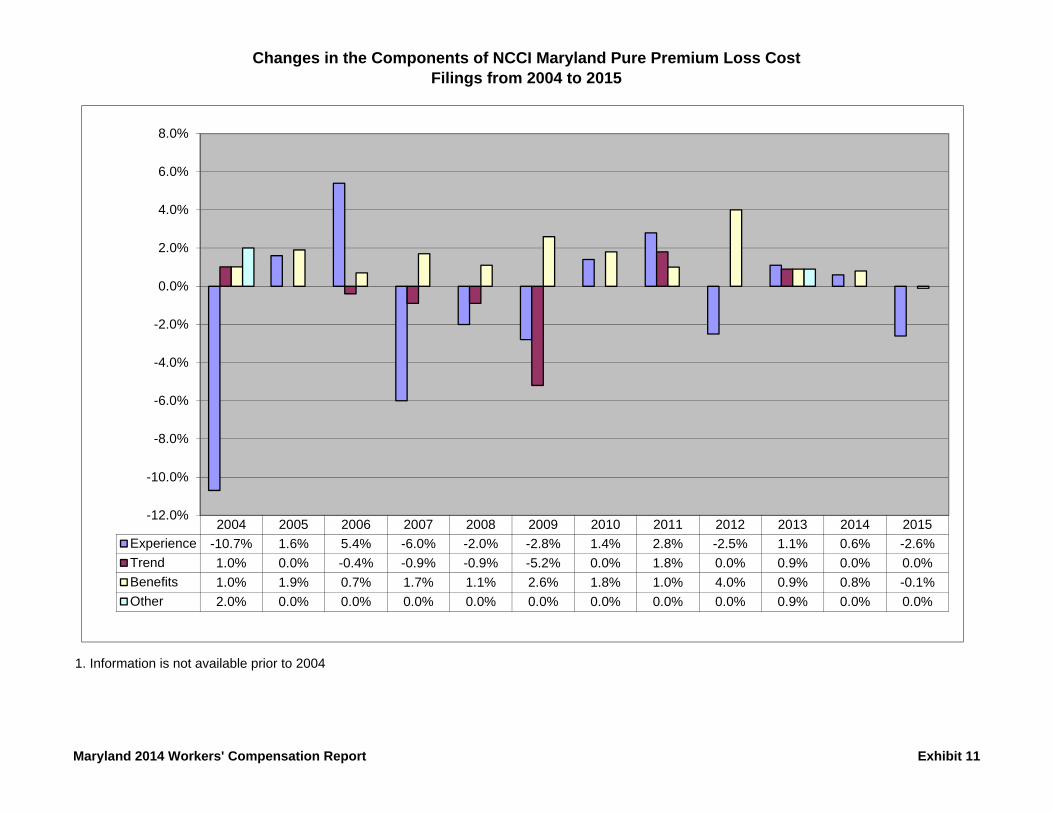
Changes in the Components of NCCI Maryland Pure Premium Loss CostFilings from 2004 to 2015
1. Information is not available prior to 2004
2004 2005 2006 2007 2008 2009 2010 2011 2012 2013 2014 2015
Experience -10.7% 1.6% 5.4% -6.0% -2.0% -2.8% 1.4% 2.8% -2.5% 1.1% 0.6% -2.6%
Trend 1.0% 0.0% -0.4% -0.9% -0.9% -5.2% 0.0% 1.8% 0.0% 0.9% 0.0% 0.0%
Benefits 1.0% 1.9% 0.7% 1.7% 1.1% 2.6% 1.8% 1.0% 4.0% 0.9% 0.8% -0.1%
Other 2.0% 0.0% 0.0% 0.0% 0.0% 0.0% 0.0% 0.0% 0.0% 0.9% 0.0% 0.0%
-12.0%
-10.0%
-8.0%
-6.0%
-4.0%
-2.0%
0.0%
2.0%
4.0%
6.0%
8.0%
Maryland 2014 Workers' Compensation Report Exhibit 11
* See Exhibit 12, Page 3 for notes.
1990 1991 1992 1993 1994 1995 1996 1998 2000 2001 2003 2004 2005 2006 2007 2008 2009 2010 2011 2012 2013 2014 2015
Cum Chg -17.5%-21.6%-17.1%-10.1% -1.8% -7.3% -19.1%-27.1%-29.5%-24.2%-23.0%-27.7%-25.2%-21.0%-25.1%-26.3%-30.3%-28.1%-24.0%-22.9%-20.0%-18.9%-21.1%
-40%
-35%
-30%
-25%
-20%
-15%
-10%
-5%
0%
Cumulative Impact of NCCI Maryland Pure Premium Loss Cost Filings for the Years 1988* through 2015
Maryland 2014 Workers' Compensation Report Page 1 Exhibit 12

* See Exhibit 12, Page 3 for notes.
1990 1991 1992 1993 1994 1995 1996 1998 2000 2001 2003 2004 2005 2006 2007 2008 2009 2010 2011 2012 2013 2014 2015
Manufacturing -15.3% -23.3% -14.8% -6.9% -0.8% -8.4% -21.2% -36.1% -32.8% -24.4% -19.0% -28.5% -27.5% -26.8% -28.2% -28.2% -27.7% -25.6% -22.7% -24.5% -21.3% -21.4% -21.7%
Contracting -15.3% -17.9% -26.6% -4.2% 12.7% 6.6% -3.9% -6.8% -5.8% -1.1% 2.4% 0.7% 1.9% 4.7% -5.0% -4.8% -11.2% -14.9% -10.0% -9.2% -5.6% -6.2% -9.3%
Office/Clerical -17.5% -21.6% -17.1% -10.1% -1.8% -8.0% -24.0% -25.5% -34.6% -24.4% -30.9% -36.5% -32.2% -25.5% -24.9% -31.6% -39.6% -36.4% -35.6% -37.2% -38.0% -39.8% -41.9%
Goods/Services -17.5% -21.6% -17.1% -10.1% -1.8% -6.4% -17.8% -28.4% -30.1% -25.4% -22.3% -27.5% -25.2% -20.1% -22.3% -22.2% -26.7% -22.6% -17.9% -15.8% -13.5% -11.2% -14.1%
Miscellaneous -17.5% -21.6% -17.1% -10.1% -1.8% -6.9% -19.8% -29.8% -37.1% -35.3% -38.0% -42.7% -37.9% -31.6% -38.7% -40.8% -40.6% -32.6% -25.6% -21.4% -13.8% -8.9% -10.1%
-50.0%
-40.0%
-30.0%
-20.0%
-10.0%
0.0%
10.0%
20.0%
Cumulative Impact of NCCI Maryland Pure Premium Loss Cost Changes by Industry Group from 1988* through 2015
Maryland 2014 Workers' Compensation Report Page 2 Exhibit 12
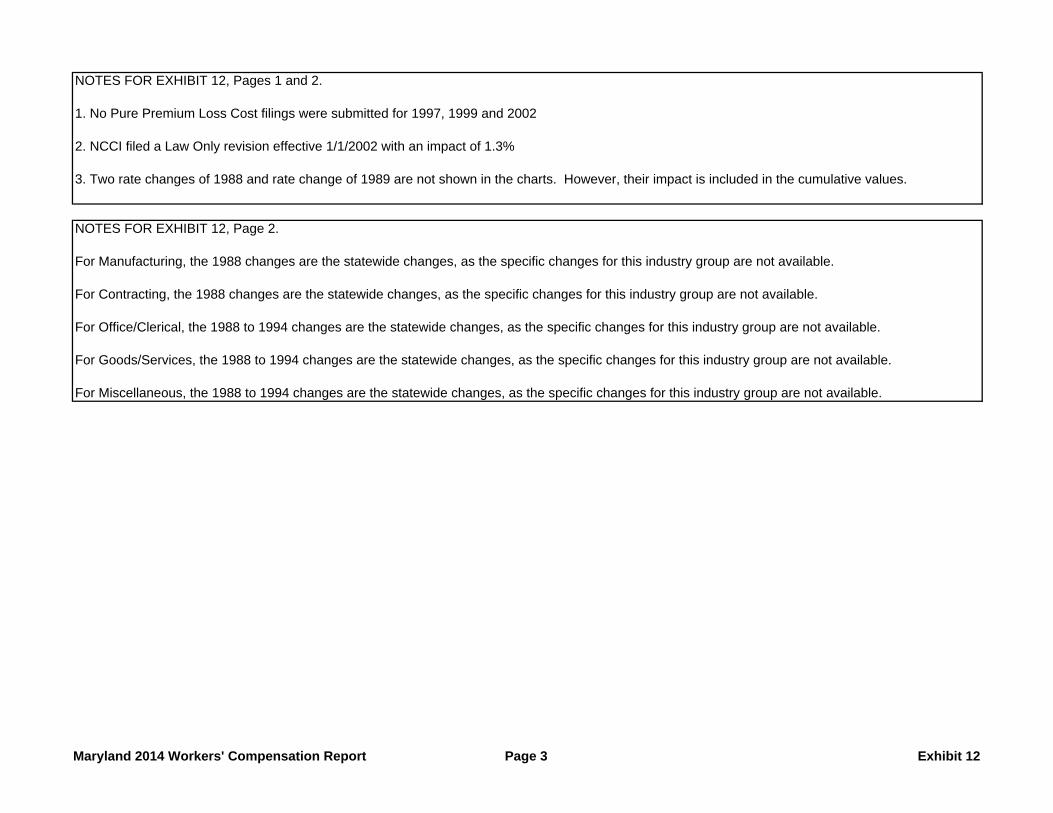
NOTES FOR EXHIBIT 12, Pages 1 and 2.
1. No Pure Premium Loss Cost filings were submitted for 1997, 1999 and 2002
2. NCCI filed a Law Only revision effective 1/1/2002 with an impact of 1.3%
3. Two rate changes of 1988 and rate change of 1989 are not shown in the charts. However, their impact is included in the cumulative values.
NOTES FOR EXHIBIT 12, Page 2.
For Manufacturing, the 1988 changes are the statewide changes, as the specific changes for this industry group are not available.
For Contracting, the 1988 changes are the statewide changes, as the specific changes for this industry group are not available.
For Office/Clerical, the 1988 to 1994 changes are the statewide changes, as the specific changes for this industry group are not available.
For Goods/Services, the 1988 to 1994 changes are the statewide changes, as the specific changes for this industry group are not available.
For Miscellaneous, the 1988 to 1994 changes are the statewide changes, as the specific changes for this industry group are not available.
Maryland 2014 Workers' Compensation Report Page 3 Exhibit 12


