44
2014 National Survey of Technology, Policy and Strategic Issues www.technologycouncils.org © 2014 Technology Councils of North America. All rights reserved.
| Date post: | 16-Jul-2015 |
| Category: |
Technology |
| Upload: | tecna-technology-councils-of-north-america |
| View: | 832 times |
| Download: | 0 times |

2014 National Survey
of Technology, Policy
and Strategic Issues
ww
w.te
ch
no
log
yc
ou
nc
ils.o
rg
© 2014 Technology Councils of North America. All rights reserved.

About TECNA | CompTIA | TechAmerica
About TECNAThe Technology Councils of North America (TECNA) represents almost 50+ IT and Technology trade organizations who, in turn, represent more than 22,000 technology-related companies in North America. TECNA serves its members and the industry through its strong peer-to-peer network and its regional initiatives to raise the visibility and viability of the technology industry.
About CompTIACompTIA is the voice of the world’s information technology (IT) industry. Its members are the companies at the forefront of innovation; and the professionals responsible for maximizing the benefits organizations receive from their investments in technology. CompTIA is dedicated to advancing industry growth through its educational programs, market research, networking events, professional certifications, and public policy advocacy.
TechAmerica is the public sector and public policy department of CompTIA, advocating before decision-makers at the state, federal and international levels of government. Representing technology companies of all sizes, TechAmerica is committed to expanding market opportunities and driving the competitiveness of the U.S. technology industry around the world.

About This Research
The data for this quantitative study was collected via an online survey conducted during October 2014. A total of 1,561 senior (C-level) U.S. IT and business executives belonging to one of the regional technology associations affiliated with the Technology Councils of North America (TECNA) participated in the survey.
The margin of sampling error at the 95% confidence level for the overall results is +/- 2.53 percentage points. Sampling error is larger for subgroups of the data, such as region or company size.
As with any survey, sampling error is only one source of possible error. While non-sampling error cannot be accurately calculated, precautionary steps were taken in all phases of the survey design, collection and processing of the data to minimize its influence.
The study was conducted in conjunction with the Computing Technology Industry Association (CompTIA), with data collection support from Decipher, Inc.
CompTIA is a member of the Market Research Association (MRA) and adheres to its guidelines for research best practices and ethics. Any questions about the research methodology or data collection can be directed to [email protected].
For questions or issues related to TECNA, contact TECNA’s executive director Bob Moore, [email protected].
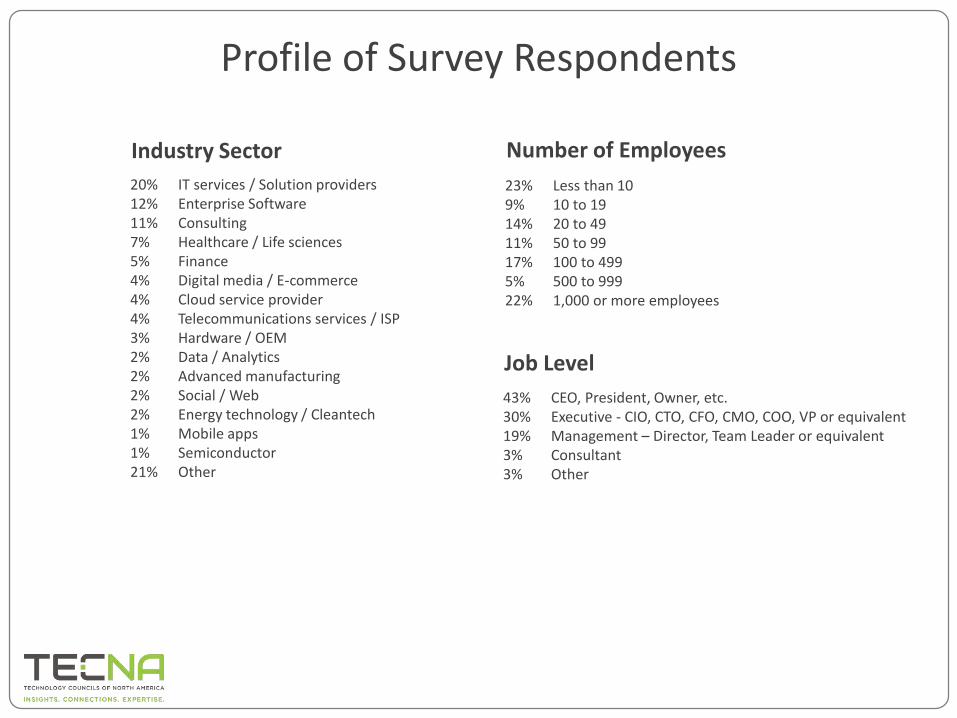
Profile of Survey Respondents
Industry Sector Number of Employees
Job Level
23% Less than 109% 10 to 1914% 20 to 4911% 50 to 9917% 100 to 4995% 500 to 99922% 1,000 or more employees
43% CEO, President, Owner, etc.30% Executive - CIO, CTO, CFO, CMO, COO, VP or equivalent19% Management – Director, Team Leader or equivalent3% Consultant3% Other
20% IT services / Solution providers12% Enterprise Software11% Consulting7% Healthcare / Life sciences5% Finance4% Digital media / E-commerce4% Cloud service provider4% Telecommunications services / ISP3% Hardware / OEM2% Data / Analytics2% Advanced manufacturing 2% Social / Web2% Energy technology / Cleantech1% Mobile apps1% Semiconductor21% Other
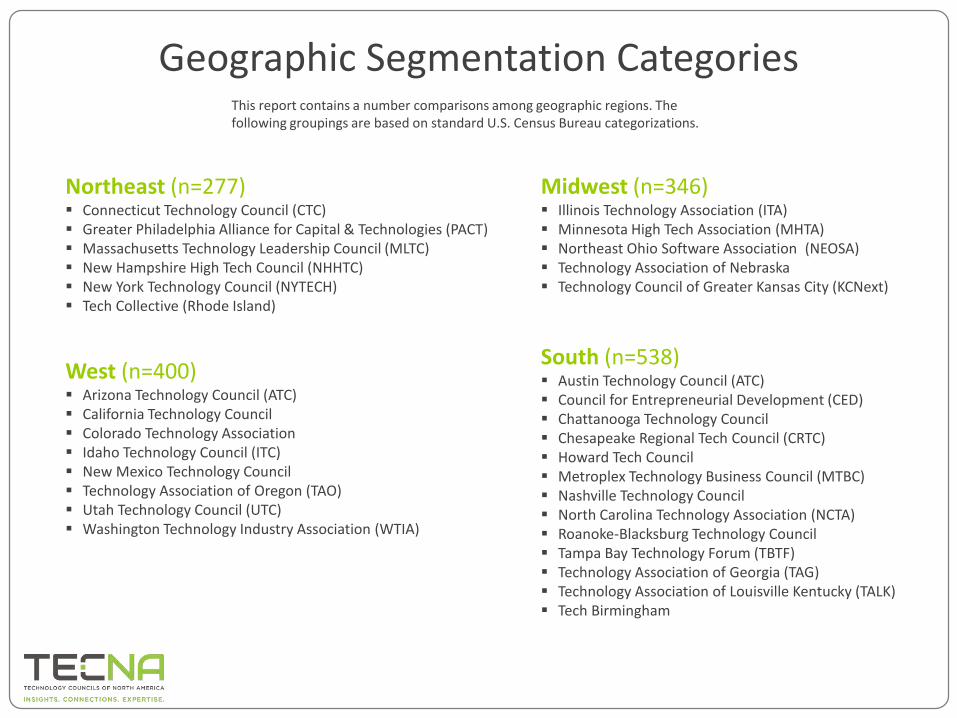
Geographic Segmentation Categories
Northeast (n=277) Connecticut Technology Council (CTC) Greater Philadelphia Alliance for Capital & Technologies (PACT) Massachusetts Technology Leadership Council (MLTC) New Hampshire High Tech Council (NHHTC) New York Technology Council (NYTECH) Tech Collective (Rhode Island)
South (n=538) Austin Technology Council (ATC) Council for Entrepreneurial Development (CED) Chattanooga Technology Council Chesapeake Regional Tech Council (CRTC) Howard Tech Council Metroplex Technology Business Council (MTBC) Nashville Technology Council North Carolina Technology Association (NCTA) Roanoke-Blacksburg Technology Council Tampa Bay Technology Forum (TBTF) Technology Association of Georgia (TAG) Technology Association of Louisville Kentucky (TALK) Tech Birmingham
This report contains a number comparisons among geographic regions. The following groupings are based on standard U.S. Census Bureau categorizations.
Midwest (n=346) Illinois Technology Association (ITA) Minnesota High Tech Association (MHTA) Northeast Ohio Software Association (NEOSA) Technology Association of Nebraska Technology Council of Greater Kansas City (KCNext)
West (n=400) Arizona Technology Council (ATC) California Technology Council Colorado Technology Association Idaho Technology Council (ITC) New Mexico Technology Council Technology Association of Oregon (TAO) Utah Technology Council (UTC) Washington Technology Industry Association (WTIA)

Key Findings- The 2014 TECNA National Survey of Technology, Policy and Strategic Issues reveals positives on a number of fronts. Measures of business
sentiment improved across-the-board, continuing the upward sloping trend since 2012. The rating of the overall U.S. economy increased the most year-over-year (6.8 percentage points), significantly closing the gap with the tech sector, which continues to out-perform. The rating of the tech sector improved 5.9 points to 71.9 on a 100-point scale. The self-assessment portion of the business sentiment rating improved a modest 3.4 points to 72.2, but overall, executives express the most confidence in their own company’s position. At a macro regional level, few differences in the ratings exist, although differences do emerge at the individual state level. For the tech sector rating, the Midwest region experienced the most improvement, jumping from most bearish in 2012 to most bullish in 2014.
- Looking ahead over the next two quarters, 41% of executives expect further improvement in the U.S. economy. In contrast, only 22% project a strengthening global economy. A slightly greater number (25%) actually expect the global economy to deteriorate over this period. This likely reflects concerns over the continued sluggishness in the Euro Area, some slowing in key emerging markets and the general uncertainty of international conflicts. Nearly half of respondents expect improvement in the tech sector, while a nearly equal number expects the sector to maintain its position. With many sectors of national and global economies moving in lock-step, out-performing the mean, which has been the case with the tech sector the past few years, is especially notable. Interestingly, the smallest of companies in this study – those in the under 10 employee range and those in the 10-99 range, have slightly more positive outlooks than larger firms. This may be a function of smaller firms operating primarily regionally versus larger firms that may be more reliant on overseas revenue streams and therefore more exposed to any softening in the global economy.
- Positive business sentiment is often a useful directional guide because of the actions it may foretell. For example, consistent with the improvements in the sentiment measures, approximately 6 in 10 executives plan to increase their investments in new products or business lines at their company. Additionally, 52% plan to spend more on technology and 34% plan to make general capital expenditures. Business travel is an oft-used proxy for business health. Fifty-one percent of TECNA executives, up from 37% in 2013, expect to increase their level of business travel, suggesting more customer visits, meetings, trips to conferences and related.
- While sentiment is generally positive, executives recognize the many factors that can quickly derail growth. Topping the list this year is the concern over the umbrella category of talent shortages, labor prices and employee churn. Concern jumped 13 points from 34% in 2013 to 47% in 2014. In an industry marked by disruption and commoditization, downward pressure on pricing and lower margins areperennial concerns. Thirty-eight percent of executives rated that as a key concern. On a positive note, the data suggests an improving landscape for access to credit and capital. Concern fell from 36% in 2012, to 29% in 2013 and 23% in 2014. Of course, access to credit and capital is heavily dependent on company size and very small firms continue to face challenges in this area.

Key Findings Continued- As noted previously, shortages of talent, labor inflation and employee churn rank as top concerns among tech sector executives. To
further quantify this concern, a NET 74% indicates there is a significant or moderate shortage in the quality of workers in their state or region. A near equal number – 76%, indicates there is a quantity shortage. Relatively few believe the labor market in the tech sector is in equilibrium, meaning the supply of labor roughly equals demand. Executives in the West region rate the shortage as most severe, while executives in the Northeast relatively less so.
- With an unemployment rate well under the national rate, computer, software and related tech jobs have experienced strong demand over the past few years. The tech sector, as the largest employer of these positions, will likely keep the momentum going. According to the TECNA study, 63% of executives report a planned increase in headcount due to newly created positions. Another 34% are in theprocess of back-filling openings for existing positions. Both rates are on par with 2013. A NET 15% of executives expect layoffs, stemming from either the permanent elimination of certain positions or layoffs associated with weak sales or business cycle issues. Small (10-99 employees) and medium-size (100-499) companies voice the strongest commitment to expanding their workforces as a result of expansion and newly created positions. In contrast, large companies are most likely to be in a position of back-filling openings. The TECNA research highlights the predicament many companies find themselves in: demand for labor (aka job openings) not aligned with the supply for labor (aka pool of qualified candidates). The study did not go into detail on the specifics on the positions where the disconnect is greatest, but generally, it parallels innovation and growth areas: cybersecurity, cloud, big data, mobility, business process automation and so forth.
- Public policy and technology increasingly intersect. As technology affects more areas of the economy on more levels, touch points with the policy arena become inescapable. Moreover, the pace of innovation continues to accelerate, widening the gap between the deployment of technology and the rate at which policies and regulations can keep up. At a Federal level, TECNA executives see few positives. Only 15% (net) rate the Federal government as doing a good job in supporting the interests of the tech sector. State and local governments fair slightly better, with 37% rating their performance as it relates to supporting the tech sector as well or very well. It is unclear from the results if the ratings reflect disappointment over specific actions or inactions, or if it is more a general expression of frustration over gridlock and dysfunction. Another contributing factor may be the belief held by many TECNA executives that their region is under-performing its potential. Executives may see opportunities to grow the tech sector in their region, contingent on a coordinated policy effort to overcome hurdles such as workforce issues, regulatory uncertainty, tax code complexity, or infrastructure inadequacies.
- The sectors TECNA executives expect to drive growth in the short-term include: software/apps, life sciences/healthcare tech, data/analytics, IT services and cloud computing/data center. Although relatively low in the ratings, the growth driver with the largest percent change over the next two years is energy technology/cleantech.

Assessment of Business Conditions and the Economy
Section 1

46.3 46.3
62.1
66.4
50.8
56.4
66.068.8
54.6
63.2
71.9 72.2
Global EconomyRating
U.S. EconomyRating
Tech Sector Rating
Company Self-Assessment Rating
2012 2013 2014
Source: TECNABase: 1,561 senior U.S. technology and business executives
Business Sentiment Continues to Trend UpwardRating on a 100-point scale

53.0
61.5
69.6 69.9
55.4
63.3
72.9 72.9
55.4
64.4
72.4 71.7
54.0
62.8
72.173.7
Global Economy…
U.S.Economy…
Tech Sector…
Company Self-Assessment…
Northeast
Midwest
South
West
Business Sentiment Segmentation: Regional Ratings
Source: TECNABase: 1,561 senior U.S. technology and business executives
Northeast=277, Midwest=346, South=538, West=400
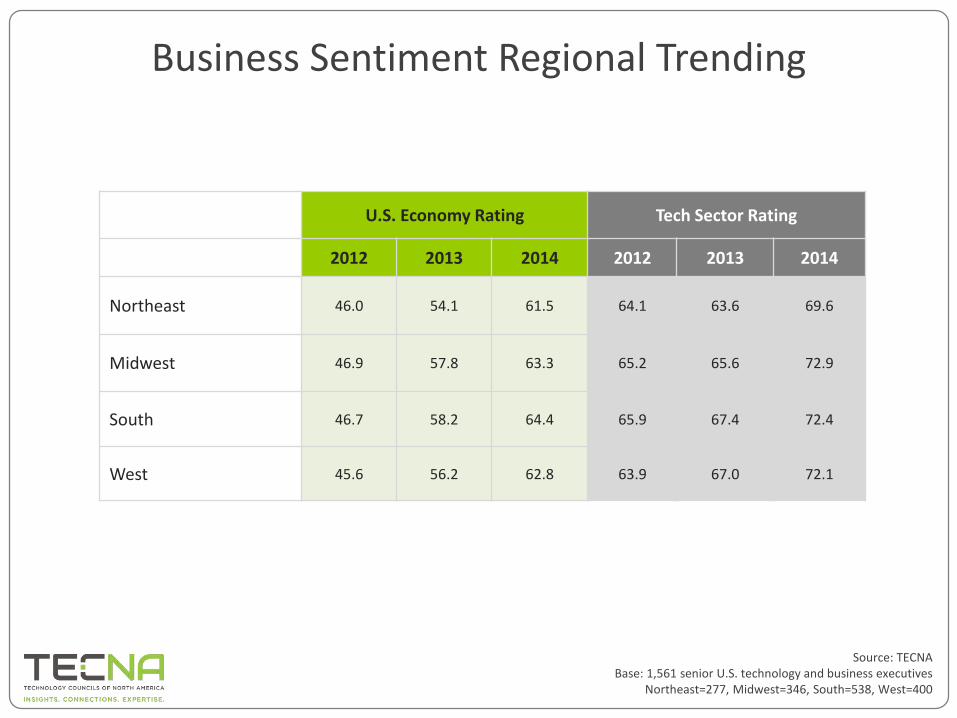
Business Sentiment Regional Trending
U.S. Economy Rating Tech Sector Rating
2012 2013 2014 2012 2013 2014
Northeast 46.0 54.1 61.5 64.1 63.6 69.6
Midwest 46.9 57.8 63.3 65.2 65.6 72.9
South 46.7 58.2 64.4 65.9 67.4 72.4
West 45.6 56.2 62.8 63.9 67.0 72.1
Source: TECNABase: 1,561 senior U.S. technology and business executives
Northeast=277, Midwest=346, South=538, West=400
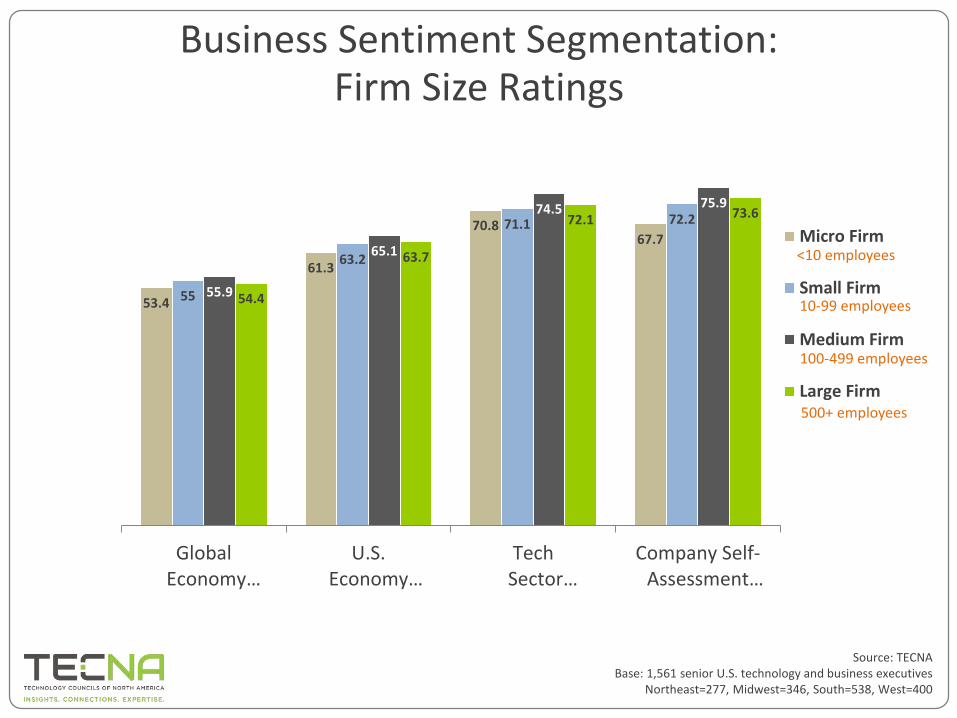
53.4
61.3
70.867.7
55
63.2
71.1 72.2
55.9
65.1
74.5 75.9
54.4
63.7
72.1 73.6
Global Economy…
U.S.Economy…
Tech Sector…
Company Self-Assessment…
Micro Firm
Small Firm
Medium Firm
Large Firm
Business Sentiment Segmentation: Firm Size Ratings
<10 employees
10-99 employees
100-499 employees
500+ employees
Source: TECNABase: 1,561 senior U.S. technology and business executives
Northeast=277, Midwest=346, South=538, West=400
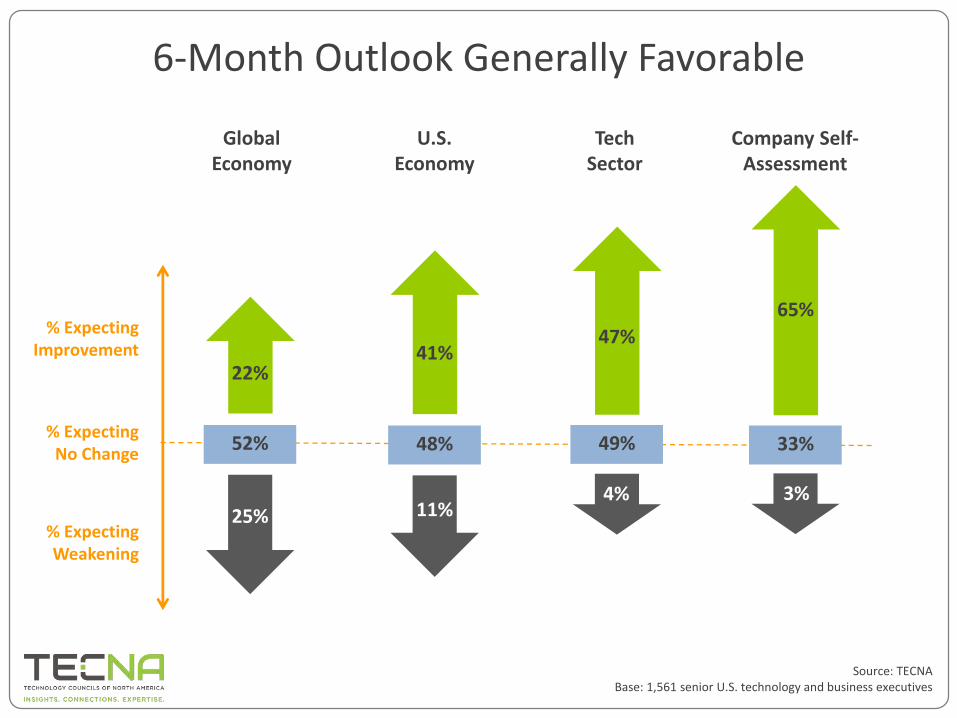
6-Month Outlook Generally Favorable
Global Economy
U.S. Economy
Tech Sector
Company Self-Assessment
22%
52%
25%
41%
48%
11%
47%
49%
4%
65%
33%
3%
% Expecting Improvement
% Expecting Weakening
% Expecting No Change
Source: TECNABase: 1,561 senior U.S. technology and business executives

21%
42%
46%
64%
25%
38%
46%
58%
23%
44%
48%
67%
21%
40%
50%
68%
Global Economy…
U.S.Economy…
Tech Sector…
Company Self-Assessment…
Northeast
Midwest
South
West
6-Month Outlook Segmentation: Regional Expectations for Improvement
Source: TECNABase: 1,561 senior U.S. technology and business executives
Northeast=277, Midwest=346, South=538, West=400

21%
41%
49%
70%
24%
41%
48%
70%
21%
40%
46%
64%
22%
42%45%
54%
Global Economy…
U.S.Economy…
Tech Sector…
Company Self-Assessment…
Micro Firm
Small Firm
Medium Firm
Large Firm
6-Month Outlook Segmentation: Firm Size Expectations for Improvement
<10 employees
10-99 employees
100-499 employees
500+ employees
Source: TECNABase: 1,561 senior U.S. technology and business executives
Micro=352, Small=515, Medium=269, Large=424
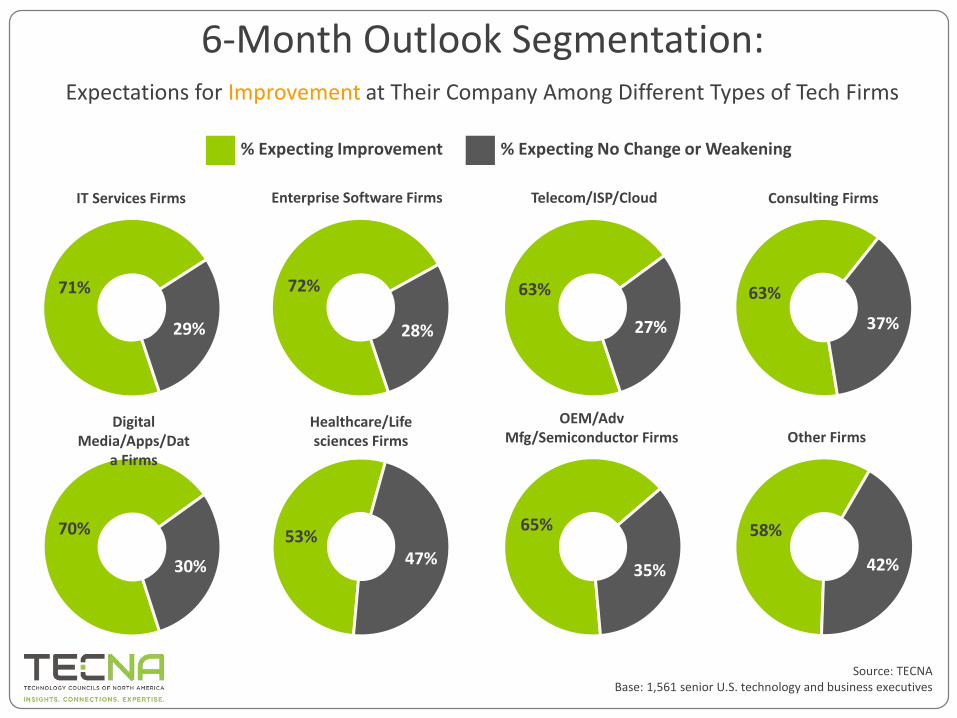
63%
27%
63%
37%
70%
30%
53%47%
65%
35%
58%
42%
6-Month Outlook Segmentation: Expectations for Improvement at Their Company Among Different Types of Tech Firms
71%
29%
IT Services Firms Enterprise Software Firms Telecom/ISP/Cloud Consulting Firms
Digital Media/Apps/Dat
a Firms
Healthcare/Life sciences Firms
OEM/AdvMfg/Semiconductor Firms Other Firms
72%
28%
% Expecting Improvement % Expecting No Change or Weakening
Source: TECNABase: 1,561 senior U.S. technology and business executives

Business Investment Drivers and Factors that Could Slow Growth
Section 2
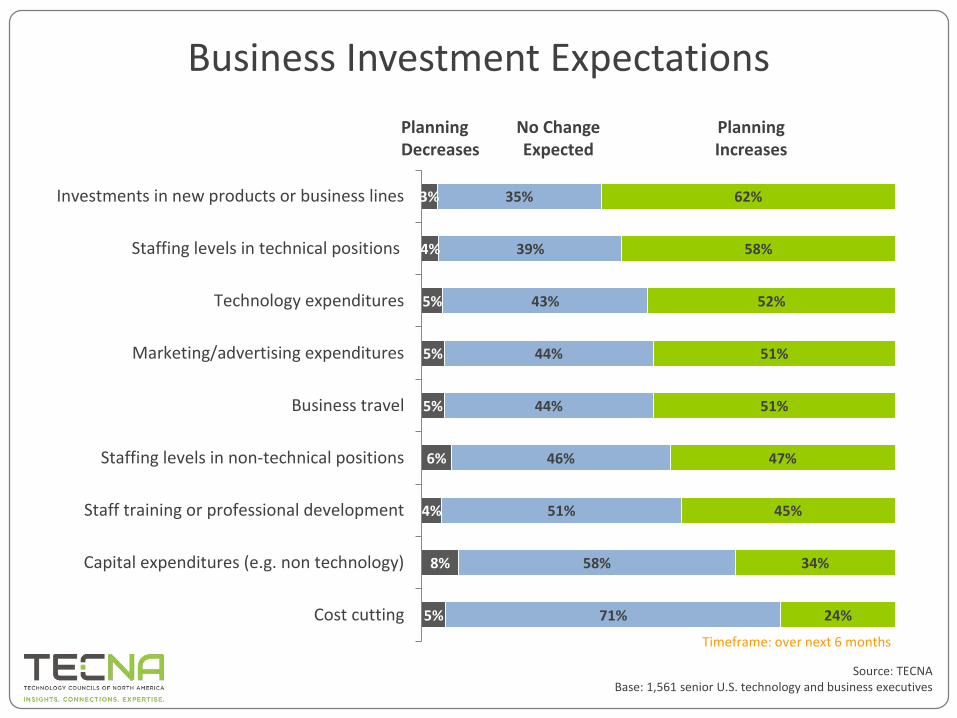
5%
8%
4%
6%
5%
5%
5%
4%
3%
71%
58%
51%
46%
44%
44%
43%
39%
35%
24%
34%
45%
47%
51%
51%
52%
58%
62%
Cost cutting
Capital expenditures (e.g. non technology)
Staff training or professional development
Staffing levels in non-technical positions
Business travel
Marketing/advertising expenditures
Technology expenditures
Staffing levels in technical positions
Investments in new products or business lines
Business Investment Expectations
Timeframe: over next 6 months
Planning Increases
Planning Decreases
No Change Expected
Source: TECNABase: 1,561 senior U.S. technology and business executives
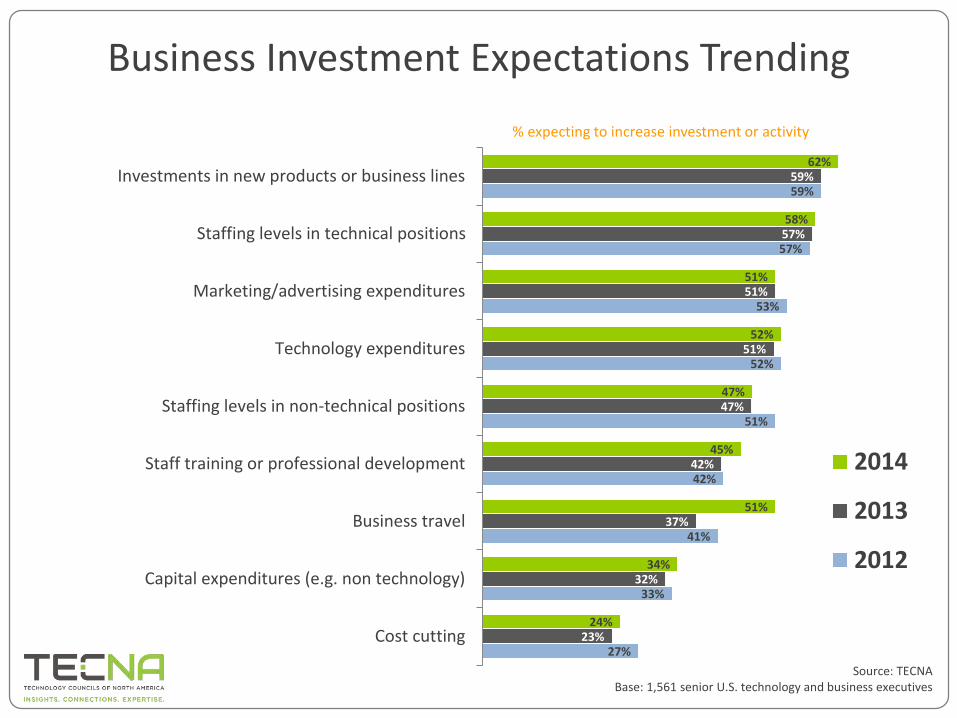
Business Investment Expectations Trending
27%
33%
41%
42%
51%
52%
53%
57%
59%
23%
32%
37%
42%
47%
51%
51%
57%
59%
24%
34%
51%
45%
47%
52%
51%
58%
62%
Cost cutting
Capital expenditures (e.g. non technology)
Business travel
Staff training or professional development
Staffing levels in non-technical positions
Technology expenditures
Marketing/advertising expenditures
Staffing levels in technical positions
Investments in new products or business lines
2014
2013
2012
% expecting to increase investment or activity
Source: TECNABase: 1,561 senior U.S. technology and business executives
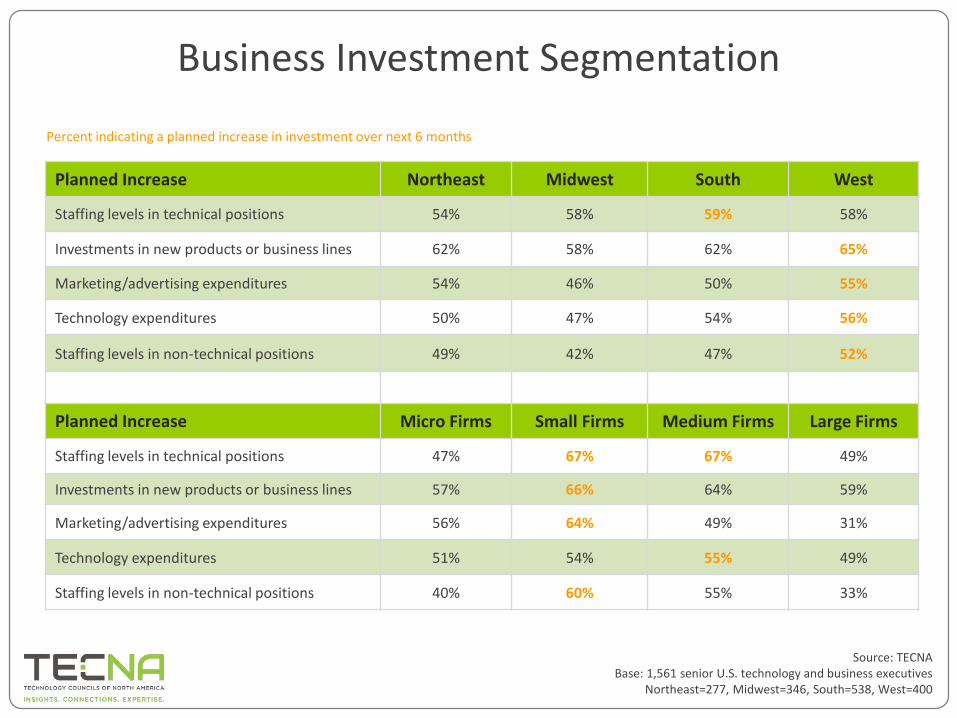
Business Investment Segmentation
Planned Increase Northeast Midwest South West
Staffing levels in technical positions 54% 58% 59% 58%
Investments in new products or business lines 62% 58% 62% 65%
Marketing/advertising expenditures 54% 46% 50% 55%
Technology expenditures 50% 47% 54% 56%
Staffing levels in non-technical positions 49% 42% 47% 52%
Planned Increase Micro Firms Small Firms Medium Firms Large Firms
Staffing levels in technical positions 47% 67% 67% 49%
Investments in new products or business lines 57% 66% 64% 59%
Marketing/advertising expenditures 56% 64% 49% 31%
Technology expenditures 51% 54% 55% 49%
Staffing levels in non-technical positions 40% 60% 55% 33%
Percent indicating a planned increase in investment over next 6 months
Source: TECNABase: 1,561 senior U.S. technology and business executives
Northeast=277, Midwest=346, South=538, West=400
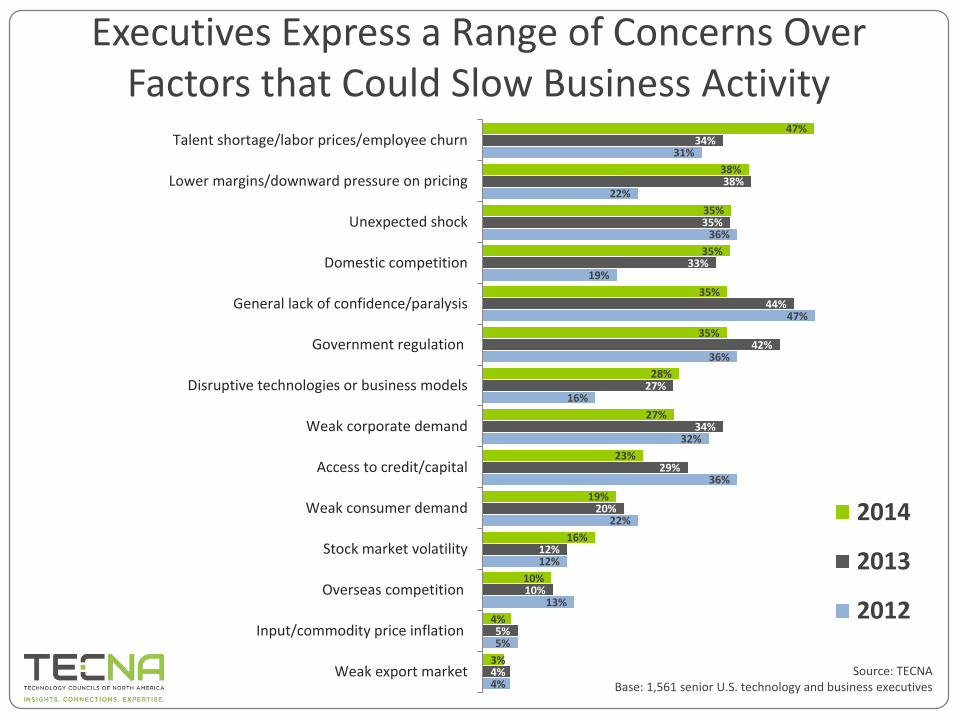
Executives Express a Range of Concerns Over Factors that Could Slow Business Activity
4%
5%
13%
12%
22%
36%
32%
16%
36%
47%
19%
36%
22%
31%
4%
5%
10%
12%
20%
29%
34%
27%
42%
44%
33%
35%
38%
34%
3%
4%
10%
16%
19%
23%
27%
28%
35%
35%
35%
35%
38%
47%
Weak export market
Input/commodity price inflation
Overseas competition
Stock market volatility
Weak consumer demand
Access to credit/capital
Weak corporate demand
Disruptive technologies or business models
Government regulation
General lack of confidence/paralysis
Domestic competition
Unexpected shock
Lower margins/downward pressure on pricing
Talent shortage/labor prices/employee churn
2014
2013
2012
Source: TECNABase: 1,561 senior U.S. technology and business executives

Growth Inhibitors Segmentation
Planned Increase Northeast Midwest South West
Talent shortage/employee retention/workforce 42% 50% 45% 50%
Lower margins/downward pressure on pricing 36% 36% 40% 37%
Government regulation 32% 32% 37% 35%
Disruptive technologies/business models 27% 30% 28% 26%
Access to credit/capital 27% 15% 22% 27%
Planned Increase Micro Firms Small Firms Medium Firms Large Firms
Talent shortage/employee retention/workforce 28% 53% 59% 47%
Lower margins/downward pressure on pricing 26% 35% 43% 47%
Government regulation 33% 30% 30% 43%
Disruptive technologies/business models 18% 25% 34% 35%
Access to credit/capital 39% 29% 13% 8%
Percent indicating a planned INCREASE in investment over next 6 months
Source: TECNABase: 1,561 senior U.S. technology and business executives

Workforce Issues
Section 3
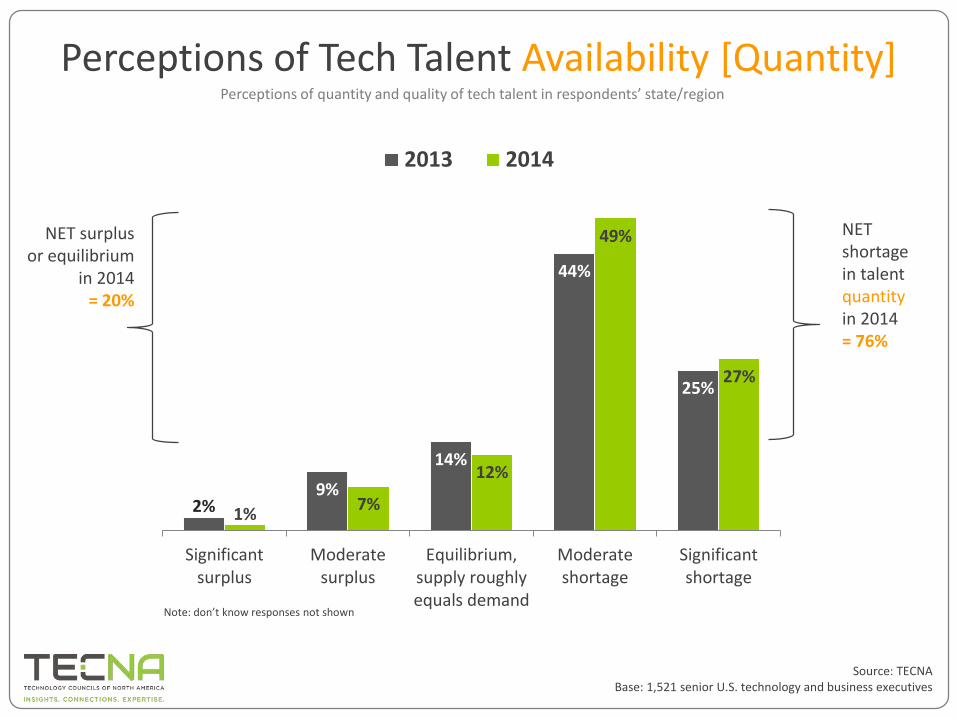
Perceptions of Tech Talent Availability [Quantity]
2%9%
14%
44%
25%
1%7%
12%
49%
27%
Significantsurplus
Moderatesurplus
Equilibrium,supply roughlyequals demand
Moderateshortage
Significantshortage
2013 2014
NET shortage in talent quantityin 2014= 76%
NET surplus or equilibrium
in 2014 = 20%
Perceptions of quantity and quality of tech talent in respondents’ state/region
Note: don’t know responses not shown
Source: TECNABase: 1,521 senior U.S. technology and business executives

Perceptions of Tech Talent Quality
1%7%
15%
51%
23%
Significantsurplus
Moderatesurplus
Equilibrium,supply roughlyequals demand
Moderateshortage
Significantshortage
NET shortage of quality talent in 2014= 74%
NET surplus or equilibrium
in 2014 = 23%
Note: don’t know responses not shown
Perceptions of quantity and quality of tech talent in respondents’ state/region | quality was not addressed in the 2013 survey
Source: TECNABase: 1,521 senior U.S. technology and business executives
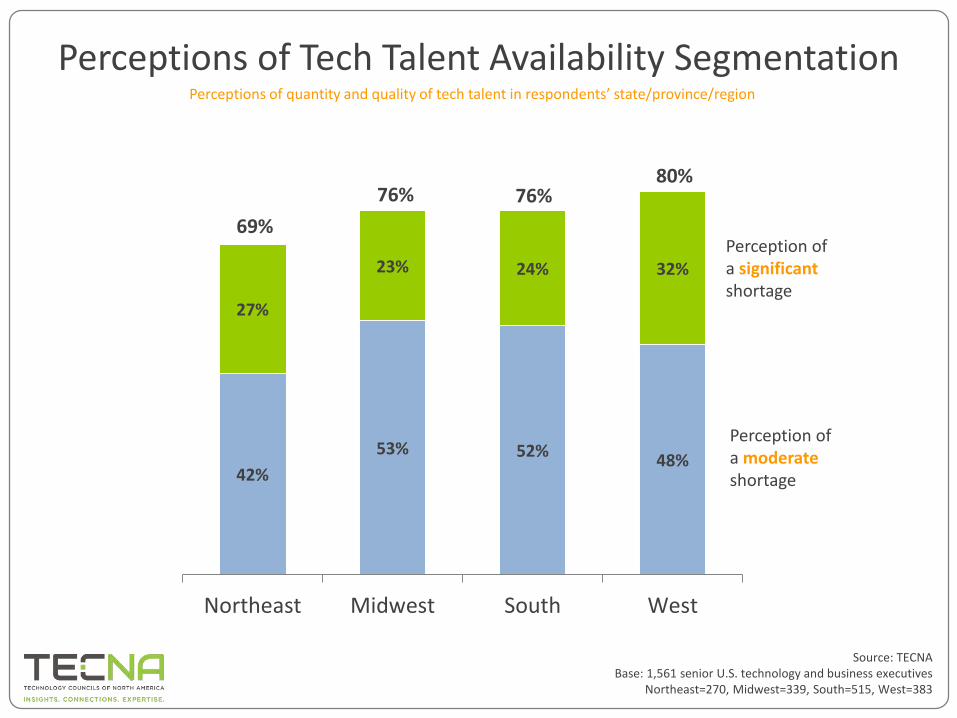
Perceptions of Tech Talent Availability Segmentation
42%
53% 52%48%
27%
23% 24% 32%
Northeast Midwest South West
69%
76% 76%80%
Perception of a significantshortage
Perception of a moderateshortage
Perceptions of quantity and quality of tech talent in respondents’ state/province/region
Source: TECNABase: 1,561 senior U.S. technology and business executives
Northeast=270, Midwest=339, South=515, West=383

Perceptions of Tech Talent Availability Segmentation
47%
43%
50%
57%
54%
45%
51%
49%
23%
15%
20%
20%
25%
33%
33%
34%
Other types of firms
OEM/Adv Mfg/Semiconductor firms
Healthcare/Life sciences firms
Telecom/ISP/Cloud firms
Digital Media/Apps/Data firms
Consulting firms
IT Services firms
Enterprise Software firms 84%
Perception of a significant shortage
Perception of a moderate shortage
84%
NET shortage
77%
79%
77%
70%
59%
70%
Source: TECNABase: 1,521 senior U.S. technology and business executives
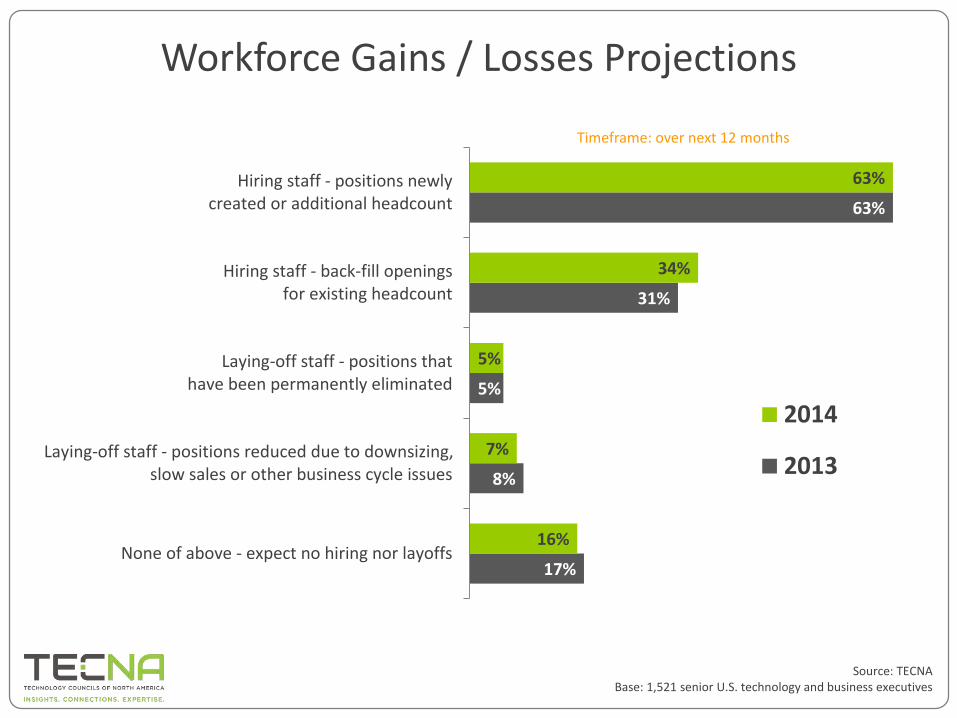
Workforce Gains / Losses Projections
17%
8%
5%
31%
63%
16%
7%
5%
34%
63%
None of above - expect no hiring nor layoffs
Laying-off staff - positions reduced due to downsizing, slow sales or other business cycle issues
Laying-off staff - positions that have been permanently eliminated
Hiring staff - back-fill openings for existing headcount
Hiring staff - positions newly created or additional headcount
2014
2013
Timeframe: over next 12 months
Source: TECNABase: 1,521 senior U.S. technology and business executives
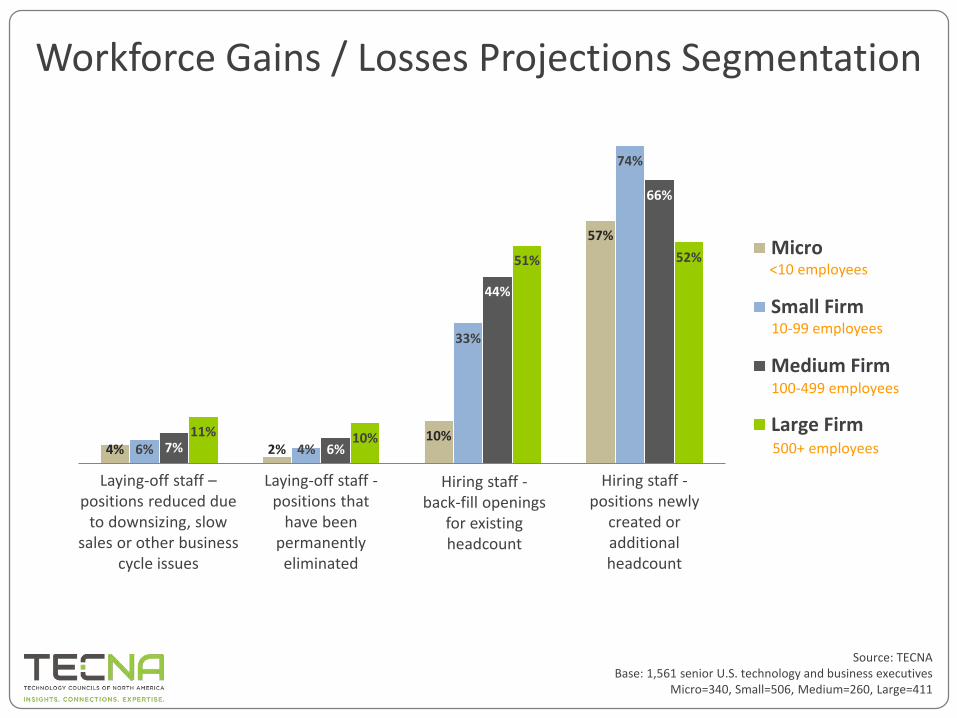
Workforce Gains / Losses Projections Segmentation
4% 2%10%
57%
6% 4%
33%
74%
7% 6%
44%
66%
11% 10%
51% 52%Micro
Small Firm
Medium Firm
Large Firm
<10 employees
10-99 employees
100-499 employees
500+ employees
Hiring staff -positions newly
created or additional headcount
Hiring staff -back-fill openings
for existing headcount
Laying-off staff -positions that
have been permanently eliminated
Laying-off staff –positions reduced due
to downsizing, slow sales or other business
cycle issues
Source: TECNABase: 1,561 senior U.S. technology and business executives
Micro=340, Small=506, Medium=260, Large=411
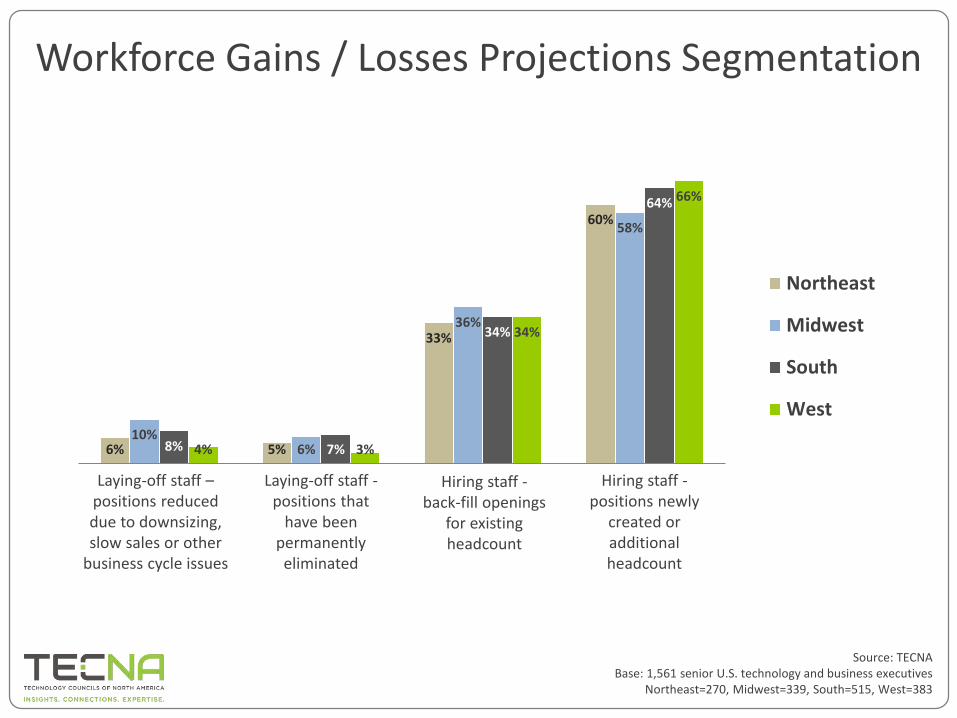
Workforce Gains / Losses Projections Segmentation
6% 5%
33%
60%
10%6%
36%
58%
8% 7%
34%
64%
4% 3%
34%
66%
Northeast
Midwest
South
West
Hiring staff -positions newly
created or additional headcount
Hiring staff -back-fill openings
for existing headcount
Laying-off staff -positions that
have been permanently eliminated
Laying-off staff –positions reduced due to downsizing, slow sales or other
business cycle issues
Source: TECNABase: 1,561 senior U.S. technology and business executives
Northeast=270, Midwest=339, South=515, West=383

Public Policy Issues
Section 4

15%
30%
41%
12%
1%
15%
30%
41%
14%
1%
Verypoorly
Poorly Justokay
Well Verywell
2013 2014
9%
16%
38%
28%
8%7%
17%
39%
29%
8%
Verypoorly
Poorly Justokay
Well Verywell
2013 2014
Rating of Federal Government Rating of State/Local Government
Rating of How Well Government Representsthe Interests of the Tech Sector
Source: TECNABase: 1,500 senior U.S. technology and business executives
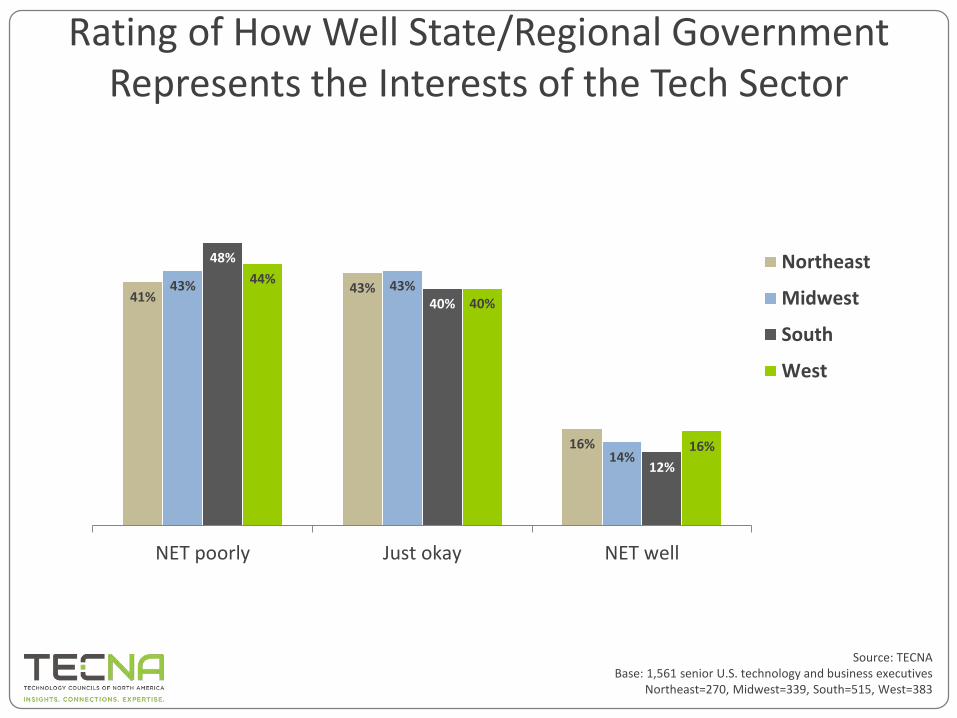
Rating of How Well State/Regional Government Represents the Interests of the Tech Sector
41%43%
16%
43% 43%
14%
48%
40%
12%
44%
40%
16%
NET poorly Just okay NET well
Northeast
Midwest
South
West
Source: TECNABase: 1,561 senior U.S. technology and business executives
Northeast=270, Midwest=339, South=515, West=383
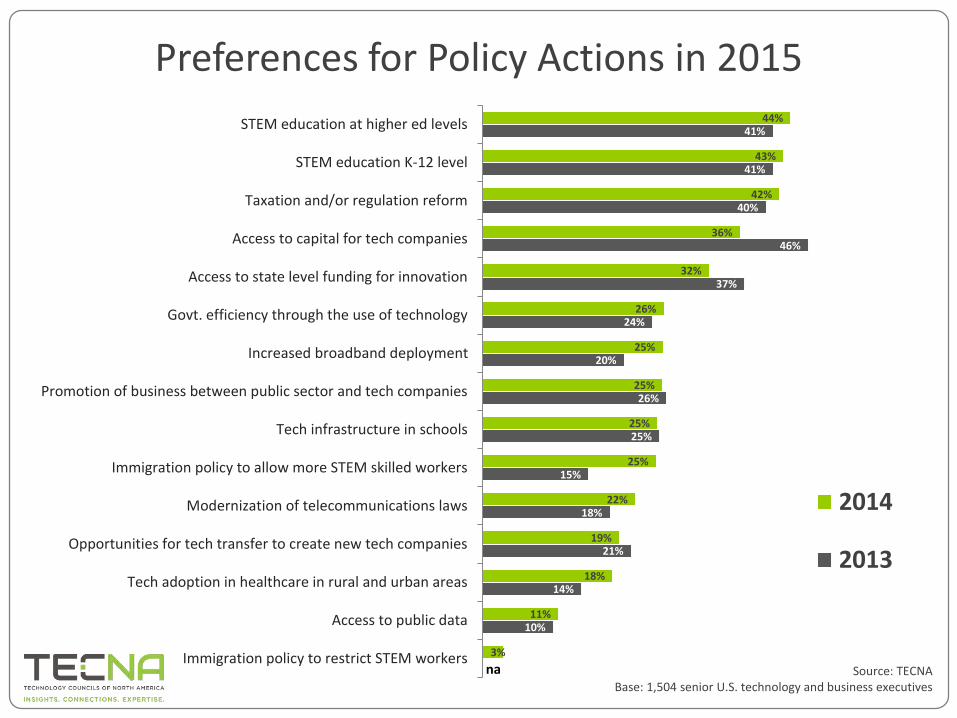
Preferences for Policy Actions in 2015
10%
14%
21%
18%
15%
25%
26%
20%
24%
37%
46%
40%
41%
41%
3%
11%
18%
19%
22%
25%
25%
25%
25%
26%
32%
36%
42%
43%
44%
Immigration policy to restrict STEM workers
Access to public data
Tech adoption in healthcare in rural and urban areas
Opportunities for tech transfer to create new tech companies
Modernization of telecommunications laws
Immigration policy to allow more STEM skilled workers
Tech infrastructure in schools
Promotion of business between public sector and tech companies
Increased broadband deployment
Govt. efficiency through the use of technology
Access to state level funding for innovation
Access to capital for tech companies
Taxation and/or regulation reform
STEM education K-12 level
STEM education at higher ed levels
2014
2013
na Source: TECNABase: 1,504 senior U.S. technology and business executives
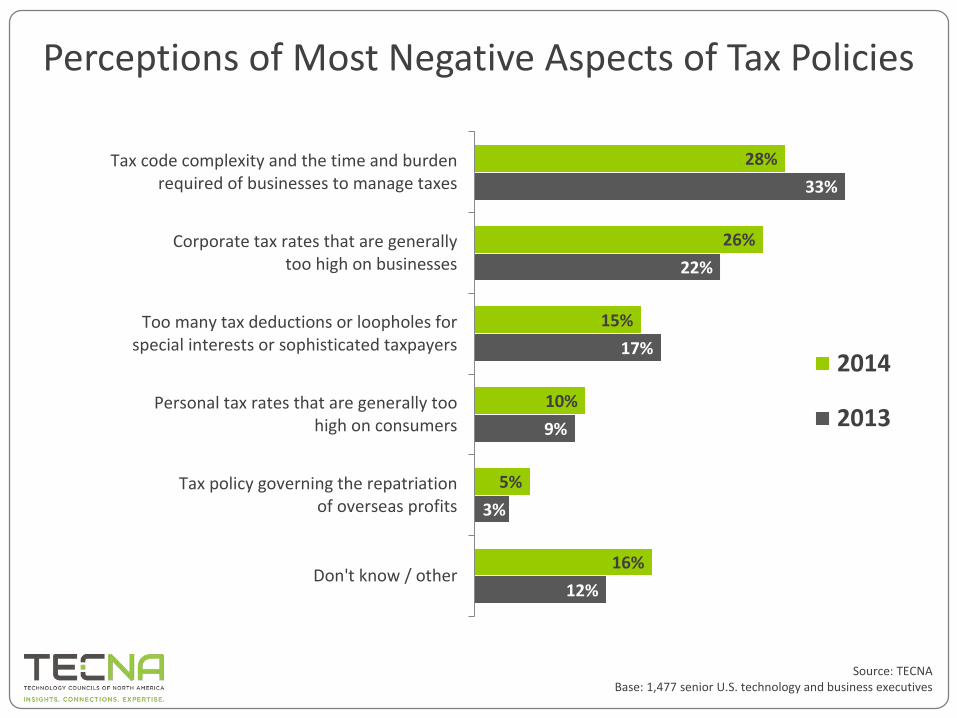
Perceptions of Most Negative Aspects of Tax Policies
12%
3%
9%
17%
22%
33%
16%
5%
10%
15%
26%
28%
Don't know / other
Tax policy governing the repatriation of overseas profits
Personal tax rates that are generally too high on consumers
Too many tax deductions or loopholes for special interests or sophisticated taxpayers
Corporate tax rates that are generally too high on businesses
Tax code complexity and the time and burden required of businesses to manage taxes
2014
2013
Source: TECNABase: 1,477 senior U.S. technology and business executives
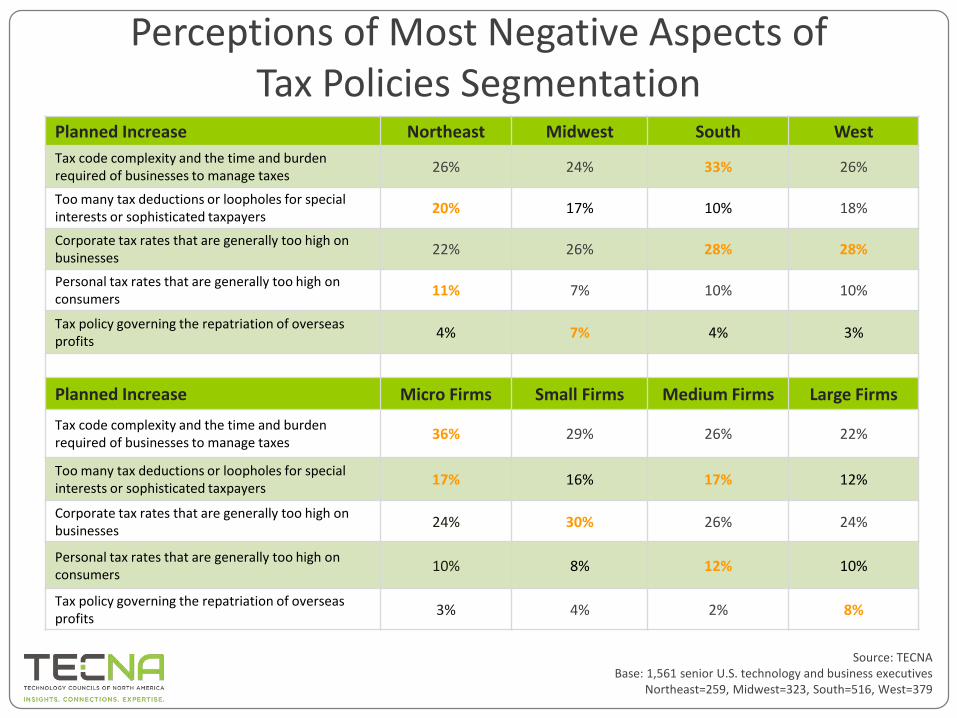
Perceptions of Most Negative Aspects of Tax Policies Segmentation
Planned Increase Northeast Midwest South West
Tax code complexity and the time and burden required of businesses to manage taxes
26% 24% 33% 26%
Too many tax deductions or loopholes for special interests or sophisticated taxpayers
20% 17% 10% 18%
Corporate tax rates that are generally too high on businesses
22% 26% 28% 28%
Personal tax rates that are generally too high on consumers
11% 7% 10% 10%
Tax policy governing the repatriation of overseas profits
4% 7% 4% 3%
Planned Increase Micro Firms Small Firms Medium Firms Large Firms
Tax code complexity and the time and burden required of businesses to manage taxes
36% 29% 26% 22%
Too many tax deductions or loopholes for special interests or sophisticated taxpayers
17% 16% 17% 12%
Corporate tax rates that are generally too high on businesses
24% 30% 26% 24%
Personal tax rates that are generally too high on consumers
10% 8% 12% 10%
Tax policy governing the repatriation of overseas profits
3% 4% 2% 8%
Source: TECNABase: 1,561 senior U.S. technology and business executives
Northeast=259, Midwest=323, South=516, West=379

Self Assessment of Desirability of Local Area/Region for Tech Startups
20%
41%
36%
16%
54%
28%
9%
45%
42%
9%
41%
47%
Lower-tier location fortech startups
Mid-tierlocationfor techstartups
Top-tierlocationfor techstartups
Northeast
Midwest
South
West
The Midwest’s self-assessment as a top-tier location for tech startups increased 8 percentage points over 2013, the most of any region.
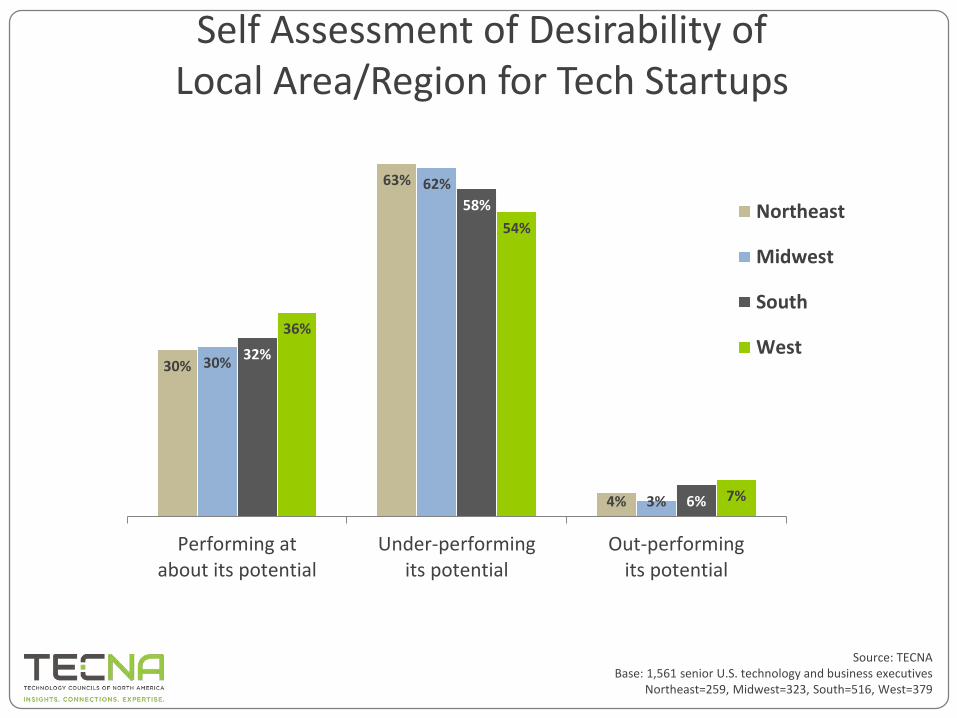
Self Assessment of Desirability of Local Area/Region for Tech Startups
30%
63%
4%
30%
62%
3%
32%
58%
6%
36%
54%
7%
Performing atabout its potential
Under-performingits potential
Out-performingits potential
Northeast
Midwest
South
West
Source: TECNABase: 1,561 senior U.S. technology and business executives
Northeast=259, Midwest=323, South=516, West=379
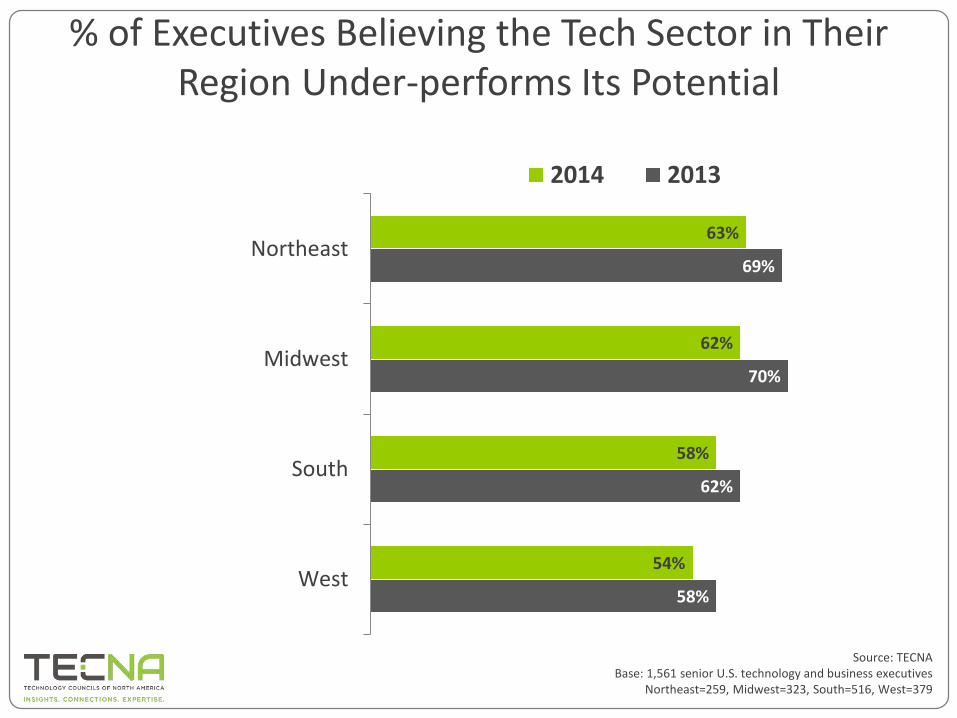
% of Executives Believing the Tech Sector in Their Region Under-performs Its Potential
58%
62%
70%
69%
54%
58%
62%
63%
West
South
Midwest
Northeast
2014 2013
Source: TECNABase: 1,561 senior U.S. technology and business executives
Northeast=259, Midwest=323, South=516, West=379
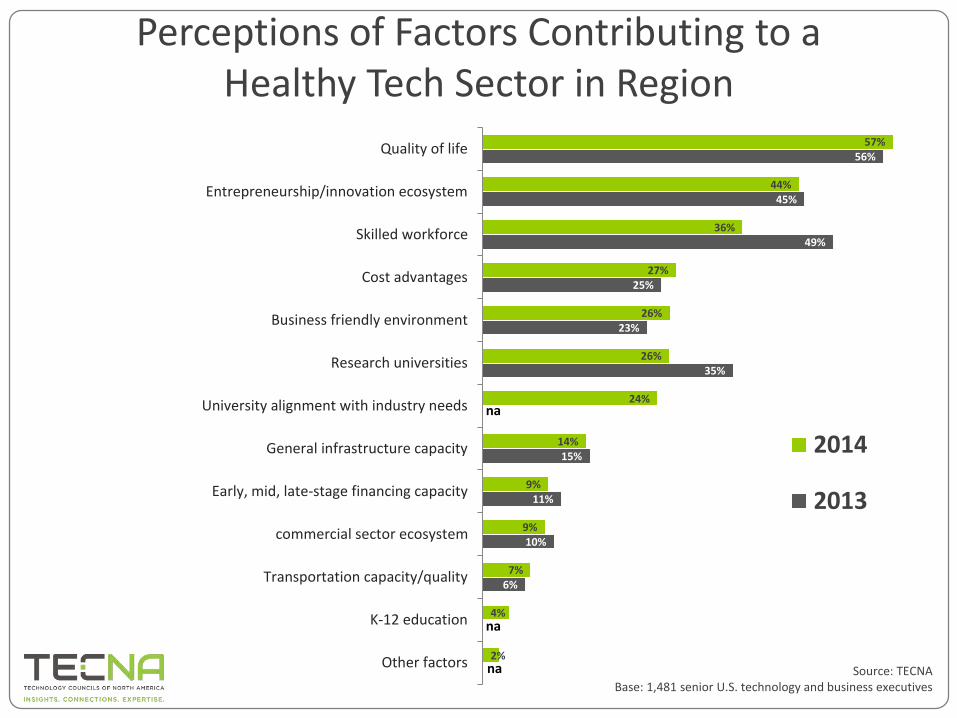
Perceptions of Factors Contributing to a Healthy Tech Sector in Region
0%
0%
6%
10%
11%
15%
0%
35%
23%
25%
49%
45%
56%
2%
4%
7%
9%
9%
14%
24%
26%
26%
27%
36%
44%
57%
Other factors
K-12 education
Transportation capacity/quality
commercial sector ecosystem
Early, mid, late-stage financing capacity
General infrastructure capacity
University alignment with industry needs
Research universities
Business friendly environment
Cost advantages
Skilled workforce
Entrepreneurship/innovation ecosystem
Quality of life
2014
2013
na
na
na Source: TECNABase: 1,481 senior U.S. technology and business executives
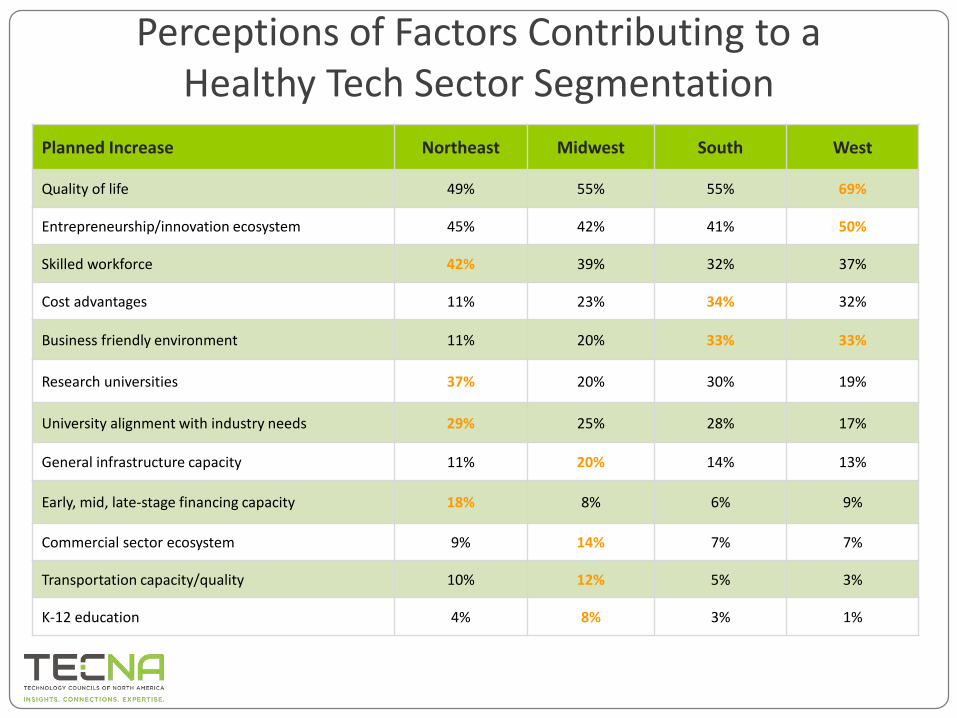
Perceptions of Factors Contributing to a Healthy Tech Sector Segmentation
Planned Increase Northeast Midwest South West
Quality of life 49% 55% 55% 69%
Entrepreneurship/innovation ecosystem 45% 42% 41% 50%
Skilled workforce 42% 39% 32% 37%
Cost advantages 11% 23% 34% 32%
Business friendly environment 11% 20% 33% 33%
Research universities 37% 20% 30% 19%
University alignment with industry needs 29% 25% 28% 17%
General infrastructure capacity 11% 20% 14% 13%
Early, mid, late-stage financing capacity 18% 8% 6% 9%
Commercial sector ecosystem 9% 14% 7% 7%
Transportation capacity/quality 10% 12% 5% 3%
K-12 education 4% 8% 3% 1%

Perceptions of Factors that can Inhibit Tech Sector Growth / Performance
8%
12%
11%
11%
17%
0
26%
0
28%
34%
36%
44%
4%
10%
11%
13%
14%
17%
21%
26%
27%
31%
33%
38%
Quality of life
Research universities / R&D capacity
Commercial sector ecosystem
General infrastructure capacity / quality
Entrepreneurship / innovation ecosystem
University/college alignment with industry needs
Business environment
K-12 education
Transportation capacity / quality
Workforce
Costs
Early, mid, late stage financing capacity
2014
2013
na
na
Source: TECNABase: 1,470 senior U.S. technology and business executives

Expectations of Sectors’ Ability to Drive Innovation / Startups / Job Growth
1%
4%
3%
2%
3%
3%
8%
8%
6%
9%
30%
22%
1%
1%
2%
2%
4%
6%
6%
8%
10%
14%
22%
24%
Advanced materials
Defense / military technology
Telecommunications
Broadcasting / Digital media / entertainment technology
Advanced manufacturing
Energy technology / Cleantech
IT services
Data center/cloud computing infrastructure
Cybersecurity
Data / analytics
Software / apps
Life sciences or healthcare technology
2-Year Outlook
Today
Source: TECNABase: 1,441 senior U.S. technology and business executives


