41
Marvin L. Clermont Associate Project Manager, Midtown Alliance
| Date post: | 17-Aug-2015 |
| Category: |
Documents |
| Upload: | marvin-clermont-mcrp |
| View: | 47 times |
| Download: | 0 times |

Marvin L. ClermontAssociate Project Manager, Midtown Alliance


Midtown Alliance Landscape Enhancements Tree Well Adopti on Program
Pershing Point Park Enhancement Project Street Furniture Deployment Annual Tree Replacement City Maintenance/Midtown Green Coordinati on Wayfi nding Enhancement Project
Atlanta Regional Commission 2013 LCI Implementati on Report
Policy One-Pagers Historic Preservati on Tax Credit Analysis LCI GIS Mapping
Tapestry Development CorporationClarkston Development Foundati on Consultati on
Historic District Development CorporationHOME Fund Applicati on - 610 Irwin Street
HDDC Property Portf olio Henderson Place Community Volunteer Event
Landscaping/Hardscaping Experience Natural Retaining Wall Stone Retaining Wall
Outreach English Avenue Volunteer Event Lakeshore Area Regional Recovery of Indiana (LARRI)
Coursework The Eff ects of Sea Level Rise on the Gullah-Geechee in Coastal Georgia Bloomberg Homeless Asset Mapping
Writing Sample LCI Implementati on Report Clarkston Development Foundati on Personal Writi ng Sample
Table of Contents

Work ExperienceMidtown Alliance
Historic District Development Corporation
Tapestry Development Corporation
Atlanta Regional Commission

Page 1 | Marvin Clermont
Midtown AllianceResponsibilities
Landscape Enhancements
• On a biannual basis, coordinate with contractors to create a plant design which incorporates an aesthetically-pleasing palate combining color and texture
• Perform needs-based assessment for plant material in medians, pocket parks, and other areas for which Midtown Alliance is responsible
• Monitor replacement and maintenance of such areas to ensure each is maintained to the standard expressed in our annual contract
Marvin Clermont | Page 2
Midtown AllianceResponsibilities
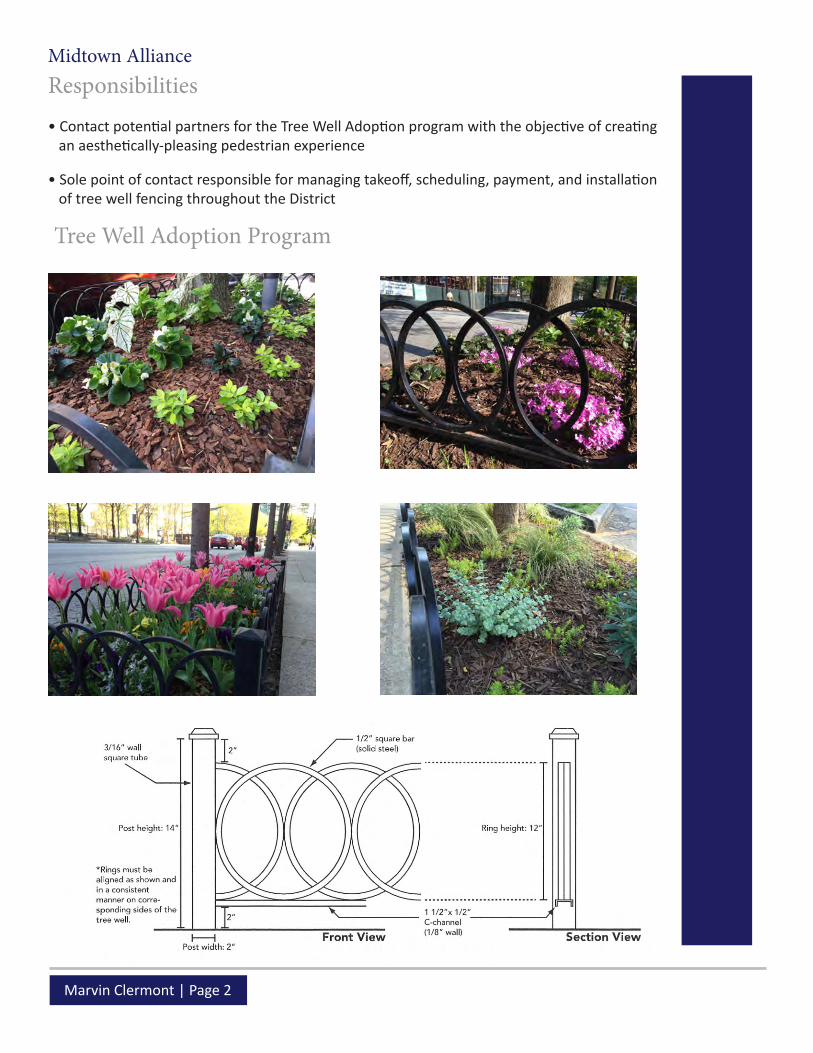
Tree Well Adoption Program
• Contact potential partners for the Tree Well Adoption program with the objective of creating an aesthetically-pleasing pedestrian experience
• Sole point of contact responsible for managing takeoff, scheduling, payment, and installation of tree well fencing throughout the District
Page 3 | Marvin Clermont
Midtown AllianceResponsibilities
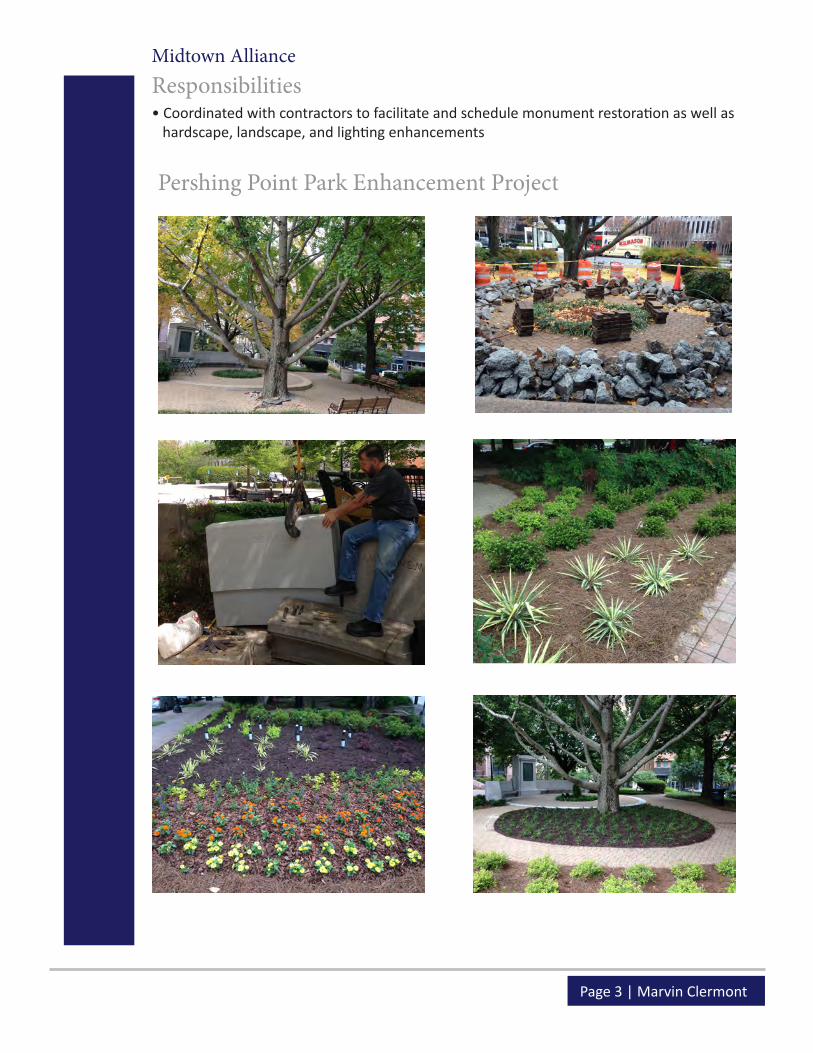
Pershing Point Park Enhancement Project
• Coordinated with contractors to facilitate and schedule monument restoration as well as hardscape, landscape, and lighting enhancements

Marvin Clermont | Page 4
Midtown Alliance
Responsibilities
Street Furniture Deployment
• Perform needs-based assessment for street furniture deployment throughout the District; potential infrastructure includes benches, bike racks, trash bins, and recycling cans
• Coordinate delivery and installation of benches, recycling bins, and trash cans to ensure all are located in high traffic areas to maximize proficiency
Page 5 | Marvin Clermont
Midtown AllianceResponsibilitiesMidtown AllianceResponsibilities
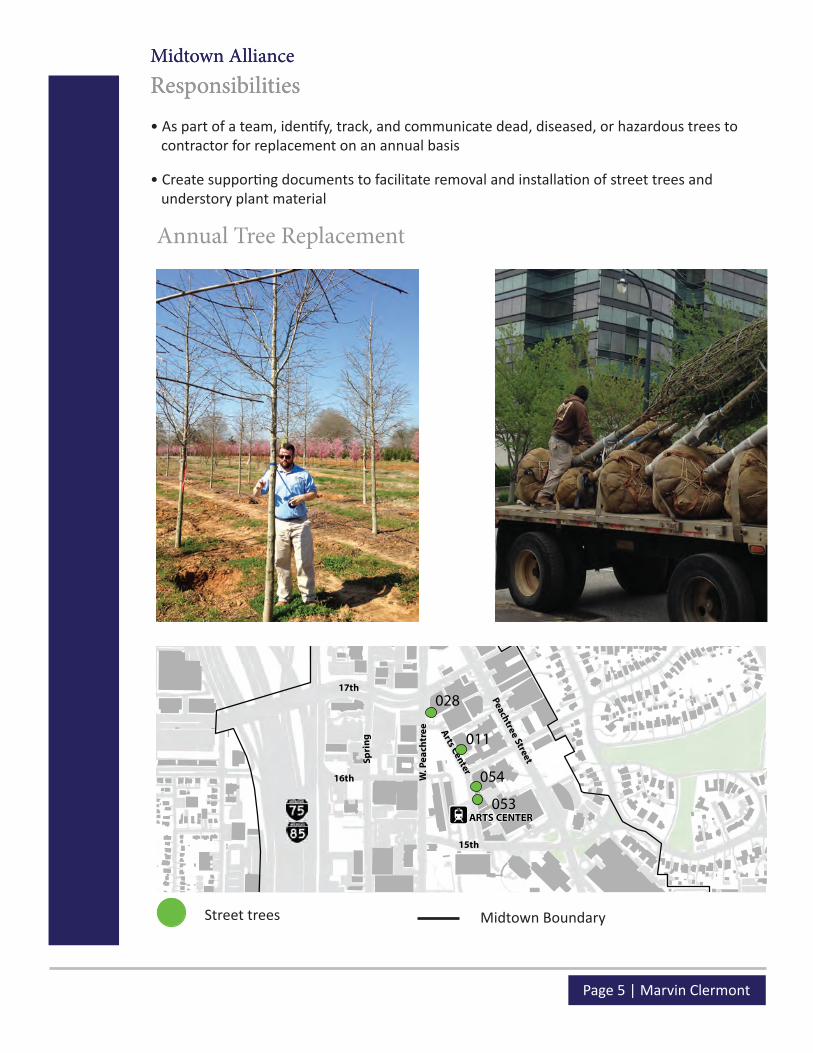
Annual Tree Replacement
• As part of a team, identi fy, track, and communicate dead, diseased, or hazardous trees to contractor for replacement on an annual basis
• Create supporti ng documents to facilitate removal and installati on of street trees and understory plant material
"Á
"Á
"Á
"Á
17th
14th
10th
5th
North
18th
16th
12th
8th
Peac
htre
e St
reet
W. P
each
tree
Spri
ng
4th
3rd
Pine
Pied
mon
t
Juni
per
Cypr
ess
Ponce de Leon
Spri
ng
W. P
each
tree
Peachtree Street
Pied
mon
t
Arts Center
Peac
htre
e W
alk
Peachtree Place
15th
11th
7th
6th
5th
Linden
Buford Hwy. Connector
Peachtree Street
W.P
each
tree
13th
Will
iam
s St
reet
MIDTOWN
ARTS CENTER
NORTH AVENUE
CIVIC CENTER
MID Boundary
Tree Installation
PREPARE BY MIDTOWN ALLIANCE ON 11/14/2014
°0 0.250.125
Miles0 400 800 1,200 1,600 2,000200
Feet
MAP EXHIBIT BTREE INSTALLATION
011
053
054
061
049
014
051
062
021
050 056
055 057
058059 060
028
052
Street trees Midtown Boundary

Marvin Clermont | Page 6
Midtown AllianceResponsibilities
City Maintenance/Midtown Green Coordination
• As part of a team, delegate responsibilities to the Midtown Green landscaping and maintenance team to resolve a wide array of issues throughout the District
• Coordinate with the City of Atlanta, Department of Watershed and Public Works to document and replace infrastructure in the City right-of-way

Page 7 | Marvin Clermont
Midtown AllianceResponsibilities
Wayfi nding Enhancement Project
• Responsible for collecti on of existi ng Wayfi nding signage throughout the District to assess project viability• Sole point of contact responsible for marking locati ons in need of sign replacement and monitoring project schedule to maintain various installati on and budget benchmarks
Marvin Clermont | Page 8
Atlanta Regional Commission
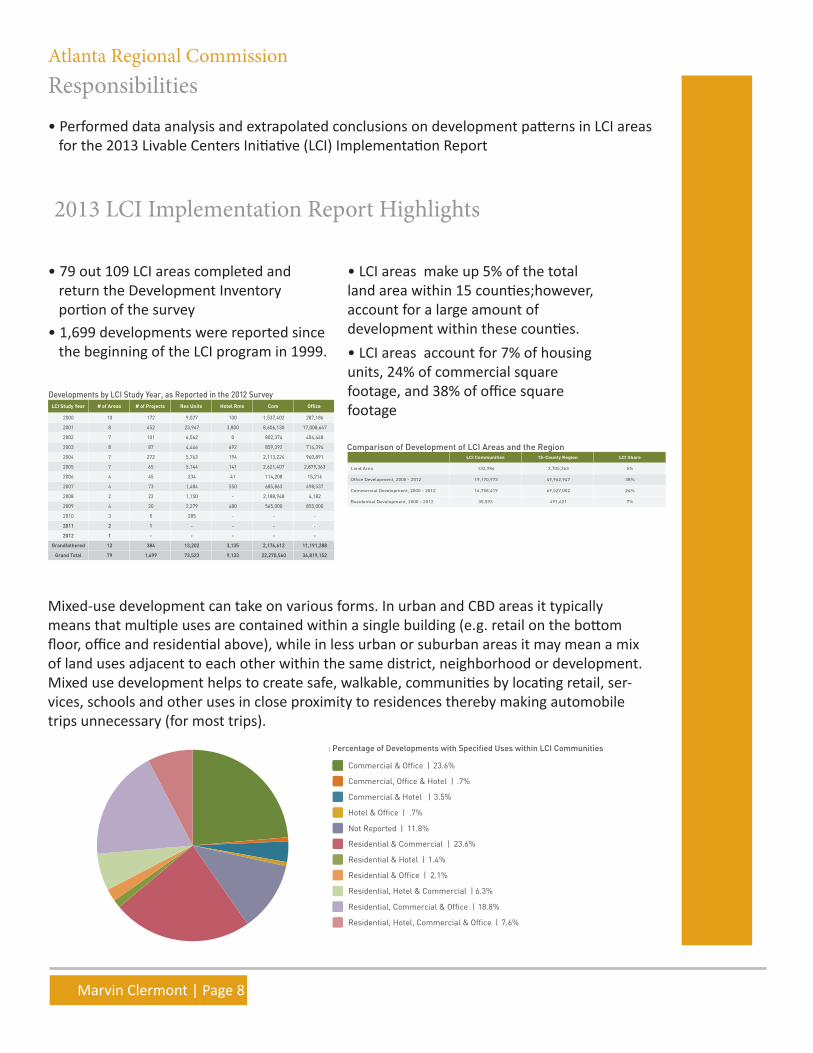
Responsibilities• Performed data analysis and extrapolated conclusions on development patterns in LCI areas for the 2013 Livable Centers Initiative (LCI) Implementation Report
2013 LCI Implementation Report Highlights
• 79 out 109 LCI areas completed and return the Development Inventory portion of the survey
• LCI areas make up 5% of the total land area within 15 counties;however, account for a large amount of development within these counties.• 1,699 developments were reported since
the beginning of the LCI program in 1999. • LCI areas account for 7% of housing units, 24% of commercial square footage, and 38% of office square footage
Mixed-use development can take on various forms. In urban and CBD areas it typically means that multiple uses are contained within a single building (e.g. retail on the bottom floor, office and residential above), while in less urban or suburban areas it may mean a mix of land uses adjacent to each other within the same district, neighborhood or development. Mixed use development helps to create safe, walkable, communities by locating retail, ser-vices, schools and other uses in close proximity to residences thereby making automobile trips unnecessary (for most trips).
Table 1: Developments by LCI Counties, as Reported in the 2012 Survey
County Area Completed Not
specified Planned Pre- Construction
Under Construction Grand Total Percentage
Atlanta 360 95 66 56 15 592 34.8%
Barrow 2 1 1 4 0.2%
Cherokee 188 2 190 11.2%
Clayton 8 1 2 11 0.6%
Cobb 78 4 10 17 109 6.4%
Dekalb 32 4 21 12 69 4.1%
Douglas 12 1 13 0.8%
Fayette 35 7 5 47 2.8%
Forsyth 3 2 3 9 0.5%
Fulton 195 22 7 13 12 249 14.7%
Gwinnett 312 2 5 6 325 19.1%
Henry 18 1 7 26 1.5%
Newton 27 3 30 1.8%
Rockdale 5 2 5 12 0.7%
Spalding 10 2 2 14 0.8%
Total 1,285 130 129 69 86 1,699 100.0%
reported since 2001.
Table 2: Developments by LCI Study Year, as Reported in the 2012 Survey
LCI Study Year # of Areas # of Projects Res Units Hotel Rms Com Office
2000 10 172 9,027 100 1,537,402 287,186
2001 8 452 23,947 3,800 8,606,130 17,008,647
2002 7 101 6,562 0 802,374 404,448
2003 8 87 4,446 692 859,392 714,394
2004 7 272 5,763 194 2,113,224 960,891
2005 7 65 5,144 141 2,621,407 2,879,363
2006 4 45 234 41 114,208 15,216
2007 4 73 1,484 550 685,863 498,537
2008 2 22 1,150 - 2,188,948 4,182
2009 4 20 2,279 480 565,000 855,000
2010 3 5 285 - - -
2011 2 1 - - - -
2012 1 - - - - -
Grandfathered 12 384 13,202 3,135 2,176,612 11,191,288
Grand Total 79 1,699 73,523 9,133 22,270,560 34,819,152
These numbers reflect the 79 LCI Communities that responded to the 2012 survey.
Residential Development
The LCI program assists communities with planning for a diverse range of housing that includes single-family
Table 3: Residential Development Summary
Land Use Quantity Projects % of All Projects Avg Q/ Project
Residential 73,523 811 48% 91
Table 4: Stage of Development by Land Use
Land Use Completed Pre-construction Planned Under Construction Remaining
Residential 520 63 89 50 96
construction. Only 32 of these projects will contain fewer than 100 residential units. These communities have consistently
add more than 100 units per project. The location of these projects achieves the goal of mixing uses by placing compact, quality housing in or around job centers and rail transit.
Chart 4: Number of Residential Units Reported
2,0000 4,000 6,000 8,000 10,000
Midtown
Buckhead
Downtown Atlanta
Upper Westside
Gwinnett
West End
Perimeter Center
Cumberland
Bolton/Moores Mill
Peachtree City
8,466
7,570
4,160
10,493
3,448
3,437
3,682
3,433
2,519
2,260
Commercial Development
A strong, growing economy is essential to the success of any metropolitan region. The Development Inventory survey assesses the strength of commercial development in LCI communities since the last reporting period. Commercial
8 9
Regional Comparison of Developments In addition to information gathered from the development inventory, ARC also gathers regional development data from Co-Star, a real estate information company. This information allows ARC to compare the amount of development in LCI areas to the amount of development in the entire region. The data reported in the LCI Development spreadsheets contained
development patterns. The following chart compares the amount of development within LCI areas to overall regional development. `
Table 12: Comparison of Development of LCI Areas and the Region
LCI Communities 15-County Region LCI Share
Land Area 132,984 2,705,263 5%
Office Development, 2000 - 2012 19,170,973 49,962,947 38%
Commercial Development, 2000 - 2012 16,758,419 69,527,002 24%
Residential Development, 2000 - 2012 35,593 491,621 7%
they lag behind in residential development. This shows that we have a “spatial mismatch” in where employees live and where the jobs are located. In order to create an environment where people can reasonably walk or bike to work, school
the economic downturn than surrounding areas, leading one to believe that LCI communities are thriving.
Employment
Along with the communities themselves, the workers who live in LCI areas also share a trend. According to the 2010
a sense of community by integrating housing and employment, as well as historic character and development patterns.
a wide variety of employment options. Jobs are available in LCI communities, and the people in the communities are making a good wage.
10-year GrowthThe implementation of an LCI plan is a long-term process. However, each completed LCI study includes an implementation
assess progress and make adjustments to maintain the spirit of the original plan.
resources), a 10-year update/full plan or it may determine that its LCI plan is complete and requires no additional funding.
Thirty-five LCI communities reached the 10-year milestone by January 2013. During this time, LCI communities have
development projects. The increase, by percentage, is depicted in Table 18.
Table 13: LCI Growth Comparison
Study Year Residential Units
Hotel Units
Commercial Space
Office Space
No.of Projects
LCI Count
2000 6,922 100 645,650 76,000 84
2001 8,167 3,346 2,729,712 13,313,624 150
2002 3,094 - 278,057 115,380 36
2003 1,729 143 401,391 1,297,211 15
GF 8,374 1,497 997,161 7,955,749 76
2004 Total 28,286 5,086 5,051,971 22,757,964 361 49
2000 9,027 100 1,537,402 287,186 172
2001 23,947 3,800 8,606,130 17,008,647 452
2002 6,562 - 802,374 404,448 101
2003 4,446 692 859,392 714,394 87
GF 12,878 3,135 1,827,692 11,555,631 264
2012 Total 56,860 7,727 13,853,990 29,970,306 1,076 109
101.0% 51.9% 169.9% 31.7 198.1% 122.4%
14 15
Hotel Development Hotel development in LCI areas is a good way to track corporate travel because the LCI areas with the most hotel square
Table 9: Hotel Development Summary
Quantity Projects % of All Projects Avg Q/ Project
Hotel 9,133 48 3% 190
Table 10: Stage of Development by Land Use
Land Use Completed Pre-construction Planned Under Construction Remaining
Hotel 27 14 0 6 1
Table 11. Top 10 Office Square Footage and Hotel Units
LCI Area Office Space (SqFt) LCI Area Hotel Units
Midtown 10,728,031 Midtown 3,135
Buckhead 10,419,397 Buckhead 3,106
Perimeter 3,922,000 Downtown Atlanta 1,141
McFarland-Stoney Point 2,636,372 College Park 475
Downtown Atlantat 1,211,400 Cumberland 304
Gwinnett 1,181,447 North Druid Hills 200
Cumberland 865,403 Town Center 194
North Druid Hills 850,000 McFarland-Stoney Point 144
Roswell Road 465,000 Covington 278 141
Upper Westside 385,632 Union City 111
Table 14. LCI Areas with Most Hotel Rooms Reported
Growth Around the Airport
College Park, not traditionally a center for hotel development, ranks in the top five for new hotel units because
airport is growing, in part due to the work of the Atlanta Aerotropolis Alliance. The Alliance is comprised of elected
owners, as well as the Airport Area, Clayton County and
goal is to lead the discussion on airport area planning and development and to identify strategies and actions related to improving the airport area.
Mixed-Use Development
and residential above). In less urban areas it may mean a mix of land uses adjacent to each other within the same district,
policies that encourage compact development, allow a mix of uses and require interconnected streets. The use of smart codes, form-based codes and overlay district zoning are other common tools that foster mixed-use development and diversify the types of housing units in a community.
respondents reported that seven percent of all projects included a mixed-use component. Twenty-four percent of mixed-
clearly demonstrate the goals of mixed-use development.
Chart 8: Percentage of Developments with Specified Uses within LCI Communities
Commercial & Office | 23.6%
Commercial, Office & Hotel | .7%
Residential, Commercial & Office | 18.8%
Residential, Hotel, Commercial & Office | 7.6%
Commercial & Hotel | 3.5%
Hotel & Office | .7%
Not Reported | 11.8%
Residential & Commercial | 23.6%
Residential & Hotel | 1.4%
Residential & Office | 2.1%
Residential, Hotel & Commercial | 6.3%
12 13
Page 9 | Marvin Clermont
The Atlanta region is a collection of vibrant neighborhoods and places that people and businesses want to call home. Over the last decade, many of these communities have improved the quality of life for their residents with help from the Livable Centers Initiative (LCI).
LCI was created by the Atlanta Regional Commission in 1999 to reduce vehicle emissions and help the region meet stringent federal air quality standards by providing travel options other than driving. Through grants, LCI encourages local jurisdictions to implement development strategies that link residents to shopping, dining and other activities via sidewalks and bike trails, rather than strictly by roads. The program has become popular and, during the last 14 years,Number and Types of Funded Studies per Year
has grown to include 109 communities.
LCI communities receive an initial grant to study and plan their town center, activity center or corridor. Once their plan is complete and adopted, the area is eligible for additional money that enables them to conduct supplemental studies of specific issues or to design and build transportation projects identified in their LCI study.
Every two years, ARC conducts a survey of all active LCI communities in an attempt to measure the success and effectiveness of the program. This document is a summary of the 2012 survey results. The full report can be found at www.atlantaregional.com/lci.
Planning Funds Awarded per Year
Cos
t
$0
$200,000
$400,000
$600,000
$800,000
$1,000,000
$1,200,000
$1,400,000
2000 2001 2002 2003 2004 2005 2006 2007 2008 2009 2010 2011 2012
New LCI Study
Supplemental Study
LCI Innovation
2013 Livable Centers Initiative
IMPLEMENTATION REPORT EXECUTIVE SUMMARY
2000–2012 Livable Centers Initiative Studies
40 Courtland Street, NE Atlanta, Georgia 30303
atlantaregional.com
For more information about the Livable Centers Initiative, including how to apply for funding, please contact:
Dan Reuter Community Development Division Manager
404.463.3305
Please consult ARC’s LCI webpage for more details:
www.atlantaregional.com/lci
Local governments and non-profit organizations are eligible for LCI grants. The program has three primary goals for its funding:• Encourage a diversity of mixed-income residential neighborhoods, employment, shopping and recreation choices in activity centers, town centers and corridors.
• Provide access to a range of travel modes including transit, roadways, walking and biking to enable access to all uses within the study area.
• Develop an outreach process that promotes the involvement of all stakeholders.
2000 2001 20020
2
4
6
8
10
12
14
16
18
20
2003 2004 2005 2006 2007 2008 2009 2010 2011 2012 GF** Grandfathered LCI Grants
Num
ber
of s
tudi
es
Activity Center
Town Center
Corridor
LCI F
UN
DIN
G G
OA
LS
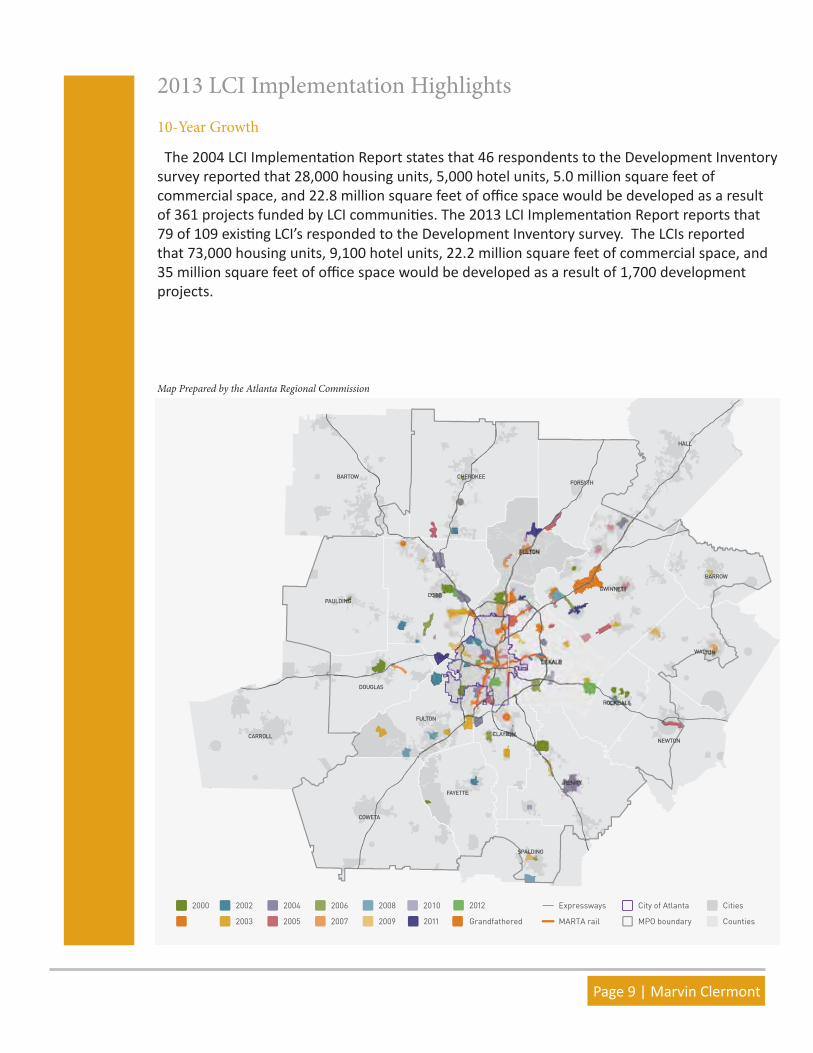
Map Prepared by the Atlanta Regional Commission
2013 LCI Implementation Highlights
The 2004 LCI Implementation Report states that 46 respondents to the Development Inventory survey reported that 28,000 housing units, 5,000 hotel units, 5.0 million square feet of commercial space, and 22.8 million square feet of office space would be developed as a result of 361 projects funded by LCI communities. The 2013 LCI Implementation Report reports that 79 of 109 existing LCI’s responded to the Development Inventory survey. The LCIs reported that 73,000 housing units, 9,100 hotel units, 22.2 million square feet of commercial space, and 35 million square feet of office space would be developed as a result of 1,700 development projects.
10-Year Growth

Marvin Clermont | Page 10
Atlanta Regional Commission
Policy One-Pagers• Researched demographic, social, and economic data related to TOD and aff ordable housing in the 10-county region
• Designed six one-pagers using Adobe InDesign and ArcGIS to illustrate the need and eff ect of the cost burden on the low to moderate income populati on
Inclusionary Zoning One-Pager
Needs and Tools to Preserve Affordable Housing
The Atlanta region is the second fastest growing metropolitan area in the nation, with a current population of about 4.1 million people. As population and economic growth increase, local governments like Atlanta are looking for ways to prevent displacement of lower to middle-income residents and provide long-term affordable housing options.
A typical household in the Atlanta region with a median income of $58,390 spends an average of $14,305 in transportation costs annually. That’s $1,192 per month, ranking Atlanta 44th out of the nation’s 51 largest metros.¹30% of typical households in the Atlanta region with median income of $58,390, spend over 30% of their yearly income on housing and 80% spend more than 45% of their yearly income on housing and transportation costs.
Working families in the Atlanta region with incomes between $20,000 and $50,000 spend 61% of their yearly budget on housing and transportation costs.²
Atlanta Mitigates Displacement and Preserves Affordable Housing
Housing is considered affordable if it costs no more than 30% of the monthly household income for rent and utilities and no more than 45% of housing and transportation costs. Policies are needed to preserve and create affordable housing.
Marisa GhaniSenior Planner, Land Usep: 404.463.3309f: 404.463.3254e: [email protected]
Market demand for the number of households likely to be looking to rent or buy housing near transit will increase to 14.6 million households by 2025 and 15.2 million households by 2030, with just under 229,000 in Atlanta³
This map illustrates housing and transportation costs as a percent of income. In the Atlanta region, most people spend over 45% of their income on housing and transportation costs.
1.Average Annual Transportation Costs for the National Typical Household, 2012, Center for Neighborhood Technology. p. 1-2.; 2.B. Lipman, A Heavy Load: The Combined Housing and Transportation Burdens of Working Families, 2006, Center for Housing Policy: Washington, D.C.; 3. Center for TOD Demand Estimate Update [cited 2013 4/22/2013]; Available from: http://www.ctod.org/portal/sites/default/files/2008demestctod.pdf. 4.Metro Atlanta Rapid Transit Authority, , MARTA’s Policy Framework and Strategic Approach to Action, 2012.; 5. Atlanta Development Authority, Atlanta Beltline Affordable Housing Trust Fund Developer Grants, 2011. p. 1-38.; 6.Arlington, Virgina Department of Community Planning and Development., 2006p. 1-4.; 7. The Effects of Inclusionary Zoning on Local Housing Markets: Lessons from the San Francisco, Washington DC and Suburban Boston Areas, 2008, Center for Housing Policy. p. 1-13; PICTURES and MAPS: Source - H+T Affordability Index, tumblr.com - mass housing;
MARTA applies a 20% affordable housing policy goal for housing affordability as part of all joint development projects (residential and mixed-use TOD). This is one way that MARTA looks to provide affordable housing options near transit stops.
The City Council created the Beltline Affordable Housing Trust Fund (BAHTF) to create and preserve affordable housing in the Beltline neighborhoods with approximately 115 units planned. Once completed these units will be a prime example of connecting affordable housing to public transportation.
5
4
Need for Affordable Housing in AtlantaTransportation Costs as a Percentage of Annual Income

Page 11 | Marvin Clermont
Transit to Health One-Pager
People who live or work in communities with high quality public transportation tend to drive significantly less and rely more on alternative modes of transportation contributing to many health benefits.Neighborhood design features that support transit, such as walkability and mixed land use, also support public health. Health benefits of transit-oriented neighborhoods include increased physical fitness, improved mental health, improved basic access to medical care and healthy food and reduced traffic crashes and pollution emissions.¹
Public Transportation Accessibility Improves Physical Fitness
Public Transportation Improves Health
Nearly half of Americans do not meet the Surgeon General’s recommendation of 30 minutes of physical activity daily. Walking to public transit has proven to help transit users meet their daily physical activity recommendations.²
Marisa GhaniSenior Planner, Land Usep: 404.463.3309f: 404.463.3254e: [email protected]
Atlanta - Sandy Springs - Marietta was ranked 21st out of 50 of the largest metropolitan MSA’s in the US American Fitness Index5
Areas for Improvement
Percent obese
Percent with asthma
Lower percent walking or biking to workLower percent primary health care providers per capita
Lower percent city area as parkland
✓✓
Strengths
Tennis Courts
Golf courses
Rec centers per capita
✓
Of people with safe places to walk within ten minutes of home, 43% achieve physical activity targets, compared with 27% of less walkable area residents²
In Georgia 65.0% of adults were overweight, with a Body Mass Index (BMI) of 25 or greater (US: 63.7%); 30.4% of adults were obese, with a BMI of 30 or greater (US: 27.5%)
1. Litman, T., Evaluating Public Transportation Health Benefits, 2010, Victoria Transport Policy Institute. p. 1-32.; 2. Dannenberg, L.B.a.A., Walking to Public Transit: Steps to Meet Physical Activity Recommendations, 2005, Centers for Disease Control: American Journal of Preventative Medicine. p. 274-280.; 3. The Food and Research Center, The Most Recent National and State Prevalence for Overweight and Obesity (including the District of Columbia), 2011, Center for Disease Control and Prevention: The Food and Research Center; 4.Silver Comet Trail. [cited 2013 4/4/2013]; Available from: http://www.silvercometga.com/. 5.Chamness et al., ACSM Health and Community Fitness Status of the 50 Largest Metropolitan Areas, 2012, American Fitness Index. p. 1-128.
Our Region is Working to Improve Accessibility
Through the LCI program, ARC continues to implement accessibility improvements such as sidewalks, multi-use trails and bicycle lanes to expand transportation alternatives and enhance mobility.Construction of the Beltline, a 22-mile network of multi-use trails that encompasses much of Atlanta, has created the potential to reconnect 45 neighborhoods through alternative modes of transportation.Atlanta’s PATH Foundation has developed 25 miles of greenway trails connecting the city’s communities. The Silver Comet Trail is a 61.5 mile long trail that is used for hikers and bikers, walkers, and is also wheelchair accessible. 4
3

Marvin Clermont | Page 12
Atlanta Regional CommissionHistoric Preservation Tax Credit Analysis • Calculated and analyzed program fees and tax incenti ves to assess economic impact of state programs on employment
• Calculated, in Excel, the economic multi plier, wages, and jobs created as a result of historical tax credits awarded in the Metropolitan Planning Organizati on (MPO)
• Applied fi ndings to defl ators to account for decades of infl ati on
Excel Consolidation, Calculation, and Extrapolation• Over two decades of state-wide data was sift ed through, by hand, and consolidated, in Excel to ensure that only historic tax credit by the MPO was included
• The economic multi plier was calculated to extrapolate the job and wages created by applying and rati os identi fi ed in research

Page 13 | Marvin Clermont
• The totals were multi plied the defl ator to adjust for infl ati on
• Over 200 properti es were identi fi ed creati ng just under 800 jobs, and over $500 million over the last three decades

Marvin Clermont | Page 14
Atlanta Regional CommissionLCI GIS Mapping
§̈¦20
O a k l a n d C i t y /O a k l a n d C i t y /L a k e w o o dL a k e w o o d
W e s t L a k eW e s t L a k e
§̈¦20
W e s t E n dW e s t E n d
Ca
sc
ad
e R
d S
W
Ca
sc
ad
e R
d S
W
W W
hi t
eh
al l
St
SW
W W
hi t
eh
al l
St
SW
C h a p e l S t
S W
C h a p e l S t
S W
Ra
l p h D
av i d
Ab
e r na
t hy B
l v d S
W
Ra
l p h D
av i d
Ab
e r na
t hy B
l v d S
W
Approve of CID
Existing LCI Community
Proposed CID Boundary
´0 0.4 0.80.2
Miles
Proposed West End CID Boundary
D o w n t o w n D o w n t o w n A t l a n t aA t l a n t a
W e s t E n dW e s t E n d
V i n e C i t yV i n e C i t y
§̈¦20
§̈¦20
H U D C h o i c e H U D C h o i c e N e i g h b o r h o o dN e i g h b o r h o o d
J o s e p h E . B o o n e B o u l e v a r dJ o s e p h E . B o o n e B o u l e v a r d
P a r k S t r e e tP a r k S t r e e t
No r t
h s i de D
r iv e
No r t
h s i de D
r iv e
No
rth
sid
e D
riv
eN
ort
hs
ide
Dri
ve
M . L . K . D r i v eM . L . K . D r i v e
Jo
se
ph
E.
Lo
we
ry S
tre
et
Jo
se
ph
E.
Lo
we
ry S
tre
et
West End
Vine City
Downtown Atlanta
HUD Choice Neighborhood
´HUD Choice Neighborhood
0 0.35 0.70.175Miles
§̈¦20
O a k l a n d C i t y /O a k l a n d C i t y /L a k e w o o dL a k e w o o d
W e s t L a k eW e s t L a k e
§̈¦20
W e s t E n dW e s t E n d
Ca
sc
ad
e R
d S
W
Ca
sc
ad
e R
d S
W
W W
hi t
eh
al l
St
SW
W W
hi t
eh
al l
St
SW
C h a p e l St
S W
C h a p e l St
S W
Ra l p h D
a v i d Ab e r n a t h y B
l v d SW
Ra l p h D
a v i d Ab e r n a t h y B
l v d SW
Approve of CID
Existing LCI Community
Proposed CID Boundary
´0 0.4 0.80.2
Miles
Proposed West End CID Boundary
Downtown Atlanta -2001 | 5 Year in 2006; 10 Year Update due this year
Project Name
Study Downtown Atlanta LCI Study
Supplemental StudyBaker Street Two-Way Conversion Feasibility Study
Supplemental Study 10 Year LCI Update
Supplemental Study Traffic Simulation Model
Supplemental Study Streetcar TOD Study
Transportation Project Piedmont Avenue Pedestrian Improvements
Transportation ProjectPeachtree Street Downtown Midblock Pedestrian Crossing
Transportation Project Decatur Street Pedestrian Improvements
Transportation Project Simpson-West Peachtree Ped Rail Connections
Transportation Project Luckie St. Two-Way Conversion
Transportation Project Atlanta Streetcar Transit Enhancements
Vine City - 2008 | 5 Year due in 2014; 10 Year due in 2019
Project Name
Study Vine City LCI Study
Transportation ProjectMLK Blvd Bicycle and Pedestrian Facilities
West End - 2000 | 5 Year in 2006; 10 Year Update due this year
Project Name
Study West End Historic District LCI
Transportation ProjectRalph David Abernathy Boulevard Streetscape and Intersection Improvements
Transportation Project Ashby Street (Lowery Boulevard) Streetscape
Transportation Project Lee Street Streetscape
Atlanta Housing Authority - HUD Choice Neighborhood
West End Community Improvement District
Page 15 | Marvin Clermont
Church St.
Church St.
Scott Blvd.
Scott Blvd.
Dekalb Industrial Way
Dekalb Industrial Way
Bill Thrasher Dr.
N. Decatur Rd.
Medline LCI
´
0 0.3 0.60.15Miles
Medline | Redevelopment Corridor
Chamblee LCI Boundary
´
Chamblee | LCI Boundary Expansion
0 0.1 0.2 0.3 0.40.05Miles
Peachtree Blvd.
Broad St.
Chambl;ee Tucker Rd.
New Peachtree Rd.
Medline LCI
´
0 0.3 0.60.15Miles
Medline | Redevelopment Corridor
Chamblee LCI Boundary
´
Chamblee | LCI Boundary Expansion
0 0.1 0.2 0.3 0.40.05Miles
Peachtre
e Blvd.
Broad St.
Chambl;ee Tucker Rd.
New Peachtre
e Rd.
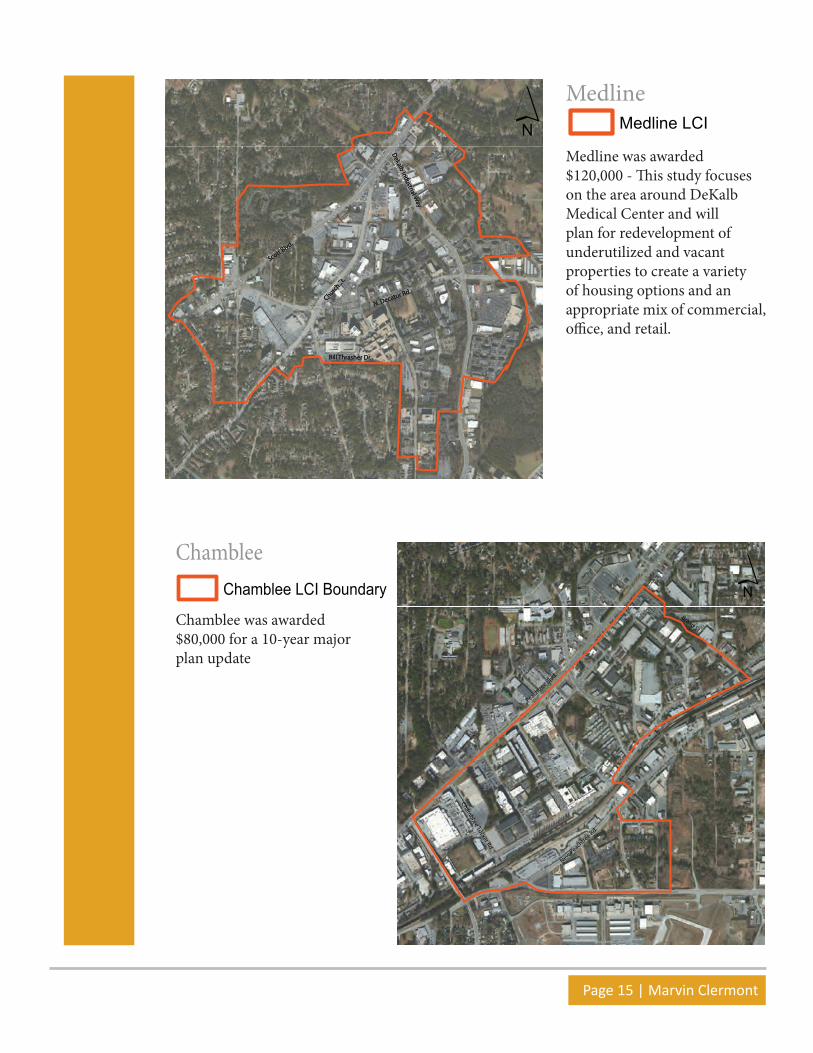
Medline was awarded $120,000 - Th is study focuses on the area around DeKalb Medical Center and will plan for redevelopment of underutilized and vacant properties to create a variety of housing options and an appropriate mix of commercial, offi ce, and retail.
Medline
Chamblee
Chamblee was awarded $80,000 for a 10-year major plan update

Marvin Clermont | Page 16
Responsibilities• Researched and compiled best practices models for potential housing redevelopment and preservation strategies for the city of Clarkston, GA
• Identified and aggregated key components of the Low Income Housing Tax Credit (LIHTC) and Placed-in-Service (PIS) grant application packages
• Created a database to segregate several key categories, such as partners, clients, and funders, in order to expedite the targeting process to increase the proficiency of the company’s marketing and public relations efforts
Clarkston Development Foundation Consultation
• 7,748 remaining units accounted for 21,964 of the population in the service area.
Tapestry Development Group
• 5,804 occupied housing units (74.9% of the occupied housing units) are rental, accommodating 16,854 people (77% of the total population).
• 1,944 housing units (25.1% of the occupied housing units) are owned, accounting for 5,110 people (23% of the total population)
Total Population by Block
Total Occupied Housing Units
§̈¦285
§̈¦285
E Po
nce
de L
eon
Ave
Memor
ial D
r
Stone Mountain Fwy
Rockbridge Rd
Lawrenceville Hwy
Brockett Rd
Cooledge Rd
Stone Mountain Fwy
Clarkston
Zip Code 30021
Interstate
Major Roads
0%
0.1% - 66.7%
66.8% - 84%
84.1% - 94.4%
94.5% - 100% ±0 0.5 10.25 Miles
C L A R K S T O NC L A R K S T O NU N I N C O R P O R A T E DU N I N C O R P O R A T E DD E K A L B C O U N T YD E K A L B C O U N T Y
U N I N C O R P O R A T E DU N I N C O R P O R A T E DD E K A L B C O U N T YD E K A L B C O U N T Y
Percentage of Occupied Housing Units - 2010 CensusPercentage of Occupied Housing Units - 2010 Census
§̈¦285
§̈¦285
E Po
nce
de L
eon
Ave
Memor
ial D
r
Stone Mountain Fwy
Rockbridge Rd
Lawrenceville Hwy
Brockett Rd
Cooledge Rd
Stone Mountain Fwy
Clarkston
Zip Code 30021
Interstate
Major Roads
0 - 58
59 - 234
235 - 608
609 - 1154
1155 - 2080 ±0 0.5 10.25 Miles
C L A R K S T O NC L A R K S T O NU N I N C O R P O R A T E DU N I N C O R P O R A T E DD E K A L B C O U N T YD E K A L B C O U N T Y
U N I N C O R P O R A T E DU N I N C O R P O R A T E DD E K A L B C O U N T YD E K A L B C O U N T Y
To t a l P o p u l a t i o n - 2 0 1 0 C e n s u sTo t a l P o p u l a t i o n - 2 0 1 0 C e n s u s
Page 17 | Marvin Clermont
§̈¦285
§̈¦285
E Po
nce
de L
eon
Ave
Memor
ial D
r
Stone Mountain Fwy
Rockbridge Rd
Lawrenceville Hwy
Brockett Rd
Cooledge RdStone Mountain Fwy
Clarkston
Zip Code 30021
Interstate
Major Roads
0% - 5.3%
5.4% - 15.4%
15.5% - 31.6%
31.7% - 62.5%
62.6% - 100% ±0 0.5 10.25 Miles
C L A R K S T O NC L A R K S T O NU N I N C O R P O R A T E DU N I N C O R P O R A T E DD E K A L B C O U N T YD E K A L B C O U N T Y
U N I N C O R P O R A T E DU N I N C O R P O R A T E DD E K A L B C O U N T YD E K A L B C O U N T Y
Percentage of Vacant Housing Units - 2010 CensusPercentage of Vacant Housing Units - 2010 Census
§̈¦285
§̈¦285
E Po
nce
de L
eon
Ave
Memor
ial D
r
Stone Mountain Fwy
Rockbridge Rd
Lawrenceville Hwy
Brockett Rd
Cooledge Rd
Stone Mountain Fwy
Clarkston
Zip Code 30021
Interstate
Major Roads
0% - 5.3%
5.4% - 15.4%
15.5% - 31.6%
31.7% - 62.5%
62.6% - 100% ±0 0.5 10.25 Miles
C L A R K S T O NC L A R K S T O NU N I N C O R P O R A T E DU N I N C O R P O R A T E DD E K A L B C O U N T YD E K A L B C O U N T Y
U N I N C O R P O R A T E DU N I N C O R P O R A T E DD E K A L B C O U N T YD E K A L B C O U N T Y
Percentage of Vacant Housing Units - 2010 CensusPercentage of Vacant Housing Units - 2010 Census
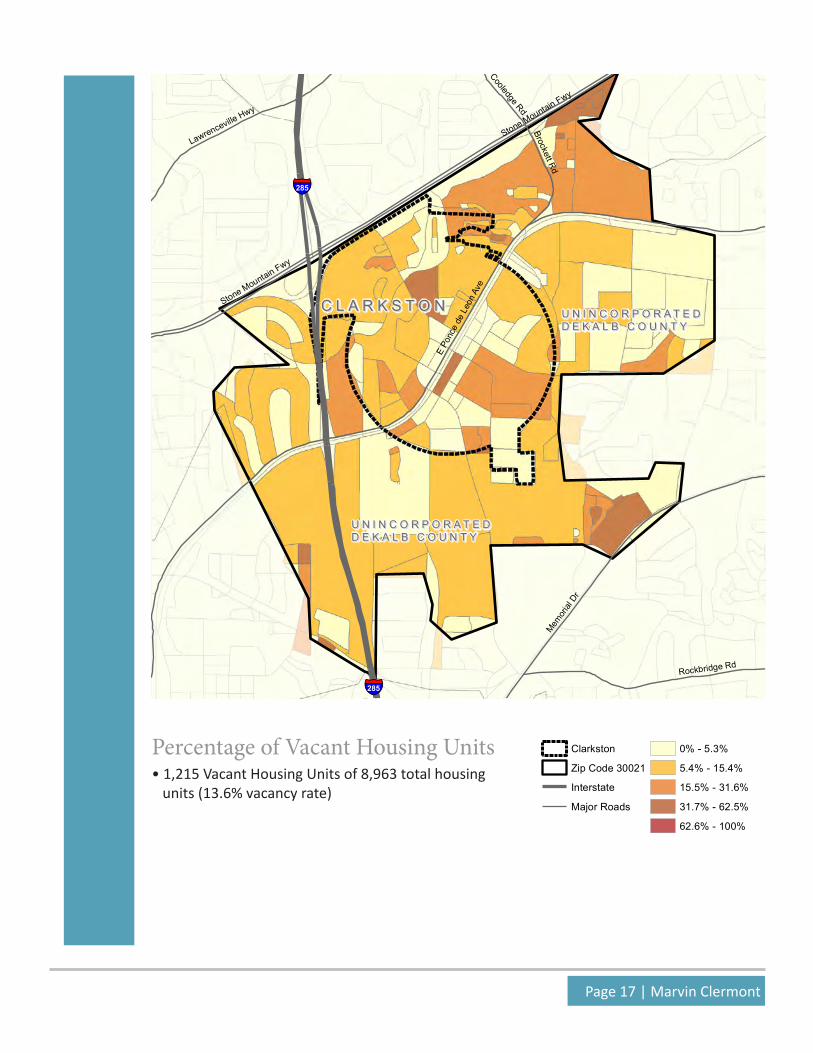
Percentage of Vacant Housing Units• 1,215 Vacant Housing Units of 8,963 total housing units (13.6% vacancy rate)
Marvin Clermont | Page 18
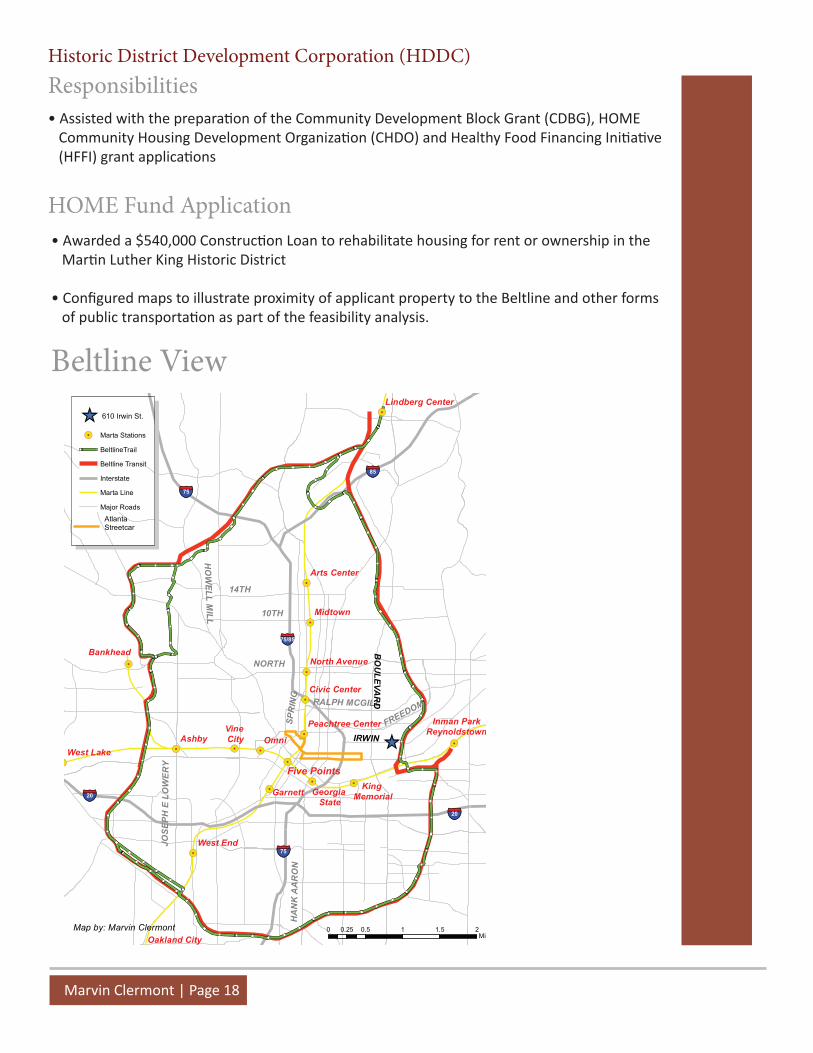
Responsibilities• Assisted with the preparati on of the Community Development Block Grant (CDBG), HOME Community Housing Development Organizati on (CHDO) and Healthy Food Financing Initi ati ve (HFFI) grant applicati ons
HOME Fund Application• Awarded a $540,000 Constructi on Loan to rehabilitate housing for rent or ownership in the Marti n Luther King Historic District
• Confi gured maps to illustrate proximity of applicant property to the Beltline and other forms of public transportati on as part of the feasibility analysis.
Beltline View
!.
!.
!.
!.
!.
!.
!. !.
!.
!.
!.
!.
!.!.!.
!.
!.
!.
!.
_̂
§̈¦85
§̈¦20
§̈¦20
§̈¦75
§̈¦75/85
§̈¦75
OmniAshby
Midtown
Garnett
Bankhead
West End
West Lake
Vine City
Five Points
Arts Center
Civic Center
North Avenue
Oakland City
King MemorialGeorgia
State
Lindberg Center
Peachtree CenterEdgewood-Candler Park
Inman ParkReynoldstown
10TH
14TH
HO
WELL M
ILL
IRWINFREEDOM
HA
NK
AA
RO
N
RALPH MCGILL
JOSE
PH E
LO
WER
Y
BO
ULEVA
RD
NORTH
SPR
ING
Atlanta Streetcar
0 0.5 1 1.5 20.25Miles
!. Marta Stations
BeltlineTrail
Beltline Transit
Interstate
Marta Line
Major Roads
_̂ 610 Irwin St.
610 Irwin St. (Beltline)
Map by: Marvin Clermont
Historic District Development Corporation (HDDC)

Page 19 | Marvin Clermont
610 Irwin in Relation to the Beltline
!(
!(!( !(
!(!( !(!(
!( !(!(
!(
!(
!(!(
!(
!(
!(
!(
North Ave NE
Boul
evar
d N
E
Irwin St NE
Angier Ave NE
Ralph Mcgill Blvd NE
Highland Ave NE
Wylie St SE
Gle
n Iri
s D
r NE
Park
way
Dr N
E
Auburn Ave NE
Decatur St SE
DeKalb Ave NE
East Ave NE
Lake Ave NE
State Route 10
Jack
son
St N
E
Morgan St NE
Felto
n D
r NE
Ran
dolp
h S
t NE
Elizabeth St NE
Edgewood Ave SE
Edgewood Ave NEKrog S
t NE
Euclid Ave
NE
Hilli
ard
St S
E
Wabash Ave NE
N Highland Ave NE
How
ell S
t NE
Waverly W
ay NE
Dallas St NE
Wad
dell
St N
E
Linden Ave NE
Jackson St SE
Hilli
ard
St N
E
Winton Ter NE
AIRLIN
E ST
Sam
pson
St N
E
Pear
l St S
E
Barnett St NE
John Wesley Dobbs Ave NE
Ashl
ey A
ve N
E
Daniel St SE
Boulevard Pl NE
Dixie Ave NE
I-75 Ramp
Hal
e S
t NE
Boulevard SE
Tye St SE
Rankin St NE
Ashland Ave NE
Arno
ld S
t NE
Linwood Ave N
E
Marcus St SE
Willoughby Way NE
How
ell S
t SE
Virgil S
t NE
Esto
ria S
t SE
Todd StC
hest
er A
ve S
E
Pine St NE
N Angier Ave NE
Selm
an S
t SE
Hog
ue S
t NE
Keny
on S
t SE
Fortu
ne S
t NE
Gartrell St SE
William
H Borders D
r SE
Chamberlain St SE
Old Wheat St NE
Kirkwood Ave SE
Cor
ley
St N
E
Shor
t St S
E
BOULEVARD
Austin Ave NE
Alas
ka A
ve N
E
Som
erse
t Ter
NE
Cur
rier P
l
Brad
ley
St N
E
Powell St SE
Pine St SE
McGruder St NE
Angi
er P
l NE
Pros
pect
Pl N
E
Lam
pkin
St N
E
Fitzgerald St SE
Tanner St SE
Madeira Ave NE
Cor
nelia
St S
E
Angier
Spr
ings R
d NE
Albi
on A
ve N
E
Williams Mill Rd NE
Johnson Ave NE
PAR
K LN
Spru
ce S
t NE
Mac
kenz
ie D
r NE
Field St SE
CO
OK
S A
LY
Pittman Pl SE
JACKSON PL
Flat
Sho
als
Ave
SE
Ensley St NE
Bere
an A
ve S
E
International Blvd NE
Atlantis Ave NE
Ran
kin
Pl N
E
BRA
DLE
Y ST
Druid C
ir NE
TENNELLE ST
Stone Mountain Fwy NE
Gra
pe S
t NE
Fortune Pl NE
McG
ill Park Ave NE
Belgrade Ave NE
EDIT
H S
T
Nut
ting
St N
E
Fort
St N
E
Gunby S
t SE
Airli
ne S
t NE
Krog St Underpass St N
E
TENELLE ST
INMAN MEWS DR
MC
GIL
L P
L
EDGEWOOD AVE
Park
way
Dr N
E
How
ell S
t NE
Krog
St N
E
Hilli
ard
St N
E
How
ell S
t NE
PARK LN
Barnett St N
E
Elizabeth St NEStat
e Rou
te 10
Edgewood Ave SE
State Route 10
Rankin St NE
Waverly Way NE
Sampson S
t NE
State Route 10
Kirkwood Ave SE
¯
0 0.2 0.40.1Miles
_̂ 610 Irwin St.
610 Irwin St. (Old 4th Ward)
!( Bus Stops
Interstate
Streets
BeltlineTrail
Beltline Transit
Old 4th Ward
_̂ 610 Irwin St.
Atlanta Streetcar
_̂
Map by: Marvin Clermont
!(
!(!(!(
!(
!(!(
!(
!(!(
!(
!(
!(
!(
!(
!(
!(
!(
!(
610 IrwinParcel ID # 14001900070896Zoning Type: RG-2
Irwin St NE
Sam
pson
St N
E
McGruder St NE
John Wesley Dobbs Ave NE
Cor
ley
St N
E
Auburn
Ave N
E
Lam
pkin
St N
E
Lake Ave NE
610 Irwin St.
Old 4th Ward
!( MARTA Bus Stops
Streets
Beltline Transit
BeltlineTrail
¯
0 200 400100Feet
610 Irwin St. (Street View)
Map by: Marvin Clermont
Street View

Marvin Clermont | Page 20
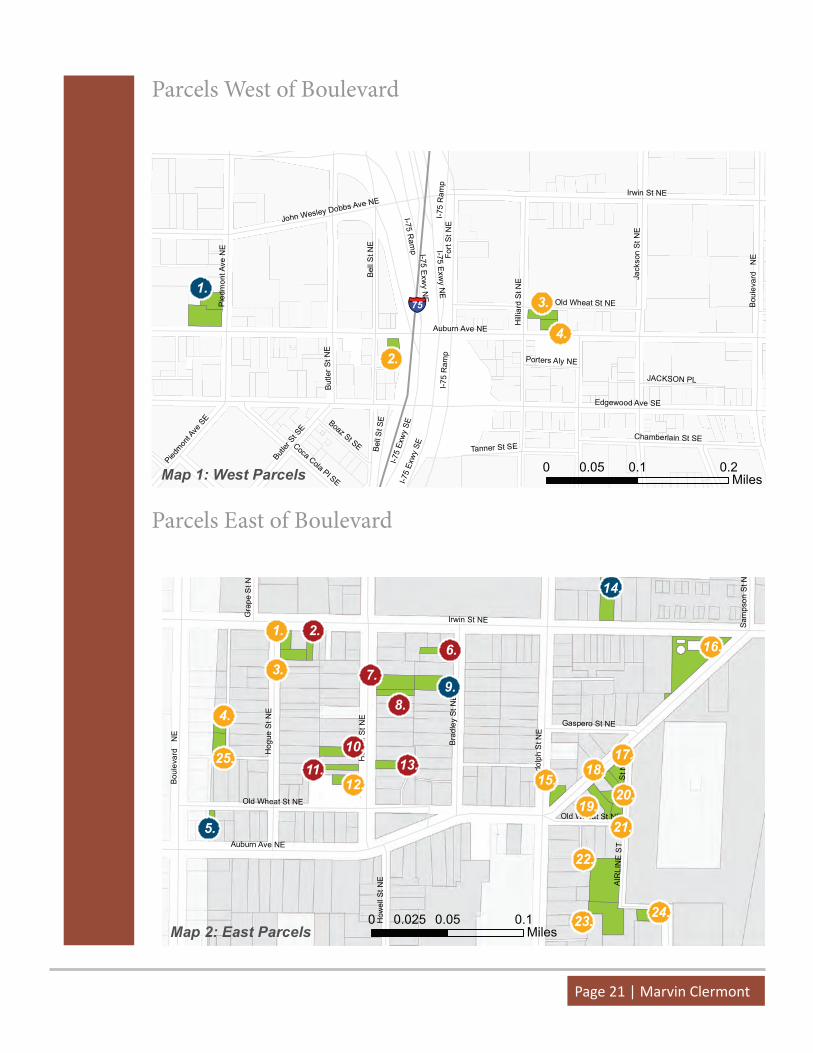
HDDC Property Portfolio• Performed GIS spati al analyses of real estate assets within the HDDC area of interest
• 24 Parcels on either side of Boulevard Street
• Property status included: Occupied, Vacant, Vacant Land and Property
Auburn Ave NE
Edgewood Ave SE
Irwin St NE
But
ler S
t NE
Bel
l St N
E I-75 Exw
y NE
Jack
son
St N
E
I-75
Ram
p
Bou
leva
rd
NE
Hill
iard
St N
E
Pie
dmon
t Ave
NE
Fort
St N
E
Old Wheat St NE
John Wesley Dobbs Ave NE
Chamberlain St SE
Butler
St S
E
Tanner St SEBell
St S
E
Coca Cola Pl SE
I-75
Exw
y SE
Piedmon
t Ave
SE
JACKSON PL
Boaz St SE
Porters Aly NE
I-75 Exw
y NE
I-75 Ram
p
I-75
Ram
p
I-75
Exw
y SE
Irwin St NE
Auburn Ave NE
Bou
leva
rd
NE
Ran
dolp
h S
t NE
How
ell S
t NE
Hog
ue S
t NE
Old Wheat St NE
Bra
dley
St N
E
AIR
LIN
E S
TA
irlin
e S
t NE
Gaspero St NE
Gra
pe S
t NE
Sam
pson
St N
E
How
ell S
t NE
Old Wheat St NE
See Map 1 See Map 2
Map 1: West Parcels
Map 2: East Parcels
1.
2.
3.
4.
14.
6.
9.
2.1.
3.
4.
25.
5.
13.10.
11.12.
17.18.
20.
21.19.
15.
22.
24.23.
16.
Map 1: West Parcels1. 142 Auburn Avenue Northeast2. 265 Auburn Avenue Northeast
3. 349 Old Wheat Street Northeast4. 348 Old Wheat Street Northeast
Map 2: East Parcels1. 507 Irwin Street Northeast2. 515 Irwin Street Northeast
3. 109 Hogue Street Northeast4. 85 Boulevard Northeast5. 479 Old Wheat Street Northeast
6. 112 Bradley Street Northeast7. 97 Howell Street Northeast8. 95 Howell Street Northeast9. 100 Bradley Street Northeast
10. 76 Howell Street Northeast
H D D C P R O P E R T Y P O R T F O L I OH D D C P R O P E R T Y P O R T F O L I O
§̈¦
§̈¦
7.
8.
Map 2: East Parcels Cont.11. 70 Howell Street Northeast12. 66 Howell Street Northeast
13. 71 Howell Street Northeast14. 610 Irwin Street Northeast15. 594 Auburn Avenue Northeast
16. 631 Irwin Street Northeast17. 619 Auburn Avenue Northeast18. 615 Auburn Avenue Northeast19. 609 Auburn Avenue Northeast
20. 66 Airline Street Northeast21. 372 Old Wheat Street Northeast22. Airline Street Northeast (Lot 98)
23. 1-3 Airline Street Northeast24. 13 Airline Street Northeast25. 75 Boulevard Northeast
Map by: Marvin Clermont¯
Vacant Land
Vacant Land and Building
Occupied
75
75
0 0.1 0.20.05Miles
0 0.05 0.10.025Miles
0 0.25 0.50.125Miles
Auburn Ave NE
Edgewood Ave SE
Irwin St NE
But
ler S
t NE
Bel
l St N
E I-75 Exw
y NE
Jack
son
St N
E
I-75
Ram
p
Bou
leva
rd
NE
Hill
iard
St N
E
Pie
dmon
t Ave
NE
Fort
St N
E
Old Wheat St NE
John Wesley Dobbs Ave NE
Chamberlain St SE
Butler
St S
E
Tanner St SEBell
St S
E
Coca Cola Pl SE
I-75
Exw
y SE
Piedmon
t Ave
SE
JACKSON PL
Boaz St SE
Porters Aly NE
I-75 Exw
y NE
I-75 Ram
p
I-75
Ram
p
I-75
Exw
y SE
Irwin St NE
Auburn Ave NE
Bou
leva
rd
NE
Ran
dolp
h S
t NE
How
ell S
t NE
Hog
ue S
t NE
Old Wheat St NE
Bra
dley
St N
E
AIR
LIN
E S
TA
irlin
e S
t NE
Gaspero St NE
Gra
pe S
t NE
Sam
pson
St N
E
How
ell S
t NE
Old Wheat St NE
See Map 1 See Map 2
Map 1: West Parcels
Map 2: East Parcels
1.
2.
3.
4.
14.
6.
9.
2.1.
3.
4.
25.
5.
13.10.
11.12.
17.18.
20.
21.19.
15.
22.
24.23.
16.
Map 1: West Parcels1. 142 Auburn Avenue Northeast2. 265 Auburn Avenue Northeast
3. 349 Old Wheat Street Northeast4. 348 Old Wheat Street Northeast
Map 2: East Parcels1. 507 Irwin Street Northeast2. 515 Irwin Street Northeast
3. 109 Hogue Street Northeast4. 85 Boulevard Northeast5. 479 Old Wheat Street Northeast
6. 112 Bradley Street Northeast7. 97 Howell Street Northeast8. 95 Howell Street Northeast9. 100 Bradley Street Northeast
10. 76 Howell Street Northeast
H D D C P R O P E R T Y P O R T F O L I OH D D C P R O P E R T Y P O R T F O L I O
§̈¦
§̈¦
7.
8.
Map 2: East Parcels Cont.11. 70 Howell Street Northeast12. 66 Howell Street Northeast
13. 71 Howell Street Northeast14. 610 Irwin Street Northeast15. 594 Auburn Avenue Northeast
16. 631 Irwin Street Northeast17. 619 Auburn Avenue Northeast18. 615 Auburn Avenue Northeast19. 609 Auburn Avenue Northeast
20. 66 Airline Street Northeast21. 372 Old Wheat Street Northeast22. Airline Street Northeast (Lot 98)
23. 1-3 Airline Street Northeast24. 13 Airline Street Northeast25. 75 Boulevard Northeast
Map by: Marvin Clermont¯
Vacant Land
Vacant Land and Building
Occupied
75
75
0 0.1 0.20.05Miles
0 0.05 0.10.025Miles
0 0.25 0.50.125Miles
HDDC Parcels in Plane View
Historic District Development Corporation (HDDC)
Page 21 | Marvin Clermont
Parcels West of Boulevard
Put Filler here
Auburn Ave NE
Edgewood Ave SE
Irwin St NE
But
ler S
t NE
Bel
l St N
E I-75 Exw
y NE
Jack
son
St N
E
I-75
Ram
p
Bou
leva
rd
NE
Hill
iard
St N
E
Pie
dmon
t Ave
NE
Fort
St N
E
Old Wheat St NE
John Wesley Dobbs Ave NE
Chamberlain St SE
Butler
St S
E
Tanner St SEBell
St S
E
Coca Cola Pl SE
I-75
Exw
y SE
Piedmon
t Ave
SE
JACKSON PL
Boaz St SE
Porters Aly NE
I-75 Exw
y NE
I-75 Ram
p
I-75
Ram
p
I-75
Exw
y SE
Irwin St NE
Auburn Ave NE
Bou
leva
rd
NE
Ran
dolp
h S
t NE
How
ell S
t NE
Hog
ue S
t NE
Old Wheat St NE
Bra
dley
St N
E
AIR
LIN
E S
TA
irlin
e S
t NE
Gaspero St NE
Gra
pe S
t NE
Sam
pson
St N
E
How
ell S
t NE
Old Wheat St NE
See Map 1 See Map 2
Map 1: West Parcels
Map 2: East Parcels
1.
2.
3.
4.
14.
6.
9.
2.1.
3.
4.
25.
5.
13.10.
11.12.
17.18.
20.
21.19.
15.
22.
24.23.
16.
Map 1: West Parcels1. 142 Auburn Avenue Northeast2. 265 Auburn Avenue Northeast
3. 349 Old Wheat Street Northeast4. 348 Old Wheat Street Northeast
Map 2: East Parcels1. 507 Irwin Street Northeast2. 515 Irwin Street Northeast
3. 109 Hogue Street Northeast4. 85 Boulevard Northeast5. 479 Old Wheat Street Northeast
6. 112 Bradley Street Northeast7. 97 Howell Street Northeast8. 95 Howell Street Northeast9. 100 Bradley Street Northeast
10. 76 Howell Street Northeast
H D D C P R O P E R T Y P O R T F O L I OH D D C P R O P E R T Y P O R T F O L I O
§̈¦
§̈¦
7.
8.
Map 2: East Parcels Cont.11. 70 Howell Street Northeast12. 66 Howell Street Northeast
13. 71 Howell Street Northeast14. 610 Irwin Street Northeast15. 594 Auburn Avenue Northeast
16. 631 Irwin Street Northeast17. 619 Auburn Avenue Northeast18. 615 Auburn Avenue Northeast19. 609 Auburn Avenue Northeast
20. 66 Airline Street Northeast21. 372 Old Wheat Street Northeast22. Airline Street Northeast (Lot 98)
23. 1-3 Airline Street Northeast24. 13 Airline Street Northeast25. 75 Boulevard Northeast
Map by: Marvin Clermont¯
Vacant Land
Vacant Land and Building
Occupied
75
75
0 0.1 0.20.05Miles
0 0.05 0.10.025Miles
0 0.25 0.50.125Miles
Auburn Ave NE
Edgewood Ave SE
Irwin St NE
But
ler S
t NE
Bel
l St N
E I-75 Exw
y NE
Jack
son
St N
E
I-75
Ram
p
Bou
leva
rd
NE
Hill
iard
St N
E
Pie
dmon
t Ave
NE
Fort
St N
E
Old Wheat St NE
John Wesley Dobbs Ave NE
Chamberlain St SE
Butler
St S
E
Tanner St SEBell
St S
E
Coca Cola Pl SE
I-75
Exw
y SE
Piedmon
t Ave
SE
JACKSON PL
Boaz St SE
Porters Aly NE
I-75 Exw
y NE
I-75 Ram
p
I-75
Ram
p
I-75
Exw
y SE
Irwin St NE
Auburn Ave NE
Bou
leva
rd
NE
Ran
dolp
h S
t NE
How
ell S
t NE
Hog
ue S
t NE
Old Wheat St NE
Bra
dley
St N
E
AIR
LIN
E S
TA
irlin
e S
t NE
Gaspero St NE
Gra
pe S
t NE
Sam
pson
St N
E
How
ell S
t NE
Old Wheat St NE
See Map 1 See Map 2
Map 1: West Parcels
Map 2: East Parcels
1.
2.
3.
4.
14.
6.
9.
2.1.
3.
4.
25.
5.
13.10.
11.12.
17.18.
20.
21.19.
15.
22.
24.23.
16.
Map 1: West Parcels1. 142 Auburn Avenue Northeast2. 265 Auburn Avenue Northeast
3. 349 Old Wheat Street Northeast4. 348 Old Wheat Street Northeast
Map 2: East Parcels1. 507 Irwin Street Northeast2. 515 Irwin Street Northeast
3. 109 Hogue Street Northeast4. 85 Boulevard Northeast5. 479 Old Wheat Street Northeast
6. 112 Bradley Street Northeast7. 97 Howell Street Northeast8. 95 Howell Street Northeast9. 100 Bradley Street Northeast
10. 76 Howell Street Northeast
H D D C P R O P E R T Y P O R T F O L I OH D D C P R O P E R T Y P O R T F O L I O
§̈¦
§̈¦
7.
8.
Map 2: East Parcels Cont.11. 70 Howell Street Northeast12. 66 Howell Street Northeast
13. 71 Howell Street Northeast14. 610 Irwin Street Northeast15. 594 Auburn Avenue Northeast
16. 631 Irwin Street Northeast17. 619 Auburn Avenue Northeast18. 615 Auburn Avenue Northeast19. 609 Auburn Avenue Northeast
20. 66 Airline Street Northeast21. 372 Old Wheat Street Northeast22. Airline Street Northeast (Lot 98)
23. 1-3 Airline Street Northeast24. 13 Airline Street Northeast25. 75 Boulevard Northeast
Map by: Marvin Clermont¯
Vacant Land
Vacant Land and Building
Occupied
75
75
0 0.1 0.20.05Miles
0 0.05 0.10.025Miles
0 0.25 0.50.125Miles
Parcels East of Boulevard
Marvin Clermont | Page 22
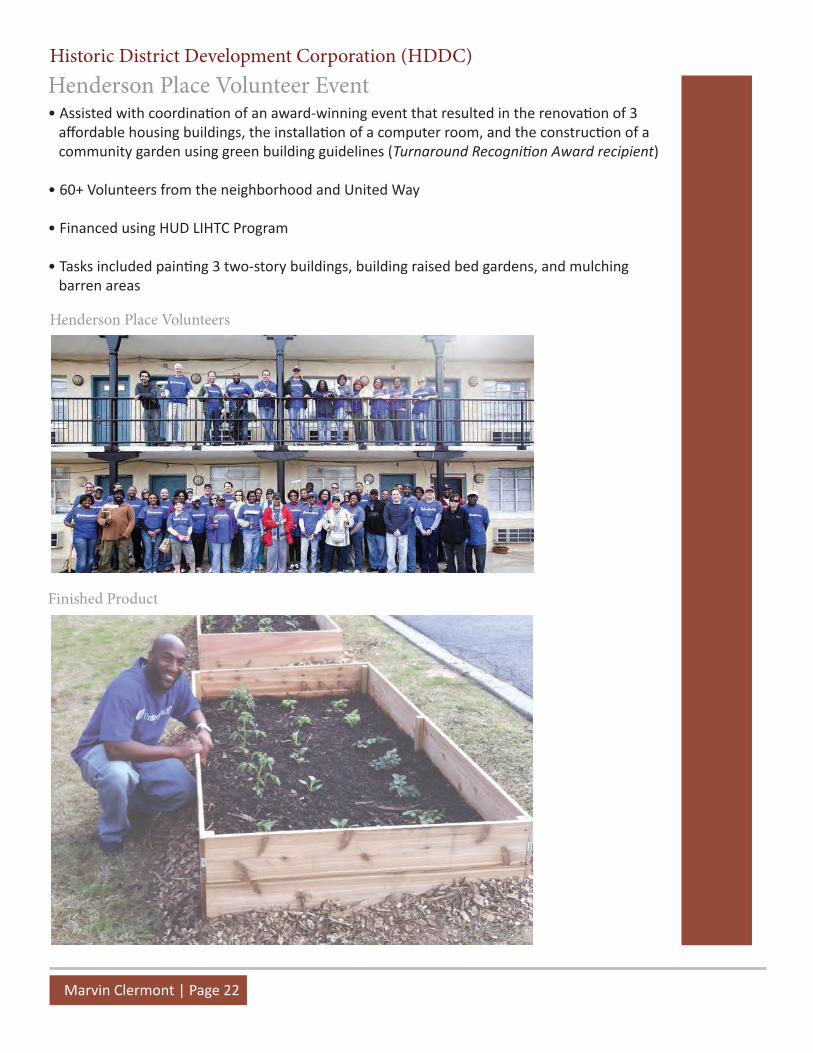
Henderson Place Volunteer Event• Assisted with coordinati on of an award-winning event that resulted in the renovati on of 3 aff ordable housing buildings, the installati on of a computer room, and the constructi on of a community garden using green building guidelines (Turnaround Recogniti on Award recipient)
• 60+ Volunteers from the neighborhood and United Way
• Financed using HUD LIHTC Program
• Tasks included painti ng 3 two-story buildings, building raised bed gardens, and mulching barren areas
Finished Product
Henderson Place Volunteers
Historic District Development Corporation (HDDC)
Page 23 | Marvin Clermont
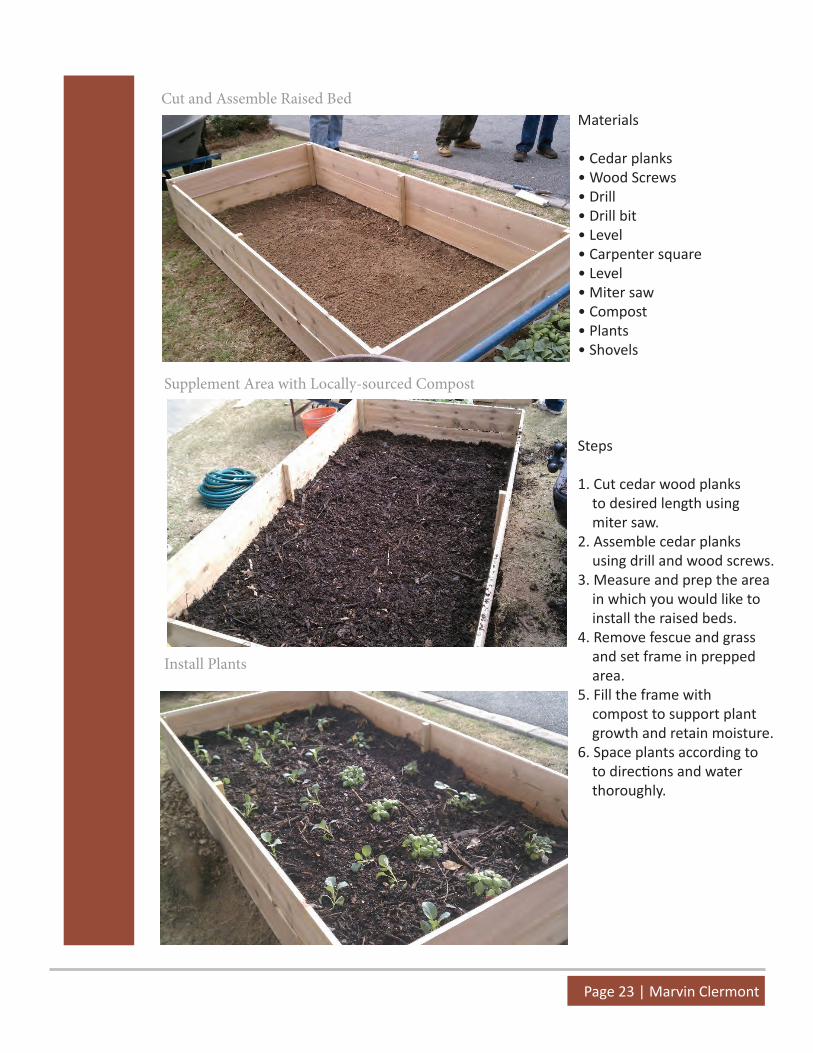
Cut and Assemble Raised Bed
Supplement Area with Locally-sourced Compost
Install Plants
Materials
• Cedar planks• Wood Screws• Drill• Drill bit• Level• Carpenter square• Level• Miter saw• Compost• Plants• Shovels
Steps
1. Cut cedar wood planks to desired length using miter saw.2. Assemble cedar planks using drill and wood screws.3. Measure and prep the area in which you would like to install the raised beds.4. Remove fescue and grass and set frame in prepped area.5. Fill the frame with compost to support plant growth and retain moisture.6. Space plants according to to directi ons and water thoroughly.


Journeyman Landscaping Experience
Outreach
Landscaping/Outreach
Marvin Clermont | Page 24
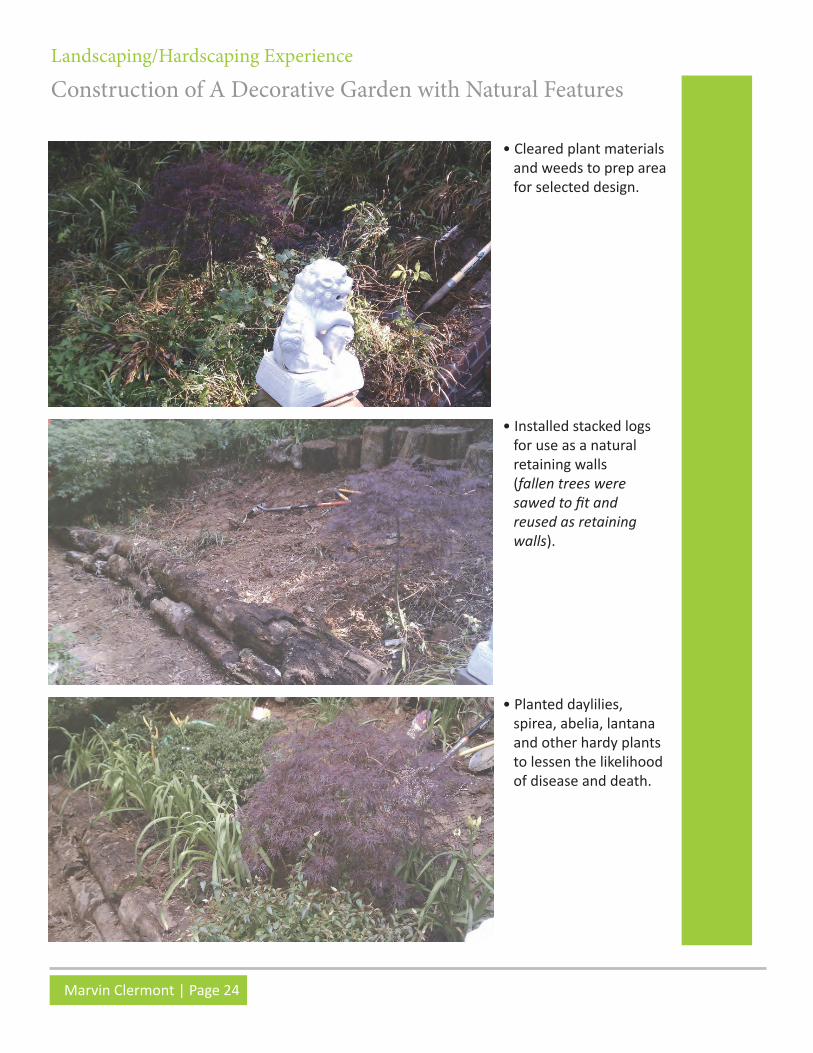
Construction of A Decorative Garden with Natural Features
• Cleared plant materials and weeds to prep area for selected design.
Landscaping/Hardscaping Experience
• Installed stacked logs for use as a natural retaining walls (fallen trees were sawed to fi t and reused as retaining walls).
• Planted daylilies, spirea, abelia, lantana and other hardy plants to lessen the likelihood of disease and death.
Page 25 | Marvin Clermont
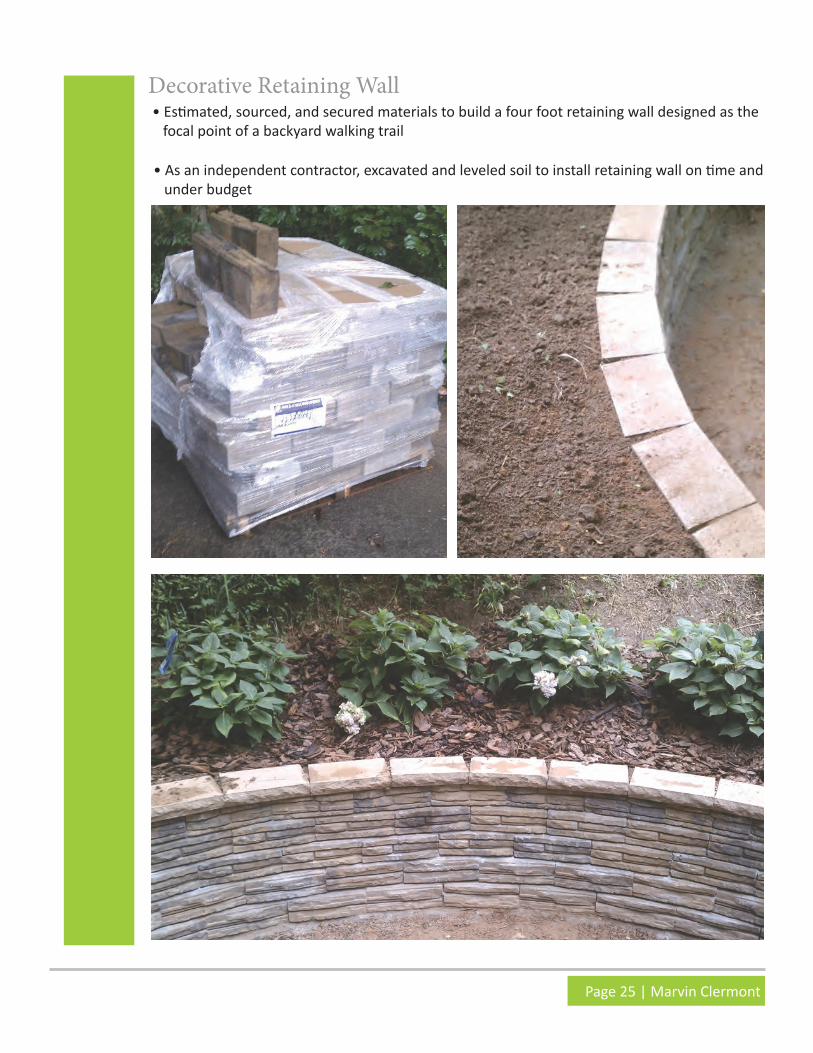
Decorative Retaining Wall• Esti mated, sourced, and secured materials to build a four foot retaining wall designed as the focal point of a backyard walking trail
• As an independent contractor, excavated and leveled soil to install retaining wall on ti me and under budget

Marvin Clermont | Page 26
English Avenue Community Volunteer Group
• Volunteer event organized every Spring with/for members of the community
• Installed plants and amended soil to increase the survival of freshly laid sod
Volunteer Work
Page 27 | Marvin Clermont
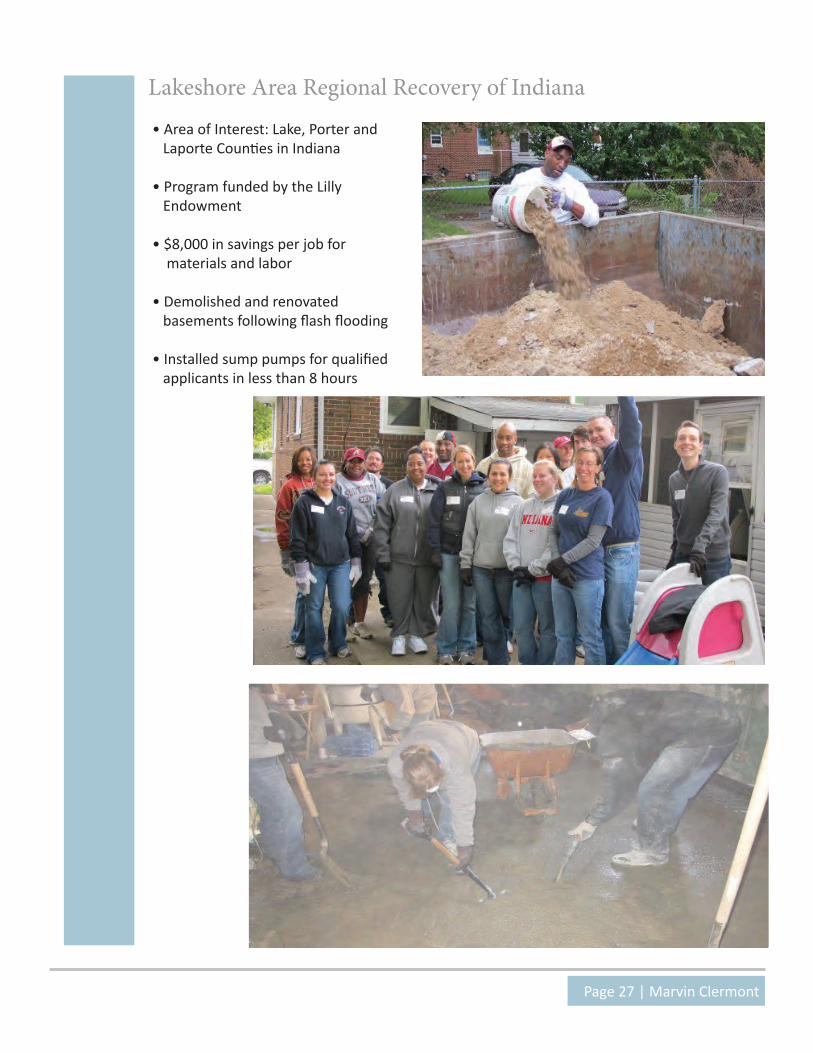
Lakeshore Area Regional Recovery of Indiana
• Area of Interest: Lake, Porter and Laporte Counti es in Indiana
• Program funded by the Lilly Endowment
• $8,000 in savings per job for materials and labor
• Demolished and renovated basements following fl ash fl ooding
• Installed sump pumps for qualifi ed applicants in less than 8 hours


Studio/Bloomberg Homeless Asset Mapping
Writing Sample
Coursework

Marvin Clermont | Page 28
Investigating the Eff ects of Sea Level Rise on the Gullah Geechee in Coastal Georgia• Award-winning presentati on at the Florida Academy of the Sciences | March 8th, 2013
• Assumpti on: 1.0 meter Sea Level Rise (SLR) by 2100
• Sixty-nine acres of Pin Point, Georgia expected to be inundated (Populati on 107 residents)
• Roads leading to Georgia Regional Hospital on Census block 1002 in Sandfl y, GA expected to face inundati on (Populati on 1,123 residents | 132 on Block 1002)
• Hog Hammock on Sapelo Island | 95% of the infrastructure is predicted to face at least parti al inundati on (Populati on 77 residents)
Studio - Fall 2012
Eff ects on the Gullah Geechee
Page 29 | Marvin Clermont
""
"
"
"
"
"
"
"
"""" " "
""
"
""
"
""
""
""
"
"
""""""
""
"
!!
!
!
!
!
!
!
!
!
!
!
!
!
!
!
!!
!!
!
!
!
!
!
!
!
!
!
!
!
!
!
!
!
!
!!
!
!
!
!
!
!!!
!
!!
!
! !
!
!
!
!
!
!
!!
!
!
!
!
!
!
!
!
!
!
!
!
!
!
!
!
!
!!
!
!
!
! !
!
!
!
!
!
!
!
!
!
!
!
!!
!
!
!
!
!
!
!
!
!!
!
!
!!!
!!
!
!
!
!
!
!!
!
!
!
!
!
!
!
!
!
!!
!
!
!
!
!
!
!
!
!
!
!
!
!
!
!
!
!
!
!
!
!
!
!
!
!
!
!
!
!
!
!
!!
!
!
!
!
!
!
!
!
!
!
!!
!
!
!
!
!
!
!
!
!
!
!
!
!
!
!
!
!
!
!
!!
!
!
! !
!
!
!! !
! !
!
!!
!
!!
!
!
!
!!
!
!
!
!
!
!
!
!
!
!
!
!
!
!
!
!
!
!
!!
!
!
!
!
!!
!
!
!
!
! !
!
!
!
!
!
!
! !
!
!
!
!
!!
!
!
!
!
!
!
!
!
!!
!
!
!
!
!
!
!
!
!
!
!
!
!!
!
!
!
!
!
!
!
!!
!
!
!
!
!
!
!
! !
!
!
!
!
!
!!
!
!
!!
!
!!
!
!
D E K A L BD E K A L B
F U L T O NF U L T O N
Atlanta
Fulton
Bartow
Cobb
Coweta
Henry
Gwinnett
Cherokee
DeKalb
Paulding
Forsyth
Fayette
Douglas
Clayton
Rockdale
! Food Pantry
! Thanksgiving Meal
! Clothing Donation Program
! General Clothing Provision
! Project Overcoat
! Thrift Shop
" MARTA Rail Station
MARTA Rail Line
Expressway
¯0 5 102.5 Miles
F O O D & C L O T H I N GF O O D & C L O T H I N G
Map Created by:Michael Hellier | Marvin Clermont
"
"
"
" "
""
"
"
"
"
"
"
""
"
!!
!
!
!
!
!
!
!
!!
!
!
!
!!
!
!
!
!!!
!
!
!
!
!
!
!
!
!!
!
!
!
! !
!
!
!
!
!
!
!
!
!
!
!
!
!
!
!
!
!
!
!
!!
!
!
!
!
!
!
!
!
!
!
!
!
!
!
!
!
!
!
!
!
!!
!
!
!
!
!
!
!
!
!
!
!
!!
!!
!
!
!
!
!
!
!!
!
!
!
!
!
! !
!!
!
!
!
!
!
!
!
!
!
!
!
!
!
!
!
!
!
!
! !
!
!
!
!
!
!
!
!
!
!
!
Atlanta Inset
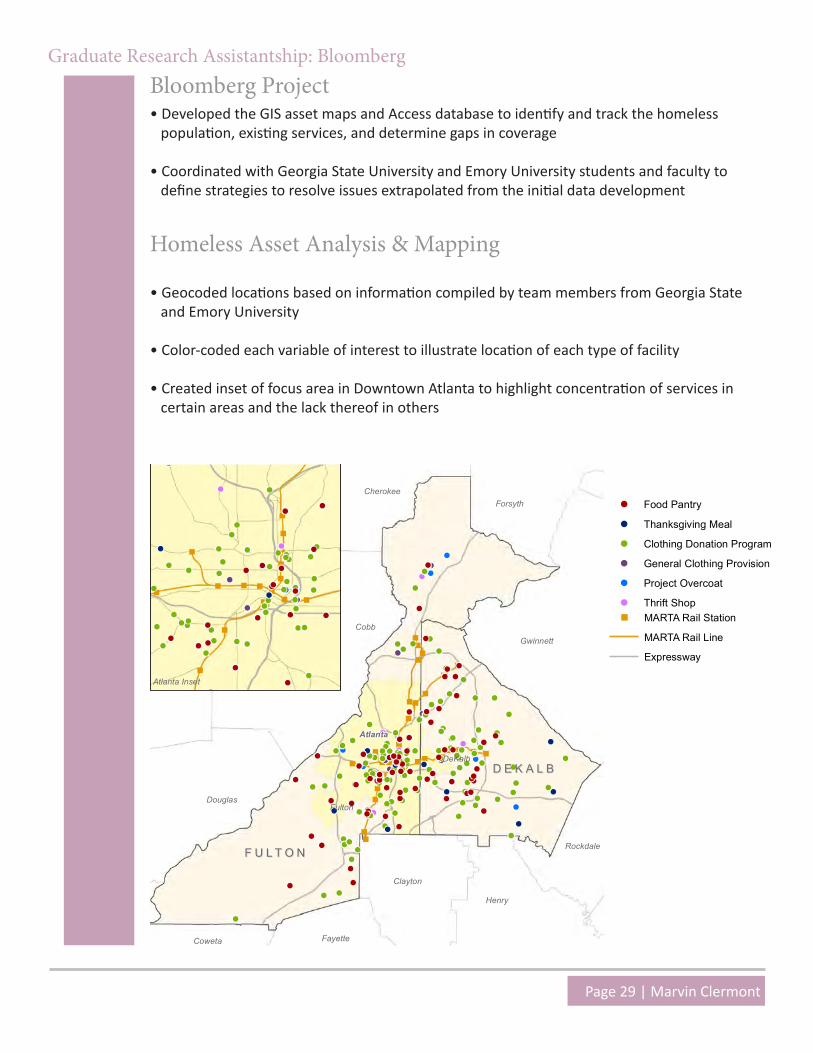
Bloomberg Project• Developed the GIS asset maps and Access database to identify and track the homeless population, existing services, and determine gaps in coverage
• Coordinated with Georgia State University and Emory University students and faculty to define strategies to resolve issues extrapolated from the initial data development
• Geocoded locations based on information compiled by team members from Georgia State and Emory University
• Color-coded each variable of interest to illustrate location of each type of facility
• Created inset of focus area in Downtown Atlanta to highlight concentration of services in certain areas and the lack thereof in others
""
"
"
"
"
"
"
"
"""" " "
""
"
""
"
""
""
""
"
"
""""""
""
"
!!
!
!
!
!
!
!
!
!
!
!
!
!
!
!
!!
!!
!
!
!
!
!
!
!
!
!
!
!
!
!
!
!
!
!!
!
!
!
!
!
!!!
!
!!
!
! !
!
!
!
!
!
!
!!
!
!
!
!
!
!
!
!
!
!
!
!
!
!
!
!
!
!!
!
!
!
! !
!
!
!
!
!
!
!
!
!
!
!
!!
!
!
!
!
!
!
!
!
!!
!
!
!!!
!!
!
!
!
!
!
!!
!
!
!
!
!
!
!
!
!
!!
!
!
!
!
!
!
!
!
!
!
!
!
!
!
!
!
!
!
!
!
!
!
!
!
!
!
!
!
!
!
!
!!
!
!
!
!
!
!
!
!
!
!
!!
!
!
!
!
!
!
!
!
!
!
!
!
!
!
!
!
!
!
!
!!
!
!
! !
!
!
!! !
! !
!
!!
!
!!
!
!
!
!!
!
!
!
!
!
!
!
!
!
!
!
!
!
!
!
!
!
!
!!
!
!
!
!
!!
!
!
!
!
! !
!
!
!
!
!
!
! !
!
!
!
!
!!
!
!
!
!
!
!
!
!
!!
!
!
!
!
!
!
!
!
!
!
!
!
!!
!
!
!
!
!
!
!
!!
!
!
!
!
!
!
!
! !
!
!
!
!
!
!!
!
!
!!
!
!!
!
!
D E K A L BD E K A L B
F U L T O NF U L T O N
Atlanta
Fulton
Bartow
Cobb
Coweta
Henry
Gwinnett
Cherokee
DeKalb
Paulding
Forsyth
Fayette
Douglas
Clayton
Rockdale
! Food Pantry
! Thanksgiving Meal
! Clothing Donation Program
! General Clothing Provision
! Project Overcoat
! Thrift Shop
" MARTA Rail Station
MARTA Rail Line
Expressway
¯0 5 102.5 Miles
F O O D & C L O T H I N GF O O D & C L O T H I N G
Map Created by:Michael Hellier | Marvin Clermont
"
"
"
" "
""
"
"
"
"
"
"
""
"
!!
!
!
!
!
!
!
!
!!
!
!
!
!!
!
!
!
!!!
!
!
!
!
!
!
!
!
!!
!
!
!
! !
!
!
!
!
!
!
!
!
!
!
!
!
!
!
!
!
!
!
!
!!
!
!
!
!
!
!
!
!
!
!
!
!
!
!
!
!
!
!
!
!
!!
!
!
!
!
!
!
!
!
!
!
!
!!
!!
!
!
!
!
!
!
!!
!
!
!
!
!
! !
!!
!
!
!
!
!
!
!
!
!
!
!
!
!
!
!
!
!
!
! !
!
!
!
!
!
!
!
!
!
!
!
Atlanta Inset
""
"
"
"
"
"
"
"
"""" " "
""
"
""
"
""
""
""
"
"
""""""
""
"
!!
!
!
!
!
!
!
!
!
!
!
!
!
!
!
!!
!!
!
!
!
!
!
!
!
!
!
!
!
!
!
!
!
!
!!
!
!
!
!
!
!!!
!
!!
!
! !
!
!
!
!
!
!
!!
!
!
!
!
!
!
!
!
!
!
!
!
!
!
!
!
!
!!
!
!
!
! !
!
!
!
!
!
!
!
!
!
!
!
!!
!
!
!
!
!
!
!
!
!!
!
!
!!!
!!
!
!
!
!
!
!!
!
!
!
!
!
!
!
!
!
!!
!
!
!
!
!
!
!
!
!
!
!
!
!
!
!
!
!
!
!
!
!
!
!
!
!
!
!
!
!
!
!
!!
!
!
!
!
!
!
!
!
!
!
!!
!
!
!
!
!
!
!
!
!
!
!
!
!
!
!
!
!
!
!
!!
!
!
! !
!
!
!! !
! !
!
!!
!
!!
!
!
!
!!
!
!
!
!
!
!
!
!
!
!
!
!
!
!
!
!
!
!
!!
!
!
!
!
!!
!
!
!
!
! !
!
!
!
!
!
!
! !
!
!
!
!
!!
!
!
!
!
!
!
!
!
!!
!
!
!
!
!
!
!
!
!
!
!
!
!!
!
!
!
!
!
!
!
!!
!
!
!
!
!
!
!
! !
!
!
!
!
!
!!
!
!
!!
!
!!
!
!
D E K A L BD E K A L B
F U L T O NF U L T O N
Atlanta
Fulton
Bartow
Cobb
Coweta
Henry
Gwinnett
Cherokee
DeKalb
Paulding
Forsyth
Fayette
Douglas
Clayton
Rockdale
! Food Pantry
! Thanksgiving Meal
! Clothing Donation Program
! General Clothing Provision
! Project Overcoat
! Thrift Shop
" MARTA Rail Station
MARTA Rail Line
Expressway
¯0 5 102.5 Miles
F O O D & C L O T H I N GF O O D & C L O T H I N G
Map Created by:Michael Hellier | Marvin Clermont
"
"
"
" "
""
"
"
"
"
"
"
""
"
!!
!
!
!
!
!
!
!
!!
!
!
!
!!
!
!
!
!!!
!
!
!
!
!
!
!
!
!!
!
!
!
! !
!
!
!
!
!
!
!
!
!
!
!
!
!
!
!
!
!
!
!
!!
!
!
!
!
!
!
!
!
!
!
!
!
!
!
!
!
!
!
!
!
!!
!
!
!
!
!
!
!
!
!
!
!
!!
!!
!
!
!
!
!
!
!!
!
!
!
!
!
! !
!!
!
!
!
!
!
!
!
!
!
!
!
!
!
!
!
!
!
!
! !
!
!
!
!
!
!
!
!
!
!
!
Atlanta Inset
Graduate Research Assistantship: Bloomberg
Homeless Asset Analysis & Mapping

Marvin Clermont | Page 30
2013 LCI Implementation ReportEmployment is a criti cal factor when tracking the success of the LCI program. Data reveals that while LCI areas only represent a small percentage of the region’s geographical footprint, LCI communiti es contribute exponenti ally to the Atlanta region jobs. According to the 2010 Census, 36% of jobs in the 13 county-region are located in LCI communiti es. Furthermore, 44% of the jobs in LCI communiti es off er an annual salary above $40,000 per year. These well-paying jobs represent 16% of all jobs in the region according to NAICS (North American Industry Classifi cati on System). Given the concentrati on of jobs and offi ce development in LCI areas, the LCI program is ulti mately helping to make these areas transit-supporti ve. Not surprisingly there are many new transit projects being evaluated that serve LCI areas such as the Northwest Corridor BRT which will traverse six diff erent LCIs in Cobb County.
In additi on to creati ng commercial and economic centers in the region, the workers who live in LCI communiti es share a trend. According to the 2010 Census, 39% of the employees who live in LCI communiti es earn a wage that exceeds $40,000. LCI communiti es create a sense of community by integrati ng housing and employment, as well as historic character and development patt erns. The employees who live in LCI communiti es represent 11% of the workforce in the region; however, their locati on provides a multi tude of opti ons for places to work. Jobs are available in LCI communiti es, and the people in the communiti es are making a good wage. These results are but a porti on of the goal that the ARC envisions when providing funding for development.
Writing Sample - Excerpts
Clarkston Development FoundationThe enti re populati on of the Service Area was 21,989 in 2010. According to the 2000 Census, the City of Clarkston’s populati on was 7,231 residents. The 2010 Census shows a populati on of 7,554 residents, representi ng a 4.5% increase over the 10-year ti me period. Clarkston fared well relati vely to other small citi es in Metro Atlanta. According to the Atlanta Regional Commission (ARC), during this same ti me period, thirteen citi es in the ten-county region experienced declines in populati on. Two of these citi es, Doraville and Stone Mountain, are also located in DeKalb County.The City of Clarkston’s populati on is dominated by three races: White, Black, and Asians. Blacks account for 58.4% of the City’s populati on, while Whites and Asians account for 13.6% and 21.6% respecti vely. The remaining populati on is a combinati on of all other races. This is counter intuiti ve more specifi cally when looking at the Georgia state averages for these same races. The White populati on makes up 59.7% of people living in Georgia, while Blacks and Asians account for 30.5% and 3.2%, respecti vely. Another trend that diff ers widely between Clarkston and the state of Georgia is the percentage of foreign born persons residing in these locati ons. Clarkston’s populati on is made up 39.5% of residents that were not born in the United States, which is more than four ti mes the Georgia average (9.6%). This speaks directly to the percentage of persons who speak a language other than English at home. Clarkston’s percentage of those without English as a fi rst language is 39.5% of the populati on, more than three ti mes that of Georgia’s average of 12.7%.

Page 31 | Marvin Clermont
2010 Prospective Student Writing SampleWriting Sample
It has been said that history repeats itself because no one is listening. Unfortunately, this rings true in Chicago since its inception. Th e people of Chicago have endured through long economic crests and troughs. Th is is due, in large part, to the cyclical nature of the economy and patterns of growth. One outcome of this cycle is gentrifi cation, which oft en results during a city’s economic upswing. Gentrifi cation is the restoration or upgrading of deteriorated urban property by middle-class or affl uent people, resulting in the displacement of lower-income people. Chicago’s urban planning has led to the gentrifi cation of many neighborhoods, which helped and hurt its residents. To improve the city’s economic and social viability, Chicago has introduced several urban renewal plans. One noteworthy plan was the Development Plan for the Central Area of Chicago of 1958. A central component of this plan was to build a University of Illinois campus in Pilsen, a predominantly Mexican neighborhood (Bennett 40). In 1965, UIC opened its doors to 10,000 students and as a result 5,000 people were displaced, 200 businesses were forced out and 800 homes were razed (Betancur 33). This patt ern conti nued in Chicago neighborhoods such as Lincoln Park, Bronzeville, and Old Town.
Chicago 21: A Plan for the Central Area Communiti es, introduced in 1973, is unquesti onably one of the city’s most controversial planning documents. Despite dissenti ng opinions about the plan, all converge on the substanti al impact it had on Chicago’s landscape. The plan emphasized downtown beauti fi cati on and hoped to provide an aestheti c environment which would not be rivaled by any American city (Bennett 41). It did beauti fy the city and att ract investment, but it also led to property tax and rent increases that displaced thousands of low-income residents.
There is debate over whether we are overlooking gentrifi cati on’s positi ve aspects. As citi es begin to thrive, commercial and residenti al properti es gain value. This bodes well for investors, property owners, and city coff ers. For those at risk of being displaced, there is constant concern over the city’s and developer’s decisions of where to build and how to value a property. Whereas to an investor, these are just variables to consider when examining lot sizes and square footage.
The current impact of gentrifi cati on cannot be measured but many Chicagoans believe it is prevalent today. Cabrini-Green is a housing development once home to 15,000 Chicagoans. As of December 2010 the last remaining building closed its doors. Although tenant acti vists may tell a diff erent story, gang violence and high crime rates were the death of the only public housing complex situated in an affl uent part of the city. It seems that once again the voices of low-income Chicagoans are not being heard.
Gentrifi cati on has both positi ves and negati ves, but more needs to be done to assuage the hardships that it brings to certain populati ons. Rent regulati on, which helps residents from being priced out of their neighborhood, is an example of a provision used to address the problem increased property value presents. This sort of initi ati ve helped my Grandmother live in the same apartment in Brooklyn for nearly 30 years. When dealing with issues around gentrifi cati on it is diffi cult to accommodate all sides. Increasing rent, for example, will always benefi t the payee and hinder the payer. As urban planners we need to create a new urban renewal paradigm that allow business and all residents the opportunity to shape and take ownership of their communiti es and hopefully create a win-win scenario. History repeats itself because no one is listening; it is ti me to allow all voices an opportunity to be heard.


Marvin L. Clermont
p: 312.618.9164
MCRP | Georgia Tech 13’
Land Use
Land & Community Development


