68
ALDAR PROPERTIES PJSC 2015 Annual Report
| Date post: | 07-Dec-2018 |
| Category: |
Documents |
| Upload: | truongkhanh |
| View: | 215 times |
| Download: | 0 times |
Aldar 20
15 Annual R
eport
ALDAR PROPERTIES PJSC
2015 Annual Report

Overview 2
Chairman’s Message 4
CEO’s Message 6
CFO’s Message 8
Financial Statements
Board of Directors’ Report 11
Financial Review 12
Independent Auditor’s Report 14
Consolidated Statement of Financial Position 16
Consolidated Income Statement 17
Consolidated Statement of Comprehensive Income 18
Consolidated Statement of Changes in Equity 19
Consolidated Statement of Cash Flows 20
Notes to the Consolidated Financial Statements 22

1Aldar Annual Report 2015
Aldar Properties PJSC, is the leading real estate developer in Abu Dhabi, and through its iconic developments, it is one of the most well known in the United Arab Emirates, and wider Middle East region.
From its beginnings in 2005 through to today, Aldar continues to shape and enhance the urban fabric of the UAE’s Capital City in addition to other key areas of the Emirate.
Aldar develops exciting and innovative projects, such as the internationally recognized HQ building situated in the Al Raha Beach development, the Gate Towers in Shams Abu Dhabi on Al Reem Island, in addition to Yas Island’s F1 circuit.
Aldar’s shares are traded on the Abu Dhabi Securities Exchange and is a profitable, cash generative business that provides recurring revenues, and benefits from a diverse and supportive shareholder base. Aldar operates according to high standards of corporate governance and is committed to operating a long term and sustainable business in order to provide ongoing value for its shareholders.
Aldar seeks to create quality, comfortable, desirable destinations that enrich the lives of Abu Dhabi residents as well as tourists within the Emirate. Aldar is playing a leading role in the development and provision of world class retail – Yas Mall, international standard education through Aldar Academies, iconic entertainment venues such as the Yas Marina Circuit, and community amenities across its entire portfolio.

2 Annual Report 2015Aldar
Strategy for growth
Quality of earnings
Strong financial position
Debt management has been a key focal point for the Group over the last several years. Gross debt has reduced from AED 13.8 billion two years ago to AED 6.0 billion as at 31 December 2015. The balance sheet has been further strengthened by collection of receivables which has led to the further debt pay down and build up in cash, resulting in a leaner and financially flexible balance sheet today.
Gross profit from recurring revenues was up 49% to AED 1.5 billion supported by the stabilisation of new assets, predominantly Yas Mall and the expanded residential portfolio. The increased contribution of recurring revenues also supported gross profit margins leading to a better underlying quality of earnings.
Gross profit from recurring revenues
+49%TO AED 1.5 BN
Debt paid down during 2015
3.1bnAED
Overview
3Annual Report 2015 Aldar
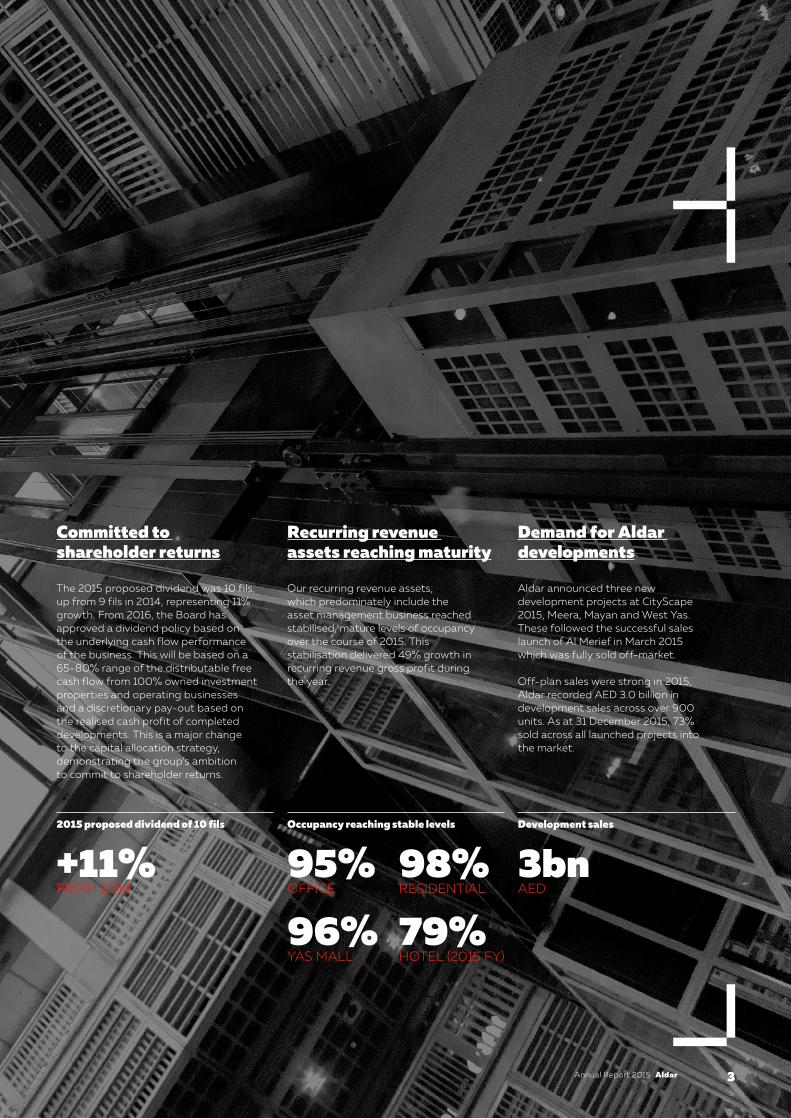
Demand for Aldar developments
Recurring revenue assets reaching maturity
Committed to shareholder returns
Aldar announced three new development projects at CityScape 2015, Meera, Mayan and West Yas. These followed the successful sales launch of Al Merief in March 2015 which was fully sold off-market.
Off-plan sales were strong in 2015, Aldar recorded AED 3.0 billion in development sales across over 900 units. As at 31 December 2015, 73% sold across all launched projects into the market.
The 2015 proposed dividend was 10 fils, up from 9 fils in 2014, representing 11% growth. From 2016, the Board has approved a dividend policy based on the underlying cash flow performance of the business. This will be based on a 65-80% range of the distributable free cash flow from 100% owned investment properties and operating businesses and a discretionary pay-out based on the realised cash profit of completed developments. This is a major change to the capital allocation strategy, demonstrating the group’s ambition to commit to shareholder returns.
Our recurring revenue assets, which predominately include the asset management business reached stabilised, mature levels of occupancy over the course of 2015. This stabilisation delivered 49% growth in recurring revenue gross profit during the year.
2015 proposed dividend of 10 fils
+11%FROM 2014
Occupancy reaching stable levels
95%OFFICE
96%YAS MALL
98%RESIDENTIAL
79%HOTEL (2015 FY)
Development sales
3bnAED
4 Aldar Annual Report 2015
Our strategy remains clear
Chairman’s MessageAbubaker Seddiq Al Khoori
The diversification of Abu Dhabi’s economy has continued apace. Through substantial investment in non-oil industries, the Government is enabling economic growth as well as accelerating the private sector. With the Abu Dhabi economy expected to expand by approximately 3 ½% this year, the appetite for high-quality real estate assets, in my view, will remain strong.
We are a proud contributor to the economic development of Abu Dhabi. Since inception, we have worked alongside the Government of Abu Dhabi, often acting as the voice of the private sector, in order to create a business environment that facilitates innovation, collaboration and prosperity.
Throughout our ten year history, we have nurtured our company through its evolution and key to our success in building a mature company centred on growth is clear accountability and consistent transparency. As such, the introduction of the new Abu Dhabi Real Estate law at the beginning of 2016 is an initiative we wholeheartedly support and welcome. The new law encourages visibility, predictability and will increase investment which can only advance the sector. Regulation and policy are the cornerstones of a well-functioning industry and play an important role in the development of our sector, helping us deliver high quality products to the consumer, at the right time.

5Aldar Annual Report 2015
The legislation will help shape the sector as it provides greater clarity on the process of off-plan sales and improve the quality of information available through a newly established registry. Each element of the new law will ultimately help the public to make the right purchasing decisions, helping to create trust in the industry and differentiating the developers. Further, as we were part of the process to design and deliver the new law, we are well prepared to implement it.
As the leading developer in Abu Dhabi, we have a responsibility to deliver only the highest quality property assets to the market. Through this role we can improve the quality of life of our customers, while also contributing to the local economy. The five projects launched in 2015 are testament to our focus on excellence and the success of sales seen at Nareel, Meera, Mayan, Al Merief and West Yas shows that our strategy works.
2015 was another strong year for Aldar and Abu Dhabi. We continued to deliver against our strategy of growing recurring revenue assets, de-risking our balance sheet, and monetising our land bank. This success has created a more stable and mature company, one that can withstand any possible challenge in the market.
Internally, we continued to pursue a considered growth strategy as set out over two years ago by our current Board. This approach balances a sensible investment strategy with a commitment to growing our recurring revenue assets, providing a more stable platform to grow earnings. Our focus on prudent financial management, debt reduction and efficient resource management has enabled us to deliver a robust financial performance in 2015.
We are conscious of the trust that our shareholders have placed in Aldar since inception, and in return we remain focused on delivering exceptional shareholder value. As such, I am pleased to announce that our Board has approved the implementation of a formalised dividend policy, underlining our commitment to returning capital to shareholders.
A great deal of our positive performance over the past three years can be attributed to the strength of our incumbent Board and management and the decisions they make. Their commitment, experience and knowledge have helped guide the development of a solid and sustainable business model. I would like to take this opportunity to thank them for their commitment over their tenure.
2015 was another strong year for Aldar. We continued to deliver against our strategy of growing recurring revenue assets, de-risking our balance sheet, and monetising our land bank.
As we consider the future, I am confident that the strategy we have in place is the right one. We have a strong pipeline of investments and developments that positions us well for future success. We have differentiated ourselves by providing the highest quality product and services, which underpins the increasing demand for our properties. By focusing on the delivery of high quality products and services, I am confident that demand will remain strong. As we enter 2016, I look forward again to sharing our many achievements with our shareholders, customers, and the residents of Abu Dhabi.
Sources1 – UAE Economic Outlook 2016 conference, UAE Minister of Economy Sultan bin Saeed Al Mansouri said on 9th December 2015.
6 Aldar Annual Report 2015
A clear strategy for growth
CEO’s MessageMohamed Khalifa Al Mubarak
By many measures, the Aldar of today is a mature company with the focus on delivering world class real estate assets and our commitment to creating shareholder value.
2015 was a year where we showed substantial progress in delivering against our strategy. We have weather-proofed our business to combat a sometimes uncertain external environment. Aldar is well positioned for the long-term. We are proud of our stable and maturing business and continue to play to our strengths: delivering the right product, at the right price, in the right location.
Our focus on stabilising recurring revenue assets has significantly improved the quality of our earnings and provided clarity on long-term cash flows.
The results speak for themselves. All our key financial metrics continue to move in the right direction.
Development sales amounted to AED 3.0 billion in 2015, supported by the launch of our five developments, while gross profit from recurring revenue grew by 49% to AED 1.5 billion. Our FY Net Profit rose 13% to AED 2.6 billion, and gross debt was reduced by 35% to AED 6.0 billion.

7Aldar Annual Report 2015
But these results by themselves do not show all the progress made over the past 12 months in de-risking the business and allocating capital in a more efficient manner. By completing our deleveraging cycle and establishing our reoccurring revenue business, we have been able to formalise a progressive dividend policy, one that reflects the underlying cash flow performance of our two core businesses.
Growth remains central to the Aldar story. And while we can be justifiably satisfied with a strong 2015 performance, we continue to look for opportunities to take our business forward. Our goal of generating AED 2.2 billion in recurring revenue by 2020 shows that our ambitions continue to grow, alongside the company.
Property development is at the very heart of what we do and we continued to see strong demand for our products in 2015. During the course of the year, five residential projects were successfully launched; three sold out, and one project is ongoing. We recognise that there are still untapped development opportunities in Abu Dhabi, and our strategy remains focused on developing our prime destinations, Yas Island, Al Raha Beach and Shams Abu Dhabi.
In terms of our asset management business, the performance of Yas Mall in 2015 exceeded our own very high expectations. Since opening, Yas Mall has attracted over 20 million visitors and continues to deliver a high quality shopping experience through a variety of household brands such as Apple, The Cheesecake Factory, Zara and Debenhams. Today, our residential portfolio is fully leased, and we continue to see strong demand for Aldar residential assets. In 2015, the company’s hotel portfolio occupancy was in-line with 2014 and continues to outperform the wider Abu Dhabi market, underpinned by the ongoing development of Yas Island.
Our Adjacent Businesses, which include Aldar Academies and Khidmah, continue to grow. From one school and 250 students in 2007, Aldar Academies now encompasses over 5,100 pupils across 6 schools and is set to expand further with Al Mamoura school under development, which will bring up to an additional 1,800 students capacity.
Property development is at the very heart of what we do and we continued to see strong demand for our products in 2015.
Central to any successful company are the hard working people who share a common set of values and a clear sense of purpose. By embracing change and working together we have been able to achieve the goals we set out at the start of 2015. I would like to thank each and every Aldar employee for the contribution they have made to our success over the past 12 months.
We head into the new financial year with our business in excellent shape. Our consistent outperformance over the past couple of years underlines the success of our actions in positioning the business for the next stage of growth. Aldar’s development and asset management portfolios are well matched to underlying demand, and our balance sheet remains strong. This gives me great confidence that our best days are still ahead of us.

8 Aldar Annual Report 2015
Strong platform for growth
CFO’s MessageGreg Fewer
Aldar achieved strong financial performance in 2015. The growth in our recurring revenues lead to a better quality of earnings further supported by improved margins as new key assets stabilised and contributed meaningfully to the bottom line. We also saw a significant strengthening of our balance sheet driven by the collection of Government receivables and further repayment of debt which now sits at our Board approved debt policy levels.
RECURRING REVENUE GROWTH Our recurring revenue assets, which predominantly includes our asset management business segment, saw a 49% growth in gross profit in 2015, led by stabilisation of the fully leased Yas Mall where retailers opened shops throughout 2015 and by increased contribution from our expanded residential asset base.
We have seen unprecedented demand for our assets, with all real estate asset classes contributing to growth as we now reach mature levels of occupancy. Yas Mall reached 96% trading occupancy as at year end and now has all key anchors fully in place, which will drive footfall growth. Our residential and office portfolios continue to perform strongly with occupancy reaching 98% and 95% respectively, with rents remaining stable to low single digit growth despite wider market softening towards the latter part of the year.

9Aldar Annual Report 2015
Under the prior accounting policy, IAS 18, revenues were fully recognised on handover of a completed off-plan sale unit to the buyer. The new accounting standard considers the terms of our sales agreements with residential customers and recognises revenues over time for development off-plan sales and as such provides a very different development revenue profile to that under IAS 18. Development revenues in 2014 were recorded under the previous standard and were supported by the high number of handovers during the year which essentially closed out the last development cycle. During 2015, we started to recognise revenue on our new developments on a percentage completion basis as per IFRS 15. This will provide a visible development revenue profile going forward, as revenue is matched to the completion of project reflecting the underlying activities of the development business.
Development revenues during 2015 were AED 1.0 billion. This included the recognition of AED 0.6 billion under IFRS 15 for new Aldar development projects. During 2016, as construction on key projects such as Ansam and Al Hadeel progresses, revenue will be recorded as percentage completion progresses on site.
BALANCE SHEET STRENGTH Debt has been a major focal area for management in recent years in order to achieve a robust and financially flexible balance sheet. During 2015, a further AED 3.1 billion dirhams of debt was paid down and today, Aldar is operating in line with its debt policy to maintain gross debt at 35-40% against the value of its recurring revenue assets. Debt as at 31 December 2015 stood at AED 6.0 billion and we do not expect any major pay down going forward.
Collection of receivables was another theme in 2015, with AED 3.4 billion collected from the Government of Abu Dhabi for asset transaction sales and infrastructure recoverables and a further AED 400 million in land receivables supporting the repayment of debt during the year and build up of cash.
Our balance sheet today stands strong and we want to ensure we maintain this strength and flexibility to support the business in delivering its strategy going forward.
COMMITMENT TO SHAREHOLDER RETURNSThe formalisation of a dividend policy from 2016 will provide investors with clear visibility on cash flows and shareholder return. This is a significant move, demonstrating the maturity of the business today and recognition of shareholder returns as a key part of our capital allocation strategy.
The dividend policy is based on the underlying cash flow performance of business. The policy will have two components, a 65-80% pay-out range of the distributable free cash flow of 100% owned investment properties and operating businesses and a discretionary pay-out of cash profits on completion of newly launched off-plan developments.
Overall, we have made significant progress towards our strategy in 2015. Going forward our financial position provides the business with the necessary platform for the next stage of growth as indicated by our ambition to grow the recurring revenue business and continue to target untapped segments of the real estate development market.
Our hotel portfolio also performed well with occupancy at 79% during 2015, in line with 2014. At the same time, we have managed to increase rates ahead of the wider Abu Dhabi market.
Whilst we saw significant growth in our recurring revenues over 2015, this level of growth is set to stabilise as all asset classes are now fully in place and reaching mature operational levels. Beyond 2016, we have set a clear target to achieve 40% growth in our net operating income from our recurring revenue assets by 2020 through a combination of organic growth and AED 3.0 billion investment plan, of which AED 900 million or 30% has been committed or deployed as of today.
DEVELOPMENT REVENUE RECOGNITIONDuring 2015, Aldar sold AED 3.0 billion of residential off-plan development product across over 900 units. AED 2.0 billion of these sales related to Aldar’s project developments including Nareel, Merief, Meera and Mayan and AED 0.9 billion related to over 200 unit sales for the West Yas development management project.
A significant factor that has impacted the financial reporting of development activities during the year was the early adoption of IFRS 15, a new revenue accounting standard governing revenue recognition and contracts with customers.
Our balance sheet today stands strong and we want to ensure that we maintain this strength and flexibility to support the business in delivering its strategy going forward.

10 Aldar Annual Report 2015
FINANCIAL STATEMENTS
Aldar Properties PJSCReports and Consolidated Financial StatementsYear ended 31 December 2015
Pages
Board of Directors’ Report 11
Financial Review 12
Independent Auditor’s Report 14
Consolidated Statement of Financial Position 16
Consolidated Income Statement 17
Consolidated Statement of Comprehensive Income 18
Consolidated Statement of Changes in Equity 19
Consolidated Statement of Cash Flows 20
Notes to the Consolidated Financial Statements 22

11Aldar Annual Report 2015
Board of Directors’ Report
On behalf of the Board of Directors, I am delighted to present the consolidated audited financial statements of Aldar Properties PJSC (“the Company”) and its subsidiaries (together referred to as “the Group”) for the year ended 31 December 2015.
PRINCIPAL ACTIVITIESThe principal activities of the Group continue to be the property development, investment and management of its real estate assets including offices, malls, hotels, schools, marinas and golf courses.
FINANCIAL RESULTSThe financial results of the Group have been presented on page 16 of these consolidated financial statements. Please also refer to financial review section for details.
FINANCIAL STATEMENTSThe Directors reviewed and approved the consolidated financial statements of the Group for the year ended 31 December 2015.
DIRECTORSThe members of the Board of Directors as of 31 December 2015 are:
H.E Abubaker Seddiq Al Khoori ChairmanH.E Ali Eid Al Mheiri Vice ChairmanH.E Dr. Sultan Ahmed Al Jaber DirectorMr. Ali Saeed Abdulla Sulayem Al Falasi DirectorMr. Mansour Mohamed Al Mulla DirectorMr. Ahmed Khalifa Mohamed Al Mehairi DirectorMr. Mohamed Haji Al Khoori DirectorMr. Hamed Al Ameri DirectorMr. Martin Lee Edelman Director
RELEASEThe Directors release from liability the external auditor and management in connection with their duties for the year ended 31 December 2015.
On behalf of the Board of Directors
Abubaker Seddiq Al KhooriChairman14 February 2016
12 Aldar Annual Report 2015
FINANCIAL STATEMENTS
Financial Review
The financial information contained in this review is based on the consolidated financial statements.
HIGHLIGHTS• Improved quality of earnings in 2015 as greater proportion of revenue was generated from recurring revenue assets as compared
to 2014 where the primary driver of revenues was development handovers. As a result of this change in revenue, mix gross profit margins more than doubled from 23% in 2014 to 48% in 2015.
• Full-year gross profit from recurring revenues rose by 45% to AED 1.5 billion in 2015, underpinned by the stabilisation of key assets including Yas Mall, as well as an overall improvement in the operational performance across all asset classes.
• Increase in gross profit predominately reflects the contribution of Yas Mall which opened in Q4 2014.• Gross debt fell 35% year-on-year to AED 6.0 billion and is now in line with debt policy.• Successful development sales across Al Merief, Shams Meera and Mayan in 2015; total of 1,886 units across six development projects
including Al Hadeel, Ansam and Al Nareel projects.• Proposed cash dividend for 2015 is 10 fils per share, a 11% increase over 2014.
FINANCIAL ANALYSISASSET MANAGEMENTRevenues from our asset management portfolio, which includes investment properties, hotels, operative villages and leisure was up by 30% in 2015 to AED 2.4 billion.
Full-year gross profit from asset management revenues rose 54% to AED 1.4 billion in 2015, underpinned by the stabilisation of key assets including Yas Mall, as well as an overall improvement in the operational performance across all asset classes.
This growth is set to continue into 2016 with a fully stabilised Yas Mall and as assets are added pursuant to our announced AED 3.0 billion investment plan that has already been activated following the Daman House acquisition and AED 410 million and renovation extension of Al Jimi Mall in Al Ain.
Following the fair valuation of its investment properties, the Company recorded AED 487.0 million of net fair value gains for the year which resulted mainly from yield compression offset by some write downs on land.
Other operational achievements for the year 2015 were as follows:Retail• Yas Mall is reaching full occupancy with key anchors Apple Store and Tryano opening in Q4 2015. Since its opening the Mall has
attracted over 20 million visitors, 18 million of whom visited in 2015.
Residential• Residential portfolio is 98% leased with continued demand for quality residential in Abu Dhabi.
Office• Office occupancy is 95% as at year end supported by the fully let Daman House acquisition in December 2015.
Hotels• Hotel portfolio occupancy was in line with 2014 and continues to outperform the wider Abu Dhabi market in occupancy by 5%.
PROPERTY DEVELOPMENT & MANAGEMENTAldar’s property development pipeline has been boosted by the successful launches of Al Merief in Khalifa City, Shams Meera on Al Reem Island and Mayan on Yas this year. These new launches are steadily supported by progress on projects such as Ansam on Yas Island, Al Hadeel at Al Raha Beach and Nareel Island, which were launched in 2014.
Property Development and Management, which includes Property Development and Sales and Development Management revenues for the year, amounted to AED 1,270 million during 2015, contributing AED 669.7 million to the gross profit.
Property Development and Sales revenue was lower in 2015 compared to the prior year predominantly due to large number of unit handovers in 2014 recorded under the previous IAS 18 revenue recognition method whereby 100% of revenues were recorded upon handover to customers. Growth in segmental property development profits year-on-year are derived from newly-launched off-plan residential projects where revenue and profit is recorded over time under IFRS 15, in addition to growth in income from our Development Management business that came from contracts with the Government of Abu Dhabi.

13Aldar Annual Report 2015
Other operational achievements for the year 2015 were as follows:Project development• AED 2.0 billion development sales across over 715 off-plan unit sales.• 73% sold across all units launched in the off-plan sales market as at 31 December 2015.
Development announcements • AED 900 million in sales at West Yas during 2015, construction contract awarded.
ADJACENT BUSINESSOur adjacent businesses also continue to perform well. Aldar Academies saw a 7% jump in student numbers for the 2015/16 academic year. Khidmah, our property and facilities management business also saw strong revenue growth on new contract signings. Our Pivot contracting division saw increased profit on successful closing of historical contracts.
Operational achievements for the year 2015 were as follows:• Aldar Academies student enrolment up by 7% to 5,053 from 4,736 in previous academic year.• Development of seventh Aldar Academies school, Al Mamoura, currently under construction, adding 1,800 of student capacity to
the portfolio.
CORPORATESelling, general and administrative expenses (excluding depreciation, impairments and amortisation) were lower compared to the corresponding period mainly because of the preopening expenses attributable to Yas Mall in 2014. This is offset by an increase in marketing expenses incurred in 2015 on newly-launched projects.
Other Income represents mainly income recognised upon handover of infrastructure assets to the Government of Abu Dhabi and the release of liability/infrastructure cost accruals that have amounted to AED 457.7 million for the year.
CASH FLOWSTotal cash for the Group increases by AED 1.6 billion during the year.
The Group had net cash inflows of AED 6.0 billion from operating activities for the year ended 31 December 2015. This was mainly due to the collection of receivables from assets sold to the Government of Abu Dhabi amounting to AED 3.7 billion and collections from customers on our recent off-plan sales in addition to the cash collected from operating assets.
AED 3.5 billion of this cash was utilised in repayment of borrowings and the related finance costs. The Group redistributed AED 694 million of cash to its shareholders in the form dividends for the year 2015.
DEBT MANAGEMENTDuring 2015, the Group continued to strengthen its balance sheet through the collection of receivables and further deleveraging. Gross debt stood at AED 6.0 billion as at 31 December 2015, down from AED 9.1 billion as at the end of 2014 and is operating in line with the debt policy whereby gross debt should be 35-40% of the value of our investment properties and operating businesses.
During the fourth quarter of 2015 Aldar successfully increased its committed bank credit facilities to AED 2.0 billion, from AED 1.8 billion, and extended the maturity of these facilities by just under 4 years to March 2021. The extended bank credit facilities, which are currently fully undrawn, were agreed at commercial terms in line with the previous facilities.
Greg FewerChief Financial Officer14 February 2016

14 Aldar Annual Report 2015
FINANCIAL STATEMENTS
Independent Auditor’s ReportTo the Shareholders of Aldar Properties PJSC
REPORT ON THE CONSOLIDATED FINANCIAL STATEMENTSWe have audited the accompanying consolidated financial statements of Aldar Properties PJSC (“the Company”) and its subsidiaries (together “the Group”) comprising of the consolidated statement of financial position as at 31 December 2015 and the related consolidated statements of income, comprehensive income, changes in equity and cash flows for the year then ended and a summary of significant accounting policies and other explanatory notes.
MANAGEMENT’S RESPONSIBILITY FOR THE CONSOLIDATED FINANCIAL STATEMENTSManagement is responsible for the preparation and fair presentation of these consolidated financial statements in accordance with International Financial Reporting Standards and in compliance with the applicable provisions of the UAE Federal Law No. (2) of 2015, and for such internal control as management determines is necessary to enable the preparation of consolidated financial statements that are free from material misstatement, whether due to fraud or error.
AUDITORS’ RESPONSIBILITYOur responsibility is to express an opinion on these consolidated financial statements based on our audit. We conducted our audit in accordance with International Standards on Auditing. Those standards require that we comply with ethical requirements and plan and perform the audit to obtain reasonable assurance whether the consolidated financial statements are free from material misstatement.
An audit involves performing procedures to obtain audit evidence about the amounts and disclosures in the consolidated financial statements. The procedures selected depend on the auditor’s judgment, including the assessment of the risks of material misstatement of the consolidated financial statements, whether due to fraud or error. In making those risk assessments, the auditor considers internal control relevant to the entity’s preparation and fair presentation of the consolidated financial statements in order to design audit procedures that are appropriate in the circumstances, but not for the purpose of expressing an opinion on the effectiveness of the entity’s internal control. An audit also includes evaluating the appropriateness of accounting policies used and the reasonableness of accounting estimates made by management, as well as evaluating the overall presentation of the consolidated financial statements.
We believe that the audit evidence we have obtained is sufficient and appropriate to provide a basis for our audit opinion.
OPINIONIn our opinion, the consolidated financial statements present fairly, in all material respects the financial position of the Group as of 31 December 2015, and its financial performance and cash flows for the year then ended in accordance with International Financial Reporting Standards.
OTHER MATTERThe consolidated financial statements of the Group for the year ended 31 December 2014, were audited by another auditor who expressed an unmodified opinion on those financial statements on 11 February 2015.

15Aldar Annual Report 2015
REPORT ON OTHER LEGAL AND REGULATORY REQUIREMENTSFurther, as required by the UAE Federal Law No. (2) of 2015, we report that:
i) we have obtained all the information and explanations we considered necessary for the purposes of our audit;ii) the consolidated financial statements have been prepared and comply, in all material respects, with the applicable provisions
of the UAE Federal Law No. (2) of 2015, and Articles of Association of the Company; iii) the Group has maintained proper books of account;iv) the consolidated financial information included in the Directors’ report is consistent with the books of account and records
of the Group; v) investments in shares and stocks are included in Notes 8 and 9 to the consolidated financial statements and include purchases and
investments made by the Group during the year ended 31 December 2015;vi) Note 31 reflects the disclosures relating to related party transactions and the terms under which they were conducted; vii) based on the information that has been made available to us nothing has come to our attention which causes us to believe that the
Company has contravened, during the financial year ended 31 December 2015, any of the applicable provisions of the UAE Federal Law No. (2) of 2015 or its Articles of Association which would materially affect its activities or its consolidated financial position as at 31 December 2015; and
viii) Note 37 reflects the social contributions during the year.
Signed byAnthony O’SullivanPartnerErnst & YoungRegistration No. 687
14 February 2016Abu Dhabi
16 Aldar Annual Report 2015
FINANCIAL STATEMENTS
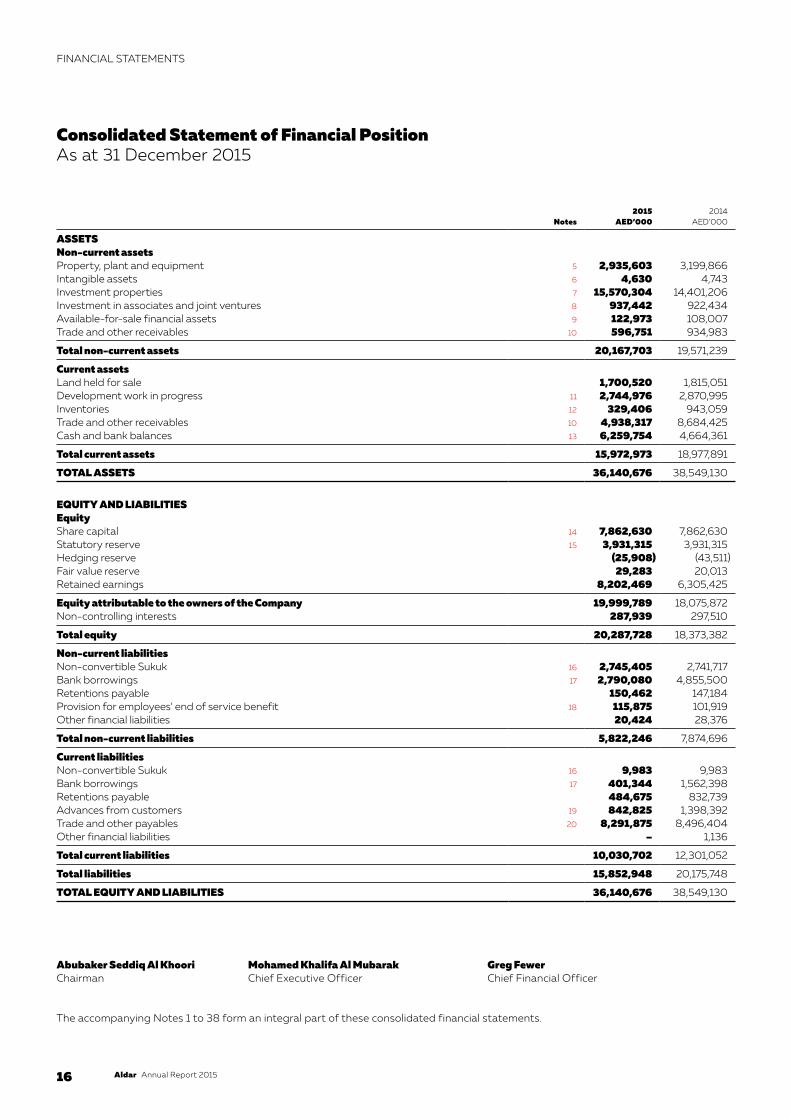
Consolidated Statement of Financial PositionAs at 31 December 2015
Notes2015
AED’0002014
AED’000
ASSETSNon-current assetsProperty, plant and equipment 5 2,935,603 3,199,866Intangible assets 6 4,630 4,743Investment properties 7 15,570,304 14,401,206Investment in associates and joint ventures 8 937,442 922,434Available-for-sale financial assets 9 122,973 108,007Trade and other receivables 10 596,751 934,983
Total non-current assets 20,167,703 19,571,239
Current assetsLand held for sale 1,700,520 1,815,051Development work in progress 11 2,744,976 2,870,995Inventories 12 329,406 943,059Trade and other receivables 10 4,938,317 8,684,425Cash and bank balances 13 6,259,754 4,664,361
Total current assets 15,972,973 18,977,891
TOTAL ASSETS 36,140,676 38,549,130
EQUITY AND LIABILITIESEquityShare capital 14 7,862,630 7,862,630Statutory reserve 15 3,931,315 3,931,315Hedging reserve (25,908) (43,511)Fair value reserve 29,283 20,013Retained earnings 8,202,469 6,305,425
Equity attributable to the owners of the Company 19,999,789 18,075,872Non-controlling interests 287,939 297,510
Total equity 20,287,728 18,373,382
Non-current liabilitiesNon-convertible Sukuk 16 2,745,405 2,741,717Bank borrowings 17 2,790,080 4,855,500Retentions payable 150,462 147,184Provision for employees’ end of service benefit 18 115,875 101,919Other financial liabilities 20,424 28,376
Total non-current liabilities 5,822,246 7,874,696
Current liabilitiesNon-convertible Sukuk 16 9,983 9,983Bank borrowings 17 401,344 1,562,398Retentions payable 484,675 832,739Advances from customers 19 842,825 1,398,392Trade and other payables 20 8,291,875 8,496,404Other financial liabilities – 1,136
Total current liabilities 10,030,702 12,301,052
Total liabilities 15,852,948 20,175,748
TOTAL EQUITY AND LIABILITIES 36,140,676 38,549,130
Abubaker Seddiq Al Khoori Mohamed Khalifa Al Mubarak Greg FewerChairman Chief Executive Officer Chief Financial Officer
The accompanying Notes 1 to 38 form an integral part of these consolidated financial statements.

17Aldar Annual Report 2015
Notes2015
AED’0002014
AED’000
Revenue 21 4,585,540 6,551,078Direct costs 22 (2,379,616) (5,032,672)
GROSS PROFIT 2,205,924 1,518,406
Selling and marketing expenses 23 (61,266) (35,540)General and administrative expenses:
Staff costs 24 (229,509) (231,226)Depreciation and amortisation (209,950) (227,670)(Provisions, impairments and write downs)/reversal – net 25 (289,134) 196,483Pre-opening expenses of operational businesses – (50,298)Other (89,888) (136,533)
Share of profit from associates and joint ventures 8 161,323 96,006Gain on disposal of investment in an associate – 42,039Gain on disposal of investment properties 32,376 28,437Fair value gain on investment properties 7 487,011 474,157Gain on discontinued operations 36 – 9,720Finance income 26 98,474 110,587Finance costs 27 (239,661) (381,795)Other income 28 694,167 853,580
PROFIT FOR THE YEAR 2,559,867 2,266,353
Attributable to:Owners of the Company 2,536,794 2,235,136Non-controlling interests 23,073 31,217
2,559,867 2,266,353
Basic and diluted earnings per share attributable to owners of the Company in AED 29 0.323 0.284
The accompanying Notes 1 to 38 form an integral part of these consolidated financial statements.
Consolidated Income StatementFor the year ended 31 December 2015
18 Aldar Annual Report 2015
FINANCIAL STATEMENTS
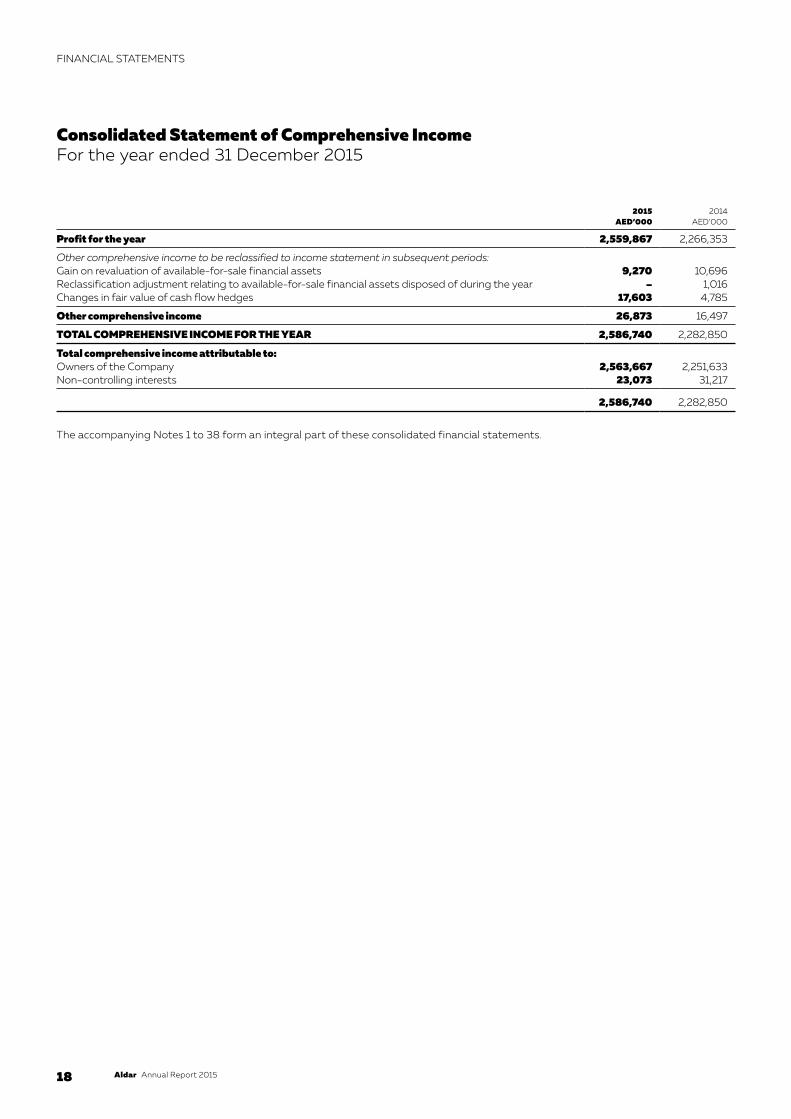
2015AED’000
2014AED’000
Profit for the year 2,559,867 2,266,353
Other comprehensive income to be reclassified to income statement in subsequent periods:Gain on revaluation of available-for-sale financial assets 9,270 10,696Reclassification adjustment relating to available-for-sale financial assets disposed of during the year – 1,016Changes in fair value of cash flow hedges 17,603 4,785
Other comprehensive income 26,873 16,497
TOTAL COMPREHENSIVE INCOME FOR THE YEAR 2,586,740 2,282,850
Total comprehensive income attributable to:Owners of the Company 2,563,667 2,251,633Non-controlling interests 23,073 31,217
2,586,740 2,282,850
The accompanying Notes 1 to 38 form an integral part of these consolidated financial statements.
Consolidated Statement of Comprehensive IncomeFor the year ended 31 December 2015

19Aldar Annual Report 2015
Notes
Sharecapital
AED’000
Sharepremium
AED’000
Shareissuance
costs – netAED’000
Statutoryreserve
AED’000
Hedgingreserve
AED’000
Fair valuereserve
AED’000
Retained earnings/
(accumulated losses)
AED’000
Attributable to owners of
the CompanyAED’000
Non- controlling
interests AED’000
TotalAED’000
Balance at 1 January 2014 7,862,630 10,412,278 (79,920) 1,235,014 (48,296) 8,301 (3,015,384) 16,374,623 273,336 16,647,959
Net transfers during the year (i) – (10,412,278) 79,920 2,696,301 – – 7,636,057 – – –
Profit for the year – – – – – – 2,235,136 2,235,136 31,217 2,266,353Other comprehensive
income – – – – 4,785 11,712 – 16,497 – 16,497Dividends declared 30 – – – – – – (550,384) (550,384) – (550,384)Disposal of interest in
a subsidiary 36 – – – – – – – – (7,043) (7,043)
Balance at 31 December 2014 7,862,630 – – 3,931,315 (43,511) 20,013 6,305,425 18,075,872 297,510 18,373,382
Balance at 31 December 2014 7,862,630 – – 3,931,315 (43,511) 20,013 6,305,425 18,075,872 297,510 18,373,382
Effect of change in accounting policy 2, 1 – – – – – – 54,242 54,242 – 54,242
Balance at 1 January 2015 7,862,630 – – 3,931,315 (43,511) 20,013 6,359,667 18,130,114 297,510 18,427,624
Profit for the year – – – – – – 2,536,794 2,536,794 23,073 2,559,867Other comprehensive
income – – – – 17,603 9,270 – 26,873 – 26,873Acquisition of minority
interest 3.3 – – – – – – 13,644 13,644 (28,644) (15,000)Dividends declared 30 – – – – – – (707,636) (707,636) (4,000) (711,636)
Balance at 31 December 2015 7,862,630 – – 3,931,315 (25,908) 29,283 8,202,469 19,999,789 287,939 20,287,728
(i) During the Annual General Meeting held on 26 March 2014, the shareholders resolved to transfer the share premium to the statutory reserve and thereafter transfer the excess statutory reserve balance representing more than 50% of the share capital to offset accumulated losses amounting to AED 3,015,384,428 and the share issuance costs amounting to AED 79,920,364.
The accompanying Notes 1 to 38 form an integral part of these consolidated financial statements.
Consolidated Statement of Changes in Equity For the year ended 31 December 2015

20 Aldar Annual Report 2015
FINANCIAL STATEMENTS
2015 2014AED’000 AED’000
Cash flows from operating activitiesProfit for the year 2,559,867 2,266,353Adjustments for:
Depreciation and amortisation 220,707 236,776Finance income (98,474) (110,587)Dividend income (1,000) (7,276)Finance costs 219,798 352,536Amortisation of prepaid finance costs 19,863 29,259Fair value gain on investment properties – net (487,011) (474,157)Share of profit from associates and joint ventures (161,323) (96,006)Release of provision for onerous contracts (19,555) (43,570)Impairments/write-offs on projects 79,510 33,201Provision for impairment of trade and other receivables 70,898 28,033Reversal of impairment of inventories – (105,940)Impairment/(reversal of impairment) on property, plant and equipment and intangible assets – net 139,555 (148,905)Reversal of impairment of investment in an associate (8,604) (2,877)Reversal of accruals (509,511) (84,086)Gain on disposal of an associate – (42,039)Gain on disposal of available-for-sale financial assets – (1,249)Gain on disposal of a subsidiary – (9,720)Gain on disposal of property, plant and equipment (11,220) (168)Gain on disposal of investment properties (32,376) (28,437)Provision for end of service benefit – net 13,956 5,018
Operating cash flows before changes in working capital 1,995,080 1,796,159Changes in working capital:Decrease in trade and other receivables 4,196,630 3,751,062Increase in development work in progress (311,021) (155,311)Decrease in inventories 98,953 3,448,546Decrease in retentions payable (344,784) (451,647)Decrease in advances and security deposits from customers (555,567) (1,745,775)Increase in trade and other payables 928,816 18,910
Net cash generated from operating activities 6,008,107 6,661,944
Consolidated Statement of Cash FlowsFor the year ended 31 December 2015
21Aldar Annual Report 2015
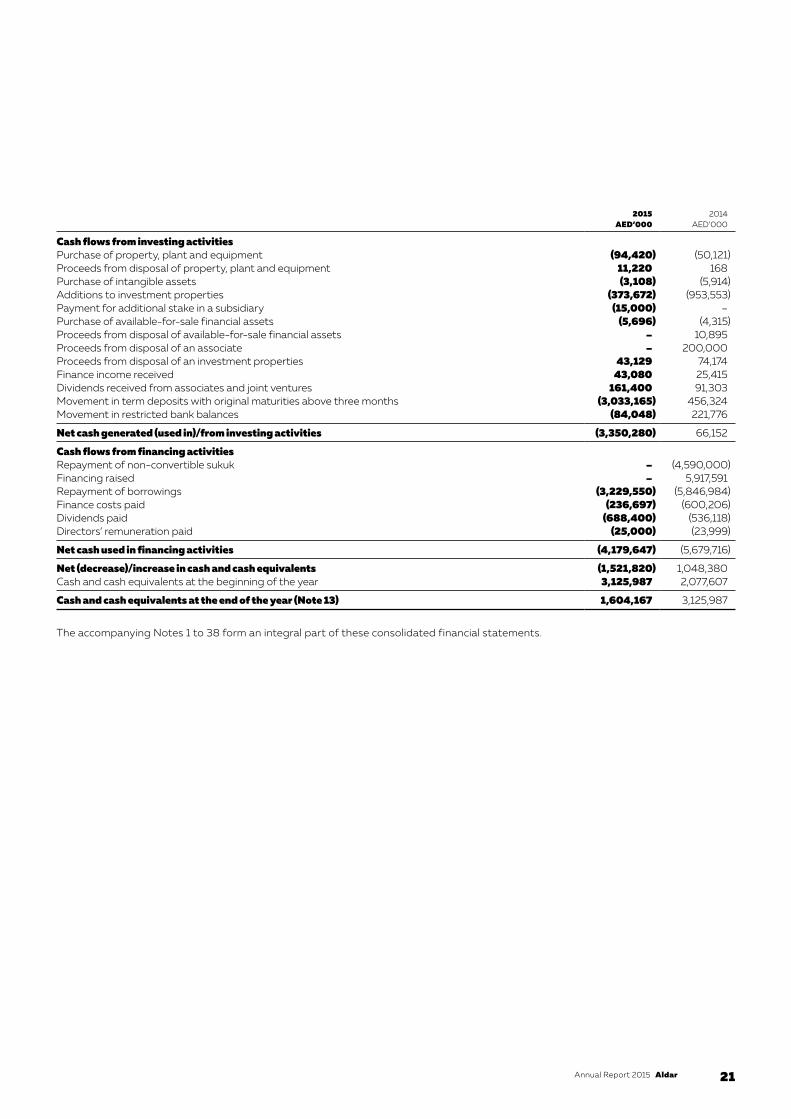
2015AED’000
2014AED’000
Cash flows from investing activitiesPurchase of property, plant and equipment (94,420) (50,121)Proceeds from disposal of property, plant and equipment 11,220 168Purchase of intangible assets (3,108) (5,914)Additions to investment properties (373,672) (953,553)Payment for additional stake in a subsidiary (15,000) –Purchase of available-for-sale financial assets (5,696) (4,315)Proceeds from disposal of available-for-sale financial assets – 10,895Proceeds from disposal of an associate – 200,000Proceeds from disposal of an investment properties 43,129 74,174Finance income received 43,080 25,415Dividends received from associates and joint ventures 161,400 91,303Movement in term deposits with original maturities above three months (3,033,165) 456,324Movement in restricted bank balances (84,048) 221,776
Net cash generated (used in)/from investing activities (3,350,280) 66,152
Cash flows from financing activitiesRepayment of non-convertible sukuk – (4,590,000)Financing raised – 5,917,591Repayment of borrowings (3,229,550) (5,846,984)Finance costs paid (236,697) (600,206)Dividends paid (688,400) (536,118)Directors’ remuneration paid (25,000) (23,999)
Net cash used in financing activities (4,179,647) (5,679,716)
Net (decrease)/increase in cash and cash equivalents (1,521,820) 1,048,380Cash and cash equivalents at the beginning of the year 3,125,987 2,077,607
Cash and cash equivalents at the end of the year (Note 13) 1,604,167 3,125,987
The accompanying Notes 1 to 38 form an integral part of these consolidated financial statements.

22 Aldar Annual Report 2015
FINANCIAL STATEMENTS
1 GENERAL INFORMATIONThe establishment of Aldar Properties PJSC (“the Company”) was approved by Decision No. (16) of 2004 of the Abu Dhabi Department of Planning and Economy dated 12 October 2004. The Company’s incorporation was declared by Ministerial Resolution No. (59) of 2005 issued by the UAE Minister of Economy dated 23 February 2005. The Company is domiciled in the United Arab Emirates and its registered office address is PO Box 51133, Abu Dhabi. The Company’s ordinary shares are listed on Abu Dhabi Securities Exchange.
The Company and its subsidiaries (together referred to as “the Group”) are engaged in various businesses primarily the development, sales, investment, construction, management and associated services for real estate. In addition, the Group is also engaged in development, construction, management and operation of hotels, schools, marinas and golf courses.
2 NEW AND REVISED INTERNATIONAL FINANCIAL REPORTING STANDARDS (IFRS)2.1 STANDARDS ISSUED AND ADOPTEDThe Group applied certain standards, interpretations and amendments for the first time, which are effective for annual periods beginning on or after 1 January 2015. The Group has also opted for the early adoption of IFRS 15 ‘Revenue from Contracts with Customers’ resulting in a change in the revenue recognition policy of the Group in relation to its contracts with customers. The Group has not early adopted any other standard, interpretation or amendment that has been issued but is not yet effective.
The application of these new standards, interpretation and amendment, other than IFRS 15, did not have a material impact on the annual consolidated financial statements of the Group. The nature and the impact of each new standard, interpretation and amendment is described below:
IFRS 15 Revenue from contracts with customersThe Group has opted for the early adoption of IFRS 15 ‘Revenue from Contracts with Customers’ resulting in a change in the revenue recognition policy of the Group in relation to its contracts with customers (refer to Note 3.7 for new accounting policy).
IFRS 15 was issued in May 2014 and is effective for annual periods commencing on or after 1 January 2018, with early adoption permitted. IFRS 15 outlines a single comprehensive model of accounting for revenue arising from contracts with customers and supersedes current revenue guidance, which is found currently across several Standards and Interpretations within IFRSs. It established a new five-step model that will apply to revenue arising from contracts with customers. Under IFRS 15, revenue is recognised at an amount that reflects the consideration to which an entity expects to be entitled in exchange for transferring goods or services to a customer.
The Group has reviewed the impact of IFRS 15 on all its business segments and has elected to early adopt IFRS 15, with effect from 1 January 2015. The Group has opted for the modified retrospective application permitted by IFRS 15 upon adoption of the new standard. Accordingly, the standard has been applied for the year ended 31 December 2015 only (i.e. the initial application period). Modified retrospective application also requires the recognition of the cumulative impact of adoption of IFRS 15 on all contracts as at 1 January 2015 in equity. The details of adjustments to opening retained earnings and other account balances as at 1 January 2015 is detailed below.
Consolidated statement of financial position31 December
2014 AED’000
Adjustments AED’000
1 January 2015
AED’000
AssetsInventory 943,059 (177,677) 765,382LiabilitiesAdvance from customers 1,398,392 (231,919) 1,166,473EquityRetained earnings 6,305,425 54,242 6,359,667
Notes to the Consolidated Financial StatementsFor the year ended 31 December 2015
23Aldar Annual Report 2015
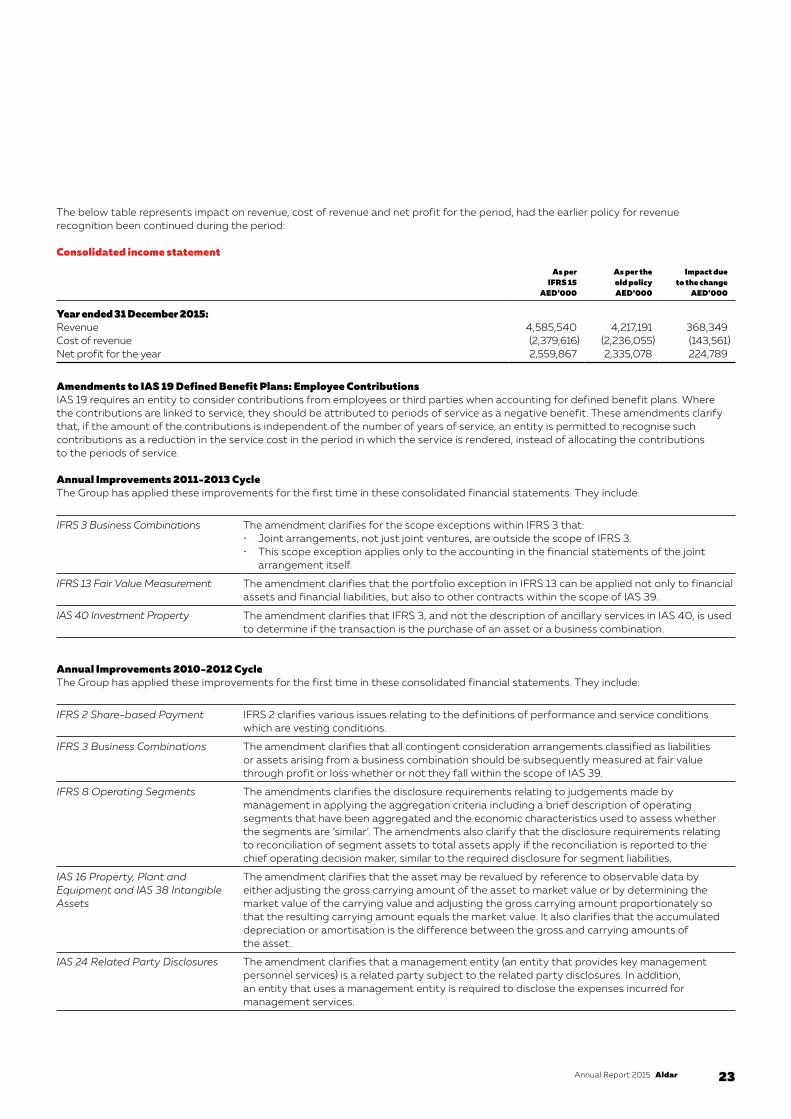
The below table represents impact on revenue, cost of revenue and net profit for the period, had the earlier policy for revenue recognition been continued during the period:
Consolidated income statement
As perIFRS 15
AED’000
As per the old policyAED’000
Impact dueto the change
AED’000
Year ended 31 December 2015:Revenue 4,585,540 4,217,191 368,349Cost of revenue (2,379,616) (2,236,055) (143,561)Net profit for the year 2,559,867 2,335,078 224,789
Amendments to IAS 19 Defined Benefit Plans: Employee ContributionsIAS 19 requires an entity to consider contributions from employees or third parties when accounting for defined benefit plans. Where the contributions are linked to service, they should be attributed to periods of service as a negative benefit. These amendments clarify that, if the amount of the contributions is independent of the number of years of service, an entity is permitted to recognise such contributions as a reduction in the service cost in the period in which the service is rendered, instead of allocating the contributions to the periods of service.
Annual Improvements 2011-2013 CycleThe Group has applied these improvements for the first time in these consolidated financial statements. They include:
IFRS 3 Business Combinations The amendment clarifies for the scope exceptions within IFRS 3 that:• Joint arrangements, not just joint ventures, are outside the scope of IFRS 3.• This scope exception applies only to the accounting in the financial statements of the joint
arrangement itself.
IFRS 13 Fair Value Measurement The amendment clarifies that the portfolio exception in IFRS 13 can be applied not only to financial assets and financial liabilities, but also to other contracts within the scope of IAS 39.
IAS 40 Investment Property The amendment clarifies that IFRS 3, and not the description of ancillary services in IAS 40, is used to determine if the transaction is the purchase of an asset or a business combination.
Annual Improvements 2010-2012 CycleThe Group has applied these improvements for the first time in these consolidated financial statements. They include:
IFRS 2 Share-based Payment IFRS 2 clarifies various issues relating to the definitions of performance and service conditions which are vesting conditions.
IFRS 3 Business Combinations The amendment clarifies that all contingent consideration arrangements classified as liabilities or assets arising from a business combination should be subsequently measured at fair value through profit or loss whether or not they fall within the scope of IAS 39.
IFRS 8 Operating Segments The amendments clarifies the disclosure requirements relating to judgements made by management in applying the aggregation criteria including a brief description of operating segments that have been aggregated and the economic characteristics used to assess whether the segments are ‘similar’. The amendments also clarify that the disclosure requirements relating to reconciliation of segment assets to total assets apply if the reconciliation is reported to the chief operating decision maker, similar to the required disclosure for segment liabilities.
IAS 16 Property, Plant and Equipment and IAS 38 Intangible Assets
The amendment clarifies that the asset may be revalued by reference to observable data by either adjusting the gross carrying amount of the asset to market value or by determining the market value of the carrying value and adjusting the gross carrying amount proportionately so that the resulting carrying amount equals the market value. It also clarifies that the accumulated depreciation or amortisation is the difference between the gross and carrying amounts of the asset.
IAS 24 Related Party Disclosures The amendment clarifies that a management entity (an entity that provides key management personnel services) is a related party subject to the related party disclosures. In addition, an entity that uses a management entity is required to disclose the expenses incurred for management services.

24 Aldar Annual Report 2015
FINANCIAL STATEMENTS
2 NEW AND REVISED INTERNATIONAL FINANCIAL REPORTING STANDARDS (IFRS) CONTINUED2.2 STANDARDS ISSUED BUT NOT YET EFFECTIVEThe standards, interpretations and amendments that are issued, but not yet effective, up to the date of issuance of the Group’s financial statements are disclosed below. The management intends to adopt these standards, if applicable, when they become effective. The management anticipates that the adoption of these standards interpretations and amendments, with the exception of IFRS 16, will have no material impact on the consolidated financial statements of the Group.
Standards, interpretation and amendments
Effective for annual periods beginning on or after
IFRS 16 Leases 1 January 2019
IFRS 9 Financial Instruments 1 January 2018
IFRS 14 Regulatory Deferral Accounts 1 January 2016
Amendments to IFRS 11 Joint Arrangements: Accounting for Acquisitions of Interests 1 January 2016
Amendments to IAS 16 and IAS 38: Clarification of Acceptable Methods of Depreciation and Amortisation 1 January 2016
Amendments to IAS 16 and IAS 41 Agriculture: Bearer Plants 1 January 2016
Amendments to IAS 27: Equity Method in Separate Financial Statements 1 January 2016
Amendments to IFRS 10 and IAS 28: Sale or Contribution of Assets between an Investor and its Associate or Joint Venture 1 January 2016
Annual Improvements 2012-2014 Cycle covering amendments to IFRS 5, IFRS 7, IAS 19 and IAS 34 1 January 2016
Amendments to IAS 1 Disclosure Initiative 1 January 2016
Amendments to IFRS 10, IFRS 12 and IAS 28 Investment Entities: Applying the Consolidation Exception 1 January 2016
IFRS 16 has been issued in January 2016 and it supersedes IAS 17. IFRS 16 introduces a single model for accounting of lease and requires lessees to recognise assets and liabilities for most leases, whereas the accounting for the lessor has remained substantially unchanged. The Group is assessing the impact of adopting IFRS 16. The adoption of the standard will result in recognition of additional assets and liabilities for leases where the Group is a lessee.
Notes to the Consolidated Financial StatementsFor the year ended 31 December 2015

25Aldar Annual Report 2015
3 SUMMARY OF SIGNIFICANT ACCOUNTING POLICIES3.1 STATEMENT OF COMPLIANCEThe consolidated financial statements have been prepared in accordance with International Financial Reporting Standards (IFRS) and also comply with the applicable requirements of the laws in the UAE. The accounting policies have been consistently applied other than changes as a result of application of new and revised standards mentioned in Note 2. The Federal Law No. 2 of 2015, concerning Commercial Companies has come into effect from 1 July 2015, replacing the existing Federal Law No. 8 of 1984. The Group is currently assessing the impact of the new law and expects to be fully compliant on or before 30 June 2016.
3.2 BASIS OF PREPARATIONThe consolidated financial statements have been prepared on the historical cost basis except for the revaluation of investment properties, derivatives and available for sale financial assets. The principal accounting policies are set out below.
These consolidated financial statements have been presented in UAE Dirhams (AED) which is also the functional currency of the Group.
3.3 BASIS OF CONSOLIDATION The consolidated financial statements incorporate the financial statements of the Company and entities (including structured entities) controlled by the Company and its subsidiaries. Control is achieved when the Company:
• has power over the investee;• is exposed, or has rights, to variable returns from its involvement with the investee; and • has the ability to use its power to affect its returns.
The Company reassesses whether or not it controls an investee if facts and circumstances indicate that there are changes to one or more of the three elements of control listed above.
When the Company has less than a majority of the voting rights of an investee, it has power over the investee when the voting rights are sufficient to give it the practical ability to direct the relevant activities of the investee unilaterally. The Company considers all relevant facts and circumstances in assessing whether or not the Company’s voting rights in an investee are sufficient to give it power, including:
• the size of the Company’s holding of voting rights relative to the size and dispersion of holdings of the other vote holders; • potential voting rights held by the Company, other vote holders or other parties; • rights arising from other contractual arrangements; and • any additional facts and circumstances that indicate that the Company has, or does not have, the current ability to direct the relevant
activities at the time that decisions need to be made, including voting patterns at previous shareholders’ meetings.
Consolidation of a subsidiary begins when the Company obtains control over the subsidiary and ceases when the Company loses control of the subsidiary. Specifically, income and expenses of a subsidiary acquired or disposed of during the year are included in the consolidated income statement and other comprehensive income from the date the Company gains control until the date when the Company ceases to control the subsidiary.
Profit or loss and each component of other comprehensive income are attributed to the owners of the Company and to the non-controlling interests. Total comprehensive income of subsidiaries is attributed to the owners of the Company and to the non-controlling interests even if this results in the non-controlling interests having a deficit balance.
When necessary, adjustments are made to the financial statements of subsidiaries to bring their accounting policies into line with the Group’s accounting policies.
All intragroup assets and liabilities, equity, income, expenses and cash flows relating to transactions between members of the Group are eliminated in full on consolidation.

26 Aldar Annual Report 2015
FINANCIAL STATEMENTS
3 SUMMARY OF SIGNIFICANT ACCOUNTING POLICIES CONTINUED3.3 BASIS OF CONSOLIDATION CONTINUED
Name of subsidiaryOwnership interest
Country of incorporation Principal activity
Al Raha Gardens Property LLC 100% UAE Development, sale and management of properties
Al Jimi Mall LLC 100% UAE Development and management of investment property
Addar Real Estate Services LLC 100% UAE Property development
Al Raha Infrastructure Company LLC 100% UAE Development, sale and management of properties
Aldar Academies LLC 100% UAE Investment in, and management of entities providing educational services
Aldar Facilities Management LLC 100% UAE Investment in, and management of, entities providing facilities management services
Aldar Commercial Property Developments LLC
100% UAE Ownership, management and development of buildings
Aldar Hotels and Hospitality LLC 100% UAE Investment in, and management of, entities providing hotels and hospitality services
Aldar Marinas LLC 100% UAE Managing and operating marinas, sports clubs and marine machinery
Abu Dhabi World Trade Centre LLC 100% UAE Development and management of, and investment in, properties and related activities
Nareel Island Development Company LLC 100% UAE Development and management of, and investment in, properties and related activities
Yas Marina LLC(ii) 100% UAE Ownership, development and management of marinas and related activities
Yas Yacht Club LLC(ii) 100% UAE Management of yachts and marine sports
Yas Hotel LLC 100% UAE Ownership, development and management of hotels
Yas Links LLC 100% UAE Ownership and management of golf courses and golf clubs
Al Muna Primary School LLC 100% UAE Providing educational services
Gate Towers Shams Abu Dhabi LLC(ii) 100% UAE Development of Gate Towers
Sorouh Abu Dhabi Real Estate LLC 100% UAE Act as Mudarib in accordance with the Sukuk Issue structure
Lulu Island for Project Development LLC 100% UAE Development of properties and real estate
Tilal Liwa Real Estate Investment LLC 100% UAE Property, rental and management
Al Seih Real Estate Management LLC 91.4% UAE Management and leasing of real estate; real estate projects investment
Seih Sdeirah Real Estate LLC 91.4% UAE Property rental and management; real estate projects investment
Pivot Engineering & General Contracting Co. (WLL)(i)
65.2% UAE Engineering and general construction works
Khidmah LLC 60% UAE Management and leasing of real estate
(i) Acquired additional interest of 5.2% during the year ended 31 December 2015. The resulting net gain is accounted for in equity.(ii) During the year, the Company discontinued certain non-active subsidiaries.
3.4 BUSINESS COMBINATIONSAcquisitions of subsidiaries are accounted for using the purchase method. The cost of the business combination is measured as the aggregate of the fair values (at the date of exchange) of assets given, liabilities incurred or assumed, and equity instruments issued by the Group in exchange for control of the acquiree, plus any costs directly attributable to the business combination. The acquiree’s identifiable assets, liabilities and contingent liabilities that meet the conditions for recognition under IFRS 3 Business Combinations are recognised at their fair values at the acquisition date, except for non-current assets (or disposal groups) that are classified as held for sale in accordance with IFRS 5 Non-current Assets Held for Sale and Discontinued Operations, which are recognised and measured at fair value less costs to sell.
Goodwill arising on acquisition is recognised as an asset and initially measured at cost, being the excess of the cost of the business combination over the Group’s interest in the net fair value of the identifiable assets, liabilities and contingent liabilities recognised.
Notes to the Consolidated Financial StatementsFor the year ended 31 December 2015

27Aldar Annual Report 2015
Non-controlling interests that are present ownership interests and entitle their holders to a proportionate share of the entity’s net assets in the event of liquidation may be initially measured either at fair value or at the non-controlling interests’ proportionate share of the recognised amounts of the acquiree’s identifiable net assets.
When a business combination is achieved in stages, the Group’s previously held equity interest in the acquiree is remeasured to fair value at the acquisition date (i.e. the date when the Group obtains control) and the resulting gain or loss, if any, is recognised in income statement. Amounts arising from interests in the acquiree prior to the acquisition date that have previously been recognised in other comprehensive income are reclassified to income statement where such treatment would be appropriate if that interest were disposed of.
If the initial accounting for a business combination is incomplete by the end of the reporting period in which the combination occurs, the Group reports provisional amounts for the items for which the accounting is incomplete. Those provisional amounts are adjusted during the measurement period, or additional assets or liabilities are recognised, to reflect new information obtained about facts and circumstances that existed at the acquisition date that, if known, would have affected the amounts recognised at that date.
3.5 INVESTMENTS IN ASSOCIATES AND JOINT VENTURESAn associate is an entity over which the Group has significant influence that is neither a subsidiary nor an interest in a joint venture. Significant influence is the power to participate in the financial and operating policy decisions of the investee but is not control or joint control over those policies.
A joint venture is a joint arrangement whereby the parties that have joint control of the arrangement have rights to the net assets of the joint arrangement. Joint control is the contractually agreed sharing of control of an arrangement, which exists only when decisions about the relevant activities require unanimous consent of the parties sharing control.
The results and assets and liabilities of associates or joint ventures are incorporated in these consolidated financial statements using the equity method of accounting, except when the investment is classified as held for sale, in which case it is accounted for under IFRS 5 Non-current Assets Held for Sale and Discontinued Operations. Under the equity method, an investment in an associate or a joint venture is initially recognised are carried in the consolidated statement of financial position at cost and as adjusted thereafter to recognise for post-acquisition changes in the Group’s share of the profit or loss and other comprehensive income of the associate and joint venture.
Losses of an associate or joint venture in excess of the Group’s interest in that associate or joint venture (which includes any long-term interests that, in substance, form part of the Group’s net investment in associate or joint venture) are recognised only to the extent that the Group has incurred legal or constructive obligations or made payments on behalf of the associate or joint venture.
Where an entity in the Group transacts with an associate or joint venture of the Group, profits and losses are eliminated to the extent of the Group’s interest in the relevant associate or joint venture.
3.6 INVESTMENT IN JOINT OPERATIONSA joint operation is a joint arrangement whereby the parties that have joint control of the arrangement have rights to the assets, and obligations for the liabilities, relating to the arrangement. Joint control is the contractually agreed sharing of control of an arrangement, which exists only when decisions about the relevant activities require unanimous consent of the parties sharing control.
When a Group entity undertakes its activities under joint operations, the Group as a joint operator recognises in relation to its interest in a joint operation:
• its assets, including its share of any assets held jointly;• its liabilities, including its share of any liabilities incurred jointly;• its revenue from the sale of its share of the output arising from the joint operation;• its share of the revenue from the sale of the output by the joint operation; and• its expenses, including its share of any expenses incurred jointly.
The Group accounts for the assets, liabilities, revenues and expenses relating to its interest in a joint operation in accordance with IFRSs applicable to the particular assets, liabilities, revenues and expenses.
When a Group entity transacts with a joint operation in which a Group entity is a joint operator (such as a sale or contribution of assets), the Group is considered conducting the transaction with other parties to the joint operation and profits and losses resulting from the transactions are recognised in the Group’s consolidated financial statements only to the extent of other parties’ interests in the joint operation.
When a Group entity transacts with a joint operation in which a Group entity is a joint operator (such as a purchase of assets), the Group does not recognise its share of the gains and losses until it resells those assets to a third party.

28 Aldar Annual Report 2015
FINANCIAL STATEMENTS
3 SUMMARY OF SIGNIFICANT ACCOUNTING POLICIES CONTINUED3.7 REVENUE RECOGNITIONThe Group has elected to early adopt IFRS 15 with effect from 1 January 2015. As a result of early adoption, the Group has applied the following accounting policy for revenue recognition in the preparation of its consolidated financial statements:
Revenue from contracts with customers for sale of properties, construction contracts and provision of servicesThe Group recognises revenue from contracts with customers based on a five-step model as set out in IFRS 15:
Step 1. Identify contract(s) with a customer: A contract is defined as an agreement between two or more parties that creates enforceable rights and obligations and sets out the criteria for every contract that must be met.
Step 2. Identify performance obligations in the contract: A performance obligation is a promise in a contract with a customer to transfer a good or service to the customer.
Step 3. Determine the transaction price: The transaction price is the amount of consideration to which the Group expects to be entitled in exchange for transferring promised goods or services to a customer, excluding amounts collected on behalf of third parties.
Step 4. Allocate the transaction price to the performance obligations in the contract: For a contract that has more than one performance obligation, the Group allocates the transaction price to each performance obligation in an amount that depicts the amount of consideration to which the Group expects to be entitled in exchange for satisfying each performance obligation.
Step 5. Recognise revenue when (or as) the Group satisfies a performance obligation.
The Group satisfies a performance obligation and recognises revenue over time, if one of the following criteria is met:
(a) The Group’s performance does not create an asset with an alternate use to the Group and the Group has an enforceable right to payment for performance completed to date.
(b) The Group’s performance creates or enhances an asset that the customer controls as the asset is created or enhanced.(c) The customer simultaneously receives and consumes the benefits provided by the Group’s performance as the Group performs.
For performance obligations where one of the above conditions are not met, revenue is recognised at the point in time at which the performance obligation is satisfied.
When the Group satisfies a performance obligation by delivering the promised goods or services it creates a contract based asset on the amount of consideration earned by the performance. Where the amount of consideration received from a customer exceeds the amount of revenue recognised this gives rise to a contract liability.
Revenue is measured at the fair value of the consideration received or receivable, taking into account contractually defined terms of payment and excluding taxes and duty. The Group assesses its revenue arrangements against specific criteria to determine if it is acting as principal or agent.
Revenue is recognised to the extent it is probable that the economic benefits will flow to the Group and the revenue and costs, if applicable, can be measured reliably.
Rental incomeRental income from operating leases is recognised on a straight-line basis over the term of the relevant lease. Initial direct costs incurred in negotiating and arranging an operating lease are added to the carrying amount of the leased asset and recognised on a straight-line basis over the lease term.
Service charges and expenses recoverable from tenantIncome arising from cost recharged to tenants is recognised in the period in which the cost can be contractually recovered. Service charges and other such receipts are included gross of the related costs in revenue as the Group acts as principal in this respect.
Income from hotelsIncome from hotels comprises revenue from rooms, food and beverages and other associated services provided, and is recognised at the point when the goods are sold or services are rendered.
Income from leisure businessesIncome from leisure businesses comprises revenue from goods sold and services provided at marinas and golf course, and is recognised at the point when the goods are sold or services are rendered.
Income from schoolsRegistration fee is recognised as income when it is received. Tuition fee income is recognised over the period of tuition. Tuition fees received in advance are recorded as deferred income.
Dividend incomeDividend income from investments is recognised when the Group’s right to receive payment has been established.
Notes to the Consolidated Financial StatementsFor the year ended 31 December 2015

29Aldar Annual Report 2015
Interest incomeInterest income is accrued on a time basis, by reference to the principal outstanding and effective interest rate applicable.
3.8 LEASINGLeases are classified as finance leases whenever the terms of the lease transfer substantially all the risks and rewards of ownership to the lessee. All other leases are classified as operating leases.
The Group as lessorAmounts due from lessees under finance leases are recorded as receivables at the amount of the Group’s net investment in the leases. Finance lease income is allocated to accounting periods so as to reflect a constant periodic rate of return on the Group’s net investment outstanding in respect of the leases.
Rental income from operating leases is recognised on a straight-line basis over the term of the relevant lease. Initial direct costs incurred in negotiating and arranging an operating lease are added to the carrying amount of the leased asset and recognised on a straight-line basis over the lease term.
The Group as lesseeAssets held under finance leases are initially recognised as assets of the Group at their fair value at the inception of the lease or, if lower, at the present value of the minimum lease payments. The corresponding liability to the lessor is included in the consolidated statement of financial position as a finance lease obligation.
Lease payments are apportioned between finance charges and reduction of the lease obligation so as to achieve a constant rate of interest on the remaining balance of the liability. Finance charges are charged directly to income statement, unless they are directly attributable to qualifying assets, in which case they are capitalised in accordance with the Group’s general policy on borrowing costs (see Note 3.10 below).
Operating lease payments are recognised as an expense on a straight-line basis over the lease term, except where another systematic basis is more representative of the time pattern in which economic benefits from the leased asset are consumed. Contingent rentals arising under operating leases are recognised as an expense in the period in which they are incurred.
In the event that lease incentives are received to enter into operating leases, such incentives are recognised as a liability. The aggregate benefit of incentives is recognised as a reduction of rental expense on a straight-line basis, except where another systematic basis is more representative of the time pattern in which economic benefits from the leased asset are consumed.
3.9 FOREIGN CURRENCIESTransactions in currencies other than AED (foreign currencies) are recorded at the rates of exchange prevailing at the dates of the transactions. At the end of each reporting period, monetary items denominated in foreign currencies are retranslated at the rates prevailing at that date. Non-monetary items carried at fair value that are denominated in foreign currencies are retranslated at the rates prevailing at the date when the fair value was determined. Non-monetary items that are measured in terms of historical cost in a foreign currency are not retranslated.
3.10 BORROWING COSTS Borrowing costs directly attributable to the acquisition, construction or production of qualifying assets, which are assets that necessarily take a substantial period of time to get ready for their intended use or sale, are added to the cost of those assets, until such time as the assets are substantially ready for their intended use or sale.
Investment income earned on the temporary investment of specific borrowings pending their expenditure on qualifying assets is deducted from the borrowing costs eligible for capitalisation.
All other borrowing costs are recognised in income statement in the period during which they are incurred.
3.11 PROPERTY, PLANT AND EQUIPMENTProperty, plant and equipment are stated at historical cost less accumulated depreciation and accumulated impairment loss. Historical cost includes expenditure that is directly attributable to the acquisition of the asset.
Subsequent costs are included in the asset’s carrying amount or recognised as a separate asset, as appropriate, only when it is probable that future economic benefits associated with the item will flow to the Group and the cost of the item can be measured reliably. All other repairs and maintenance expenses are charged to the income statement in the period in which they are incurred.

30 Aldar Annual Report 2015
FINANCIAL STATEMENTS
3 SUMMARY OF SIGNIFICANT ACCOUNTING POLICIES CONTINUED3.11 PROPERTY, PLANT AND EQUIPMENT CONTINUEDDepreciation is calculated using the straight-line method to allocate the assets’ cost to their residual values over their estimated useful lives as follows:
Years
Buildings 20-30
Labour camps 5
Furniture and fixtures 5
Office equipment 3-5
Computers 3
Motor vehicles 4
Leasehold improvements 3-4
Freehold land is not depreciated.
Assets held under finance leases are depreciated over the shorter of their expected useful lives or the term of the relevant lease.
The estimated useful lives, residual values and depreciation method are reviewed at each year end, with the effect of any changes in estimate accounted for on a prospective basis.
An asset’s carrying amount is written down immediately to its recoverable amount if the asset’s carrying amount is greater than its estimated recoverable amount.
The gain or loss arising on the disposal or retirement of an item of property, plant and equipment is determined as the difference between the sales proceeds and the carrying amount of the asset and is recognised in the income statement.
3.12 CAPITAL WORK IN PROGRESSProperties or assets in the course of construction for production, supply or administrative purposes, are carried at cost, less any recognised impairment loss. Cost includes all direct costs attributable to the design and construction of the property including related staff costs and, for qualifying assets, borrowing costs capitalised in accordance with the Group’s accounting policy. When the assets are ready for intended use, the capital work in progress is transferred to the appropriate property, plant and equipment category and is accounted in accordance with the Group’s policies.
3.13 INVESTMENT PROPERTIESInvestment properties comprise completed properties and properties under development. Completed properties are properties held to earn rentals and/or for capital appreciation and properties under development are properties being constructed or developed for future use as investment property.
Investment properties are measured initially at cost including transaction costs and for properties under development all direct costs attributable to the design and construction, including related staff costs. Subsequent to initial recognition, investment properties are measured at fair value. Gains or losses arising from changes in the fair value of investment properties are included in the income statement in the period in which they arise.
Upon completion of construction or development, a property is transferred from properties under development to completed properties.
3.14 DEVELOPMENT WORK IN PROGRESSDevelopment work in progress consists of property being developed principally for sale and is stated at the lower of cost or net realisable value. Cost comprises all direct costs attributable to the design and construction of the property including direct staff costs. Net realisable value is the estimated selling price in the ordinary course of the business less estimated costs to complete and applicable variable selling expenses.
3.15 INVENTORIESInventories comprise completed properties held for sale in the ordinary course of business and other operating inventories. Inventories are stated at the lower of cost and net realisable value. Cost is calculated using the weighted average cost method and comprises construction/acquisition costs and other charges incurred in bringing inventory to its present location and condition. Net realisable value represents the estimated selling price less all estimated selling and marketing costs to be incurred.
Notes to the Consolidated Financial StatementsFor the year ended 31 December 2015

31Aldar Annual Report 2015
3.16 LAND HELD FOR SALELand held for sale is stated at the lower of cost and net realisable value. Costs include the cost of land acquired and all direct costs attributable to the infrastructure works of the land. Net realisable value represents the estimated selling price of the land less all estimated costs necessary to make the sale.
3.17 INTANGIBLE ASSETSIntangible assets acquired separately are reported at cost less accumulated amortisation and accumulated impairment losses. Amortisation is charged on a straight-line basis over their estimated useful lives. The estimated useful lives are reviewed at the end of each annual reporting period, with effect of any changes in estimate being accounted for on a prospective basis.
Computer softwareAcquired computer software licences are capitalised on the basis of the costs incurred to acquire and bring to use the specific software. These costs are amortised on a straight-line basis over their estimated useful lives which is normally a period of three to five years.
LicensesAcquired licenses are shown at historical cost. Licenses have a finite useful life and are carried at cost less accumulated amortisation. Amortisation is calculated using the straight-line method to allocate the cost of licenses over their estimated useful lives.
3.18 IMPAIRMENT OF TANGIBLE AND INTANGIBLE ASSETS EXCLUDING GOODWILL At the end of each reporting period, the Group reviews the carrying amounts of its tangible and intangible assets to determine whether there is any indication that those assets have suffered an impairment loss. If any such indication exists, the recoverable amount of the asset is estimated in order to determine the extent of the impairment loss (if any). Where it is not possible to estimate the recoverable amount of an individual asset, the Group estimates the recoverable amount of the cash-generating unit to which the asset belongs. Where a reasonable and consistent basis of allocation can be identified, corporate assets are also allocated to individual cash-generating units, or otherwise they are allocated to the smallest group of cash-generating units for which a reasonable and consistent allocation basis can be identified.
Recoverable amount is the higher of fair value less costs to sell and value in use. In assessing value in use, the estimated future cash flows are discounted to their present value using a discount rate that reflects current market assessments of the time value of money and the risks specific to the asset.
If the recoverable amount of an asset (or cash-generating unit) is estimated to be less than its carrying amount, the carrying amount of the asset (or cash-generating unit) is reduced to its recoverable amount. An impairment loss is recognised immediately in income statement, unless the relevant asset is carried at a revalued amount, in which case the impairment loss is treated as a revaluation decrease.
Where an impairment loss subsequently reverses, the carrying amount of the asset (or cash-generating unit) is increased to the revised estimate of its recoverable amount, but so that the increased carrying amount does not exceed the carrying amount that would have been determined had no impairment loss been recognised for the asset (or cash-generating unit) in prior years. A reversal of an impairment loss is recognised immediately in income statement, unless the relevant asset is carried at a revalued amount, in which case the reversal of the impairment loss is treated as a revaluation increase.
3.19 PROVISIONSProvisions are recognised when the Group has a legal or constructive obligation as a result of a past event, it is probable that an outflow of resources will be required to settle the obligation, and the amount can be reliably estimated.
Provisions are measured at the present value of the expenditures expected to be required to settle the obligation at the end of the reporting period, using a rate that reflects current market assessments of the time value of money and the risks specific to the obligation.
When some or all of the economic benefits required to settle a provision are expected to be recovered from a third party, a receivable is recognised as an asset if it is virtually certain that reimbursement will be received and the amount of receivable can be measured reliably.
Onerous contractsPresent obligations arising under onerous contracts are recognised and measured as provisions. An onerous contract is considered to exist where the Group has a contract under which the unavoidable costs of meeting the obligations under the contract exceed the economic benefits expected to be received from the contract.

32 Aldar Annual Report 2015
FINANCIAL STATEMENTS
3 SUMMARY OF SIGNIFICANT ACCOUNTING POLICIES CONTINUED3.20 EMPLOYEE BENEFITSAn accrual is made for the estimated liability for employees’ entitlement to annual leave and leave passage as a result of services rendered by eligible employees up to the end of the year.
Provision is also made for the full amount of end of service benefit due to non-UAE national employees in accordance with the UAE Labour Law, for their period of service up to the end of the year. The accrual relating to annual leave and leave passage is disclosed as a current liability, while the provision relating to end of service benefit is disclosed as a non-current liability.
Pension contributions are made in respect of UAE national employees to the UAE General Pension and Social Security Authority in accordance with the UAE Federal Law No. (2), 2000 for Pension and Social Security. Such contributions are charged to the income statement during the employees’ period of service.
3.21 GOVERNMENT GRANTSGovernment grants are not recognised until there is reasonable assurance that the Group will comply with the conditions attaching to them and that the grants will be received.
Government grants are recognised in income statement on a systematic basis over the periods in which the Group recognises as expenses the related costs for which the grants are intended to compensate. Specifically, government grants whose primary condition is that the Group should purchase, construct or otherwise acquire non-monetary assets are recognised as deferred government grant in the statement of financial position and transferred to income statement on a systematic and rational basis over the useful lives of the related assets.
Government grants that are receivable as compensation for expenses already incurred or for the purpose of giving immediate financial support to the Group with no future related costs are recognised in income statement in the period in which they become receivable.
The benefit of a government loan at a below-market rate of interest is treated as a government grant, measured as the difference between proceeds received and the fair value of the loan based on prevailing market interest rates.
Land granted by the Government of Abu Dhabi is recognised at nominal value where there is reasonable assurance that the land will be received and the Group will comply with any attached conditions, where applicable.
3.22 FINANCIAL ASSETSFinancial assets are classified into the following specified categories: ‘available-for-sale’ (AFS) financial assets and ‘loans and receivables’. The classification depends on the nature and purpose of the financial assets and is determined at the time of initial recognition. Loans and receivable include cash and bank balances, trade and other receivables, amounts due from related parties and loans and advances to third parties.
Cash and cash equivalentsCash and cash equivalents include cash on hand and deposits held with banks (excluding deposits held under lien) with original maturities of three months or less.
Available for sale (AFS) financial assetsInvestments are recognised and derecognised on a trade date basis where the purchase or sale of an investment is under a contract whose terms require delivery of the investment within the timeframe established by the market concerned, and are initially measured at fair value, plus directly attributable transaction costs.
AFS investments are measured at subsequent reporting dates at fair value unless the latter cannot be reliably measured. Gains and losses arising from changes in fair value are recognised in other comprehensive income and accumulated in the investment revaluation reserve in equity, with the exception of impairment losses, interest calculated using effective interest method and foreign exchange gains and losses on monetary assets, which are recognised in the income statement.
Where the AFS investment is disposed of or is determined to be impaired, at which time the cumulative gains or losses previously accumulated in the investment revaluation reserve is reclassified to the income statement.
Dividends on AFS equity instruments are recognised in income statement when the Group’s right to receive the dividends is established.
Loans and receivablesLoans and receivables are non-derivative financial assets with fixed or determinable payments that are not quoted in an active market. Loans and receivables are measured at amortised cost, less any impairment. Interest income is recognised by applying the effective interest rate, except for short-term receivables when the recognition of interest would be immaterial.
Impairment of financial assetsFinancial assets are assessed for indicators of impairment at the end of each reporting period. Financial assets are considered to be impaired when there is objective evidence that, as a result of past event, the estimated future cash flows of the investment have been affected.
Notes to the Consolidated Financial StatementsFor the year ended 31 December 2015
33Aldar Annual Report 2015
For unquoted shares classified as AFS at cost, objective evidence of impairment could include:
• significant financial difficulty of the issuer or counterparty; or• default or delinquency in interest or principal payments; or• it becoming probable that the counterparty will enter bankruptcy or financial re-organisation.
For certain categories of financial assets, such as trade receivables, assets that are assessed not to be impaired individually are assessed for impairment on a collective basis. Objective evidence of impairment for a portfolio of receivables could include the Group’s past experience of collecting payments, an increase in the number of delayed payments in the portfolio past the average credit period, as well as observable changes in national or local economic conditions that correlate with default on receivables.
For financial assets carried at amortised cost, the amount of the impairment is the difference between the asset’s carrying amount and the present value of estimated future cash flows, discounted at the financial asset’s original effective interest rate.
The carrying amount of the financial asset is reduced by the impairment loss directly for all financial assets with the exception of trade receivables, where the carrying amount is reduced through the use of an allowance account. When a trade receivable is considered uncollectible, it is written off against the allowance account. Subsequent recoveries of amounts previously written off are credited against the allowance account. Changes in the carrying amount of the allowance account are recognised in income statement.
With the exception of AFS equity instruments, if, in a subsequent period, the amount of the impairment loss decreases and the decrease can be related objectively to an event occurring after the impairment was recognised, the previously recognised impairment loss is reversed through income statement to the extent that the carrying amount of the investment at the date the impairment is reversed does not exceed what the amortised cost would have been had the impairment not been recognised.
In respect of AFS equity securities, impairment losses previously recognised through the income statement are not reversed through income statement. Any increase in fair value subsequent to an impairment loss is recognised directly in other comprehensive income.
Derecognition of financial assetsThe Group derecognises a financial asset only when the contractual rights to the cash flows from the asset expire; or it transfers the financial asset and substantially all the risks and rewards of ownership of the asset to another entity. If the Group neither transfers nor retains substantially all the risks and rewards of ownership and continues to control the transferred asset, the Group recognises its retained interest in the asset and an associated liability for amounts it may have to pay. If the Group retains substantially all the risks and rewards of ownership of a transferred financial asset, the Group continues to recognise the financial asset.
3.23 FINANCIAL LIABILITIES AND EQUITY INSTRUMENTS ISSUED BY THE GROUPClassification as debt or equityDebt and equity instruments are classified as either financial liabilities or as equity in accordance with the substance of the contractual arrangement.
Equity instrumentsAn equity instrument is any contract that evidences a residual interest in the assets of an entity after deducting all of its liabilities. Equity instruments issued by the Group are recorded at the proceeds received, net of direct issue costs.
Other financial liabilitiesOther financial liabilities, including borrowings, are initially measured at fair value, net of transaction costs.
Other financial liabilities are subsequently measured at amortised cost using the effective interest method, with interest expense recognised on an effective yield basis, except for short-term payables when recognition of interest would be immaterial.
The effective interest method is a method of calculating the amortised cost of a financial liability and of allocating interest expense over the relevant period. The effective interest rate is the rate that exactly discounts estimated future cash payments through the expected life of the financial liability, or, where appropriate, a shorter period.
Derecognition of financial liabilitiesThe Group derecognises financial liabilities when, and only when, the Group’s obligations are discharged, cancelled or they expire.

34 Aldar Annual Report 2015
FINANCIAL STATEMENTS
3 SUMMARY OF SIGNIFICANT ACCOUNTING POLICIES CONTINUED3.24 DERIVATIVE FINANCIAL INSTRUMENTSThe Group enters into derivative financial instruments to manage its exposure to interest rate risk, including interest rate swaps.
Derivative financial instruments are initially measured at fair value at contract date, and are subsequently re-measured at fair value at the end of each reporting period. All derivatives are carried at their fair values as assets where the fair values are positive and as liabilities where the fair values are negative. A derivative is presented as a non-current asset or a non-current liability if the remaining maturity of the instrument is more than 12 months and it is not expected to be realised or settled within 12 months. Other derivatives are presented as current assets or current liabilities.
Fair values of the derivatives are carried out by independent valuers by reference to quoted market prices, discounted cash flow models and recognised pricing models as appropriate.
Changes in the fair value of derivative financial instruments that do not qualify for hedge accounting are recognised in income statement as they arise. Derivative financial instruments that do not qualify for hedge accounting are classified as held for trading derivatives.
For the purpose of hedge accounting, the Group designates certain derivatives into two types of hedge categories: (a) fair value hedges which hedge the exposure to changes in the fair value of a recognised asset or liability; and (b) cash flow hedges which hedge exposure to variability in cash flows that are either attributable to a particular risk associated with a recognised asset or liability, or a highly probable forecasted transaction that will affect future reported net income.
Hedge accountingIn order to qualify for hedge accounting, it is required that the hedge should be expected to be highly effective, i.e. the changes in fair value or cash flows of the hedging instrument should effectively offset corresponding changes in the hedged item and the effectiveness can be reliably measured. At inception of the hedge, the Group documents its risk management objective and strategy for undertaking various hedge transactions, including the identification of the hedging instrument, the related hedged item, the nature of risk being hedged, and how the Group will assess the effectiveness of the hedging relationship. Subsequently, the hedge is required to be assessed and determined to be an effective hedge on an ongoing basis.
Note 33.5(b) sets out details of the fair values of the derivative instruments used for hedging purposes. Movements in the hedging reserve in equity are also detailed in the consolidated statement of changes in equity.
Fair value hedgesChanges in the fair value of derivatives that are designated and qualify as fair value hedges are recorded in income statement immediately, together with any changes in the fair value of the hedged item that are attributable to the hedged risk.
Hedge accounting is discontinued when the Group revokes the hedging relationship, the hedging instrument expires or is sold, terminated, exercised or no longer qualifies for hedge accounting. The adjustment to the carrying amount of the hedged item arising from the hedged risk is amortised to the profit of loss from that date.
Cash flow hedgesThe effective portion of changes in the fair value of derivatives that are designated and qualify as cash flow hedges is recognised in other comprehensive income. The gain or loss relating to the ineffective portion is recognised immediately in income statement.
Amounts previously recognised in other comprehensive income and accumulated in hedging reserve in equity are recycled in income statement in the periods when the hedged item is recognised in income statement, in the same line of the income statement as the recognised hedged item. However, when the forecast transaction that is hedged results in the recognition of a non-financial asset or a non-financial liability, the gains and losses previously accumulated in equity are transferred from equity and included in the initial measurement of the cost of the asset or liability.
Hedge accounting is discontinued when the Group revokes the hedging relationship, the hedging instrument expires or is sold, terminated, or exercised, or no longer qualifies for hedge accounting. Any cumulative gain or loss accumulated in equity at that time remains in equity and is recognised when the forecast transaction is ultimately recognised in income statement. When a forecast transaction is no longer expected to occur, the cumulative gain or loss that was deferred in equity is recognised immediately in income statement.
Notes to the Consolidated Financial StatementsFor the year ended 31 December 2015
35Aldar Annual Report 2015
4 CRITICAL ACCOUNTING JUDGMENTS AND KEY SOURCES OF ESTIMATION UNCERTAINTYWhile applying the accounting policies as stated in Note 3, management of the Group has made certain judgments, estimates and assumptions that are not readily apparent from other sources. The estimates and associated assumptions are based on historical experience and other factors that are considered to be relevant. Actual results may differ from these estimates.
The estimates and underlying assumptions are reviewed on an ongoing basis. Revision to accounting estimates are recognised in the period of the revision in which the estimate is revised if the revision affects only that period, or in the period of the revision and future periods if the revision affects both current and future periods.
4.1 CRITICAL JUDGMENTS IN APPLYING ACCOUNTING POLICIESSignificant judgments made by management that have a significant risk of causing a material adjustment to the carrying amounts of assets and liabilities within the next financial year are:
Classification of leasesThe Group, as a lessor, has entered into long-term lease arrangements for plots of land with entities outside the Gulf Cooperation Council (non-GCC entities) whereby the lease term under each lease is valid for a period of 99 years renewable at the option of the lessees for an indefinite duration.
In the process of determining whether these arrangements represent operating leases or finance leases, the Group’s management has made various judgments. In making its judgments, the Group’s management considered the terms and conditions of the lease agreements and the requirements of IAS 17 Leases, including the Basis for Conclusions on IAS 17 provided by the International Accounting Standards Board and related guidance, to determine whether significant risks and rewards associated with the land in accordance with each lease term would have been transferred to the lessees despite there being no transfers of title. The Group evaluated the transfer of risks and rewards before and after entering into the lease arrangements, and has obtained a legal opinion from independent legal advisors. Management has determined that in the lease arrangements referred to above, the Group transferred substantially all risks and rewards of ownership to the lessees with practical ability for the lessees to exercise unilaterally all rights on the plots of land. Accordingly, management is satisfied that these arrangements represent finance leases.
Classification of propertiesIn the process of classifying properties, management has made various judgments. Judgment is needed to determine whether a property qualifies as an investment property, property, plant and equipment and/or property held for sale. The Group develops criteria so that it can exercise that judgment consistently in accordance with the definitions of investment property, property, plant and equipment and property held for sale. In making its judgment, management considered the detailed criteria and related guidance for the classification of properties as set out in IAS 2, IAS 16 and IAS 40, and in particular, the intended usage of property as determined by the management.
Judgments in relation to contracts with customersSatisfaction of performance obligations The Group is required to assess each of its contracts with customers to determine whether performance obligations are satisfied over time or at a point in time in order to determine the appropriate method for recognising revenue. The Group has assessed that based on the contracts entered into with customers and the provisions of relevant laws and regulations, the Group recognises revenue over time in the following circumstances:
a) where contracts are entered into for development (sale of properties to customers), the Group does not create an asset with an alternative use to the Group and has an enforceable right to payment for performance completed to date;
b) where contracts are entered into for construction (to construct an asset for the customer), the Group’s performance creates or enhances an asset that the customer controls as the asset is created or enhanced; and
c) where contracts are entered into to provide services (property management and facility management), the customer simultaneously receives and consumes the benefits provided by the Group’s performance as the Group performs.
Where the above criteria are not met, revenue is recognised at a point in time. Where revenue is recognised at a point of time, the Group assesses each contract with customers to determine when the performance obligation of the Group under the contract is satisfied.
Determination of transaction pricesThe Group is required to determine the transaction price in respect of each of its contracts with customers. In making such judgment the Group assesses the impact of any variable consideration in the contract, due to discounts or penalties, the existence of any significant financing component and any non-cash consideration in the contract.
In determining the impact of variable consideration, the Group uses the “most-likely amount” method in IFRS 15 whereby the transaction price is determined by reference to the single most likely amount in a range of possible consideration amounts.

36 Aldar Annual Report 2015
FINANCIAL STATEMENTS
4 CRITICAL ACCOUNTING JUDGMENTS AND KEY SOURCES OF ESTIMATION UNCERTAINTY CONTINUED4.1 CRITICAL JUDGMENTS IN APPLYING ACCOUNTING POLICIES CONTINUEDTransfer of control in contracts with customersIn cases where the Group determines that performance obligations are satisfied at a point in time, revenue is recognised when control over the assets is transferred to the customer or benefits of the services being provided is received and consumed by the customer. In the case of contracts to sell real estate assets this is generally when the consideration for the unit has been substantially received and there are no impediments in the handing over of the unit to the customer.
4.2 KEY SOURCES OF ESTIMATION UNCERTAINTYThe key assumptions concerning the future, and other key sources of estimation uncertainty at the end of the reporting period, that have a significant risk of causing a material adjustment to the carrying amounts of assets and liabilities within the next financial year, are discussed below:
Allocation of transaction price to performance obligation in contracts with customersThe Group has elected to apply the input method in allocating the transaction price to performance obligations where revenue is recognised over time. The Group considers that the use of the input method, which requires revenue recognition on the basis of the Group’s efforts to the satisfaction of performance obligation, provides the best reference of revenue actually earned. In applying the input method, the Group estimates the efforts or inputs to the satisfaction of a performance obligation. In addition to the cost of meeting contractual obligation to the customers, these estimates mainly include:
a) for development contracts, the cost of development and related infrastructure;b) for construction contracts, the certified works as evaluated by project consultant; andc) for services contracts, the time elapsed.
Fair value of investment properties and investment properties under developmentThe fair value of investment properties is determined by independent real estate valuation experts using recognised valuation methods. These methods comprise the Residual Value Method and the Income Capitalisation Method.
The Residual Value Method requires the use of estimates such as future cash flows from assets (comprising of selling and leasing rates, future revenue streams, construction costs and associated professional fees and financing cost, etc.), targeted internal rate of return and developer’s risk and targeted profit. These estimates are based on local market conditions existing at the end of the reporting period.
Under the Income Capitalisation Approach, the income receivable under existing lease agreements and projected future rental streams are capitalised at appropriate rates to reflect the investment market conditions at the valuation dates.
Such estimations are based on certain assumptions, which are subject to uncertainty and might materially differ from the actual results.
The continuing volatility in the global financial system and in the real estate industry has contributed to the significant reduction in transaction volumes in the UAE. Therefore, in arriving at their estimates of market values as at 31 December 2015, the valuers have used their market knowledge and professional judgement and have not only relied solely on historic transactional comparables. In these circumstances, there is greater degree of uncertainty than which exists in a more active market in estimating market values of investment property.
The key assumptions used are as follows:
Range %
Targeted internal rate of return 12-17Rental yield 7- 12
Estimation of net realisable value for inventory and development work in progress Properties held for sale and properties classified under development work in progress are stated at lower of cost or net realisable value (NRV). NRV is assessed with reference to sales prices, costs of completion and advances received and market conditions existing at the end of the reporting period. For certain properties, NRV is determined by the Group having taken suitable external advice and in the light of recent market transactions, where available.
Impairment of property, plant and equipment and capital work in progress Properties classified under property, plant and equipment and capital work in progress are assessed for impairment based on the assessment of cash flows on individual cash-generating units when there is an indication that those assets have suffered an impairment loss. Cash flows are determined with reference to recent market conditions, prices existing at the end of the reporting period, contractual agreements and estimations over the useful lives of the assets and discounted using a range of discounting rates that reflects current market assessments of the time value of money and the risks specific to the asset. The net present values are compared to the carrying amounts to assess any probable impairment.
Notes to the Consolidated Financial StatementsFor the year ended 31 December 2015

37Aldar Annual Report 2015
Useful lives of property, plant and equipment and intangible assetsManagement reviews the residual values and estimated useful lives of property, plant and equipment and intangible assets at the end of each annual reporting period in accordance with IAS 16 and IAS 38. Management determined that current year expectations do not differ from previous estimates based on its review.
Valuation of unquoted AFS equity investments Valuation of unquoted AFS equity investments is normally based on recent market transactions on an arm’s length basis, fair value of another instrument that is substantially the same, expected cash flows discounted at current rates for similar instruments or other valuation models.
Impairment of investments in/receivable from joint ventures and associates Management regularly reviews its investments in joint ventures and associates for indicators of impairment. This determination of whether investments in joint ventures and associates are impaired, entails Management’s evaluation of the specific investee’s profitability, liquidity, solvency and ability to generate operating cash flows from the date of acquisition and until the foreseeable future. The difference between the estimated recoverable amount and the carrying value of investment and/or receivable is recognised as an expense in income statement. Management is satisfied that no additional impairment is required on its investments in associates and joint ventures (Note 8) and it’s receivables from associates and joint ventures (Note 10.5) in excess of amount already provided.
Impairment of trade and other receivablesAn estimate of the collectible amount of trade and other receivables is made when collection of the full amount is no longer probable. This determination of whether the receivables are impaired, entails Management’s evaluation of the specific credit and liquidity position of the customers and related parties and their historical recovery rates, including discussion with the legal department and review of the current economic environment. Management is satisfied that no additional impairment is required on its trade and other receivables in excess of amount already provided (Note 10.1).

38 Aldar Annual Report 2015
FINANCIAL STATEMENTS
5 PROPERTY, PLANT AND EQUIPMENT
Land andbuildingsAED’000
Labourcamps
AED’000
Furnitureand
fixturesAED’000
Officeequipment
AED’000Computers
AED’000
Motorvehicles
AED’000
Leaseholdimprovements
AED’000
Capitalwork in
progressAED’000
TotalAED’000
Cost1 January 2014 5,959,414 1,504,704 539,158 54,486 80,893 5,396 13,605 488,299 8,645,955Additions 3,109 3,519 20,003 8,009 8,413 370 40 6,658 50,121Transfer from investment
properties (Note 7) 93,556 – – – – – – – 93,556Transfers – net (86,431) 424,299 – – – – – (467,280) (129,412)Disposals – – (912) – – – – – (912)
1 January 2015 5,969,648 1,932,522 558,249 62,495 89,306 5,766 13,645 27,677 8,659,308Additions 3,834 94 67,744 15,287 11,161 90 14 (3,804) 94,420 Transfers to investment
properties (Note 7) – – – – – – – (1,642) (1,642)Disposals – (278,569) (8,642) (3,784) – – – – (290,995)
31 December 2015 5,973,482 1,654,047 617,351 73,998 100,467 5,856 13,659 22,231 8,461,091
Accumulated depreciation and impairment1 January 2014 2,917,499 1,440,000 436,206 41,044 72,777 2,926 11,414 467,280 5,389,146Charge for the year 130,447 27,120 60,314 8,719 6,661 812 237 – 234,310Reversal of impairment
(Note 25) (150,601) – – 278 – – – – (150,323)Transfers – net 30,050 424,299 – – – – – (467,280) (12,931)Disposals – – (760) – – – – – (760)
1 January 2015 2,927,395 1,891,419 495,760 50,041 79,438 3,738 11,651 – 5,459,442Charge for the year 134,804 25,188 38,781 9,893 7,873 748 199 – 217,486Impairment (Note 25) 139,555 – – – – – – – 139,555Disposals – (278,569) (8,642) (3,784) – – – – (290,995)
31 December 2015 3,201,754 1,638,038 525,899 56,150 87,311 4,486 11,850 – 5,525,488
Carrying amount31 December 2015 2,771,728 16,009 91,452 17,848 13,156 1,370 1,809 22,231 2,935,603
31 December 2014 3,042,253 41,103 62,489 12,454 9,868 2,028 1,994 27,677 3,199,866
All of the Group’s property, plant and equipment are located in the United Arab Emirates.
The depreciation charge for the year has been allocated as follows:
2015AED’000
2014AED’000
Cost of sales 10,757 9,106General and administrative expenses 206,729 225,204
217,486 234,310
During the year, the Group carried out a review of recoverable amounts of its property, plant and equipment. The review led to an impairment of AED 139.6 million (2014: reversal of impairment of AED 150.3 million) (Note 25), which has been recorded in the consolidated income statement. The recoverable amount of relevant assets has been determined on the basis of their value in use by reference to the discounted cash flow method using a yield of 8% to 9.75% (2014: 8% to 8.5%) and a discount rate of 11% to 12.75% (2014: 11% to 11.5%).
Notes to the Consolidated Financial StatementsFor the year ended 31 December 2015

39Aldar Annual Report 2015
6 INTANGIBLE ASSETS
LicensesAED’000
Computersoftware
AED’000Total
AED’000
Cost1 January 2014 1,430 66,612 68,042Additions – 5,914 5,914Write-off (1,430) – (1,430)
1 January 2015 – 72,526 72,526Additions – 3,108 3,108Write-off – (429) (429)
31 December 2015 – 75,205 75,205
Accumulated amortisation1 January 2014 12 65,317 65,329Charge for the year – 2,466 2,466Write-off (12) – (12)
1 January 2015 – 67,783 67,783Charge for the year – 3,221 3,221Write-off – (429) (429)
31 December 2015 – 70,575 70,575
Carrying amount31 December 2015 – 4,630 4,630
31 December 2014 – 4,743 4,743

40 Aldar Annual Report 2015
FINANCIAL STATEMENTS
7 INVESTMENT PROPERTIESInvestment properties comprise completed properties (residential and office buildings, shopping malls and retail centres) and properties under development, including land under development, measured at fair value. Movement during the year is as follows:
2015 2014
Completedproperties
AED’000
Propertiesunder
developmentAED’000
TotalAED’000
CompletedpropertiesAED’000
Propertiesunder
developmentAED’000
TotalAED’000
Balance at the beginning of the year 13,051,800 1,349,406 14,401,206 7,191,216 4,834,765 12,025,981Development costs incurred during the year 1,295 42,376 43,671 4,975 948,578 953,553Finance cost capitalised (Note 27) – 285 285 – 118,368 118,368Increase/(decrease) in fair value – net 1,091,609 (604,598) 487,011 474,157 – 474,157Unrealised gain arising on transactions with a
subsidiary – – – (34,032) – (34,032)Disposals (32,832) – (32,832) (53,814) – (53,814)Additions 330,000 – 330,000 – – –Transfer upon completion – – – 4,552,305 (4,552,305) –Transfers from/(to):
Property, plant and equipment (Note 5) 1,642 – 1,642 (93,556) – (93,556)Development work in progress (Note 11) – – – 844,712 – 844,712Inventories 339,321 – 339,321 165,837 – 165,837
Balance at the end of the year 14,782,835 787,469 15,570,304 13,051,800 1,349,406 14,401,206
The fair value of a building has been calculated by management with reference to discounted future estimated cash flows based on the existing lease contracts and the use of a discount rate of 10% per annum.
The fair values of the remaining investment properties including properties under development are arrived at on the basis of a valuation carried out by independent valuers not connected with the Group. The valuers are members of various professional valuers’ associations, and have appropriate qualifications and recent experience in the valuation of properties at the relevant locations. The valuations were mainly determined by using the Income Capitalisation Method. The effective date of the valuation is 31 October 2015; management believes that there has been no significant change to the investment properties’ fair values as at 31 December 2015. Refer to Note 4.2 for the key assumptions used.
All investment properties are located in the United Arab Emirates.
The Company conducted a sensitivity analysis for nine largest assets in its Investment Property Portfolio with an aggregate value of AED 11.27 billion. The valuation technique used for these assets is Income Capitalisation Method and Discounted Cash Flow Method. The sensitivity is conducted on the Capitalisation Rates and Rental Values.
Sensitivity to significant changes in unobservable inputs:• A decrease in the Capitalisation/Discount Rate by 50bps would result in a AED 725 million or 6.4% increase in the valuation,
whilst an increase in the Capitalisation/Discount Rate by 50bps would result in AED 640 million or 5.7% decrease in the valuation.• An increase in the rental rates by 10% would result in a AED 895 million or 7.9% increase in the valuation, whilst an decrease in the
rental rates by 10% would result in AED 895 million or 7.9% decrease in the valuation.
There are interrelationships between the unobservable inputs which are generally determined by market conditions. The valuation may be affected by the interrelationship between the two noted unobservable inputs; for example, an increase in rent may be offset by an increase in the capitalisation rate, thus resulting in no net impact on the valuation. Similarly, an increase in rent in conjunction with a decrease in the capitalisation rate would amplify an increase in the value.
The investment properties, both completed and properties under development, are categorised under Level 3 in the fair value hierarchy.
Notes to the Consolidated Financial StatementsFor the year ended 31 December 2015

41Aldar Annual Report 2015
8 INVESTMENT IN ASSOCIATES AND JOINT VENTURES
Ownershipinterest
Votingpower
Place ofregistration
Share inunderlying
net assets at1 January
2015AED’000
AdditionsAED’000
Share incurrent
year’sprofit/
(loss)AED’000
Share inhedgingreserve
AED’000
Dividendsreceived
AED’000
Allocated to current
accountof the
associates/ ventures
AED’000
Reversal ofimpairment/ (impairment)
AED’000DisposalsAED’000
Share inunderlying
net assets at31 December
2015AED’000
Investee AssociatesGreen Emirates
Properties PJSC 40% 40% Abu Dhabi 85,757 – (210) – (94,150) – 8,603 – –Al Fayafi Al Khadra
Company LLC 40% 40% Abu Dhabi 800 – – – – – – – 800Dimarco Electronic
Systems LLC 34% 34% Abu Dhabi – – – – – – – – –Bunya LLC 33% 33% Abu Dhabi – – – – – – – – –Abu Dhabi Finance
PJSC 32% 32% Abu Dhabi 130,739 – 10,903 – – – – – 141,642Al Sdeirah
Real Estate Investment LLC 30% 30% Abu Dhabi 38,897 – 61,945 – – – – – 100,842
World-Class Initiatives and Standards in Education LLC(i) 20% 20% Abu Dhabi 10,000 – – – – – – (10,000) –
Iskandar Holdings Ltd 19% 19%
Cayman Islands 6,861 – – – – – – – 6,861
273,054 – 72,638 – (94,150) – 8,603 (10,000) 250,145
Joint venturesAldar Besix LLC 51% 50% Abu Dhabi 16,030 – 55 – – – – – 16,085Aldar Etihad
Investment Properties LLC 50% 50% Abu Dhabi 410,235 – 71,284 8,515 (45,500) – – – 444,534
Al Raha International Integrated Facilities Management LLC 50% 50% Abu Dhabi 21,492 – 5,422 – (5,000) – – – 21,914
Royal House LLC 50% 50% Abu Dhabi – – (6,967) – – 6,967 – – –Aldar Etihad First
Investment Properties LLC 50% 50% Abu Dhabi 84,533 – 9,790 – (2,750) – – – 91,573
Aldar Etihad Development LLC 50% 50% Abu Dhabi 106,601 – 15,257 – (13,000) – – – 108,858
S&T District Cooling Co. LLC 50% 50% Abu Dhabi 49 – – – – – – – 49
Galaxy Building Materials 45% 50% Abu Dhabi 10,440 – (6,156) – – – – – 4,284
649,380 – 88,685 8,515 (66,250) 6,967 – – 687,297
922,434 – 161,323 8,515 (160,400) 6,967 8,603 (10,000) 937,442
(i) During the year, the Company discontinued certain non-active associates.
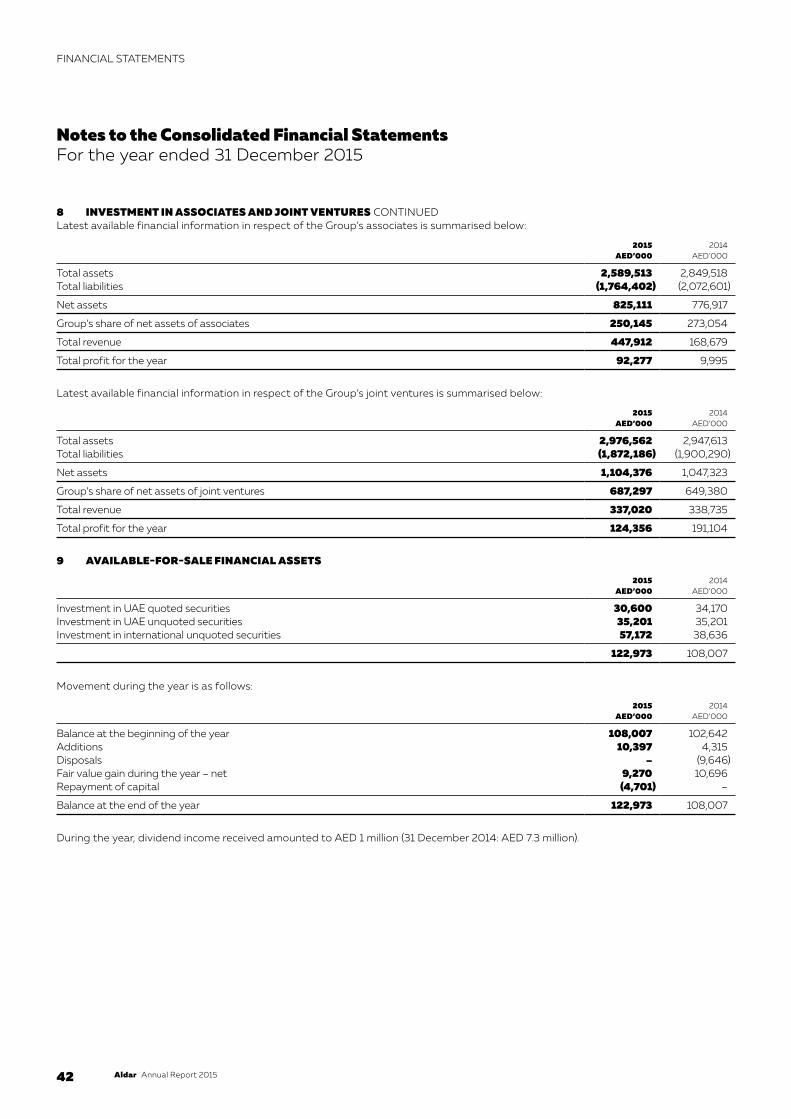
42 Aldar Annual Report 2015
FINANCIAL STATEMENTS
8 INVESTMENT IN ASSOCIATES AND JOINT VENTURES CONTINUEDLatest available financial information in respect of the Group’s associates is summarised below:
2015AED’000
2014AED’000
Total assets 2,589,513 2,849,518Total liabilities (1,764,402) (2,072,601)
Net assets 825,111 776,917
Group’s share of net assets of associates 250,145 273,054
Total revenue 447,912 168,679
Total profit for the year 92,277 9,995
Latest available financial information in respect of the Group’s joint ventures is summarised below:
2015AED’000
2014AED’000
Total assets 2,976,562 2,947,613Total liabilities (1,872,186) (1,900,290)
Net assets 1,104,376 1,047,323
Group’s share of net assets of joint ventures 687,297 649,380
Total revenue 337,020 338,735
Total profit for the year 124,356 191,104
9 AVAILABLE-FOR-SALE FINANCIAL ASSETS
2015AED’000
2014AED’000
Investment in UAE quoted securities 30,600 34,170Investment in UAE unquoted securities 35,201 35,201Investment in international unquoted securities 57,172 38,636
122,973 108,007
Movement during the year is as follows:
2015AED’000
2014AED’000
Balance at the beginning of the year 108,007 102,642Additions 10,397 4,315Disposals – (9,646)Fair value gain during the year – net 9,270 10,696Repayment of capital (4,701) –
Balance at the end of the year 122,973 108,007
During the year, dividend income received amounted to AED 1 million (31 December 2014: AED 7.3 million).
Notes to the Consolidated Financial StatementsFor the year ended 31 December 2015

43Aldar Annual Report 2015
10 TRADE AND OTHER RECEIVABLES
2015AED’000
2014AED’000
Non-current portionTrade receivables (Note 10.1) – 6,935Less: provision for impairment and cancellations – (6,935)
– –Receivable from project finance (Note 10.3) 157,382 163,588Receivable from the Government of Abu Dhabi (Note 10.4) 331,744 655,458Due from associates and joint ventures (Notes 10.5) 93,625 101,937Other 14,000 14,000
596,751 934,983
Current portionTrade receivables (Note 10.1) 2,000,782 2,522,350Less: provision for impairment and cancellations (536,857) (552,235)
1,463,925 1,970,115Refundable costs (Note 10.2) 315,744 2,107,207Receivable from project finance (Note 10.3) 20,148 17,927Receivable from the Government of Abu Dhabi (Note 10.4) 790,223 2,055,347Due from associates and joint ventures (Note 10.5) 256,747 366,020Gross amount due from customers on contracts for sale of properties (Note 10.6) 111,408 –Gross amount due from customers on contracts to construct an asset (Note 10.7) 188,642 414,792Advances and prepayments 1,335,661 1,060,737Accrued interest 25,679 10,148Other 430,140 682,132
4,938,317 8,684,425
10.1 TRADE RECEIVABLESTrade receivables represent mainly the amounts due from sales of plots of land, properties and revenue from construction contracts. At the end of the year, 55% of the trade receivables (2014: 55% of the trade receivables) is due from its top five customers. Concentration of credit risk is mitigated due to the fact that the customers have already made instalment payments, in some cases substantial, on the plots, which the Group would contractually be entitled to retain in the event of non-completion of the remaining contractual obligations in order to cover losses incurred by the Group.
Interest is charged at 12% per annum on the outstanding past due amounts from sales of plots and properties. No collateral is taken on trade receivables.
2015AED’000
2014AED’000
Ageing of trade receivables:Not past due 424,729 842,823Not past due but impaired – 6,935Past due but not impaired (more than 180 days) 1,039,196 1,127,292Past due and impaired (more than 180 days) 536,857 552,235
Total trade receivables 2,000,782 2,529,285
Movement during the year in provision for impairment and cancellations in trade receivables is as follows:
2015AED’000
2014AED’000
Balance at the beginning of the year 559,170 596,832Impairment recognised during the year (Note 25) 15,302 28,033Released upon cancellation of sales (37,615) (65,695)
Balance at the end of the year 536,857 559,170
10.2 REFUNDABLE COSTSRefundable costs represent costs incurred on behalf of the Government of Abu Dhabi in relation with development of infrastructure of various projects and real estate developments. These amounts will be refunded by the relevant Government Authorities upon completion.

44 Aldar Annual Report 2015
FINANCIAL STATEMENTS
10 TRADE AND OTHER RECEIVABLES CONTINUED10.3 RECEIVABLE FROM PROJECT FINANCE
Minimum payments Present value of minimum payments
2015AED’000
2014AED’000
2015AED’000
2014AED’000
Current receivables:Within one year 25,439 21,854 20,148 17,927
Non-current receivables:In the second to fifth year 79,773 76,017 51,561 51,249After five years 286,672 308,963 105,821 112,339
366,445 384,980 157,382 163,588
Amounts receivable from project finance 384,857 402,884 177,530 181,515Less: unearned finance income (207,327) (221,369) – –
Present value of minimum payments receivable 177,530 181,515 177,530 181,515
10.4 RECEIVABLE FROM THE GOVERNMENT OF ABU DHABIReceivable from the Government of Abu Dhabi represents the amount receivable against certain assets sold in 2009 and 2011 and the recognition of revenue on land plots handed over.
10.5 DUE FROM ASSOCIATES AND JOINT VENTURES
Non-current Current
2015AED’000
2014AED’000
2015AED’000
2014AED’000
Gross receivables 168,670 169,429 272,878 382,151Less: provision for impairment (75,045) (67,492) (16,131) (16,131)
93,625 101,937 256,747 366,020
10.6 CONTRACTS WITH CUSTOMERS FOR SALE OF PROPERTIES
2015AED‘000
2014AED‘000
Amount due from customers included in trade and other receivables (Note 10) 111,408 –Amount due to customers included in trade and other payables (Note 20) (653,562) –
(542,154) –
Total contracts cost incurred plus recognised profits less recognised losses to date 588,375 –Less: total progress billings to date (1,130,529) –
(542,154) –
The above represents deferred revenue arising from sale of land and units. With respect to the above contracts, revenue aggregating to AED 2,454 million is expected to be recognised over the term of these contracts.
10.7 CONTRACTS WITH CUSTOMERS FOR CONSTRUCTION
2015AED‘000
2014AED‘000
Amount due from customers included in trade and other receivables (Note 10) 188,642 414,792Amount due to customers included in trade and other payables (Note 20) (47,554) (113,341)
141,088 301,451
Total contracts cost incurred plus recognised profits less recognised losses to date 7,254,868 8,253,294Less: total progress billings to date (7,113,780) (7,951,843)
141,088 301,451
The above represents unbilled revenue arising from construction contracts. With respect to the above contracts, revenue aggregating to AED 1,023 million is expected to be recognised over the period of these contracts.
Notes to the Consolidated Financial StatementsFor the year ended 31 December 2015

45Aldar Annual Report 2015
11 DEVELOPMENT WORK IN PROGRESSDevelopment work in progress represents development and construction costs incurred on properties being constructed for sale. Movement during the year is as follows:
2015AED‘000
2014AED‘000
Balance at beginning of the year 2,870,995 4,310,918Development costs incurred during the year 311,021 300,921Derecognised on disposal of a subsidiary (Note 36) – (44,333)Transfers (to)/from:
Investment properties (Note 7) – (844,712)Refundable costs – 22,419
Projects completed during the year:Transferred to inventories (Note 12) – (675,260)Recognised in costs of properties sold (427,475) (165,757)
Impairments/write-offs of project costs (Note 25) (9,565) (33,201)
Balance at the end of the year 2,744,976 2,870,995
All development work in progress projects are located in the United Arab Emirates.
12 INVENTORIES
2015AED‘000
2014AED‘000
Completed properties 276,532 913,408Other operating inventories 52,874 29,651
329,406 943,059
Completed properties in inventories are located in the United Arab Emirates.
13 CASH AND CASH EQUIVALENTS
2015AED‘000
2014AED‘000
Cash and bank balances 1,427,268 1,894,064Short-term deposits held with banks 4,832,486 2,770,297
Cash and bank balances 6,259,754 4,664,361Short-term deposits with original maturities greater than three months (3,654,944) (621,779)Restricted bank balances (1,000,643) (916,595)
Cash and cash equivalents 1,604,167 3,125,987
During the year, the Group held amounts related to one of its associates in addition to community service charges and security deposits on behalf of the owners of units in certain buildings or communities that are managed by the Group. At the end of the reporting period, an amount of AED 585 million (2014: AED 621.9 million) is not included in the Group’s bank balances and cash as it is held by the Group on behalf of third parties.
The interest rate on term deposits ranges between 0.1875% and 2.65% (2014: 0.55% and 2.00%) per annum. All fixed deposits are placed with local banks in the United Arab Emirates.
14 SHARE CAPITALShare capital comprises 7,862,629,603 (2014: 7,862,629,603) authorised, issued and fully paid up ordinary shares with a par value of AED 1 each.
15 STATUTORY RESERVEIn accordance with its Articles of Association and the UAE Federal Law No. (2) of 2015, 10% of the profit of the Company is transferred to a statutory reserve that is non-distributable. Transfers to this reserve may be suspended whenever the reserve reaches 50% of the paid up share capital of the Company.
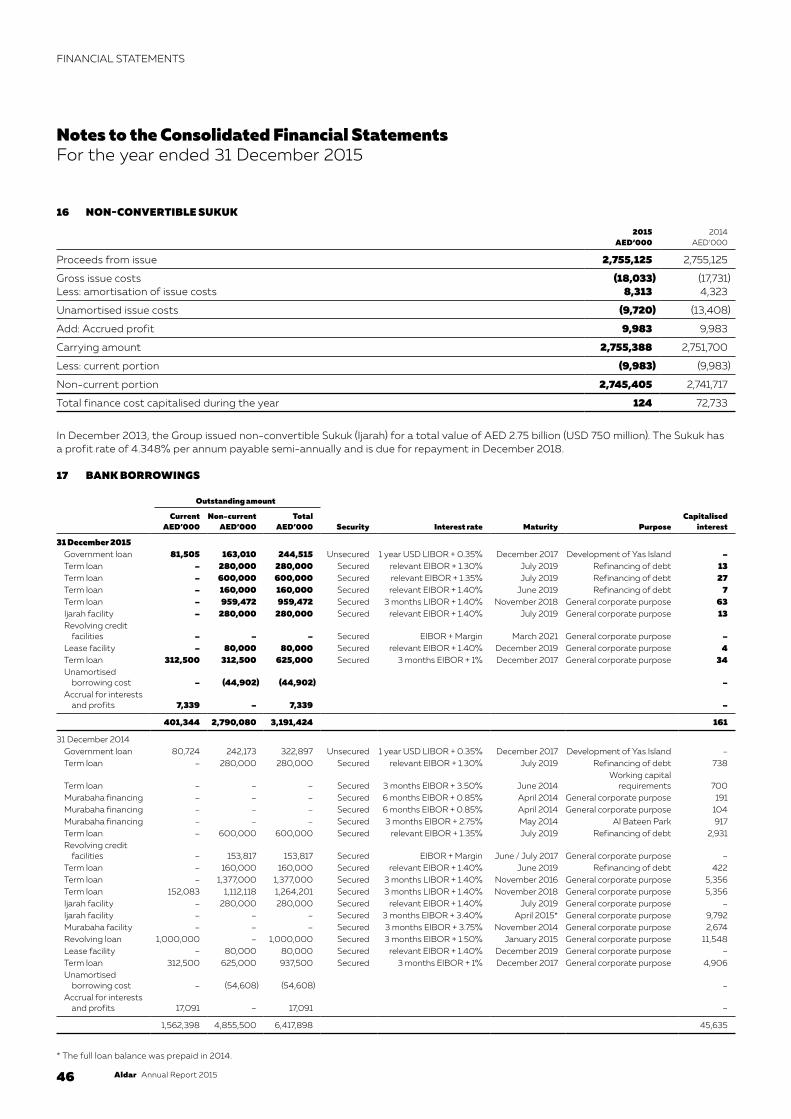
46 Aldar Annual Report 2015
FINANCIAL STATEMENTS
16 NON-CONVERTIBLE SUKUK
2015AED‘000
2014AED‘000
Proceeds from issue 2,755,125 2,755,125
Gross issue costs (18,033) (17,731)Less: amortisation of issue costs 8,313 4,323
Unamortised issue costs (9,720) (13,408)
Add: Accrued profit 9,983 9,983
Carrying amount 2,755,388 2,751,700
Less: current portion (9,983) (9,983)
Non-current portion 2,745,405 2,741,717
Total finance cost capitalised during the year 124 72,733
In December 2013, the Group issued non-convertible Sukuk (Ijarah) for a total value of AED 2.75 billion (USD 750 million). The Sukuk has a profit rate of 4.348% per annum payable semi-annually and is due for repayment in December 2018.
17 BANK BORROWINGS
Outstanding amount
Security Interest rate Maturity PurposeCapitalised
interestCurrent
AED’000Non-current
AED’000Total
AED’000
31 December 2015Government loan 81,505 163,010 244,515 Unsecured 1 year USD LIBOR + 0.35% December 2017 Development of Yas Island –Term loan – 280,000 280,000 Secured relevant EIBOR + 1.30% July 2019 Refinancing of debt 13Term loan – 600,000 600,000 Secured relevant EIBOR + 1.35% July 2019 Refinancing of debt 27Term loan – 160,000 160,000 Secured relevant EIBOR + 1.40% June 2019 Refinancing of debt 7Term loan – 959,472 959,472 Secured 3 months LIBOR + 1.40% November 2018 General corporate purpose 63Ijarah facility – 280,000 280,000 Secured relevant EIBOR + 1.40% July 2019 General corporate purpose 13Revolving credit
facilities – – – Secured EIBOR + Margin March 2021 General corporate purpose –Lease facility – 80,000 80,000 Secured relevant EIBOR + 1.40% December 2019 General corporate purpose 4Term loan 312,500 312,500 625,000 Secured 3 months EIBOR + 1% December 2017 General corporate purpose 34Unamortised
borrowing cost – (44,902) (44,902) –Accrual for interests
and profits 7,339 – 7,339 –
401,344 2,790,080 3,191,424 161
31 December 2014Government loan 80,724 242,173 322,897 Unsecured 1 year USD LIBOR + 0.35% December 2017 Development of Yas Island –Term loan – 280,000 280,000 Secured relevant EIBOR + 1.30% July 2019 Refinancing of debt 738
Term loan – – – Secured 3 months EIBOR + 3.50% June 2014Working capital
requirements 700Murabaha financing – – – Secured 6 months EIBOR + 0.85% April 2014 General corporate purpose 191Murabaha financing – – – Secured 6 months EIBOR + 0.85% April 2014 General corporate purpose 104Murabaha financing – – – Secured 3 months EIBOR + 2.75% May 2014 Al Bateen Park 917Term loan – 600,000 600,000 Secured relevant EIBOR + 1.35% July 2019 Refinancing of debt 2,931Revolving credit
facilities – 153,817 153,817 Secured EIBOR + Margin June / July 2017 General corporate purpose –Term loan – 160,000 160,000 Secured relevant EIBOR + 1.40% June 2019 Refinancing of debt 422Term loan – 1,377,000 1,377,000 Secured 3 months LIBOR + 1.40% November 2016 General corporate purpose 5,356Term loan 152,083 1,112,118 1,264,201 Secured 3 months LIBOR + 1.40% November 2018 General corporate purpose 5,356Ijarah facility – 280,000 280,000 Secured relevant EIBOR + 1.40% July 2019 General corporate purpose –Ijarah facility – – – Secured 3 months EIBOR + 3.40% April 2015* General corporate purpose 9,792Murabaha facility – – – Secured 3 months EIBOR + 3.75% November 2014 General corporate purpose 2,674Revolving loan 1,000,000 – 1,000,000 Secured 3 months EIBOR + 1.50% January 2015 General corporate purpose 11,548Lease facility – 80,000 80,000 Secured relevant EIBOR + 1.40% December 2019 General corporate purpose –Term loan 312,500 625,000 937,500 Secured 3 months EIBOR + 1% December 2017 General corporate purpose 4,906Unamortised
borrowing cost – (54,608) (54,608) –Accrual for interests
and profits 17,091 – 17,091 –
1,562,398 4,855,500 6,417,898 45,635
* The full loan balance was prepaid in 2014.
Notes to the Consolidated Financial StatementsFor the year ended 31 December 2015

47Aldar Annual Report 2015
The borrowings are repayable as follows:
2015AED‘000
2014AED‘000
Current:Within one year 401,344 1,562,398
Non-current:In the second to fifth year 2,790,080 4,855,500
3,191,424 6,417,898
In March 2012, the Group signed a loan facility for AED 4.0 billion. In January 2015, the Group repaid in full the remaining AED 1.0 billion outstanding balance as at the end of December 2014.
In November 2013, the Group signed a term loan facility for AED 1.25 billion repayable in four equal installments commencing 15 December 2014. This loan is secured by assignment of Government receivables. The balance as of 31 December 2015 was AED 625 million.
In November 2013, the Group signed a term loan facility for USD 750 million (AED 2.75 billion) which USD 375 million (Facility A) is repayable in one bullet payment in November 2016 and the remaining USD 375 million (Facility B) is repayable in quarterly installments until November 2018. During 2015, the Group pre-paid the full balance of Facility A and USD 41.4 million of quarterly installments under Facility B due in 2016.
In July 2014, the Group signed a number of bilateral facilities with banks for AED 3.2 billion. The facilities comprised of AED 1.8 billion of committed revolving credit facilities for a tenor of three years and AED 1.4 billion of term loans with a maturity of five years. In December 2015, the Group has renegotiated the terms of the revolving credit facilities increasing the facility amounts from AED 1.8 billion to AED 2.0 billion and extending the maturity until 31 March 2021 with an option to extend the maturity for a further two years with banks’ approval.
Loan securities are in the form of mortgages over plots of land, assignment of project receivables and lien on bank deposits. Certain Group’s borrowings carry a net worth covenant.
Borrowings repaid during the year amounted to AED 3.23 billion (2014: AED 5.85 billion).
18 PROVISION FOR EMPLOYEES’ END OF SERVICE BENEFITMovement in the provision for end of service benefit is as follows:
2015AED‘000
2014AED‘000
Balance at the beginning of the year 101,919 96,901Charge for the year (Note 24) 25,065 23,628Paid during the year (11,109) (18,610)
Balance at the end of the year 115,875 101,919
19 ADVANCES FROM CUSTOMERSAdvances from customers represent installments collected from customers against sale of the Group’s property developments. This also includes net advances received from the Government of Abu Dhabi (Note 31) amounting to AED 409 million (2014: AED 415.4 million).

48 Aldar Annual Report 2015
FINANCIAL STATEMENTS
20 TRADE AND OTHER PAYABLES
2015AED‘000
2014AED‘000
Trade payables 367,809 426,198Accrual for contractors’ costs 1,674,009 2,159,456Accrual for infrastructure costs 8,151 263,918Advances from the Government of Abu Dhabi 4,237,508 4,311,156Deferred income 459,809 361,216Dividends payable 106,042 92,359Provision for onerous contracts 102,918 83,363Gross amount due to customers on contracts for sale of properties (Note 10.6) 653,562 –Gross amount due to customers on contracts to construct an asset (Note 10.7) 47,554 113,341Other liabilities 634,513 685,397
8,291,875 8,496,404
The Group has financial and risk management policies in place to ensure that all payables are paid within the pre-agreed credit terms.
21 REVENUE
2015AED’000
2014AED’000
Property development and management 1,269,990 4,131,721Operating businesses 3,315,550 2,419,357
4,585,540 6,551,078
22 DIRECT COSTS
2015AED’000
2014AED’000
Cost of property development and management 600,263 3,628,672Direct costs of operating businesses 1,779,353 1,404,000
2,379,616 5,032,672
23 SELLING AND MARKETING EXPENSES
2015AED’000
2014AED’000
Corporate advertising 21,859 12,316Exhibitions and sponsorships 9,730 8,111Project marketing 26,992 15,113Other 2,685 –
61,266 35,540
24 STAFF COSTS
2015AED’000
2014AED’000
Salaries, bonuses and other benefits 634,413 578,278Post-employment benefit (Note 18) 25,065 23,628Staff training and development 4,794 6,165
664,272 608,071
Staff costs allocated to:Direct operating costs 409,598 355,272General and administrative expenses 229,509 231,226Projects under development 25,165 21,573
664,272 608,071
Notes to the Consolidated Financial StatementsFor the year ended 31 December 2015
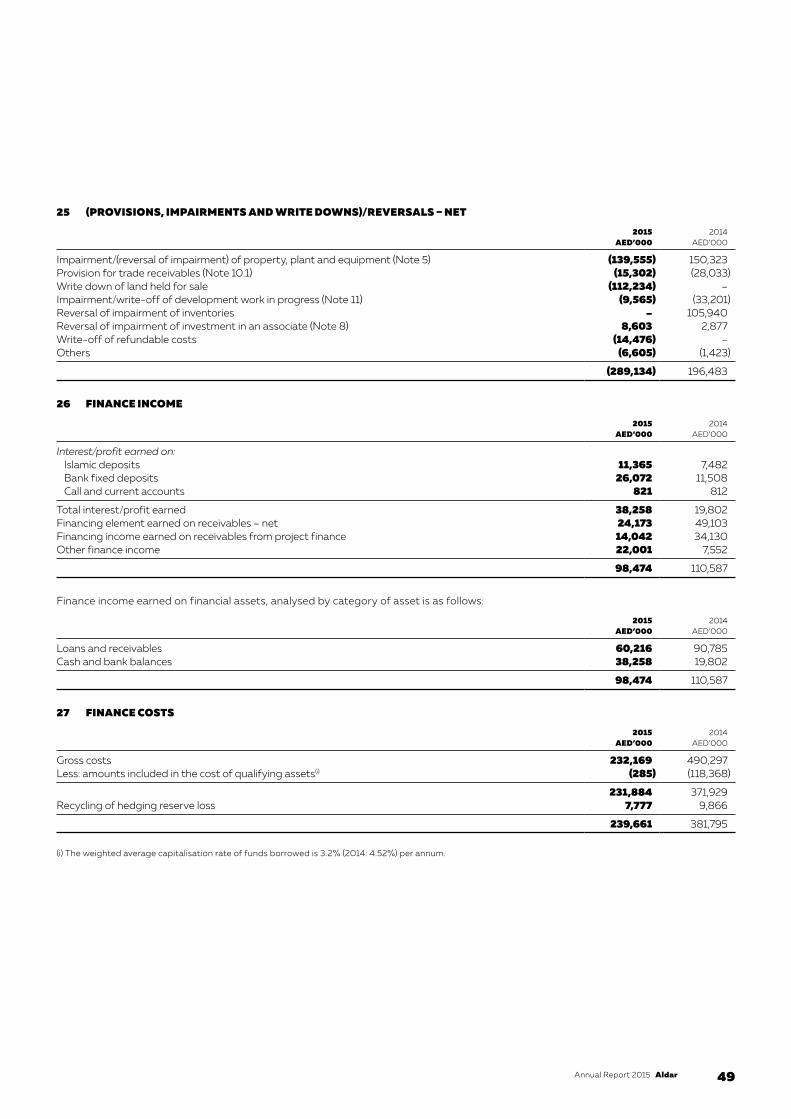
49Aldar Annual Report 2015
25 (PROVISIONS, IMPAIRMENTS AND WRITE DOWNS)/REVERSALS – NET
2015AED’000
2014AED’000
Impairment/(reversal of impairment) of property, plant and equipment (Note 5) (139,555) 150,323Provision for trade receivables (Note 10.1) (15,302) (28,033)Write down of land held for sale (112,234) –Impairment/write-off of development work in progress (Note 11) (9,565) (33,201)Reversal of impairment of inventories – 105,940Reversal of impairment of investment in an associate (Note 8) 8,603 2,877Write-off of refundable costs (14,476) –Others (6,605) (1,423)
(289,134) 196,483
26 FINANCE INCOME
2015AED’000
2014AED’000
Interest/profit earned on:Islamic deposits 11,365 7,482Bank fixed deposits 26,072 11,508Call and current accounts 821 812
Total interest/profit earned 38,258 19,802Financing element earned on receivables – net 24,173 49,103Financing income earned on receivables from project finance 14,042 34,130Other finance income 22,001 7,552
98,474 110,587
Finance income earned on financial assets, analysed by category of asset is as follows:
2015AED’000
2014AED’000
Loans and receivables 60,216 90,785Cash and bank balances 38,258 19,802
98,474 110,587
27 FINANCE COSTS
2015AED’000
2014AED’000
Gross costs 232,169 490,297Less: amounts included in the cost of qualifying assets(i) (285) (118,368)
231,884 371,929Recycling of hedging reserve loss 7,777 9,866
239,661 381,795
(i) The weighted average capitalisation rate of funds borrowed is 3.2% (2014: 4.52%) per annum.

50 Aldar Annual Report 2015
FINANCIAL STATEMENTS
28 OTHER INCOME
2015AED’000
2014AED’000
Reversal of infrastructure cost accruals – 63,405Government grant income recognised upon handover of units in the Gate Tower (Note 31.1.b) – 346,928Government grant income recorded upon handover of infrastructure assets (Note 31.1.c) 165,668 311,128Government grant income related to costs recovered from the Government (Note 31.2) – 83,121Release of Infrastructure accruals(i) 457,717 –Others 70,782 48,998
694,167 853,580
(i) This relates to release of infrastructure cost accruals and other liabilities upon finalisation of costs on a certain master planned community development.
29 EARNINGS PER SHAREBasic earnings per share amounts are calculated by dividing profit for the year attributable to ordinary equity holders of the parent by the weighted average number of ordinary shares outstanding during the year. As there are no dilutive instruments outstanding, basic and diluted earnings per share are identical.
The calculation of basic and diluted earnings per share attributable to the owners of the Company is based on the following data:
2015 2014
Earnings (AED ‘000)Earnings for the purpose of basic and diluted earnings per share
(profit for the year attributable to owners of the Company) 2,536,794 2,235,136
Weighted average number of sharesWeighted average number of ordinary shares for the purpose of basic and diluted earnings per share 7,862,629,603 7,862,629,603
Basic and diluted earnings per share attributable to owners of the Company in AED 0.323 0.284
30 DIVIDENDSAt the annual general assembly held on 18 March 2015, the shareholders approved the recommendation of the Board of Directors to distribute dividends of AED 9 fils per share for a total of AED 707.6 million. The Board of Directors propose a cash dividend of AED 10 fils per share for the year ended 31 December 2015. The proposed dividend is subject to the approval of the shareholders at the annual general assembly.
31 TRANSACTIONS AND BALANCES WITH RELATED PARTIES Parties are considered to be related if one party has the ability to control the other party or exercise significant influence over the other party in making financial or operational decisions. Related parties comprise of major shareholder, associated companies, Directors, key management personnel of the Group and their related entities. The terms of these transactions are approved by the Group’s management and are made on terms agreed by the Board of Directors or management. Government of Abu Dhabi is an indirect major shareholder of the Company.
Related party balances:
2015AED’000
2014AED’000
Due from/(to) Government:Refundable costs (Notes 10.2) 315,744 2,107,207Receivable from assets sold (Note 10) 1,121,967 2,710,805Other receivables 188,090 195,703
1,625,801 5,013,715
Advances received (Notes 19 and 20) (4,646,500) (4,726,603)
Due from associates and joint ventures (Note 10.5) 350,372 467,957
Due to joint ventures for project-related workContract payables (32,692) (32,692)Retention payables (815) (815)
(33,507) (33,507)
Certain receivables from joint ventures carry interest of 9% per annum and are repayable within two to five years.
Notes to the Consolidated Financial StatementsFor the year ended 31 December 2015

51Aldar Annual Report 2015
2015AED’000
2014AED’000
Due (to)/from major shareholder owned by Government and/or its associated companies:Receivable from project finance (Note 10.3) 142,798 146,783Due to a major shareholder – net (150,716) (126,714)
(7,918) 20,069
Significant transactions with related parties during the year are as follows:
2015AED’000
2014AED’000
Key management compensation:Salaries, bonuses and other benefits 12,963 14,866Post-employment benefits 471 689
13,434 15,555
Directors remuneration paid 25,000 23,999
Income from the Government and major shareholder owned by the GovernmentRevenue from sale of land and properties 10,000 1,253,327Project management income 149,604 63,811Rental income 300,060 242,797Government grant income (Note 28) 165,668 741,177
625,332 2,301,112
Work provided by joint ventures 102 311
Finance income from project finance and joint ventures 23,447 38,543
31.1 In January 2013, the Government of Abu Dhabi had agreed to reimburse up to AED 1.6 billion of infrastructure costs and to purchase units in the Gate Towers development for AED 1.6 billion. As of 31 December 2015, AED 2.9 billion has been received. These transactions have been accounted for as follows:
a) AED 1.6 billion of the amount received has been recorded as an advance received from the Government, included in “advances from customers” and AED 1.3 billion has been recorded as “advances from the Government of Abu Dhabi” under trade and other payables. As of 31 December 2015, the balance in “advances from the customers” is AED Nil (Note 19) and AED 554.0 million in “advances from the Government of Abu Dhabi” (Note 20).
b) The difference between the selling price of units in the Gate Towers and the fair market price has been recorded as a deferred Government grant under trade and other payables (Note 20). During the year, an amount of AED Nil was recognised as Government grant income upon handover of units (2014: AED 346.9 million) (Note 28).
c) The amount and timing of the infrastructure cost reimbursement is subject to the completion of certain audit and technical inspections and assessments to be performed by the relevant government authority. Once these activities are completed, there will be reasonable assurance that the grant will be received and at that point it will be recognised as a deferred government grant in the consolidated statement of financial position. Once the conditions of the grant are met, i.e. infrastructure assets are handed over to the designated authorities, the deferred government grant will be recognised as other income in income statement. During the year, an amount of AED 165.7 million (2014: AED 311.1 million) was recognised as government grant income, recorded under other income in the consolidated income statement (Note 28), upon handover of infrastructure assets.
31.2 During the year the Group recognised AED Nil (2014: AED 83.1 million) as government grant income being compensations received for certain costs previously incurred.
31.3 Outstanding borrowings of AED 1,993.8 million (31 December 2014: AED 3,534.2 million) are due to the Government and banks controlled by the Government. Finance cost on these borrowings amounted to AED 58.3 million (2014: AED 111.4 million).
31.4 Outstanding deposits of AED 2,510.3 million (31 December 2014: AED 1,647.3 million) are kept with banks controlled by the Government. Finance income on these deposits amounted to AED 19.3 million (2014: AED 9.2 million).

52 Aldar Annual Report 2015
FINANCIAL STATEMENTS
32 COMMITMENTS AND CONTINGENCIES32.1 CAPITAL COMMITMENTSCapital expenditure contracted but not yet incurred at the end of the year is as follows:
2015AED’000
2014AED’000
Projects under development 1,481,828 420,169Reimbursable project works in progress 4,364,283 5,466,525Investment in associates 30,342 79,569Other – 4,090
5,876,453 5,970,353
The above commitments are spread over a period of one to five years.
The Group has outstanding advances to the suppliers and contractors amounting to AED 1,159 million (2014: AED 937.1 million) against the above commitments.
32.2 OPERATING LEASE COMMITMENTSThe Company has leased out certain buildings. The amounts of committed future lease inflows are as follows:
The Company as lessor
2015AED’000
2014AED’000
Buildings:Within one year 775,758 899,249In the second to fifth year 2,061,257 2,414,957After five years 533,431 791,158
3,370,446 4,105,364
The Company as lesseeThe Company has annual operating lease commitments with respect to rental of land and buildings. The minimum lease payments are as follows:
2015AED’000
2014AED’000
Land:Within one year 58,821 59,048In the second to fifth year 143,105 160,465After five years 329,602 360,493
531,528 580,006
The Group does not have the option to purchase the leased premises at expiry of the lease period but the lease can be renewed upon mutual agreements of both parties.
32.3 CONTINGENCIESLetters of credit and bank guarantees
2015AED’000
2014AED’000
Letters of credit and bank guarantees:Issued by the Group 589,800 497,516
Group’s share in contingencies of joint ventures and associates 232,369 243,039
Notes to the Consolidated Financial StatementsFor the year ended 31 December 2015

53Aldar Annual Report 2015
33 FINANCIAL INSTRUMENTS33.1 SIGNIFICANT ACCOUNTING POLICIESDetails of the significant accounting policies and methods adopted, including the criteria for recognition, the basis of measurement and the basis on which income and expenses are recognised, in respect of each class of financial asset, financial liability and equity instrument are disclosed in Note 3 to the consolidated financial statements.
33.2 CATEGORIES OF FINANCIAL INSTRUMENTS
2015AED’000
2014AED’000
Financial assetsAvailable-for-sale financial assets 122,973 108,007Loans and receivables (including cash and bank balances) 11,663,166 13,223,032
Total 11,786,139 13,331,039
Financial liabilitiesFinancial liabilities measured at amortised cost 9,544,336 14,122,471Derivative instruments 20,424 29,512
Total 9,564,760 14,151,983
33.3 FINANCIAL RISK MANAGEMENTThe Group’s Corporate Finance and Treasury function provides services to the business, coordinates access to domestic and international financial markets, monitors and manages financial risks based on internally developed models, benchmarks and forecasts. The Group seeks to minimise the effects of financial risks by using appropriate risk management techniques including using derivative financial instruments to hedge risk exposures. The use of financial derivatives is governed by management’s analysis of market trends, liquidity position and predicted movements in interest rate and foreign currency rates which are reviewed by the management on a continuous basis.
The Group does not enter into or trade financial instruments, including derivative financial instruments, for speculative purposes.
The Group analyses financial risks under the following captions:
33.4 CAPITAL RISK MANAGEMENTCapital risk is the risk that the Group is not able to manage its capital structure to ensure that all entities in the Group will be able to continue as a going concern.
The Group’s capital structure comprises non-convertible Sukuk, borrowings, cash and bank balances and equity attributable to owners of the Company, comprising issued capital, share premium, reserves and accumulated losses as disclosed in the consolidated statement of changes in equity.
The Group monitors and adjusts its capital structure with a view to promote the long-term success of the business while maintaining sustainable returns for shareholders. This is achieved through a combination of risk management actions including monitoring solvency, minimising financing costs, rigorous investment appraisals and maintaining high standards of business conduct.
Key financial measures that are subject to regular review include cash flow projections and assessment of their ability to meet contracted commitments, projected gearing levels and compliance with borrowing covenants, although no absolute targets are set for these.
The Group monitors its cost of debt on a regular basis. At 31 December 2015, the weighted average cost of debt was 3.17% (2014: 2.65%). Investment and development opportunities are evaluated against an appropriate equity return in order to ensure that long-term shareholder value is created.
The covenants of six (2014: six) borrowing arrangements require the Group maintaining a minimum equity of AED 6.0 billion.
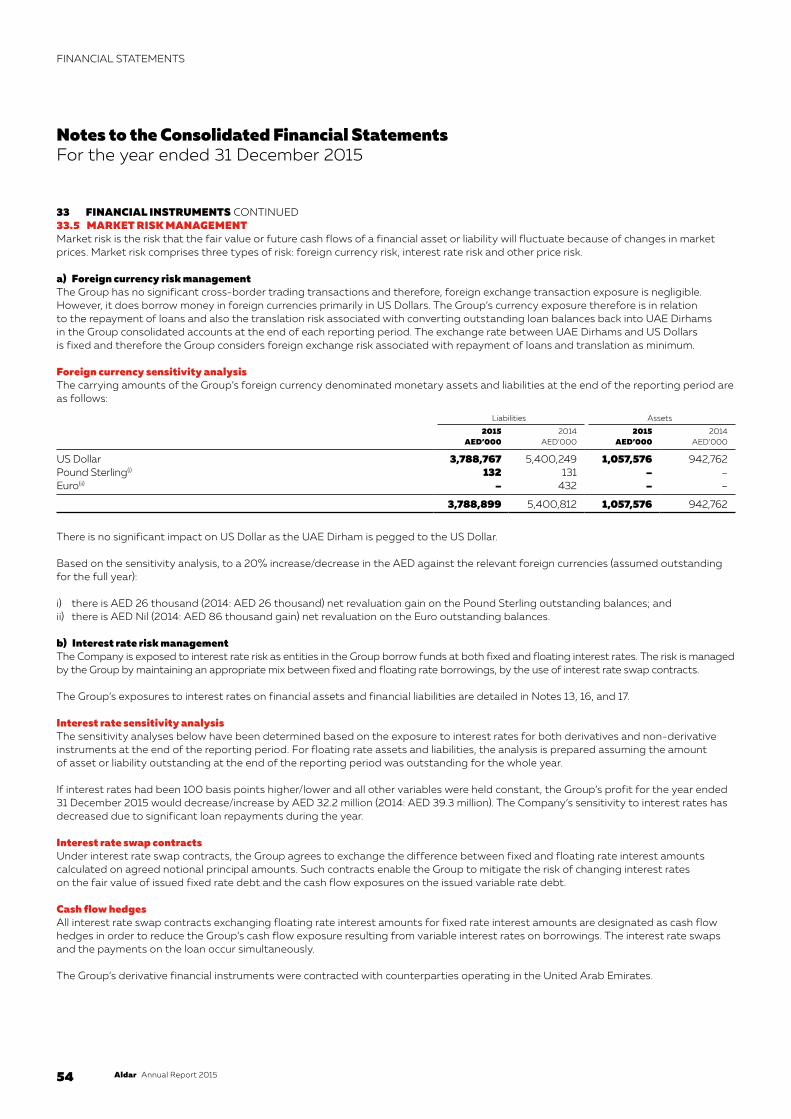
54 Aldar Annual Report 2015
FINANCIAL STATEMENTS
33 FINANCIAL INSTRUMENTS CONTINUED33.5 MARKET RISK MANAGEMENTMarket risk is the risk that the fair value or future cash flows of a financial asset or liability will fluctuate because of changes in market prices. Market risk comprises three types of risk: foreign currency risk, interest rate risk and other price risk.
a) Foreign currency risk managementThe Group has no significant cross-border trading transactions and therefore, foreign exchange transaction exposure is negligible. However, it does borrow money in foreign currencies primarily in US Dollars. The Group’s currency exposure therefore is in relation to the repayment of loans and also the translation risk associated with converting outstanding loan balances back into UAE Dirhams in the Group consolidated accounts at the end of each reporting period. The exchange rate between UAE Dirhams and US Dollars is fixed and therefore the Group considers foreign exchange risk associated with repayment of loans and translation as minimum.
Foreign currency sensitivity analysisThe carrying amounts of the Group’s foreign currency denominated monetary assets and liabilities at the end of the reporting period are as follows:
Liabilities Assets
2015 AED’000
2014 AED’000
2015 AED’000
2014 AED’000
US Dollar 3,788,767 5,400,249 1,057,576 942,762Pound Sterling(i) 132 131 – –Euro(ii) – 432 – –
3,788,899 5,400,812 1,057,576 942,762
There is no significant impact on US Dollar as the UAE Dirham is pegged to the US Dollar.
Based on the sensitivity analysis, to a 20% increase/decrease in the AED against the relevant foreign currencies (assumed outstanding for the full year):
i) there is AED 26 thousand (2014: AED 26 thousand) net revaluation gain on the Pound Sterling outstanding balances; andii) there is AED Nil (2014: AED 86 thousand gain) net revaluation on the Euro outstanding balances.
b) Interest rate risk managementThe Company is exposed to interest rate risk as entities in the Group borrow funds at both fixed and floating interest rates. The risk is managed by the Group by maintaining an appropriate mix between fixed and floating rate borrowings, by the use of interest rate swap contracts.
The Group’s exposures to interest rates on financial assets and financial liabilities are detailed in Notes 13, 16, and 17.
Interest rate sensitivity analysisThe sensitivity analyses below have been determined based on the exposure to interest rates for both derivatives and non-derivative instruments at the end of the reporting period. For floating rate assets and liabilities, the analysis is prepared assuming the amount of asset or liability outstanding at the end of the reporting period was outstanding for the whole year.
If interest rates had been 100 basis points higher/lower and all other variables were held constant, the Group’s profit for the year ended 31 December 2015 would decrease/increase by AED 32.2 million (2014: AED 39.3 million). The Company’s sensitivity to interest rates has decreased due to significant loan repayments during the year.
Interest rate swap contractsUnder interest rate swap contracts, the Group agrees to exchange the difference between fixed and floating rate interest amounts calculated on agreed notional principal amounts. Such contracts enable the Group to mitigate the risk of changing interest rates on the fair value of issued fixed rate debt and the cash flow exposures on the issued variable rate debt.
Cash flow hedgesAll interest rate swap contracts exchanging floating rate interest amounts for fixed rate interest amounts are designated as cash flow hedges in order to reduce the Group’s cash flow exposure resulting from variable interest rates on borrowings. The interest rate swaps and the payments on the loan occur simultaneously.
The Group’s derivative financial instruments were contracted with counterparties operating in the United Arab Emirates.
Notes to the Consolidated Financial StatementsFor the year ended 31 December 2015

55Aldar Annual Report 2015
33.6 CREDIT RISK MANAGEMENTCredit risk in relation to the Group, refers to the risk that a counter party will default on its contractual obligations resulting in financial loss to the Group.
Key areas where the Group is exposed to credit risk are trade and other receivables and bank and cash balances and derivative financial assets (liquid assets).
The Group has adopted a policy of only dealing with creditworthy counterparties as a means of mitigating the risk of financial loss from defaults. The Group attempts to control credit risk by monitoring credit exposures, limiting transactions with specific non-related counterparties, and continually assessing the creditworthiness of such non-related counterparties.
Concentration of credit riskConcentration of credit risk arise when a number of counterparties are engaged in similar business activities, or activities in the same geographic region, or have similar economic features that would cause their ability to meet contractual obligations to be similarly affected by changes in economic, political or other conditions. Concentration of credit risk indicates the relative sensitivity of the Group’s performance to developments affecting a particular industry or geographic location. Details on concentration of trade receivable balances are disclosed in Note 10. Management believes that the concentration of credit risk is mitigated by having received installment payments, in some cases substantial, which the Group would contractually be entitled to retain in the event of non-completion of the remaining contractual obligations in order to cover the losses incurred by the Group.
At 31 December 2015, 100% (2014: 100%) of the deposits were placed with six banks. Balances with banks are assessed to have low credit risk of default since these banks are among the major banks operating in the UAE and are regulated by the central bank.
Trade and other receivables and balances with banks are not secured by any collateral. The amount that best represents maximum credit risk exposure on financial assets at the end of the reporting period, in the event counter parties fail to perform their obligations generally approximates their carrying value.
33.7 LIQUIDITY RISK MANAGEMENTThe responsibility for liquidity risk management rests with the management of the Group, that have built an appropriate liquidity risk management framework for the management of the Group’s short, medium and long term funding and liquidity management requirements. The Group manages liquidity risk by maintaining adequate reserves, banking facilities and committed borrowing facilities, by continuously monitoring forecast and actual cash flows and matching the maturity profiles of financial assets and liabilities.

56 Aldar Annual Report 2015
FINANCIAL STATEMENTS
33 FINANCIAL INSTRUMENTS CONTINUED33.7 LIQUIDITY RISK MANAGEMENT CONTINUEDThe following tables detail the Group’s remaining contractual maturity for its non-derivative financial assets and liabilities. The tables have been drawn up based on the undiscounted cash flows of non-derivative financial assets and liabilities based on the earliest date on which the Group can be required to pay or collect. The table includes both interest and principal cash flows. Maturity profile of non-derivative financial assets and liabilities at the end of the reporting period is as follows:
Effectiveinterest
rate< 1 monthAED’000
1 to 3months
AED’000
3 monthsto 1 year
AED’000
1 to 5years
AED’000> 5 years
AED’000Total
AED’000
31 December 2015Financial assetsNon-interest bearing
instruments 3,700 208,739 3,398,122 725,464 93,626 4,429,651Receivables from project
finance 8.07% – 5,125 20,314 79,773 279,645 384,857Variable interest rate
instruments Note 13 1,492,463 1,108,311 3,684,669 – – 6,285,443
Total 1,496,163 1,322,175 7,103,105 805,237 373,271 11,099,951
Financial liabilitiesNon-interest bearing
instruments(1) 92,635 2,325,384 1,053,748 125,756 – 3,597,523Non-convertible bonds Note 16 – – 9,983 2,755,125 – 2,765,108Variable interest rate
instruments Note 17 4,238 3,102 394,005 2,855,407 – 3,256,752Derivative instruments – – – 20,424 – 20,424
Total 96,873 2,328,486 1,457,736 5,756,712 – 9,639,807
31 December 2014Financial assetsNon-interest bearing
instruments 1,204,751 135,161 6,524,069 879,403 – 8,743,384Receivables from project
finance 8.06% – 5,125 16,729 76,017 308,964 406,835Variable interest rate
instruments Note 13 1,153,724 1,905,499 1,615,286 – – 4,674,509
Total 2,358,475 2,045,785 8,156,084 955,420 308,964 13,824,728
Financial liabilitiesNon-interest bearing
instruments(1) 112,375 2,791,525 1,919,241 16,490 – 4,839,631 Non-convertible bonds Note 16 9,983 – – 2,755,125 – 2,765,108Variable interest rate
instruments Note 17 1,007,109 38,021 517,269 4,910,107 – 6,472,506Derivative instruments 1,136 – – 28,376 – 29,512
Total 1,130,603 2,829,546 2,436,510 7,710,098 – 14,106,757
(1) Including security deposits from customers.
Notes to the Consolidated Financial StatementsFor the year ended 31 December 2015

57Aldar Annual Report 2015
34 FAIR VALUE OF FINANCIAL INSTRUMENTSExcept as disclosed in the following table, Management considers that the carrying amounts of financial assets and financial liabilities recognised at amortised cost in the consolidated financial statements approximate their fair values.
As at 31 December 2015
Gross carrying
amount AED’000
Fair value
AED’000
Financial liabilities at amortised costSukuk-al-Ijarah (Note 16) 2,755,388 2,841,223
As at 31 December 2014
Grosscarryingamount
AED’000
Fairvalue
AED’000
Financial liabilities at amortised costSukuk-al-Ijarah (Note 16) 2,751,700 2,872,218
Following the amendment to IFRS 7, all financial instruments that are required to be measured at fair value (subsequent to initial recognition) should be disclosed in a fair value hierarchy or grouping into 3 levels (Levels 1 to 3) based on the degree to which the fair value is observable.
Level 1 fair value is derived from quoted prices (unadjusted) in active markets for identical assets or liabilities.
Level 2 fair value measurements are derived from inputs other than quoted prices, and Level 3 are those that are derived from valuation techniques using unobservable inputs.
As at 31 December 2014 and 31 December 2015, the Group’s financial assets that are stated at fair value are grouped as follows:
Level 1AED’000
Level 2AED’000
Level 3AED’000
TotalAED’000
31 December 2015Available-for-sale investmentsEquities 30,600 92,373 – 122,973
31 December 2014Available-for-sale investmentsEquities 34,170 73,837 – 108,007
During 2014, one of the investments got listed and commenced trading on the secondary market for private companies of Abu Dhabi Securities Exchange (ADX). Accordingly, this investment has been transferred from Level 2 to Level 1 (Note 9).
The fair values of derivative instruments amounting to AED 20 million pertaining to interest rate swap are determined by independent valuers (see Note 33.5) and are measured at the present value of future cash flows estimated and discounted based on the applicable yield curves derived from quoted interest rates. The derivative instruments are categorised as Level 2.
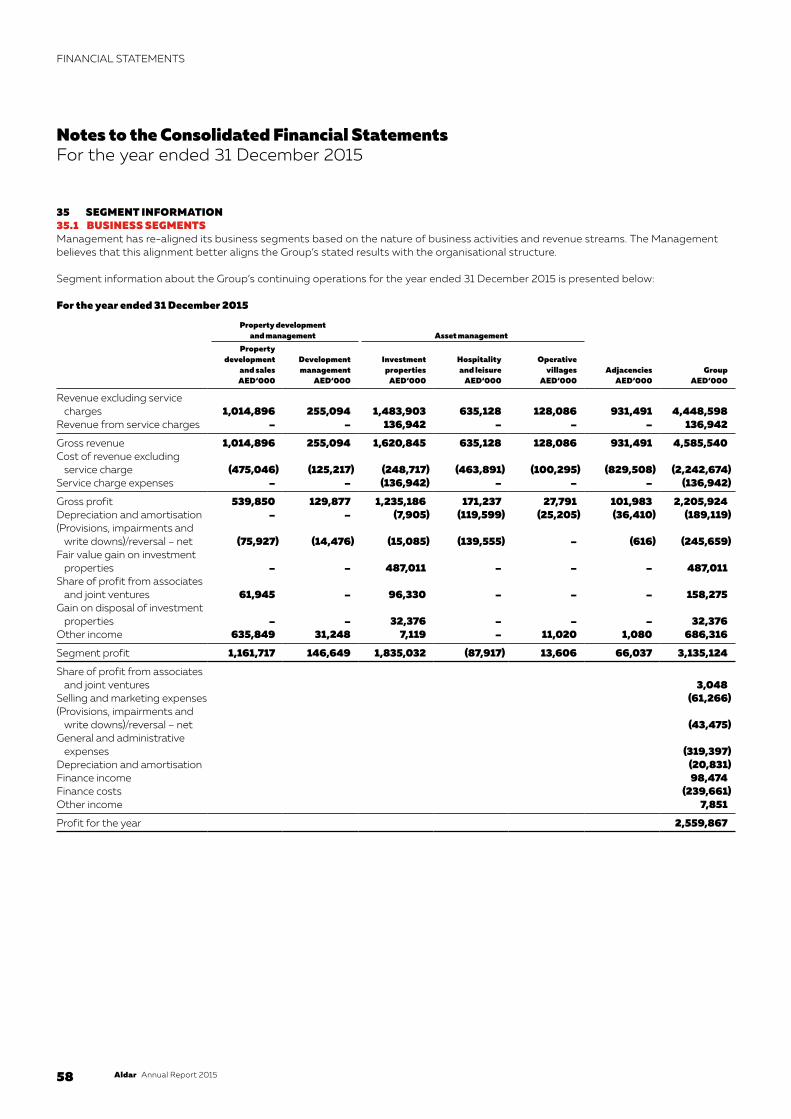
58 Aldar Annual Report 2015
FINANCIAL STATEMENTS
35 SEGMENT INFORMATION35.1 BUSINESS SEGMENTSManagement has re-aligned its business segments based on the nature of business activities and revenue streams. The Management believes that this alignment better aligns the Group’s stated results with the organisational structure.
Segment information about the Group’s continuing operations for the year ended 31 December 2015 is presented below:
For the year ended 31 December 2015
Property development and management Asset management
AdjacenciesAED‘000
GroupAED‘000
Propertydevelopment
and salesAED‘000
Developmentmanagement
AED‘000
Investmentproperties
AED‘000
Hospitalityand leisure
AED‘000
Operativevillages
AED‘000
Revenue excluding service charges 1,014,896 255,094 1,483,903 635,128 128,086 931,491 4,448,598
Revenue from service charges – – 136,942 – – – 136,942
Gross revenue 1,014,896 255,094 1,620,845 635,128 128,086 931,491 4,585,540Cost of revenue excluding
service charge (475,046) (125,217) (248,717) (463,891) (100,295) (829,508) (2,242,674)Service charge expenses – – (136,942) – – – (136,942)
Gross profit 539,850 129,877 1,235,186 171,237 27,791 101,983 2,205,924Depreciation and amortisation – – (7,905) (119,599) (25,205) (36,410) (189,119)(Provisions, impairments and
write downs)/reversal – net (75,927) (14,476) (15,085) (139,555) – (616) (245,659)Fair value gain on investment
properties – – 487,011 – – – 487,011Share of profit from associates
and joint ventures 61,945 – 96,330 – – – 158,275Gain on disposal of investment
properties – – 32,376 – – – 32,376Other income 635,849 31,248 7,119 – 11,020 1,080 686,316
Segment profit 1,161,717 146,649 1,835,032 (87,917) 13,606 66,037 3,135,124
Share of profit from associates and joint ventures 3,048
Selling and marketing expenses (61,266)(Provisions, impairments and
write downs)/reversal – net (43,475)General and administrative
expenses (319,397)Depreciation and amortisation (20,831)Finance income 98,474Finance costs (239,661)Other income 7,851
Profit for the year 2,559,867
Notes to the Consolidated Financial StatementsFor the year ended 31 December 2015

59Aldar Annual Report 2015
Segment information about the Group’s continuing operations for the year ended 31 December 2014 is presented below:
For the year ended 31 December 2014
Property development and management Asset management
AdjacenciesAED‘000
GroupAED‘000
Propertydevelopment
and salesAED‘000
Developmentmanagement
AED‘000
InvestmentpropertiesAED‘000
Hospitalityand leisure
AED‘000
Operativevillages
AED‘000
Revenue excluding service charges 3,732,926 398,795 992,500 622,743 119,288 589,351 6,455,603
Revenue from service charges – – 95,475 – – – 95,475
Gross revenue 3,732,926 398,795 1,087,975 622,743 119,288 589,351 6,551,078
Cost of revenue excluding service charge (3,314,869) (313,803) (255,311) (458,840) (88,112) (506,262) (4,937,197)
Service charge expenses – – (95,475) – – – (95,475)
Gross profit 418,057 84,992 737,189 163,903 31,176 83,089 1,518,406Depreciation and amortisation – – (9,438) (136,369) (23,620) (34,737) (204,164)(Provisions, impairments and
write downs)/reversal – net 93,055 – (41,259) 150,601 – (2,052) 200,345Fair value loss on investment
properties – – 474,157 – – – 474,157Share of profit from associates
and joint ventures 5,175 – 103,249 – – – 108,424Gain on discontinued operation 9,720 – – – – – 9,720Gain on disposal of investment
properties – – 28,437 – – – 28,437Other income 736,663 – 24,566 – – 73 761,302
Segment profit 1,262,670 84,992 1,316,901 178,135 7,556 46,373 2,896,627
Share of loss from associates and joint ventures (12,418)
Gain on disposal of investment in associates 42,039
(Provisions, impairments and write downs)/reversal – net (3,862)
Selling and marketing expenses (35,540)General and administrative
expenses (418,057)Depreciation and amortisation (23,506)Finance income 110,587Finance costs (381,795)Other income 92,278
Profit for the year 2,266,353
The numbers for the comparative period have been amended in line with the change in business segment.
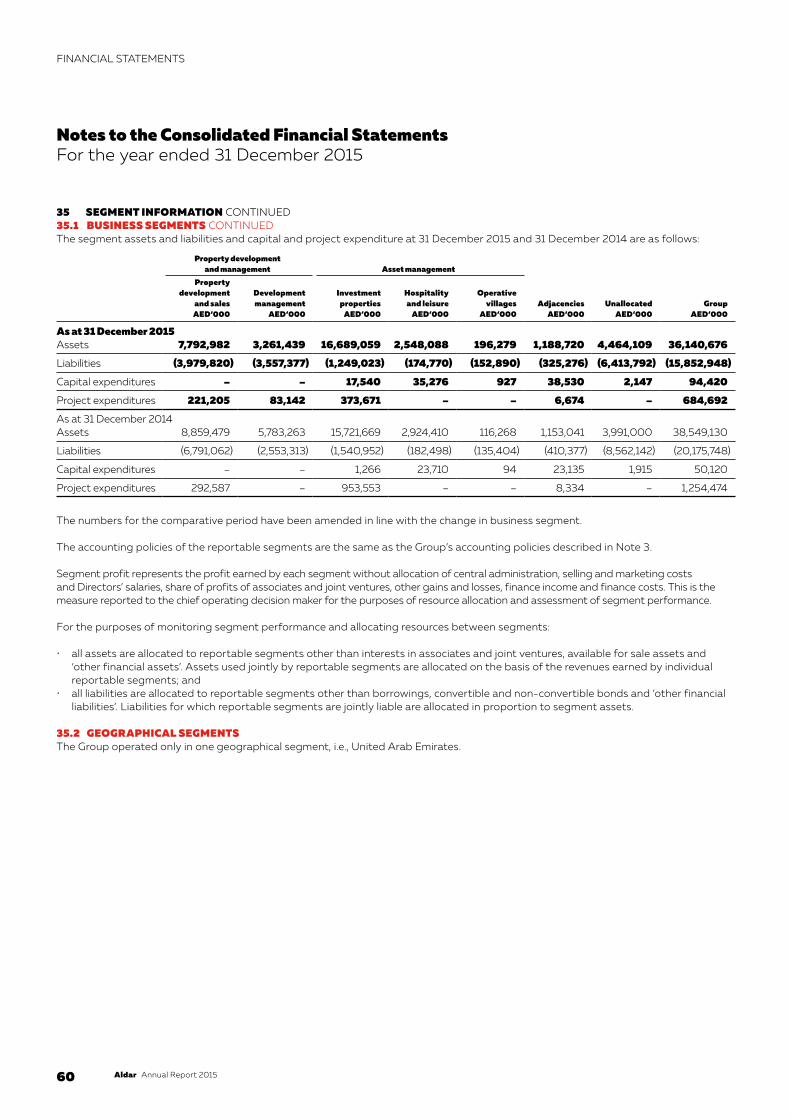
60 Aldar Annual Report 2015
FINANCIAL STATEMENTS
35 SEGMENT INFORMATION CONTINUED35.1 BUSINESS SEGMENTS CONTINUEDThe segment assets and liabilities and capital and project expenditure at 31 December 2015 and 31 December 2014 are as follows:
Property development and management Asset management
AdjacenciesAED‘000
UnallocatedAED‘000
GroupAED‘000
Property development
and salesAED‘000
Developmentmanagement
AED‘000
Investmentproperties
AED‘000
Hospitalityand leisure
AED‘000
Operativevillages
AED‘000
As at 31 December 2015Assets 7,792,982 3,261,439 16,689,059 2,548,088 196,279 1,188,720 4,464,109 36,140,676
Liabilities (3,979,820) (3,557,377) (1,249,023) (174,770) (152,890) (325,276) (6,413,792) (15,852,948)
Capital expenditures – – 17,540 35,276 927 38,530 2,147 94,420
Project expenditures 221,205 83,142 373,671 – – 6,674 – 684,692
As at 31 December 2014 Assets 8,859,479 5,783,263 15,721,669 2,924,410 116,268 1,153,041 3,991,000 38,549,130
Liabilities (6,791,062) (2,553,313) (1,540,952) (182,498) (135,404) (410,377) (8,562,142) (20,175,748)
Capital expenditures – – 1,266 23,710 94 23,135 1,915 50,120
Project expenditures 292,587 – 953,553 – – 8,334 – 1,254,474
The numbers for the comparative period have been amended in line with the change in business segment.
The accounting policies of the reportable segments are the same as the Group’s accounting policies described in Note 3.
Segment profit represents the profit earned by each segment without allocation of central administration, selling and marketing costs and Directors’ salaries, share of profits of associates and joint ventures, other gains and losses, finance income and finance costs. This is the measure reported to the chief operating decision maker for the purposes of resource allocation and assessment of segment performance.
For the purposes of monitoring segment performance and allocating resources between segments:
• all assets are allocated to reportable segments other than interests in associates and joint ventures, available for sale assets and ‘other financial assets’. Assets used jointly by reportable segments are allocated on the basis of the revenues earned by individual reportable segments; and
• all liabilities are allocated to reportable segments other than borrowings, convertible and non-convertible bonds and ‘other financial liabilities’. Liabilities for which reportable segments are jointly liable are allocated in proportion to segment assets.
35.2 GEOGRAPHICAL SEGMENTSThe Group operated only in one geographical segment, i.e., United Arab Emirates.
Notes to the Consolidated Financial StatementsFor the year ended 31 December 2015
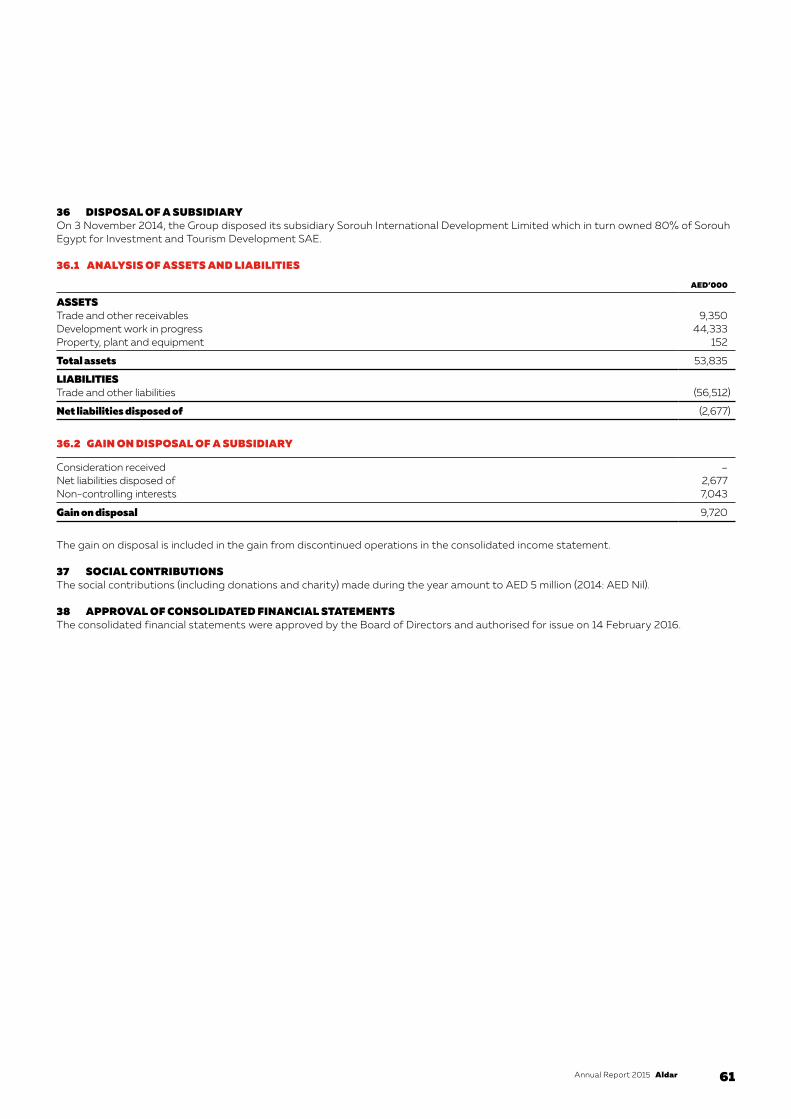
61Aldar Annual Report 2015
36 DISPOSAL OF A SUBSIDIARYOn 3 November 2014, the Group disposed its subsidiary Sorouh International Development Limited which in turn owned 80% of Sorouh Egypt for Investment and Tourism Development SAE.
36.1 ANALYSIS OF ASSETS AND LIABILITIES
AED’000
ASSETSTrade and other receivables 9,350Development work in progress 44,333Property, plant and equipment 152
Total assets 53,835
LIABILITIESTrade and other liabilities (56,512)
Net liabilities disposed of (2,677)
36.2 GAIN ON DISPOSAL OF A SUBSIDIARY
Consideration received –Net liabilities disposed of 2,677Non-controlling interests 7,043
Gain on disposal 9,720
The gain on disposal is included in the gain from discontinued operations in the consolidated income statement.
37 SOCIAL CONTRIBUTIONSThe social contributions (including donations and charity) made during the year amount to AED 5 million (2014: AED Nil).
38 APPROVAL OF CONSOLIDATED FINANCIAL STATEMENTSThe consolidated financial statements were approved by the Board of Directors and authorised for issue on 14 February 2016.
62 Aldar Annual Report 2015
Notes

63Aldar Annual Report 2015

64 Aldar Annual Report 2015
Notes


ALDAR HQAl Raha BeachAbu DhabiTel: +971 2 810 5555
aldar.com
Aldar 20
15 Annual R
eport


