61
2015 Furbearer Program Annual Report MISSOURI DEPARTMENT OF CONSERVATION RESOURCE SCIENCE DIVISION JEFF BERINGER, RESOURCE SCIENTIST EVAN GRUSENMEYER, RESOURCE ASSISTANT

2015 Furbearer Program Annual Report
M I S S O U R I D E P A R T M E N T O F C O N S E R V A T I O N
RESOURCE SCIENCE DIVISION
JEFF BERINGER, RESOURCE SCIENTIST
EVAN GRUSENMEYER, RESOURCE ASSISTANT

P a g e | 1
TA B L E O F C O N T E N T S
INTRODUCTION ....................................................................................................................................................... 2
SECTION 1
FUR HARVEST COMPARISONS ............................................................................................................................. 3
MISSOURI FUR AUCTION PRICES ........................................................................................................................ 4
POPULATION AND HARVEST TRENDS
RACCOON.................................................................................................................................................................. 6
COYOTE ..................................................................................................................................................................... 8
FOX ........................................................................................................................................................................... 10
BOBCAT ................................................................................................................................................................... 13
OTTER ...................................................................................................................................................................... 19
BEAVER AND MUSKRAT ..................................................................................................................................... 25
SECTION 2
CABLE RESTRAINT TRAINING ........................................................................................................................... 26
FURBEARER SIGN STATION SURVEY............................................................................................................... 27
ARCHER’S INDEX TO FURBEARER POPULATION ......................................................................................... 31
BADGERS STATUS IN MISSOURI ....................................................................................................................... 36
MONITORING AND DEMOGRAPHIC ASSESSMENT
OF RIVER OTTERS AND BOBCATS IN MISSOURI ........................................................................................... 40
LARGE CARNIVORE INVENTORY ..................................................................................................................... 43
MOUNTAIN LION RESPONSE TEAM .................................................................................................................. 45
DETERMINING ORIGIN, SEX, GENOTYPE, AND
MOVEMENTS OF MOUNTAIN LIONS IN MISSOURI ....................................................................................... 51
BLACK BEAR DISTRIBUTION AND STATUS .................................................................................................... 53
STATE FURBEARER RECORD ............................................................................................................................. 58
MULTI STATE GRAY FOX GENETICS ................................................................................................................ 59

P a g e | 2
I N T R O D U C T I O N
Missouri’s wild fur market has been monitored annually since 1940, with some information dating back to 1934. Over time,
we’ve seen tremendous fluctuations in the harvest of Missouri’s primary furbearing animals as both market and social trends change.
The Missouri Department of Conservation (MDC) monitors the fur market using mandatory fur dealer transaction records, mandatory
pelt registration of bobcats (since 1980) and river otters (since 1996), and information gathered at fur auctions. The information in
this report is based on harvest from trappers and hunters.
The number of Fur Dealer Permits issued by MDC peaked at 1,192 during the 1945-46 trapping and hunting season. In 2014, MDC
issued 55 Resident and 5 Non-Resident Fur Dealer Permits. The number of Resident Trapping Permits issued peaked at 13,248 in
1980-81 (permits were first required in 1953), and reached a low of 2,050 in 2000. During the 2014-15 trapping season, MDC issued
10,197 Resident and 335 Non-Resident Trapping Permits (Table 1).
Total pelts harvested reached 834,935 in 1940-41 (over 70% were opossum and skunk pelts), and reached the second highest peak in
1979 at 634,338 when average raccoon pelt values were estimated at $27.50. The economic value of harvested fur also peaked in
1979-80 at over $9 million. Pelt values declined dramatically during the late 1980s and through the mid-1990s; as a result the number
of participants fell to all-time lows. Market trends for the 2015-16 season suggest that pelt values for many furbearers are losing
strength as territorial disputes in Russia, tariffs in China, and economic woes in Greece add uncertainly for those working in the fur
industry.
In addition to harvest information, wildlife population trends are monitored using observations collected by bow hunters (archer’s
indices) and MDC staff (sign station surveys). Archer’s indices are based on annual wildlife observation reports sent in by
cooperating bow hunters. Sign station surveys are conducted each September by Conservation Department staff in 25 counties. A
more detailed account of sign station surveys and archer’s indices is described in Section 2.
Also contained in Section 2 are updates and progress summaries for various furbearer-related research projects, monitoring efforts,
and items of interest. Section 2 is for informational purposes and these should be considered preliminary reports. For more
information on any of these reports please contact Jeff Beringer at [email protected].

P a g e | 3
SECTION 1:
Missouri Furbearer Status 2014-2015
F U R H A R V E S T
C O M P A R I S O N S
To buy and sell fur in Missouri (fur dealer) individuals must be issued a commercial permit from the MDC. The permit requirements
include maintaining and submitting records of all fur transactions. Data collected from fur dealers gives MDC an estimate of furbearer
harvest. In addition, harvest numbers for bobcats and otters are gathered from mandatory pelt registration required by the Convention
on International Trade of Endangered Species (CITES).
Strong fur prices in 2013-14 resulted in strong permit sales during 2014-15. Fur prices however, dropped dramatically throughout the
season resulting in reduced harvest of most species. MDC issued over 10,000 trapping permits as trappers anticipated high fur sales.
Muskrats bucked the trend of lower harvest, mostly because prices remained strong until late in the harvest season. Recent survey
data suggest over 13,000 hunters pursued raccoons and over 25,000 hunters pursued coyotes this past year. Forecasts for 2015-16 are
poor as most fur houses have high inventories of all species.
Table 1. Furbearer harvest and pelt prices in Missouri over the last three years.
Species
2014-15 2013-14 2012-13
Number of
pelts sold or
registered*
Pelt Prices
from MTA
Auctions
Number of
pelts sold or
registered*
Pelt Prices
from MTA
Auctions
Number of
pelts sold or
registered*
Pelt Prices
from MTA
Auctions
Raccoon 85,497 $7.75 134,715 $13.04 138,865 $20.79
Opossum 4,874 $1.80 11,529 $1.63 7,733 $1.25
Muskrat 13,227 $5.58 11,445 $9.94 15,699 $11.79
Coyote 5,264 $18.14 7,631 $18.12 7,025 $22.26
Beaver 4,228 $11.11 5,133 $14.86 9,302 $21.72
Mink 475 $11.18 715 (m)$14.81
(f)$12.50 1,254
(m)$26.72
(f)$18.67
Red Fox 1,093 $24.81 1,772 $36.24 1,401 $39.13
Gray Fox 593 $18.47 1,034 $24.01 1,066 $34.72
Striped
Skunk 263 $3.83 402 $2.50 442 $3.25
Badger 37 $32.67 65 $17.50 80 $0.38
Bobcat* 3,223 $60.08 4,310 $120.13 5,059 $115.50
River Otter* 2,154 $34.97 2,584 $60.57 4,201 $85.53
Trapping
permits
issued
10,197 10,681 9,192
* Pelts issued (except bobcat and otter where harvest is based on CITES registration) is based on reports received from 56 Fur Buyer Permittees.

P a g e | 4
M I S S O U R I F U R A U C T I O N
P R I C E S
The Missouri Trappers Association (MTA) held only 1 fur auction in 2014-15. Prices are
averaged from all fur sold, including green, finished and damaged (Table 2). Average
pelt prices were lower by nearly 30% this year for most species (Table 3). Most notably
raccoon prices dropped over 40% from last year and otter prices were off 40%. Bobcats
dropped by 50%.
Table 2. Range of furbearer pelt prices in Missouri during the 2014-15 trapping season.
2014-2015 Auction Summary
Species Total Number of
Pelts Sold 21-Feb
Change in
Price from
2013-14
Raccoon 5,554 $7.75 -40.6%
Opossum 283 $1.80 10.4%
Muskrat 678 $5.58 -43.9%
Coyote 207 $18.14 0.1%
Beaver 290 $11.11 -25.2%
Mink 37 $11.18 -23.9%
Red Fox 108 $24.81 -31.5%
Gray Fox 36 $18.47 -23.1%
Striped Skunk 6 $3.83 53.2%
Badger 2 $32.67 86.7%
Bobcat 159 $60.08 -50.0%
Otter 208 $34.97 -42.3%

P a g e | 5
Table 3. Comparison of average furbearer auction prices over the last five trapping seasons.
Average Price Per Season
Species 2014-15 2013-14 2012-13 2011-12 2010-11 5-year average
Raccoon $7.75 $13.04 $20.79 $10.00 $10.98
Opossum $1.80 $1.63 $1.25 $1.23 $1.70 $1.52
Muskrat $5.58 $9.94 $11.79 $9.49 $6.21 $8.60
Coyote $18.14 $18.12 $22.26 $14.93 $11.04 $16.90
Beaver $11.11 $14.86 $21.72 $13.47 $9.94 $14.22
Mink $11.18 $14.81 $24.05 $18.15 $14.18 $16.55
Red Fox $24.81 $36.24 $39.13 $30.08 $16.78 $29.41
Gray Fox $18.47 $24.01 $34.72 $20.26 $18.02 $23.10
Str. Skunk $3.83 $2.50 $3.25 $1.80 $1.87 $2.65
Badger $32.67 $17.50 $0.38 $15.63 N/A $16.55
Bobcat $60.08 $120.13 $115.5 $77.66 $45.21 $83.72
Otter $34.97 $60.57 $85.53 $87.80 $46.95 $63.14

P a g e | 6
R A C C O O N P O P U L A T I O N
A N D H A R V E S T T R E N D S
Raccoon harvest, including trapping, for the 2014-15 season was 85,497, down 36.53% from the 2013-14 season and down 38.43%
from the 2012-13 season (Figure 1). Trapping pressure was high early in the season but diminished as trappers learned of weak prices
and weather turned poor.
Figure 1. Comparison of raccoon harvest and pelt prices over the last 25 years.
$0
$2
$4
$6
$8
$10
$12
$14
$16
$18
$20
$22
0
25,000
50,000
75,000
100,000
125,000
150,000
175,000
200,000
225,000
1990-9
1
1991-9
2
1992-9
3
1993-9
4
1994-9
5
1995-9
6
1996-9
7
1997-9
8
1998-9
9
1999-0
0
2000-0
1
2001-0
2
2002-0
3
2003-0
4
2004-0
5
2005-0
6
2006-0
7
2007-0
8
2008-0
9
2009-1
0
2010-1
1
2011-1
2
2012-1
3
2013-1
4
2014-1
5
Pelt P
rice
Nu
mb
er
Harv
este
d
SEASON
Raccoon Harvest and Pelt Prices
Harvest Price
P a g e | 7
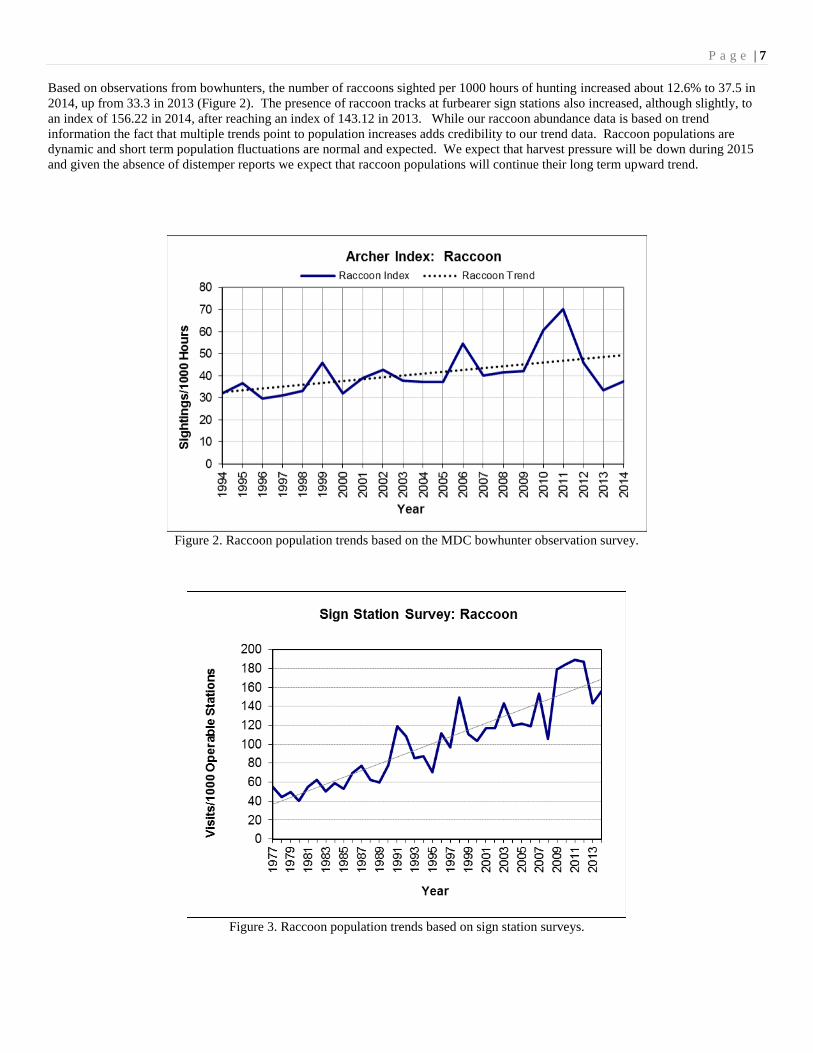
Based on observations from bowhunters, the number of raccoons sighted per 1000 hours of hunting increased about 12.6% to 37.5 in
2014, up from 33.3 in 2013 (Figure 2). The presence of raccoon tracks at furbearer sign stations also increased, although slightly, to
an index of 156.22 in 2014, after reaching an index of 143.12 in 2013. While our raccoon abundance data is based on trend
information the fact that multiple trends point to population increases adds credibility to our trend data. Raccoon populations are
dynamic and short term population fluctuations are normal and expected. We expect that harvest pressure will be down during 2015
and given the absence of distemper reports we expect that raccoon populations will continue their long term upward trend.
Figure 2. Raccoon population trends based on the MDC bowhunter observation survey.
Figure 3. Raccoon population trends based on sign station surveys.

P a g e | 8
C O Y O T E P O P U L A T I O N A N D H A R V E S T
T R E N D S
Coyote harvest during the 2014-15 furbearer season (5,264) was down 31% from the 2013-14 season (Figure 4). Lower coyote
harvests reflect weaker fur prices and challenging trapping conditions during 2014-15. Predator hunting continues to increase in
popularity and survey data suggest over 25,000 people hunt coyotes annually. Although coyote pelt prices averaged only $18.12,
many trappers still enjoy the challenge of catching coyotes. The use of cable restraints has increased coyote harvest for the fur and
live markets. Trend data for coyotes suggest populations are stable but higher than those observed during the mid-1970s (Figures 5
and 6). Mange in both coyotes and red fox is reported each year but major outbreaks have not been confirmed for 2015.
Figure 4. Comparison of coyote harvest and pelt prices over the last 24 years.
$0
$2
$4
$6
$8
$10
$12
$14
$16
$18
$20
$22
$24
0500
1,0001,5002,0002,5003,0003,5004,0004,5005,0005,5006,0006,5007,0007,5008,0008,500
1990-9
1
1991-9
2
1992-9
3
1993-9
4
1994-9
5
1995-9
6
1996-9
7
1997-9
8
1998-9
9
1999-0
0
2000-0
1
2001-0
2
2002-0
3
2003-0
4
2004-0
5
2005-0
6
2006-0
7
2007-0
8
2008-0
9
2009-1
0
2010-1
1
2011-1
2
2012-1
3
2013-1
4
2014-1
5
Pelt P
rice
Nu
mb
er
Harv
este
d
SEASON
Coyote Harvest and Pelt Prices
Harvest Price

P a g e | 9
Figure 5. Coyote population trends based on the MDC bowhunter observation survey.
Figure 6. Coyote population trends based on sign station surveys.

P a g e | 10
F O X P O P U L A T I O N A N D
H A R V E S T T R E N D S
During the 2014-15 season, red fox harvest (1,093) decreased 38.32% and gray fox harvest (593) decreased by 42.65% compared
with last year’s harvest (Figures 7 and 8). Fox harvest is typically a by-product of bobcat or coyote trapper effort. Bobcat fur prices
dropped in 2014-15, and as a result, land trappers were less active. From a long-term perspective, both archer observations and sign
station surveys suggest declines in both red and gray fox populations (Figures 9 and 10). Long-term fox population declines may be
the result of interspecies competition with coyotes and bobcats. Another possible reason for the gray fox decline could be the
increasing population of raccoons and their associated distemper virus; gray fox seem especially vulnerable to distemper virus. We
continue to observe slight upticks in trend indicators for both red and gray fox, especially around suburban areas where foxes may be
seeking refuge from coyotes.
Figure 7. Comparison of red fox harvest and pelt prices over the last 25 years.
$0
$5
$10
$15
$20
$25
$30
$35
$40
$45
0
200
400
600
800
1000
1200
1400
1600
1800
2000
1990-9
1
1991-9
2
1992-9
3
1993-9
4
1994-9
5
1995-9
6
1996-9
7
1997-9
8
1998-9
9
1999-0
0
2000-0
1
2001-0
2
2002-0
3
2003-0
4
2004-0
5
2005-0
6
2006-0
7
2007-0
8
2008-0
9
2009-1
0
2010-1
1
2011-1
2
2012-1
3
2013-1
4
2014-1
5
Pelt P
rice
Nu
mb
er
Harv
este
d
SEASON
Red Fox Harvest and Pelt Prices
Harvest Price

P a g e | 11
Figure 8. Comparison of gray fox harvest and pelt prices over the last 25 years.
Figure 9. Fox population trends based on MDC bowhunter observation survey.
$0
$5
$10
$15
$20
$25
$30
$35
$40
0
200
400
600
800
1000
1200
1400
1600
1800
2000
2200
1990-9
1
1991-9
2
1992-9
3
1993-9
4
1994-9
5
1995-9
6
1996-9
7
1997-9
8
1998-9
9
1999-0
0
2000-0
1
2001-0
2
2002-0
3
2003-0
4
2004-0
5
2005-0
6
2006-0
7
2007-0
8
2008-0
9
2009-1
0
2010-1
1
2011-1
2
2012-1
3
2013-1
4
2014-1
5
Pelt P
rice
Nu
mb
er
Harv
este
d
SEASON
Gray Fox Harvest and Pelt Prices
Harvest Price

P a g e | 12
Figure 10. Fox population trends based on sign station surveys.

P a g e | 13
B O B C A T P O P U L A T I O N A N D
H A R V E S T T R E N D S
Trappers and hunters are required to check or register bobcat carcasses or green pelts at MDC offices or with Conservation Agents.
The data collected are used to monitor bobcat harvest in Missouri and to comply with CITES regulations.
During 2014-15, 3,223 bobcats were harvested, a decrease of 27.41% from 2013-14, and 36.29% below 2012-13 season harvests
(Figure 11). Prices during 2014-15 dropped by 50% and fewer bobcats were harvested. Bobcats have continued to expand across
north Missouri and have now established in all suitable habitats including suburban landscapes.
Figure 11. Bobcat harvest trends over the last 25 years compared to average pelt prices.
The number of bobcat pelts purchased by fur dealers (1,565) was significantly less than the number of bobcats checked by trappers
and hunters as required by CITES (3,223). Instead of selling to fur buyers, trappers can make more money by selling carcasses to
taxidermists or selling mounted bobcats on the internet. The significant drop in pelt sales to fur dealers is likely a reflection of this
trend.
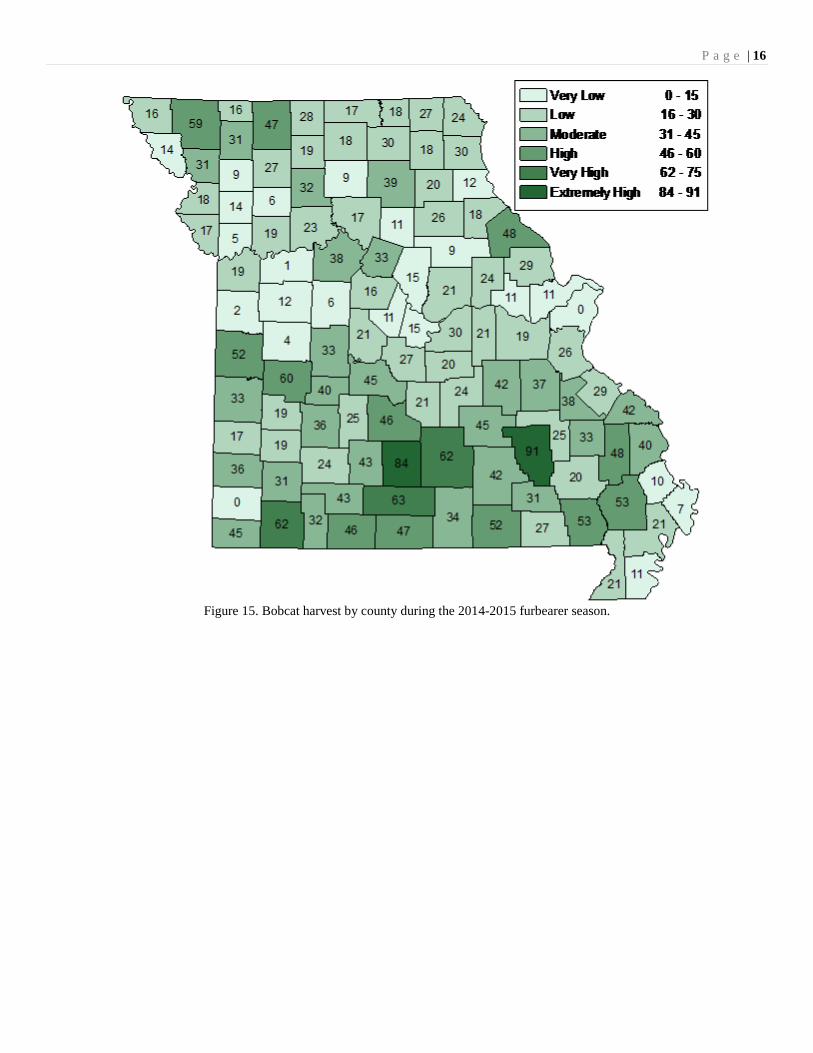
Both sign station and Archer Index data suggest bobcat populations may have dipped some over the last couple years – the overall
trend appears to be stable (Figures 12 and 13). Regional harvest varied and was significantly lower in Western and Northern regions.
Limited habitat during winter likely increases vulnerability of bobcats in these regions. (Table 4, Figure 15). Bobcat harvest
distribution suggests high harvest occurs early in the season, mostly from firearms deer hunters, and trapping harvest is later (Table 5).
Pelts are generally prime after December.
$0
$10
$20
$30
$40
$50
$60
$70
$80
$90
$100
$110
$120
$130
0
1000
2000
3000
4000
5000
6000
1990-9
1
1991-9
2
1992-9
3
1993-9
4
1994-9
5
1995-9
6
1996-9
7
1997-9
8
1998-9
9
1999-0
0
2000-0
1
2001-0
2
2002-0
3
2003-0
4
2004-0
5
2005-0
6
2006-0
7
2007-0
8
2008-0
9
2009-1
0
2010-1
1
2011-1
2
2012-1
3
2013-1
4
2014-1
5
Pelt P
rice
Nu
mb
er
Harv
este
d
SEASON
Bobcat Harvest Based on Mandatory Pelt Registration Compared to Average Pelt Price
Harvest Price

P a g e | 14
Figure 12. Bobcat population trends based on the MDC bowhunter observation survey.
Figure 13. Bobcat population trends based on sign station surveys.

P a g e | 15
Table 4. Bobcat harvest (based on mandatory pelt registration) and pelt prices from 2004 – 2015, in Missouri, by Zoogeographic
region.
Bobcats Harvested per Season
Zoogeographic
Region 2005-06 2006-07 2007-08 2008-09 2009-10 2010-11 2011-12 2012-13 2013-14 2014-15
Northwest Prairie 470 493 358 341 150 342 391 421 260 231
Northern
Riverbreaks 604 636 373 404 192 412 465 473 374 261
Northeast
Riverbreaks 558 678 521 492 379 608 617 644 544 474
Western Prairie 616 763 572 446 235 542 694 807 629 299
Western Ozark
Border 473 431 377 312 223 453 450 560 444 342
Ozark Plateau 852 918 984 868 550 962 1012 1486 1459 1056
North and East
Ozark Border 289 372 316 307 243 369 395 439 429 355
Mississippi
Lowlands 208 158 159 157 154 185 165 208 159 176
Unknown 1 4 46 6 2 0 10 21 12 0
TOTAL 4,061 4,453 3,706 3,333 2,128 3,888 4,199 5,059 4,310 3,223
Bobcat Pelt Prices $44.53 $59.78 $56.93 $23.68 $36.30 $45.21 $77.66 $115.50 $120.13 $60.08
Figure 14. Number of bobcats harvested per individual hunter/trapper.
1 2 3 4 5 6 7 8 9 10 11 12 13 14 16 17 18 19
21
24
0
5
10
15
20
25
30
10
10
23
5
12
7
56
47
17
12 7 7 8 2 1 4 2 3 1 1 1 1 1
Nu
mb
er
of
Bo
bca
ts H
arve
ste
d
Number of Hunters/Trappers
Bobcats Harvested per Hunter/Trapper 2014-15
P a g e | 16
Figure 15. Bobcat harvest by county during the 2014-2015 furbearer season.

P a g e | 17
Figure 16. Comparison of bobcat harvest by Zoogeographic region between the 2013-14 and 2014-15 furbearer seasons.

P a g e | 18
Figure 17. Comparison of hunted vs. trapped bobcats per county in the 2014-2015 season.

P a g e | 19
O T T E R P O P U L A T I O N A N D
H A R V E S T T R E N D S
Trappers are required to check or register river otter carcasses or green hides at MDC offices or with Conservation Agents. The data
collected are used to monitor statewide and regional otter harvest in Missouri and to comply with CITES regulations.
The 2014-15 furbearer season resulted in a harvest of 2,154 animals. This is down 19.33% from last year, and down 48.7% from the
2012-2013 season. Otter pelt prices declined 42.3% from last year. High harvest during the previous two furbearer seasons and lower
pelt prices are likely the reasons for decreased harvest in the 2014-15 season (Figure 18). Overall statewide otter numbers are down.
Harvest data for otter and bobcat are available as a result of CITES tagging. Both species have a relatively long harvest season (Table
5).
Figure 18. Otter harvest and pelt prices from 1990 – 2015.
$0
$20
$40
$60
$80
$100
$120
0
500
1,000
1,500
2,000
2,500
3,000
3,500
4,000
4,500
19
96-9
7
19
97-9
8
19
98-9
9
19
99-0
0
20
00-0
1
20
01-0
2
20
02-0
3
20
03-0
4
20
04-0
5
20
05-0
6
20
06-0
7
20
07-0
8
20
08-0
9
20
09-1
0
20
10-1
1
20
11-1
2
20
12-1
3
20
13-1
4
20
14-1
5
Pe
lt Pric
e
Nu
mb
er
Ha
rve
ste
d
SEASON
Otter Harvest Based on Mandatory Pelt Registration Compared to Average Pelt Price
Harvest Price

P a g e | 20
Table 5. Bobcat and otter harvest during each week of the 2014-15 season.
Although most otter harvest occurs during December and January (Table 5), a longer season does facilitate targeted harvests. From a
county basis, otter harvest was highest in Chariton, St Clair and Lincoln counties with harvests of 77, 53 and 50, respectively (Figure
19). Other high harvest counties were in the south-east and north-central regions of Missouri.
Week of
Season Dates
Number of Bobcats
Harvested
Number of Otters
Harvested
--- Before Nov. 15 6 9
1 Nov.15 – 16 121 18
2 Nov. 17 – 23 257 135
3 Nov. 24 – Nov. 30 249 198
4 Dec. 1 – 7 299 277
5 Dec. 8 – 14 232 199
6 Dec. 15 – 21 304 262
7 Dec. 22 – 28 334 225
8 Dec. 29 – Jan 4 346 177
9 Jan. 5 –11 289 121
10 Jan. 12 – 18 291 112
11 Jan. 19 – 25 268 130
12 Jan. 26 – Feb 1 163 105
13 Feb 2 – 8 ---season closed--- 81
14 Feb. 9 – 15 ---season closed--- 58
--- Feb 16 – 20 ---season closed--- 24
--- Unknown date 64 23
TOTAL 3,223 2,154

P a g e | 21
Figure 19. The number of otters harvested by county during the 2014-15 season.

P a g e | 22
Figure 20. Comparison of otters trapped in ponds vs. streams.

P a g e | 23
Otter harvest during the 2014-15 season was highest in the Missouri River, Grand River, Upper Mississippi River and Gasconade
River watersheds (Figure 21, Table 6). Over 20% (413) of total otters harvested were in these three watersheds. Other watersheds
with high harvest included the Salt River, Black River and Chariton River.
Figure 21. Otter harvest distribution among watersheds during the 2014-15 trapping season.

P a g e | 24
Table 6. Otter harvest distribution among watersheds during the 2014-15 trapping season.
WatershedNumber
Harvested
Percent of
Harvest Watershed
Number
Harvested
Percent of
Harvest
Big Piney River 16 0.74%
Mississippi R. (upper) 87 4.04%
Big River 8 0.37% Missouri River 132 6.13%
Black River 67 3.11% Moreau River 8 0.37%
Blackwater River 9 0.42%
N. Fork White River 32 1.49%
Bourbeuse River 17 0.79%
Niangua River 57 2.65%
Chariton River 64 2.97%
Nodaway River 6 0.28%
Cuivre River 24 1.11%
North River 6 0.28%
Current River 39 1.81%
Osage River East 27 1.25%
Eleven Point River 27 1.25%
Osage River West 20 0.93%
Elk River 12 0.56%
Platte River 26 1.21%
Fabius River 39 1.81%
Pomme de Terre River 27 1.25%
Fox River 5 0.23%
S. Grand River 3 0.14%
Gasconade River 84 3.90%
Sac River 28 1.30%
Grand River 110 5.11%
Salt River 80 3.71%
Headwater Diversion 25 1.16%
Spring River 15 0.70%
Jacks Fork River 4 0.19%
St. Francis River 62 2.88%
James River 38 1.76%
Thompson River 21 0.97%
Lamine River 6 0.28%
White River 26 1.21%
Locust Creek 31 1.44%
Wyaconda River 3 0.14%
Meramec River 45 2.09%
Unknown 789 36.63%
Mississippi R. (lower) 29 1.35%
TOTAL HARVEST 2154 100%
Figure 22. Number of otters harvested per trapper.
1 2 3 4 5 6 7 8 9 10 11 12 13 14 15 17
19 20 21 23
27 31
0
5
10
15
20
25
30
35
34
5
15
8
79
48
32
15
15
11
10
10 3 5 2 1 4 3 1 1 1 3 1 1Nu
mb
er
of
Ott
ers
Har
vest
ed
Number of Trappers
Otters Harvested per Trapper 2014-15

P a g e | 25
B E A V E R A N D M U S K R A T H A R V E S T
T R E N D S
Harvest rates for beaver and muskrat continue to fluctuate in somewhat predictable ranges. Since 1990 muskrat harvests have varied
from about 5,000 – 20,000 and beaver from 2,000 – 10,000. Historically, muskrat numbers have fluctuated widely however habitat
degradation has limited populations. Beavers are a longer- lived species and are less vulnerable to predators; harvest rates are more
likely related to pelt values. Last year trappers harvested 13,227 muskrats and 4,228 beaver.
Figure 23. Number of muskrats harvested in the last 50 years.
Figure 24. Number of beavers harvested in the last 50 years.

P a g e | 26
SECTION 2:
Project Updates and Summaries
After studying reports about the safe and efficient use of cable restraints to capture coyotes and foxes, the Missouri Trappers
Association (MTA) and the Missouri Department of Conservation (MDC) entered into a cooperative agreement to provide resident
trappers in Missouri with training to learn the best methods for using cable restraints on land for appropriate furbearers. When used
properly, cable restraints hold captured animals without mortalities and with few significant injuries.
Using cable restraints is a highly regulated activity as are all trapping methods. Anyone who traps must follow strict rules established
and enforced by the Missouri Department of Conservation. Trappers may use cable restraints after completing a certified cable
restraint training course. Check the MDC website for full regulations on the use of cable restraints in Missouri. There have been over
5,692 trappers certified to use cable restraints since 2004 (Figure 25).
Figure 25. Number of trappers certified by year
C a b l e R e s t r a i n t s i n M i s s o u r i

P a g e | 27
F U R B E A R E R S I G N S T A T I O N
S U R V E Y
Background
The furbearer sign station survey occurs annually in September.
The survey dates back to 1977 and gathers furbearer population
trend information across the state. Currently there are twenty-
five routes, each in a different county. Routes have five
segments with 10 sign stations each, for a total of 50 sign
stations per route. Sign stations consist of 36-inch diameter
circles of sifted soil, set up at 0.3 miles intervals along gravel
roads. Scent discs infused with fatty acid scent serve as
attractants and are placed in the center of each station. Stations
are set up in a day and checked the next day for presence of
animal tracks.
Only operable stations are included in the index calculations.
Observers identify any tracks within the station but do not count
the number of animals visiting a station.
Results
In 2014, all 25 routes (Figure 26) were completed with a total of 1165 operable stations out of a possible 1250. A breakdown of
operable stations by Zoological region is shown in Table 7. Inoperable stations were due to tire tracks and road graders.
Table 7. Summary of operable and inoperable sign stations in 2014 by Zoological region.
Zooregion Number of
routes completed
Number of
operable stations
Number of
inoperable
stations
Northwest Prairie 2 91 9
Northern Riverbreaks 3 139 11
Northeast Riverbreaks 4 178 22
Western Prairie 3 144 6
Western Ozark Border 3 144 6
Ozark Plateau 6 289 11
North & East Ozark Border 3 138 12
Mississippi Lowlands 1 42 8
TOTAL 25 1165 85

P a g e | 28
Figure 26. Map of Missouri showing counties with sign station routes within their respective Zoological region.

P a g e | 29
The most common species to visit sign stations include raccoon, deer, coyote and opossum (Figure 27). Less common visitors include
fox, mink and weasel.
Figure 27. Number of stations visited by mammal species (including non-furbearers) out of 1165 operable stations in 2014 survey.
Figures 28 through 31 indicate furbearer population trends based on Furbearer Sign Station Surveys conducted from 1977-2014.
Overall, trends indicate that most furbearer species have steady to slightly increasing populations. We have observed a slight
downward trend for red and gray fox populations, which is also reflected in bowhunter observations and harvest records.
Figure 28. Raccoon and opossum population trends based on annual furbearer sign station survey.

P a g e | 30
Figure 29. Bobcat and coyote population trends based on annual furbearer sign station survey.
Figure 30. Skunk population trend based on annual furbearer sign station survey.
Figure 31. Red and gray fox population trends based on annual furbearer sign station survey.

P a g e | 31
A R C H E R ’ S I N D E X
T O F U R B E A R E R
P O P U L A T I O N S
MONITORING FURBEARER TRENDS USING DATA
GATHERED FROM COOPERATOR BOWHUNTERS
Introduction
The MDC has conducted annual surveys of wildlife populations via the bowhunters observation survey for 32 consecutive years
(1983-2014). Each fall, several thousand archery deer and turkey hunters keep daily observation records for furbearers, other small
game animals, deer and turkeys. Archers volunteer through post-season surveys, articles in the Missouri Conservationist magazine,
and during sign-ups at bowhunter club meetings and other outdoor events. Archery hunters are asked to record the number of hours
hunted, during both morning and evening hunts, and to use a standardized daily diary to record hours and sightings of wildlife. MDC
uses the number of sightings of each species divided by the total number of hours hunted statewide to calculate a sighting index which
is expressed as sightings per 1,000 hunter hours.
Wildlife population indices calculated from archer’s diaries are useful trend indicators for terrestrial wildlife such as, coyotes,
raccoons, foxes, bobcats, squirrels, white-tailed deer, and turkeys. Hunters are well distributed statewide, with volunteers in 113 of
the 114 counties during most years. Bowhunters averaged 53,503 hours in the stand over the last 32 years, and ranged from 30,990 in
1985 to 84,497 in 1988 (Table 8).
Table 8. Hunter hours and furbearer population indices based on archer’s diaries, 1983-2014.
Years Hunter
Hours Coyote Red Fox Gray Fox Bobcat Raccoon Opossum
Striped
Skunk Mink Beaver Muskrat Weasel Badger Otter
Black
Bear
1983 55,374 20.0 6.5 5.1 1.7 23.8 12.6 5.0 0.7 0.3 0.5 0.1 0.1 0.0 0.0
1984 32,746 18.8 6.8 3.1 1.2 16.9 6.4 3.5 0.3 0.3 0.1 0.0 0.1 0.0 0.0
1985 30,990 20.1 5.3 2.8 1.5 15.4 8.6 4.2 0.5 0.4 0.4 0.1 0.1 0.1 0.0
1986 51,727 23.5 5.7 2.8 1.5 15.3 6.9 3.5 0.3 0.4 0.0 0.0 0.0 0.0 0.0
1987 57,457 23.5 4.5 2.5 2.0 23.3 10.1 3.0 0.3 0.7 0.2 0.1 0.1 0.1 0.0
1988 84,497 22.4 4.7 2.4 1.7 16.7 4.8 2.7 0.3 0.6 0.1 0.0 0.1 0.1 0.0
1989 72,992 21.1 5.1 2.4 1.8 19.6 5.6 3.5 0.1 0.6 0.1 0.0 0.2 0.1 0.0
1990 72,227 23.6 4.9 2.3 2.9 24.0 7.2 3.5 0.2 0.4 0.1 0.0 0.1 0.1 0.0
1991 64,434 26.1 4.7 3.0 3.3 30.5 11.7 4.0 0.3 0.3 0.1 0.0 0.1 0.0 0.1
1992 64,452 22.5 4.7 2.3 2.9 24.3 8.9 2.8 0.6 0.7 0.1 0.0 0.1 0.3 0.0
1993 53,857 19.7 4.2 2.1 3.2 28.1 7.7 3.7 0.2 0.5 0.2 0.0 0.1 0.3 0.0
1994 49,102 21.0 5.1 2.0 3.4 32.0 7.6 3.2 0.1 0.5 0.2 0.0 0.2 0.2 0.0
1995 66,106 22.3 4.6 2.1 3.8 36.5 9.6 3.6 0.1 0.3 0.1 0.0 0.1 0.3 0.1
1996 60,077 19.6 4.5 1.8 4.1 29.7 6.6 2.7 0.0 0.3 0.0 0.0 0.1 0.5 0.0
1997 47,816 18.0 4.0 2.0 4.5 31.2 7.4 2.7 0.1 0.4 0.0 0.0 0.1 0.6 0.0
1998 43,152 20.8 4.1 2.4 4.4 33.0 10.6 4.2 0.1 0.3 0.1 0.0 0.2 0.3 0.1

P a g e | 32
Line graph representations of archer indices for several furbearer species are shown in Figure 32. Based on these indices, long term
raccoon, bobcat and opossum observations suggest population increases. Striped skunk and coyote populations are relatively steady,
while observations suggest a downward trend for red and gray fox populations. Wildlife population indices are also depicted by
county (Table 9).
Figure 32. Population trends of some furbearing species based on archer observations.
Years Hunter
Hours Coyote
Red
Fox
Gray
Fox Bobcat Raccoon Opossum
Striped
Skunk Mink Beaver Muskrat Weasel Badger Otter
Black
Bear
1999 44,012 29.2 3.7 2.2 4.8 45.9 12.5 4.0 0.2 0.3 0.1 0.0 0.1 0.5 0.0
2000 50,795 20.0 3.7 2.0 4.9 32.1 8.1 3.3 0.0 0.2 0.0 0.0 0.1 0.3 0.0
2001 47,023 19.5 3.6 2.1 5.2 38.7 8.2 4.7 0.1 0.4 0.0 0.0 0.1 0.3 0.0
2002 42,826 24.6 3.8 1.5 7.9 42.6 14.4 5.6 0.3 0.1 0.0 0.0 0.1 0.8 0.1
2003 39,964 20.5 2.7 1.5 6.0 37.9 7.2 3.2 0.1 0.1 0.0 0.0 0.2 0.6 0.0
2004 35,071 17.6 2.8 1.1 4.7 37.3 7.9 2.6 0.1 0.1 0.1 0.0 0.1 1.2 0.0
2005 68,440 21.2 2.8 1.3 5.6 37.3 8.5 2.5 0.1 0.3 0.0 0.0 0.1 0.5 0.0
2006 60,040 22.2 3.2 1.3 6.9 54.4 14.4 3.8 0.3 0.2 0.0 0.0 0.1 0.5 0.0
2007 50,390 19.8 3.0 1.5 5.2 40.0 9.4 4.0 0.0 0.1 0.0 0.0 0.1 0.4 0.0
2008 44,471 16.3 2.6 1.2 5.0 41.5 7.8 3.7 0.1 0.1 0.1 0.0 0.4 0.3 0.0
2009 44,919 20.6 2.6 1.2 4.9 42.0 12.4 4.4 0.1 0.1 0.1 0.0 0.2 1.2 0.1
2010 42,907 27.1 2.1 1.0 5.9 60.6 12.9 3.1 0.2 0.1 0.0 0.0 0.2 0.7 0.0
2011 41,370 26.1 2.7 1.1 6.6 70.1 16.6 4.6 0.2 0.1 0.1 0.0 0.2 0.9 0.1
2012 63,621 24.4 3.6 1.4 5.3 45.8 7.1 5.6 0.1 0.1 0.0 0.0 0.3 1.1 0.0
2013 68,674 16.2 2.1 1.4 4.0 33.3 5.7 2.9 0.1 0.2 0.1 0.0 0.1 0.6 0.1
2014 60,560 20.3 2.5 1.3 3.4 37.5 5.8 2.8 0.0 0.1 0.0 0.0 0.3 0.3 0.1

P a g e | 33
Figure 32 (continued). Population trends of some furbearing species based on archer indices.
Table 9. County wildlife Indices for 2014 based on sightings by cooperating archery hunters (sightings/1,000 hours)
County Coyote Deer Turkey Raccoon Opossum Red
Fox
Gray
Fox Bobcat Badger Bear
Adair 16 1184 434 33 3 0 0 0 0 0
Andrew 32 698 375 100 9 2 0 0 0 0
Atchison 68 458 0 102 0 0 0 0 17 0
Audrain 31 996 71 66 5 0 5 0 0 0
Barry 2 414 103 16 5 2 0 10 0 0
Barton 95 1790 677 79 14 0 0 2 0 0
Bates 24 1267 597 48 18 0 0 6 0 0
Benton 9 587 278 6 5 0 0 6 1 0
Bollinger 17 641 329 9 3 2 0 2 0 0
Boone 26 652 234 33 8 3 1 1 0 0
Buchanan 75 698 261 78 10 7 0 3 3 0
Butler 0 614 110 8 4 0 0 0 0 0
Caldwell 9 444 475 37 9 0 0 0 0 0
Callaway 19 813 195 61 22 1 3 3 0 0
Camden 5 826 270 18 3 8 0 2 0 0
Cape
Girardeau 22 589 548 22 6 0 2 7 0 0
Carroll 30 1020 122 66 0 0 0 0 0 0
Carter 12 617 148 0 12 0 0 0 0 0
Cass 21 813 446 31 2 0 0 0 0 0
Cedar 20 1428 970 26 13 0 0 3 0 0
Chariton 59 1336 370 4 2 0 0 4 0 0
Christian 11 484 280 5 0 0 9 2 0 4
Clark 11 1143 335 49 11 4 0 4 0 0
Clay 18 628 178 75 7 2 0 5 0 0
Clinton 34 1561 280 11 0 0 0 0 0 0
Cole 16 663 441 4 3 1 0 0 0 0
Cooper 24 1241 401 103 0 0 0 3 0 0
Crawford 7 463 209 19 5 15 1 4 3 0
Dade 8 950 448 51 10 0 3 5 0 0
Dallas 6 614 968 5 3 6 3 2 0 0

P a g e | 34
County Coyote Deer Turkey Raccoon Opossum Red
Fox
Gray
Fox Bobcat Badger Bear
Davies 36 693 921 341 13 7 0 0 0 0
Dekalb 38 768 622 110 10 5 0 7 0 0
Dent 25 586 565 11 0 14 0 4 0 0
Douglas 25 437 625 14 0 0 0 4 0 0
Dunklin 16 444 16 40 0 0 0 0 0 0
Franklin 21 595 430 21 3 6 1 7 0 0
Gasconade 13 922 564 23 6 0 1 1 0 0
Gentry 31 673 296 10 5 5 0 5 0 0
Greene 13 623 324 22 3 3 1 0 0 0
Grundy 6 1172 229 25 13 0 0 6 0 0
Harrison 47 1169 498 22 3 0 0 16 3 0
Henry 17 840 393 28 5 1 0 6 0 0
Hickory 14 711 465 22 4 2 4 2 0 0
Holt 17 569 429 25 8 0 4 4 0 0
Howard 22 1217 611 56 14 3 1 4 0 0
Howell 85 996 103 31 0 3 0 3 0 3
Iron 65 253 63 0 0 0 0 0 0 0
Jackson 14 701 355 43 6 2 0 2 2 0
Jasper 19 1271 1254 97 19 4 0 4 0 0
Jefferson 13 616 206 16 3 2 0 1 0 0
Johnson 20 698 302 38 4 3 0 4 0 0
Knox 33 1260 398 78 4 0 0 2 0 0
Laclede 0 638 545 0 4 0 4 2 0 0
Lafayette 73 840 355 108 5 0 0 5 0 0
Lawrence 40 479 434 12 23 2 3 7 0 0
Lewis 9 856 247 54 5 2 0 0 0 0
Lincoln 11 644 140 30 3 3 0 0 0 0
Linn 14 1170 198 64 5 19 0 10 0 0
Livingston 22 760 666 9 0 0 0 4 0 0
McDonald 0 583 0 0 0 0 0 0 0 0
Macon 26 680 425 42 6 0 0 3 0 0
Madison 2 384 262 0 0 0 0 4 0 0
Maries 3 393 754 10 6 0 3 0 0 0
Marion 21 1143 525 76 18 3 0 0 0 0
Mercer 31 957 466 36 3 0 0 9 0 0
Miller 10 670 318 56 10 3 0 0 0 0
Mississippi 0 500 56 56 0 0 0 0 0 0
Moniteau 0 624 138 0 0 0 0 9 0 0
Monroe 12 811 659 42 4 0 0 3 0 0
Montgomery 27 775 228 20 11 3 0 2 0 0
Morgan 3 479 180 14 0 0 1 3 0 0
New Madrid 0 0 0 0 0 0 0 0 0 0
Newton 30 898 443 13 3 0 0 1 0 0
Nodaway 72 1023 398 248 10 10 0 2 6 0
Oregon 13 1287 288 13 0 0 0 11 0 0
Osage 47 905 588 38 9 4 0 2 0 0
Ozark 12 503 62 28 1 4 3 11 1 0
Pemiscot 0 0 0 0 0 0 0 0 0 0

P a g e | 35
County Coyote Deer Turkey Raccoon Opossum Red
Fox
Gray
Fox Bobcat Badger Bear
Perry 14 733 385 19 2 0 0 2 0 0
Pettis 19 1119 400 99 6 0 0 3 0 0
Phelps 8 573 519 8 3 4 1 1 0 0
Pike 11 804 308 32 5 2 2 0 0 0
Platte 27 890 421 48 9 6 3 3 0 0
Polk 28 1031 894 84 3 0 3 0 3 0
Pulaski 16 472 159 22 4 4 0 5 0 0
Putnam 6 1462 1164 85 11 0 3 23 0 0
Ralls 39 1321 584 100 11 1 0 4 0 0
Randolph 21 761 459 38 10 14 12 2 0 0
Ray 30 547 484 30 7 0 0 0 0 0
Reynolds 7 501 229 4 0 0 0 9 0 0
Ripley 0 735 340 14 0 0 0 5 0 0
St Charles 13 755 144 16 1 2 23 1 0 0
St Clair 5 630 391 34 10 0 0 4 0 0
St Francois 5 408 153 2 0 9 4 4 0 0
St Genevieve 8 464 373 8 1 0 0 1 0 0
St Louis 12 1092 299 22 5 1 0 5 1 0
Saline 21 1029 464 67 8 0 0 4 0 0
Schuyler 67 1030 218 48 18 6 0 0 0 0
Scotland 13 1268 464 103 0 7 0 2 0 0
Scott 0 485 747 0 0 0 0 20 0 0
Shannon 6 336 291 21 0 0 0 3 0 0
Shelby 37 1146 175 72 7 0 0 0 0 0
Stoddard 4 478 91 13 6 0 2 6 0 0
Stone 17 415 88 17 0 0 0 4 0 0
Sullivan 44 777 490 21 0 2 0 0 0 0
Taney 3 590 228 9 0 6 3 0 0 0
Texas 38 570 465 0 0 0 0 13 0 0
Vernon 30 1311 208 62 21 8 0 9 0 0
Warren 13 672 83 17 2 3 0 5 0 0
Washington 18 350 108 4 4 4 0 14 0 0
Wayne 12 483 90 20 0 0 3 3 0 0
Webster 24 681 633 0 0 15 5 5 0 0
Worth 48 1094 665 163 48 0 12 12 12 0
Wright 64 558 326 10 10 0 0 3 0 0
State-wide
Index 22.1 775.6 369.6 39.6 5.7 2.3 1.1 3.7 0.5 0.1

P a g e | 36
B A D G E R S T A T U S I N
M I S S O U R I
AN EXPLORATORY ASSESSMENT OF BADGER DEMOGRAPHICS
AND CONSERVATION STATUS IN MISSOURI
The badger is uncommon in Missouri and is considered a species of conservation concern. Its official rank is Unrankable (SU),
however, as little data are available to form the basis for a ranking. MDC is collecting badger observations and specimens from across
the state to better understand the demographics and distribution of badgers in Missouri and to provide data from which to refine the
status of badgers in Missouri.
The badger is a harvested species in Missouri, but harvest
numbers have historically been low (generally fewer than 200
per year since the 1960s, and fewer than 100 per year since the
1990s). Arkansas ranks the species as S1 (Critically
Imperiled), Ohio and Indiana as S2 (Imperiled), and Kansas as
S3 (Vulnerable). Iowa ranks the badger as S4 (Apparently
Secure), reflecting their apparent increased abundance in the
grassland and open habitats that dominate the state. This habitat
preference is also seen in Missouri, as the majority of harvested
animals are from the northern portion of the state, and
especially from northwestern Missouri.
Badger habitat has declined substantially in areas converted from grassland to intensive agriculture. Also, colonial rodents such as
prairie dogs and ground squirrels (as in Missouri, where both Franklin’s and thirteen-lined ground squirrels are also species of
conservation concern) have been reduced or eliminated. Assessing the range and demographics of badgers in Missouri is hindered by a
lack of information because 1) harvest data are insufficient to properly assess trends and 2) little baseline data are available on the
biology and demographics of the species. MDC is using verified sightings from the public to define the minimum range of badgers in
Missouri, to make initial and preliminary insights into the demographics of the Missouri population and to better refine the status of
the species in MDC’s heritage database.
P a g e | 37
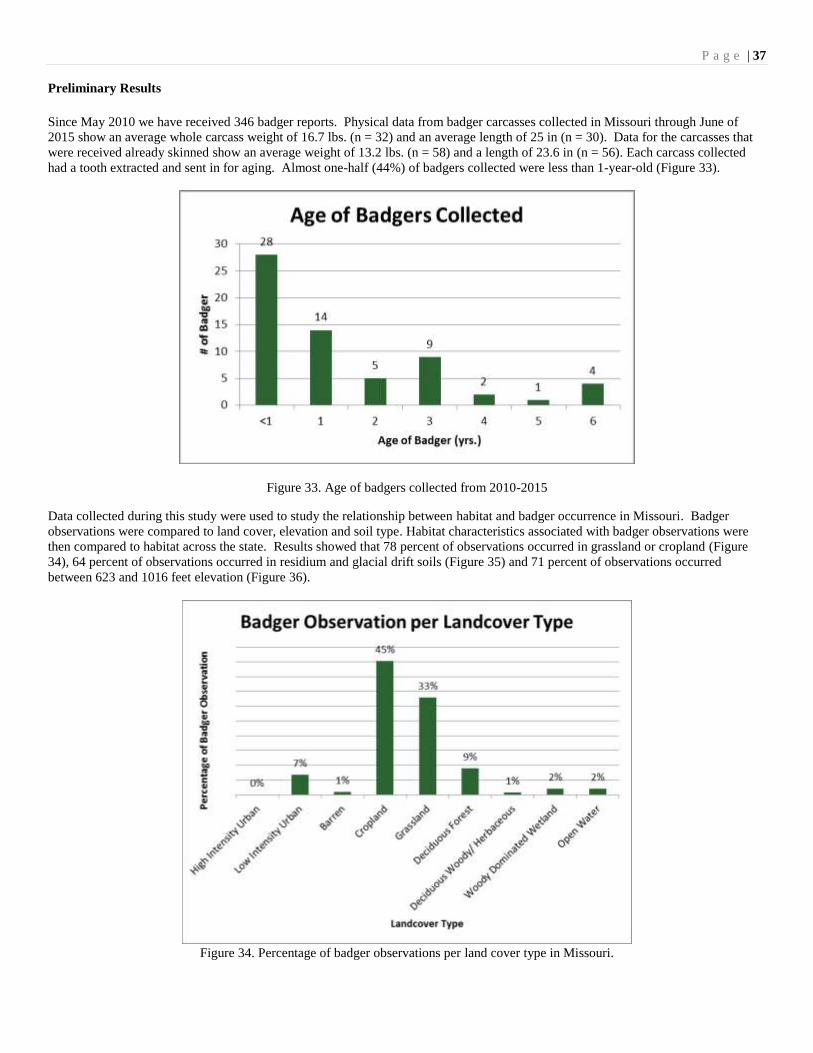
Preliminary Results
Since May 2010 we have received 346 badger reports. Physical data from badger carcasses collected in Missouri through June of
2015 show an average whole carcass weight of 16.7 lbs. (n = 32) and an average length of 25 in (n = 30). Data for the carcasses that
were received already skinned show an average weight of 13.2 lbs. (n = 58) and a length of 23.6 in (n = 56). Each carcass collected
had a tooth extracted and sent in for aging. Almost one-half (44%) of badgers collected were less than 1-year-old (Figure 33).
Figure 33. Age of badgers collected from 2010-2015
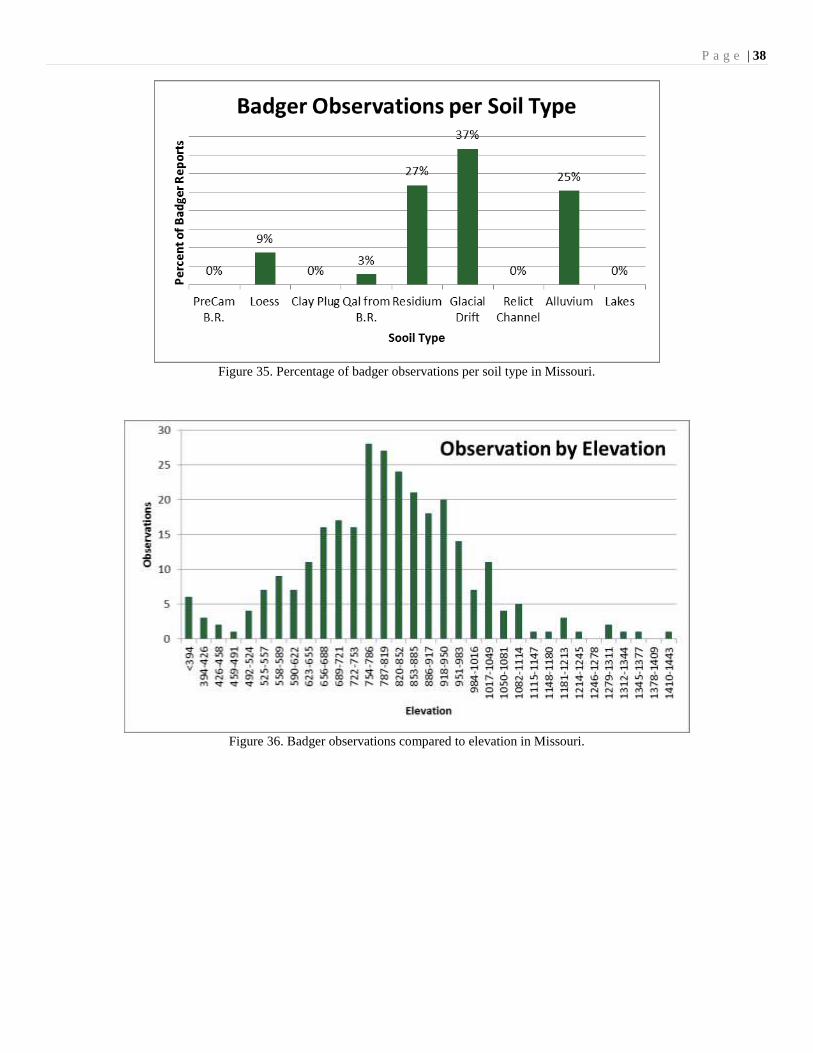
Data collected during this study were used to study the relationship between habitat and badger occurrence in Missouri. Badger
observations were compared to land cover, elevation and soil type. Habitat characteristics associated with badger observations were
then compared to habitat across the state. Results showed that 78 percent of observations occurred in grassland or cropland (Figure
34), 64 percent of observations occurred in residium and glacial drift soils (Figure 35) and 71 percent of observations occurred
between 623 and 1016 feet elevation (Figure 36).
Figure 34. Percentage of badger observations per land cover type in Missouri.
P a g e | 38
Figure 35. Percentage of badger observations per soil type in Missouri.
Figure 36. Badger observations compared to elevation in Missouri.

P a g e | 39
Figure 37. Badger locations based on reported sightings and carcass recoveries from trappers and road killed animals.

P a g e | 40
M O N I T O R I N G A N D
D E M O G R A P H I C
A S S E S S M E N T O F R I V E R
O T T E R S A N D B O B C A T S
I N M I S S O U R I
Currently, Missouri has no harvest level restrictions on river otters or bobcats. Past harvest data suggest these species are not in
danger of being overharvested. However, harvest of these species has been challenged in a number of states. Plaintiffs have alleged
state agencies lacked sufficient data to allow harvest at current levels. Bobcat trapping was recently banned in the state of California
because state agencies were unable to demonstrate that annual bobcat harvests were sustainable. In order to obtain a better idea of the
age and sex characteristics of statewide populations of river otters and bobcats, as well as to legally defend our harvest if needed, the
MDC began a research project to document the sex and age of harvested animals and measure harvest effort by trappers for these
species. These and other data will enable us to generate abundance estimates and measure the impact of harvest and regulations on
otter and bobcat populations.
Statistical Population Reconstruction (SPR) provides a broad scale assessment whereas most other techniques are applicable to only
local areas. Through SPR, the MDC will have a better understanding of the relationship between harvest rates and demographics of
each species. Population reconstruction will also provide the MDC with solid harvest and population data. This format will be the
MDC’s long-term monitoring plan.
Tooth envelopes and survey packets are sent to Missouri trappers at the start of each trapping season. These packets contain a
monthly journal to aid trappers in recording effort or trap-nights per captured animal. Trap-nights per capture will reveal the amount
of trapping pressure these species undergo each year. Trappers are also asked to remove one of the lower canine teeth from each otter
and bobcat they harvest so that we can determine age-at-harvest. This allows us to determine if a population is increasing, decreasing
or stable. The effort survey and teeth are collected when hunters and trappers register their animals with Conservation personnel for
CITES purposes. See figures 38 and 41 for initial age analysis of samples for the 2014-2015 season.
In total, 656 lower canine teeth were collected from both river otters and bobcats with 40 samples being excluded from analysis
because they were cut too short or the wrong tooth was sent in for aging. The samples consisted of 338 river otter and 278 bobcat
teeth.

P a g e | 41
Figure 38. Age of otters sampled 2013-2014.
Figure 39. Age of bobcats sampled 2013-2014.
217
127
47
26 20 16 10 10 3 2 2 1 1 0
50
100
150
200
250
<1 1 2 3 4 5 6 7 8 9 10 11 15
# o
f R
ive
r O
tte
rs
Age of River Otters (Yrs)
Age of Harvested River Otters 2013-2014
69 81
136
55
35
10 5 12
6 5 2 1 1 0
20
40
60
80
100
120
140
160
<1 1 2 3 4 5 6 7 8 9 11 12 13
# o
f B
ob
cats
Age of Bobcats (Yrs)
Age of Harvested Bobcats 2013-2014

P a g e | 42
Figure 40: Age of otters sampled 2014-2015
Figure 41: Age of bobcats sampled 2014-2015

P a g e | 43
LARGE CARNIVORE INVENTORY AND MARKING STUDY:
Background
Dangerous captive animals have recently come under public scrutiny. Because of the inherent danger and potential liability associated
with the possession of large carnivores, an effective system was needed to verify ownership and better monitor the legitimate
purchase, sale and trade of these animals. The Department of Agriculture is currently evaluating regulations for the possession of
dangerous carnivores other than those regulated by MDC. The MDC has taken a proactive approach in response to the public demand
for more accountability and to provide some consistency between us and the Department of Agriculture. The intent of these new
provisions is to better enable our enforcement and record keeping obligations, safeguard permit holders from false claims of
ownership, and satisfy public demand for higher accountability of these potentially dangerous animals. In addition, our Department
will have the ability to distinguish captive animals from truly wild animals.
Based on these issues, MDC made significant regulation changes pertaining to large carnivores owned under the Class II Wildlife
Breeder Permit. The proposal to permanently mark all captive bears, mountain lions, wolves and wolf hybrids was approved by the
Regulations Committee and Conservation Commission in 2007. The regulation became effective March 1st, 2008 under code: 3 CSR
10-9.353 Privileges of Class I and Class II Wildlife Breeders and had a 1 July 2008 compliance date. Effective July 1, 2008, all
mountain lions, black bears, wolves and wolf-hybrids held under the privileges of a Class II Wildlife Breeder Permit were required to
be uniquely identified with a permanent Passive Integrated Transponder (PIT) microchip. These microchips are about the size of a
grain of rice and contain an electromagnetic code that can be used to identify animals. They can be injected under the skin to
permanently mark animals without altering external appearance. Microchips are normally placed just under the skin along the back of
the animal, between the shoulder blades. This standardized protocol allows animals to be searched quickly and efficiently. The
regulation also requires owners to allow the Department to obtain, from each animal, a small blood or tissue sample sufficient for
DNA analysis.
L A R G E C A R N I V O R E INVENTORY

P a g e | 44
Progress to Date
Surveys and interviews were completed for 33 of the then 50 captive
carnivore owners in the state. Feedback from the interviews showed
that a majority of owners are generally supportive of the new
regulations, but have concerns about the welfare of their animals. An
informational workshop was held in Jefferson City on February 9,
2008. The workshop provided a forum for MDC personnel,
veterinarians and captive carnivore owners to discuss the procedures
for marking captive animals. The contract with Wildlife Genetics
International for DNA testing was finalized in May 2008, renewed in
April 2009, 2010, and again in April 2011. DNA samples will be
stored at Resource Science in Columbia until all samples have been
collected and then will be sent to Wildlife Genetics International for
analysis.
Department personnel have assisted in implanting microchips in and
collecting DNA samples from 188 different animals at 46 facilities
around the state. A total of 35 mountain lions, 34 black bears, 53 wolves and 66 wolf hybrids have been tagged. As of June 2015, all
known owners of captive carnivores are in compliance with the regulation.
All permits to hold large carnivores expire June 30th of each year. Renewal letters and applications were sent to all current permit
holders in April and May 2015. If the permits are not renewed by their expiration date, the permit holder is considered to be in
violation of Missouri state code. Permit holders in violation may receive a citation from their local conservation agent if they wish to
continue to hold large carnivores.

P a g e | 45
M O U N T A I N L I O N R E S P O N S E
T E A M
The Missouri Department of Conservation developed a Mountain Lion Response Team (MLRT) in 1996 to address the concerns and
reports from the public regarding mountain lions and the occasional confirmed occurrence of a mountain lion in the state. The MLRT
consists of employees across the state. MLRT members have special qualifications or have received training to address mountain lion
concerns and conduct investigations when evidence is present.
All mountain lion sightings are categorized and entered into a long-term database. The MLRT also keeps track of confirmed cases of
mountain lions in Missouri when there is physical evidence to support a sighting such as a track, carcass, photo, video, etc. The
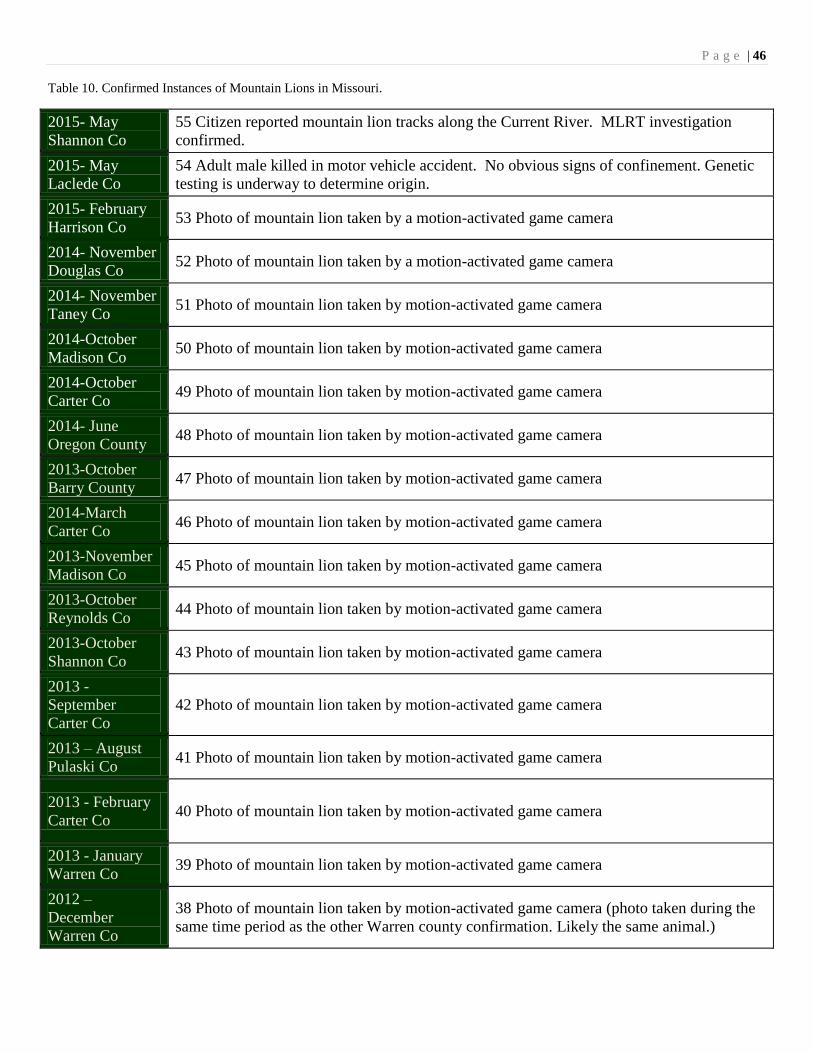
MLRT has logged over 2,000 sightings in the database since 1994. During this time period there have been 55 mountain lion
observations confirmed in the state (Table 10, Figure 42). Mountain lion confirmations continue to increase. Missouri has confirmed
more mountain lion incidents than any other state without a known population. Lion confirmations in Missouri are the result of trail
camera photos (75%), followed by DNA confirmation from hair, carcasses, and tracks. Genetic analysis from killed lions indicated
origins of South Dakota, Montana and Colorado; all DNA-confirmed animals were males. Although the sex and origin from only 4 of
our 55 confirmations has been documented, the information does help explain some of what is likely happening with lions in Missouri
– that being that the majority of confirmed reports result from transient subadult males. Learning the sex and origins of some lions has
enabled MDC to provide the public and media with timely updates about mountain lion occurrences, factual information about
individual animals, and general information about their biology and habits.
There have been 26 sightings in a six- county region including Shannon, Texas, Oregon, Carter, Ripley and Reynolds counties. There
have been 18 sightings confirmed by photos, two by hair samples, and one each of a carcass and a live capture. Six months after the
first sightings, a mountain lion was killed in Texas County that was physically different than the mountain lions that had been
previously caught on game camera. During the summers of 2011 and 2012, multiple Shannon county lion photos and kill sites were
investigated over a course of six months; some of the photos were collected from the same location. During this past year, over 100
reports of mountain lions were recorded in the state. This is a minimum number because many reports to local agency staff are not
recorded. Most reports are the result of the MLRT website reporting form and email account. The MLRT confirmed three mountain
lion sightings this past year; the most interesting result was the confirmation of a 6 year-old male that was roadkilled in Laclede
County. Historically only subadult male lions were documented in Missouri, this animal represents the first known adult male in
recent history in Missouri.
P a g e | 46
Table 10. Confirmed Instances of Mountain Lions in Missouri.
2015- May
Shannon Co
55 Citizen reported mountain lion tracks along the Current River. MLRT investigation
confirmed.
2015- May
Laclede Co
54 Adult male killed in motor vehicle accident. No obvious signs of confinement. Genetic
testing is underway to determine origin.
2015- February
Harrison Co 53 Photo of mountain lion taken by a motion-activated game camera
2014- November
Douglas Co 52 Photo of mountain lion taken by a motion-activated game camera
2014- November
Taney Co 51 Photo of mountain lion taken by motion-activated game camera
2014-October
Madison Co 50 Photo of mountain lion taken by motion-activated game camera
2014-October
Carter Co 49 Photo of mountain lion taken by motion-activated game camera
2014- June
Oregon County 48 Photo of mountain lion taken by motion-activated game camera
2013-October
Barry County 47 Photo of mountain lion taken by motion-activated game camera
2014-March
Carter Co 46 Photo of mountain lion taken by motion-activated game camera
2013-November
Madison Co 45 Photo of mountain lion taken by motion-activated game camera
2013-October
Reynolds Co 44 Photo of mountain lion taken by motion-activated game camera
2013-October
Shannon Co 43 Photo of mountain lion taken by motion-activated game camera
2013 -
September
Carter Co
42 Photo of mountain lion taken by motion-activated game camera
2013 – August
Pulaski Co 41 Photo of mountain lion taken by motion-activated game camera
2013 - February
Carter Co 40 Photo of mountain lion taken by motion-activated game camera
2013 - January
Warren Co 39 Photo of mountain lion taken by motion-activated game camera
2012 –
December
Warren Co
38 Photo of mountain lion taken by motion-activated game camera (photo taken during the
same time period as the other Warren county confirmation. Likely the same animal.)

P a g e | 47
2012 - December
Carter Co 37 Photo of mountain lion taken by motion-activated game camera
2012 - December
DeKalb Co 36 Photo of mountain lion taken by motion-activated game camera
2012 - November
Taney Co 35 Photo of mountain lion taken by motion-activated game camera
2012 - October
Ripley Co 34 Photo of mountain lion taken by motion-activated game camera
2012 - October
Shannon Co 33 Photo of mountain lion taken by motion-activated game camera
2012 -
September
Shannon Co
32 Photo of mountain lion taken by motion-activated game camera
2012 -
September
Grundy Co
31 Photo of mountain lion taken by motion-activated game camera (Photo taken in April,
near to and soon after previous Grundy county confirmation, not submitted until
September.)
2012 - September
Shannon Co 30 Photo of mountain lion taken by motion-activated game camera
2012 - April
Grundy Co 29 Photo of mountain lion taken by motion-activated game camera
2012 - February
Reynolds Co 28 Photo of mountain lion taken by motion-activated game camera
2012 - January
Reynolds Co
27 Citizen captured mountain lion in live trap. Mountain lion was tranquilized, measured,
weighed and released.
2011 -
September
Gasconade Co
26 Citizen reported seeing mountain lion. Hair sample collected. DNA confirmed.
2011 -
September
Carter Co
25 Citizen reported seeing mountain lion. Hair sample collected. DNA confirmed.
2011 -
September
Reynolds Co
24 Photo of mountain lion taken by motion-activated game camera
2011 -
September
Wayne Co
23 MDC employee reported mountain lion tracks in roadway. MLRT investigation
confirmed.
2011 -
September
Shannon Co
22 Photo of mountain lion taken by motion-activated game camera
2011 -
September
Texas Co
21 Sub adult male shot by landowner. No obvious signs of confinement.

P a g e | 48
2011 -
September
Shannon Co
20 Photo of mountain lion taken by motion-activated game camera
2011 - August
Oregon Co 19 Photo of mountain lion hindquarters taken by motion-activated game camera
2011 - August
Shannon Co 18 Photo of probably subadult disperser taken by motion-activated game camera
2011 - April
Macon Co 17 Citizen reported mountain lion tracks in creek bed. MLRT investigation confirmed.
2011 – March
Oregon Co
16 Citizen reported observing a cat jump a fence. DNA analysis of hairs collected at the
scene confirmed species, ancestry analysis underway.
2011 – February
Linn Co 15 Photo of probably subadult disperser taken by motion-activated game camera
2011 – January
Macon Co
14 Subadult male shot by coyote hunters. No obvious signs of confinement. DNA
analysis indicated probable South Dakotan ancestry.
2011 – January
St Louis Co 13 Photo of probable subadult disperser taken by motion-activated game camera.
2010 –
December
Ray Co
12 Subadult male shot by raccoon hunter. No obvious signs of confinement.
DNA analysis indicated probable South Dakotan ancestry.
2010 –
November
Platte Co
11 Photo of probable subadult disperser taken by landowner.
DNA analysis of hairs collected at the scene could not confirm ancestry.
2006 –
December
Livingston Co
10 Photo of probable subadult disperser taken by motion-activated game camera.
2006 –
November
Shannon Co
9 Deer carcass characteristic of mountain lion kill with tracks found nearby.
2003 – August
Callaway Co
8 Approximately 1½-year-old male road kill. No obvious signs of confinement. All four
toes and pad of left forepaw missing but healed over (dewclaw present); cause of injury
unknown, but did not appear to be trap-related. Stomach and intestines contained
remains of squirrel, rabbit, and white-tailed deer. DNA analysis indicated North
American heredity.
2002 – October
Clay Co
7 Two-to-three-year-old male road kill. No obvious signs of confinement. Intestines
contained deer and raccoon hairs, and also man-made fibers. DNA analysis indicated
North American heredity.
2001 –
December
Pulaski Co
6 Photo of probable subadult disperser taken by motion-activated game camera.

P a g e | 49
2000 –
December
Lewis Co
5 Video by deer hunter in a tree stand.
1999 – January
Texas Co
4 Animal treed by rabbit hunters’ dogs. Tracks in snow, and two deer carcasses
characteristic of mountain lion kills found nearby.
1997 – January
Christian Co
3 Video by property owner (obtained through Dr. Lynn Robbins at Missouri State
University in Springfield). Animal’s behavior suggested possible former captive.
1996 –
November
Reynolds Co
2 Night-time video by Conservation Agent of cat on deer carcass.
1994 –
December
Carter Co
1 Small adult female treed and shot (through the eye with a .22) by two raccoon hunters
near Peck Ranch Conservation Area. Carcass was never recovered, but obtained photo of
animal on truck tailgate. Federal authorities fined each hunter $2,000.
In November 1998 a deer hunter found the skinned pelt of a small adult female with head
and feet attached by a remote Texas County road. Pelt showed signs of freezer burn, and X-
ray of skull revealed bullet fragments. Although likely the same animal, it cannot be
confirmed.

P a g e | 50
Figure 42. Confirmed locations and information for mountain lions in Missouri from 1994-2015.

P a g e | 51
D E T E R M I N I N G O R I G I N , S E X ,
G E N O T Y P E , A N D M O V E M E N T S O F
M O U N T A I N L I O N S I N M I S S O U R I
There is mounting evidence that mountain lion populations are in the process of reclaiming former habitats in the Midwest. Given the
numerous lion confirmations in Missouri, especially the southeastern Ozarks, there seems to be an attraction to this area and some
lions appear to be establishing home ranges. In order to continue to learn about and monitor these animals we are using scat detection
dogs to collect genetic materials in areas around confirmed sightings and will opportunistically capture and radio-mark lions with
satellite equipped transmitters. Our investigations will reveal the sex, genotype, and origin of individual lions and reveal whether
lions have established home ranges in the state. The information gained from this study will give us a clearer picture of what is
happening with lions in Missouri. We currently do not know if we have detected one lion multiple times or ten different lions only
once in any given time period. Identifying the sex of individual lions is important because finding a female suggests a strong chance
for reproduction. Radio-marked animals will allow us to examine movement patterns and, over time habitat use, prey selection, and
home range size or dispersal movements. We believe this information will give us a better understanding of the biology and ecology
of lions in Missouri. When we are able to document female lions and/or reproduction lions will no longer be considered extirpated
and we will draft a management plan for lions in a similar process as was conducted for black bears.
Our approach is to search areas around verified lion incidents with the aid of scat detection dogs trained for finding only lion scat.
Dogs and their handler search areas around confirmed sightings. Collected scats are preserved and shipped to the USDA Wildlife
Ecology Research Unit of the Rocky Mountain Research Station. Collected DNA is amplified and species, sex, and genotype are
identified (Table 11). To infer the source of these lions, genotypes will be compared with those in the laboratory’s database. We will
compare lion genetic samples collected in Missouri and those from surrounding states to quantify a minimum number of individual
lions.
Capture and radio marking lions: We will opportunistically attempt to capture lions with walk-in cage traps, covered with
vegetation to offer security and thermal cover; traps checked at 24 hour intervals. Captures sites will be around kill sites and
potentially near locations for which we have confirmed a sighting. In some cases lions may be treed or bayed with trained dogs during
November-March when conditions are suitable for tracking and trailing lions. For animals bayed in trees we will secure a 2.5 m radius
nylon landing net to the base of the tree with the perimeter tied to adjacent trees and positioned >1m above ground to prevent injury to
the animal if it falls. We will climb the tree and attach a rope to the animal’s foot and lower sedated animals to the ground. Captured
lions will be immobilized with concentrations of 200 mg/mL of ketamine hydrochloride and 20 mg/mL of xylazine hydrochloride at
doses of 12 mg/kg of estimated body weight (Ross and Jalkotzy 1992, Logan et al. 1996, Spreadbury et al. 1996). Immobilization
drugs will be administered from 3.0-cc darts fired from a CO2 powered dart gun (Pneu dart, Knoxville, TN). We will monitor vital
rates including temperature, pulse, and visual observation of respiration, pulse, and capillary refill of gums and will remain at the
capture site to monitor animals until they are fully ambulatory following anesthesia.
Processing will consist of morphological measurements, marking animals with numbered identifiable ear-tags. We will collect tissue
and blood samples to assess physical condition, test for disease, and analyze and catalogue DNA profiles. We will determine sex by
examining visible genitalia and age from measurements of gum regression (Laundre et al. 2000). Lions will be assigned to age classes
as kitten (0-12 months), juvenile (13-24 months), and adult (25+ months). All captured animals will be fitted with collars equipped
with Global Positioning System (GPS) and VHF transmitters (VECTRONIC Aerospace, Carl-Scheele-Str. 12 D-12489, Berlin
Germany), weighing <650 gm (< 5% of body weight). Collars will be fitted with cotton spacers designed to break-away from the
animal after approximately one year (Hellgren et al. 1988). Collars are programmed to collect GPS coordinates at 4-hour intervals and
location data will be sent from satellites via email.

P a g e | 52
Table 11. DNA results of scat samples collected in Missouri in 2014.
Sample ID Type Location Date Collected DNA Result Sex Individual Recapture?
MDC-1 Scat Peck Ranch Conservation Area 3/25/2014 coyote
MDC-2 Scat Peck Ranch Conservation Area 3/25/2014 poor DNA
MDC-3 Scat Peck Ranch Conservation Area 3/25/2014 coyote
MDC-4 Scat Peck Ranch Conservation Area 3/25/2014 bobcat
MDC-5 Scat Peck Ranch Conservation Area 3/25/2014 Cougar Male MO-MDC-5 no
MDC-6 Scat Peck Ranch Conservation Area 3/25/2014 coyote
MDC-7 Scat Peck Ranch Conservation Area 3/25/2014 poor DNA
MDC-8 Scat Peck Ranch Conservation Area 3/25/2014 poor DNA
MDC-9 Scat Peck Ranch Conservation Area 3/25/2014 poor DNA
MDC-10 Scat Peck Ranch Conservation Area 3/25/2014 coyote
MDC-11 Scat Peck Ranch Conservation Area 3/25/2014 coyote
MDC-854-1 Scat Peck Ranch Conservation Area 3/25/2014 poor DNA
MDC-854-2 Scat Peck Ranch Conservation Area 3/25/2014 poor DNA
MDC-12 Scat Private Property Near Doniphan 12/2/2014 coyote
MDC-13 Scat Private Property Near Doniphan 12/2/2014 coyote
MDC-14 Scat Private Property Near Doniphan 12/2/2014 Poor DNA
MDC-15 Scat Private Property Near Doniphan 12/2/2014 coyote
MDC-16 Scat Private Property Near Doniphan 12/2/2014 coyote

P a g e | 53
B L A C K B E A R D I S T R I B U T I O N
A N D S T A T U S
Summary
The MDC completed a new management plan for black bears in Missouri in 2008. The plan was drafted and approved by a multi-
agency group of resource professionals from the Missouri Department of Conservation, U.S. Forest Service, National Park Service
and Missouri Department of Natural Resources during summer of 2008 and was signed and approved by MDC administration during
fall of 2008.
Black bear goal/vision statement:
To encourage black bear population expansion within their natural range in Missouri, and to manage black bears consistent with the
available habitat and within the limits of human tolerance.
Black bear program objectives:
Increase knowledge about current black bear
population status in Missouri.
Increase knowledge of black bear ecology in
Missouri, how they move, disperse and travel on
a landscape level and identify source and sink
populations.
Develop black bear conservation and
management strategies based on information
gathered through research, monitoring and
surveys.
Educate Missouri’s public, the media and other
resource professionals in Missouri and the
Midwest about black bears and Missouri’s black
bear management program.
The entire black bear management plan can be viewed at: http://mdc.mo.gov/node/11391
Black bear research – population estimation
American black bears (Ursus americanus) are an important wildlife resource in Missouri, yet little information is known about their
population status. Black bears were believed to be extirpated from Missouri by the early 1900s due to overharvest and deforestation;
however, they have been naturally recolonizing and increasing in abundance in southern areas of the state since the 1960s. Increased
abundance has resulted in more interest in black bears as well as occasional nuisance complaints and safety concerns from the public.
The Missouri Department of Conservation (MDC) is encouraging range expansion of black bears while managing the species
consistent with available habitat and within limits of human tolerance. MDC’s intent is to conduct research that will increase
knowledge of black bear ecology critical for developing conservation and management strategies.
In a recently recovering population of black bears, such as in Missouri, establishing an accurate population estimate is critical for
developing a reliable long-term conservation plan. Our current black bear population estimate is 300 bears in 16 counties in Missouri
(Figure 43).

P a g e | 54
Figure 43. Current Missouri Black Bear range.
Cumulative capture results
Capture efforts to date include 109 individual bears including 64 males and 45 females (Figure 44). Ages at capture, determined from
cementum annulations on upper premolars, ranged from 1 – 19 years (Figure 45). The age distribution of captured bears is not a
reflection of overall ages. During capture sessions we target adult bears; especially adult female bears. Captured bears are weighed,
measured, and fitted with GPS equipped collars (Figure 46).

P a g e | 55
Figure 44. Black bear capture by age class
Figure 45. Ages of black bears captured as part of the Missouri black bear research project
Figure 46. Weights of black bears captured as part of the Missouri black bear research project
3
16
28
63
0 10 20 30 40 50 60 70
Cub
Yearling
Subadult
Adult
Number of Bears
Age
Cla
ss
Black Bear Age Class
3
7
20
13 10 10
5 4 2
0
4 1 0 0 0 0 0 0 0 1
0
5
10
15
20
25
<1 1 2 3 4 5 6 7 8 9 10 11 12 13 14 15 16 17 18 19
# o
f B
ear
s
Age of Bears (Yrs)
Black Bear Ages
301
155 110
6
180 130
85
6 0
50100150200250300350
Adult Subadult Yearling Cub
Be
ar W
eig
ht
(lb
s)
Age Classes
Black Bear Average Weight
Male
Female

P a g e | 56
Black bear range and reporting
Citizen reports of black bear sightings are important for delineating bear range expansion in the state. Reports of bears with cubs help
to define the breeding range of bears in Missouri. Bear sightings are reported to local Conservation staff and through an electronic
reporting system.
Figure 47. Bear sightings from 2009-2015.
P a g e | 57
Black bear research – survival and recruitment
Our initial population research suggested a 2012 statewide estimated population of just under 300 bears. In order to model statewide
bear numbers and estimate population trajectory we began a project to measure reproductive and survival rates of female bears in
Missouri. Our goal is to capture and monitor at least 25 female bears annually for 7 years. This black bear population model will be
used to predict growth and trajectory of our black bear population. Current plans are to initiate a limited harvest once bear numbers
exceed 500 animals. Other research objectives include measuring black bear habitat use and movement patterns, identifying suitable
but unoccupied habitat and to delineate travel corridors that link large tracts of suitable bear habitat in the state. A comprehensive
project summary, data, and movements of marked individuals can be found at
http://mdc4.mdc.mo.gov/applications/BearSleuth/Default.aspx
Other activities
Tick loads: During 2015 we began to measure tick loads and species present on captured bears. Ticks are a probable stressor for bears
and can carry a variety of diseases. Tick numbers on captured bears ranged from 15 to almost 1000. We identified 5 different tick
species. Future efforts will examine seasonal changes, disease occurrence, and the relationship between habitat use by bears and tick
occurrence.
Capture protocols:
Capturing bears during spring and summer requires efforts to ensure animals do not suffer from hyperthermia. We are currently using
data loggers to measure ambient and inside-trap air temperatures for 3 different styles of bear traps. We will use this information to
determine which trap styles are most appropriate under various weather conditions and help with trap check protocols. Our next step
will be to measure inside-trap air temperatures with a simulated bear capture – using a mechanical device that gives off heat at a rate
and level similar to an adult bear. Our preliminary information suggests that the new “box style” trailer traps are most appropriate for
summer time bear captures.
Donuts and other sweet baits are effective for black bear captures but exposure to these human foods could condition bears to human
foods and cause tooth decay. We have developed to methods to limit bears’ exposure to these baits. First we created bait holders
from PVC pipes that are used inside traps to hold sweet baits but limit bears from actually eating the bait. We also experimented with
using shumard oak acorns as bait at trap sites – with some success. We will try hazelnuts next year as these are a more preferred bear
food.
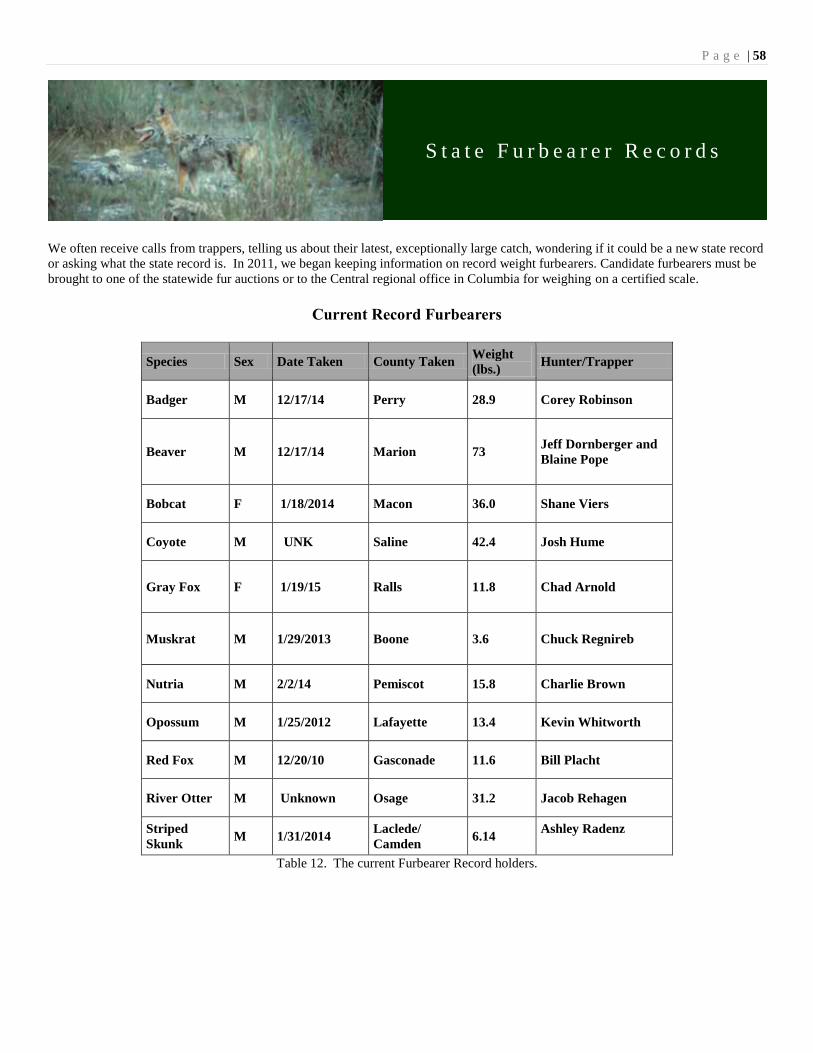
P a g e | 58
S t a t e F u r b e a r e r R e c o r d s
We often receive calls from trappers, telling us about their latest, exceptionally large catch, wondering if it could be a new state record
or asking what the state record is. In 2011, we began keeping information on record weight furbearers. Candidate furbearers must be
brought to one of the statewide fur auctions or to the Central regional office in Columbia for weighing on a certified scale.
Current Record Furbearers
Species Sex Date Taken County Taken Weight
(lbs.) Hunter/Trapper
Badger M 12/17/14 Perry 28.9 Corey Robinson
Beaver M 12/17/14 Marion 73 Jeff Dornberger and
Blaine Pope
Bobcat F 1/18/2014 Macon 36.0 Shane Viers
Coyote M UNK Saline 42.4 Josh Hume
Gray Fox F 1/19/15 Ralls 11.8 Chad Arnold
Muskrat M 1/29/2013 Boone 3.6 Chuck Regnireb
Nutria M 2/2/14 Pemiscot 15.8 Charlie Brown
Opossum M 1/25/2012 Lafayette 13.4 Kevin Whitworth
Red Fox M 12/20/10 Gasconade 11.6 Bill Placht
River Otter M Unknown Osage 31.2 Jacob Rehagen
Striped
Skunk M 1/31/2014
Laclede/
Camden 6.14
Ashley Radenz
Table 12. The current Furbearer Record holders.

P a g e | 59
M U L T I - S T A T E G R A Y F O X
G E N E T I C S
Population genetics of gray fox (Urocyon cinereoargenteus) in
the Midwest, USA M U L T I S T A T E
Background: The gray fox is widespread and relatively abundant
across much of North America and into central and northern South
America. Morphological differences across its range have been
recognized by dividing the species into 16 subspecies, 4 of which
occur in the eastern U.S. (Figure 48). It is legally harvested in most
states. Despite the ecological and economic importance of gray fox,
surprisingly little research has been done on this species, including
genetic analyses. Identifying the locations of genetic boundaries, if
they exist, in gray fox is relevant for the conservation and
management of this species. In particular, a recent petition to list
the prairie gray fox under the Endangered Species Act has
stimulated the USFWS to initiate a status review to determine if
listing is warranted (Department of the Interior 2012). However, it
is uncertain whether the prairie gray fox is actually a genetically
distinct segment of the contiguous gray fox range.
Issues:
It is unclear whether the current subspecies delineations reflect the actual structure of gray fox populations
Recent study across 15 states found little genetic differentiation between the two southeastern subspecies (U. c.
cinereoargenteus and U. c. floridanus).
No genetic data from gray fox in range of U. c. ocythus
Questions:
Is the “prairie gray fox” (U. c. ocythus) genetically unique relative to surrounding populations?
If so, what is its range? Does it match the current subspecies map?
Research Goals:
Sample gray fox across the United States to cover a broad range of habitats and subspecific designations
Sequence the same 411 bp segment of the mtDNA control region to compare results with the eastern samples analyzed in
Bozarth et al. (2011)
Develop nuclear genetic markers
Figure 48. Map of gray fox subspecies ranges.

P a g e | 60
Figure 49. Collected and proposed gray fox samples to determine subspecies via mtDNA sequences.
Preliminary results:
Found 17 distinct mtDNA sequences (“haplotypes”) among the 49 individuals (Figure 50):
10 of these haplotypes are newly discovered
7 were found in eastern gray fox.
Haplotype network shows little geographic structure:
Northeastern US is recent and distinct
Midwestern haplotypes are often the same as, or genetically close to, those found in the eastern U.S.
MO – AR – OK haplotypes can be separated but are not exceedingly different from Eastern
Some haplotypes are shared between multiple sites
There is more unique genetic variation in Midwestern samples as compared to Eastern samples
Figure 50. Genetic divergence in gray fox samples from Eastern states.


