Date post: | 20-Apr-2018 |
Category: |
Documents |
Upload: | phungthien |
View: | 220 times |
Download: | 3 times |
NCARB BY THE NUMBERSInsights on NCARB Data and the Path to Licensure
JUNE 2015
© 2015 NCARB by the Numbers by the National Council of Architectural Registration Boards. All rights reserved. No part of this document may be reproduced, stored in a retrieval system, or transmitted for reproduction without the prior permission of the publisher.
Welcome to the 2015 NCARB by the NumbersThis is the fourth year that the National Council of Architectural Registration Boards (NCARB) has published NCARB by the Numbers, and we are especially excited about this year’s edition. You’ll notice that we have divided our data into special sections—each providing you with a focused view of our findings and insights on the path to licensure.
Also new this year are some baseline comparisons from all 54 U.S. jurisdictions. Each licensing board has its own dashboard of information, providing a 2014 snapshot on the total number of architects, as well as candidate performance metrics for the Intern Development Program (IDP) and the Architect Registration Examination® (ARE®).
Several findings leap off the pages of the 2015 report:• The number of aspiring architects on the path to licensure continues to grow.• Candidates are completing licensure requirements earlier and at a younger age.• Graduates from NAAB-accredited architecture programs have advantages over
their peers from non-accredited programs.• The highest number of women to date are now on the path to licensure.• Tomorrow’s architects will have more racially and ethnically diverse backgrounds.
As you can see, the profile and performance of those entering the architecture profession is changing. Licensing boards have certainly played a significant role in these changes, adopting new rules and laws such as allowing candidates to start the ARE before completing the IDP. Policy changes at NCARB include modifications to the IDP reporting requirement; the elimination of minimum duration experience requirements; simplification of IDP eligibility to a high school diploma; and shortening the ARE retest wait time from six months to 60 days. All of these changes, along with improved communications and customer service, have had a direct impact on behaviors along the path to licensure.
There is much to explore in our latest report. We hope you agree that the 2015 NCARB by the Numbers provides insights on emerging issues to better help the profession guide aspiring architects and practitioners in their careers. We look forward to hearing your thoughts.
Michael J. Armstrong Chief Executive Officer National Council of Architectural Registration Boards
© 2015 NCARB by the Numbers by the National Council of Architectural Registration Boards. All rights reserved. No part of this document may be reproduced, stored in a retrieval system, or transmitted for reproduction without the prior permission of the publisher.
NCARB BY THE NUMBERS • JUNE 2015 2
Join the Conversation on Social Media#NBTN
Table of ContentsWelcome to the 2015 NCARB by the Numbers .......................................................................................................................................................... 2
A Thriving Talent Pool Enters the Profession .......................................................................................................................................................... 4–8
Getting It Done Earlier ................................................................................................................................................................................................................... 9–13
Architecture Profession Experiences a Youth Movement .................................................................................................................... 14–18
Advantage: NAAB-Accredited Programs .................................................................................................................................................................. 19–25
More Women Enter the Profession ............................................................................................................................................................................... 26–31
Profession’s Racial and Ethnic Diversity Gains Ground ............................................................................................................................ 32–34
Inside NCARB ....................................................................................................................................................................................................................................... 35–45
Jurisdictions by the Numbers ............................................................................................................................................................................................ 46–101
About This Report ................................................................................................................................................................................................................................. 102
About NCARB ............................................................................................................................................................................................................................................. 103
Definitions ...................................................................................................................................................................................................................................................... 104
© 2015 NCARB by the Numbers by the National Council of Architectural Registration Boards. All rights reserved. No part of this document may be reproduced, stored in a retrieval system, or transmitted for reproduction without the prior permission of the publisher.
NCARB BY THE NUMBERS • JUNE 2015 3
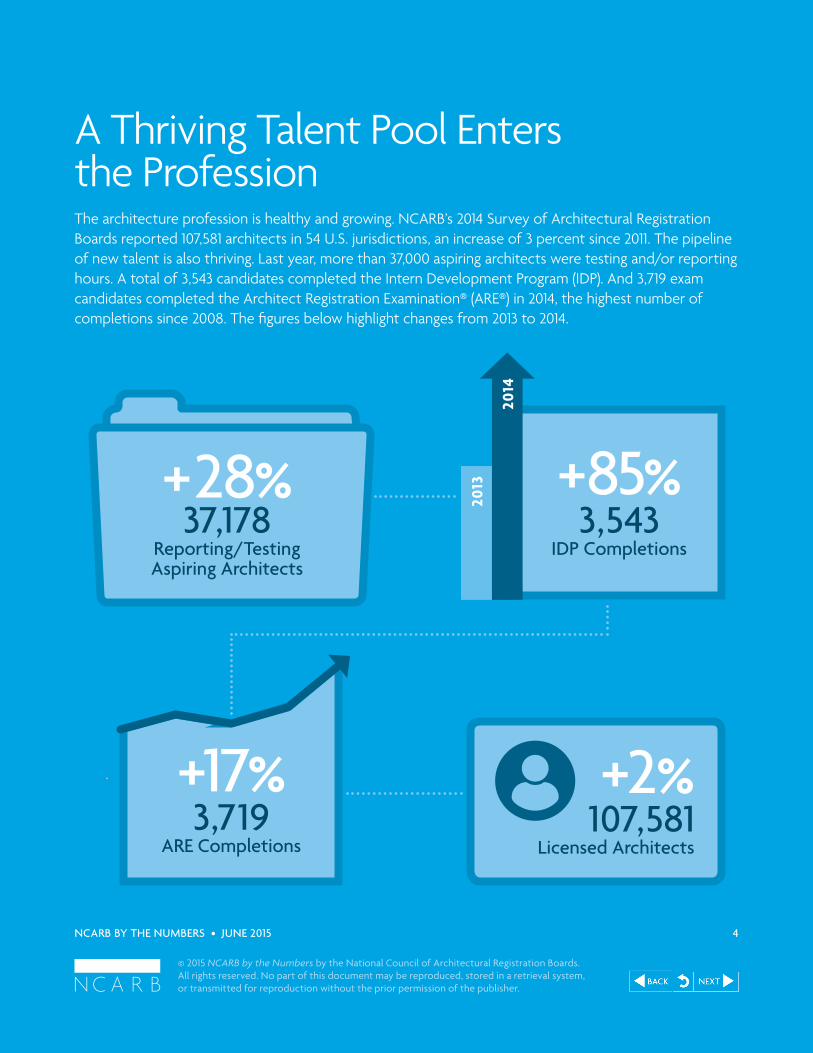
A Thriving Talent Pool Enters the ProfessionThe architecture profession is healthy and growing. NCARB’s 2014 Survey of Architectural Registration Boards reported 107,581 architects in 54 U.S. jurisdictions, an increase of 3 percent since 2011. The pipeline of new talent is also thriving. Last year, more than 37,000 aspiring architects were testing and/or reporting hours. A total of 3,543 candidates completed the Intern Development Program (IDP). And 3,719 exam candidates completed the Architect Registration Examination® (ARE®) in 2014, the highest number of completions since 2008. The figures below highlight changes from 2013 to 2014.
ARE Completions
+17%3,719
2014
2013
IDP Completions
+85%3,543
+2%Licensed Architects
107,581
+28%37,178
Reporting/TestingAspiring Architects
© 2015 NCARB by the Numbers by the National Council of Architectural Registration Boards. All rights reserved. No part of this document may be reproduced, stored in a retrieval system, or transmitted for reproduction without the prior permission of the publisher.
NCARB BY THE NUMBERS • JUNE 2015 4
© 2015 NCARB by the Numbers by the National Council of Architectural Registration Boards. All rights reserved. No part of this document may be reproduced, stored in a retrieval system, or transmitted for reproduction without the prior permission of the publisher.
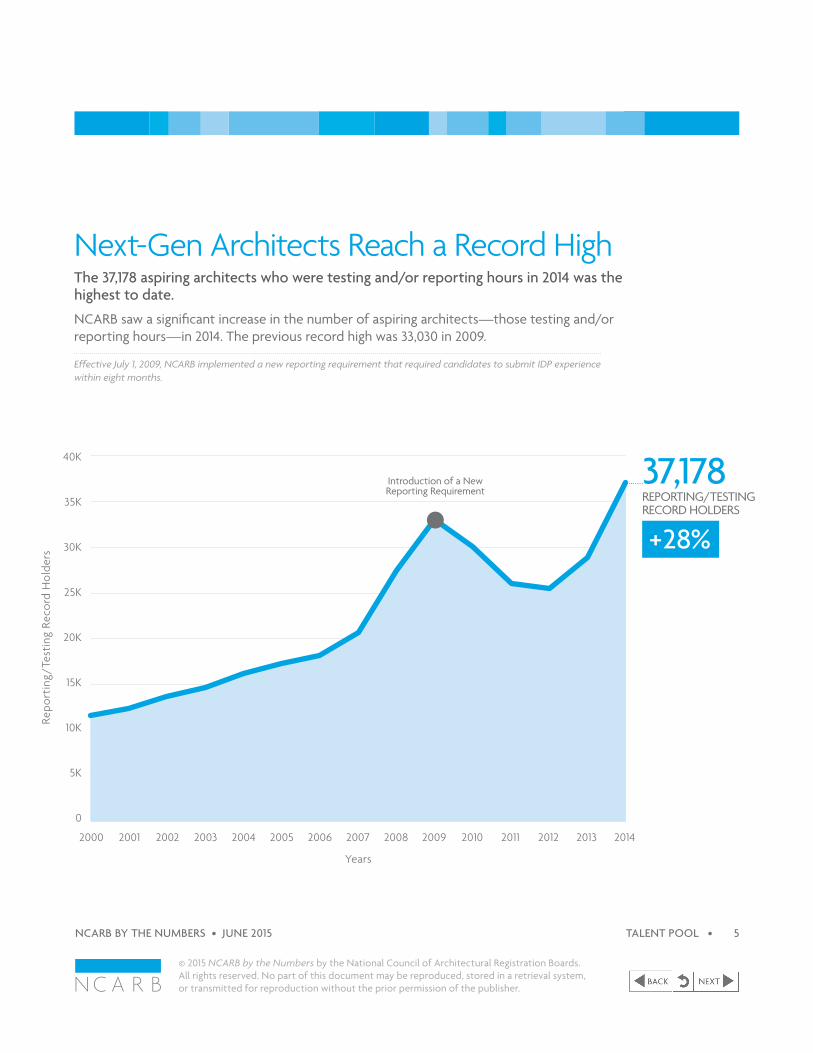
Next-Gen Architects Reach a Record HighThe 37,178 aspiring architects who were testing and/or reporting hours in 2014 was the highest to date.
NCARB saw a significant increase in the number of aspiring architects—those testing and/or reporting hours—in 2014. The previous record high was 33,030 in 2009.
Effective July 1, 2009, NCARB implemented a new reporting requirement that required candidates to submit IDP experience within eight months.
0
5K
10K
20K
15K
30K
25K
40K
35K
2000 2001 2002 2003 2004 2005 2006 2007 2008 2009 2010 2011 2012 2013 2014
Repo
rtin
g/Te
stin
g Re
cord
Hol
ders
37,178REPORTING/TESTING RECORD HOLDERS
+28%
Introduction of a NewReporting Requirement
Years
NCARB BY THE NUMBERS • JUNE 2015 TALENT POOL • 5
© 2015 NCARB by the Numbers by the National Council of Architectural Registration Boards. All rights reserved. No part of this document may be reproduced, stored in a retrieval system, or transmitted for reproduction without the prior permission of the publisher.
IDP Gets Back on TrackThe number of aspiring architects who completed the IDP returned to the all-time average.
The 3,543 aspiring architects who completed the IDP in 2014 represented an 85 percent growth since 2013. Considering the increase in new applicants (see page 36), NCARB expects growth to continue in future years.
Effective July 1, 2009, NCARB implemented a new reporting requirement that required candidates to submit IDP experience within eight months.
2000 2001 2002 2003 2004 2005 2006 2007 2008 2009 2010 2011 2012 2013 2014
0
1K
2K
3K
5K
6K
4K
3,543IDP COMPLETIONS
+85%
IDP
Com
plet
ions
Introduction of a NewReporting Requirement
AVERAGE : 3,478
Years
NCARB BY THE NUMBERS • JUNE 2015 TALENT POOL • 6
© 2015 NCARB by the Numbers by the National Council of Architectural Registration Boards. All rights reserved. No part of this document may be reproduced, stored in a retrieval system, or transmitted for reproduction without the prior permission of the publisher.
ARE Completions Reach Six-Year HighThe number of exam candidates who successfully completed the ARE in 2014 marks the most since 2008.
In 2014, 3,719 candidates completed the ARE, a 17 percent increase since 2013. This is the highest number of ARE completions since 2008, a year that saw a dramatic spike in candidates completing the exam in advance of the transition from ARE 3.1 to ARE 4.0.
2000 2001 2002 2003 2004 2005 2006 2007 2008 2009 2010 2011 2012 2013 2014
0
1K
2K
3K
5K
6K
4K 3,719ARE COMPLETIONS
+17%
ARE
Com
plet
ions
ARE 3.1 to ARE 4.0. Transition
Years
NCARB BY THE NUMBERS • JUNE 2015 TALENT POOL • 7
© 2015 NCARB by the Numbers by the National Council of Architectural Registration Boards. All rights reserved. No part of this document may be reproduced, stored in a retrieval system, or transmitted for reproduction without the prior permission of the publisher.
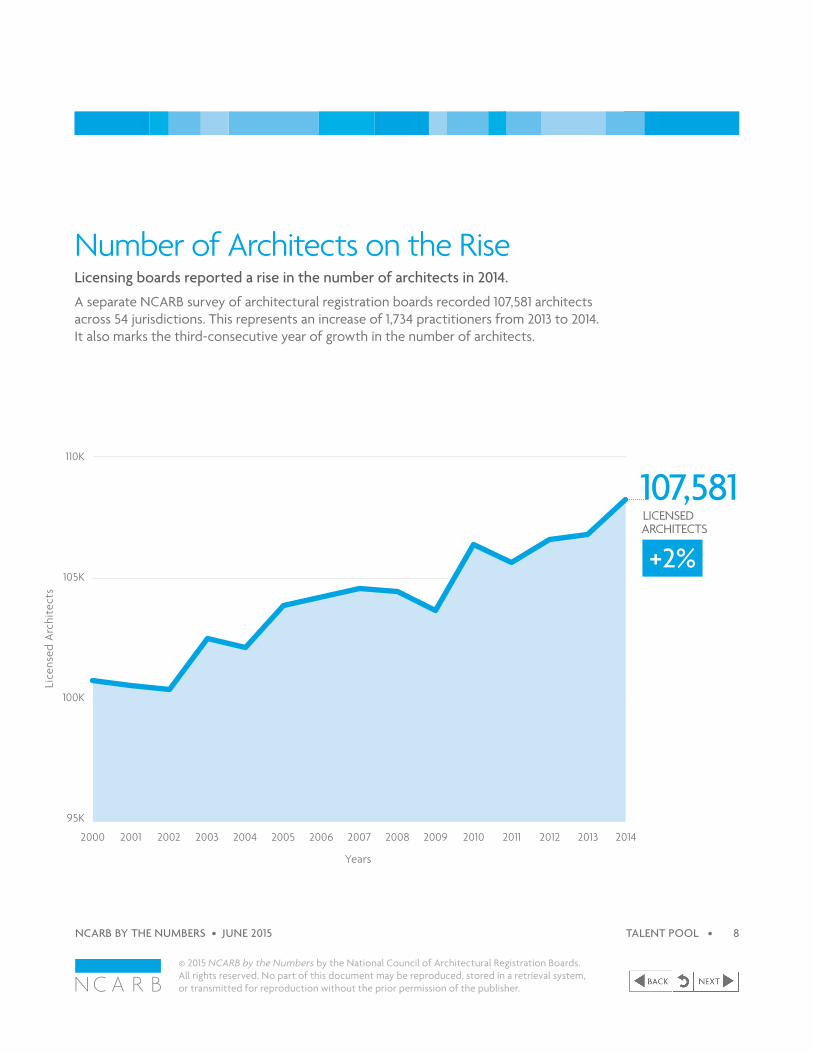
Number of Architects on the RiseLicensing boards reported a rise in the number of architects in 2014.A separate NCARB survey of architectural registration boards recorded 107,581 architects across 54 jurisdictions. This represents an increase of 1,734 practitioners from 2013 to 2014. It also marks the third-consecutive year of growth in the number of architects.
2000 2001 2002 2003 2004 2005 2006 2007 2008 2009 2010 2011 2012 2013 2014
95K
105K
110K
100K
+2%
107,581LICENSED ARCHITECTS
Lice
nsed
Arc
hite
cts
Years
NCARB BY THE NUMBERS • JUNE 2015 TALENT POOL • 8
IDP ARE
42% Of applicants create an account with NCARB before graduation.
52% Of exam candidates take advantage of early eligibility.
EDUCATION IDP ARE
© 2015 NCARB by the Numbers by the National Council of Architectural Registration Boards. All rights reserved. No part of this document may be reproduced, stored in a retrieval system, or transmitted for reproduction without the prior permission of the publisher.
NCARB BY THE NUMBERS • JUNE 2015 9
Getting It Done EarlierNot only are more aspiring architects reaching the goal of licensure, they are doing it sooner. Many start the path prior to graduation. Forty-nine of the 54 U.S. licensing boards now allow exam candidates to test prior to completing IDP requirements (called early eligibility). This increase in flexibility, without reducing rigor, has enabled candidates to more easily fit licensure requirements into their busy academic, professional, and personal lives.
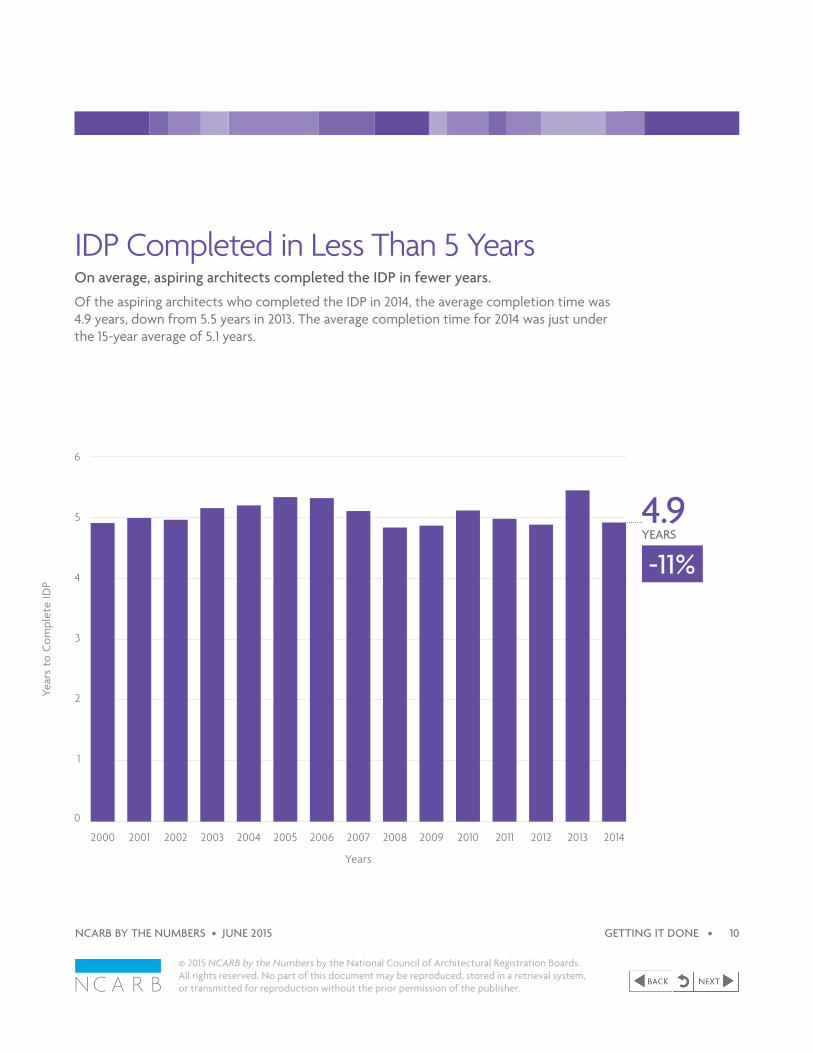
IDP Completed in Less Than 5 YearsOn average, aspiring architects completed the IDP in fewer years.Of the aspiring architects who completed the IDP in 2014, the average completion time was 4.9 years, down from 5.5 years in 2013. The average completion time for 2014 was just under the 15-year average of 5.1 years.
0
1
2
3
5
6
4
4.9 YEARS
-11%
2000 2001 2002 2003 2004 2005 2006 2007 2008 2009 2010 2011 2012 2013 2014
Year
s to
Com
plet
e ID
P
Years
© 2015 NCARB by the Numbers by the National Council of Architectural Registration Boards. All rights reserved. No part of this document may be reproduced, stored in a retrieval system, or transmitted for reproduction without the prior permission of the publisher.
NCARB BY THE NUMBERS • JUNE 2015 GETTING IT DONE • 10
ARE Completion Times ImproveExam candidates, on average, completed the ARE in 2.5 years.The average number of years it took candidates to complete the ARE in 2014 was down 3 percent from 2013.
0
1
3
2
4
5
6
2000 2001 2002 2003 2004 2005 2006 2007 2008 2009 2010 2011 2012 2013 2014
2.5 YEARS
-3%
Year
s to
Com
plet
e A
RE
Years
© 2015 NCARB by the Numbers by the National Council of Architectural Registration Boards. All rights reserved. No part of this document may be reproduced, stored in a retrieval system, or transmitted for reproduction without the prior permission of the publisher.
NCARB BY THE NUMBERS • JUNE 2015 GETTING IT DONE • 11
More Students Start the Path to LicensureThe proportion of student applications was at a record high in 2014.Forty-two percent of new NCARB Record applicants were students, compared to 34 percent in 2013.
0%
50%
25%
75%
100%
2007 2008 2009 2010 2011 2012 2013 2014
42%+8Pe
rcen
t of
New
App
lican
ts
PERCENTAGE POINTS
Years
© 2015 NCARB by the Numbers by the National Council of Architectural Registration Boards. All rights reserved. No part of this document may be reproduced, stored in a retrieval system, or transmitted for reproduction without the prior permission of the publisher.
NCARB BY THE NUMBERS • JUNE 2015 GETTING IT DONE • 12
Rise in Candidates Combining ARE and IDPMore than half of all ARE divisions were taken before the completion of IDP.Of all the divisions taken in 2014, 52 percent were taken prior to the completion of IDP (known as early eligibility). Currently, 49 of 54 jurisdictions allow this overlap.
0%
50%
25%
75%
100%
2007 2008 2009 2010 2011 2012 2013 2014
52%+7
Perc
ent
of D
eliv
ered
Div
isio
ns
PERCENTAGE POINTS
Years
© 2015 NCARB by the Numbers by the National Council of Architectural Registration Boards. All rights reserved. No part of this document may be reproduced, stored in a retrieval system, or transmitted for reproduction without the prior permission of the publisher.
NCARB BY THE NUMBERS • JUNE 2015 GETTING IT DONE • 13
33.3 YEARS
-2.7 YEARS
Average Age at Initial Licensure
Since 2008
© 2015 NCARB by the Numbers by the National Council of Architectural Registration Boards. All rights reserved. No part of this document may be reproduced, stored in a retrieval system, or transmitted for reproduction without the prior permission of the publisher.
NCARB BY THE NUMBERS • JUNE 2015 14
Architecture Profession Experiences a Youth MovementAspiring architects are starting and finishing the path to licensure at a younger age, with many students beginning the process before graduation. As a result, the average age of a newly licensed architect—33.3 in 2014—is at its lowest since 2001. Requirement changes by licensing boards have played a major role in reducing these numbers. Exam candidates in most jurisdictions now have the option to start testing prior to completing IDP experience requirements. The combined result: new architects are entering the profession at a younger age.
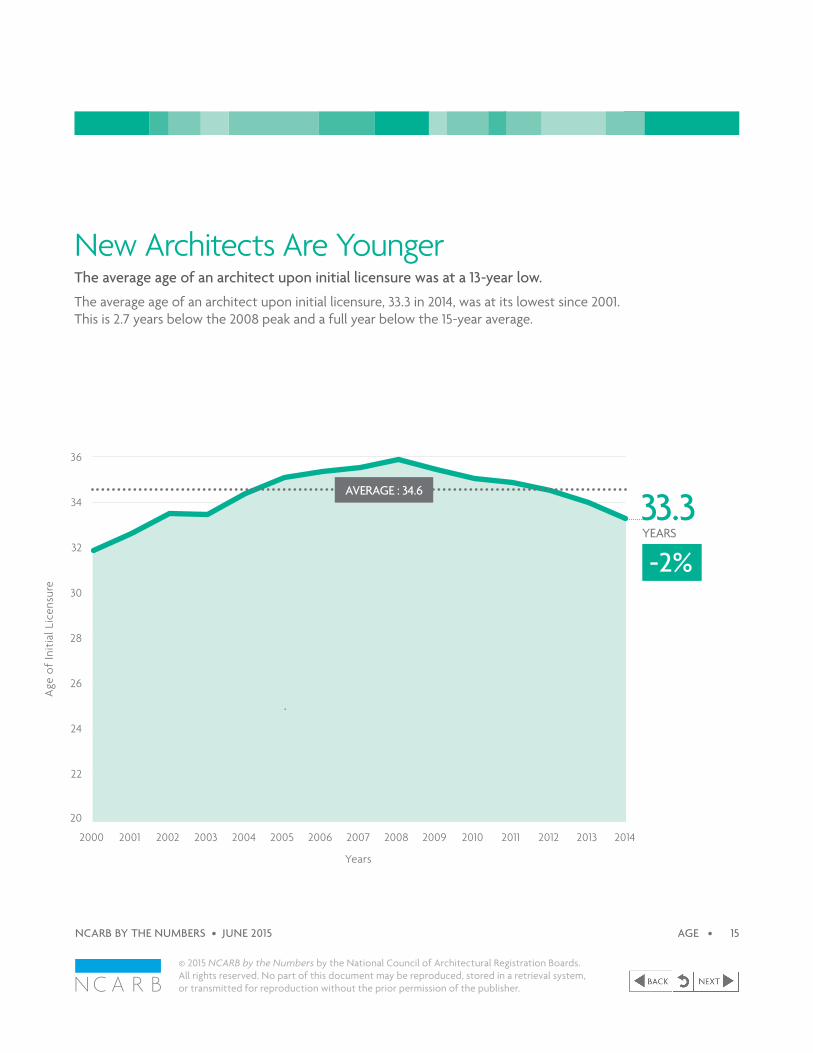
-2%
33.3YEARS
New Architects Are YoungerThe average age of an architect upon initial licensure was at a 13-year low.The average age of an architect upon initial licensure, 33.3 in 2014, was at its lowest since 2001. This is 2.7 years below the 2008 peak and a full year below the 15-year average.
20
24
22
26
28
30
36
32
34
2000 2001 2002 2003 2004 2005 2006 2007 2008 2009 2010 2011 2012 2013 2014
AVERAGE : 34.6
Age
of
Init
ial L
icen
sure
Years
© 2015 NCARB by the Numbers by the National Council of Architectural Registration Boards. All rights reserved. No part of this document may be reproduced, stored in a retrieval system, or transmitted for reproduction without the prior permission of the publisher.
NCARB BY THE NUMBERS • JUNE 2015 AGE • 15
An Earlier StartThe average age of aspiring architects starting the path to licensure remained below the 15-year average.
The average age of an aspiring architect in 2014 was 25.7, slightly up from 2013, but down significantly from 2000.
Effective July 1, 2009, NCARB implemented a new reporting requirement that required candidates to submit IDP experience within eight months.
2000 2001 2002 2003 2004 2005 2006 2007 2008 2009 2010 2011 2012 2013 2014
+1%
20
24
22
26
28
30
36
32
34
25.7YEARS
Introduction of a New Reporting Requirement
AVERAGE : 26.9
Age
of
New
Rec
ord
App
lican
ts
Years
© 2015 NCARB by the Numbers by the National Council of Architectural Registration Boards. All rights reserved. No part of this document may be reproduced, stored in a retrieval system, or transmitted for reproduction without the prior permission of the publisher.
NCARB BY THE NUMBERS • JUNE 2015 AGE • 16
Age at IDP Completion Stays ConsistentThe average age of an aspiring architect completing IDP increased slightly in 2014.The average age for IDP completion was 30.7 in 2014. This is slightly above the 15-year average of 30.3.
20
24
22
26
28
30
36
32
34
2000 2001 2002 2003 2004 2005 2006 2007 2008 2009 2010 2011 2012 2013 2014
+1%
30.7YEARS
Age
of
IDP
Com
plet
ion
Years
© 2015 NCARB by the Numbers by the National Council of Architectural Registration Boards. All rights reserved. No part of this document may be reproduced, stored in a retrieval system, or transmitted for reproduction without the prior permission of the publisher.
NCARB BY THE NUMBERS • JUNE 2015 AGE • 17
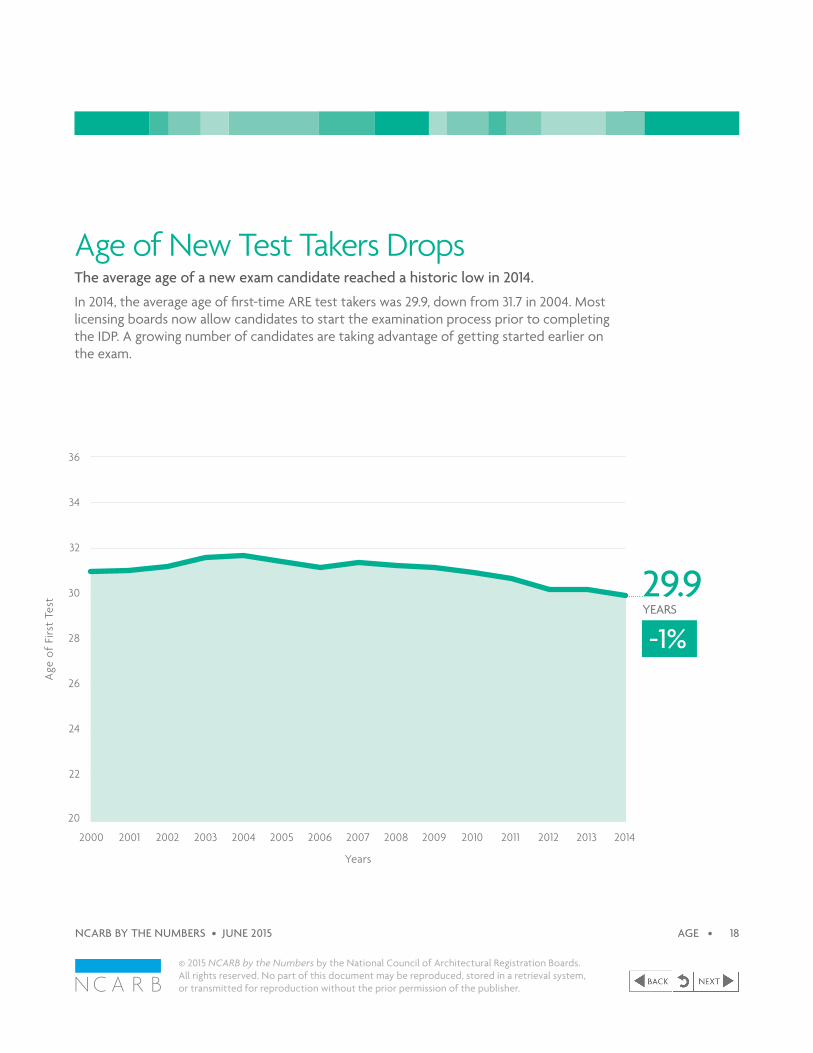
Age of New Test Takers DropsThe average age of a new exam candidate reached a historic low in 2014.In 2014, the average age of first-time ARE test takers was 29.9, down from 31.7 in 2004. Most licensing boards now allow candidates to start the examination process prior to completing the IDP. A growing number of candidates are taking advantage of getting started earlier on the exam.
2000 2001 2002 2003 2004 2005 2006 2007 2008 2009 2010 2011 2012 2013 2014
20
24
22
26
28
30
36
32
34
-1%
29.9YEARS
Age
of
Firs
t Te
st
Years
© 2015 NCARB by the Numbers by the National Council of Architectural Registration Boards. All rights reserved. No part of this document may be reproduced, stored in a retrieval system, or transmitted for reproduction without the prior permission of the publisher.
NCARB BY THE NUMBERS • JUNE 2015 AGE • 18
Advantage: NAAB-Accredited ProgramsEducation, along with experience and examination, is a vital step on the path to licensure. Today, there are more than 150 programs at 123 institutions that are accredited by the National Architectural Accrediting Board (NAAB). NCARB’s 2014 data suggests that graduates from NAAB-accredited programs are better equipped to pursue their architectural aspirations.
69%of New Exam Candidates Have Graduated From a
NAAB-Accredited Program
2.4YEARSTime it Takes Graduates From NAAB-Accredited Programs to Complete
the AREAlmost half a year (0.46%)
sooner than graduates from non-accredited
programs.
Students Enrolled in NAAB-Accredited
Programs*
24,989
69%ARE Success Rate
for Graduates From NAAB-Accredited
ProgramsCompared to 58% of graduates from non-accredited programs.
AC
CR
EDIT
ED
NO
N-A
CC
RED
ITED
*This data is provided to NAAB by accredited programs and was published in the 2014 NAAB Annual
Report, available at www.naab.org.
© 2015 NCARB by the Numbers by the National Council of Architectural Registration Boards. All rights reserved. No part of this document may be reproduced, stored in a retrieval system, or transmitted for reproduction without the prior permission of the publisher.
NCARB BY THE NUMBERS • JUNE 2015 19
0%
50%
25%
75%
100%
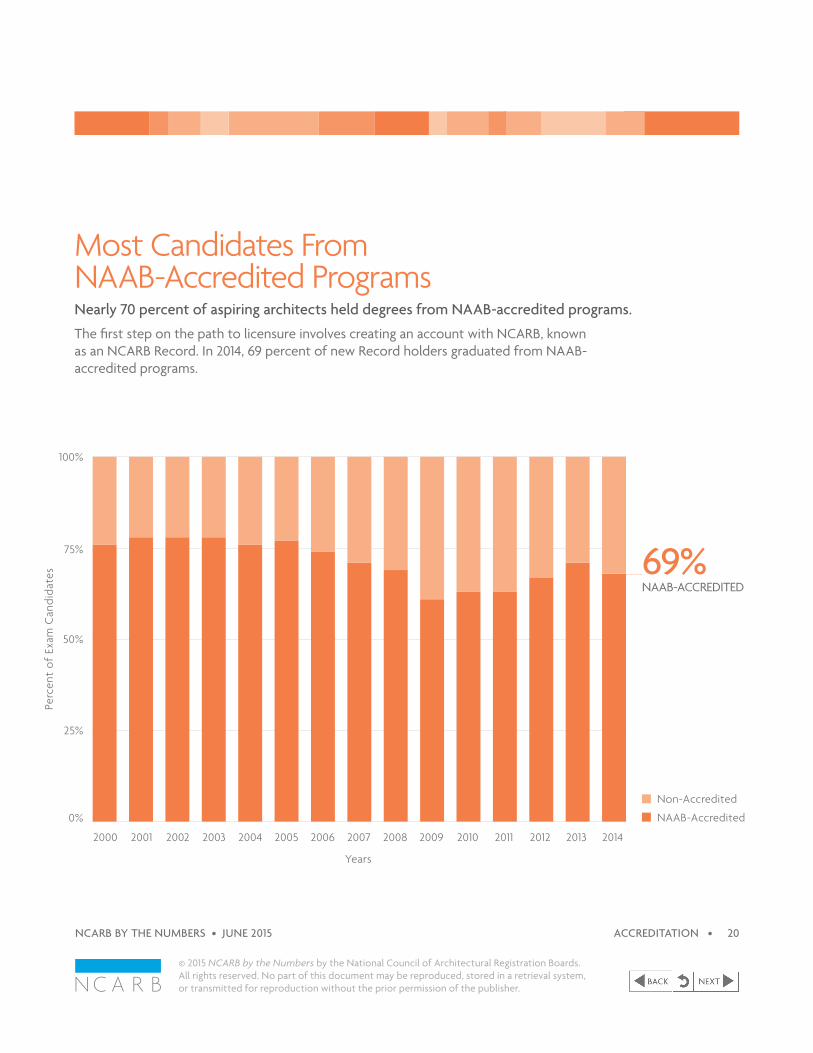
Most Candidates From NAAB-Accredited ProgramsNearly 70 percent of aspiring architects held degrees from NAAB-accredited programs.The first step on the path to licensure involves creating an account with NCARB, known as an NCARB Record. In 2014, 69 percent of new Record holders graduated from NAAB- accredited programs.
Non-Accredited
NAAB-Accredited
2000 2001 2002 2003 2004 2005 2006 2007 2008 2009 2010 2011 2012 2013 2014
69% NAAB-ACCREDITED
Perc
ent
of E
xam
Can
dida
tes
Years
© 2015 NCARB by the Numbers by the National Council of Architectural Registration Boards. All rights reserved. No part of this document may be reproduced, stored in a retrieval system, or transmitted for reproduction without the prior permission of the publisher.
NCARB BY THE NUMBERS • JUNE 2015 ACCREDITATION • 20
Graduates From NAAB-Accredited Programs Have the EdgeExam candidates from NAAB-accredited programs achieved higher overall ARE success rates.
Based on all ARE 4.0 divisions taken in 2014, candidates from NAAB-accredited programs had a 69 percent success rate versus a 58 percent success rate by candidates from non-accredited programs.
69% NAAB-ACCREDITED
58% NON-ACCREDITED
© 2015 NCARB by the Numbers by the National Council of Architectural Registration Boards. All rights reserved. No part of this document may be reproduced, stored in a retrieval system, or transmitted for reproduction without the prior permission of the publisher.
NCARB BY THE NUMBERS • JUNE 2015 ACCREDITATION • 21
0%
50%
25%
75%
100%
Higher ARE Division Pass RatesExam candidates from NAAB-accredited programs outperformed candidates from non-accredited programs across all ARE divisions.
The largest gap in pass rates occurred in Building Systems (BS). Candidates from NAAB-accredited programs had a pass rate of 71 percent compared to 59 percent for candidates from non-accredited programs.
* This data set compares the pass rates of all ARE 4.0 divisions taken from July 2008 through December 2014.
Build
ing D
esign
&
Construc
tion S
ystem
s
Build
ing Sy
stems
Construc
tion
Documen
ts & Se
rvice
s
Progra
mming
Plann
ing & Pr
actic
e
Sche
matic D
esign
Site P
lannin
g & D
esign
Struc
tural
Syste
ms
71%
61%
71%
71%
79%
53%
65%
53%
65%
57%
71%
56%
66%
59%
Non-Accredited
NAAB-Accredited
Pass
Rat
e pe
r D
ivis
ion
© 2015 NCARB by the Numbers by the National Council of Architectural Registration Boards. All rights reserved. No part of this document may be reproduced, stored in a retrieval system, or transmitted for reproduction without the prior permission of the publisher.
NCARB BY THE NUMBERS • JUNE 2015 ACCREDITATION • 22
Faster ARE CompletionExam candidates from NAAB-accredited programs completed the ARE in less time than candidates from non-accredited programs.
Candidates from NAAB-accredited programs have had faster average ARE completion times for 13 of the past 15 years. In 2014, candidates from NAAB-accredited programs completed the ARE in 2.4 years, versus 2.8 years for those from non-accredited programs.
0
1
.5
1.5
3
2
2.5
Non-Accredited
NAAB-Accredited
2.8YEARSNON-ACCREDITED
2.4YEARSNAAB-ACCREDITED
Year
s to
Com
plet
e A
RE
Years
2000 2001 2002 2003 2004 2005 2006 2007 2008 2009 2010 2011 2012 2013 2014
© 2015 NCARB by the Numbers by the National Council of Architectural Registration Boards. All rights reserved. No part of this document may be reproduced, stored in a retrieval system, or transmitted for reproduction without the prior permission of the publisher.
NCARB BY THE NUMBERS • JUNE 2015 ACCREDITATION • 23
Student Enrollment Drops Slightly The number of students enrolled in NAAB-accredited programs dropped slightly over the last two years.
The National Architectural Accrediting Board (NAAB) reported that 24,989 students were enrolled in NAAB-accredited architecture programs during the 2013-2014 school year.
This data is provided to NAAB by accredited programs and was published in various NAAB Annual Reports, available at www.naab.org. NAAB is the sole agency authorized to accredit U.S. professional degree programs in architecture. (Note: This does not include students enrolled in non-accredited architect programs or students who intend to join architect programs after completing other four-year preprofessional degrees.)
2009 2010 2011 2012 2013 2014
0
5K
15K
10K
20K
25K
30K
24,989STUDENTS ENROLLED
-4%
Stud
ents
Enr
olle
d
Years
© 2015 NCARB by the Numbers by the National Council of Architectural Registration Boards. All rights reserved. No part of this document may be reproduced, stored in a retrieval system, or transmitted for reproduction without the prior permission of the publisher.
NCARB BY THE NUMBERS • JUNE 2015 ACCREDITATION • 24
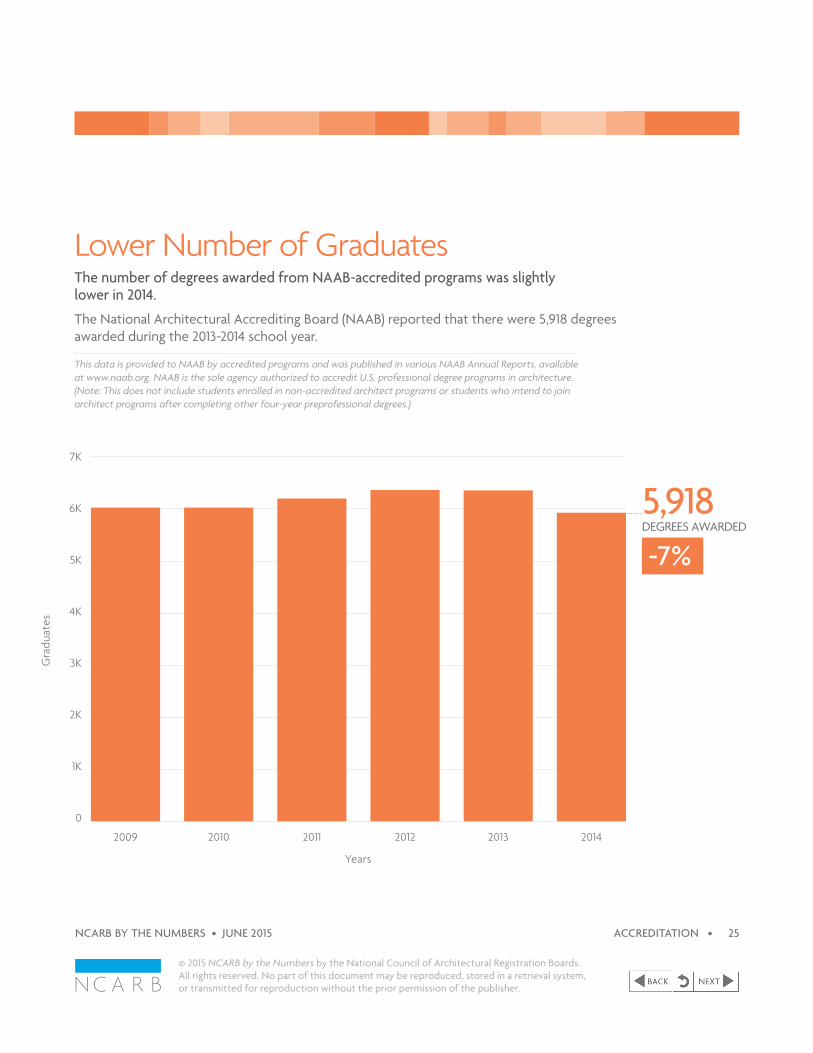
Lower Number of GraduatesThe number of degrees awarded from NAAB-accredited programs was slightly lower in 2014.The National Architectural Accrediting Board (NAAB) reported that there were 5,918 degrees awarded during the 2013-2014 school year.
This data is provided to NAAB by accredited programs and was published in various NAAB Annual Reports, available at www.naab.org. NAAB is the sole agency authorized to accredit U.S. professional degree programs in architecture. (Note: This does not include students enrolled in non-accredited architect programs or students who intend to join architect programs after completing other four-year preprofessional degrees.)
2009 2010 2011 2012 2013 2014
0
2K
1K
3K
4K
5K
6K
7K
5,918 DEGREES AWARDED
-7%
Gra
duat
es
Years
© 2015 NCARB by the Numbers by the National Council of Architectural Registration Boards. All rights reserved. No part of this document may be reproduced, stored in a retrieval system, or transmitted for reproduction without the prior permission of the publisher.
NCARB BY THE NUMBERS • JUNE 2015 ACCREDITATION • 25
© 2015 NCARB by the Numbers by the National Council of Architectural Registration Boards. All rights reserved. No part of this document may be reproduced, stored in a retrieval system, or transmitted for reproduction without the prior permission of the publisher.
NCARB BY THE NUMBERS • JUNE 2015 26
29YEARSAge Women Start the ARE
Compared to 30.5 years for men
24.8YEARSAge Women
Start Licensure ProcessCompared to 26.2 years for men
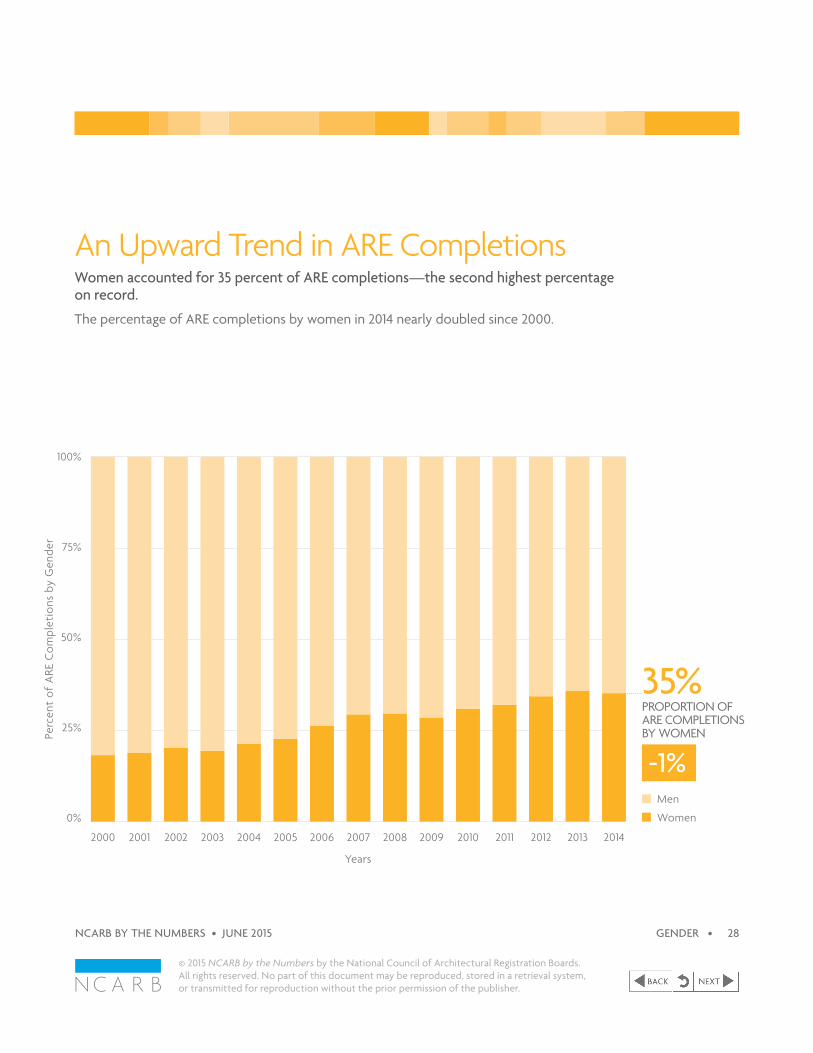
35%Proportion of
ARE Completions by Women
38%Proportion of
IDP Completions by Women
More Women Enter the ProfessionThe pipeline of aspiring architects suggests that women continue to move forward in the profession. Women generally start earlier than men—getting a head start on the IDP and the ARE. And the proportions of IDP and ARE completions by women has steadily grown in the 21st century. Among practitioners, women are still under represented, as indicated by the percentage of women Certificate holders and IDP supervisors. However, this should improve over time given the increasing number of women on the path to licensure.
Gender Balance for IDP ImprovingNearly 40 percent of IDP completions were by women in 2014.Women made up 38 percent of those who completed the IDP in 2014. This was an increase from the 35 percent of IDP completions achieved by women in 2013. The 15-year trend indicates steady, positive growth in the proportion of aspiring women architects. In 2000, less than 25 percent of IDP completions were achieved by women.
0%
25%
75%
50%
100%
38% PROPORTION OF IDP COMPLETIONS BY WOMEN
+3%Men
Women
Perc
ent
of ID
P C
ompl
etio
ns b
y G
ende
r
Years
2000 2001 2002 2003 2004 2005 2006 2007 2008 2009 2010 2011 2012 2013 2014
© 2015 NCARB by the Numbers by the National Council of Architectural Registration Boards. All rights reserved. No part of this document may be reproduced, stored in a retrieval system, or transmitted for reproduction without the prior permission of the publisher.
NCARB BY THE NUMBERS • JUNE 2015 GENDER • 27
An Upward Trend in ARE CompletionsWomen accounted for 35 percent of ARE completions—the second highest percentage on record.
The percentage of ARE completions by women in 2014 nearly doubled since 2000.
0%
25%
75%
50%
100%
35% PROPORTION OF ARE COMPLETIONS BY WOMEN
-1%Men
Women
Perc
ent
of A
RE C
ompl
etio
ns b
y G
ende
r
Years
2000 2001 2002 2003 2004 2005 2006 2007 2008 2009 2010 2011 2012 2013 2014
© 2015 NCARB by the Numbers by the National Council of Architectural Registration Boards. All rights reserved. No part of this document may be reproduced, stored in a retrieval system, or transmitted for reproduction without the prior permission of the publisher.
NCARB BY THE NUMBERS • JUNE 2015 GENDER • 28
Getting a Head StartAspiring women architects started the licensure process earlier than men.The average age of women starting the path to licensure in 2014 was 24.8, more than a year younger than the average age of men. This age disparity has stayed consistent over the last 15 years.
20
22
26
24
28
30
32
2000 2001 2002 2003 2004 2005 2006 2007 2008 2009 2010 2011 2012 2013 2014
Men
Women
0%
24.8AGE WOMEN START LICENSURE PROCESS
Age
of
New
Rec
ord
App
lican
ts b
y G
ende
r
Years
© 2015 NCARB by the Numbers by the National Council of Architectural Registration Boards. All rights reserved. No part of this document may be reproduced, stored in a retrieval system, or transmitted for reproduction without the prior permission of the publisher.
NCARB BY THE NUMBERS • JUNE 2015 GENDER • 29
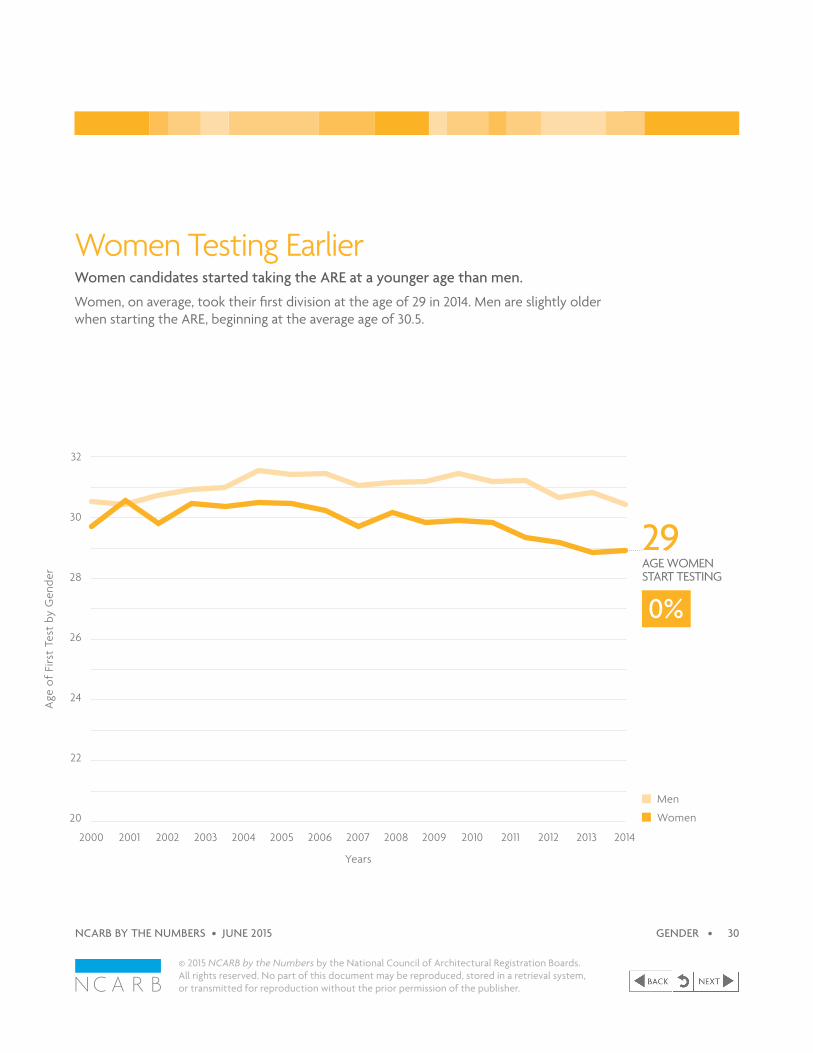
Women Testing EarlierWomen candidates started taking the ARE at a younger age than men.Women, on average, took their first division at the age of 29 in 2014. Men are slightly older when starting the ARE, beginning at the average age of 30.5.
20
22
26
24
28
30
32
29 AGE WOMEN START TESTING
0%
Men
Women
Age
of
Firs
t Te
st b
y G
ende
r
2000 2001 2002 2003 2004 2005 2006 2007 2008 2009 2010 2011 2012 2013 2014
Years
© 2015 NCARB by the Numbers by the National Council of Architectural Registration Boards. All rights reserved. No part of this document may be reproduced, stored in a retrieval system, or transmitted for reproduction without the prior permission of the publisher.
NCARB BY THE NUMBERS • JUNE 2015 GENDER • 30
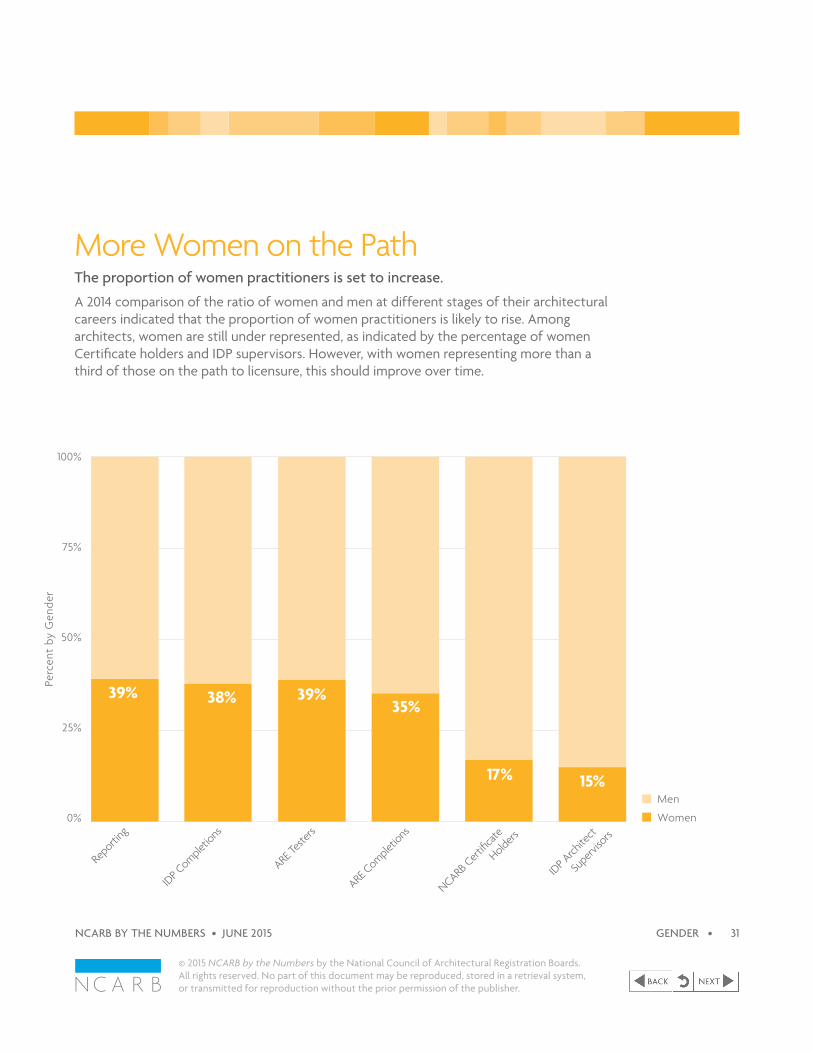
More Women on the PathThe proportion of women practitioners is set to increase.A 2014 comparison of the ratio of women and men at different stages of their architectural careers indicated that the proportion of women practitioners is likely to rise. Among architects, women are still under represented, as indicated by the percentage of women Certificate holders and IDP supervisors. However, with women representing more than a third of those on the path to licensure, this should improve over time.
Reportin
g
IDP Complet
ions
ARE Te
sters
ARE Complet
ions
NCARB Cert
ificate
Holders
IDP Arch
itect
Superv
isors
39% 38% 39%35%
17% 15%
0%
25%
75%
50%
100%
Men
Women
Perc
ent
by G
ende
r
© 2015 NCARB by the Numbers by the National Council of Architectural Registration Boards. All rights reserved. No part of this document may be reproduced, stored in a retrieval system, or transmitted for reproduction without the prior permission of the publisher.
NCARB BY THE NUMBERS • JUNE 2015 GENDER • 31
© 2015 NCARB by the Numbers by the National Council of Architectural Registration Boards. All rights reserved. No part of this document may be reproduced, stored in a retrieval system, or transmitted for reproduction without the prior permission of the publisher.
NCARB BY THE NUMBERS • JUNE 2015 32
Profession’s Racial and Ethnic Diversity Gains GroundNCARB’s 2014 data finds that the number of aspiring architects from racial and ethnic minority groups is slowly growing, with the potential to represent a larger proportion of the future architect workforce.
19Percentage Points
Since 2007
Racial and Ethnic Diversity Grew
41% in 2014
22% in 2007
Racial Diversity Grows Among Record HoldersFor the fourth-straight year, NCARB Record holders became more racially diverse.Applicants who identified themselves as non-white represented 33 percent of new NCARB Record holders in 2014. This compares favorably to 22 percent of the non-white U.S. population, based on 2010 Census Bureau data.
0%
25%
75%
50%
100% White
Native Hawaiian or Other Pacific Islander
Black or African-American
Asian
American Indian or Alaska Native
Other
Perc
ent
of R
ecor
d H
olde
rs b
y Ra
ce
2007 2008 2009 2010 2011 2012 2013 2014
Years
© 2015 NCARB by the Numbers by the National Council of Architectural Registration Boards. All rights reserved. No part of this document may be reproduced, stored in a retrieval system, or transmitted for reproduction without the prior permission of the publisher.
NCARB BY THE NUMBERS • JUNE 2015 RACIAL DIVERSITY • 33
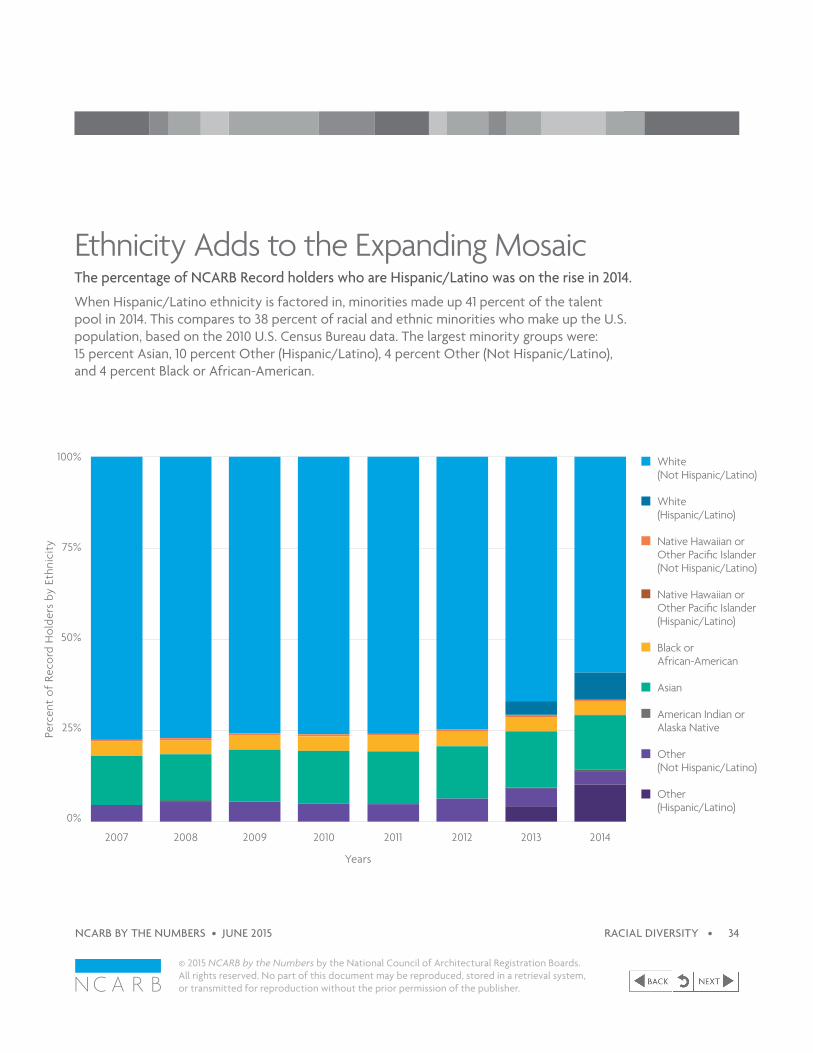
Ethnicity Adds to the Expanding Mosaic The percentage of NCARB Record holders who are Hispanic/Latino was on the rise in 2014.When Hispanic/Latino ethnicity is factored in, minorities made up 41 percent of the talent pool in 2014. This compares to 38 percent of racial and ethnic minorities who make up the U.S. population, based on the 2010 U.S. Census Bureau data. The largest minority groups were: 15 percent Asian, 10 percent Other (Hispanic/Latino), 4 percent Other (Not Hispanic/Latino), and 4 percent Black or African-American.
0%
25%
75%
50%
100%
2007 2008 2009 2010 2011 2012 2013 2014
White (Not Hispanic/Latino)
White (Hispanic/Latino)
Native Hawaiian or Other Pacific Islander (Not Hispanic/Latino)
Native Hawaiian or Other Pacific Islander (Hispanic/Latino)
Black or African-American
Asian
American Indian or Alaska Native
Other (Not Hispanic/Latino)
Other (Hispanic/Latino)
Perc
ent
of R
ecor
d H
olde
rs b
y Et
hnic
ity
Years
© 2015 NCARB by the Numbers by the National Council of Architectural Registration Boards. All rights reserved. No part of this document may be reproduced, stored in a retrieval system, or transmitted for reproduction without the prior permission of the publisher.
NCARB BY THE NUMBERS • JUNE 2015 RACIAL DIVERSITY • 34
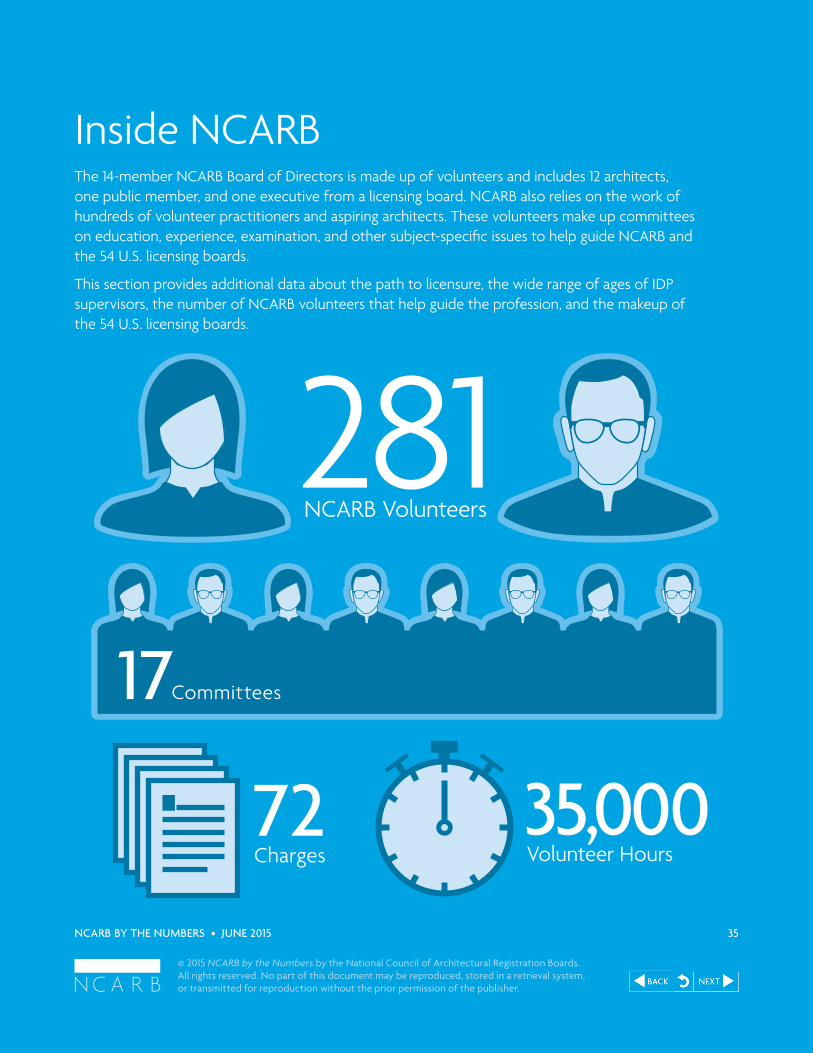
Inside NCARBThe 14-member NCARB Board of Directors is made up of volunteers and includes 12 architects, one public member, and one executive from a licensing board. NCARB also relies on the work of hundreds of volunteer practitioners and aspiring architects. These volunteers make up committees on education, experience, examination, and other subject-specific issues to help guide NCARB and the 54 U.S. licensing boards.
This section provides additional data about the path to licensure, the wide range of ages of IDP supervisors, the number of NCARB volunteers that help guide the profession, and the makeup of the 54 U.S. licensing boards.
281 NCARB Volunteers
72Charges
35,000 Volunteer Hours
17Committees
© 2015 NCARB by the Numbers by the National Council of Architectural Registration Boards. All rights reserved. No part of this document may be reproduced, stored in a retrieval system, or transmitted for reproduction without the prior permission of the publisher.
NCARB BY THE NUMBERS • JUNE 2015 35
Nearly 10,000 Start the Path to LicensureThe number of aspiring architects beginning the path to licensure continued to grow.In 2014, 9,953 new aspiring architects started the path to licensure by creating an NCARB Record, up 61 percent since 2000 and up 4 percent from last year.
Effective July 1, 2009, NCARB implemented a new reporting requirement that required candidates to submit IDP experience within eight months.
0
2K
4K
6K
8K
10K
12K
14K
2000 2001 2002 2003 2004 2005 2006 2007 2008 2009 2010 2011 2012 2013 2014
9,953NEW RECORDS
+4%
New
Rec
ord
App
lican
ts
Years
Introduction of a New Reporting Requirement
© 2015 NCARB by the Numbers by the National Council of Architectural Registration Boards. All rights reserved. No part of this document may be reproduced, stored in a retrieval system, or transmitted for reproduction without the prior permission of the publisher.
NCARB BY THE NUMBERS • JUNE 2015 INSIDE NCARB • 36
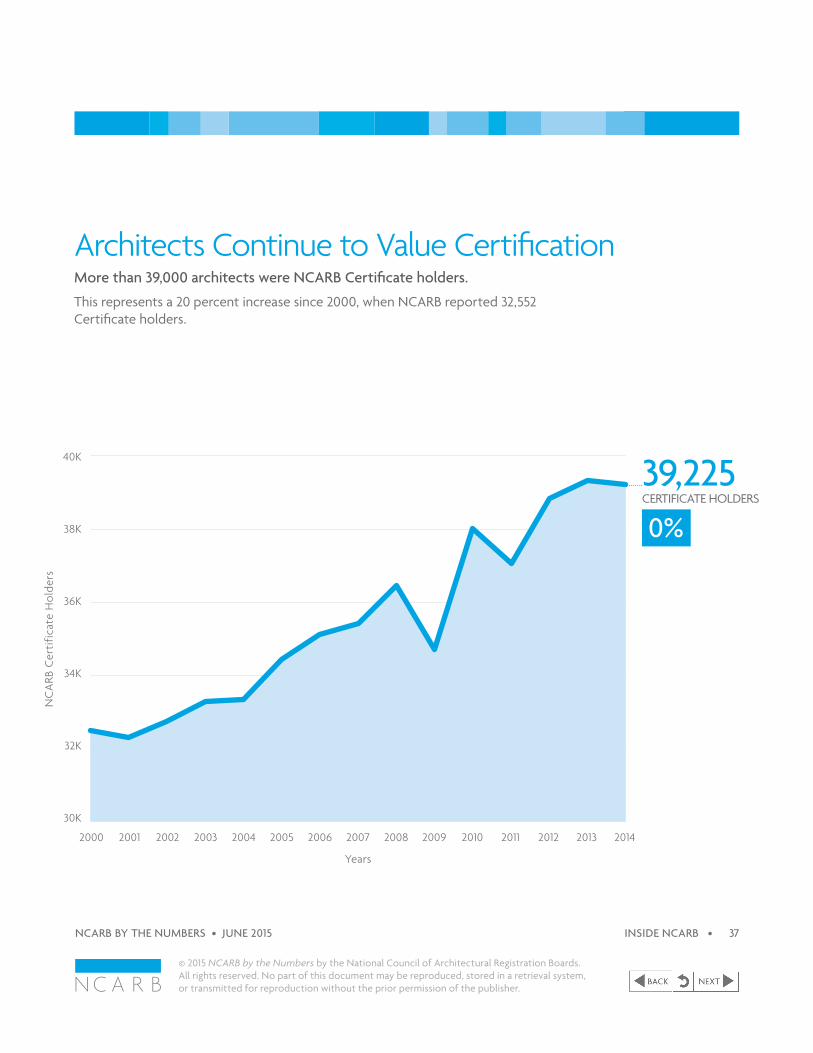
Architects Continue to Value CertificationMore than 39,000 architects were NCARB Certificate holders.This represents a 20 percent increase since 2000, when NCARB reported 32,552 Certificate holders.
30K
34K
32K
36K
38K
40K
2000 2001 2002 2003 2004 2005 2006 2007 2008 2009 2010 2011 2012 2013 2014
39,225CERTIFICATE HOLDERS
0%
NC
ARB
Cer
tific
ate
Hol
ders
Years
© 2015 NCARB by the Numbers by the National Council of Architectural Registration Boards. All rights reserved. No part of this document may be reproduced, stored in a retrieval system, or transmitted for reproduction without the prior permission of the publisher.
NCARB BY THE NUMBERS • JUNE 2015 INSIDE NCARB • 37
IDP Supervisors: A Broad Range of AgesThe average age of an IDP architect supervisor was 49.2 in 2014.Aspiring architects reported to IDP supervisors of widely varying ages and levels of experience. The most common age of an IDP architect supervisor was between 45-54.
0
200
400
500
300
100
25 30 35 40 45 50 55 60 65 70 75
Age
8%
29%
32%
26%
55-64
65+ 25-34
35-44
45-54
5%
Proportion of IDP Architect Supervisors
by Age
Arc
hite
ct S
uper
viso
rs
© 2015 NCARB by the Numbers by the National Council of Architectural Registration Boards. All rights reserved. No part of this document may be reproduced, stored in a retrieval system, or transmitted for reproduction without the prior permission of the publisher.
NCARB BY THE NUMBERS • JUNE 2015 INSIDE NCARB • 38
Exam Candidates Test More FrequentlyFor the second-straight year, the number of ARE divisions administered increased.The 45,023 ARE divisions administered in 2014 represent a 23 percent increase since 2013. This is the highest number of ARE divisions administered since 2009, when many candidates rushed to complete the exam before it transitioned from ARE 3.1 to ARE 4.0.
25K
30K
35K
40K
45K
50K
55K
60K
2000 2001 2002 2003 2004 2005 2006 2007 2008 2009 2010 2011 2012 2013 2014
45,023ARE DIVISIONS
+23%
Start of ARE 3.1 to ARE 4.0 transition
Del
iver
ed D
ivis
ions
Years
© 2015 NCARB by the Numbers by the National Council of Architectural Registration Boards. All rights reserved. No part of this document may be reproduced, stored in a retrieval system, or transmitted for reproduction without the prior permission of the publisher.
NCARB BY THE NUMBERS • JUNE 2015 INSIDE NCARB • 39
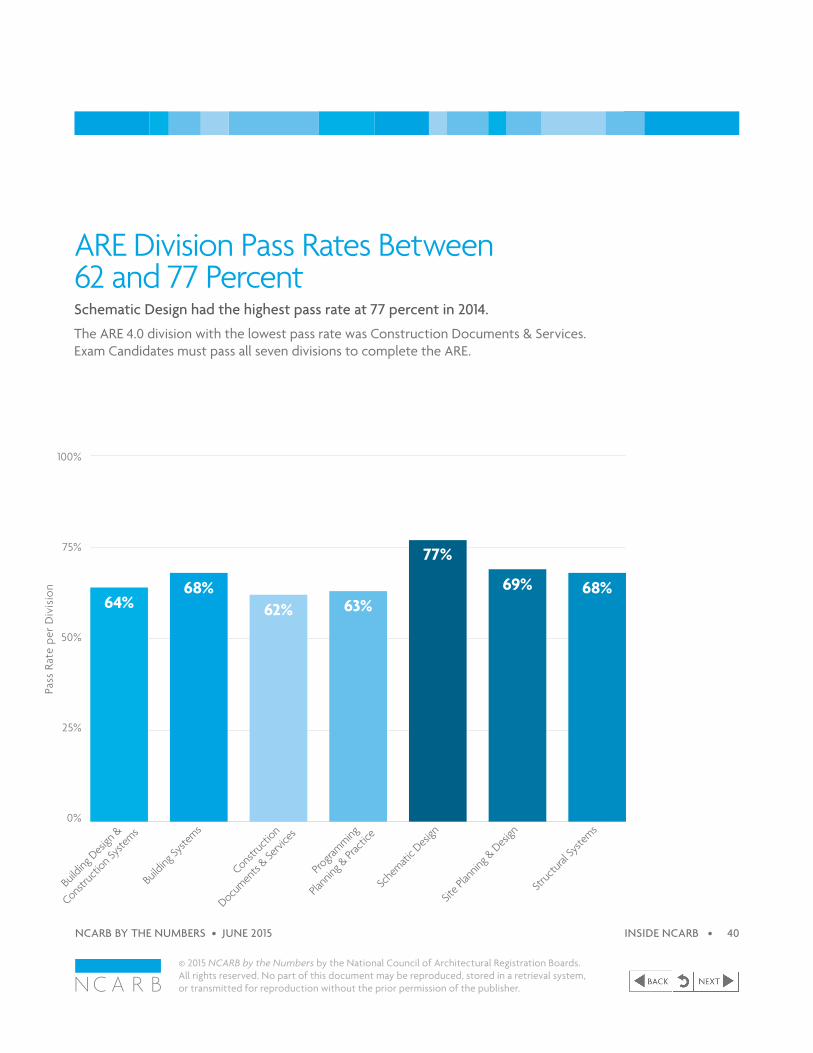
ARE Division Pass Rates Between 62 and 77 PercentSchematic Design had the highest pass rate at 77 percent in 2014.The ARE 4.0 division with the lowest pass rate was Construction Documents & Services. Exam Candidates must pass all seven divisions to complete the ARE.
0%
25%
50%
75%
100%
68%69%
77%
63%62%68%
64%
Pass
Rat
e pe
r D
ivis
ion
Build
ing D
esign
&
Construc
tion S
ystem
s
Build
ing Sy
stems
Construc
tion
Documen
ts & Se
rvice
s
Progra
mming
Plann
ing & Pr
actic
e
Sche
matic D
esign
Site P
lannin
g & D
esign
Struc
tural
Syste
ms
© 2015 NCARB by the Numbers by the National Council of Architectural Registration Boards. All rights reserved. No part of this document may be reproduced, stored in a retrieval system, or transmitted for reproduction without the prior permission of the publisher.
NCARB BY THE NUMBERS • JUNE 2015 INSIDE NCARB • 40
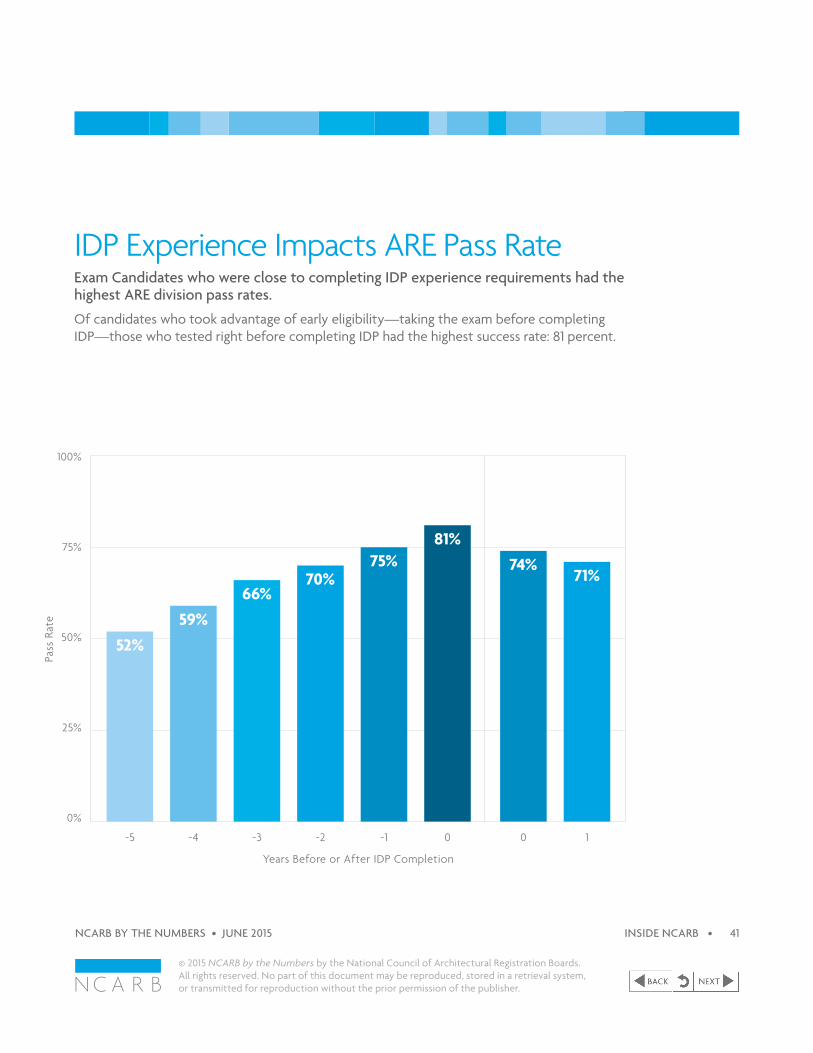
IDP Experience Impacts ARE Pass RateExam Candidates who were close to completing IDP experience requirements had the highest ARE division pass rates.
Of candidates who took advantage of early eligibility—taking the exam before completing IDP—those who tested right before completing IDP had the highest success rate: 81 percent.
10-1-2-3-4-5 0
0%
25%
50%
75%
100%
Years Before or After IDP Completion
71%74%
81%75%
70%66%
59%52%
Pass
Rat
e
© 2015 NCARB by the Numbers by the National Council of Architectural Registration Boards. All rights reserved. No part of this document may be reproduced, stored in a retrieval system, or transmitted for reproduction without the prior permission of the publisher.
NCARB BY THE NUMBERS • JUNE 2015 INSIDE NCARB • 41
Prospective ArchitectsThese 10 jurisdictions had the highest number of aspiring architects in 2014.
California: 8,783
New York: 7,630
Texas: 4,276
Illinois: 2,822
Massachusetts: 2,543
Florida: 2,494
New Jersey: 2,029
Pennsylvania: 1,774
Washington: 1,654
Virginia: 1,454
© 2015 NCARB by the Numbers by the National Council of Architectural Registration Boards. All rights reserved. No part of this document may be reproduced, stored in a retrieval system, or transmitted for reproduction without the prior permission of the publisher.
NCARB BY THE NUMBERS • JUNE 2015 INSIDE NCARB • 42
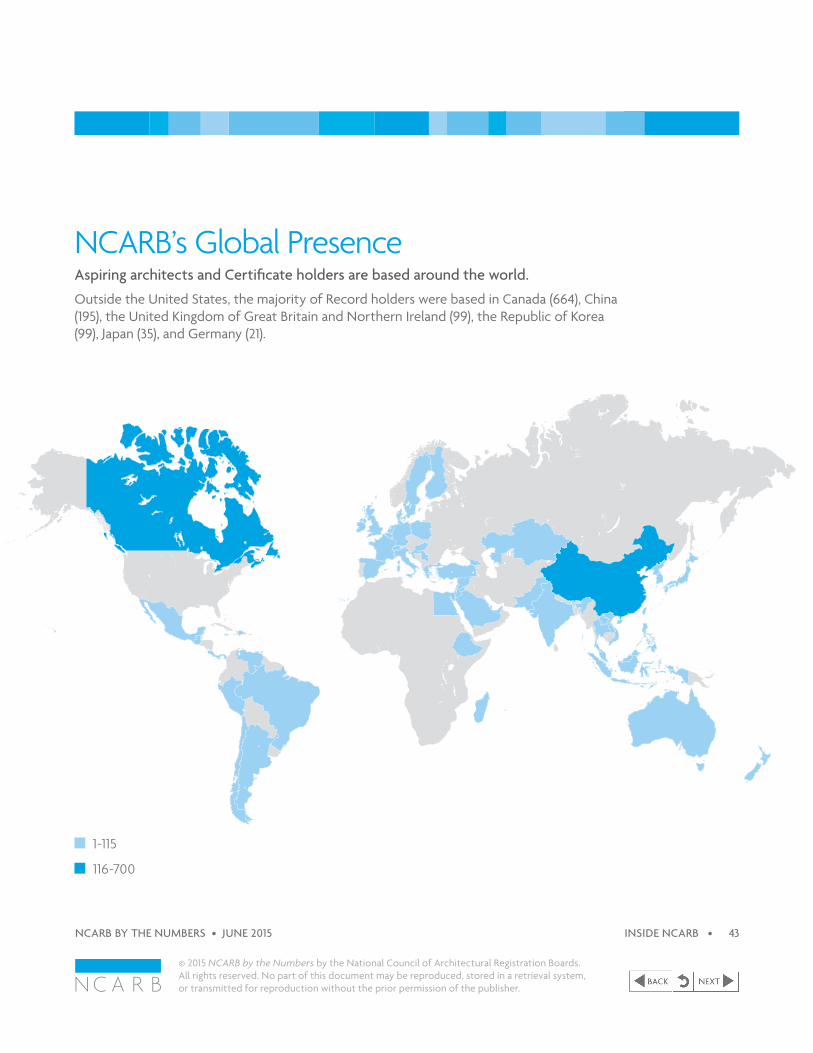
NCARB’s Global PresenceAspiring architects and Certificate holders are based around the world.Outside the United States, the majority of Record holders were based in Canada (664), China (195), the United Kingdom of Great Britain and Northern Ireland (99), the Republic of Korea (99), Japan (35), and Germany (21).
NCARB’s Global PresenceAspiring architects and Certificate holders are based around the world.
Outside the United States, the majority of Record holders were based in Canada (664), China (195), the United Kingdom of Great Britain and Northern Ireland (99), the Republic of Korea (99), Japan (35), and Germany (21).
1-115
116-700
NC
ARB
BY
TH
E N
UM
BERS
| J
UN
E 20
15
52
INSI
DE
NC
ARB
53
1-115
116-700
© 2015 NCARB by the Numbers by the National Council of Architectural Registration Boards. All rights reserved. No part of this document may be reproduced, stored in a retrieval system, or transmitted for reproduction without the prior permission of the publisher.
NCARB BY THE NUMBERS • JUNE 2015 INSIDE NCARB • 43
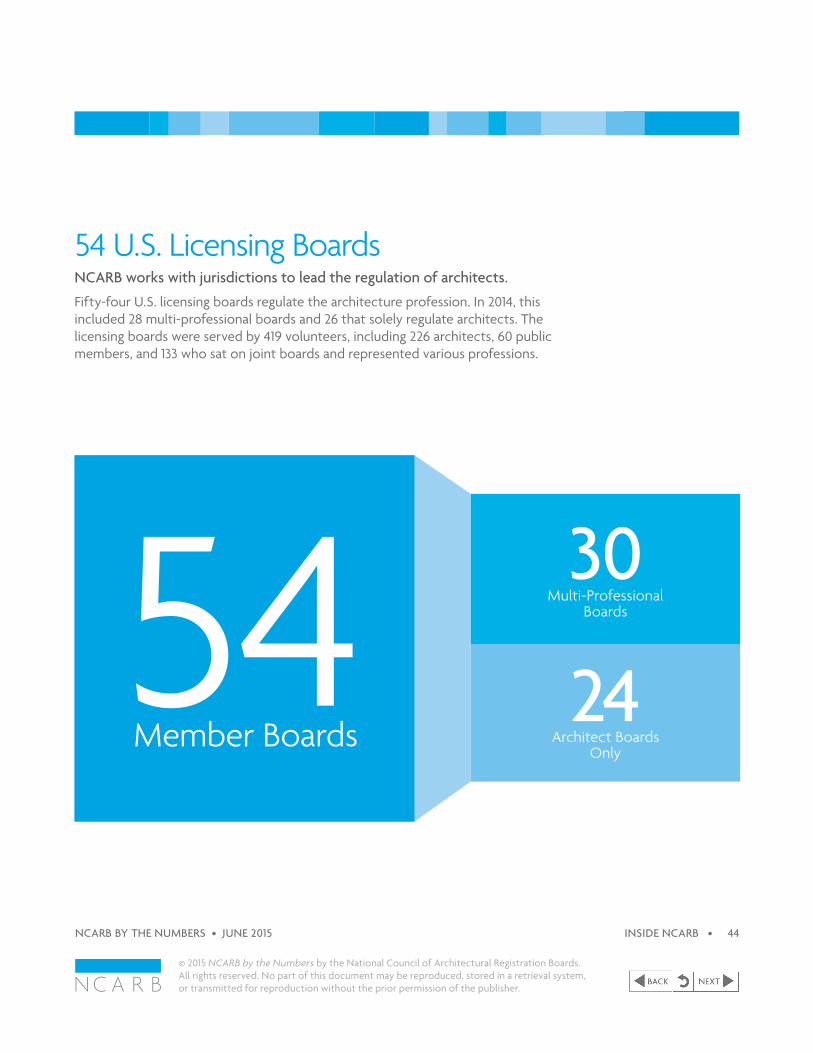
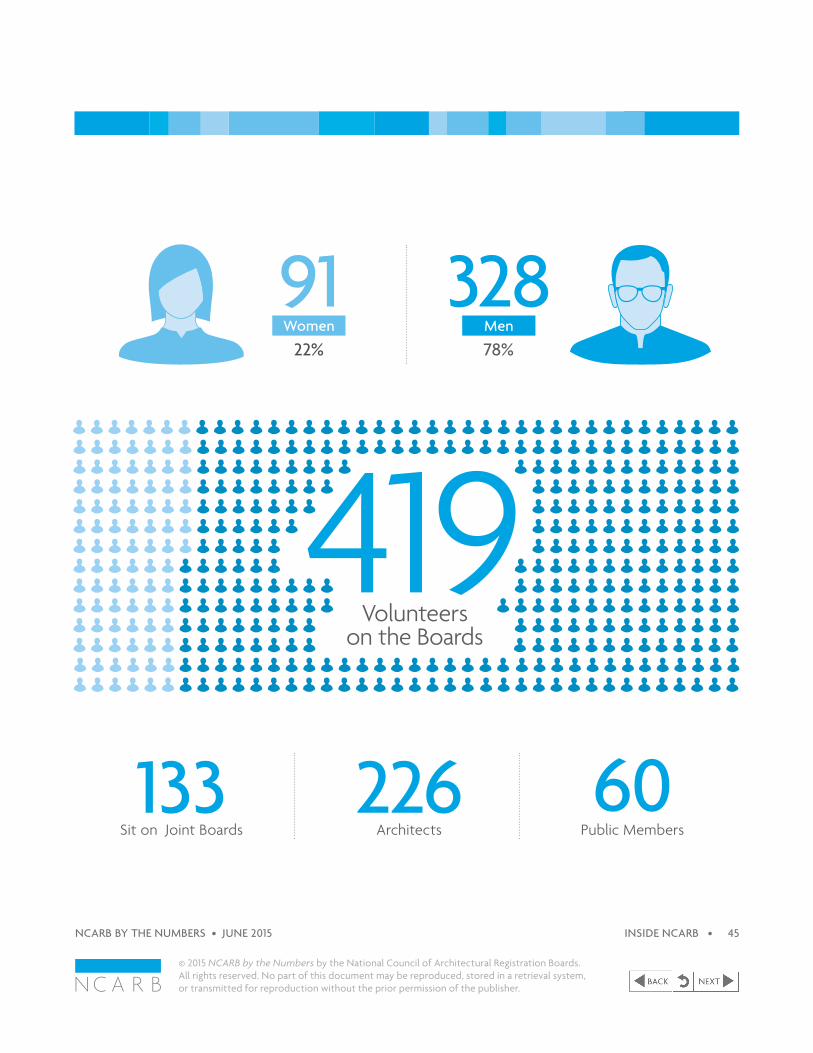
54 U.S. Licensing BoardsNCARB works with jurisdictions to lead the regulation of architects.Fifty-four U.S. licensing boards regulate the architecture profession. In 2014, this included 28 multi-professional boards and 26 that solely regulate architects. The licensing boards were served by 419 volunteers, including 226 architects, 60 public members, and 133 who sat on joint boards and represented various professions.
54 Member Boards Architect Boards
Only
24
Multi-Professional Boards
30
© 2015 NCARB by the Numbers by the National Council of Architectural Registration Boards. All rights reserved. No part of this document may be reproduced, stored in a retrieval system, or transmitted for reproduction without the prior permission of the publisher.
NCARB BY THE NUMBERS • JUNE 2015 INSIDE NCARB • 44
419 Volunteers
on the Boards
60Public MembersArchitects
226Sit on Joint Boards133
78%Men
328Women
9122%
© 2015 NCARB by the Numbers by the National Council of Architectural Registration Boards. All rights reserved. No part of this document may be reproduced, stored in a retrieval system, or transmitted for reproduction without the prior permission of the publisher.
NCARB BY THE NUMBERS • JUNE 2015 INSIDE NCARB • 45
© 2015 NCARB by the Numbers by the National Council of Architectural Registration Boards. All rights reserved. No part of this document may be reproduced, stored in a retrieval system, or transmitted for reproduction without the prior permission of the publisher.
NCARB BY THE NUMBERS • JUNE 2015 46
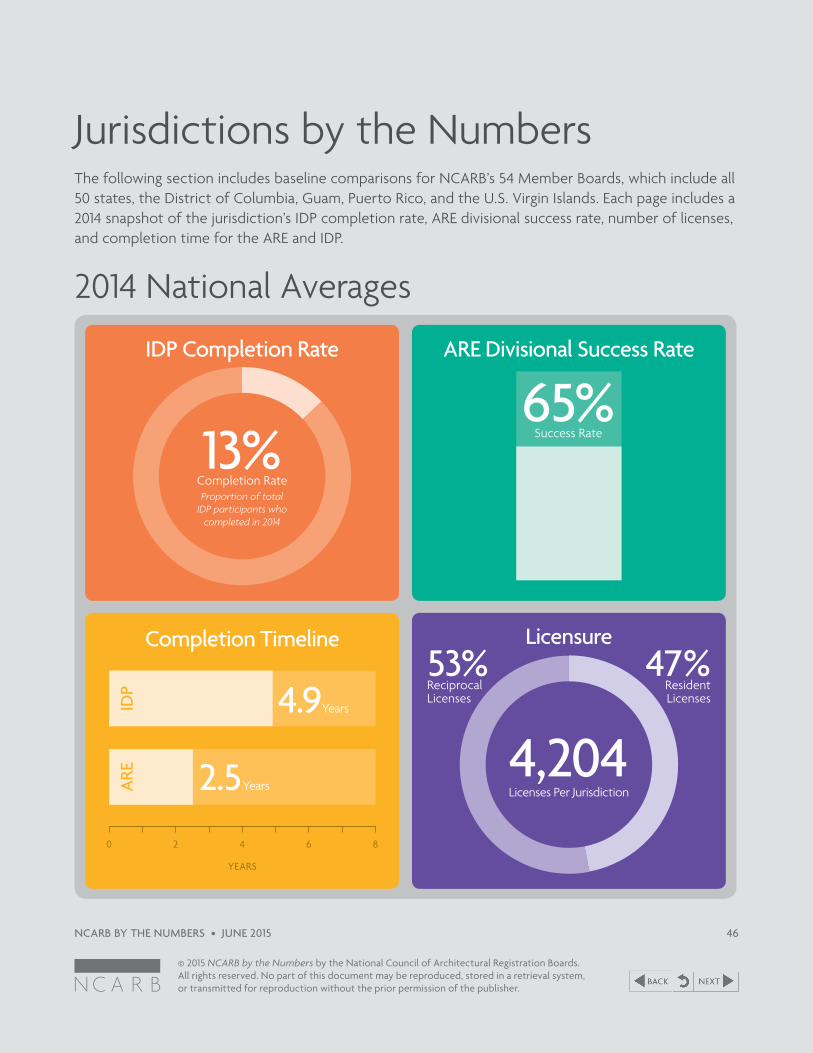
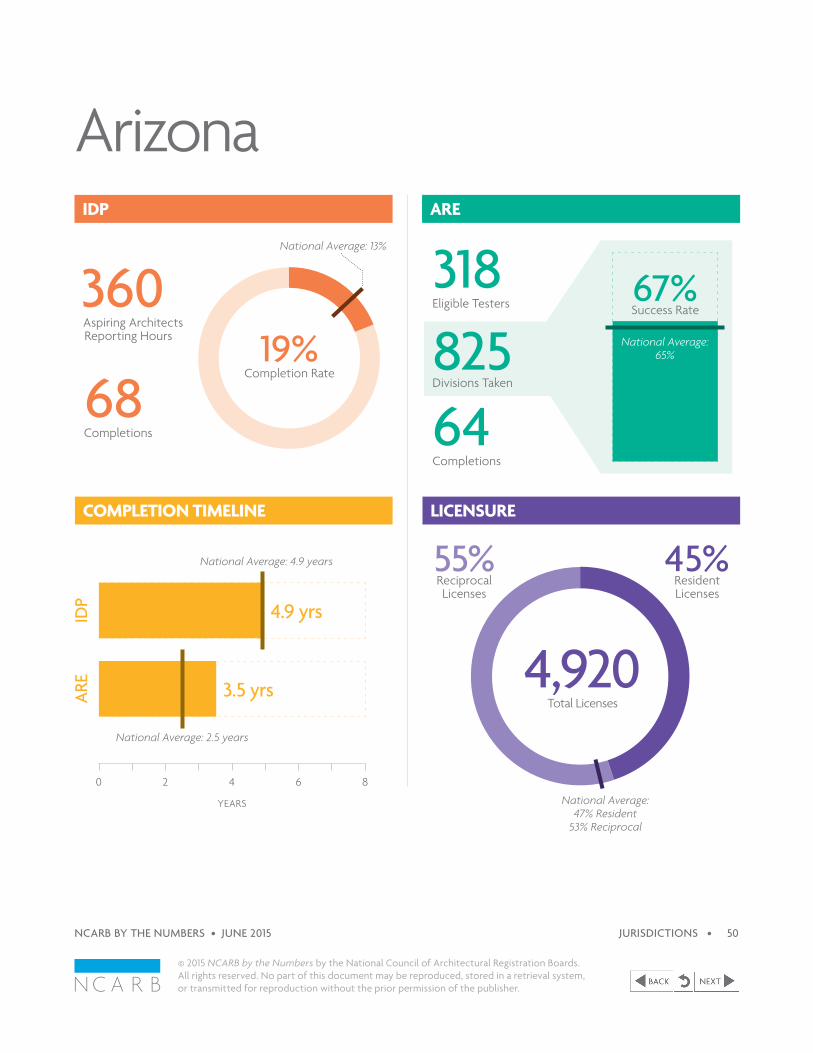
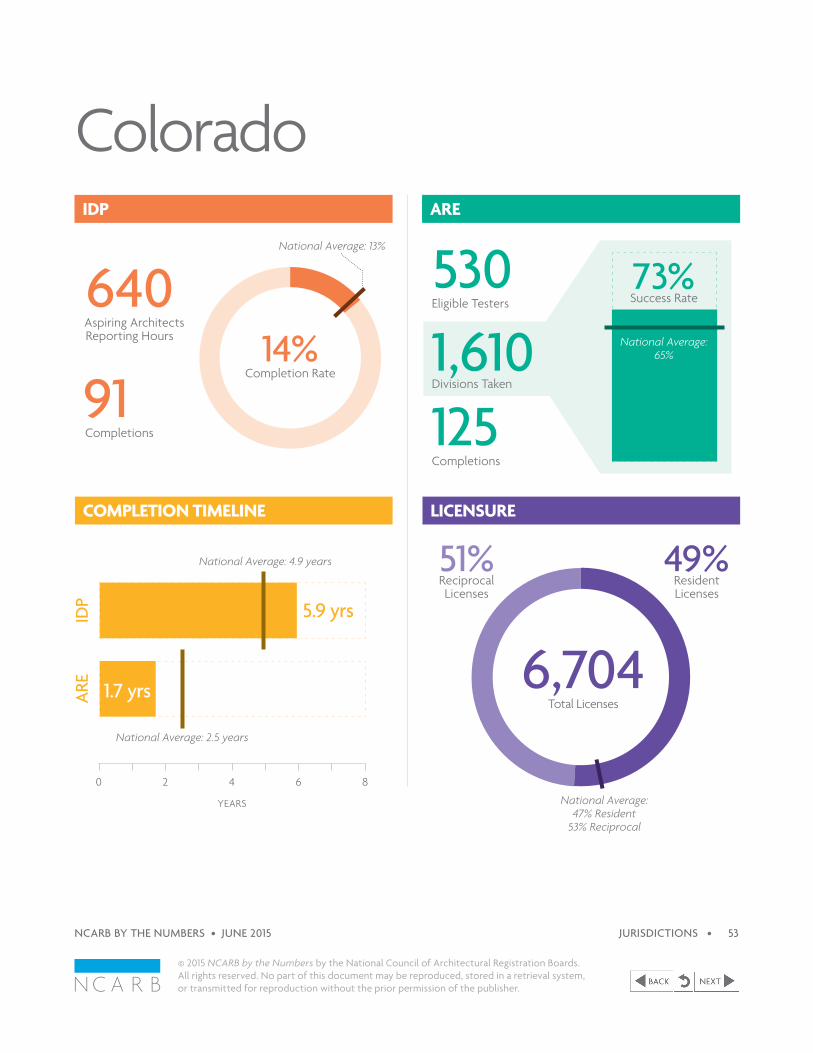
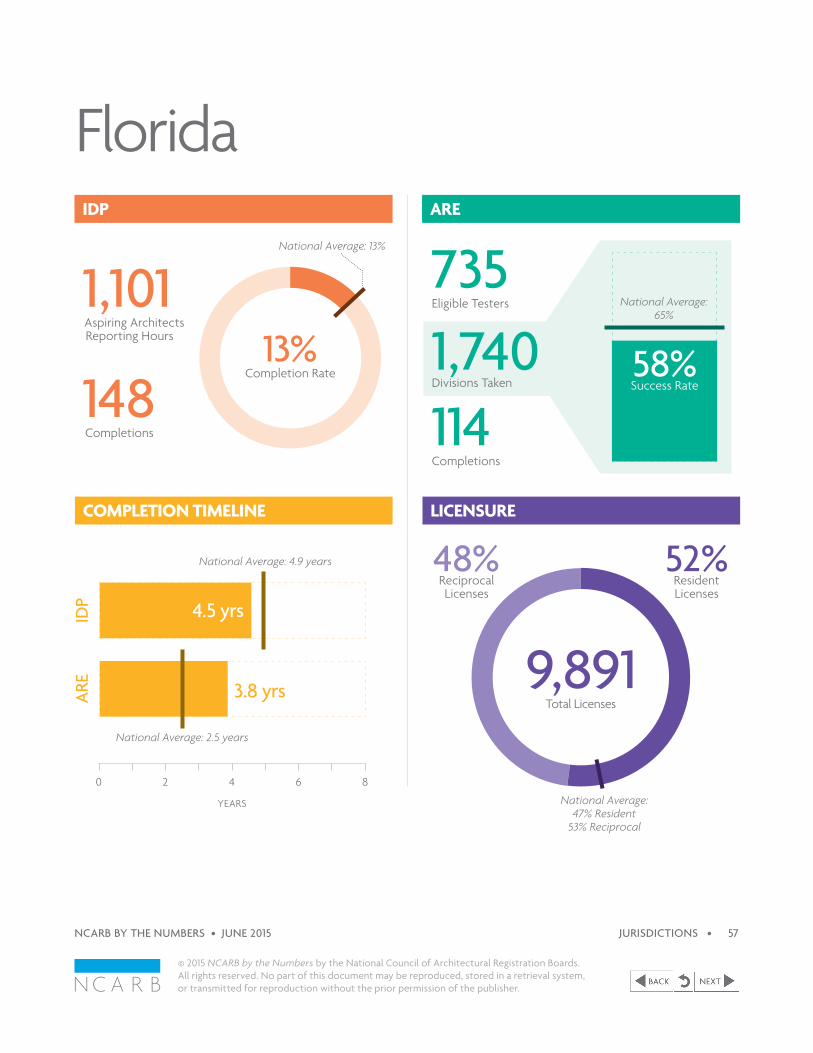
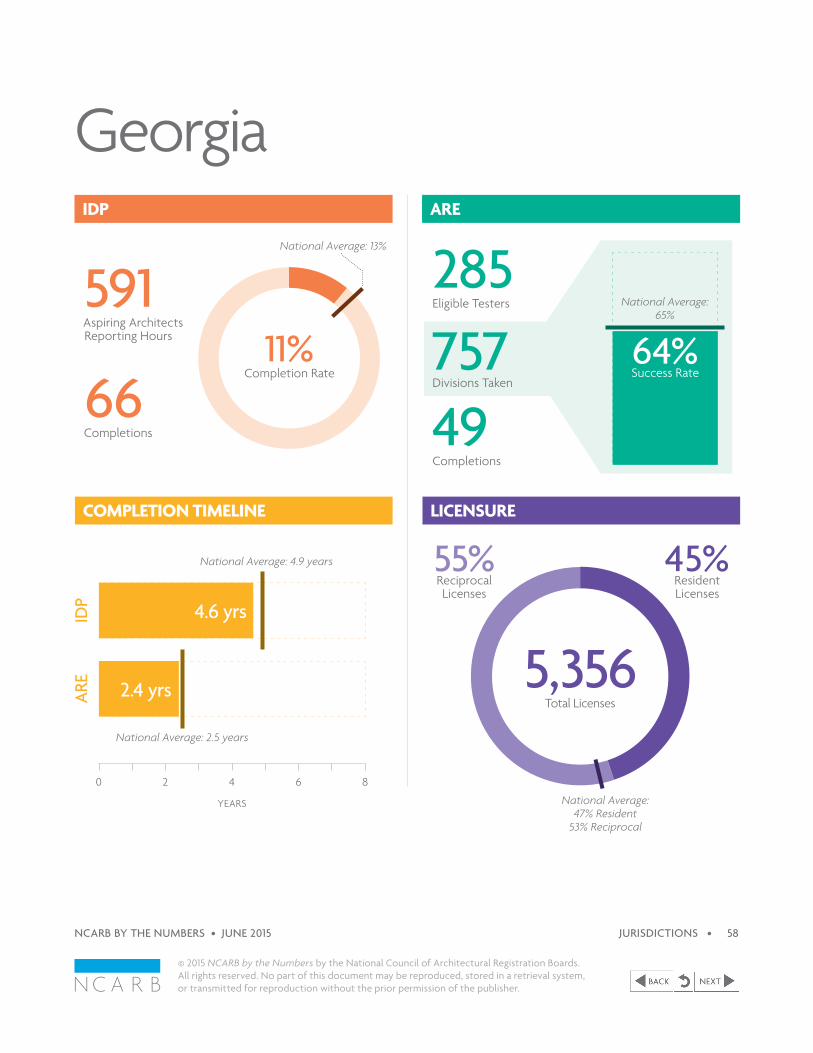
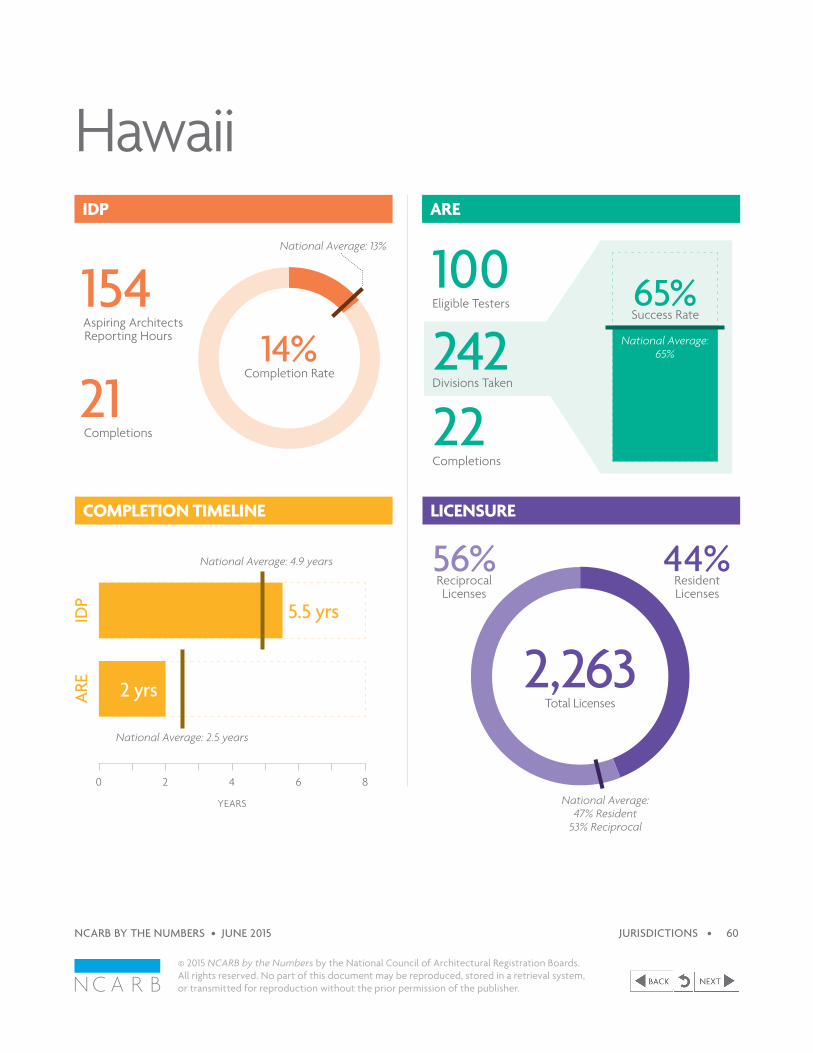
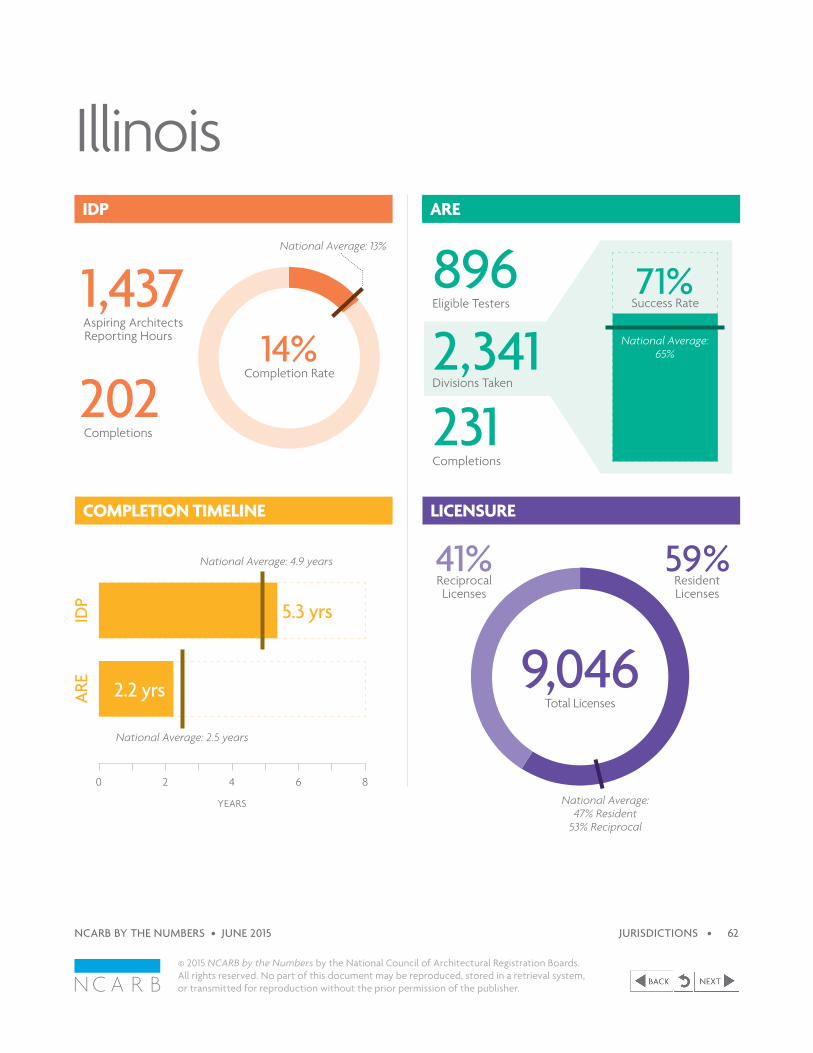
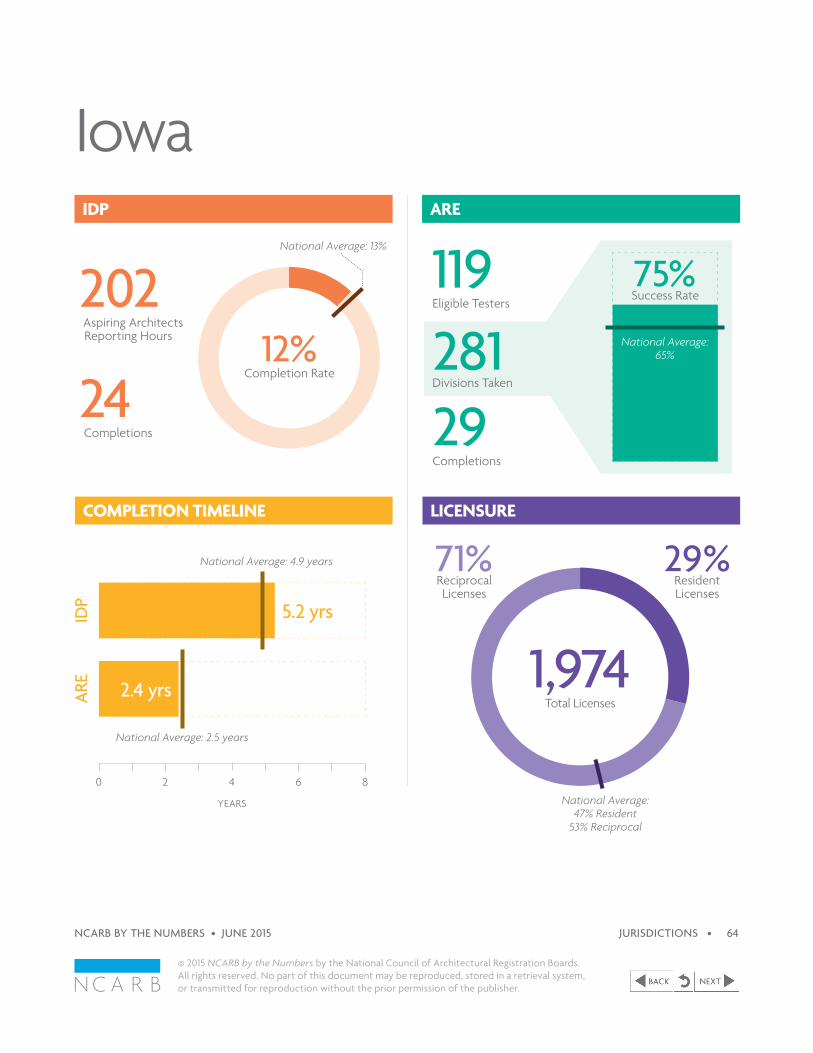
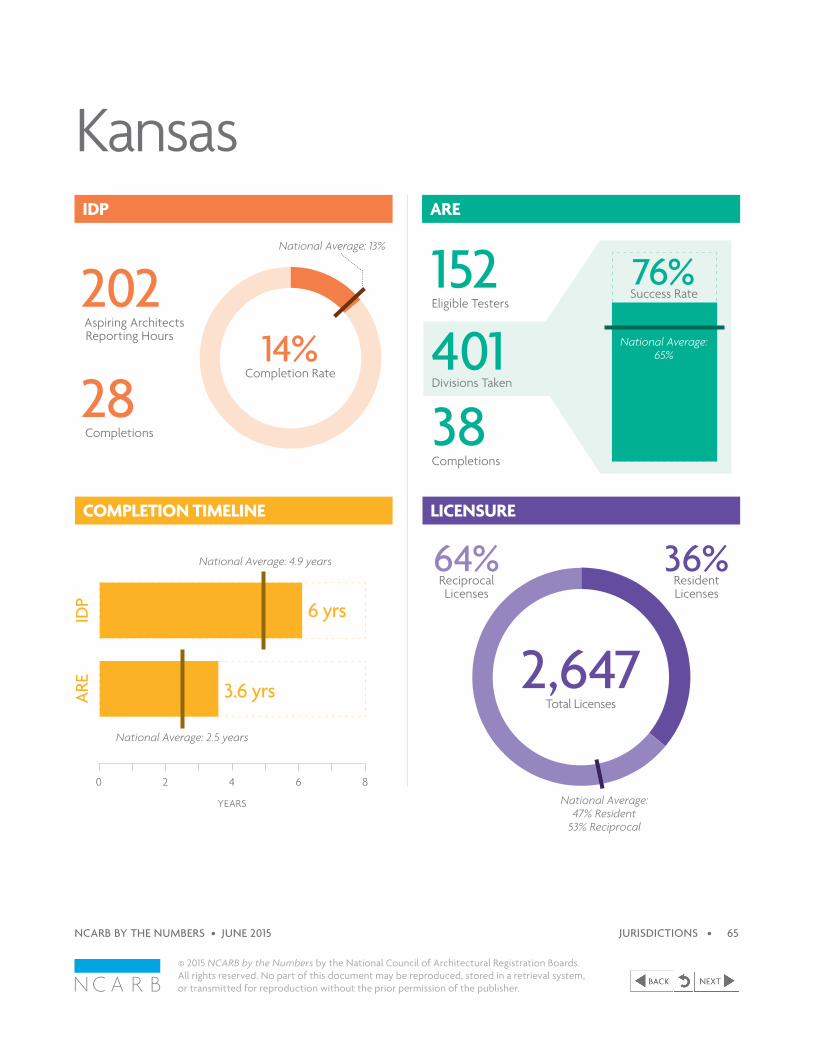
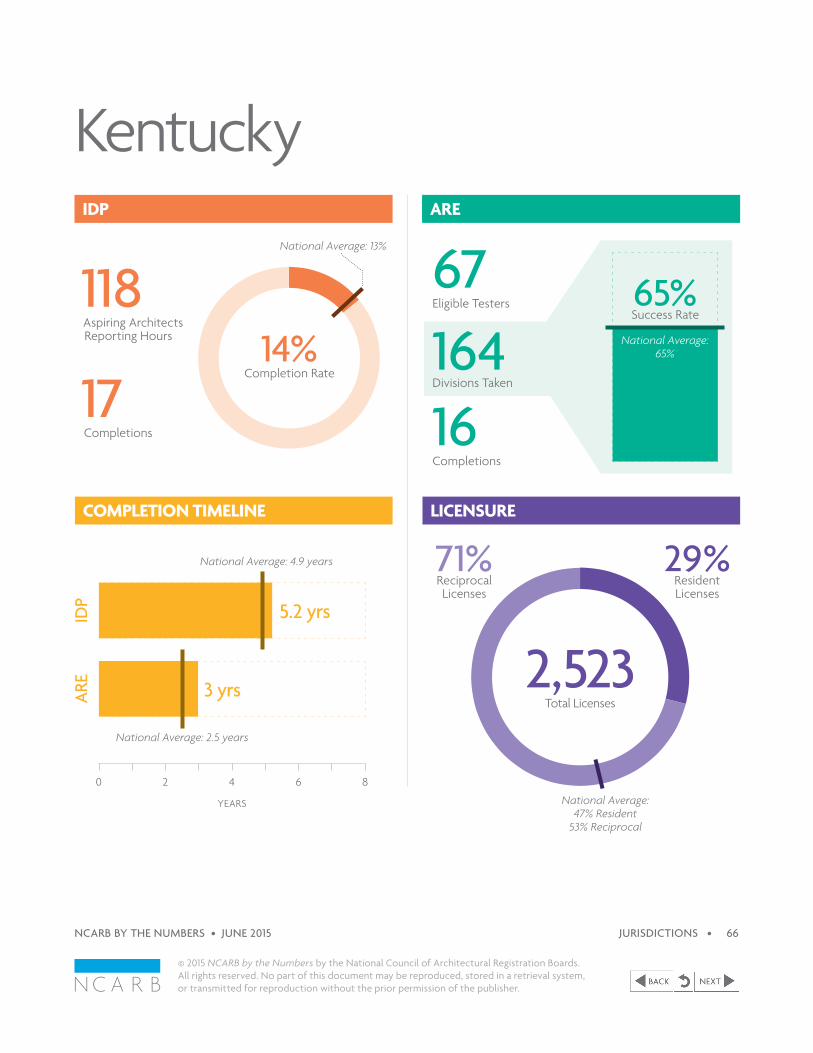
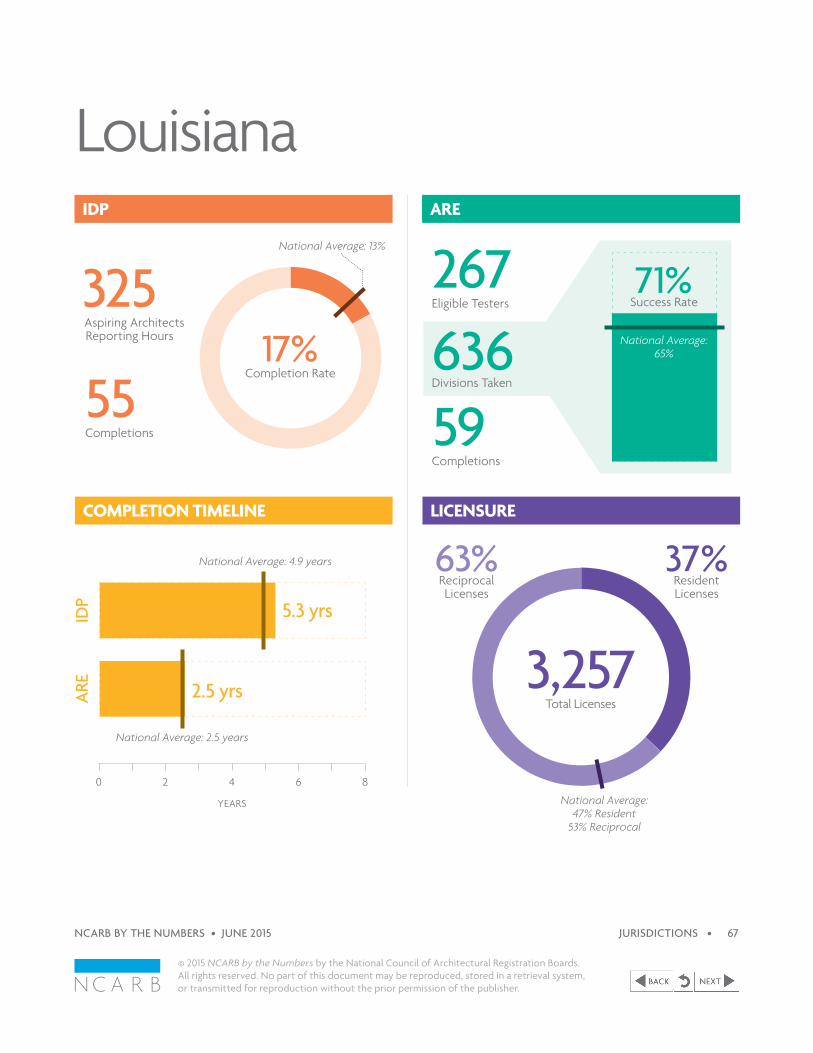
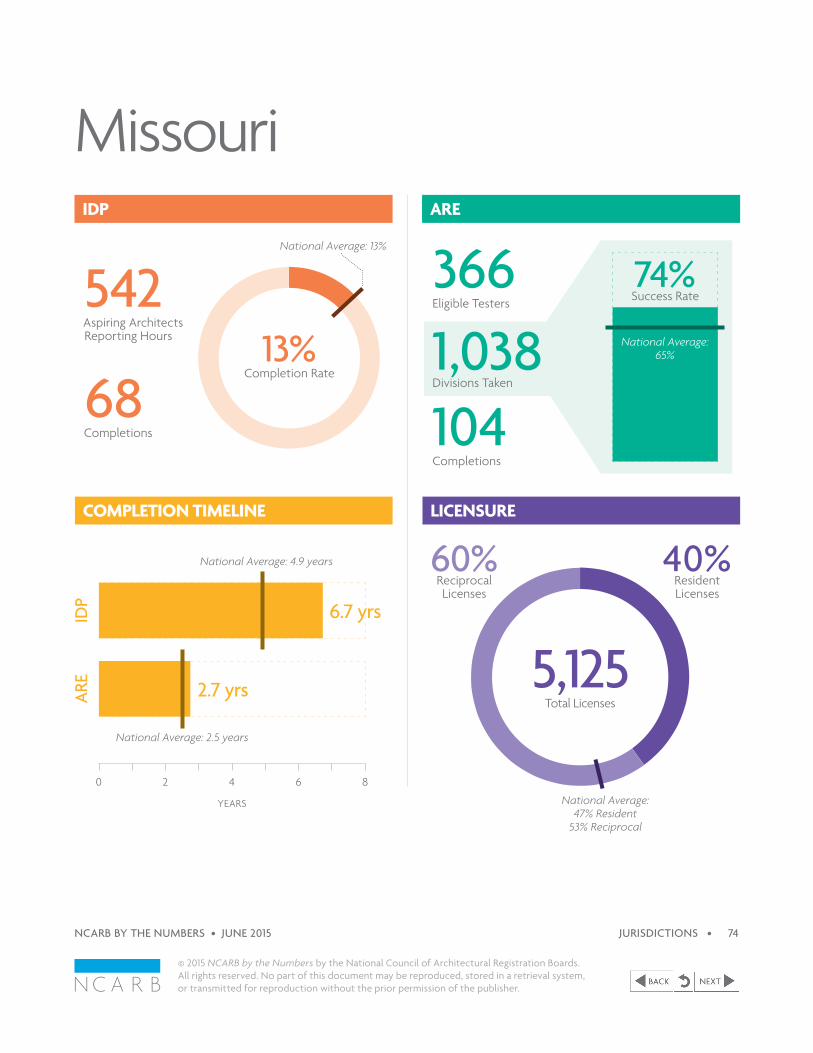
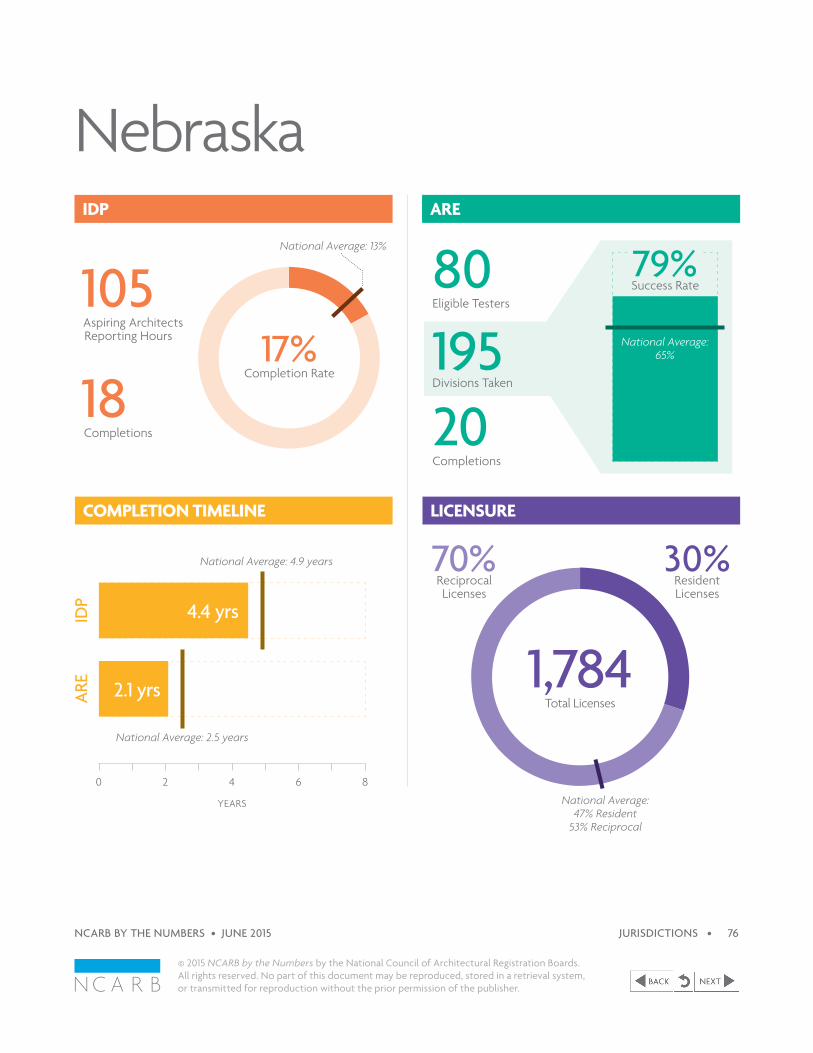
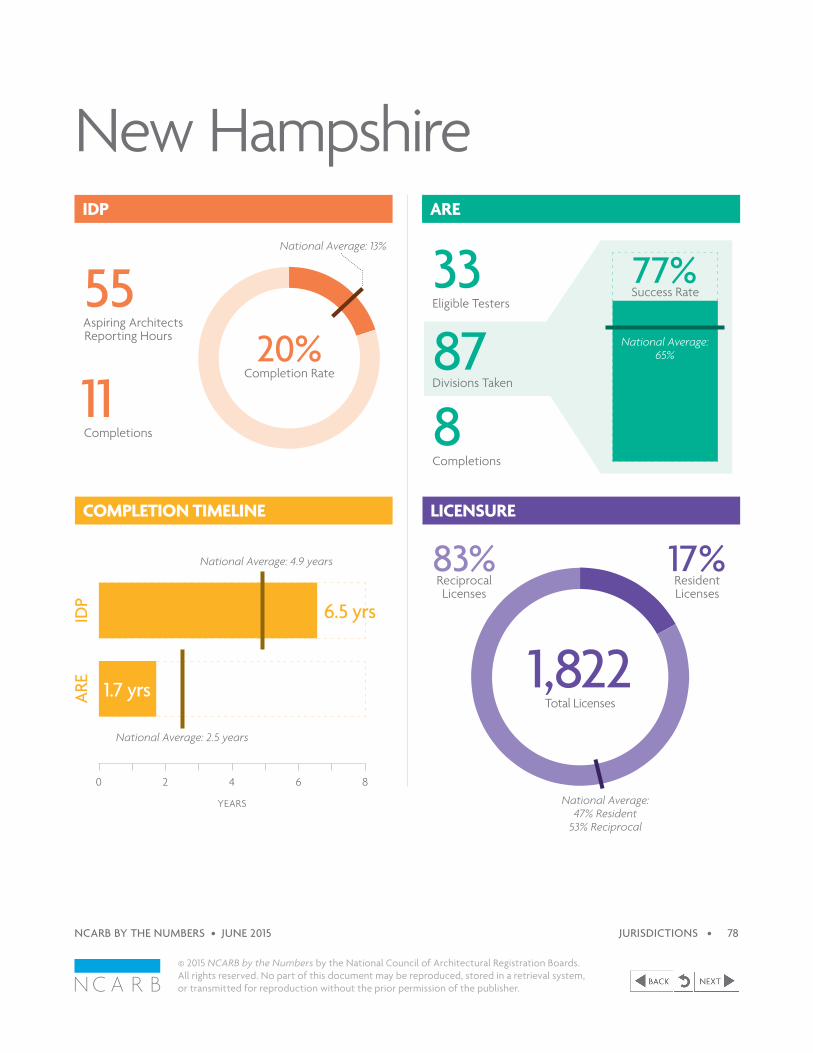
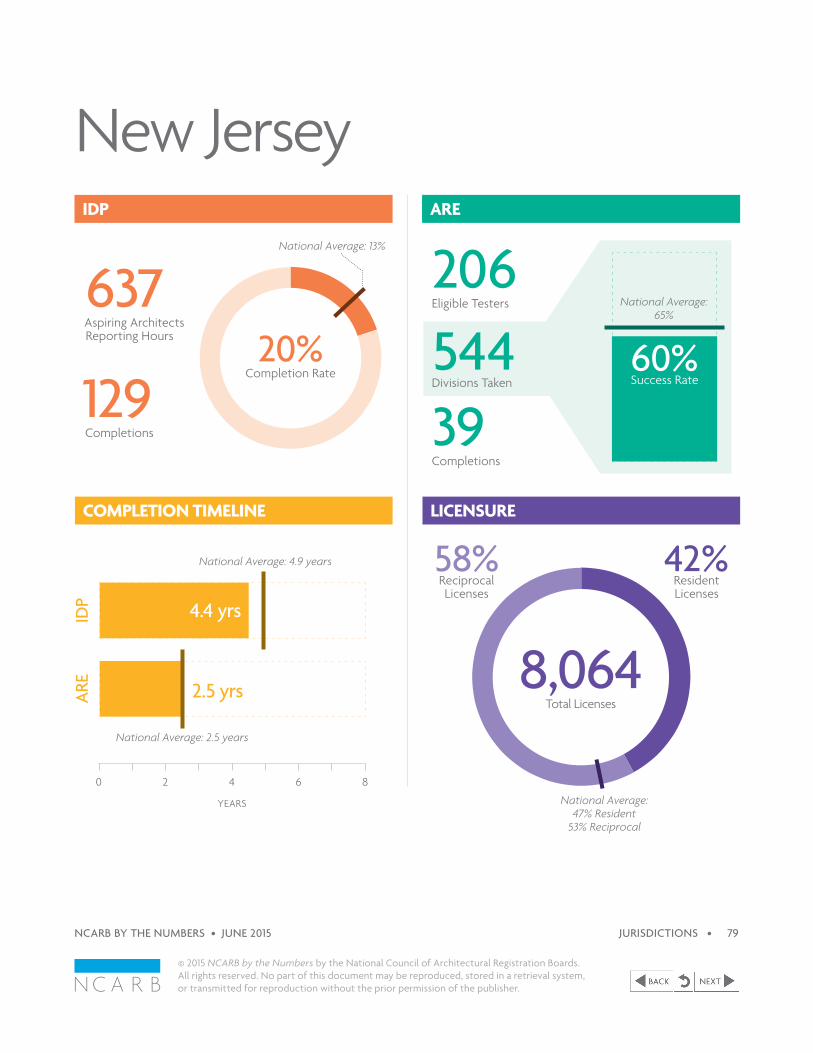
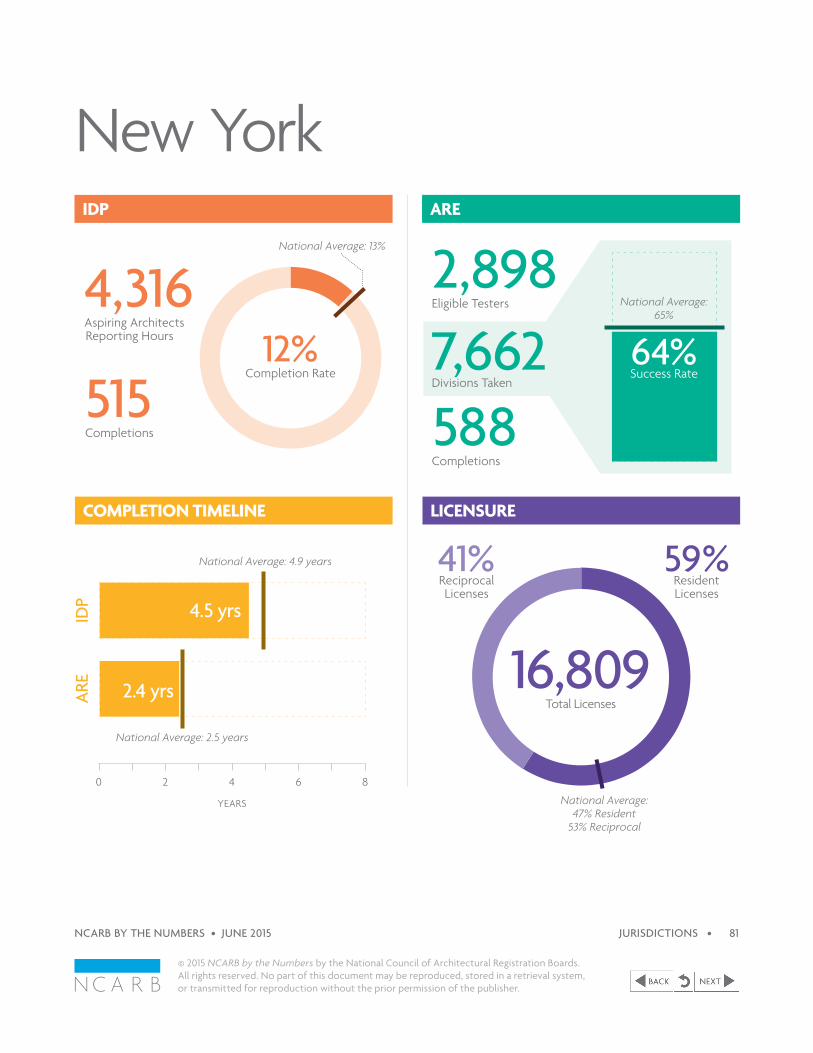
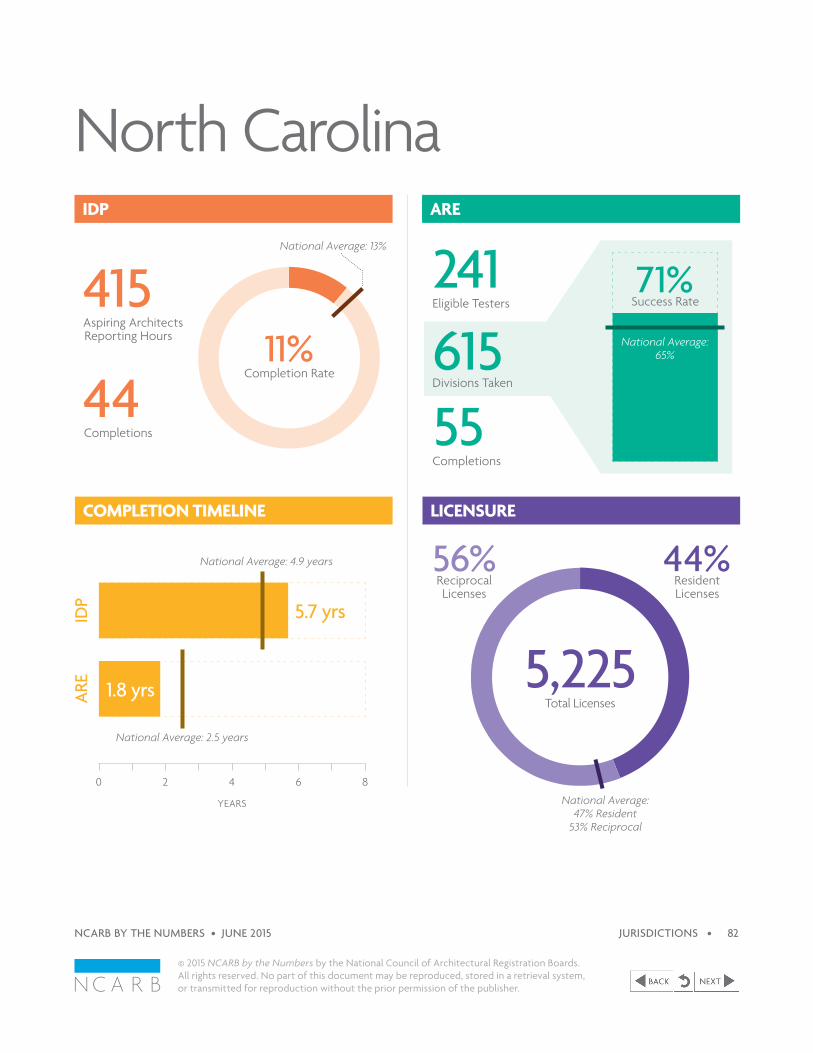
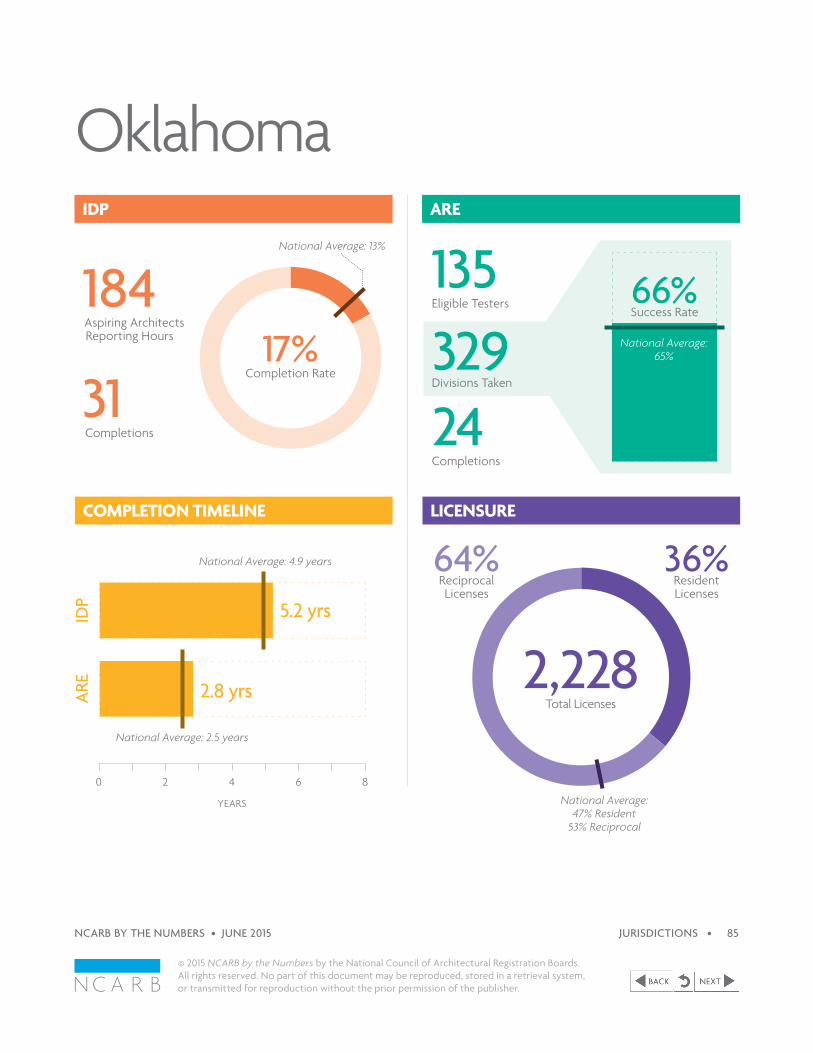
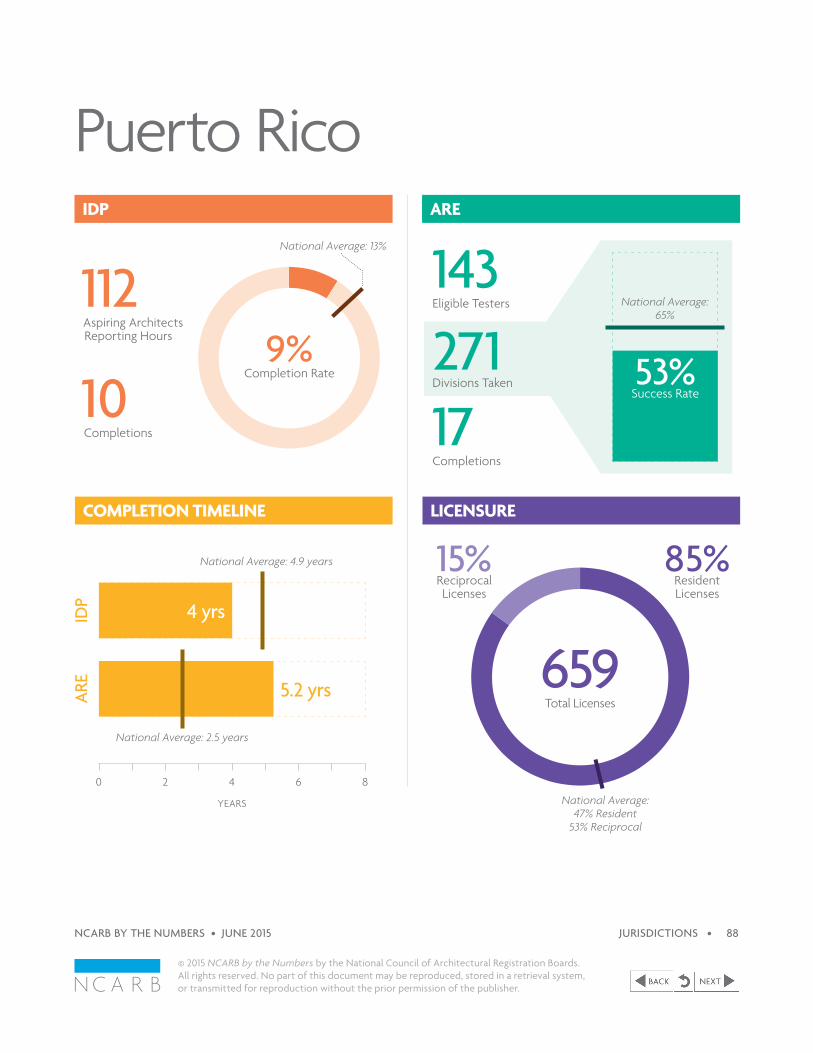
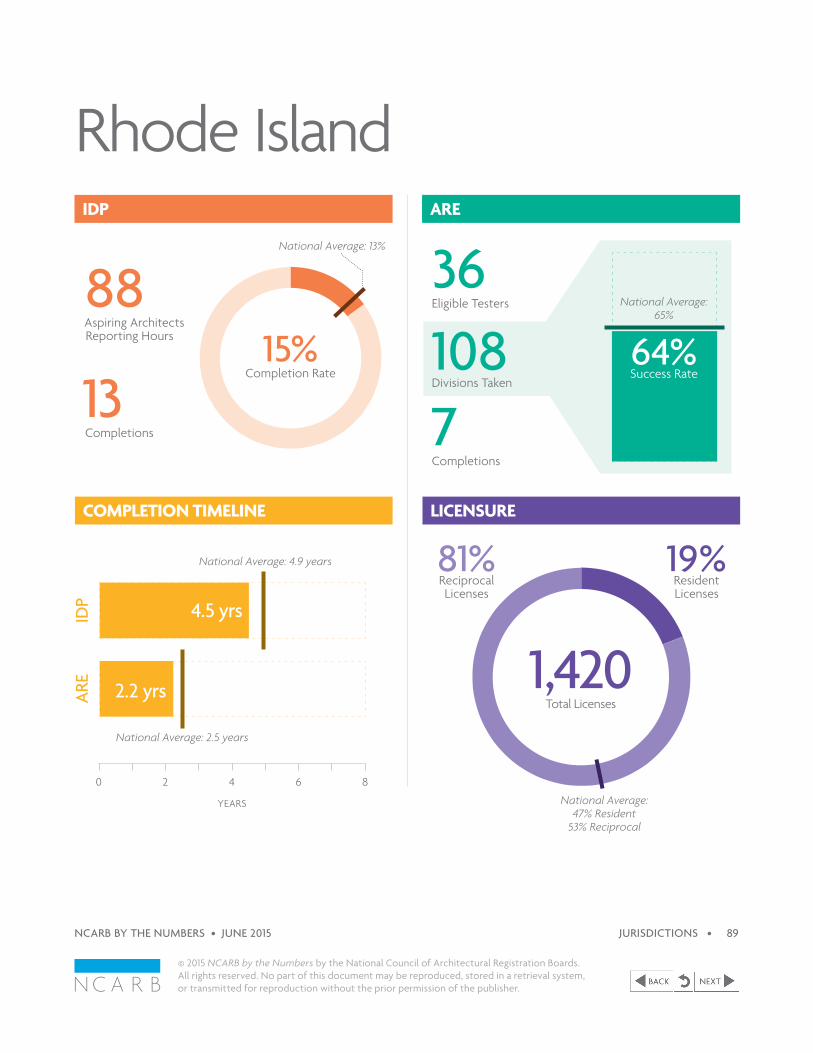
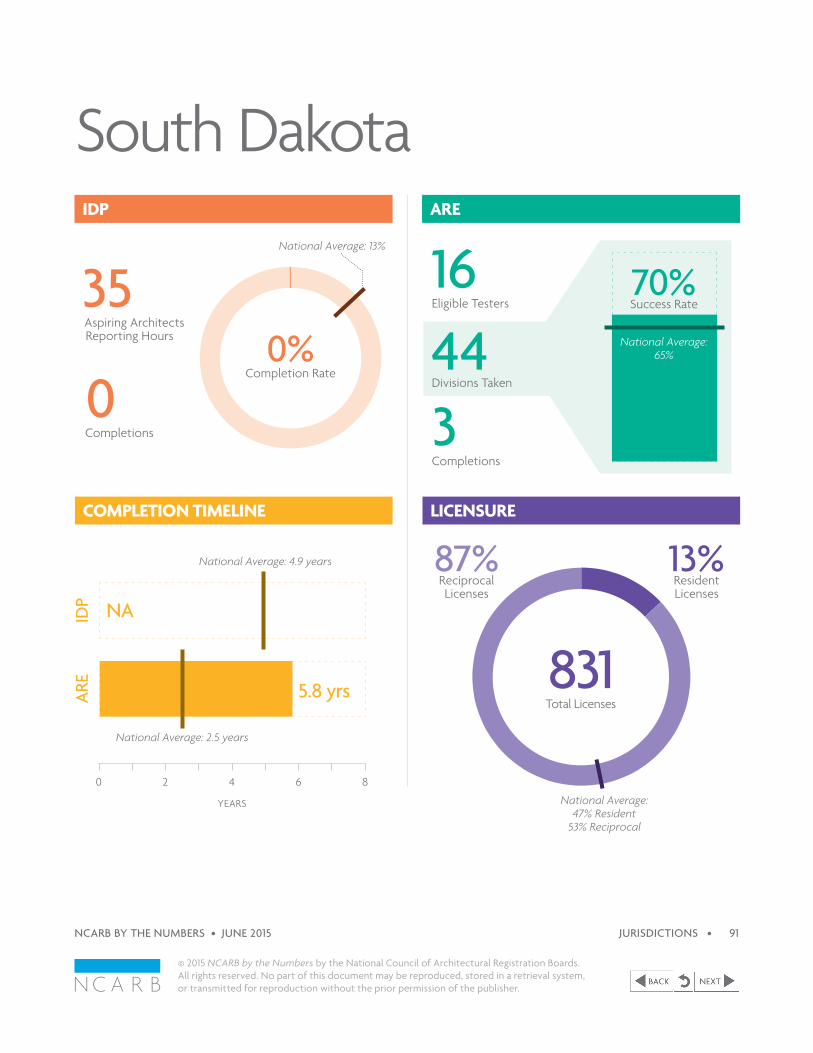
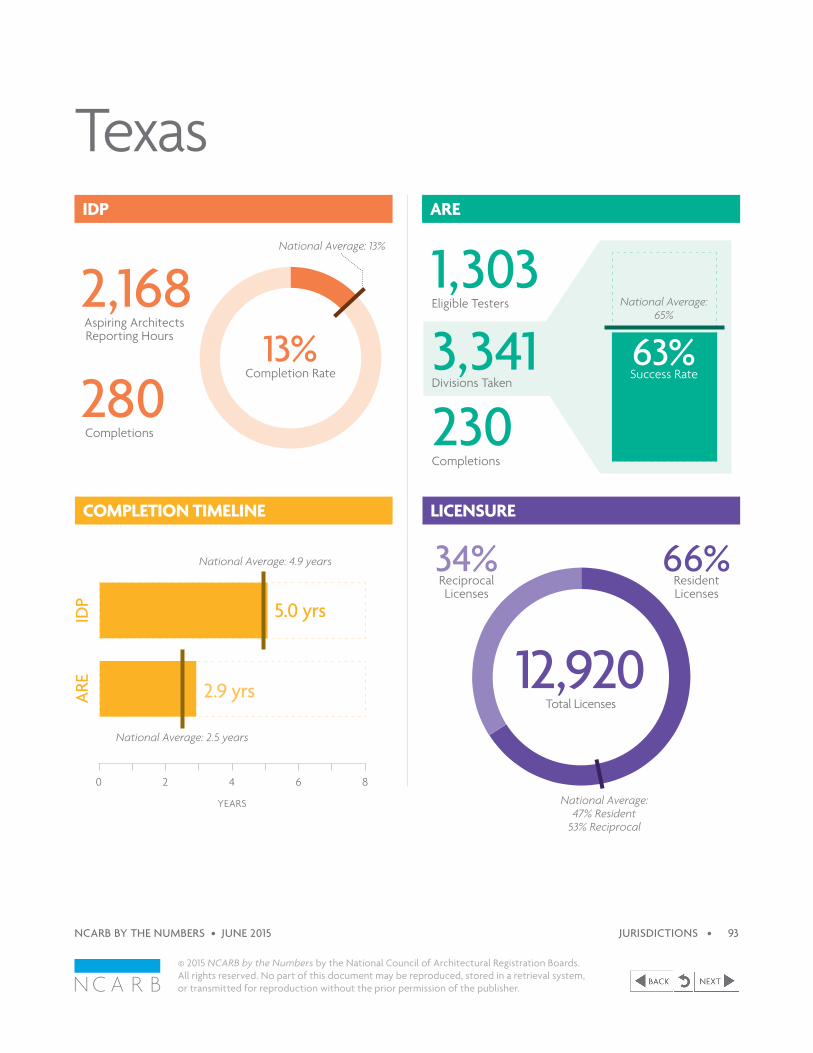
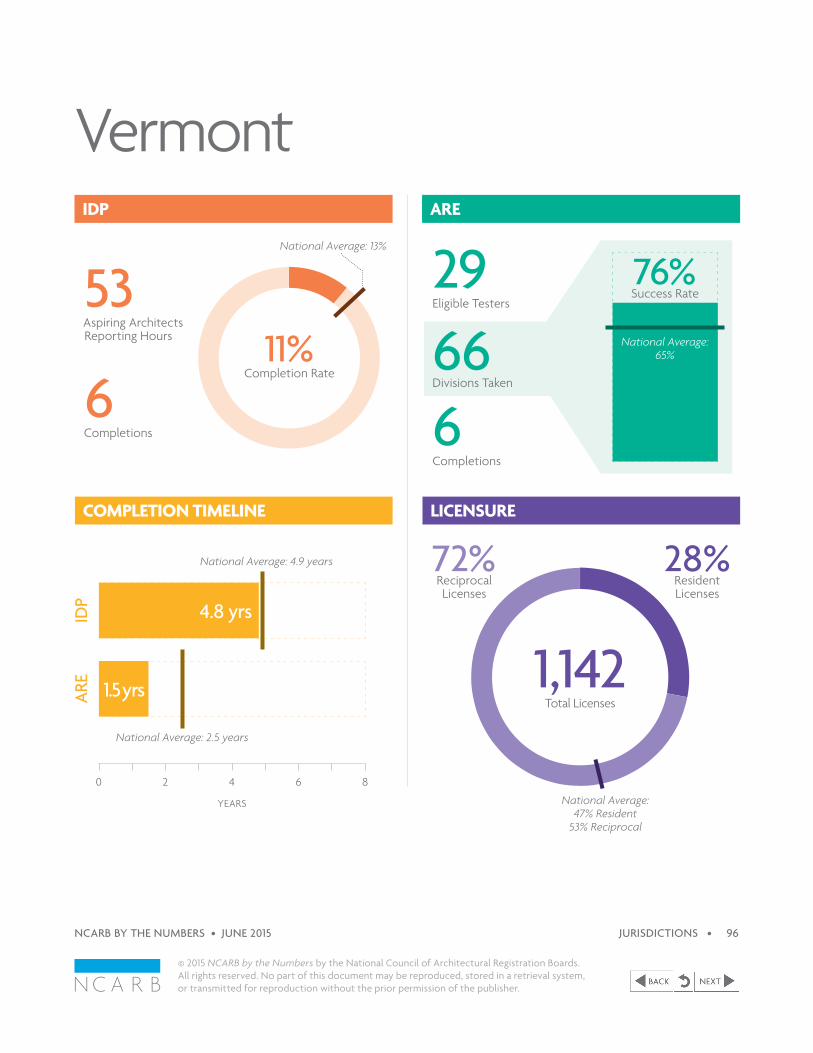
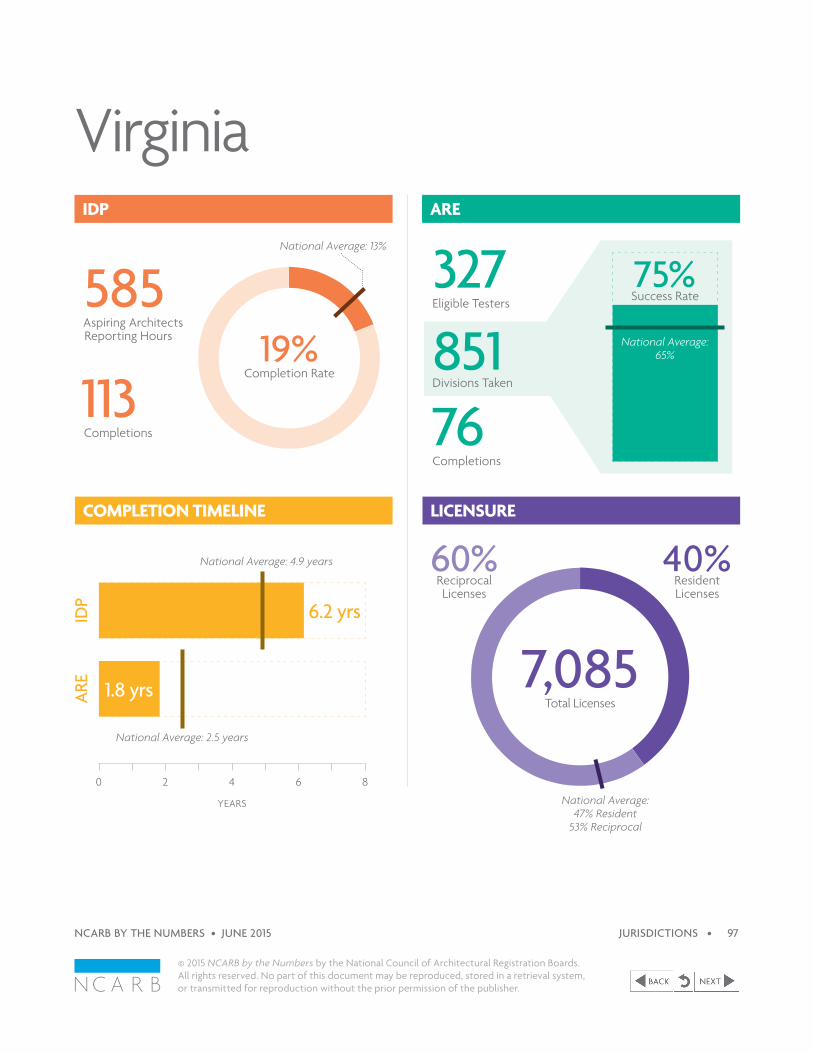
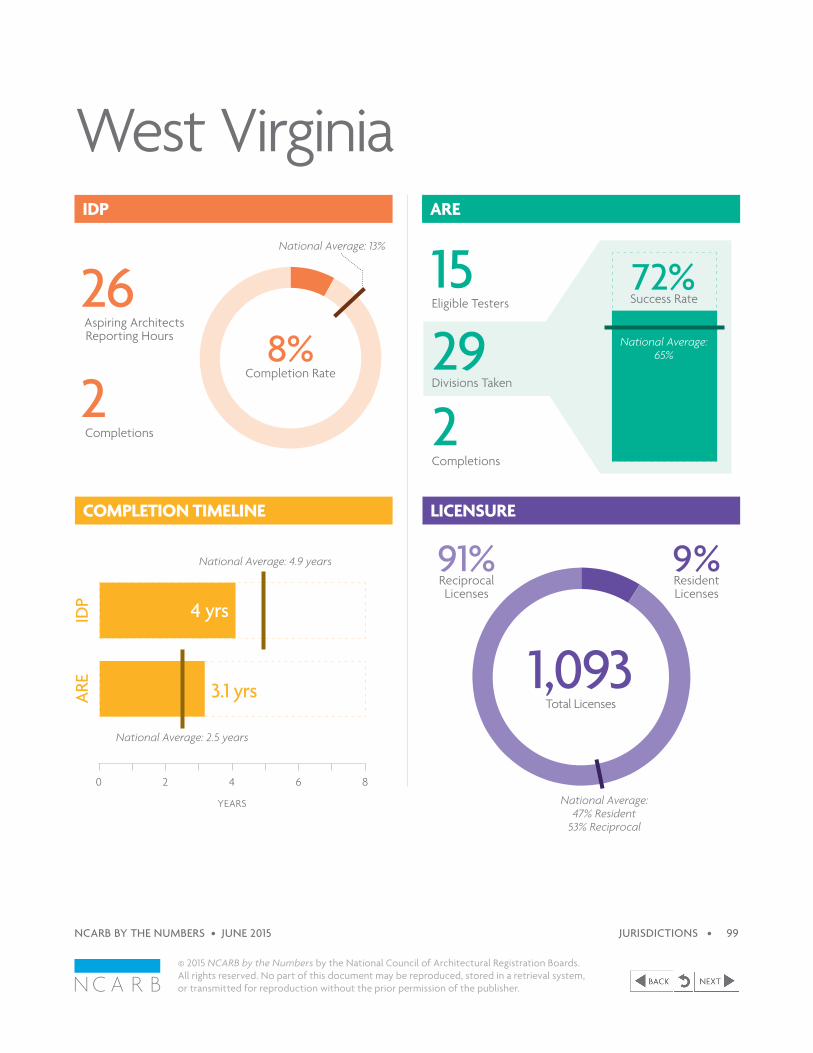
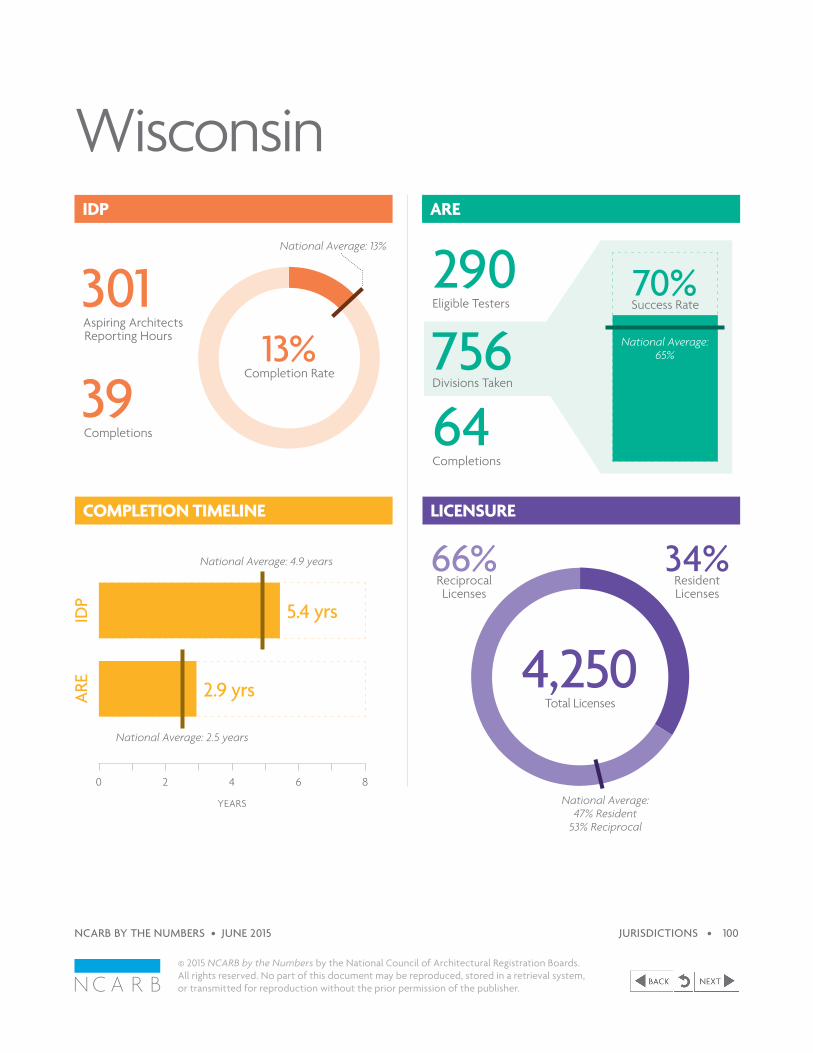
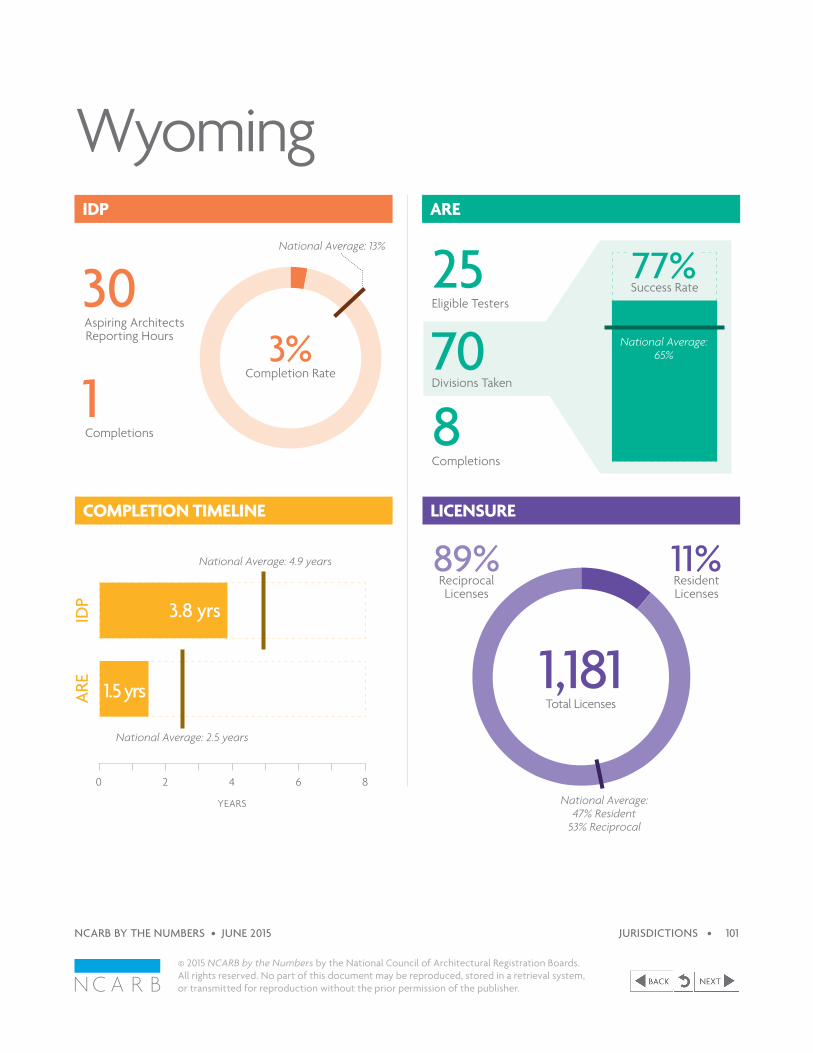
Jurisdictions by the NumbersThe following section includes baseline comparisons for NCARB’s 54 Member Boards, which include all 50 states, the District of Columbia, Guam, Puerto Rico, and the U.S. Virgin Islands. Each page includes a 2014 snapshot of the jurisdiction’s IDP completion rate, ARE divisional success rate, number of licenses, and completion time for the ARE and IDP.
Completion Timeline
IDP
ARE
YEARS
8 6420
4.9Years
2.5Years
ARE Divisional Success Rate
65%Success Rate
IDP Completion Rate
Licensure47%
Resident Licenses
53%Reciprocal Licenses
4,204Licenses Per Jurisdiction
2014 National Averages
13%Completion RateProportion of total
IDP participants who completed in 2014
54 JurisdictionsAlabama ............................................................................................................ 48
Alaska .................................................................................................................. 49
Arizona .............................................................................................................. 50
Arkansas ............................................................................................................ 51
California ......................................................................................................... 52
Colorado .......................................................................................................... 53
Connecticut ................................................................................................. 54
Delaware .......................................................................................................... 55
District of Columbia ........................................................................... 56
Florida ................................................................................................................. 57
Georgia ............................................................................................................. 58
Guam ................................................................................................................... 59
Hawaii ................................................................................................................ 60
Idaho ..................................................................................................................... 61
Illinois .................................................................................................................. 62
Indiana ................................................................................................................ 63
Iowa ..................................................................................................................... 64
Kansas ................................................................................................................. 65
Kentucky ......................................................................................................... 66
Louisiana .......................................................................................................... 67
Maine ................................................................................................................. 68
Maryland ......................................................................................................... 69
Massachusetts ........................................................................................... 70
Michigan ............................................................................................................ 71
Minnesota ...................................................................................................... 72
Mississippi ...................................................................................................... 73
Missouri ............................................................................................................ 74
Montana ........................................................................................................... 75
Nebraska ......................................................................................................... 76
Nevada ............................................................................................................... 77
New Hampshire ....................................................................................... 78
New Jersey ..................................................................................................... 79
New Mexico ................................................................................................ 80
New York ......................................................................................................... 81
North Carolina .......................................................................................... 82
North Dakota ............................................................................................. 83
Ohio ..................................................................................................................... 84
Oklahoma ....................................................................................................... 85
Oregon ............................................................................................................. 86
Pennsylvania ................................................................................................. 87
Puerto Rico .................................................................................................. 88
Rhode Island ............................................................................................... 89
South Carolina .......................................................................................... 90
South Dakota ............................................................................................... 91
Tennessee ....................................................................................................... 92
Texas ..................................................................................................................... 93
U.S. Virgin Islands ................................................................................... 94
Utah ...................................................................................................................... 95
Vermont .......................................................................................................... 96
Virginia ............................................................................................................... 97
Washington ................................................................................................. 98
West Virginia .............................................................................................. 99
Wisconsin .................................................................................................... 100
Wyoming ....................................................................................................... 101
© 2015 NCARB by the Numbers by the National Council of Architectural Registration Boards. All rights reserved. No part of this document may be reproduced, stored in a retrieval system, or transmitted for reproduction without the prior permission of the publisher.
NCARB BY THE NUMBERS • JUNE 2015 47
YEARS
8 6420
251Aspiring Architects Reporting Hours
113Eligible Testers
14Completions 19
Completions
236Divisions Taken
33%Resident Licenses
67%Reciprocal Licenses
5.8 yrs
2.6 yrs
IDP
ARE
Alabama
6%Completion Rate
69%Success Rate
National Average: 4.9 years
National Average: 13%
2,741Total Licenses
National Average:47% Resident
53% Reciprocal
National Average: 65%
© 2015 NCARB by the Numbers by the National Council of Architectural Registration Boards. All rights reserved. No part of this document may be reproduced, stored in a retrieval system, or transmitted for reproduction without the prior permission of the publisher.
NCARB BY THE NUMBERS • JUNE 2015 JURISDICTIONS • 48
IDP
LICENSURECOMPLETION TIMELINE
ARE
National Average: 2.5 years
YEARS
8 6420
168Aspiring Architects Reporting Hours
31Eligible Testers
15Completions 10
Completions
97Divisions Taken
43%Resident Licenses
57%Reciprocal Licenses
IDP
ARE
Alaska
9%Completion Rate
71%Success Rate
5.8 yrs
2.6 yrs
National Average: 4.9 years
National Average: 13%
567Total Licenses
National Average:47% Resident
53% Reciprocal
National Average: 65%
© 2015 NCARB by the Numbers by the National Council of Architectural Registration Boards. All rights reserved. No part of this document may be reproduced, stored in a retrieval system, or transmitted for reproduction without the prior permission of the publisher.
NCARB BY THE NUMBERS • JUNE 2015 JURISDICTIONS • 49
IDP
LICENSURECOMPLETION TIMELINE
ARE
National Average: 2.5 years
YEARS
8 6420
360Aspiring Architects Reporting Hours
318Eligible Testers
68Completions 64
Completions
825Divisions Taken
45%Resident Licenses
55%Reciprocal Licenses
4.9 yrs
3.5 yrs
IDP
ARE
Arizona
19%Completion Rate
67%Success Rate
National Average: 4.9 years
National Average: 13%
4,920Total Licenses
National Average:47% Resident
53% Reciprocal
National Average: 65%
© 2015 NCARB by the Numbers by the National Council of Architectural Registration Boards. All rights reserved. No part of this document may be reproduced, stored in a retrieval system, or transmitted for reproduction without the prior permission of the publisher.
NCARB BY THE NUMBERS • JUNE 2015 JURISDICTIONS • 50
IDP
LICENSURECOMPLETION TIMELINE
ARE
National Average: 2.5 years
YEARS
8 6420
113Aspiring Architects Reporting Hours
83Eligible Testers
15Completions 23
Completions
233Divisions Taken
37%Resident Licenses
63%Reciprocal Licenses
IDP
ARE
Arkansas
13%Completion Rate
71%Success Rate
4.2 yrs
2.5 yrs
National Average: 4.9 years
National Average: 13%
1,345Total Licenses
National Average:47% Resident
53% Reciprocal
National Average: 65%
© 2015 NCARB by the Numbers by the National Council of Architectural Registration Boards. All rights reserved. No part of this document may be reproduced, stored in a retrieval system, or transmitted for reproduction without the prior permission of the publisher.
NCARB BY THE NUMBERS • JUNE 2015 JURISDICTIONS • 51
IDP
LICENSURECOMPLETION TIMELINE
ARE
National Average: 2.5 years
YEARS
8 6420
4,109Aspiring Architects Reporting Hours
3,057Eligible Testers
509Completions 434
Completions
7,108Divisions Taken
National Average: 4.9 years
5 yrs
3.5 yrs
IDP
ARE
CaliforniaNational Average: 13%
National Average: 65%
20,595Total Licenses
National Average:47% Resident
53% Reciprocal
12%Completion Rate 59%
Success Rate
81%Resident Licenses
19%Reciprocal Licenses
© 2015 NCARB by the Numbers by the National Council of Architectural Registration Boards. All rights reserved. No part of this document may be reproduced, stored in a retrieval system, or transmitted for reproduction without the prior permission of the publisher.
NCARB BY THE NUMBERS • JUNE 2015 JURISDICTIONS • 52
IDP
LICENSURECOMPLETION TIMELINE
ARE
National Average: 2.5 years
YEARS
8 6420
5.9 yrs
640Aspiring Architects Reporting Hours
530Eligible Testers
91Completions 125
Completions
1,610Divisions Taken
National Average: 4.9 years
IDP
ARE
ColoradoNational Average: 13%
National Average: 65%
6,704Total Licenses
National Average:47% Resident
53% Reciprocal
14%Completion Rate
73%Success Rate
49%Resident Licenses
51%Reciprocal Licenses
1.7 yrs
© 2015 NCARB by the Numbers by the National Council of Architectural Registration Boards. All rights reserved. No part of this document may be reproduced, stored in a retrieval system, or transmitted for reproduction without the prior permission of the publisher.
NCARB BY THE NUMBERS • JUNE 2015 JURISDICTIONS • 53
IDP
LICENSURECOMPLETION TIMELINE
ARE
National Average: 2.5 years
341Aspiring Architects Reporting Hours
84Eligible Testers
35Completions 25
Completions
208Divisions Taken
34%Resident Licenses
66%Reciprocal Licenses
4.4 yrs
2.3 yrs
IDP
ARE
Connecticut
10%Completion Rate
73%Success Rate
National Average: 4.9 years
National Average: 13%
4,191Total Licenses
National Average:47% Resident
53% Reciprocal
National Average: 65%
© 2015 NCARB by the Numbers by the National Council of Architectural Registration Boards. All rights reserved. No part of this document may be reproduced, stored in a retrieval system, or transmitted for reproduction without the prior permission of the publisher.
NCARB BY THE NUMBERS • JUNE 2015 JURISDICTIONS • 54
IDP
LICENSURECOMPLETION TIMELINE
ARE
National Average: 2.5 years
YEARS
8 6420
14Aspiring Architects Reporting Hours
8Eligible Testers
1Completions 1
Completions
12Divisions Taken
7%Resident Licenses
93%Reciprocal Licenses
IDP
ARE
Delaware
7%Completion Rate
33%Success Rate
16.1 yrs
NA
1612840
YEARS
National Average: 4.9 years
National Average: 2.5 years
National Average: 13%
1,590Total Licenses
National Average:47% Resident
53% Reciprocal
National Average: 65%
© 2015 NCARB by the Numbers by the National Council of Architectural Registration Boards. All rights reserved. No part of this document may be reproduced, stored in a retrieval system, or transmitted for reproduction without the prior permission of the publisher.
NCARB BY THE NUMBERS • JUNE 2015 JURISDICTIONS • 55
IDP
LICENSURECOMPLETION TIMELINE
AREIDP
LICENSURECOMPLETION TIMELINE
ARE
YEARS
8 6420
9+91570Aspiring Architects Reporting Hours
345Eligible Testers
54Completions 84
Completions
973Divisions Taken
19%Resident Licenses
81%Reciprocal Licenses
4.5 yrs
2 yrs
IDP
ARE
District of Columbia
9%Completion Rate
72%Success Rate
National Average: 4.9 years
National Average: 13%
3,215Total Licenses
National Average:47% Resident
53% Reciprocal
National Average: 65%
© 2015 NCARB by the Numbers by the National Council of Architectural Registration Boards. All rights reserved. No part of this document may be reproduced, stored in a retrieval system, or transmitted for reproduction without the prior permission of the publisher.
NCARB BY THE NUMBERS • JUNE 2015 JURISDICTIONS • 56
IDP
LICENSURECOMPLETION TIMELINE
ARE
National Average: 2.5 years
YEARS
8 6420
1,101Aspiring Architects Reporting Hours
735Eligible Testers
148Completions 114
Completions
1,740Divisions Taken
52%Resident Licenses
48%Reciprocal Licenses
Florida
13%Completion Rate 58%
Success Rate
National Average: 13%
9,891Total Licenses
National Average:47% Resident
53% Reciprocal
National Average: 65%
4.5 yrs
National Average: 4.9 years
IDP
ARE
3.8 yrs
© 2015 NCARB by the Numbers by the National Council of Architectural Registration Boards. All rights reserved. No part of this document may be reproduced, stored in a retrieval system, or transmitted for reproduction without the prior permission of the publisher.
NCARB BY THE NUMBERS • JUNE 2015 JURISDICTIONS • 57
IDP
LICENSURECOMPLETION TIMELINE
ARE
National Average: 2.5 years
YEARS
8 6420
591Aspiring Architects Reporting Hours
285Eligible Testers
66Completions 49
Completions
757Divisions Taken
45%Resident Licenses
55%Reciprocal Licenses
4.6 yrs
2.4 yrs
IDP
ARE
Georgia
11%Completion Rate
64%Success Rate
National Average: 4.9 years
National Average: 13%
5,356Total Licenses
National Average:47% Resident
53% Reciprocal
National Average: 65%
© 2015 NCARB by the Numbers by the National Council of Architectural Registration Boards. All rights reserved. No part of this document may be reproduced, stored in a retrieval system, or transmitted for reproduction without the prior permission of the publisher.
NCARB BY THE NUMBERS • JUNE 2015 JURISDICTIONS • 58
IDP
LICENSURECOMPLETION TIMELINE
ARE
National Average: 2.5 years
YEARS
8 6420
4Aspiring Architects Reporting Hours
5Eligible Testers
0Completions 0
Completions
8Divisions Taken
National Average: 4.9 years
NA
NA
IDP
ARE
GuamNational Average: 13%
National Average: 65%
0%Completion Rate
38%Success Rate
30%Resident Licenses
70%Reciprocal Licenses
112Total Licenses
National Average:47% Resident
53% Reciprocal
© 2015 NCARB by the Numbers by the National Council of Architectural Registration Boards. All rights reserved. No part of this document may be reproduced, stored in a retrieval system, or transmitted for reproduction without the prior permission of the publisher.
NCARB BY THE NUMBERS • JUNE 2015 JURISDICTIONS • 59
IDP
LICENSURECOMPLETION TIMELINE
ARE
National Average: 2.5 years
YEARS
8 6420
154Aspiring Architects Reporting Hours
100Eligible Testers
21Completions 22
Completions
242Divisions Taken
44%Resident Licenses
56%Reciprocal Licenses
5.5 yrs
2 yrs
IDP
ARE
Hawaii
14%Completion Rate
65%Success Rate
National Average: 4.9 years
National Average: 13%
2,263Total Licenses
National Average:47% Resident
53% Reciprocal
National Average: 65%
© 2015 NCARB by the Numbers by the National Council of Architectural Registration Boards. All rights reserved. No part of this document may be reproduced, stored in a retrieval system, or transmitted for reproduction without the prior permission of the publisher.
NCARB BY THE NUMBERS • JUNE 2015 JURISDICTIONS • 60
IDP
LICENSURECOMPLETION TIMELINE
ARE
National Average: 2.5 years
YEARS
8 6420
16+8430+70
88Aspiring Architects Reporting Hours
41Eligible Testers
14Completions 17
Completions
105Divisions Taken
30%Resident Licenses
70%Reciprocal Licenses
Idaho
16%Completion Rate
76%Success Rate
National Average: 13%
1,666Total Licenses
National Average:47% Resident
53% Reciprocal
National Average: 65%
4.9 yrs
National Average: 4.9 years
IDP
ARE
1.9 yrs
© 2015 NCARB by the Numbers by the National Council of Architectural Registration Boards. All rights reserved. No part of this document may be reproduced, stored in a retrieval system, or transmitted for reproduction without the prior permission of the publisher.
NCARB BY THE NUMBERS • JUNE 2015 JURISDICTIONS • 61
IDP
LICENSURECOMPLETION TIMELINE
ARE
National Average: 2.5 years
YEARS
8 6420 59+4114+861,437
Aspiring Architects Reporting Hours
896Eligible Testers
202Completions 231
Completions
2,341Divisions Taken
59%Resident Licenses
41%Reciprocal Licenses
5.3 yrs
2.2 yrs
IDP
ARE
Illinois
14%Completion Rate
71%Success Rate
National Average: 4.9 years
National Average: 13%
9,046Total Licenses
National Average:47% Resident
53% Reciprocal
National Average: 65%
© 2015 NCARB by the Numbers by the National Council of Architectural Registration Boards. All rights reserved. No part of this document may be reproduced, stored in a retrieval system, or transmitted for reproduction without the prior permission of the publisher.
NCARB BY THE NUMBERS • JUNE 2015 JURISDICTIONS • 62
IDP
LICENSURECOMPLETION TIMELINE
ARE
National Average: 2.5 years
YEARS
8 6420
14+8631+69
209Aspiring Architects Reporting Hours
108Eligible Testers
29Completions 28
Completions
272Divisions Taken
31%Resident Licenses
69%Reciprocal Licenses
Indiana
14%Completion Rate
74%Success Rate
National Average: 13%
3,291Total Licenses
National Average:47% Resident
53% Reciprocal
National Average: 65%
5.9 yrs
National Average: 4.9 years
IDP
ARE
2.2 yrs
© 2015 NCARB by the Numbers by the National Council of Architectural Registration Boards. All rights reserved. No part of this document may be reproduced, stored in a retrieval system, or transmitted for reproduction without the prior permission of the publisher.
NCARB BY THE NUMBERS • JUNE 2015 JURISDICTIONS • 63
IDP
LICENSURECOMPLETION TIMELINE
ARE
National Average: 2.5 years
YEARS
8 6420 29+7112+88202
Aspiring Architects Reporting Hours
119Eligible Testers
24Completions 29
Completions
281Divisions Taken
29%Resident Licenses
71%Reciprocal Licenses
5.2 yrs
2.4 yrs
IDP
ARE
Iowa
12%Completion Rate
75%Success Rate
National Average: 4.9 years
National Average: 13%
1,974Total Licenses
National Average:47% Resident
53% Reciprocal
National Average: 65%
© 2015 NCARB by the Numbers by the National Council of Architectural Registration Boards. All rights reserved. No part of this document may be reproduced, stored in a retrieval system, or transmitted for reproduction without the prior permission of the publisher.
NCARB BY THE NUMBERS • JUNE 2015 JURISDICTIONS • 64
IDP
LICENSURECOMPLETION TIMELINE
ARE
National Average: 2.5 years
YEARS
8 6420
14+8636+64
202Aspiring Architects Reporting Hours
152Eligible Testers
28Completions 38
Completions
401Divisions Taken
36%Resident Licenses
64%Reciprocal Licenses
Kansas
14%Completion Rate
76%Success Rate
National Average: 13%
2,647Total Licenses
National Average:47% Resident
53% Reciprocal
National Average: 65%
6 yrs
National Average: 4.9 years
IDP
ARE
3.6 yrs
© 2015 NCARB by the Numbers by the National Council of Architectural Registration Boards. All rights reserved. No part of this document may be reproduced, stored in a retrieval system, or transmitted for reproduction without the prior permission of the publisher.
NCARB BY THE NUMBERS • JUNE 2015 JURISDICTIONS • 65
IDP
LICENSURECOMPLETION TIMELINE
ARE
National Average: 2.5 years
YEARS
8 6420 29+7114+86118
Aspiring Architects Reporting Hours
67Eligible Testers
17Completions 16
Completions
164Divisions Taken
29%Resident Licenses
71%Reciprocal Licenses
5.2 yrs
3 yrs
IDP
ARE
Kentucky
14%Completion Rate
65%Success Rate
National Average: 4.9 years
National Average: 13%
2,523Total Licenses
National Average:47% Resident
53% Reciprocal
National Average: 65%
© 2015 NCARB by the Numbers by the National Council of Architectural Registration Boards. All rights reserved. No part of this document may be reproduced, stored in a retrieval system, or transmitted for reproduction without the prior permission of the publisher.
NCARB BY THE NUMBERS • JUNE 2015 JURISDICTIONS • 66
IDP
LICENSURECOMPLETION TIMELINE
ARE
National Average: 2.5 years
YEARS
8 6420
17+8337+63
325Aspiring Architects Reporting Hours
267Eligible Testers
55Completions 59
Completions
636Divisions Taken
37%Resident Licenses
63%Reciprocal Licenses
Louisiana
17%Completion Rate
71%Success Rate
National Average: 13%
3,257Total Licenses
National Average:47% Resident
53% Reciprocal
National Average: 65%
5.3 yrs
National Average: 4.9 years
IDP
ARE
2.5 yrs
© 2015 NCARB by the Numbers by the National Council of Architectural Registration Boards. All rights reserved. No part of this document may be reproduced, stored in a retrieval system, or transmitted for reproduction without the prior permission of the publisher.
NCARB BY THE NUMBERS • JUNE 2015 JURISDICTIONS • 67
IDP
LICENSURECOMPLETION TIMELINE
ARE
National Average: 2.5 years
YEARS
8 6420 28+7219+8153
Aspiring Architects Reporting Hours
37Eligible Testers
10Completions 12
Completions
91Divisions Taken
28%Resident Licenses
72%Reciprocal Licenses
4.7 yrs
3.1 yrs
IDP
ARE
Maine
19%Completion Rate
75%Success Rate
National Average: 4.9 years
National Average: 13%
1,503Total Licenses
National Average:47% Resident
53% Reciprocal
National Average: 65%
© 2015 NCARB by the Numbers by the National Council of Architectural Registration Boards. All rights reserved. No part of this document may be reproduced, stored in a retrieval system, or transmitted for reproduction without the prior permission of the publisher.
NCARB BY THE NUMBERS • JUNE 2015 JURISDICTIONS • 68
IDP
LICENSURECOMPLETION TIMELINE
ARE
National Average: 2.5 years
YEARS
8 6420
16+8441+59
486Aspiring Architects Reporting Hours
354Eligible Testers
78Completions 89
Completions
957Divisions Taken
41%Resident Licenses
59%Reciprocal Licenses
Maryland
16%Completion Rate
69%Success Rate
National Average: 13%
6,448Total Licenses
National Average:47% Resident
53% Reciprocal
National Average: 65%
5.5 yrs
National Average: 4.9 years
IDP
ARE
2.4 yrs
© 2015 NCARB by the Numbers by the National Council of Architectural Registration Boards. All rights reserved. No part of this document may be reproduced, stored in a retrieval system, or transmitted for reproduction without the prior permission of the publisher.
NCARB BY THE NUMBERS • JUNE 2015 JURISDICTIONS • 69
IDP
LICENSURECOMPLETION TIMELINE
ARE
National Average: 2.5 years
YEARS
8 6420 56+4412+881,369
Aspiring Architects Reporting Hours
822Eligible Testers
163Completions 185
Completions
2,140Divisions Taken
56%Resident Licenses
44%Reciprocal Licenses
5 yrs
2.3 yrs
IDP
ARE
Massachusetts
12%Completion Rate
71%Success Rate
National Average: 4.9 years
National Average: 13%
6,710Total Licenses
National Average:47% Resident
53% Reciprocal
National Average: 65%
© 2015 NCARB by the Numbers by the National Council of Architectural Registration Boards. All rights reserved. No part of this document may be reproduced, stored in a retrieval system, or transmitted for reproduction without the prior permission of the publisher.
NCARB BY THE NUMBERS • JUNE 2015 JURISDICTIONS • 70
IDP
LICENSURECOMPLETION TIMELINE
ARE
National Average: 2.5 years
YEARS
8 6420
438Aspiring Architects Reporting Hours
209Eligible Testers
49Completions 43
Completions
518Divisions Taken
45%Resident Licenses
55%Reciprocal Licenses
4.8 yrs
2.4 yrs
IDP
ARE
Michigan
11%Completion Rate
69%Success Rate
National Average: 4.9 years
National Average: 13%
National Average: 65%
5,683Total Licenses
National Average:47% Resident
53% Reciprocal
© 2015 NCARB by the Numbers by the National Council of Architectural Registration Boards. All rights reserved. No part of this document may be reproduced, stored in a retrieval system, or transmitted for reproduction without the prior permission of the publisher.
NCARB BY THE NUMBERS • JUNE 2015 JURISDICTIONS • 71
IDP
LICENSURECOMPLETION TIMELINE
ARE
National Average: 2.5 years
YEARS
8 6420 57+4313+87448
Aspiring Architects Reporting Hours
222Eligible Testers
60Completions 58
Completions
596Divisions Taken
57%Resident Licenses
43%Reciprocal Licenses
5.4 yrsIDP
ARE
Minnesota
13%Completion Rate
78%Success Rate
National Average: 4.9 years
National Average: 13%
3,209Total Licenses
National Average:47% Resident
53% Reciprocal
1.8 yrs
National Average: 65%
© 2015 NCARB by the Numbers by the National Council of Architectural Registration Boards. All rights reserved. No part of this document may be reproduced, stored in a retrieval system, or transmitted for reproduction without the prior permission of the publisher.
NCARB BY THE NUMBERS • JUNE 2015 JURISDICTIONS • 72
IDP
LICENSURECOMPLETION TIMELINE
ARE
National Average: 2.5 years
YEARS
8 6420
10+9020+80
71Aspiring Architects Reporting Hours
60Eligible Testers
7Completions 12
Completions
157Divisions Taken
20%Resident Licenses
80%Reciprocal Licenses
Mississippi
10%Completion Rate
64%Success Rate
National Average: 13%
1,764Total Licenses
National Average:47% Resident
53% Reciprocal
National Average: 65%
5.2 yrs
National Average: 4.9 years
IDP
ARE
2.3 yrs
© 2015 NCARB by the Numbers by the National Council of Architectural Registration Boards. All rights reserved. No part of this document may be reproduced, stored in a retrieval system, or transmitted for reproduction without the prior permission of the publisher.
NCARB BY THE NUMBERS • JUNE 2015 JURISDICTIONS • 73
IDP
LICENSURECOMPLETION TIMELINE
ARE
National Average: 2.5 years
YEARS
8 6420 40+6013+87542
Aspiring Architects Reporting Hours
366Eligible Testers
68Completions 104
Completions
1,038Divisions Taken
40%Resident Licenses
60%Reciprocal Licenses
6.7 yrsIDP
ARE
Missouri
13%Completion Rate
74%Success Rate
National Average: 4.9 years
National Average: 13%
5,125Total Licenses
National Average:47% Resident
53% Reciprocal
2.7 yrs
National Average: 65%
© 2015 NCARB by the Numbers by the National Council of Architectural Registration Boards. All rights reserved. No part of this document may be reproduced, stored in a retrieval system, or transmitted for reproduction without the prior permission of the publisher.
NCARB BY THE NUMBERS • JUNE 2015 JURISDICTIONS • 74
IDP
LICENSURECOMPLETION TIMELINE
ARE
National Average: 2.5 years
YEARS
8 6420
6+9431+69
112Aspiring Architects Reporting Hours
65Eligible Testers
7Completions 17
Completions
177Divisions Taken
31%Resident Licenses
69%Reciprocal Licenses
Montana
6%Completion Rate
72%Success Rate
National Average: 13%
1,372Total Licenses
National Average:47% Resident
53% Reciprocal
National Average: 65%
5.5 yrs
National Average: 4.9 years
IDP
ARE
2.4 yrs
© 2015 NCARB by the Numbers by the National Council of Architectural Registration Boards. All rights reserved. No part of this document may be reproduced, stored in a retrieval system, or transmitted for reproduction without the prior permission of the publisher.
NCARB BY THE NUMBERS • JUNE 2015 JURISDICTIONS • 75
IDP
LICENSURECOMPLETION TIMELINE
ARE
National Average: 2.5 years
YEARS
8 6420 30+7017+83105
Aspiring Architects Reporting Hours
80Eligible Testers
18Completions 20
Completions
195Divisions Taken
30%Resident Licenses
70%Reciprocal Licenses
4.4 yrsIDP
ARE
Nebraska
17%Completion Rate
79%Success Rate
National Average: 4.9 years
National Average: 13%
1,784Total Licenses
National Average:47% Resident
53% Reciprocal
National Average: 65%
2.1 yrs
© 2015 NCARB by the Numbers by the National Council of Architectural Registration Boards. All rights reserved. No part of this document may be reproduced, stored in a retrieval system, or transmitted for reproduction without the prior permission of the publisher.
NCARB BY THE NUMBERS • JUNE 2015 JURISDICTIONS • 76
IDP
LICENSURECOMPLETION TIMELINE
ARE
National Average: 2.5 years
YEARS
8 6420
8+9224+76
125Aspiring Architects Reporting Hours
47Eligible Testers
10Completions 5
Completions
103Divisions Taken
24%Resident Licenses
76%Reciprocal Licenses
Nevada
8%Completion Rate 55%
Success Rate
National Average: 13%
2,921Total Licenses
National Average:47% Resident
53% Reciprocal
National Average: 65%
4.8 yrs
National Average: 4.9 years
IDP
ARE
2.9 yrs
© 2015 NCARB by the Numbers by the National Council of Architectural Registration Boards. All rights reserved. No part of this document may be reproduced, stored in a retrieval system, or transmitted for reproduction without the prior permission of the publisher.
NCARB BY THE NUMBERS • JUNE 2015 JURISDICTIONS • 77
IDP
LICENSURECOMPLETION TIMELINE
ARE
National Average: 2.5 years
YEARS
8 6420 17+8320+8055
Aspiring Architects Reporting Hours
33Eligible Testers
11Completions 8
Completions
87Divisions Taken
17%Resident Licenses
83%Reciprocal Licenses
6.5 yrsIDP
ARE
New Hampshire
20%Completion Rate
77%Success Rate
National Average: 4.9 years
National Average: 13%
1,822Total Licenses
National Average:47% Resident
53% Reciprocal
National Average: 65%
1.7 yrs
© 2015 NCARB by the Numbers by the National Council of Architectural Registration Boards. All rights reserved. No part of this document may be reproduced, stored in a retrieval system, or transmitted for reproduction without the prior permission of the publisher.
NCARB BY THE NUMBERS • JUNE 2015 JURISDICTIONS • 78
IDP
LICENSURECOMPLETION TIMELINE
ARE
National Average: 2.5 years
YEARS
8 6420
20+8042+58
637Aspiring Architects Reporting Hours
206Eligible Testers
129Completions 39
Completions
544Divisions Taken
42%Resident Licenses
58%Reciprocal Licenses
New Jersey
20%Completion Rate 60%
Success Rate
National Average: 13%
8,064Total Licenses
National Average:47% Resident
53% Reciprocal
National Average: 65%
4.4 yrs
National Average: 4.9 years
IDP
ARE
2.5 yrs
© 2015 NCARB by the Numbers by the National Council of Architectural Registration Boards. All rights reserved. No part of this document may be reproduced, stored in a retrieval system, or transmitted for reproduction without the prior permission of the publisher.
NCARB BY THE NUMBERS • JUNE 2015 JURISDICTIONS • 79
IDP
LICENSURECOMPLETION TIMELINE
ARE
National Average: 2.5 years
YEARS
8 6420 32+6818+8295
Aspiring Architects Reporting Hours
80Eligible Testers
17Completions 18
Completions
212Divisions Taken
32%Resident Licenses
68%Reciprocal Licenses
5.3 yrsIDP
ARE
New Mexico
18%Completion Rate
69%Success Rate
National Average: 4.9 years
National Average: 13%
2,100Total Licenses
National Average:47% Resident
53% Reciprocal
National Average: 65%
2.6 yrs
© 2015 NCARB by the Numbers by the National Council of Architectural Registration Boards. All rights reserved. No part of this document may be reproduced, stored in a retrieval system, or transmitted for reproduction without the prior permission of the publisher.
NCARB BY THE NUMBERS • JUNE 2015 JURISDICTIONS • 80
IDP
LICENSURECOMPLETION TIMELINE
ARE
National Average: 2.5 years
YEARS
8 6420
12+8859+41
4,316Aspiring Architects Reporting Hours
2,898Eligible Testers
515Completions 588
Completions
7,662Divisions Taken
59%Resident Licenses
41%Reciprocal Licenses
New York
12%Completion Rate
64%Success Rate
National Average: 13%
16,809Total Licenses
National Average:47% Resident
53% Reciprocal
National Average: 65%
4.5 yrs
National Average: 4.9 years
IDP
ARE
2.4 yrs
© 2015 NCARB by the Numbers by the National Council of Architectural Registration Boards. All rights reserved. No part of this document may be reproduced, stored in a retrieval system, or transmitted for reproduction without the prior permission of the publisher.
NCARB BY THE NUMBERS • JUNE 2015 JURISDICTIONS • 81
IDP
LICENSURECOMPLETION TIMELINE
ARE
National Average: 2.5 years
YEARS
8 6420 44+5611+89415
Aspiring Architects Reporting Hours
241Eligible Testers
44Completions 55
Completions
615Divisions Taken
44%Resident Licenses
56%Reciprocal Licenses
5.7 yrsIDP
ARE
North Carolina
11%Completion Rate
71%Success Rate
National Average: 4.9 years
National Average: 13%
5,225Total Licenses
National Average:47% Resident
53% Reciprocal
National Average: 65%
1.8 yrs
© 2015 NCARB by the Numbers by the National Council of Architectural Registration Boards. All rights reserved. No part of this document may be reproduced, stored in a retrieval system, or transmitted for reproduction without the prior permission of the publisher.
NCARB BY THE NUMBERS • JUNE 2015 JURISDICTIONS • 82
IDP
LICENSURECOMPLETION TIMELINE
ARE
National Average: 2.5 years
YEARS
8 6420
7+9314+86
102Aspiring Architects Reporting Hours
42Eligible Testers
7Completions 6
Completions
116Divisions Taken
14%Resident Licenses
86%Reciprocal Licenses
North Dakota
7%Completion Rate
72%Success Rate
National Average: 13%
1,154Total Licenses
National Average:47% Resident
53% Reciprocal
National Average: 65%
2.9 yrs
National Average: 4.9 years
IDP
ARE
1 yr
© 2015 NCARB by the Numbers by the National Council of Architectural Registration Boards. All rights reserved. No part of this document may be reproduced, stored in a retrieval system, or transmitted for reproduction without the prior permission of the publisher.
NCARB BY THE NUMBERS • JUNE 2015 JURISDICTIONS • 83
IDP
LICENSURECOMPLETION TIMELINE
ARE
National Average: 2.5 years
YEARS
8 6420 44+5612+88641
Aspiring Architects Reporting Hours
319Eligible Testers
75Completions 80
Completions
764Divisions Taken
51%Resident Licenses
49%Reciprocal Licenses
5.7 yrsIDP
ARE
Ohio
12%Completion Rate
74%Success Rate
National Average: 4.9 years
National Average: 13%
6,314Total Licenses
National Average:47% Resident
53% Reciprocal
National Average: 65%
2.8 yrs
© 2015 NCARB by the Numbers by the National Council of Architectural Registration Boards. All rights reserved. No part of this document may be reproduced, stored in a retrieval system, or transmitted for reproduction without the prior permission of the publisher.
NCARB BY THE NUMBERS • JUNE 2015 JURISDICTIONS • 84
IDP
LICENSURECOMPLETION TIMELINE
ARE
National Average: 2.5 years
YEARS
8 6420
17+8336+64
184Aspiring Architects Reporting Hours
135Eligible Testers
31Completions 24
Completions
329Divisions Taken
36%Resident Licenses
64%Reciprocal Licenses
Oklahoma
17%Completion Rate
66%Success Rate
National Average: 13%
2,228Total Licenses
National Average:47% Resident
53% Reciprocal
National Average: 65%
5.2 yrs
National Average: 4.9 years
IDP
ARE
2.8 yrs
© 2015 NCARB by the Numbers by the National Council of Architectural Registration Boards. All rights reserved. No part of this document may be reproduced, stored in a retrieval system, or transmitted for reproduction without the prior permission of the publisher.
NCARB BY THE NUMBERS • JUNE 2015 JURISDICTIONS • 85
IDP
LICENSURECOMPLETION TIMELINE
ARE
National Average: 2.5 years
YEARS
8 6420 56+4412+88427
Aspiring Architects Reporting Hours
256Eligible Testers
53Completions 72
Completions
693Divisions Taken
56%Resident Licenses
44%Reciprocal Licenses
5.7 yrsIDP
ARE
Oregon
12%Completion Rate
80%Success Rate
National Average: 4.9 years
National Average: 13%
3,021Total Licenses
National Average:47% Resident
53% Reciprocal
National Average: 65%
1.8 yrs
© 2015 NCARB by the Numbers by the National Council of Architectural Registration Boards. All rights reserved. No part of this document may be reproduced, stored in a retrieval system, or transmitted for reproduction without the prior permission of the publisher.
NCARB BY THE NUMBERS • JUNE 2015 JURISDICTIONS • 86
IDP
LICENSURECOMPLETION TIMELINE
ARE
National Average: 2.5 years
YEARS
8 6420
16+8446+54
844Aspiring Architects Reporting Hours
624Eligible Testers
135Completions 144
Completions
1,564Divisions Taken
46%Resident Licenses
54%Reciprocal Licenses
Pennsylvania
16%Completion Rate
74%Success Rate
National Average: 13%
7,865Total Licenses
National Average:47% Resident
53% Reciprocal
National Average: 65%
5.4 yrs
National Average: 4.9 years
IDP
ARE
2.3 yrs
© 2015 NCARB by the Numbers by the National Council of Architectural Registration Boards. All rights reserved. No part of this document may be reproduced, stored in a retrieval system, or transmitted for reproduction without the prior permission of the publisher.
NCARB BY THE NUMBERS • JUNE 2015 JURISDICTIONS • 87
IDP
LICENSURECOMPLETION TIMELINE
ARE
National Average: 2.5 years
YEARS
8 6420 85+159+91112
Aspiring Architects Reporting Hours
143Eligible Testers
10Completions 17
Completions
271Divisions Taken
85%Resident Licenses
15%Reciprocal Licenses
4 yrsIDP
ARE
Puerto Rico
9%Completion Rate 53%
Success Rate
National Average: 4.9 years
National Average: 13%
659Total Licenses
National Average:47% Resident
53% Reciprocal
National Average: 65%
5.2 yrs
© 2015 NCARB by the Numbers by the National Council of Architectural Registration Boards. All rights reserved. No part of this document may be reproduced, stored in a retrieval system, or transmitted for reproduction without the prior permission of the publisher.
NCARB BY THE NUMBERS • JUNE 2015 JURISDICTIONS • 88
IDP
LICENSURECOMPLETION TIMELINE
ARE
National Average: 2.5 years
YEARS
8 6420
15+8519+81
88Aspiring Architects Reporting Hours
36Eligible Testers
13Completions 7
Completions
108Divisions Taken
19%Resident Licenses
81%Reciprocal Licenses
Rhode Island
15%Completion Rate
64%Success Rate
National Average: 13%
1,420Total Licenses
National Average:47% Resident
53% Reciprocal
National Average: 65%
4.5 yrs
National Average: 4.9 years
IDP
ARE
2.2 yrs
© 2015 NCARB by the Numbers by the National Council of Architectural Registration Boards. All rights reserved. No part of this document may be reproduced, stored in a retrieval system, or transmitted for reproduction without the prior permission of the publisher.
NCARB BY THE NUMBERS • JUNE 2015 JURISDICTIONS • 89
IDP
LICENSURECOMPLETION TIMELINE
ARE
National Average: 2.5 years
YEARS
8 6420 28+7215+85187
Aspiring Architects Reporting Hours
124Eligible Testers
28Completions 26
Completions
331Divisions Taken
28%Resident Licenses
72%Reciprocal Licenses
6.1 yrsIDP
ARE
South Carolina
15%Completion Rate
69%Success Rate
National Average: 4.9 years
National Average: 13%
3,859Total Licenses
National Average:47% Resident
53% Reciprocal
National Average: 65%
2.1 yrs
© 2015 NCARB by the Numbers by the National Council of Architectural Registration Boards. All rights reserved. No part of this document may be reproduced, stored in a retrieval system, or transmitted for reproduction without the prior permission of the publisher.
NCARB BY THE NUMBERS • JUNE 2015 JURISDICTIONS • 90
IDP
LICENSURECOMPLETION TIMELINE
ARE
National Average: 2.5 years
YEARS
8 6420
0+10013+87
35Aspiring Architects Reporting Hours
16Eligible Testers
0Completions 3
Completions
44Divisions Taken
13%Resident Licenses
87%Reciprocal Licenses
South Dakota
0%Completion Rate
70%Success Rate
National Average: 13%
831Total Licenses
National Average:47% Resident
53% Reciprocal
National Average: 65%
NA
National Average: 4.9 years
IDP
ARE
5.8 yrs
© 2015 NCARB by the Numbers by the National Council of Architectural Registration Boards. All rights reserved. No part of this document may be reproduced, stored in a retrieval system, or transmitted for reproduction without the prior permission of the publisher.
NCARB BY THE NUMBERS • JUNE 2015 JURISDICTIONS • 91
IDP
LICENSURECOMPLETION TIMELINE
ARE
National Average: 2.5 years
YEARS
8 6420 40+6013+87293
Aspiring Architects Reporting Hours
139Eligible Testers
39Completions 33
Completions
391Divisions Taken
40%Resident Licenses
60%Reciprocal Licenses
4.4 yrsIDP
ARE
Tennessee
13%Completion Rate
73%Success Rate
National Average: 4.9 years
National Average: 13%
3,790Total Licenses
National Average:47% Resident
53% Reciprocal
National Average: 65%
1.7 yrs
© 2015 NCARB by the Numbers by the National Council of Architectural Registration Boards. All rights reserved. No part of this document may be reproduced, stored in a retrieval system, or transmitted for reproduction without the prior permission of the publisher.
NCARB BY THE NUMBERS • JUNE 2015 JURISDICTIONS • 92
IDP
LICENSURECOMPLETION TIMELINE
ARE
National Average: 2.5 years
YEARS
8 6420
13+8766+34
2,168Aspiring Architects Reporting Hours
1,303Eligible Testers
280Completions 230
Completions
3,341Divisions Taken
66%Resident Licenses
34%Reciprocal Licenses
Texas
13%Completion Rate
63%Success Rate
National Average: 13%
12,920Total Licenses
National Average:47% Resident
53% Reciprocal
National Average: 65%
5.0 yrs
National Average: 4.9 years
IDP
ARE
2.9 yrs
© 2015 NCARB by the Numbers by the National Council of Architectural Registration Boards. All rights reserved. No part of this document may be reproduced, stored in a retrieval system, or transmitted for reproduction without the prior permission of the publisher.
NCARB BY THE NUMBERS • JUNE 2015 JURISDICTIONS • 93
IDP
LICENSURECOMPLETION TIMELINE
ARE
National Average: 2.5 years
YEARS
8 6420 15+850+1004
Aspiring Architects Reporting Hours
1Eligible Testers
0Completions 0
Completions
2Divisions Taken
15%Resident Licenses
85%Reciprocal Licenses
IDP
ARE
U.S. Virgin Islands
0%Completion Rate 50%
Success Rate
NA
NA
National Average: 4.9 years
National Average: 13%
1,111Total Licenses
National Average:47% Resident
53% Reciprocal
National Average: 65%
© 2015 NCARB by the Numbers by the National Council of Architectural Registration Boards. All rights reserved. No part of this document may be reproduced, stored in a retrieval system, or transmitted for reproduction without the prior permission of the publisher.
NCARB BY THE NUMBERS • JUNE 2015 JURISDICTIONS • 94
IDP
LICENSURECOMPLETION TIMELINE
ARE
National Average: 2.5 years
YEARS
8 6420
187Aspiring Architects Reporting Hours
143Eligible Testers
34Completions 39
Completions
373Divisions Taken
34%Resident Licenses
66%Reciprocal Licenses
IDP
ARE
Utah
18%Completion Rate
72%Success Rate
4.9 yrs
2.3 yrs
National Average: 4.9 years
National Average: 13%
2,379Total Licenses
National Average:47% Resident
53% Reciprocal
National Average: 65%
© 2015 NCARB by the Numbers by the National Council of Architectural Registration Boards. All rights reserved. No part of this document may be reproduced, stored in a retrieval system, or transmitted for reproduction without the prior permission of the publisher.
NCARB BY THE NUMBERS • JUNE 2015 JURISDICTIONS • 95
IDP
LICENSURECOMPLETION TIMELINE
ARE
National Average: 2.5 years
YEARS
8 6420 28+7211+8953
Aspiring Architects Reporting Hours
29Eligible Testers
6Completions 6
Completions
66Divisions Taken
28%Resident Licenses
72%Reciprocal Licenses
4.8 yrsIDP
ARE
Vermont
11%Completion Rate
76%Success Rate
National Average: 4.9 years
National Average: 13%
1,142Total Licenses
National Average:47% Resident
53% Reciprocal
National Average: 65%
1.5 yrs
© 2015 NCARB by the Numbers by the National Council of Architectural Registration Boards. All rights reserved. No part of this document may be reproduced, stored in a retrieval system, or transmitted for reproduction without the prior permission of the publisher.
NCARB BY THE NUMBERS • JUNE 2015 JURISDICTIONS • 96
IDP
LICENSURECOMPLETION TIMELINE
ARE
National Average: 2.5 years
YEARS
8 6420 40+6019+81585
Aspiring Architects Reporting Hours
327Eligible Testers
113Completions 76
Completions
851Divisions Taken
40%Resident Licenses
60%Reciprocal Licenses
6.2 yrsIDP
ARE
Virginia
19%Completion Rate
75%Success Rate
National Average: 4.9 years
National Average: 13%
7,085Total Licenses
National Average:47% Resident
53% Reciprocal
National Average: 65%
1.8 yrs
© 2015 NCARB by the Numbers by the National Council of Architectural Registration Boards. All rights reserved. No part of this document may be reproduced, stored in a retrieval system, or transmitted for reproduction without the prior permission of the publisher.
NCARB BY THE NUMBERS • JUNE 2015 JURISDICTIONS • 97
IDP
LICENSURECOMPLETION TIMELINE
ARE
National Average: 2.5 years
YEARS
8 6420 62+3814+86844
Aspiring Architects Reporting Hours
528Eligible Testers
121Completions 125
Completions
1,342Divisions Taken
62%Resident Licenses
38%Reciprocal Licenses
5.6 yrsIDP
ARE
Washington
14%Completion Rate
72%Success Rate
National Average: 4.9 years
National Average: 13%
6,263Total Licenses
National Average:47% Resident
53% Reciprocal
National Average: 65%
2.8 yrs
© 2015 NCARB by the Numbers by the National Council of Architectural Registration Boards. All rights reserved. No part of this document may be reproduced, stored in a retrieval system, or transmitted for reproduction without the prior permission of the publisher.
NCARB BY THE NUMBERS • JUNE 2015 JURISDICTIONS • 98
IDP
LICENSURECOMPLETION TIMELINE
ARE
National Average: 2.5 years
YEARS
8 6420
8+929+91
26Aspiring Architects Reporting Hours
15Eligible Testers
2Completions 2
Completions
29Divisions Taken
9%Resident Licenses
91%Reciprocal Licenses
West Virginia
8%Completion Rate
72%Success Rate
National Average: 13%
1,093Total Licenses
National Average:47% Resident
53% Reciprocal
National Average: 65%
4 yrs
National Average: 4.9 years
IDP
ARE
3.1 yrs
© 2015 NCARB by the Numbers by the National Council of Architectural Registration Boards. All rights reserved. No part of this document may be reproduced, stored in a retrieval system, or transmitted for reproduction without the prior permission of the publisher.
NCARB BY THE NUMBERS • JUNE 2015 JURISDICTIONS • 99
IDP
LICENSURECOMPLETION TIMELINE
ARE
National Average: 2.5 years
YEARS
8 6420 34+6613+87301
Aspiring Architects Reporting Hours
290Eligible Testers
39Completions 64
Completions
756Divisions Taken
34%Resident Licenses
66%Reciprocal Licenses
5.4 yrsIDP
ARE
Wisconsin
13%Completion Rate
70%Success Rate
National Average: 4.9 years
National Average: 13%
4,250Total Licenses
National Average:47% Resident
53% Reciprocal
National Average: 65%
2.9 yrs
© 2015 NCARB by the Numbers by the National Council of Architectural Registration Boards. All rights reserved. No part of this document may be reproduced, stored in a retrieval system, or transmitted for reproduction without the prior permission of the publisher.
NCARB BY THE NUMBERS • JUNE 2015 JURISDICTIONS • 100
IDP
LICENSURECOMPLETION TIMELINE
ARE
National Average: 2.5 years
YEARS
8 6420
3+9711+89
30Aspiring Architects Reporting Hours
25Eligible Testers
1Completions 8
Completions
70Divisions Taken
11%Resident Licenses
89%Reciprocal Licenses
Wyoming
3%Completion Rate
77%Success Rate
National Average: 13%
1,181Total Licenses
National Average:47% Resident
53% Reciprocal
National Average: 65%
3.8 yrs
National Average: 4.9 years
IDP
ARE
1.5 yrs
© 2015 NCARB by the Numbers by the National Council of Architectural Registration Boards. All rights reserved. No part of this document may be reproduced, stored in a retrieval system, or transmitted for reproduction without the prior permission of the publisher.
NCARB BY THE NUMBERS • JUNE 2015 JURISDICTIONS • 101
IDP
LICENSURECOMPLETION TIMELINE
ARE
National Average: 2.5 years
About This ReportThis is the fourth annual analysis of data collected by NCARB. This report is based on data collected by the National Council of Architectural Registration Boards (NCARB) during the 2014 calendar year, providing insight on the path to licensure.
NCARB maintains a database on aspiring architects and Certificate holders. This allows us to track the progression of candidates as they move through the Intern Development Program (IDP) and the Architect Registration Examination® (ARE®), and receive an initial license.
Some of the data is self-reported, such as age, race, and geographic location. Other data is triggered by candidate actions such as starting the IDP or completing the ARE. NCARB also collects data from the U.S. jurisdictions to provide a total count of architects.
Note: Data from the National Architectural Accrediting Board (NAAB) was also used in this report to provide the reader with the number of students entering into and graduating from NAAB-accredited programs.
© 2015 NCARB by the Numbers by the National Council of Architectural Registration Boards. All rights reserved. No part of this document may be reproduced, stored in a retrieval system, or transmitted for reproduction without the prior permission of the publisher.
NCARB BY THE NUMBERS • JUNE 2015 102
About NCARBThe National Council of Architectural Registration Boards’ membership is made up of the architectural registration boards of all 50 states as well as those of the District of Columbia, Puerto Rico, Guam, and the U.S. Virgin Islands. NCARB assists its member registration boards in carrying out their duties and provides a certification program for individual architects.
NCARB protects the public health, safety, and welfare by leading the regulation of the practice of architecture through the development and application of standards for licensure and credentialing of architects. In order to achieve these goals, the Council develops and recommends standards to be required of an applicant for architectural registration; develops and recommends standards regulating the practice of architecture; provides to Member Boards a process for certifying the qualifications of an architect for registration; and represents the interests of Member Boards before public and private agencies. NCARB has established reciprocal registration for architects in the United States and Canada.
Join the Conversation on Twitter with #NBTN
For more information visit www.ncarb.org
Connect with NCARB on Social Media
www.facebook.com/ncarbwww.twitter.com/ncarb
© 2015 NCARB by the Numbers by the National Council of Architectural Registration Boards. All rights reserved. No part of this document may be reproduced, stored in a retrieval system, or transmitted for reproduction without the prior permission of the publisher.
NCARB BY THE NUMBERS • JUNE 2015 103
DefinitionsAge: Median age based on self-reported dates of birth.
ARE: The Architect Registration Examination® (ARE®) assesses candidates for their knowledge, skills, and ability to provide the various services required in the practice of architecture. The ARE was updated in 2008, from ARE 3.1 to ARE 4.0.
ARE Completion: The date on which a candidate has successfully completed all seven ARE 4.0 divisions.
Aspiring Architect: NCARB Record holders who are currently completing the IDP.
Early Eligibility: The ability to sit for the ARE before completing the IDP. Today, 49 jurisdictions allow early eligibility.
Exam Candidate: NCARB Record holders who are currently taking the ARE.
IDP: The Intern Development Program (IDP) helps guide aspiring architects as they fulfill experience requirements for initial licensure.
IDP Completion: When an NCARB Record is evaluated and marked as having satisfied all IDP experience requirements.
NAAB: The National Architectural Accrediting Board (NAAB) accredits professional programs in architecture offered by institutions accredited by a U.S. regional accrediting agency.
New Record: Date when a new candidate successfully applies for an NCARB Record and begins the path to licensure.
NCARB Certification: Licensed architects have the option to become Certificate holders to signify that they have met national standards established by U.S. licensing boards for protecting public health, safety, and welfare. Certification also facilitates reciprocal registration in all 54 jurisdictions, 11 Canadian jurisdictions, and can be used to support an application for licensure in other countries.
New Reporting Requirement: Effective July 1, 2009, NCARB implemented a new reporting requirement that required candidates to submit IDP experience within eight months.
© 2015 NCARB by the Numbers by the National Council of Architectural Registration Boards. All rights reserved. No part of this document may be reproduced, stored in a retrieval system, or transmitted for reproduction without the prior permission of the publisher.
NCARB BY THE NUMBERS • JUNE 2015 104