Key Investments in Greenhouse Gas Mitigation Technologies from 2000 Through 2014 by Oil and Gas Firms, Other Industry and the Federal Government Thomas Tanton President, T 2 and Associates September 2015
Transcript
Key Investments in Greenhouse Gas Mitigation Technologies from 2000 Through 2014
by Oil and Gas Firms, Other Industry and the Federal Government
Thomas Tanton President, T2 and Associates
September 2015
i
Table of Contents
Preface .............................................................................................................................. ii Glossary of Terms .......................................................................................................... ii Global Warming Potential of Greenhouse Gases ........................................................... iii Categorization of GHG Mitigating Technologies ............................................................ iv
Emission Reductions ....................................................................................................... 1 Major Changes Since Last Report .................................................................................. 3
CHAPTER I: INVESTMENTS FROM 2000-2014 ............................................................... 5
Five Leading Technology Investments .......................................................................... 6
Major Movers .................................................................................................................... 7
Greenhouse Gas Mitigation Technology Investments .................................................. 8 Oil and Gas Industry Investments from 2000 through 2012 ........................................... 8 Other Private Industries and Federal Government Investments from 2000 to 2012 ..... 11
Technology Investments by Investor Types ................................................................ 18
APPENDIX A FIGURES PRESENTED IN NOMINAL DOLLARS ................................... 35
APPENDIX B BIBLIOGRAPHY ....................................................................................... 43
Undertaken for API
ii
Preface
Glossary of Terms (for extended discussion see page 25) Technology Categories Fuel substitution technologies include liquefied natural gas (LNG), shale gas, nuclear, and landfill gas. End-use technologies include efficiency improvements, such as cogeneration (CHP), improved lighting, and carbon capture and storage (CCS). Non-hydrocarbon technologies include any energy form that is not a hydrocarbon energy source, such as wind, solar and biomass. Enabling technologies are necessary and often basic technologies that allow other technologies’ use and include various consortia that are researching and developing a wide variety of technologies, and include several university programs. Alternative Fuel Vehicles and Advanced Technology Vehicles use both petroleum and nonpetroleum based fuels (or mixtures) or fuel-cell technologies. Biomass uses plant materials, animal fats and wastes, or woody material to produce energy. Biorefineries produce a broad slate of products from plant materials and/or animal fats. Biodiesel is an increasingly important sub-group of this technology. Biodiesel is produced by chemically altering plant oils (e.g., soybean oil) and/or animal fats into diesel fuel substitutes. The term generally refers only to diesel substitutes produced from vegetable oils and/or animal fats. However, this study includes other bio-derivatives including those produced as refinery products, such as certain higher alcohols and alkanes. Carbon Capture and Storage (CCS) is the capture and long term storage of carbon dioxide emissions from combustion processes. Cogeneration, or combined heat and power (CHP), is the simultaneous production of both electricity and thermal energy (steam, hot water, hot air). Ethanol is a liquid fuel, currently produced by the fermentation of various sugars, primarily from corn and sugar cane. Sugar cane is not a significant source in the North American market. Technologies to produce ethanol from cellulose have just begun commercial application. Gasification is a thermal process for converting solid materials (e.g. biomass, coal or petroleum coke) into a synthetic gas. The gas may be used directly, or converted to hydrogen or liquid fuels. Gas Flaring occurs when crude oil is extracted from the earth and natural gas associated with the oil is produced to the surface as well. In areas of the world lacking natural gas infrastructure and markets, this associated gas is usually flared (burned) or sometimes vented (emitted as un-burnt gas). Liquefied natural gas (LNG) is natural gas that has been super-cooled to a liquid for transport. This dramatically reduces the volume for cost-effective transport over longer distances.
iii
Landfill gas (LFG) is methane that is produced anaerobically in landfills from the decomposition of waste material. SF6 is sulfur hexafluoride. It is used in the electrical industry as a dielectric and within the magnesium production industry. Fluorocarbons and halogenated fluorocarbons are various chemicals used as either refrigerants or industrial cleaning agents. Several of them are greenhouse gases, while others can deplete ozone. Industry continues to develop substitutes for those fluorocarbons. Nitrous Oxides (N2O) are produced by both biogenic and anthropogenic sources. Primary anthropogenic sources of N2O are agricultural practices related to the use of fertilizer. Nitrous oxide is also produced naturally from a wide variety of biological sources in soil and water, particularly microbial action in wet tropical forests. Shale Gas is an important source of expanded supply of natural gas in the U.S., typically produced through a well-tested process known as hydraulic fracturing. As a greenhouse gas emission reduction technology, shale gas increases the supply of natural gas to the North American market that may substitute for coal, and to a lesser extent for petroleum fuels. The potential for greenhouse gas mitigation is determined, however, by the amount of gas-on-gas substitution versus gas-on-coal. A Disruptive Technology is a new technological innovation, product, or service that overturns the existing dominant technology in the market, despite the fact that the disruptive technology is radically different from the leading technology and requires fundamental infrastructure and support changes.
“Global Warming Potential” of Greenhouse Gases Each greenhouse gas has been defined by the U.S. Environmental Protection Agency as having a different “global warming potential” that is measured relative to carbon dioxide (CO2). The gases that are included within this analysis have been reported to have the following global warming potentials1:
*Actual value depends on specific chemical within a class
1 U.S. Environmental Protection Agency, Inventory Of U.S. Greenhouse Gas Emissions And Sinks: 1990-2011 (April 2013); http://www.epa.gov/climatechange/emissions/usinventoryreport.html GWP numbers from IPCC’s Fourth Scientific Assessment Report.
iv
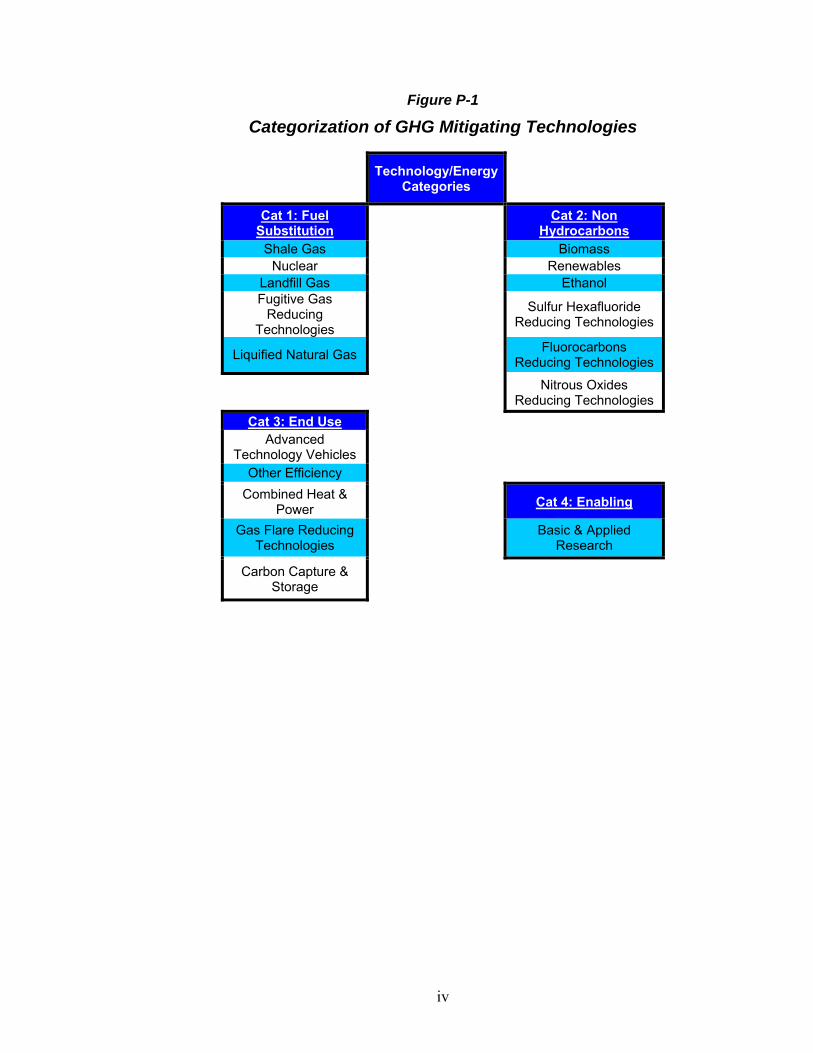
Figure P-1
Categorization of GHG Mitigating Technologies
Technology/Energy Categories
Cat 1: Fuel Substitution
Cat 2: Non
Hydrocarbons Shale Gas Biomass
Nuclear Renewables Landfill Gas Ethanol Fugitive Gas
Reducing Technologies
Sulfur Hexafluoride
Reducing Technologies
Liquified Natural Gas Fluorocarbons
Reducing Technologies
Nitrous Oxides
Reducing Technologies
Cat 3: End Use Advanced
Technology Vehicles
Other Efficiency
Combined Heat & Power
Cat 4: Enabling
Gas Flare Reducing Technologies
Basic & Applied
Research
Carbon Capture & Storage
1
Executive Summary
This report provides estimates of the investments made from 2000 through 2014 in
various greenhouse gas emission reduction technologies. Estimates are provided for the oil and
gas industry, other private sector industries, and the Federal Government.
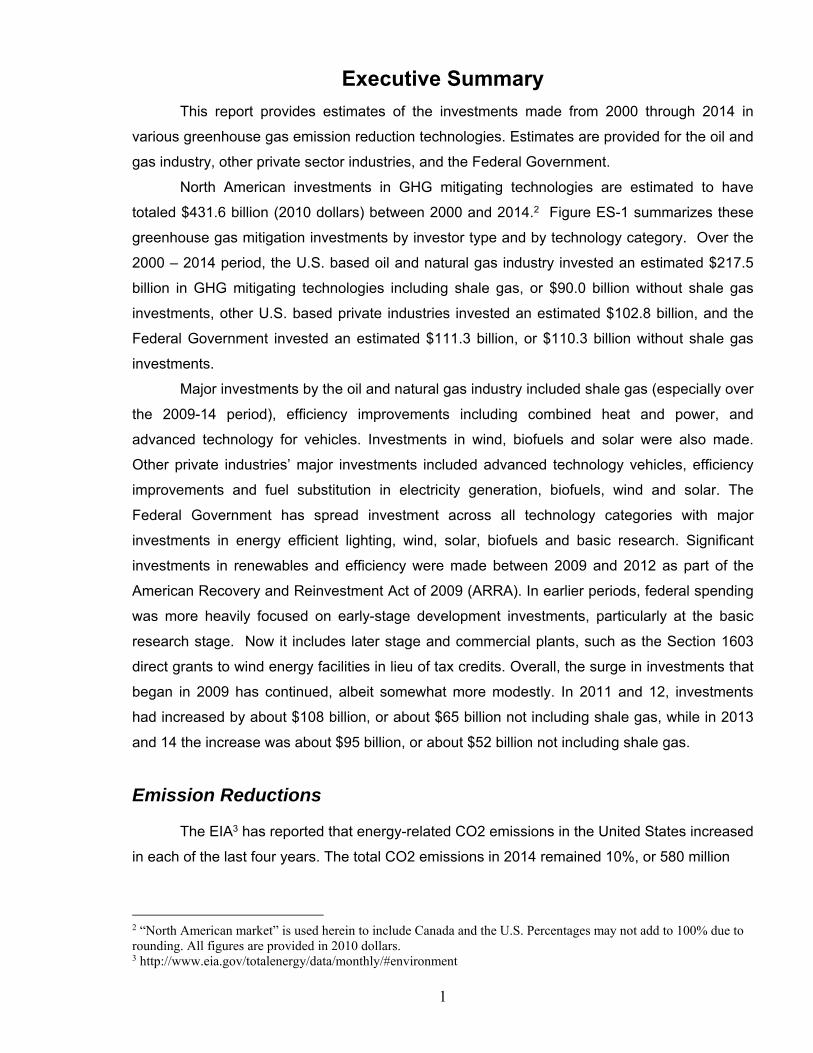
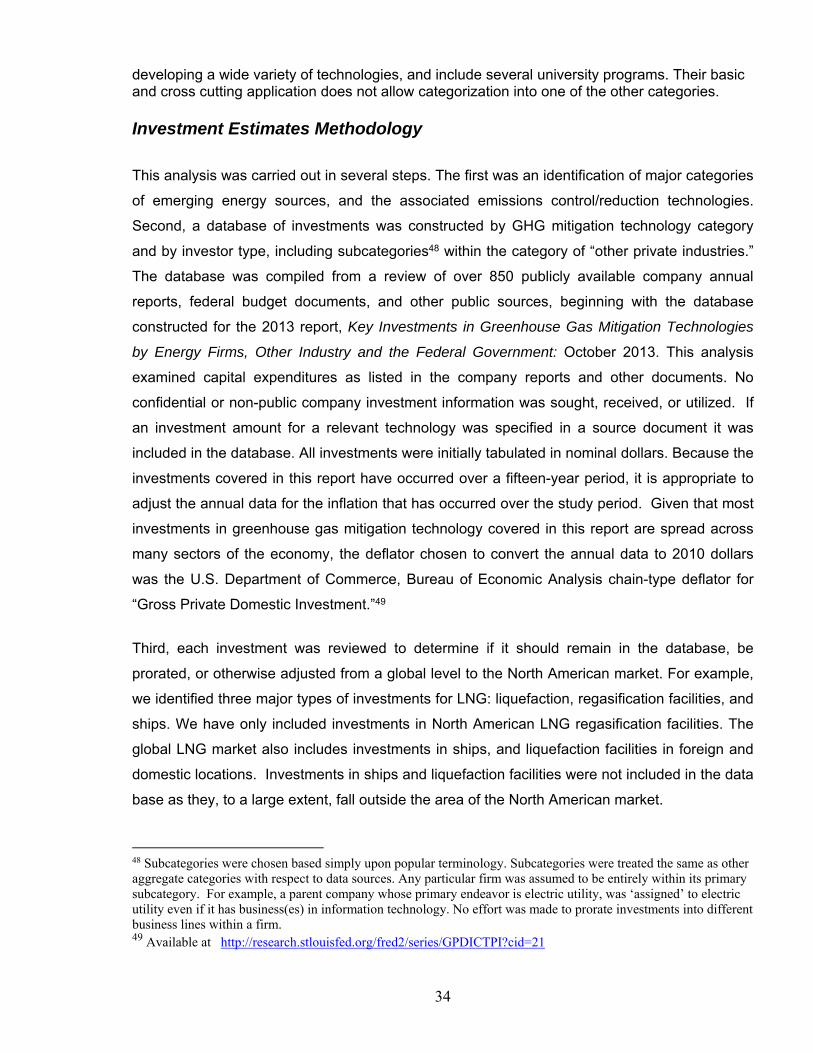
North American investments in GHG mitigating technologies are estimated to have
totaled $431.6 billion (2010 dollars) between 2000 and 2014.2 Figure ES-1 summarizes these
greenhouse gas mitigation investments by investor type and by technology category. Over the
2000 – 2014 period, the U.S. based oil and natural gas industry invested an estimated $217.5
billion in GHG mitigating technologies including shale gas, or $90.0 billion without shale gas
investments, other U.S. based private industries invested an estimated $102.8 billion, and the
Federal Government invested an estimated $111.3 billion, or $110.3 billion without shale gas
investments.
Major investments by the oil and natural gas industry included shale gas (especially over
the 2009-14 period), efficiency improvements including combined heat and power, and
advanced technology for vehicles. Investments in wind, biofuels and solar were also made.
Other private industries’ major investments included advanced technology vehicles, efficiency
improvements and fuel substitution in electricity generation, biofuels, wind and solar. The
Federal Government has spread investment across all technology categories with major
investments in energy efficient lighting, wind, solar, biofuels and basic research. Significant
investments in renewables and efficiency were made between 2009 and 2012 as part of the
American Recovery and Reinvestment Act of 2009 (ARRA). In earlier periods, federal spending
was more heavily focused on early-stage development investments, particularly at the basic
research stage. Now it includes later stage and commercial plants, such as the Section 1603
direct grants to wind energy facilities in lieu of tax credits. Overall, the surge in investments that
began in 2009 has continued, albeit somewhat more modestly. In 2011 and 12, investments
had increased by about $108 billion, or about $65 billion not including shale gas, while in 2013
and 14 the increase was about $95 billion, or about $52 billion not including shale gas.
Emission Reductions
The EIA3 has reported that energy-related CO2 emissions in the United States increased
in each of the last four years. The total CO2 emissions in 2014 remained 10%, or 580 million
2 “North American market” is used herein to include Canada and the U.S. Percentages may not add to 100% due to rounding. All figures are provided in 2010 dollars. 3 http://www.eia.gov/totalenergy/data/monthly/#environment
2
metric tons, below the peak of 2007. Energy-related carbon dioxide emissions have declined in
six of the past fourteen years.
Figure ES-1
In 2014 GDP grew by 4.1 percent (current dollars)4 while emissions increased just under
1 percent5, largely due to a continuing improvement in GHG emission intensity. Since 1990,
GHG emissions in the United States have grown much more slowly than GDP; in 2007
emissions reached a peak of about 20 percent more than 1990 levels, while 2014 GHG
emissions are only about 7.5 percent more than 1990 levels. GDP has increased by 78 percent
over that same time period, as measured in constant chained dollars6. At the same time the
U.S. population has increased by about 69 million people or a little over 20 percent7.
The GHG mitigation investments catalogued in this report delivered greenhouse gas
emission reductions either in absolute terms or relative to what would have otherwise occurred.
No connection is made between specific investments and reduction amounts. Emission
reductions reported by the oil and gas industry in the North American market are shown in
Table ES-1. These are reductions that occur from the various companies’ operations, such as
4 http://bea.gov/national/index.htm#gdp Table “gdplev” Current-Dollar and "Real" Gross Domestic Product release date 8/27/2015 5 http://www.eia.gov/totalenergy/data/monthly/#environment 6 http://bea.gov/national/index.htm#gdp 7 http://www.multpl.com/united-states-population/table
3
improved efficiency in energy use in their facilities and improved fugitive emission control. Table
ES-1 does not include reductions that were accomplished by other industries, like electric
utilities, that were only made possible by investments by the oil and gas industry in shale gas,
allowing those electric utilities to switch from coal to natural gas. They also do not include the
significant reductions from improved production technologies resulting in lower emission
intensity of methane, which otherwise may have increased in aggregate with vastly expanded
hydraulic fracturing related production.
Table ES-1 Reported Emission Reductions 2011 and 2012 versus Prior Year
Oil and Gas Industry in North America Million Metric Tons CO2e*
*Emissions reductions associated with fuel substitution do not include reductions by other industries such as electric utilities replacing coal with natural gas produced and sold by the oil and natural gas industry.
U.S. based oil and gas industry sources have reported direct emission reductions
totaling 55.5 million metric tons CO2 equivalent for 2014 compared to 2013. The reduction of
55.5 million metric tons is equivalent to taking 11.8 million cars and light trucks off the road,8 or
retiring nine 1000MW coal fired power plants and putting one more on half time work9. For
comparison, there were 256 million cars and trucks in the US in 2013, according to the U.S.
Department of Transportation.10
Major Changes Since Last Report
Oil and natural gas companies, other private sector companies, and the Federal
government continue to invest in greenhouse gas mitigating technologies in the North American
8 Passenger vehicles estimate derived from http://www3.epa.gov/otaq/climate/documents/420f14040a.pdf, by dividing total reductions by average passenger vehicle emissions 9 Average coal plant estimate derived from http://www.epa.gov/cpd/pdf/brochure.pdf and http://www.eia.gov/coal/production/quarterly/co2_article/co2.html by calculating total MWh/year, mmBTU/MWh and MMT CO2/mmBTU. 10http://www.fhwa.dot.gov/policyinformation/statistics/2013/mv1.cfm
4
market. Since the last report that covered investment from 2000-1211, total investment in these
technologies has increased by approximately $95.3 billion in the 2013-14 period, or
approximately 28 percent, from $336 billion to $432 billion12.
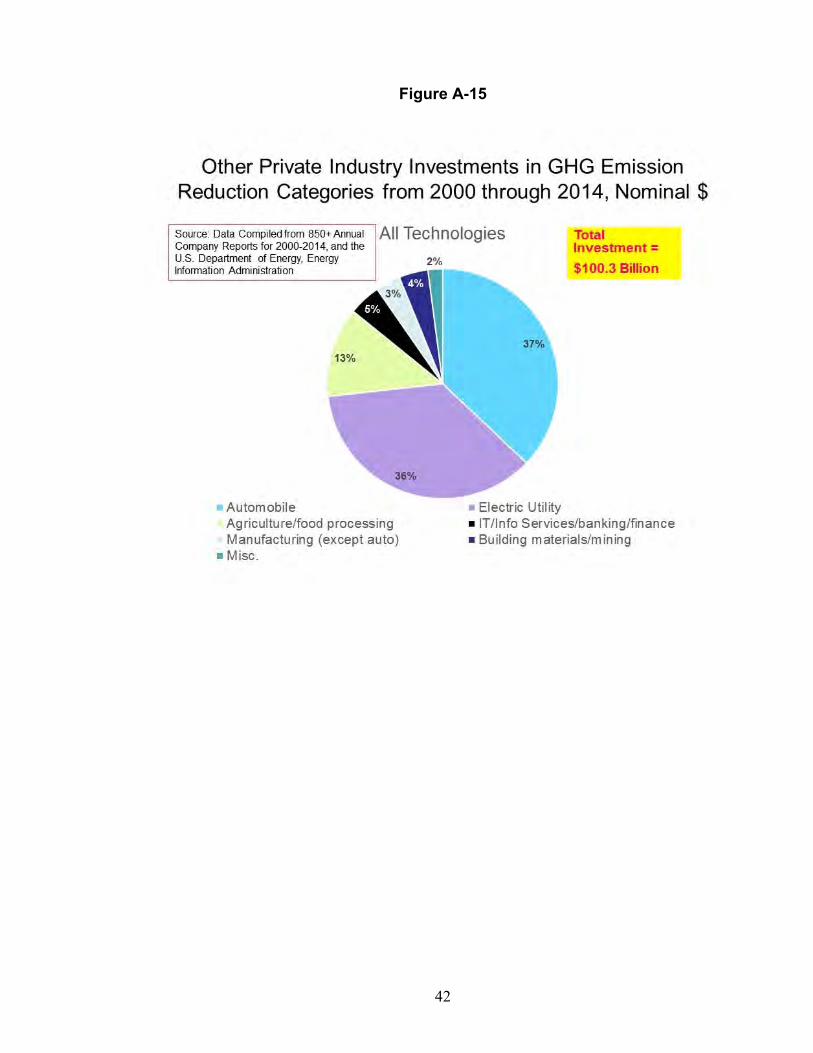
In addition, the investments made by other private industries have been disaggregated into
specific industry groups. Figure ES-2 shows the investments by private sector firms in different
industries, including:
Automotive Electric utilities, including independent power Producers Agriculture/food processing Information Technology/Info Services/banking/finance Manufacturing (except auto) Building materials/mining Misc. including online retail
Figure ES-2
11 Thomas Tanton, Key Investments in Greenhouse Gas Mitigation Technologies from 2000 Through 2012 by Energy Firms, Other Industry and the Federal Government, October 2013 12 Note that early reports in this series provided estimated investments in nominal dollars; these have been adjusted to constant 2010 dollars throughout here and in the last two reports. Figures showing nominal dollars are provided in Appendix A.
5
Chapter I: Investments From 2000-2014
Introduction
This report summarizes identified investment in GHG mitigation technologies in North America
during the period 2000 through 2014.13 Investments are reported for the private sector and the
Federal government by technology or energy category. The data were compiled from a review
of over 850 company annual reports, federal budget documents, and other public sources.14 It
should be noted that most of the investments may provide benefits in addition to any reduction
of greenhouse gas emissions, and were made for multiple reasons such as to increase or
diversify energy supplies, or to improve efficiency.
The issue of climate change continues to draw the attention of scientists, government officials,
the media and public. As climate policy in the U.S. continues to evolve, it is important to
understand how current and emerging technologies including those that mitigate greenhouse
gas (GHG) emissions are being invested in today and by which major stakeholders.
Greenhouse gas emissions can be reduced by a variety of measures, such as improving energy
efficiency and, in some applications, by developing alternative energy sources, like wind and
solar power. Another way to reduce atmospheric emissions is to capture the CO2 that is
released from fossil fuel-fired power plants and store it underground, referred to as carbon
capture and storage (CCS). Oil and natural gas companies are reducing releases of methane, a
potent greenhouse gas, while at the same time greatly expanding energy supplies through
various substitute fuels through hydraulic fracturing. Next to hydraulic fracturing, oil and gas
companies have invested heavily in end use technologies to improve overall efficiency.
The GHG mitigating technologies examined in this report were placed into four categories: fuel
substitution, nonhydrocarbon, end-use and enabling technologies as laid out in the
organizational chart on page iv.
This report does not include investments made by individual consumers (e.g. for more efficient
appliances or hybrid and flexible fuel vehicles), or tax policies by the government intended to
encourage specific technologies, nor monies paid in various legal settlements. Direct cash
13 No claim is made to have captured 100% of investments in each technology or for each GHG, but the author believes that further refinements to the database would change the relative distributions only at the margin. 14 See bibliography for a list of data sources used in this study. Not all company reports reviewed provided data for the analysis undertaken in this report.
6
grants, such as the Federal Section 1603 grants to renewable energy generators were included.
Finally, many of the project investments were made by partnerships and/or joint ventures. While
all reasonable efforts were made to allocate those project expenditures to the entities involved,
this was not always possible. In those instances, project level expenditures were assigned to
the lead sponsor and the corresponding sector.
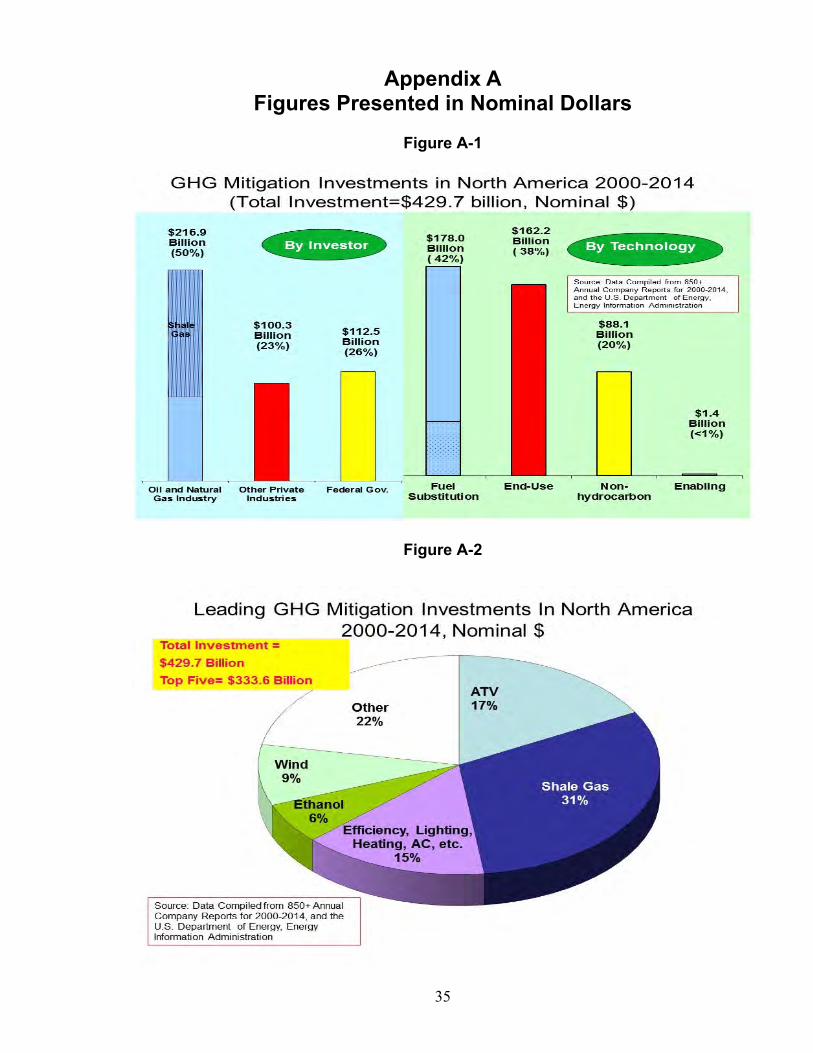
Five Leading Technology Investments
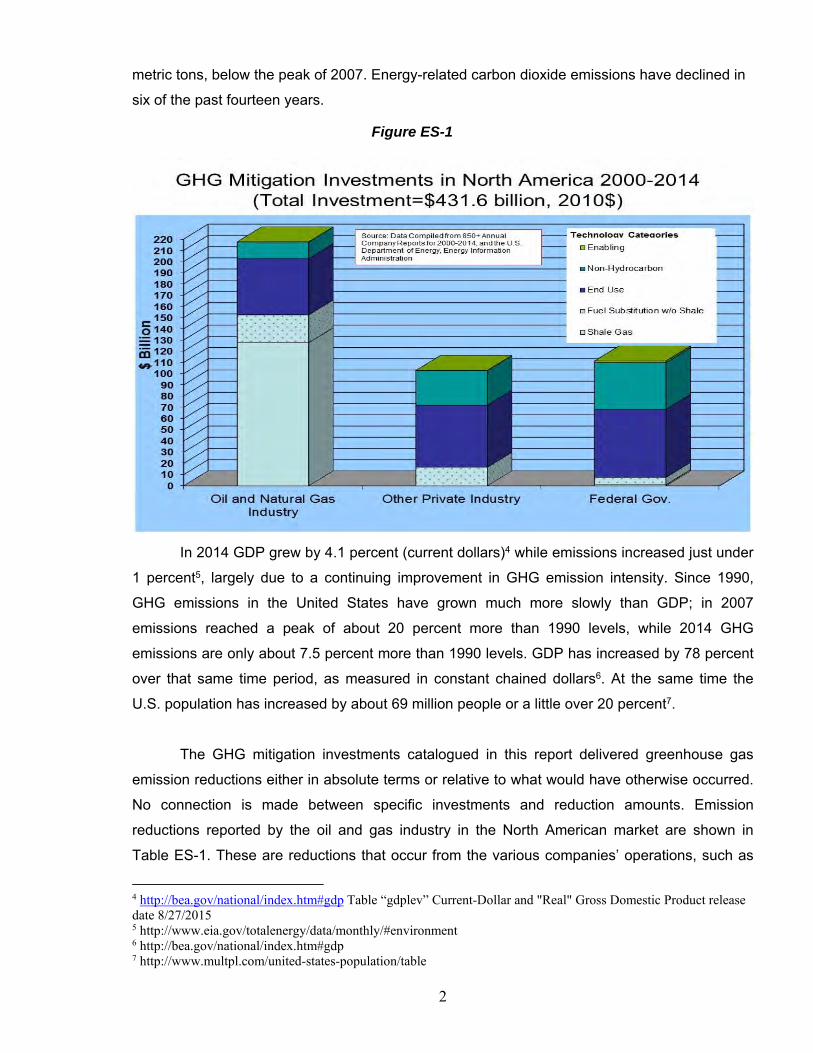
The five leading emission mitigation technologies for private and public sector investment
(Figure 1), as measured by expenditure share, are: shale gas, 30 percent ($128.6 billion);
billion)15; wind, 9 percent ($39.4 billion); and ethanol, 6 percent ($26.8 billion). These top five
technologies commanded 77 percent of the estimated total investments, or $332 billion over the
2000 – 2014 period in the North American market. All other technologies combined comprised
23 percent of the estimated total investments.16
Figure 1
15 “Efficiency” comprises all ‘other’ efficiency technologies except for combined heat and power (CHP) and vehicle efficiency, such as more efficient lighting, heating, ventilation, air conditioning, etc. 16 Percentages may not add to 100% due to rounding.
7
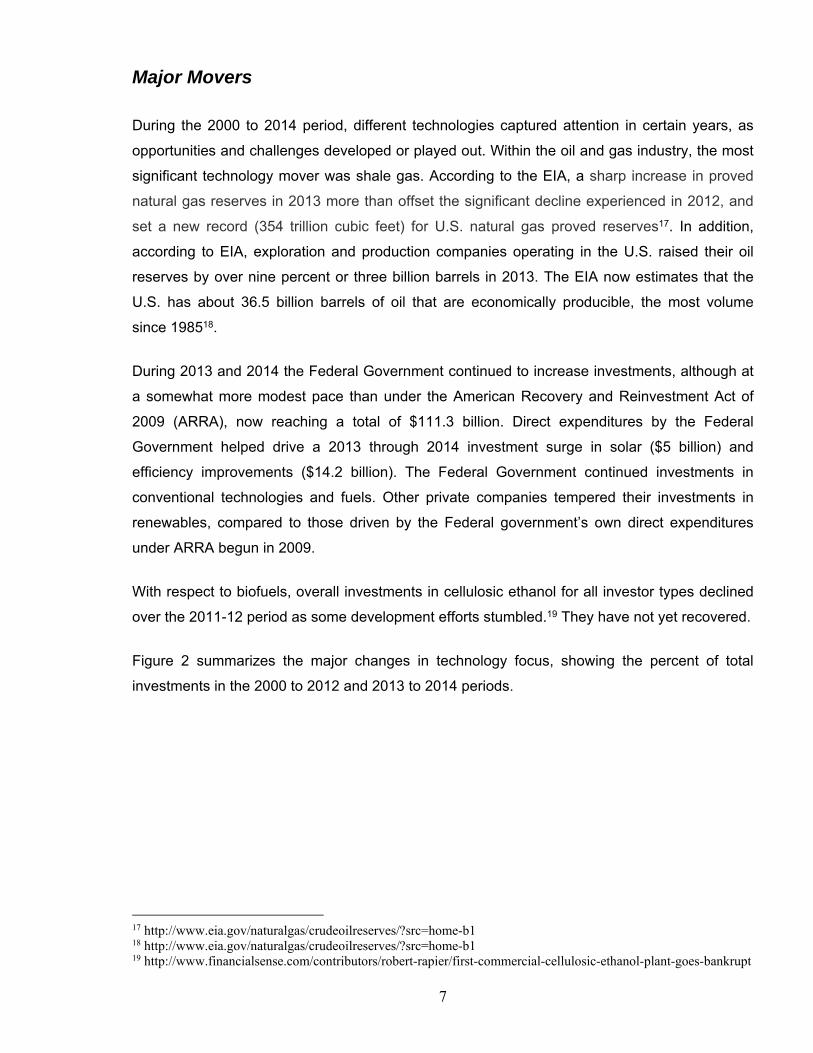
Major Movers
During the 2000 to 2014 period, different technologies captured attention in certain years, as
opportunities and challenges developed or played out. Within the oil and gas industry, the most
significant technology mover was shale gas. According to the EIA, a sharp increase in proved
natural gas reserves in 2013 more than offset the significant decline experienced in 2012, and
set a new record (354 trillion cubic feet) for U.S. natural gas proved reserves17. In addition,
according to EIA, exploration and production companies operating in the U.S. raised their oil
reserves by over nine percent or three billion barrels in 2013. The EIA now estimates that the
U.S. has about 36.5 billion barrels of oil that are economically producible, the most volume
since 198518.
During 2013 and 2014 the Federal Government continued to increase investments, although at
a somewhat more modest pace than under the American Recovery and Reinvestment Act of
2009 (ARRA), now reaching a total of $111.3 billion. Direct expenditures by the Federal
Government helped drive a 2013 through 2014 investment surge in solar ($5 billion) and
efficiency improvements ($14.2 billion). The Federal Government continued investments in
conventional technologies and fuels. Other private companies tempered their investments in
renewables, compared to those driven by the Federal government’s own direct expenditures
under ARRA begun in 2009.
With respect to biofuels, overall investments in cellulosic ethanol for all investor types declined
over the 2011-12 period as some development efforts stumbled.19 They have not yet recovered.
Figure 2 summarizes the major changes in technology focus, showing the percent of total
investments in the 2000 to 2012 and 2013 to 2014 periods.
U.S. based companies20 and the Federal government invested approximately $431.6 billion
(2010 dollars) from 2000 to 2014 on greenhouse gas mitigating technologies in the North
American market. The U.S. based oil and gas industry invested $217.5 billion ($90 billion
without shale gas), 50 percent of the $431.6 billion total, in end-use, fuel substitution, non-
hydrocarbon, and enabling technologies. Other private companies invested an estimated
$102.8 billion or 24 percent of the total, predominantly in end-use and non-hydrocarbon
technologies. During the same period, the Federal government invested in a wide array of
greenhouse gas mitigation technologies, with expenditures of approximately $111.3 billion
($110.3 without shale gas), or 26 percent of the total North American investment (Figure 3).
This does not include state and local expenditures nor investments.
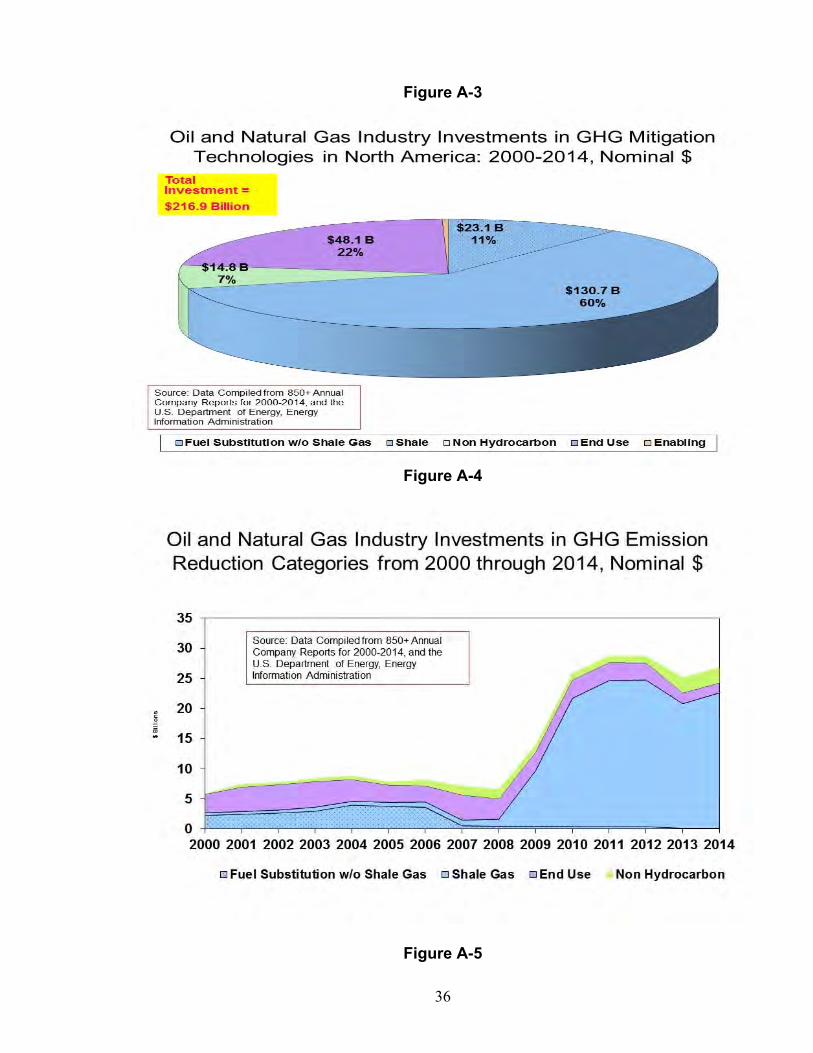
Oil and Gas Industry Investments from 2000 through 2014
It is estimated that U.S. based oil and natural gas companies invested $217.5 billion ($90 billion
without shale gas) from 2000 through 2014 in GHG mitigating technologies in the North
20 U.S. based companies include both U.S. companies and foreign-owned companies operating in the U.S.
9
American market.21 (Figure 4) This expenditure represents 50 percent of the estimated total of
$431.6 billion spent by U.S. companies and the Federal government. Publicly announced non-
hydrocarbon investment by the U.S. based oil and gas industry in the North American market is
estimated at just more than $14.9 billion over the 2000 – 2014 period, or about 7 percent of the
oil and natural gas industry’s investments. This represents 17 percent of the total industry and
Federal government investments of approximately $87.6 billion in this technology class (Figure
10). The oil and gas industry’s top publicly announced non-hydrocarbon investments continue to
be in wind, biofuels, solar, geothermal, and landfill digester gas, although investments in those
technologies each diminished in absolute amounts and in relation to shale gas investments.
Figure 3
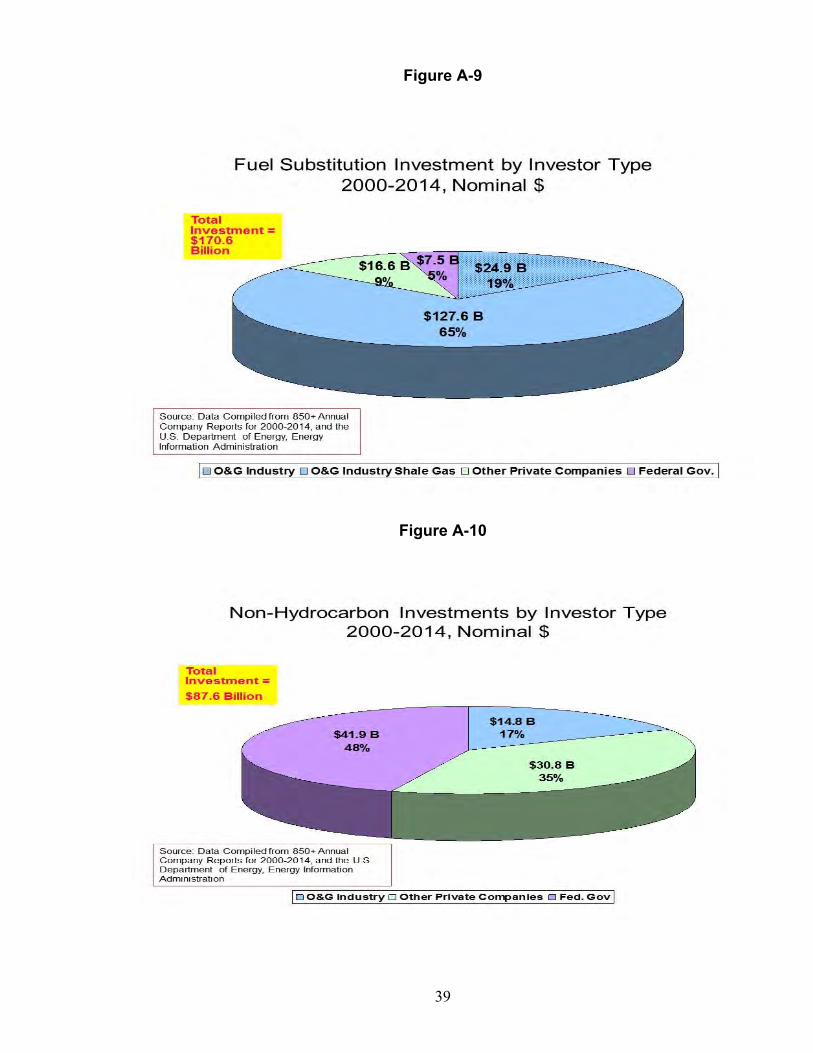
The largest share of investments made by the oil and gas industry, roughly 70 percent or $152
billion, was in the fuel substitution category (Figure 4). This $152 billion investment in fuel
substitution technologies represents 83 percent of the estimated $130.9 billion invested in total
in this technology class (Figure 11). Of this $152 billion, $127.6 billion, (84 percent of the oil
and natural gas industry fuel substitution investment), was invested to expand shale gas
development. The remaining fuel substitution technologies received $24.9 billion from the oil
21 “North American market” is used herein to include Canada and the U.S.
10
and natural gas industry, or 11 percent of the $152 billion oil and natural gas industry fuel
substitution investment.
The oil and gas industry invested $50 billion (or 23 percent of its $217.5 billion total investments
across technologies) for advanced end-use technologies, mostly for efficiency improvements
including combined heat and power in the early part of the period, for carbon capture and
storage22 and for advanced technology vehicles. Significantly, this $50 billion investment in end-
use technologies represents 30 percent of the estimated total amount ($162.2 billion) spent by
all U.S. companies and the Federal government in this technology category (Figure 12).
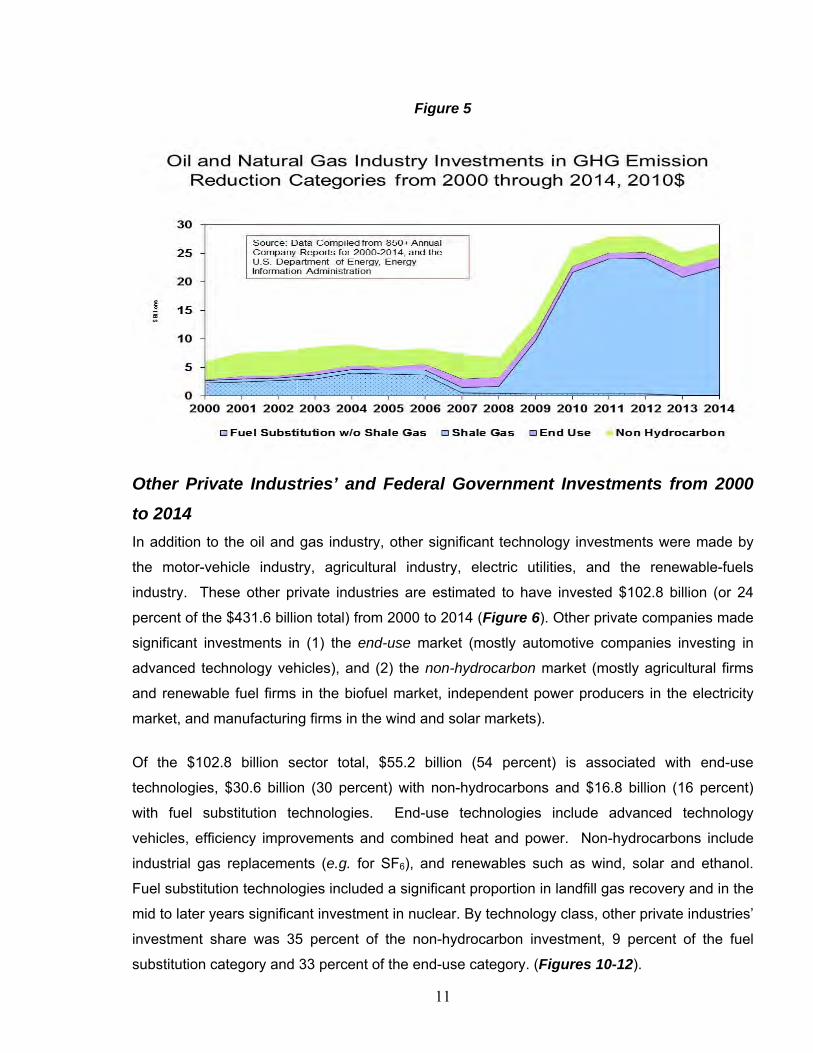
Figure 5 shows the investment pattern over the 2000-2012 period for the oil and gas industry.
Significant new levels of investment occurred starting in 2009 in the fuel substitution category.
This surge was driven by investments for shale gas development, as advancing technology
enabled companies to efficiently develop the very large US shale gas resources. These
significant new investments were made in the face of a persistent recession and slow recovery.
In late 2014, investments decelerated with drops in natural gas and crude oil prices.
Figure 4
22 Carbon Capture and Storage was moved from “enabling” in the May 2008 Report to “end-use” in the 2011 report and here. As described on page 24, this technology has progressed beyond basic research, with demonstration plants now under construction.
11
Figure 5
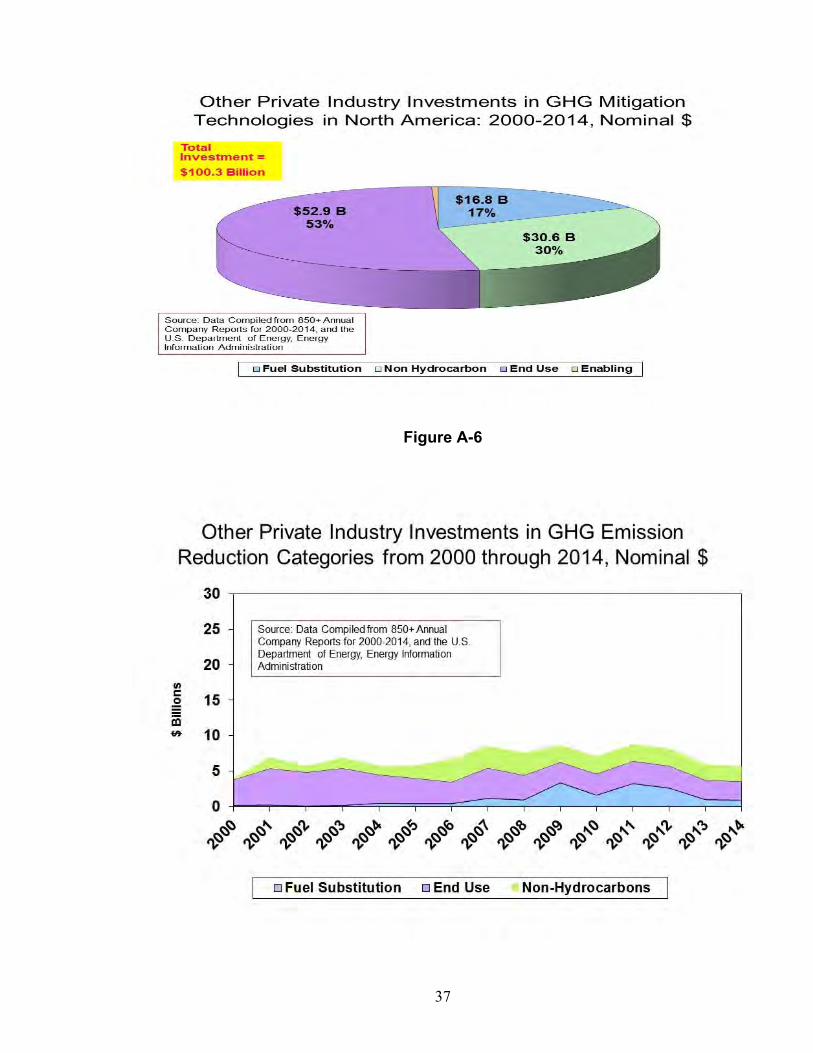
Other Private Industries’ and Federal Government Investments from 2000
to 2014
In addition to the oil and gas industry, other significant technology investments were made by
the motor-vehicle industry, agricultural industry, electric utilities, and the renewable-fuels
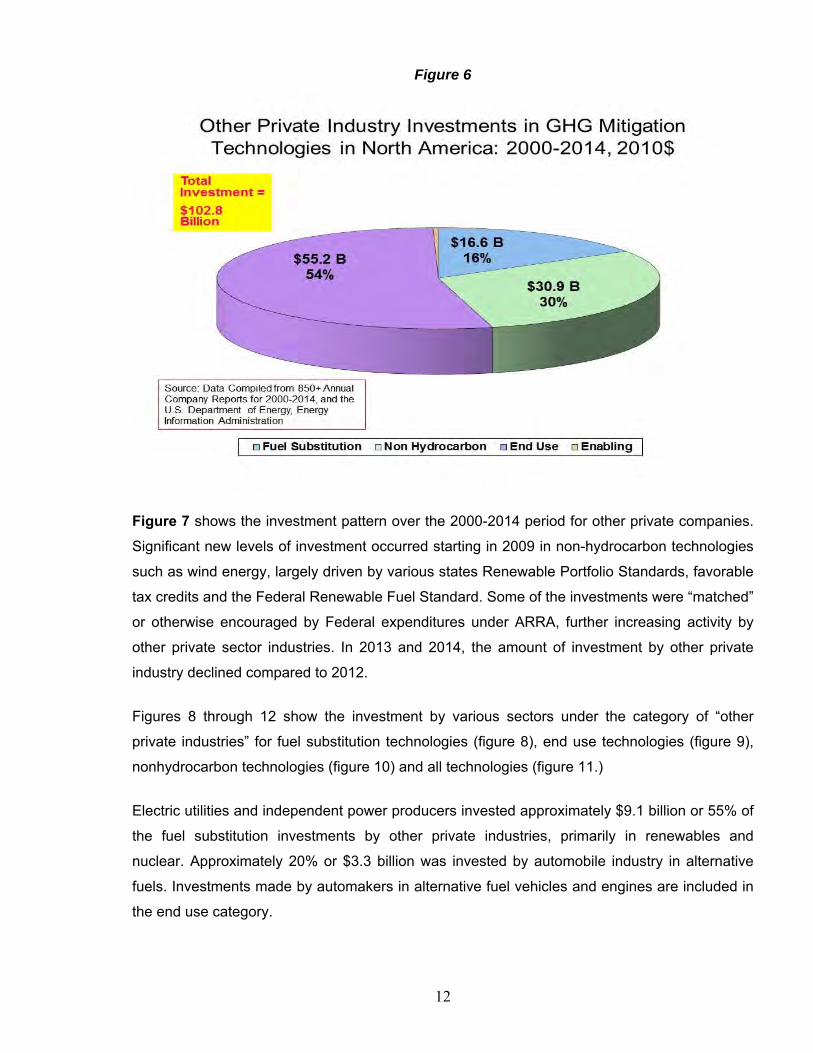
industry. These other private industries are estimated to have invested $102.8 billion (or 24
percent of the $431.6 billion total) from 2000 to 2014 (Figure 6). Other private companies made
significant investments in (1) the end-use market (mostly automotive companies investing in
advanced technology vehicles), and (2) the non-hydrocarbon market (mostly agricultural firms
and renewable fuel firms in the biofuel market, independent power producers in the electricity
market, and manufacturing firms in the wind and solar markets).
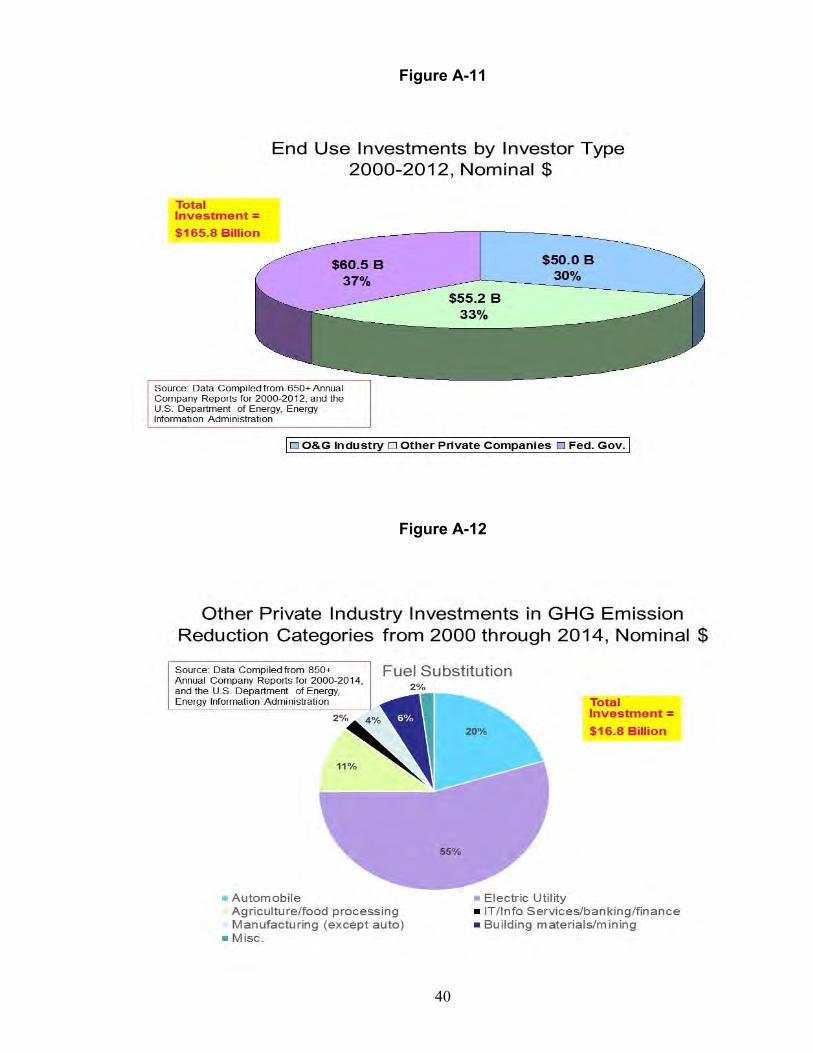
Of the $102.8 billion sector total, $55.2 billion (54 percent) is associated with end-use
technologies, $30.6 billion (30 percent) with non-hydrocarbons and $16.8 billion (16 percent)
with fuel substitution technologies. End-use technologies include advanced technology
vehicles, efficiency improvements and combined heat and power. Non-hydrocarbons include
industrial gas replacements (e.g. for SF6), and renewables such as wind, solar and ethanol.
Fuel substitution technologies included a significant proportion in landfill gas recovery and in the
mid to later years significant investment in nuclear. By technology class, other private industries’
investment share was 35 percent of the non-hydrocarbon investment, 9 percent of the fuel
substitution category and 33 percent of the end-use category. (Figures 10-12).
12
Figure 6
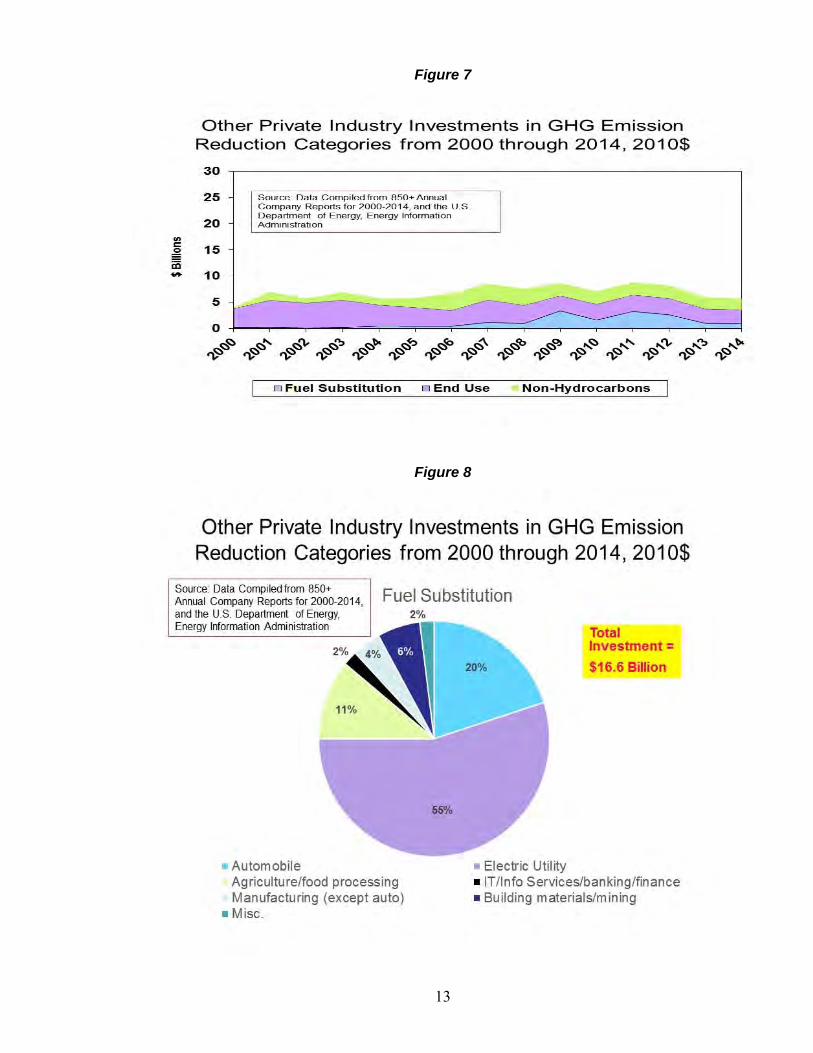
Figure 7 shows the investment pattern over the 2000-2014 period for other private companies.
Significant new levels of investment occurred starting in 2009 in non-hydrocarbon technologies
such as wind energy, largely driven by various states Renewable Portfolio Standards, favorable
tax credits and the Federal Renewable Fuel Standard. Some of the investments were “matched”
or otherwise encouraged by Federal expenditures under ARRA, further increasing activity by
other private sector industries. In 2013 and 2014, the amount of investment by other private
industry declined compared to 2012.
Figures 8 through 12 show the investment by various sectors under the category of “other
private industries” for fuel substitution technologies (figure 8), end use technologies (figure 9),
nonhydrocarbon technologies (figure 10) and all technologies (figure 11.)
Electric utilities and independent power producers invested approximately $9.1 billion or 55% of
the fuel substitution investments by other private industries, primarily in renewables and
nuclear. Approximately 20% or $3.3 billion was invested by automobile industry in alternative
fuels. Investments made by automakers in alternative fuel vehicles and engines are included in
the end use category.
13
Figure 7
Figure 8
14
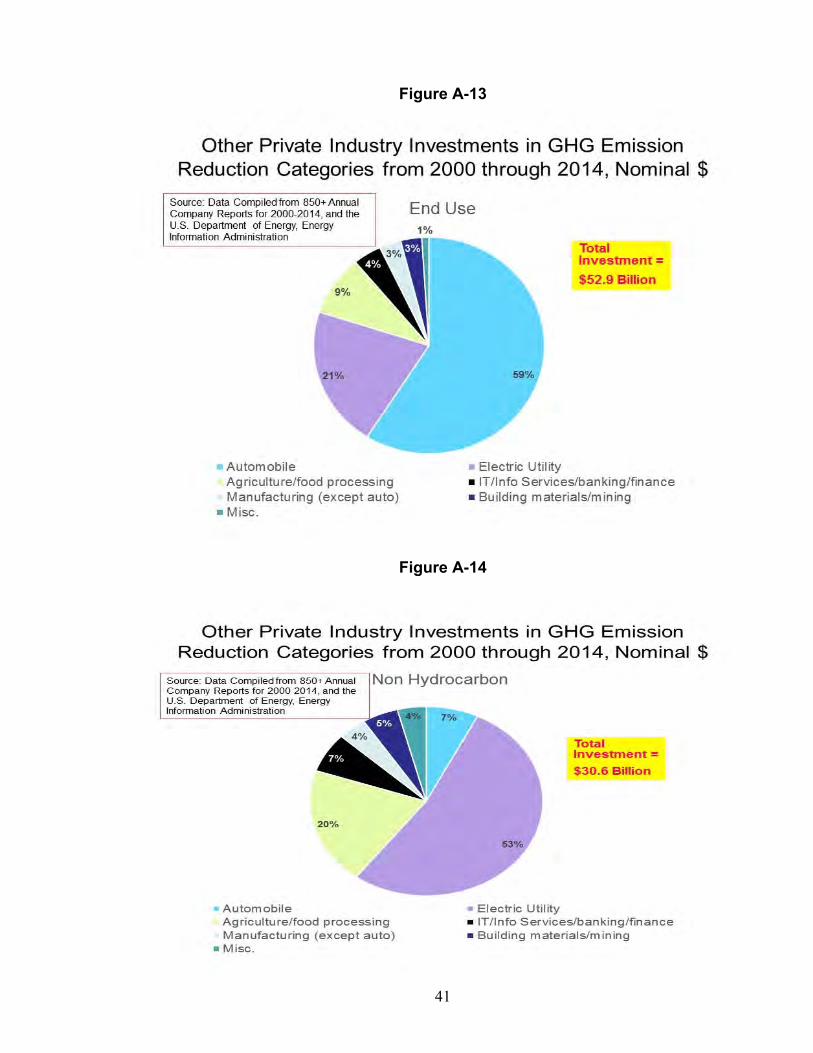
Automakers made up the bulk of investments, $32.6 billion or 59%, in the end use category
(Figure 9.) Electric utilities and independent power producers made investments of $11.6 billion
(21%) of the end use category investments by other private firms, including carbon capture and
sequestration, other efficiency improvements, and combined heat and power. Agricultural and
food processors accounted for $5.0 billion or 9 percent, mostly for combined heat and power
and other efficiency improvements.
Figure 9
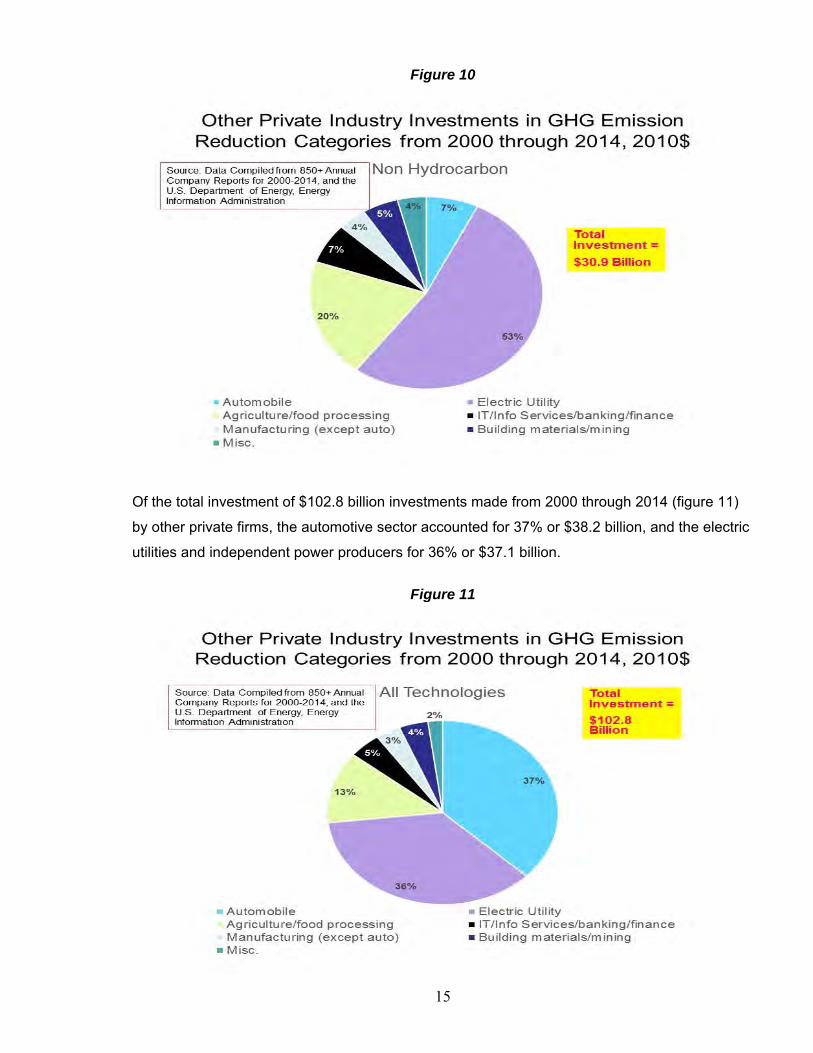
In the nonhydrocarbon category, electric utilities and independent power producers accounted
for 53% or $16.4 billion of the total sector investment of $30.9 billion (figure 10) in this
technology category. This included various renewable energy like wind and solar, but also
geothermal and biomass. Agricultural entities, including processors, accounted for 20% or $6.2
billion, largely in corn based ethanol.
15
Figure 10
Of the total investment of $102.8 billion investments made from 2000 through 2014 (figure 11)
by other private firms, the automotive sector accounted for 37% or $38.2 billion, and the electric
utilities and independent power producers for 36% or $37.1 billion.
Figure 11
16
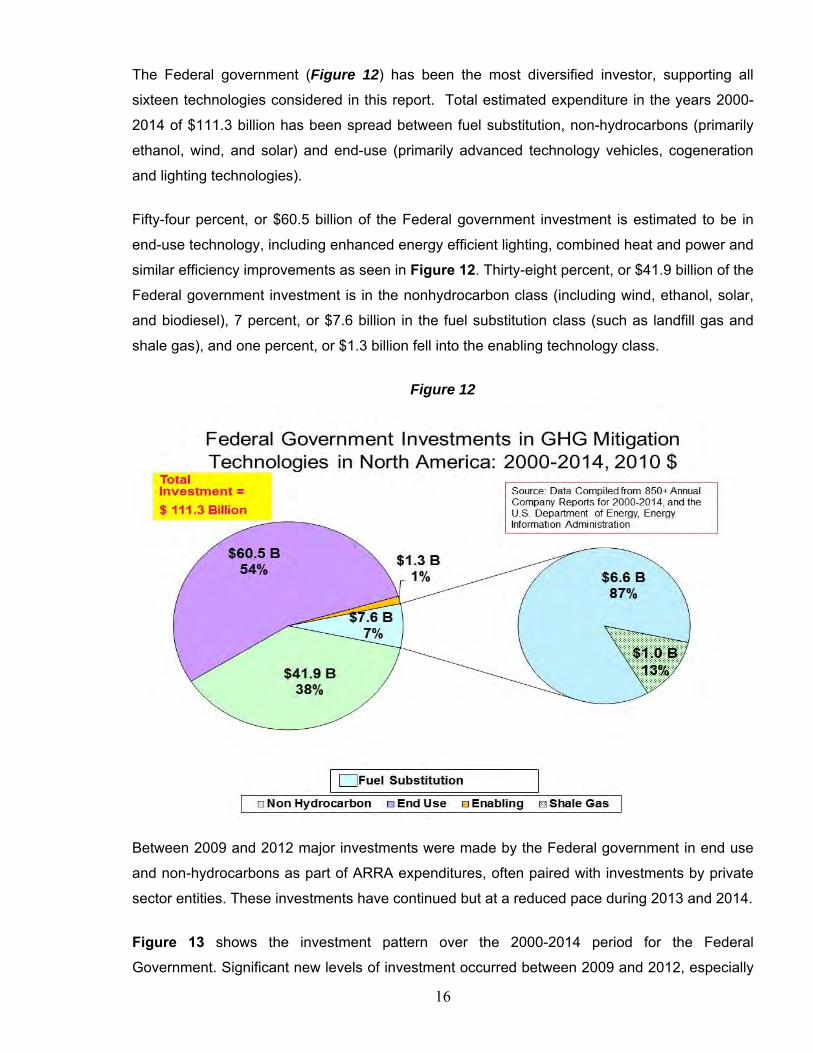
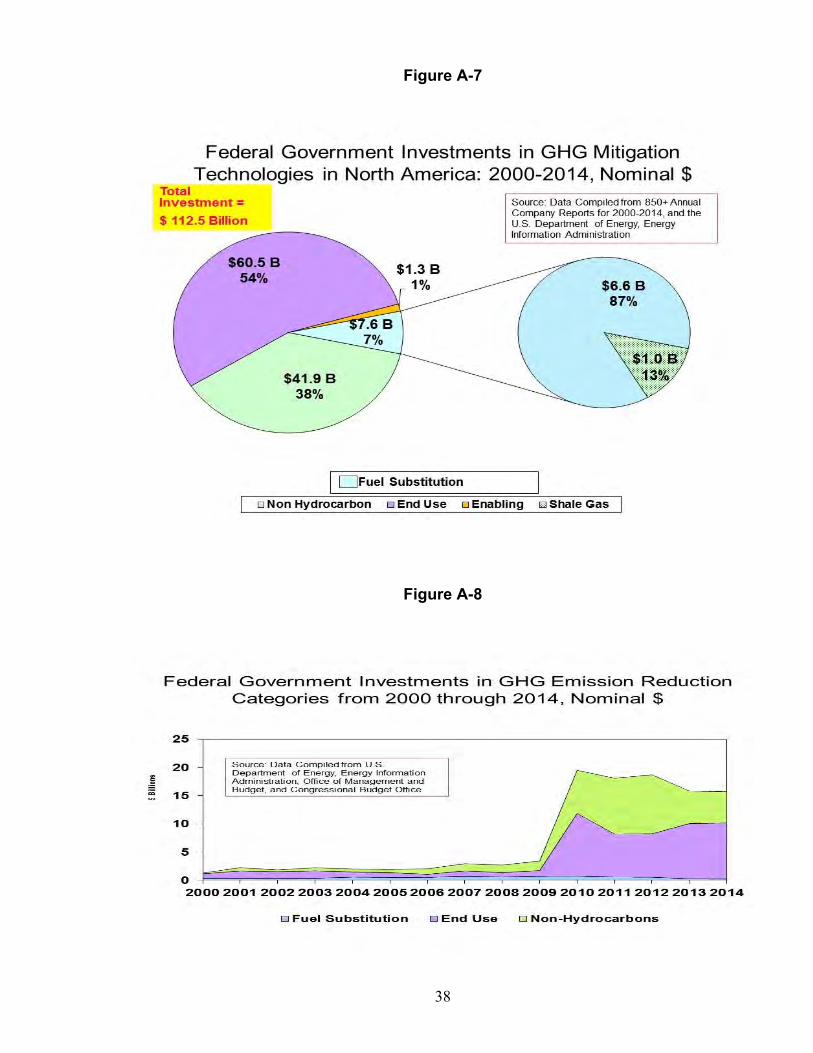
The Federal government (Figure 12) has been the most diversified investor, supporting all
sixteen technologies considered in this report. Total estimated expenditure in the years 2000-
2014 of $111.3 billion has been spread between fuel substitution, non-hydrocarbons (primarily
ethanol, wind, and solar) and end-use (primarily advanced technology vehicles, cogeneration
and lighting technologies).
Fifty-four percent, or $60.5 billion of the Federal government investment is estimated to be in
end-use technology, including enhanced energy efficient lighting, combined heat and power and
similar efficiency improvements as seen in Figure 12. Thirty-eight percent, or $41.9 billion of the
Federal government investment is in the nonhydrocarbon class (including wind, ethanol, solar,
and biodiesel), 7 percent, or $7.6 billion in the fuel substitution class (such as landfill gas and
shale gas), and one percent, or $1.3 billion fell into the enabling technology class.
Figure 12
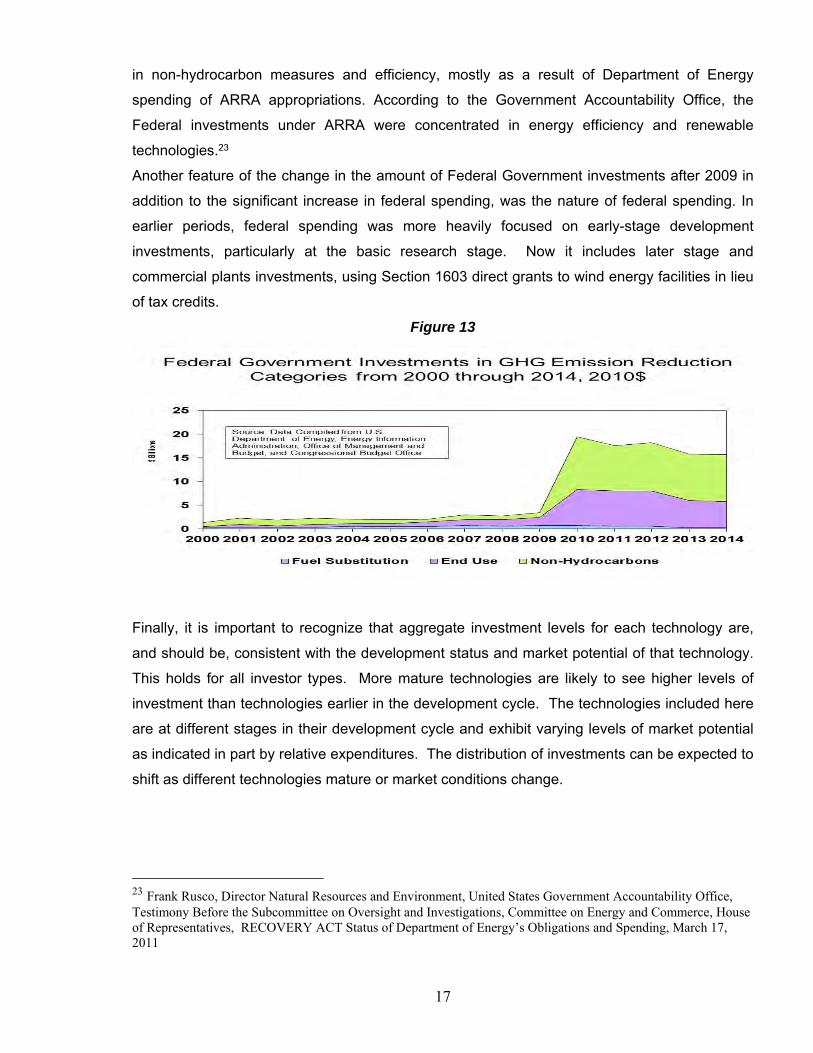
Between 2009 and 2012 major investments were made by the Federal government in end use
and non-hydrocarbons as part of ARRA expenditures, often paired with investments by private
sector entities. These investments have continued but at a reduced pace during 2013 and 2014.
Figure 13 shows the investment pattern over the 2000-2014 period for the Federal
Government. Significant new levels of investment occurred between 2009 and 2012, especially
17
in non-hydrocarbon measures and efficiency, mostly as a result of Department of Energy
spending of ARRA appropriations. According to the Government Accountability Office, the
Federal investments under ARRA were concentrated in energy efficiency and renewable
technologies.23
Another feature of the change in the amount of Federal Government investments after 2009 in
addition to the significant increase in federal spending, was the nature of federal spending. In
earlier periods, federal spending was more heavily focused on early-stage development
investments, particularly at the basic research stage. Now it includes later stage and
commercial plants investments, using Section 1603 direct grants to wind energy facilities in lieu
of tax credits.
Figure 13
Finally, it is important to recognize that aggregate investment levels for each technology are,
and should be, consistent with the development status and market potential of that technology.
This holds for all investor types. More mature technologies are likely to see higher levels of
investment than technologies earlier in the development cycle. The technologies included here
are at different stages in their development cycle and exhibit varying levels of market potential
as indicated in part by relative expenditures. The distribution of investments can be expected to
shift as different technologies mature or market conditions change.
23 Frank Rusco, Director Natural Resources and Environment, United States Government Accountability Office, Testimony Before the Subcommittee on Oversight and Investigations, Committee on Energy and Commerce, House of Representatives, RECOVERY ACT Status of Department of Energy’s Obligations and Spending, March 17, 2011
18
Technology Investments by Investor Types
Figures14-16 show, for each technology category, the investment shares by investor type.
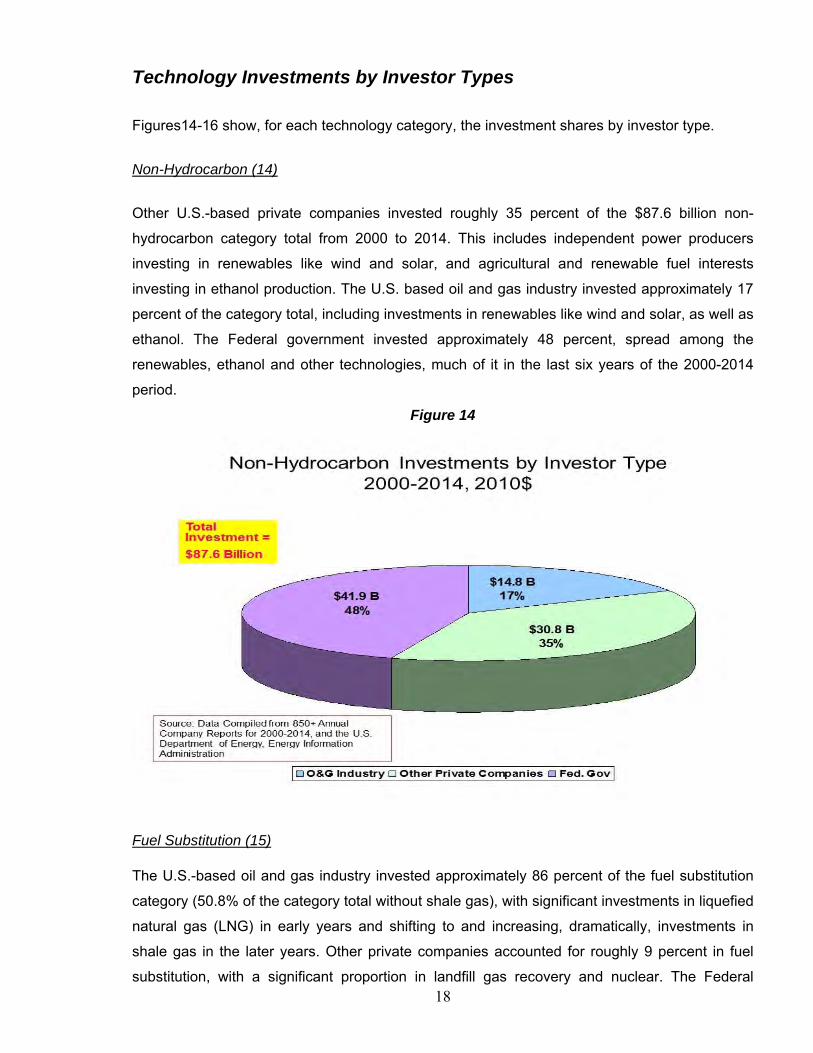
Non-Hydrocarbon (14)
Other U.S.-based private companies invested roughly 35 percent of the $87.6 billion non-
hydrocarbon category total from 2000 to 2014. This includes independent power producers
investing in renewables like wind and solar, and agricultural and renewable fuel interests
investing in ethanol production. The U.S. based oil and gas industry invested approximately 17
percent of the category total, including investments in renewables like wind and solar, as well as
ethanol. The Federal government invested approximately 48 percent, spread among the
renewables, ethanol and other technologies, much of it in the last six years of the 2000-2014
period.
Figure 14
Fuel Substitution (15)
The U.S.-based oil and gas industry invested approximately 86 percent of the fuel substitution
category (50.8% of the category total without shale gas), with significant investments in liquefied
natural gas (LNG) in early years and shifting to and increasing, dramatically, investments in
shale gas in the later years. Other private companies accounted for roughly 9 percent in fuel
substitution, with a significant proportion in landfill gas recovery and nuclear. The Federal
19
government accounted for about 5 percent of this category, including investments in nuclear
and landfill gas recovery as well as shale gas.
Figure 15
End Use (16)
Within the end-use category, other U.S. based industries invested an estimated 33 percent or
$55.2 billion. This includes significant investments by automotive companies investing in
advanced-technology vehicles, and coal companies investments, along with electric utilities, in
carbon capture and storage (CCS). U.S. based oil and gas industry invested approximately 30
percent, or $50 billion of the $165.8 billion total investment in this technology category,
principally in cogeneration, carbon capture and storage and advanced technology vehicles.
Advanced batteries are an example of the advanced technology vehicle investments made by
the U.S. based oil and gas industry. The Federal government invested approximately 37
percent, or $60.5 billion in the end-use category, including investments in lighting technologies
and advanced technology vehicles. In the case of advanced technology vehicles, Federal
Government investments are typically used to match investments from both oil and gas
companies and, more typically, from other private sector companies like automobile and battery
makers.
20
Figure 16
21
Chapter II: Emission Reductions Reported
This chapter provides a compilation of greenhouse gas (GHG) emission reduction estimates
reported by the U.S. based oil and natural gas industry. The emission reduction estimates for
2008-2014 presented herein were compiled strictly from company reports including annual
shareholder reports and corporate responsibility reports. The authors did not solicit, receive,
or utilize any nonpublic information to develop these estimates. As discussed in the
Methodology section below, there are indications that this summary of reported reductions is
an underestimate of actual reductions.
Reported reductions fall into three major categories:
Fuel substitution, such as increasing natural gas supply through capturing fugitive
emissions, and replacing more carbon intensive fuels,
Non-hydrocarbon, such as biofuels produced at biorefineries, and,
End-use, including combined heat and power.
The $217.5 billion in GHG mitigation technologies made by the U.S. based oil and natural gas
industry over 2000 to 2014 clearly resulted in emission reductions, both directly by the oil and
gas companies and indirectly as other private companies like electric utilities have switched
from coal to natural gas. However, it needs to be recognized that other factors make it difficult
to specifically link aggregate emission reductions and individual past investments. For
example, while this report documents reported emission reductions between 2008 and 2014,
investments made can often take time to complete with actual emission reductions occurring
with a lag of up to five years. Some of the reductions in 2008-2014 are likely due to
investments made in the middle years of the 2000-2014 period.
U.S. based oil and gas industry sources have reported direct emission reductions totaling 55.5
million metric tons CO2 equivalent for 2014 compared to 2013. The reduction of 55.1 million
metric tons is equivalent to taking 11.2 million cars and light trucks off the road,24 or retiring nine
1000MW coal fired power plants and putting one more on half time duty25. For comparison,
24 Passenger vehicles estimate derived from http://www.epa.gov/otaq/climate/420f05004.htm, by dividing total reductions by average passenger vehicle emissions 25 Average coal plant estimate derived from http://www.epa.gov/cpd/pdf/brochure.pdf and http://www.eia.gov/coal/production/quarterly/co2_article/co2.html by calculating total MWh/year, mmBTU/MWh and MMT CO2/mmBTU.
22
there are 256 million cars and trucks in the US, according to the U.S. Department of
Transportation.26
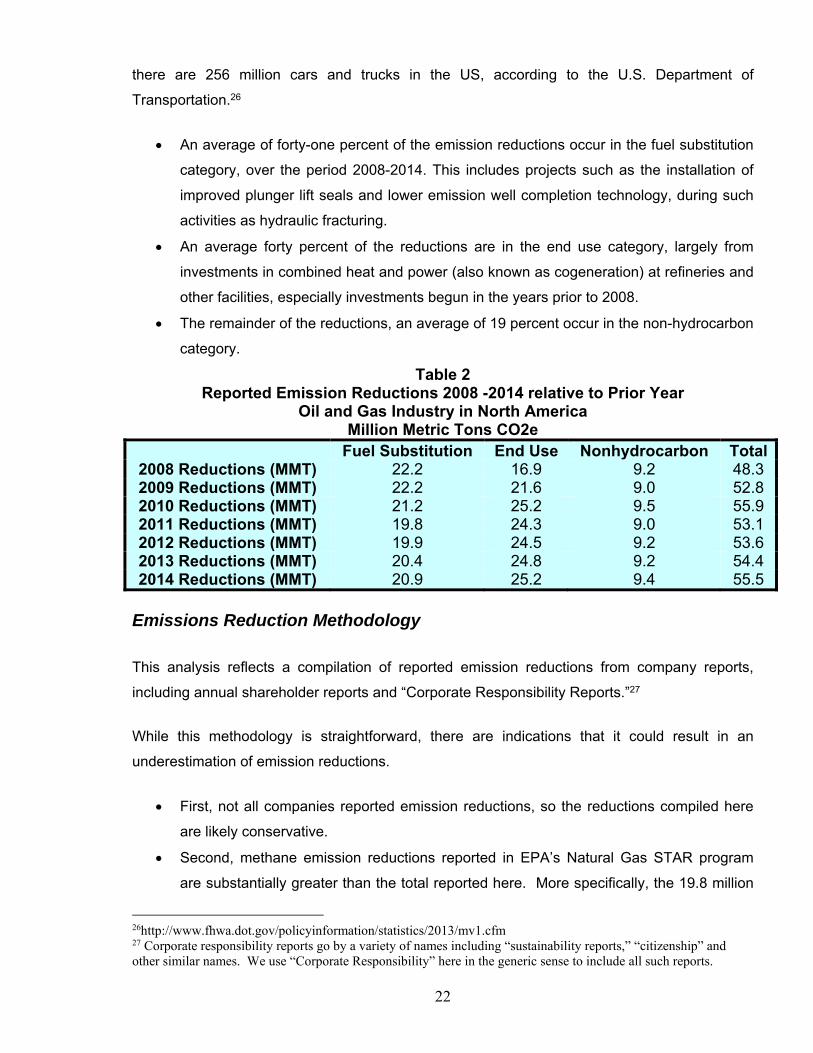
An average of forty-one percent of the emission reductions occur in the fuel substitution
category, over the period 2008-2014. This includes projects such as the installation of
improved plunger lift seals and lower emission well completion technology, during such
activities as hydraulic fracturing.
An average forty percent of the reductions are in the end use category, largely from
investments in combined heat and power (also known as cogeneration) at refineries and
other facilities, especially investments begun in the years prior to 2008.
The remainder of the reductions, an average of 19 percent occur in the non-hydrocarbon
category.
Table 2 Reported Emission Reductions 2008 -2014 relative to Prior Year
Oil and Gas Industry in North America Million Metric Tons CO2e
This analysis reflects a compilation of reported emission reductions from company reports,
including annual shareholder reports and “Corporate Responsibility Reports.”27
While this methodology is straightforward, there are indications that it could result in an
underestimation of emission reductions.
First, not all companies reported emission reductions, so the reductions compiled here
are likely conservative.
Second, methane emission reductions reported in EPA’s Natural Gas STAR program
are substantially greater than the total reported here. More specifically, the 19.8 million
26http://www.fhwa.dot.gov/policyinformation/statistics/2013/mv1.cfm 27 Corporate responsibility reports go by a variety of names including “sustainability reports,” “citizenship” and other similar names. We use “Corporate Responsibility” here in the generic sense to include all such reports.
23
metric tons of CO2e reductions reported for the Fuel Substitution category includes but
is not limited to methane emission reductions from improved exploration and production
equipment and practices. However, EPA’s Natural Gas STAR program28 reports 2013
methane reductions from producing entities, of 50.7 billion cubic feet or roughly 24
million metric tons of CO2e. This exceeds the total reductions reported here for the
entire Fuel Substitution category each year.
For example, according to EPA data, methane emissions from natural gas development
have fallen steadily since 2005, while natural gas production is rising steadily – even as
less and less methane is being emitted from that production. Net methane emissions
from natural gas production fell 38 percent from 2005 to 2013 – even as natural gas
production increased dramatically. Further, methane from hydraulically fractured natural
gas wells fell 79 percent from 2005 to 201329.
Emissions reductions from substituting natural gas for coal are not included in reported
emission reductions by oil and gas companies, but are significant in reducing overall
emissions (see following section.)
Emission reductions reported were then categorized based on company descriptions of how the
reductions were achieved, where such descriptions were provided. For example, reductions
achieved through efficiency improvements were assigned to the end use category. Emission
reductions that were reported by some companies on a global basis were prorated to the North
American market using secondary sources. This was done only in the fuel substitution
category, associated with emission reductions due to methane capture from fugitive emissions.
In this case we used reported emission reductions from EPA’s Natural Gas Star Program to
prorate global emission reduction estimates to the North American market.
Some companies reported reductions (or intensity improvements) based upon their equity
involvement in shared facilities (such as refinery complexes) while some reported the reductions
for the entire facility, especially if they were or are the primary operator of that facility. We
include reductions based on equity positions to avoid double counting. No specific link is
suggested between a specific investment and emission reduction.
28 See http://www.epa.gov/gasstar/accomplishments/index.html#three 29 http://www.epa.gov/climatechange/Downloads/ghgemissions/US-GHG-Inventory-2015-Main-Text.pdf
24
Chapter III: The Challenge of Emission Reductions
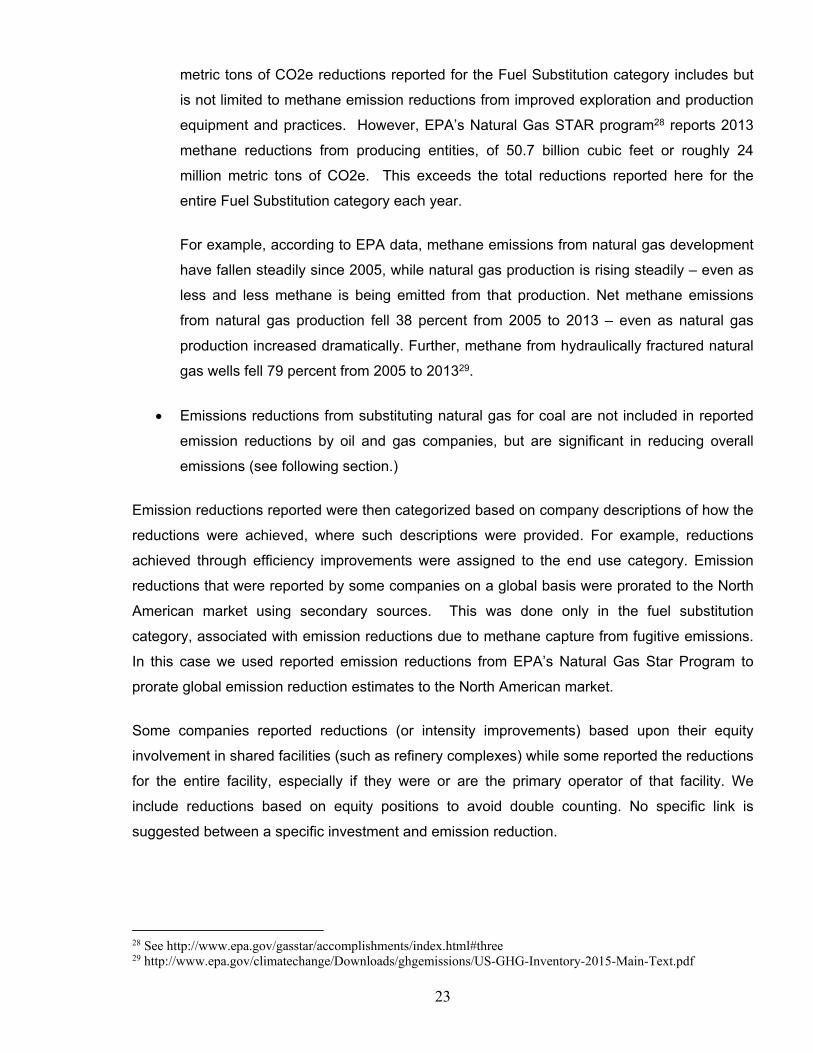
Energy consumption in the United States is forecast by the Energy Information Administration
(EIA), an agency of the U.S. Department of Energy, to increase approximately 9 percent over
the 2013 to 2040 period, or about 0.3 percent annually. (Figure 17) This projected increase is
tempered by a predicted improvement in energy intensity (energy usage per real dollar of
GDP).30 The DOE reference case forecast results in an average annual reduction in energy use
per capita of 0.4%/year from 2013 through 2040 and an average annual decline in energy use
per 2009 dollar of GDP of 2.0%/year. As renewable fuels and natural gas account for larger
shares of total energy consumption, carbon intensity (CO2 emissions per unit of GDP)
continues to decline by an average 2.3%/year from 2013 to 2040.
To meet increased demand for energy, the EIA projects that hydrocarbons (crude oil and
natural gas and their derivatives) will remain the mainstay of the U.S. energy sector at least
over the next several decades. The market share of oil, natural gas, and coal is projected to be
approximately 81 percent in 2040, little changed from 83 percent in 2013.
Figure 17
30 Noted trends and statistics in this section are from Energy Information Administration, Annual Energy Outlook 2015, April 2015.
25
According to BP’s “Energy Outlook 2035”, by 2035, the world’s population is projected to reach
8.7 billion, up 1.6 billion people from today. Global gross domestic product is expected to more
than double, with much of the growth in Asia. China and India will become the world’s largest
and 3rd largest economies respectively, jointly accounting for about one-third of global
population and GDP31.
The global outlook for energy consumption is for an increase of 45% between 2010 and 2035,
with growth averaging 1.4% per year. Virtually all (96%) of the projected growth is in non-OECD
countries, with energy consumption growing at 2.2% per year. OECD energy consumption, by
contrast, grows at just 0.1% per year over the period. The projected growth rate of global
energy consumption is slower than the trend of 2.5% per year for 2000-10.
Natural gas is the fastest growing fossil fuel (1.9% per year), with oil (0.8% per year) marginally
ahead of coal. The fastest fuel growth is seen in renewables (6.3% per year). The combined
share for fossil fuels (coal, liquids and gas) drops from 86% of the total in 2010 to 80% in 2035.
(Figure 18)
Figure 18
31 Noted trends and statistics regarding global energy are from BP’s “Energy Outlook 2035” bp.com/energyoutlook , Feb. 2015.
26
These projections of energy demand highlight the importance of continued economically viable
investments leading to more efficient, and lower-GHG emitting technologies, as well as the
development of efficient technology transfer programs to developing countries.
National Trends
There has been significant progress in mitigation of U.S. GHG emissions although significant
challenges remain going forward.32
In 2013 and 2014, energy-related carbon dioxide (CO2) emissions in the United States
increased compared to 2012. However, unlike 2013, when emissions and gross domestic
product (GDP) grew at similar rates (2.5% and 2.2%, respectively), 2014's CO2 emissions
growth rate of 0.7% was much smaller than the 2014 GDP growth rate of 2.4%.
Energy-related CO2 emissions are the largest component of overall U.S. greenhouse gas
emissions. Changes in CO2 emissions reflect changes in economic and energy-related
indicators. The previous two years have largely followed the economic trends in terms of
increasing population and per capita GDP, but have slowed the trends of declining energy and
carbon intensities.
Population grew at an average annual rate of 0.7% during 2005-14, and the U.S. economy,
as measured by GDP, grew by 1.4% per year.
The amount of energy consumption per unit of GDP, or the energy intensity of the U.S.
economy, has generally improved in the past decade, as less energy was needed to
produce economic growth. In 2014, the United States required 13% less energy than in
2005 per unit of GDP. In 2013 there was a slight increase in energy intensity of 0.7%,
largely because of weather-related energy consumption, but energy intensity improved in
2014 by 1.2%.
Carbon intensity, or the amount of CO2 emissions per unit of energy consumption, declined
in total by 8% during 2005-14, with an average annual decline of 0.9%. In 2013 and 2014,
however, carbon intensity declined by only 0.4%.
32 Noted trends and statistics in this section are from Energy Information Administration, U.S. ENERGY-RELATED CARBON DIOXIDE EMISSIONS INCREASE IN PAST TWO YEARS, April 20, 2015 http://www.eia.gov/todayinenergy/detail.cfm?id=20872
27
Estimated emissions of 5,404 million metric tons of CO2 from energy-related sources occurred
in 2014, and energy-related CO2 emissions are projected to increase slightly in both 2015 and
2016. In the Reference case in EIA's recently released Annual Energy Outlook
2015, emissions are expected to increase only slightly, at a rate of 0.1% annually, and to remain
below 2005 levels by more than 400 million metric tons in 2040, and below 1996’s33 level of
5509 million metric tons. Future energy consumption and related emission levels will depend
largely on a mix of weather, energy sources, and economic factors—as well as potential
changes in national and state policies.
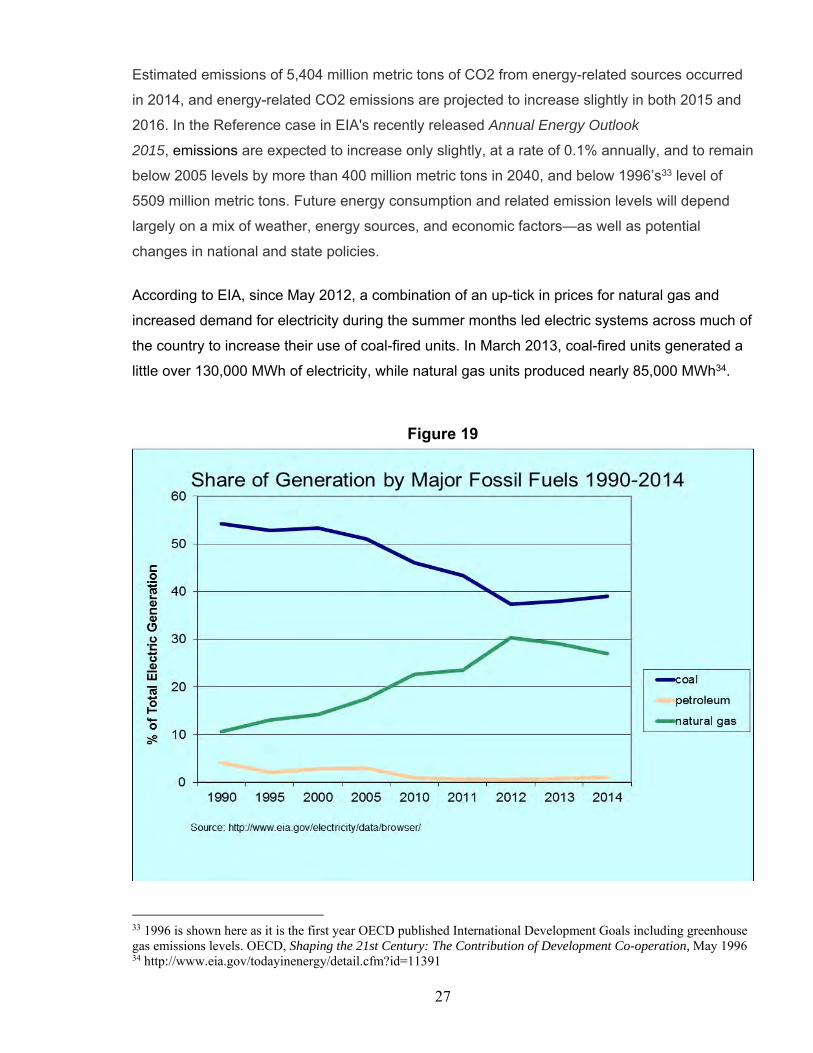
According to EIA, since May 2012, a combination of an up-tick in prices for natural gas and
increased demand for electricity during the summer months led electric systems across much of
the country to increase their use of coal-fired units. In March 2013, coal-fired units generated a
little over 130,000 MWh of electricity, while natural gas units produced nearly 85,000 MWh34.
Figure 19
33 1996 is shown here as it is the first year OECD published International Development Goals including greenhouse gas emissions levels. OECD, Shaping the 21st Century: The Contribution of Development Co-operation, May 1996 34 http://www.eia.gov/todayinenergy/detail.cfm?id=11391
28
Source: http://www.eia.gov/environment/emissions/carbon/ and http://www.eia.gov/todayinenergy/detail.cfm?id=11391#
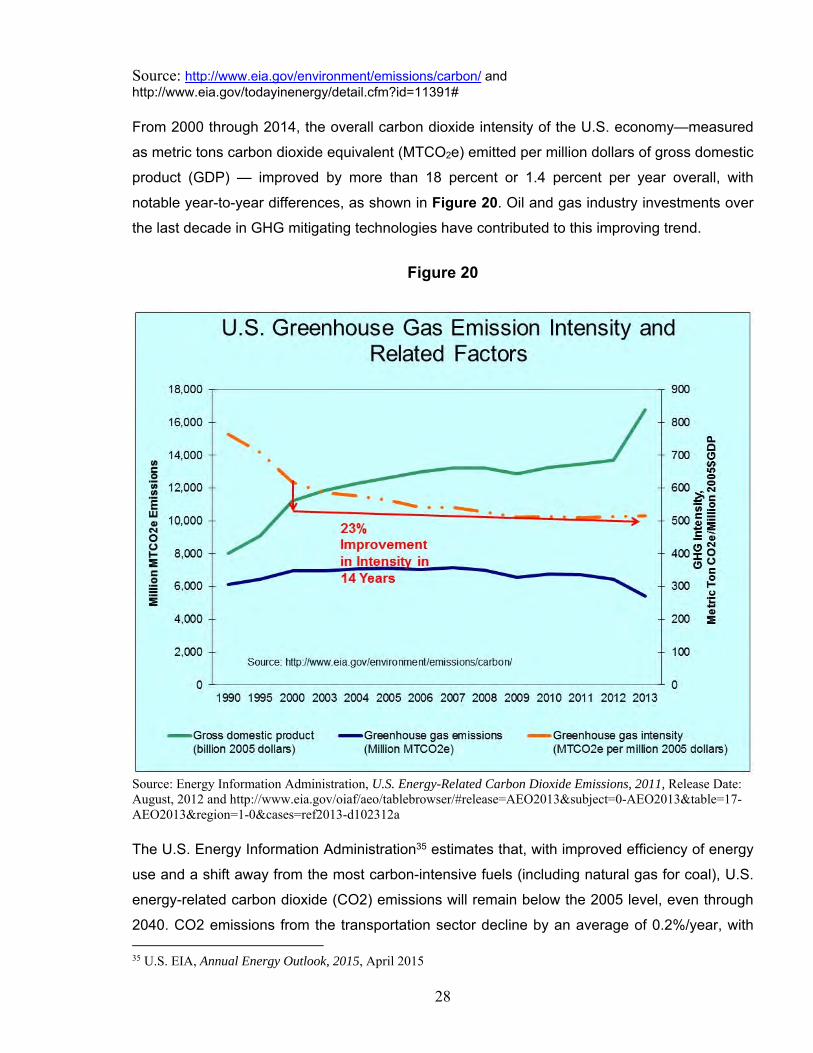
From 2000 through 2014, the overall carbon dioxide intensity of the U.S. economy—measured
as metric tons carbon dioxide equivalent (MTCO2e) emitted per million dollars of gross domestic
product (GDP) — improved by more than 18 percent or 1.4 percent per year overall, with
notable year-to-year differences, as shown in Figure 20. Oil and gas industry investments over
the last decade in GHG mitigating technologies have contributed to this improving trend.
Figure 20
Source: Energy Information Administration, U.S. Energy-Related Carbon Dioxide Emissions, 2011, Release Date: August, 2012 and http://www.eia.gov/oiaf/aeo/tablebrowser/#release=AEO2013&subject=0-AEO2013&table=17-AEO2013®ion=1-0&cases=ref2013-d102312a
The U.S. Energy Information Administration35 estimates that, with improved efficiency of energy
use and a shift away from the most carbon-intensive fuels (including natural gas for coal), U.S.
energy-related carbon dioxide (CO2) emissions will remain below the 2005 level, even through
2040. CO2 emissions from the transportation sector decline by an average of 0.2%/year, with 35 U.S. EIA, Annual Energy Outlook, 2015, April 2015
29
overall improvements in vehicle energy efficiency offsetting increased travel demand, growth in
diesel consumption in freight trucks, and consumer’s preference for larger, less-efficient
vehicles as a result of the lower fuel prices that historically accompany strong growth of
domestic oil and dry natural gas production. EIA attributes the lower emissions to be the result
of the adoption of more efficient automotive technology, and shifts in consumer behavior.
Emissions from coal use in the generation of electricity are expected to continue downward as
power generation shifts away from coal to lower-carbon fuels.
CO2 emissions per 2005 dollar of GDP (carbon intensity) have historically tracked closely with
energy use per dollar of GDP. The U.S. EIA estimates, however, that as lower-carbon fuels
account for a larger share of total energy use, CO2 emissions per 2005 dollar of GDP will
decline more rapidly than energy use per 2005 dollar of GDP, falling by 56 percent from 2005 to
2040, at an annual rate of 2.3 percent per year further improving our carbon intensity.
The most recent analysis, last completed in 2013, by EIA of global emissions36 has non-OECD
Asia accounting for 70 percent of the world’s increased CO2 emissions through 2040. China’s
share of global energy-related CO2 emissions is projected to grow from 21 percent in 2007 to
32 percent in 2040. India accounts for the second-largest share of the projected increase, 7
percent. The U.S. share of world CO2 emissions is projected to fall to 12.5 percent (5691 MMT
out of a global total of 45,455 MMT) in 2040, from about 19.5% today, although the
improvement is likely to be even more pronounced with the larger improvements in carbon
intensity, as described above, through 2040.
Greenhouse Gas Emission Mitigation Technologies
A principal objective of this report is to identify key technologies and their associated
investments that mitigate GHG emissions, or that have the potential to do so in the future.
Sixteen major energy technologies have been identified in this study as actual or potential
mitigation technologies. These technologies have been grouped into four categories (Figure
technologies), and enabling. Biomass, within the non-hydrocarbon category, is further
delineated into electricity and transportation applications, and ethanol is separated into corn and
cellulosic ethanol. Sugar cane is not included here as it is not a major source in the North
American market.
36 U.S. EIA International Energy Outlook 2013, July 25, 2013 37 Carbon Capture and Storage has been moved from “enabling” in the May 2008 Report to “end-use” in the 2011 and later reports.
30
Figure 21
Categorization of GHG Mitigating Technologies38
Category 1. “Fuel substitution” technologies include shale gas, liquefied natural gas (LNG),
nuclear, landfill gas, and methane captured by fugitive gas reducing technologies.
Shale Gas is an important source of expanded supply of natural gas in the U.S. As a greenhouse gas emission reduction technology, shale gas increases the supply of natural gas to the North American market that may substitute for coal, and to a lesser extent for petroleum-based liquid fuels. The potential for greenhouse gas mitigation is determined, however, by the amount of gas-on-gas substitution versus gas-on-coal. Several recent studies demonstrate the greenhouse gas emission reductions are associated with substituting shale gas for coal and other higher GHG intensity fuels. The Massachusetts Institute of Technology (MIT) Energy Initiative found:
o “the role of natural gas is likely to continue to expand, and its relative importance is likely to increase even further when greenhouse gas emissions are constrained.”39
38 In previous editions of this Report, “Fugitive Gas Reducing Technologies” was placed in the End Use Category in this chart. 39 MIT Energy Initiative – Future of Natural Gas, Abstract, p. ix, June 2011
31
MIT further found that replacement of coal by natural gas in U.S. electric generation would involve the “substitution of coal units with an average efficiency of 30% to 35% with gas combined cycle plants with efficiencies in the range of 45% to 55%.”40 Similarly the International Energy Agency in their World Energy Outlook 2011 – Special Report – “Are We Entering a Golden Age of Gas?” concluded that “shale gas produced to proper standards of environmental responsibility has slightly higher ‘well-to-burner’ emissions than conventional gas, with the combustion of gas being the dominant source of emissions.”41 (emphasis added) The National Energy Technology Laboratory (NETL) provided relative lifecycle GHG emission factors42:
o Average Coal: 2,453 lbs CO2e per MWh; o Average Conventional [natural] Gas; 1,041 CO2e per MWh; o Average Unconventional [natural] Gas: 1,139 CO2e per MWh.
Liquefied natural gas (LNG) is natural gas that has been super-cooled to a liquid. This dramatically reduces the volume for cost-effective transport in ships (where transport via conventional natural gas pipelines is cost prohibitive or not feasible). LNG as a transport mode opens up natural gas to become a much more broadly traded international commodity.
Nuclear is limited to the production of electricity and reduces the amount of coal or natural gas consumption for that purpose, and consequently the associated greenhouse gas emissions.
LFG is landfill gas (methane) produced by the anaerobic digestion of waste material.
Historically, that methane was emitted into the atmosphere, but more recently has been collected and used to produce electricity or in transportation applications. According to the Environmental Protection Agency, of the 2,300 or so currently operating or recently closed municipal solid waste landfills in the United States, more than 510 have LFG utilization projects.43 The generation of electricity from LFG makes up about two–thirds of the currently operational projects in the United States, with the remainder in direct use (heat) and transportation application. LFG acts to reduce greenhouse gas emissions first by reducing the amount of methane released to the atmosphere, and secondarily by substituting for higher-carbon content fossil fuels such as coal and petroleum.
Fugitive Gas Emissions can occur when methane, a potent greenhouse gas, is collected
and transported, and certain amounts leak out to the atmosphere. Investments made to reduce fugitive emissions directly and indirectly reduce greenhouse gas emissions. Emissions may indirectly be reduced as lower carbon natural gas is added to the fuel supply.
Category 2. “Non-hydrocarbon” technologies include any energy form that is not a hydrocarbon
energy source. This category includes: wind energy conversion, solar to electric, geothermal
40 MIT Energy Initiative – Future of Natural Gas, Appendix 1A; Life-Cycle Climate Impacts from Fossil Fuel Use, p. 2, June 2011 41 International Energy Agency – World Energy Outlook 2011 – Special Report – “Are We Entering a Golden Age of Gas?” p.7, 2011 42 National Energy Technology Laboratory – Life Cycle Greenhouse Gas Analysis of Natural Gas Extraction & Delivery in the United States, Timothy J. Skone, May 12, 2011 43 http://www.epa.gov/lmop/faq/lfg.html
32
(electric and direct use for industrial application), biomass and biorefinery, biodiesel, and
ethanol production. Ethanol and biodiesel production were included in this category rather than
in the fuel substitution category where they could have also arguably been placed. This
category also includes technologies that facilitate reductions in halogenated fluorocarbons
(HFC), perfluorocarbons and sulfur hexafluoride (SF6).
Ethanol is currently produced by the fermentation of various sugars and starches, primarily from corn and sugar cane. Significant fossil fuel use is involved in corn-based ethanol production both for growing the corn and in producing the ethanol. Most ethanol for fuel is produced in Brazil or the United States. Technological advances may allow ethanol production from cellulosic materials in the longer term. Greenhouse gas emissions benefits associated with corn-based ethanol are likely to be marginal or zero44, and there is significant uncertainty surrounding greenhouse gas emissions benefits associated with cellulosic ethanol, although they are expected to be better than corn based ethanol. As part of revising the National Renewable Fuel Standard program (commonly known as the RFS program) as required by the Energy Independence and Security Act of 2007 (EISA), EPA has analyzed lifecycle greenhouse gas (GHG) emissions from increased renewable fuels use. In February 2010 EPA determined that ethanol produced from corn starch at a new natural gas, biomass, or biogas fired facility (or expanded capacity from such a facility) using advanced efficient technologies will achieve about 20% GHG emission reduction compared to the 2005 gasoline baseline.45
Biomass projects also use plant or animal waste materials to produce energy either from
direct combustion, through thermal gasification, or biologic treatment. Biomass gasification is included in biomass/biorefining, as a precursor to ultimate use, within the nonhydrocarbon group.
Bio-refineries produce a broad slate of products from plant materials, including energy and fuels, plastics, pharmaceuticals and animal feeds. Biodiesel is produced by chemically altering oils (e.g., soybean oil) into diesel fuel substitutes. Also included are other bio-derivatives including those produced as refinery products, such as certain alcohols and alkanes. Another sub-category of biologically derived petroleum substitutes are called biobased products (or bioproducts).
Solar, wind and geothermal are electricity generation technologies that substitute for fossil-based generation technologies. Because, wind and solar can be intermittent in their output, they often require other power plants on a grid to operate in less efficient modes of operation—termed ramping—which can result in reduced or no reductions in fuel use and GHG emissions.
Sulfur hexafluoride (SF6) and Halogenated Fluorocarbons/Perflurocarbons are gases used in industrial applications and refrigeration. Various substitute gases have recently been developed to reduce those applications’ greenhouse gas emissions, or their global
44 National Research Council. Renewable Fuel Standard: Potential Economic and Environmental Effects of U.S. Biofuel Policy. Washington, DC: The National Academies Press, 2011. 45 http://www.epa.gov/otaq/renewablefuels/420f10006.htm
33
warming potential. These gases substitute for other industrial and commercial gases, but are not “fuels” and not considered as fuel substitutes.
Nitrous Oxides (N2O) are produced by both natural and human sources. Primary human-related sources of N2O are agricultural soil management, animal manure management, sewage treatment, adipic acid production, and nitric acid production. Nitrous oxide is also produced naturally from a wide variety of biological sources in soil and water, particularly microbial action in wet tropical forests. Control mechanisms for human sources include improved tillage practices and fertilization techniques, and improved efficiency in manufacture of adipic acid and combustion.
Category 3. “End-use” technologies include stationary fuel-cell applications46, transportation
applications (fuel cell, electric hybrid, and flex-fuel vehicles, high efficiency gasoline and diesel
engines), and cogeneration—regardless of fuel source. The extent of greenhouse gas mitigation
from flexible fuel vehicles depends on the consumers’ actual use of different fuels, and may be
negligible. This category also includes investments made to improve thermodynamic efficiency.
Advanced-Technology Vehicles use both petroleum and non-petroleum based fuels (or mixtures), advanced batteries for hybrid vehicles or fuel-cell technologies. Automakers, engine manufacturers, and oil and gas companies are actively developing vehicle technologies and the advanced fuels of the future that will power them.
Cogeneration, or combined heat and power (CHP) is the simultaneous production of both electricity and thermal energy (steam, hot water, hot air). CHP is an important efficiency improvement compared to separate production of electricity and heat. These facilities range from very small units in commercial buildings to large units at petroleum refineries, and are captured separately from other efficiency improvements.
Efficiency measures include a whole range of technologies, from improved combustion burners, to advanced lighting, and improved process efficiencies, but does not include, for purposes of this report, combined heat and power.
Gas Flaring can occur when methane associated with crude oil production is combusted. In areas of the world lacking infrastructure and markets, this associated gas is usually flared (burned) or sometimes vented (emitted as un-burnt gas). Reducing this flared gas reduces greenhouse gas emissions of either CO2 if the gas is burned, or of methane if the gas is vented. Safety issues may impact the flaring or venting decision.
Carbon Capture and Storage is the capture and long-term storage of carbon dioxide emissions from combustion processes. Over 200 CCS projects were active or planned worldwide at the end of 2010, a net rise of 26 from 200947. Of these, 77 are large-scale integrated projects at various stages of development. North America, Europe, and Australia are home to 87% of all projects. This technology has moved beyond the basic research stage.
Category 4. “Enabling Technologies” are necessary and often basic science and technology that allow other technologies’ use. They include various consortia that are researching and 46 Note that fuel cells as a technology are not separately listed, as they depend on a variety of fuels and can be used in a variety of applications, including transportation and combined heat and power. They are subsumed in the various categories where applicable. 47 Carbon Capture and Storage: A Mixed Review, Robin Beckwith, JPT/JPT Online, May 2011
34
developing a wide variety of technologies, and include several university programs. Their basic and cross cutting application does not allow categorization into one of the other categories.
Investment Estimates Methodology
This analysis was carried out in several steps. The first was an identification of major categories
of emerging energy sources, and the associated emissions control/reduction technologies.
Second, a database of investments was constructed by GHG mitigation technology category
and by investor type, including subcategories48 within the category of “other private industries.”
The database was compiled from a review of over 850 publicly available company annual
reports, federal budget documents, and other public sources, beginning with the database
constructed for the 2013 report, Key Investments in Greenhouse Gas Mitigation Technologies
by Energy Firms, Other Industry and the Federal Government: October 2013. This analysis
examined capital expenditures as listed in the company reports and other documents. No
confidential or non-public company investment information was sought, received, or utilized. If
an investment amount for a relevant technology was specified in a source document it was
included in the database. All investments were initially tabulated in nominal dollars. Because the
investments covered in this report have occurred over a fifteen-year period, it is appropriate to
adjust the annual data for the inflation that has occurred over the study period. Given that most
investments in greenhouse gas mitigation technology covered in this report are spread across
many sectors of the economy, the deflator chosen to convert the annual data to 2010 dollars
was the U.S. Department of Commerce, Bureau of Economic Analysis chain-type deflator for
“Gross Private Domestic Investment.”49
Third, each investment was reviewed to determine if it should remain in the database, be
prorated, or otherwise adjusted from a global level to the North American market. For example,
we identified three major types of investments for LNG: liquefaction, regasification facilities, and
ships. We have only included investments in North American LNG regasification facilities. The
global LNG market also includes investments in ships, and liquefaction facilities in foreign and
domestic locations. Investments in ships and liquefaction facilities were not included in the data
base as they, to a large extent, fall outside the area of the North American market.
48 Subcategories were chosen based simply upon popular terminology. Subcategories were treated the same as other aggregate categories with respect to data sources. Any particular firm was assumed to be entirely within its primary subcategory. For example, a parent company whose primary endeavor is electric utility, was ‘assigned’ to electric utility even if it has business(es) in information technology. No effort was made to prorate investments into different business lines within a firm. 49 Available at http://research.stlouisfed.org/fred2/series/GPDICTPI?cid=21
35
Appendix A Figures Presented in Nominal Dollars
Figure A-1
Figure A-2
36
Figure A-3
Figure A-4
Figure A-5
37
Figure A-6
38
Figure A-7
Figure A-8
39
Figure A-9
Figure A-10
40
Figure A-11
Figure A-12
41
Figure A-13
Figure A-14
42
Figure A-15
43
Appendix B Bibliography
Alpha Natural Resources, Annual Report, 2005 Alpha Natural Resources Annual Report Pursuant To Section 13 Or 15(D) Of The Securities Exchange Act Of 1934; (10-K) For the Fiscal Year Ended December 31, 2005 Alpha Natural Resources, Annual Report, 2006 Alpha Natural Resources Annual Report Pursuant To Section 13 Or 15(D) Of The Securities Exchange Act Of 1934; (10-K) For the Fiscal Year Ended December 31, 2006 Alpha Natural Resources, Annual Report, 2007 Alpha Natural Resources Annual Report Pursuant To Section 13 Or 15(D) Of The Securities Exchange Act Of 1934; (10-K) For the Fiscal Year Ended December 31, 2007 Alpha Natural Resources, Annual Report, 2008 Alpha Natural Resources Annual Report Pursuant To Section 13 Or 15(D) Of The Securities Exchange Act Of 1934; (10-K) For the Fiscal Year Ended December 31, 2008 Alpha Natural Resources, Annual Report, 2009 Alpha Natural Resources Annual Report Pursuant To Section 13 Or 15(D) Of The Securities Exchange Act Of 1934; (10-K) For the Fiscal Year Ended December 31, 2009 Alpha Natural Resources, Annual Report, 2010 Alpha Natural Resources Annual Report Pursuant To Section 13 Or 15(D) Of The Securities Exchange Act Of 1934; (10-K) For the Fiscal Year Ended December 31, 2010 Alpha Natural Resources, Annual Report, 2011 Alpha Natural Resources Annual Report Pursuant To Section 13 Or 15(D) Of The Securities Exchange Act Of 1934; (10-K) For the Fiscal Year Ended December 31, 2011 Alpha Natural Resources, Annual Report, 2012 Alpha Natural Resources Annual Report Pursuant To Section 13 Or 15(D) Of The Securities Exchange Act Of 1934; (10-K) For the Fiscal Year Ended December 31, 2012 Alpha Natural Resources, Annual Report, 2013 Alpha Natural Resources Annual Report Pursuant To Section 13 Or 15(D) Of The Securities Exchange Act Of 1934; (10-K) For the Fiscal Year Ended December 31, 2013 Alpha Natural Resources, Annual Report, 2014 Alpha Natural Resources Annual Report Pursuant To Section 13 Or 15(D) Of The Securities Exchange Act Of 1934; (10-K) For the Fiscal Year Ended December 31, 2014 Amerada Hess Corporation; Annual Report to Shareholders; 2000 Amerada Hess Corporation; Annual Report to Shareholders; 2001 Amerada Hess Corporation; Annual Report to Shareholders; 2002 Amerada Hess Corporation; Annual Report to Shareholders; 2003 Amerada Hess Corporation; Annual Report to Shareholders; 2004 Amerada Hess Corporation; Annual Report to Shareholders; 2005 American Electric Power (AEP) 2000 Annual Report/Appendix A American Electric Power (AEP) 2001 Annual Report/Appendix A American Electric Power (AEP) 2002 Annual Report/Appendix A American Electric Power (AEP) 2003 Annual Report/Appendix A American Electric Power (AEP) 2004 Annual Report/Appendix A American Electric Power (AEP) 2005 Annual Report/Appendix A American Electric Power (AEP) 2006 Annual Report/Appendix A American Electric Power (AEP) 2007 Annual Report/Appendix A American Electric Power (AEP) 2008 Annual Report/Appendix A American Electric Power (AEP) 2009 Annual Report/Appendix A American Electric Power (AEP) 2010 Annual Report/Appendix A American Electric Power (AEP) 2011 Annual Report/Appendix A American Electric Power (AEP) 2012 Annual Report/Appendix A American Electric Power (AEP) 2013 Annual Report/Appendix A American Electric Power (AEP) 2014 Annual Report/Appendix A American Wind Energy Association; http://www.awea.org/projects/
44
American Wind Energy Association; http://www.awea.org/suite/suite.cfm?CFID=297674921&CFTOKEN=87705055&jsessionid=7830b310eb3 d3fbbee90185e3d4c3d666e5f Anadarko Petroleum, Inc. Annual Report to Shareholders; 2000 Anadarko Petroleum, Inc. Annual Report to Shareholders; 2001 Anadarko Petroleum, Inc. Annual Report to Shareholders; 2002 Anadarko Petroleum, Inc. Annual Report to Shareholders; 2002 Anadarko Petroleum, Inc. Annual Report to Shareholders; 2004 Anadarko Petroleum, Inc. Annual Report to Shareholders; 2005 Anadarko Petroleum, Inc. Annual Report to Shareholders; 2006 Anadarko Petroleum, Inc. Annual Report to Shareholders; 2007 Anadarko Petroleum, Inc. Annual Report to Shareholders; 2008 Anadarko Petroleum, Inc. Annual Report to Shareholders; 2009 Anadarko Petroleum, Inc. Annual Report to Shareholders; 2010 Anadarko Petroleum, Inc. Annual Report to Shareholders; 2011 Anadarko Petroleum, Inc. Annual Report to Shareholders; 2012 Anadarko Petroleum, Inc. Annual Report to Shareholders; 2013 Anadarko Petroleum, Inc. Annual Report to Shareholders; 2014 Apache Corporation: GHG Emissions Quantification – 2007 Apache Corporation; Annual Report to Shareholders; 2000 Apache Corporation; Annual Report to Shareholders; 2001 Apache Corporation; Annual Report to Shareholders; 2002 Apache Corporation; Annual Report to Shareholders; 2003 Apache Corporation; Annual Report to Shareholders; 2004 Apache Corporation; Annual Report to Shareholders; 2005 Apache Corporation; Annual Report to Shareholders; 2006 Apache Corporation; Annual Report to Shareholders; 2007 Apache Corporation; Annual Report to Shareholders; 2008 Apache Corporation; Annual Report to Shareholders; 2009 Apache Corporation; Annual Report to Shareholders; 2010 Apache Corporation; Annual Report to Shareholders; 2011 Apache Corporation; Annual Report to Shareholders; 2012 Apache Corporation; Annual Report to Shareholders; 2013 Apache Corporation; Annual Report to Shareholders; 2014 Arch Coal Inc, Annual Report 2010 Arch Coal Inc, Annual Report 2011 Arch Coal Inc, Annual Report 2012 Arch Coal Inc, Annual Report 2013 Arch Coal Inc, Annual Report 2014 Arch Coal Inc, 2011-2012 Corporate Social Responsibility Report Berkshire Hathaway Energy, Annual 2011 http://www.berkshirehathawayenergyco.com/investors/financial-filings Berkshire Hathaway Energy, Annual 2012 http://www.berkshirehathawayenergyco.com/investors/financial-filings Berkshire Hathaway Energy, Annual 2013 http://www.berkshirehathawayenergyco.com/investors/financial-filings Berkshire Hathaway Energy, Annual 2014 http://www.berkshirehathawayenergyco.com/investors/financial-filings BP America, Inc.; Annual Report to Shareholders; 2000 BP America, Inc.; Annual Report to Shareholders; 2001 BP America, Inc.; Annual Report to Shareholders; 2002 BP America, Inc.; Annual Report to Shareholders; 2003 BP America, Inc.; Annual Report to Shareholders; 2004 BP America, Inc.; Annual Report to Shareholders; 2005 BP America, Inc.; Annual Report to Shareholders; 2006 BP America, Inc.; Annual Report to Shareholders; 2007 BP America, Inc.; Annual Report to Shareholders; 2009 BP America, Inc.; Annual Report to Shareholders; 2010 BP America, Inc.; Annual Report to Shareholders; 2011 BP America, Inc.; Annual Report to Shareholders; 2012
45
BP America, Inc.; Annual Report to Shareholders; 2013 BP America, Inc.; Annual Report to Shareholders; 2014 BP, Sustainability Report 2007 BP, Sustainability Report 2008 BP, Sustainability Report 2009 BP, Sustainability Report 2010 BP, Sustainability Report 2011 BP, Sustainability Report 2012 BP, Sustainability Report 2013 BP, Sustainability Report 2014 BP Energy Outlook 2035, February 2015 Burlington Resources Inc. Annual Report to Shareholders; 2000 Burlington Resources Inc. Annual Report to Shareholders; 2001 Burlington Resources Inc. Annual Report to Shareholders; 2002 Burlington Resources Inc. Annual Report to Shareholders; 2003 Burlington Resources Inc. Annual Report to Shareholders; 2004 Burlington Resources Inc. Annual Report to Shareholders; 2005 Canadian Association of Petroleum Producers; http://www.capp.ca/raw.asp?x=1&dt=NTV&e=PDF&dn=34093 http://www.capp.ca/environmentCommunity/Climate/Pages/What-We-Are-Doing.aspx http://www.capp.ca/environmentCommunity/airClimateChange/Pages/GreenhouseGasEmissions.aspx Chesapeake Energy Corporation; Report to Shareholders; 2000 Chesapeake Energy Corporation; Report to Shareholders; 2001 Chesapeake Energy Corporation; Report to Shareholders; 2002 Chesapeake Energy Corporation; Report to Shareholders; 2003 Chesapeake Energy Corporation; Report to Shareholders; 2004 Chesapeake Energy Corporation; Report to Shareholders; 2005 Chesapeake Energy Corporation; Report to Shareholders; 2006 Chesapeake Energy Corporation; Report to Shareholders; 2007 Chesapeake Energy Corporation; Report to Shareholders; 2008 Chesapeake Energy Corporation; Report to Shareholders; 2009 Chesapeake Energy Corporation; Report to Shareholders; 2010 Chesapeake Energy Corporation; Report to Shareholders; 2011 Chesapeake Energy Corporation; Report to Shareholders; 2012 Chesapeake Energy Corporation; Report to Shareholders; 2013 Chesapeake Energy Corporation; Report to Shareholders; 2014 Chevron Corporation; Annual Report to Shareholders; 2000 Chevron Corporation; Annual Report to Shareholders; 2001 Chevron Corporation; Annual Report to Shareholders; 2002 Chevron Corporation; Annual Report to Shareholders; 2003 Chevron Corporation; Annual Report to Shareholders; 2004 Chevron Corporation; Annual Report to Shareholders; 2005 Chevron Corporation; Annual Report to Shareholders; 2006 Chevron Corporation; Annual Report to Shareholders; 2007 Chevron Corporation; Annual Report to Shareholders; 2008 Chevron Corporation; Annual Report to Shareholders; 2009 Chevron Corporation; Annual Report to Shareholders; 2010 Chevron Corporation; Annual Report to Shareholders; 2011 Chevron Corporation; Annual Report to Shareholders; 2012 Chevron Corporation; Annual Report to Shareholders; 2013 Chevron Corporation; Annual Report to Shareholders; 2014 CITGO Petroleum Corporation Annual Report Pursuant To Section 13 Or 15(D) Of The Securities Exchange Act Of 1934; (10-K) For the Fiscal Year Ended December 31, 2000 CITGO Petroleum Corporation Annual Report Pursuant To Section 13 Or 15(D) Of The Securities Exchange Act Of 1934; (10-K) For the Fiscal Year Ended December 31, 2001 CITGO Petroleum Corporation Annual Report Pursuant To Section 13 Or 15(D) Of The Securities Exchange Act Of 1934; (10-K) For the Fiscal Year Ended December 31, 2002 CITGO Petroleum Corporation Annual Report Pursuant To Section 13 Or 15(D) Of The Securities Exchange Act Of 1934; (10-K) For the Fiscal Year Ended December 31, 2003
46
CITGO Petroleum Corporation Annual Report Pursuant To Section 13 Or 15(D) Of The Securities Exchange Act Of 1934; (10-K) For the Fiscal Year Ended December 31, 2004 CITGO Petroleum Corporation Annual Report Pursuant To Section 13 Or 15(D) Of The Securities Exchange Act Of 1934; (10-K) For the Fiscal Year Ended December 31, 2005 CITGO Petroleum Corporation Annual Report Pursuant To Section 13 Or 15(D) Of The Securities Exchange Act Of 1934; (10-K) For the Fiscal Year Ended December 31, 2006 CITGO Petroleum Corporation Annual Report Pursuant To Section 13 Or 15(D) Of The Securities Exchange Act Of 1934; (10-K) For the Fiscal Year Ended December 31, 2007 CITGO Petroleum Corporation Annual Report Pursuant To Section 13 Or 15(D) Of The Securities Exchange Act Of 1934; (10-K) For the Fiscal Year Ended December 31, 2008 CITGO Petroleum Corporation Annual Report Pursuant To Section 13 Or 15(D) Of The Securities Exchange Act Of 1934; (10-K) For the Fiscal Year Ended December 31, 2009 CITGO Petroleum Corporation Annual Report Pursuant To Section 13 Or 15(D) Of The Securities Exchange Act Of 1934; (10-K) For the Fiscal Year Ended December 31, 2010 CITGO Petroleum Corporation 2012 Corporate Social Responsibility Report 2011 CITGO Petroleum Corporation 2012 Corporate Social Responsibility Report 2012 CITGO Petroleum Corporation 2012 Corporate Social Responsibility Report 2013 CITGO Petroleum Corporation 2012 Corporate Social Responsibility Report 2014 Cloud Peak Energy, 2009 Annual Corporate Report Cloud Peak Energy, 2010 Annual Corporate Report Cloud Peak Energy, 2011 Annual Corporate Report Cloud Peak Energy, 2012 Annual Corporate Report Cloud Peak Energy, 2013 Annual Corporate Report Cloud Peak Energy, 2014 Annual Corporate Report ConocoPhillips Petroleum Company Annual Report to Shareholders, 2000 ConocoPhillips Petroleum Company Annual Report to Shareholders, 2001 ConocoPhillips Petroleum Company Annual Report to Shareholders, 2002 ConocoPhillips Petroleum Company Annual Report to Shareholders, 2003 ConocoPhillips Petroleum Company Annual Report to Shareholders, 2004 ConocoPhillips Petroleum Company Annual Report to Shareholders, 2005 ConocoPhillips Petroleum Company Annual Report to Shareholders, 2006 ConocoPhillips Petroleum Company Annual Report to Shareholders, 2007 ConocoPhillips Petroleum Company Annual Report to Shareholders, 2008 ConocoPhillips Petroleum Company Annual Report to Shareholders, 2009 ConocoPhillips Petroleum Company Annual Report to Shareholders, 2010 ConocoPhillips Petroleum Company Annual Report to Shareholders, 2011 ConocoPhillips Petroleum Company Annual Report to Shareholders, 2012 ConocoPhillips Petroleum Company Annual Report to Shareholders, 2013 ConocoPhillips Petroleum Company Annual Report to Shareholders, 2014 ConocoPhillips Petroleum Company; Sustainable Development Report – Baseline; 2004 ConocoPhillips Petroleum Company; Sustainable Development Report – 2006 ConocoPhillips, 2008 Sustainable Development Review ConocoPhillips, 2012 Sustainable Development Review; http://www.conocophillips.com/EN/susdev/environment/climatechange/Pages/index.aspx ConocoPhillips; Technology and Innovation Initiative, Technology and Innovation Initiatives http://www.conocophillips.com/sustainable-development/environment/climate-change/climate-change-action-plan/Pages/action-plan.aspx DaimlerChrysler Group; Annual Report to Shareholders; 2000 DaimlerChrysler Group; Annual Report to Shareholders; 2001 DaimlerChrysler Group; Annual Report to Shareholders; 2002 DaimlerChrysler Group; Annual Report to Shareholders; 2003 DaimlerChrysler Group; Annual Report to Shareholders; 2004 DaimlerChrysler Group; Annual Report to Shareholders; 2005 DaimlerChrysler Group; Annual Report to Shareholders; 2006 DaimlerChrysler Group; Annual Report to Shareholders; 2007 DaimlerChrysler Group; Annual Report to Shareholders; 2008 DaimlerChrysler Group; Annual Report to Shareholders; 2009 DaimlerChrysler Group; Annual Report to Shareholders; 2010 DaimlerChrysler Group; Annual Report to Shareholders; 2011
47
DaimlerChrysler Group; Annual Report to Shareholders; 2012 DaimlerChrysler Group; Annual Report to Shareholders; 2013 DaimlerChrysler Group; Annual Report to Shareholders; 2014 Devon Energy 2008/2009 Corporate Responsibility Report Devon Energy Corporation Annual Report Pursuant To Section 13 Or 15(D) Of The Securities Exchange Act Of 1934; (10-K) For the Fiscal Year Ended December 31, 2000 Devon Energy Corporation Annual Report Pursuant To Section 13 Or 15(D) Of The Securities Exchange Act Of 1934; (10-K) For the Fiscal Year Ended December 31, 2001 Devon Energy Corporation Annual Report Pursuant To Section 13 Or 15(D) Of The Securities Exchange Act Of 1934; (10-K) For the Fiscal Year Ended December 31, 2002 Devon Energy Corporation Annual Report Pursuant To Section 13 Or 15(D) Of The Securities Exchange Act Of 1934; (10-K) For the Fiscal Year Ended December 31, 2003 Devon Energy Corporation Annual Report Pursuant To Section 13 Or 15(D) Of The Securities Exchange Act Of 1934; (10-K) For the Fiscal Year Ended December 31, 2004 Devon Energy Corporation Annual Report Pursuant To Section 13 Or 15(D) Of The Securities Exchange Act Of 1934; (10-K) For the Fiscal Year Ended December 31, 2005 Devon Energy Corporation Annual Report Pursuant To Section 13 Or 15(D) Of The Securities Exchange Act Of 1934; (10-K) For the Fiscal Year Ended December 31, 2006 Devon Energy Corporation Annual Report Pursuant To Section 13 Or 15(D) Of The Securities Exchange Act Of 1934; (10-K) For the Fiscal Year Ended December 31, 2007 Devon Energy Corporation Annual Report Pursuant To Section 13 Or 15(D) Of The Securities Exchange Act Of 1934; (10-K) For the Fiscal Year Ended December 31, 2008 Devon Energy Corporation Annual Report Pursuant To Section 13 Or 15(D) Of The Securities Exchange Act Of 1934; (10-K) For the Fiscal Year Ended December 31, 2009 Devon Energy Corporation Annual Report Pursuant To Section 13 Or 15(D) Of The Securities Exchange Act Of 1934; (10-K) For the Fiscal Year Ended December 31, 2010 Devon Energy Corporation Annual Report Pursuant To Section 13 Or 15(D) Of The Securities Exchange Act Of 1934; (10-K) For the Fiscal Year Ended December 31, 2011 Devon Energy Corporation Annual Report Pursuant To Section 13 Or 15(D) Of The Securities Exchange Act Of 1934; (10-K) For the Fiscal Year Ended December 31, 2012 Devon Energy Corporation Annual Report Pursuant To Section 13 Or 15(D) Of The Securities Exchange Act Of 1934; (10-K) For the Fiscal Year Ended December 31, 2013 Devon Energy Corporation Annual Report Pursuant To Section 13 Or 15(D) Of The Securities Exchange Act Of 1934; (10-K) For the Fiscal Year Ended December 31, 2014 Duke Energy, 2006 Annual Report And Form 10-K Duke Energy, 2007 Annual Report And Form 10-K Duke Energy, 2008 Annual Report And Form 10-K Duke Energy, 2009 Annual Report And Form 10-K Duke Energy, 2010 Annual Report And Form 10-K Duke Energy, 2011 Annual Report And Form 10-K Duke Energy, 2012 Annual Report And Form 10-K Duke Energy, 2013 Annual Report And Form 10-K Duke Energy, 2014 Annual Report And Form 10-K Duke Energy, Connected: 2006 Sustainability Report Duke Energy, Connected: 2007 Sustainability Report Duke Energy, Connected: 2008 Sustainability Report Duke Energy, Connected: 2009 Sustainability Report Duke Energy, Connected: 2010 Sustainability Report Duke Energy, Connected: 2011 Sustainability Report Duke Energy, Connected: 2012 Sustainability Report Duke Energy, Connected: 2013 Sustainability Report Duke Energy, Connected: 2014 Sustainability Report Dominion Resources, 2008/2009 Corporate Responsibility Report Dominion Resources, Inc. Annual Report to Shareholders; 2003 Edison International Annual Report 2000 Edison International Annual Report 2001 Edison International Annual Report 2002 Edison International Annual Report 2003 Edison International Annual Report 2004 Edison International Annual Report 2005
48
Edison International Annual Report 2006 Edison International Annual Report 2007 Edison International Annual Report 2008 Edison International Annual Report 2009 Edison International Annual Report 2010 Edison International Annual Report 2011 Edison International Annual Report 2012 Edison International Annual Report 2013 Edison International Annual Report 2014 El Paso Corporation Annual Report Pursuant To Section 13 Or 15(D) Of The Securities Exchange Act Of 1934; (10-K) For the Fiscal Year Ended December 31, 2000 El Paso Corporation Annual Report Pursuant To Section 13 Or 15(D) Of The Securities Exchange Act Of 1934; (10-K) For the Fiscal Year Ended December 31, 2001 El Paso Corporation Annual Report Pursuant To Section 13 Or 15(D) Of The Securities Exchange Act Of 1934; (10-K) For the Fiscal Year Ended December 31, 2002 El Paso Corporation Annual Report Pursuant To Section 13 Or 15(D) Of The Securities Exchange Act Of 1934; (10-K) For the Fiscal Year Ended December 31, 2003 El Paso Corporation Annual Report Pursuant To Section 13 Or 15(D) Of The Securities Exchange Act Of 1934; (10-K) For the Fiscal Year Ended December 31, 2004 El Paso Corporation Annual Report Pursuant To Section 13 Or 15(D) Of The Securities Exchange Act Of 1934; (10-K) For the Fiscal Year Ended December 31, 2005 El Paso Corporation Annual Report Pursuant To Section 13 Or 15(D) Of The Securities Exchange Act Of 1934; (10-K) For the Fiscal Year Ended December 31, 2006 El Paso Corporation Annual Report Pursuant To Section 13 Or 15(D) Of The Securities Exchange Act Of 1934; (10-K) For the Fiscal Year Ended December 31, 2007 El Paso Corporation Annual Report Pursuant To Section 13 Or 15(D) Of The Securities Exchange Act Of 1934; (10-K) For the Fiscal Year Ended December 31, 2008 El Paso Corporation Annual Report Pursuant To Section 13 Or 15(D) Of The Securities Exchange Act Of 1934; (10-K) For the Fiscal Year Ended December 31, 2009 El Paso Corporation Annual Report Pursuant To Section 13 Or 15(D) Of The Securities Exchange Act Of 1934; (10-K) For the Fiscal Year Ended December 31, 2010 El Paso Corporation Annual Report Pursuant To Section 13 Or 15(D) Of The Securities Exchange Act Of 1934; (10-K) For the Fiscal Year Ended December 31, 2011 El Paso Corporation Annual Report Pursuant To Section 13 Or 15(D) Of The Securities Exchange Act Of 1934; (10-K) For the Fiscal Year Ended December 31, 2012 El Paso Corporation, Corporate Sustainability Report, 2008 Energy Information Administration, Annual Energy Outlook 2008 Energy Information Administration, Annual Energy Outlook 2009 Energy Information Administration, Annual Energy Outlook 2010 Energy Information Administration, Annual Energy Outlook 2011 Energy Information Administration, Annual Energy Outlook 2013 Energy Information Administration, Annual Energy Outlook 2015 Energy Information Administration, International Energy Outlook, DOE/EIA-0484, September 2011 Energy Information Administration, Form EIA-886, "Annual Survey of Alternative Fueled Vehicles" Energy Information Administration, Emissions of Greenhouse Gases in the United States 2009, March 2011 Energy Information Administration, Emissions of Greenhouse Gases in the United States 2010, August 2011 Energy Information Administration, U.S. Energy Related Carbon Dioxide Emissions, 2011, August 2012 Energy Transfer Partners, Annual Report Pursuant To Section 13 Or 15(D) Of The Securities Exchange Act Of 1934; (10-K) For the Fiscal Year Ended December 31, 2011 Energy Transfer Partners, Annual Report Pursuant To Section 13 Or 15(D) Of The Securities Exchange Act Of 1934; (10-K) For the Fiscal Year Ended December 31, 2012 EOG Resources, Inc. Annual Report Pursuant To Section 13 Or 15(D) Of The Securities Exchange Act Of 1934; (10-K) For the Fiscal Year Ended December 31, 2000 EOG Resources, Inc. Annual Report Pursuant To Section 13 Or 15(D) Of The Securities Exchange Act Of 1934; (10-K) For the Fiscal Year Ended December 31, 2001 EOG Resources, Inc. Annual Report Pursuant To Section 13 Or 15(D) Of The Securities Exchange Act Of 1934; (10-K) For the Fiscal Year Ended December 31, 2002 EOG Resources, Inc. Annual Report Pursuant To Section 13 Or 15(D) Of The Securities Exchange Act Of 1934; (10-K) For the Fiscal Year Ended December 31, 2003
49
EOG Resources, Inc. Annual Report Pursuant To Section 13 Or 15(D) Of The Securities Exchange Act Of 1934; (10-K) For the Fiscal Year Ended December 31, 2004 EOG Resources, Inc. Annual Report Pursuant To Section 13 Or 15(D) Of The Securities Exchange Act Of 1934; (10-K) For the Fiscal Year Ended December 31, 2005 EOG Resources, Inc. Annual Report Pursuant To Section 13 Or 15(D) Of The Securities Exchange Act Of 1934; (10-K) For the Fiscal Year Ended December 31, 2006 EOG Resources, Inc. Annual Report Pursuant To Section 13 Or 15(D) Of The Securities Exchange Act Of 1934; (10-K) For the Fiscal Year Ended December 31, 2007 EOG Resources, Inc. Annual Report Pursuant To Section 13 Or 15(D) Of The Securities Exchange Act Of 1934; (10-K) For the Fiscal Year Ended December 31, 2008 EOG Resources, Inc. Annual Report Pursuant To Section 13 Or 15(D) Of The Securities Exchange Act Of 1934; (10-K) For the Fiscal Year Ended December 31, 2009 EOG Resources, Inc. Annual Report Pursuant To Section 13 Or 15(D) Of The Securities Exchange Act Of 1934; (10-K) For the Fiscal Year Ended December 31, 2010 EOG Resources, Inc. Annual Report Pursuant To Section 13 Or 15(D) Of The Securities Exchange Act Of 1934; (10-K) For the Fiscal Year Ended December 31, 2011 EOG Resources, Inc. Annual Report Pursuant To Section 13 Or 15(D) Of The Securities Exchange Act Of 1934; (10-K) For the Fiscal Year Ended December 31, 2012 Equitable Resources, Inc. Annual Report Pursuant To Section 13 Or 15(D) Of The Securities Exchange Act Of 1934; (10-K) For The Fiscal Year Ended December 31, 2000 Equitable Resources, Inc. Annual Report Pursuant To Section 13 Or 15(D) Of The Securities Exchange Act Of 1934; (10-K) For The Fiscal Year Ended December 31, 2001 Equitable Resources, Inc. Annual Report Pursuant To Section 13 Or 15(D) Of The Securities Exchange Act Of 1934; (10-K) For The Fiscal Year Ended December 31, 2002 Equitable Resources, Inc. Annual Report Pursuant To Section 13 Or 15(D) Of The Securities Exchange Act Of 1934; (10-K) For The Fiscal Year Ended December 31, 2003 Equitable Resources, Inc. Annual Report Pursuant To Section 13 Or 15(D) Of The Securities Exchange Act Of 1934; (10-K) For The Fiscal Year Ended December 31, 2004 Equitable Resources, Inc. Annual Report Pursuant To Section 13 Or 15(D) Of The Securities Exchange Act Of 1934; (10-K) For The Fiscal Year Ended December 31, 2005 Equitable Resources, Inc. Annual Report Pursuant To Section 13 Or 15(D) Of The Securities Exchange Act Of 1934; (10-K) For The Fiscal Year Ended December 31, 2006 Equitable Resources, Inc. Annual Report Pursuant To Section 13 Or 15(D) Of The Securities Exchange Act Of 1934; (10-K) For The Fiscal Year Ended December 31, 2007 Equitable Resources, Inc. Annual Report Pursuant To Section 13 Or 15(D) Of The Securities Exchange Act Of 1934; (10-K) For The Fiscal Year Ended December 31, 2008 Equitable Resources, Inc. Annual Report Pursuant To Section 13 Or 15(D) Of The Securities Exchange Act Of 1934; (10-K) For The Fiscal Year Ended December 31, 2009 Equitable Resources, Inc. Annual Report Pursuant To Section 13 Or 15(D) Of The Securities Exchange Act Of 1934; (10-K) For The Fiscal Year Ended December 31, 2010 Equitable Resources, Inc. Annual Report Pursuant To Section 13 Or 15(D) Of The Securities Exchange Act Of 1934; (10-K) For The Fiscal Year Ended December 31, 2011 Equitable Resources, Inc. Annual Report Pursuant To Section 13 Or 15(D) Of The Securities Exchange Act Of 1934; (10-K) For The Fiscal Year Ended December 31, 2012 Exxon Mobil Corporation Annual Report to Shareholders; 2000 Exxon Mobil Corporation Annual Report to Shareholders; 2001 Exxon Mobil Corporation Annual Report to Shareholders; 2002 Exxon Mobil Corporation Annual Report to Shareholders; 2003 Exxon Mobil Corporation Annual Report to Shareholders; 2004 Exxon Mobil Corporation Annual Report to Shareholders; 2005 Exxon Mobil Corporation Annual Report to Shareholders; 2006 Exxon Mobil Corporation Annual Report to Shareholders; 2007 Exxon Mobil Corporation Annual Report to Shareholders; 2008 Exxon Mobil Corporation Annual Report to Shareholders; 2009 Exxon Mobil Corporation Annual Report to Shareholders; 2010 Exxon Mobil Corporation Annual Report to Shareholders; 2011 Exxon Mobil Corporation Annual Report to Shareholders; 2012 ExxonMobil Corporation, 2008 Corporate Citizenship Report ExxonMobil Corporation, 2009 Corporate Citizenship Report ExxonMobil Corporation, 2010 Corporate Citizenship Report
50
http://www.exxonmobil.com/Corporate/safety_climate.aspx Frank Rusco, Director Natural Resources and Environment, United States Government Accountability
Office, Testimony Before the Subcommittee on Oversight and Investigations, Committee on Energy and Commerce, House of Representatives, RECOVERY ACT Status of Department of Energy’s Obligations and Spending, March 17, 2011
Ford Motor Company; Annual Report; 2000 Ford Motor Company; Annual Report; 2001 Ford Motor Company; Annual Report; 2002 Ford Motor Company; Annual Report; 2003 Ford Motor Company; Annual Report; 2004 Ford Motor Company; Annual Report; 2005 Ford Motor Company; Annual Report; 2006 Ford Motor Company; Annual Report; 2007 Ford Motor Company; Annual Report; 2008 Ford Motor Company; Annual Report; 2009 Ford Motor Company; Annual Report; 2010 Ford Motor Company; Annual Report; 2011 Ford Motor Company; Annual Report; 2012 Frazier, Barnes and Associates; http://www.agecon.uga.edu/~caed/biodieselrpt.pdf; 2003 General Motors Corp.; Annual Shareholders Report; 2000 General Motors Corp.; Annual Shareholders Report; 2001 General Motors Corp.; Annual Shareholders Report; 2002 General Motors Corp.; Annual Shareholders Report; 2003 General Motors Corp.; Annual Shareholders Report; 2004 General Motors Corp.; Annual Shareholders Report; 2005 General Motors Corp.; Annual Shareholders Report; 2006 General Motors Corp.; Annual Shareholders Report; 2007 General Motors Corp.; Annual Shareholders Report; 2008 General Motors Corp.; Annual Shareholders Report; 2009 General Motors Corp.; Annual Shareholders Report; 2010 General Motors Corp.; Annual Shareholders Report; 2011 General Motors Corp.; Annual Shareholders Report; 2012 Hess Corporation, 2008 Corporate Sustainability Report Hess Corporation, 2009 Corporate Sustainability Report Hess Corporation, 2010 Corporate Sustainability Report Hess Corporation, 2011 Corporate Sustainability Report Hess Corporation; Annual Report to Shareholders; 2006 Hess Corporation; Annual Report to Shareholders; 2007 Hess Corporation; Annual Report to Shareholders; 2008 Hess Corporation; Annual Report; 2009 Hess Corporation; Annual Report; 2010 Hess Corporation; Annual Report; 2011 Hess Corporation; Annual Report; 2012 Honda Corporation, North America; North American Environmental Report, 2005 Honda Corporation, North America; North American Environmental Report, 2006 Honda Corporation, North America; North American Environmental Report, 2007 Honda Corporation, North America; North American Environmental Report, 2008 Honda Corporation, North America; North American Environmental Report, 2009 Honda Corporation, North America; North American Environmental Report, 2010 Honda Corporation, North America; North American Environmental Report, 2011 Honda Corporation, North America; North American Environmental Report, 2012 http://209.85.165.104/search?q=cache:8_EmYPfUutYJ:sec.edgar- online.com/2006/02/23/0000950129-06-001722/Section5.asp+elk+hills+shale+ percent24+million+capex&hl=en&ct=clnk&cd=6&gl=us http://209.85.165.104/search?q=cache:8_EmYPfUutYJ:sec.edgar- online.com/2006/02/23/0000950129-06-001722/Section5.asp+elk+hills+shale+ percent24+million+capex&hl=en&ct=clnk&cd=6&gl=us http://209.85.165.104/search?q=cache:8_EmYPfUutYJ:sec.edgar-online.com/2006/02/23/0000950129-06- 001722/Section5.asp+elk+hills+shale+%24+million+capex&hl=en&ct=clnk&cd=6&gl=us
http://ir.kindermorgan.com/sites/kindermorgan.investorhq.businesswire.com/files/report/additional/KMI-2001-10K_Final.pdf http://ir.kindermorgan.com/sites/kindermorgan.investorhq.businesswire.com/files/report/additional/KMI-2002-10K_Final.pdf http://ir.kindermorgan.com/sites/kindermorgan.investorhq.businesswire.com/files/report/additional/KMI-2003-10K_Final.pdf http://ir.kindermorgan.com/sites/kindermorgan.investorhq.businesswire.com/files/report/additional/KMI-2004-10K_Final.pdf http://ir.kindermorgan.com/sites/kindermorgan.investorhq.businesswire.com/files/report/additional/KMI-2005-10K_Final.pdf http://ir.kindermorgan.com/sites/kindermorgan.investorhq.businesswire.com/files/report/additional/KMI-2006-10K_Final.pdf http://ir.kindermorgan.com/sites/kindermorgan.investorhq.businesswire.com/files/report/additional/KMI-2007-10K_Final.pdf http://ir.kindermorgan.com/sites/kindermorgan.investorhq.businesswire.com/files/report/additional/KMI-2008-10K_Final.pdf http://ir.kindermorgan.com/sites/kindermorgan.investorhq.businesswire.com/files/report/additional/KMI-2009-10K_Final.pdf http://ir.kindermorgan.com/sites/kindermorgan.investorhq.businesswire.com/files/report/additional/KMI-2010-10K_Final.pdf http://ir.kindermorgan.com/sites/kindermorgan.investorhq.businesswire.com/files/report/additional/KMI-2011-10K_Final.pdf http://ir.kindermorgan.com/sites/kindermorgan.investorhq.businesswire.com/files/report/additional/KMI-2012-10K_Final.pdf http://ir.kindermorgan.com/sites/kindermorgan.investorhq.businesswire.com/files/report/additional/KMI-2013-10K_Final.pdf http://ir.kindermorgan.com/sites/kindermorgan.investorhq.businesswire.com/files/report/additional/KMI-2014-10K_Final.pdf Kerr-McGee Corporation Annual Report Pursuant To Section 13 Or 15(D) Of The Securities Exchange Act Of 1934; (10-K) For the Fiscal Year Ended December 31, 2000 Kerr-McGee Corporation Annual Report Pursuant To Section 13 Or 15(D) Of The Securities Exchange Act Of 1934; (10-K) For the Fiscal Year Ended December 31, 2001 Kerr-McGee Corporation Annual Report Pursuant To Section 13 Or 15(D) Of The Securities Exchange Act Of 1934; (10-K) For the Fiscal Year Ended December 31, 2002 Kerr-McGee Corporation Annual Report Pursuant To Section 13 Or 15(D) Of The Securities Exchange Act Of 1934; (10-K) For the Fiscal Year Ended December 31, 2003 Kerr-McGee Corporation Annual Report Pursuant To Section 13 Or 15(D) Of The Securities Exchange Act Of 1934; (10-K) For the Fiscal Year Ended December 31, 2004 Kerr-McGee Corporation Annual Report Pursuant To Section 13 Or 15(D) Of The Securities Exchange Act Of 1934; (10-K) For the Fiscal Year Ended December 31, 2005 Lyondell-CITGO Refining, L.P. Annual Report Pursuant To Section 13 Or 15(D) Of The Securities Exchange Act Of 1934; (10-K) For the Fiscal Year Ended December 31, 2001 Lyondell-CITGO Refining, L.P. Annual Report Pursuant To Section 13 Or 15(D) Of The Securities Exchange Act Of 1934; (10-K) For the Fiscal Year Ended December 31, 2002 Lyondell-CITGO Refining, L.P. Annual Report Pursuant To Section 13 Or 15(D) Of The Securities Exchange Act Of 1934; (10-K) For the Fiscal Year Ended December 31, 2003 Lyondell-CITGO Refining, L.P. Annual Report Pursuant To Section 13 Or 15(D) Of The Securities Exchange Act Of 1934; (10-K) For the Fiscal Year Ended December 31, 2004 Marathon Oil Corporation Annual Report to Shareholders; 2000 Marathon Oil Corporation Annual Report to Shareholders; 2001 Marathon Oil Corporation Annual Report to Shareholders; 2002 Marathon Oil Corporation Annual Report to Shareholders; 2003 Marathon Oil Corporation Annual Report to Shareholders; 2004 Marathon Oil Corporation Annual Report to Shareholders; 2005 Marathon Oil Corporation Annual Report to Shareholders; 2006 Marathon Oil Corporation Annual Report to Shareholders; 2007 Marathon Oil Corporation Annual Report to Shareholders; 2008 Marathon Oil Corporation Annual Report to Shareholders; 2009 Marathon Oil Corporation Annual Report to Shareholders; 2010 Marathon Petroleum Corporation Annual Report to Shareholders; 2011
56
Marathon Petroleum Corporation Annual Report to Shareholders; 2012 Marathon Oil Corporation Annual Review; 2011 Marathon Oil Corporation Annual Review; 2012 Marathon Oil Corporation Annual Review; 2013 Marathon Oil Corporation Annual Review; 2014 Marathon Oil Corporation, 2005 “Report Card” Marathon Oil Corporation, 2006 Corporate Social Responsibility Report Marathon Oil Corporation, 2007 Corporate Social Responsibility Report Marathon Oil Corporation, 2008 Corporate Social Responsibility Report Marathon Oil Corporation, 2009 Corporate Social Responsibility Report Marathon Oil Corporation, 2011 Corporate Social Responsibility Report Marathon Oil Corporation, 2012 Corporate Social Responsibility Report Marathon Oil Corporation, 2013 Corporate Social Responsibility Report Marathon Oil Corporation, 2014 Corporate Social Responsibility Report Motiva Enterprises, L.L.C. Annual Report Pursuant To Section 13 Or 15(D) Of The Securities Exchange Act Of 1934; (10-K) For the Fiscal Year Ended December 31, 2000 Motiva Enterprises, L.L.C. Annual Report Pursuant To Section 13 Or 15(D) Of The Securities Exchange Act Of 1934; (10-K) For the Fiscal Year Ended December 31, 2001 Motiva Enterprises, L.L.C. Annual Report Pursuant To Section 13 Or 15(D) Of The Securities Exchange Act Of 1934; (10-K) For the Fiscal Year Ended December 31, 2002 Motiva Enterprises, L.L.C. Annual Report Pursuant To Section 13 Or 15(D) Of The Securities Exchange Act Of 1934; (10-K) For the Fiscal Year Ended December 31, 2003 Motiva Enterprises, L.L.C. Annual Report Pursuant To Section 13 Or 15(D) Of The Securities Exchange Act Of 1934; (10-K) For the Fiscal Year Ended December 31, 2004 Motiva Enterprises, L.L.C. Annual Report Pursuant To Section 13 Or 15(D) Of The Securities Exchange Act Of 1934; (10-K) For the Fiscal Year Ended December 31, 2005 National Biodiesel Board; http://www.biodiesel.org/ National Biodiesel Board; http://www.biodiesel.org/production/plants National Science Foundation; 2001 Survey of Industrial Research and Development; 2003 National Science Foundation; 2008 Business R&D and Innovation Survey; 2010 Occidental Petroleum Corporation Annual Report to Shareholders; 2000 Occidental Petroleum Corporation Annual Report to Shareholders; 2001 Occidental Petroleum Corporation Annual Report to Shareholders; 2002 Occidental Petroleum Corporation Annual Report to Shareholders; 2003 Occidental Petroleum Corporation Annual Report to Shareholders; 2004 Occidental Petroleum Corporation Annual Report to Shareholders; 2005 Occidental Petroleum Corporation Annual Report to Shareholders; 2006 Occidental Petroleum Corporation Annual Report to Shareholders; 2007 Occidental Petroleum Corporation Annual Report to Shareholders; 2008 Occidental Petroleum Corporation Annual Report to Shareholders; 2009 Occidental Petroleum Corporation Annual Report to Shareholders; 2010 Occidental Petroleum Corporation Annual Report to Shareholders; 2011 Occidental Petroleum Corporation Annual Report to Shareholders; 2012 Occidental Petroleum Corporation Annual Report to Shareholders; 2013 Occidental Petroleum Corporation Annual Report to Shareholders; 2014 Occidental Petroleum Corporation 2008 Social Responsibility Report Occidental Petroleum Corporation 2009 Social Responsibility Report Occidental Petroleum Corporation 2010 Social Responsibility Report Occidental Petroleum Corporation 2011 Social Responsibility Report Occidental Petroleum Corporation 2012 Social Responsibility Report Occidental Petroleum Corporation 2013 Social Responsibility Report Pacific Gas and Electric Corporation, Annual Report to Shareholders, 2000 Pacific Gas and Electric Corporation, Annual Report to Shareholders, 2001 Pacific Gas and Electric Corporation, Annual Report to Shareholders, 2002 Pacific Gas and Electric Corporation, Annual Report to Shareholders, 2003 Pacific Gas and Electric Corporation, Annual Report to Shareholders, 2004 Pacific Gas and Electric Corporation, Annual Report to Shareholders, 2005 Pacific Gas and Electric Corporation, Annual Report to Shareholders, 2006 Pacific Gas and Electric Corporation, Annual Report to Shareholders, 2007 Pacific Gas and Electric Corporation, Annual Report to Shareholders, 2008
57
Pacific Gas and Electric Corporation, Annual Report to Shareholders, 2009 Pacific Gas and Electric Corporation, Annual Report to Shareholders, 2010 Pacific Gas and Electric Corporation, Annual Report to Shareholders, 2011 Pacific Gas and Electric Corporation, Annual Report to Shareholders, 2012 Pacific Gas and Electric Corporation, Annual Report to Shareholders, 2013 Pacific Gas and Electric Corporation, Annual Report to Shareholders, 2014 Peabody Energy Corp, BTU Annual Report, 2010 Peabody Energy Corp, Corporate and Social Responsibility Report. 2011 Peabody Energy Corp, BTU Annual Report, 2011 Peabody Energy Corp, Corporate and Social Responsibility Report. 2012 Peabody Energy Corp, BTU Annual Report, 2012 Peabody Energy Corp, Corporate and Social Responsibility Report. 2013 Peabody Energy Corp, BTU Annual Report, 2013 Peabody Energy Corp, Corporate and Social Responsibility Report. 2014 Peabody Energy Corp, BTU Annual Report, 2014 Progress Energy, 2000 Annual Report And Form 10-K Progress Energy, 2001 Annual Report And Form 10-K Progress Energy, 2002 Annual Report And Form 10-K Progress Energy, 2003 Annual Report And Form 10-K Progress Energy, 2004 Annual Report And Form 10-K Progress Energy, 2005 Annual Report And Form 10-K Pennsylvania State University: College of Earth and Mineral Sciences: Department of Energy and Mineral
Engineering, The Economic Impacts of the Pennsylvania Marcellus Shale Natural Gas Play: An Update Timothy J. Considine, Robert Watson, Seth Blumsack, May 24, 2010 Premcor, Inc. Annual Report Pursuant To Section 13 Or 15(D) Of The Securities Exchange Act Of 1934; (10-K) For the Fiscal Year Ended December 31, 2000 Premcor, Inc. Annual Report Pursuant To Section 13 Or 15(D) Of The Securities Exchange Act Of 1934; (10-K) For the Fiscal Year Ended December 31, 2001 Premcor, Inc. Annual Report Pursuant To Section 13 Or 15(D) Of The Securities Exchange Act Of 1934; (10-K) For the Fiscal Year Ended December 31, 2002 Premcor, Inc. Annual Report Pursuant To Section 13 Or 15(D) Of The Securities Exchange Act Of 1934; (10-K) For the Fiscal Year Ended December 31, 2003 Premcor, Inc. Annual Report Pursuant To Section 13 Or 15(D) Of The Securities Exchange Act Of 1934; (10-K) For the Fiscal Year Ended December 31, 2004 Premcor, Inc. Annual Report Pursuant To Section 13 Or 15(D) Of The Securities Exchange Act Of 1934; (10-K) For the Fiscal Year Ended December 31, 2005 REN21 Renewable Energy Policy Network. 2005. Renewables 2005 Global Status Report. Washington, DC: Worldwatch Institute. REN21 Renewable Energy Policy Network , Global Status Report, June 2012 Rio Tinto Group, Annual Report 2008, and Annual Report Pursuant To Section 13 Or 15(D) Of The Securities Exchange Act Of 1934 For The Fiscal Year Ended 31 December 2008 Rio Tinto Group, Annual Report 2008, and Annual Report Pursuant To Section 13 Or 15(D) Of The Securities Exchange Act Of 1934 For The Fiscal Year Ended 31 December 2009 Rio Tinto Group, Annual Report 2008, and Annual Report Pursuant To Section 13 Or 15(D) Of The Securities Exchange Act Of 1934 For The Fiscal Year Ended 31 December 2010 Rio Tinto Group, Annual Report 2008, and Annual Report Pursuant To Section 13 Or 15(D) Of The Securities Exchange Act Of 1934 For The Fiscal Year Ended 31 December 2011 Rio Tinto Group, Annual Report 2008, and Annual Report Pursuant To Section 13 Or 15(D) Of The Securities Exchange Act Of 1934 For The Fiscal Year Ended 31 December 2012 Rio Tinto Group, Annual Report 2008, and Annual Report Pursuant To Section 13 Or 15(D) Of The Securities Exchange Act Of 1934 For The Fiscal Year Ended 31 December 2013 Rio Tinto Group, Annual Report 2008, and Annual Report Pursuant To Section 13 Or 15(D) Of The Securities Exchange Act Of 1934 For The Fiscal Year Ended 31 December 2014Shell Oil Company Annual Report to Shareholders; 2000 Shell Oil Company Annual Report to Shareholders; 2001 Shell Oil Company Annual Report to Shareholders; 2002 Shell Oil Company Annual Report to Shareholders; 2003 Shell Oil Company Annual Report to Shareholders; 2004 Shell Oil Company Annual Report to Shareholders; 2005 Shell Oil Company Annual Report to Shareholders; 2006
58
Shell Oil Company Annual Report to Shareholders; 2007 Shell Oil Company Annual Report to Shareholders; 2008 Shell Oil Company Annual Report to Shareholders; 2009 Shell Oil Company Annual Report to Shareholders; 2010 Shell Oil Company Annual Report to Shareholders; 2011 Shell Oil Company Annual Report to Shareholders; 2012 Shell Oil Company Annual Report to Shareholders; 2013 Shell Oil Company Annual Report to Shareholders; 2014 Shell Oil Company; http://eng.volkswagen-media- services.com/medias_publish/m...lose_ethanol_in_germany.standard.gid- oeffentlichkeit.html Shell Oil Company; Shell Sustainability Report 2006 Shell Oil Company; Shell Sustainability Report 2007 Shell Oil Company; Shell Sustainability Report 2008 Shell Oil Company; Shell Sustainability Report 2009 Shell Oil Company; Shell Sustainability Report 2010 Shell Oil Company; Shell Sustainability Summary 2011 Shell Oil Company; Shell Sustainability Report 2012 Shell Oil Company; Shell Sustainability Report 2013 Shell Oil Company; Shell Sustainability Report 2014 Shell Technology webcast – February 21, 2007
sites.nppd.com/IO/spring06.pdf Southern Company Annual Report 2000 Southern Company Annual Report 2001 Southern Company Annual Report 2002 Southern Company Annual Report 2003 Southern Company Annual Report 2004 Southern Company Annual Report 2005 Southern Company Annual Report 2006 Southern Company Annual Report 2007 Southern Company Annual Report 2008 Southern Company Annual Report 2009 Southern Company Annual Report 2010 Southern Company Annual Report 2011 Southern Company Annual Report 2012 Southern Company Annual Report 2013 Southern Company Annual Report 2014 Sunoco, Inc. Annual Report Pursuant To Section 13 Or 15(D) Of The Securities Exchange Act Of 1934; (10-K) For the Fiscal Year Ended December 31, 2000 Sunoco, Inc. Annual Report Pursuant To Section 13 Or 15(D) Of The Securities Exchange Act Of 1934; (10-K) For the Fiscal Year Ended December 31, 2001 Sunoco, Inc. Annual Report Pursuant To Section 13 Or 15(D) Of The Securities Exchange Act Of 1934; (10-K) For the Fiscal Year Ended December 31, 2002 Sunoco, Inc. Annual Report Pursuant To Section 13 Or 15(D) Of The Securities Exchange Act Of 1934; (10-K) For the Fiscal Year Ended December 31, 2003 Sunoco, Inc. Annual Report Pursuant To Section 13 Or 15(D) Of The Securities Exchange Act Of 1934; (10-K) For the Fiscal Year Ended December 31, 2004 Sunoco, Inc. Annual Report Pursuant To Section 13 Or 15(D) Of The Securities Exchange Act Of 1934; (10-K) For the Fiscal Year Ended December 31, 2005 Sunoco, Inc. Annual Report Pursuant To Section 13 Or 15(D) Of The Securities Exchange Act Of 1934; (10-K) For the Fiscal Year Ended December 31, 2006 Sunoco, Inc. Annual Report Pursuant To Section 13 Or 15(D) Of The Securities Exchange Act Of 1934; (10-K) For the Fiscal Year Ended December 31, 2007 Sunoco, Inc. Annual Report Pursuant To Section 13 Or 15(D) Of The Securities Exchange Act Of 1934; (10-K) For the Fiscal Year Ended December 31, 2008 Sunoco, Inc. Annual Report Pursuant To Section 13 Or 15(D) Of The Securities Exchange Act Of 1934; (10-K) For the Fiscal Year Ended December 31, 2009 Sunoco, Inc. Annual Report Pursuant To Section 13 Or 15(D) Of The Securities Exchange Act Of 1934; (10-K) For the Fiscal Year Ended December 31, 2010
59
Sunoco, Inc. Annual Report Pursuant To Section 13 Or 15(D) Of The Securities Exchange Act Of 1934; (10-K) For the Fiscal Year Ended December 31, 2011 Sunoco, Inc. Annual Report Pursuant To Section 13 Or 15(D) Of The Securities Exchange Act Of 1934; (10-K) For the Fiscal Year Ended December 31, 2012 Sunoco, Inc. Annual Report Pursuant To Section 13 Or 15(D) Of The Securities Exchange Act Of 1934; (10-K) For the Fiscal Year Ended December 31, 2013 Sunoco, Inc. Annual Report Pursuant To Section 13 Or 15(D) Of The Securities Exchange Act Of 1934; (10-K) For the Fiscal Year Ended December 31, 2014 T2 and Associates, Key Investments in Greenhouse Gas Mitigation Technologies by Energy Firms, Other Industry and the Federal Government: An Update, June 2009, and embedded 400+ annual company reports Tesoro Petroleum Corporation Annual Report to Shareholders, 2004 Tesoro Petroleum Corporation Annual Report to Shareholders, 2005 Tesoro Petroleum Corporation Annual Report to Shareholders, 2006 Tesoro Petroleum Corporation Annual Report to Shareholders, 2007 Tesoro Petroleum Corporation Annual Report to Shareholders, 2008 Tesoro Petroleum Corporation Annual Report Pursuant To Section 13 Or 15(D) Of The Securities Exchange Act Of 1934; (10-K) For the Fiscal Year Ended December 31, 2009 Tesoro Petroleum Corporation Annual Report Pursuant To Section 13 Or 15(D) Of The Securities Exchange Act Of 1934; (10-K) For the Fiscal Year Ended December 31, 2010 Tesoro Petroleum Corporation Annual Report Pursuant To Section 13 Or 15(D) Of The Securities Exchange Act Of 1934; (10-K) For the Fiscal Year Ended December 31, 2011 Tesoro Petroleum Corporation Annual Report Pursuant To Section 13 Or 15(D) Of The Securities Exchange Act Of 1934; (10-K) For the Fiscal Year Ended December 31, 2012 Tesoro Petroleum Corporation Annual Report Pursuant To Section 13 Or 15(D) Of The Securities Exchange Act Of 1934; (10-K) For the Fiscal Year Ended December 31, 2013 Tesoro Petroleum Corporation Annual Report Pursuant To Section 13 Or 15(D) Of The Securities Exchange Act Of 1934; (10-K) For the Fiscal Year Ended December 31, 2014 Tesoro Petroleum Corporation Social Responsibility Report 2010 Tesoro Petroleum Corporation Social Responsibility Report 2011 Tesoro Petroleum Corporation Social Responsibility Report 2012 Tesoro Petroleum Corporation Social Responsibility Report 2013 Tesoro Petroleum Corporation Social Responsibility Report 2014 The Williams Companies, Inc. Annual Report to Shareholders, 2003 The Williams Companies, Inc. Annual Report to Shareholders, 2004 The Williams Companies, Inc. Annual Report to Shareholders, 2005 The Williams Companies, Inc. Annual Report to Shareholders, 2006 The Williams Companies, Inc. Annual Report to Shareholders, 2007 The Williams Companies, Inc. Annual Report to Shareholders, 2008 The Williams Companies, Inc. Annual Report to Shareholders, 2009 The Williams Companies, Inc. Annual Report to Shareholders, 2010 The Williams Companies, Inc. Annual Report to Shareholders, 2011 The Williams Companies, Inc. Annual Report to Shareholders, 2012 The Williams Companies, Inc. Annual Report to Shareholders, 2013 The Williams Companies, Inc. Annual Report to Shareholders, 2014 (draft) The Williams Companies, Inc., 2007 Corporate Responsibility Report The Williams Companies, Inc., 2008 Corporate Responsibility Report The Williams Companies, Inc., 2009 Corporate Responsibility Report The Williams Companies, Inc., 2010 Corporate Responsibility Report The Williams Companies, Inc., 2011 Corporate Responsibility Report The Williams Companies, Inc., 2012 Corporate Responsibility Report The Williams Companies, Inc., 2013 Corporate Responsibility Report Total Fina Elf Holdings USA, Inc. Annual Report Pursuant To Section 13 Or 15(D) Of The Securities Exchange Act Of 1934; (10-K) For the Fiscal Year Ended December 31, 2000 Total Fina Elf Holdings USA, Inc. Annual Report Pursuant To Section 13 Or 15(D) Of The Securities Exchange Act Of 1934; (10-K) For the Fiscal Year Ended December 31, 2001 Total Fina Elf Holdings USA, Inc. Annual Report Pursuant To Section 13 Or 15(D) Of The Securities Exchange Act Of 1934; (10-K) For the Fiscal Year Ended December 31, 2002 Total Fina Elf Holdings USA, Inc. Annual Report Pursuant To Section 13 Or 15(D) Of The Securities Exchange Act Of 1934; (10-K) For the Fiscal Year Ended December 31, 2003
60
Total Fina Elf Holdings USA, Inc. Annual Report Pursuant To Section 13 Or 15(D) Of The Securities Exchange Act Of 1934; (10-K) For the Fiscal Year Ended December 31, 2004 Total Fina Elf Holdings USA, Inc. Annual Report Pursuant To Section 13 Or 15(D) Of The Securities Exchange Act Of 1934; (10-K) For the Fiscal Year Ended December 31, 2005 Total Fina Elf Holdings USA, Inc. Annual Report Pursuant To Section 13 Or 15(D) Of The Securities Exchange Act Of 1934; (10-K) For the Fiscal Year Ended December 31, 2007 U.S Department of Energy, General Services Administration; Federal Automotive Statistical Tool U.S. Department of Energy, Energy Information Administration, Form EIA-860, Annual Electric Generator Report. U.S. Department of Energy, Energy Information Administration; Form EIA-886, "Annual Survey of Alternative Fuel Vehicles Suppliers and Users" U.S. Department of Energy, Energy Information Administration; http://www.iea.org/Textbase/stats/rd.asp U.S. Department of Energy; s:/xlsfiles/history tables/BA history by approp 98-06 energy programs U.S. Energy Information Administration Emissions of Greenhouse Gases in the United States 2008, Dec 2009 U.S. Environmental Protection Agency, Inventory Of U.S. Greenhouse Gas Emissions And Sinks: 1990-2011 (April 2013); http://www.epa.gov/climatechange/emissions/usinventoryreport.html Unocal Corporation Annual Report to Shareholders; 2000 Unocal Corporation Annual Report to Shareholders; 2001 Unocal Corporation Annual Report to Shareholders; 2002 Unocal Corporation Annual Report to Shareholders; 2003 Unocal Corporation Annual Report to Shareholders; 2004 Unocal Corporation Annual Report to Shareholders; 2005 Valero Energy Corporation Annual Report to Shareholders, 2002 Valero Energy Corporation Annual Report to Shareholders, 2003 Valero Energy Corporation Annual Report to Shareholders,2004 Valero Energy Corporation Annual Report to Shareholders, 2005 Valero Energy Corporation Annual Report to Shareholders, 2006 Valero Energy Corporation Annual Report to Shareholders, 2007 Valero Energy Corporation Annual Report to Shareholders, 2008 Valero Energy Corporation Annual Report to Shareholders, 2009 Valero Energy Corporation Annual Report to Shareholders, 2010 Valero Energy Corporation Annual Report to Shareholders, 2011 Valero Energy Corporation Annual Report to Shareholders, 2012 Valero Energy Corporation Annual Report to Shareholders, 2013 Valero Energy Corporation Annual Report to Shareholders, 2014 Valero Energy Corporation Social Responsibility Report, 2010 Valero Energy Corporation Social Responsibility Report, 2012 Valero Energy Corporation Social Responsibility Report, 2013 Valero Energy Corporation Social Responsibility Report, 2014 XTO Energy, Inc. Annual Report; 2000 XTO Energy, Inc. Annual Report; 2001 XTO Energy, Inc. Annual Report; 2002 XTO Energy, Inc. Annual Report; 2003 XTO Energy, Inc. Annual Report; 2004 XTO Energy, Inc. Annual Report; 2005 XTO Energy, Inc. Annual Report; 2006 XTO Energy, Inc. Annual Report; 2007 XTO Energy, Inc. Annual Report; 2008 XTO Energy, Inc. Annual Report; 2009