26
Gas Natural Fenosa´s experi developing gas infrastructure January 2015 ience in e 1

Gas Natural Fenosa´s experience developing gas infrastructure
January 2015
experience in gas infrastructure
1

- Gas Natural Fenosa´s overview
Index
- Natural gas world consumption
- Infrastructure Planning
- Gas Natural Fenosa´s Experience
- Gas Infrastructure in Indonesia
- Conclusions- Conclusions
overview
Natural gas world consumption
Experience
Gas Infrastructure in Indonesia
2
Gas Natural
Fenosa
Gas Natural
Fenosa
3

Originsand history
1843 First gas company founded in Spain.
1969 Pioneer in distribution of natural gas in the Iberian Peninsula.
1991 Creation of Gas Natural SDG and integration of the gas distribution sector in Spain (merger of Catalana de Gas, Gas Madrid and Repsol Butano's gas pipeline assets).
1992 Start of international expansion in Latin America, entering Argentine market
2000 First electricity sales in
2009 Acquisition of Unión Fenosa concluded
2010 Launch of Gas Natural Fenosa brand.
1992 Start of international expansion in Latin America, entering Argentine market
First electricity sales in the liberalised Spanish market.
4

PortugalLNG/NG and electricity sales
SpainTransmission, distribution, gas and electricity sales, power generation, upstream, LNG/NG sales and infrastructure
The Group in the World
MexicoGas distribution,power generation
Puerto RicoLNG/NG infrastructure,power generation
and infrastructure
PanamaElectricity distribution, power generation
Dominican RepublicPower generation
Costa RicaPower generation
MoroccoLNG/NG Infrastructure
AngolaLNG/NG Infrastructure
AlgeriaGas supply, LNG/GN infrastructure
power generation
BrazilGas distribution
ArgentinaGas distribution
ColombiaGas and electricitydistribution
PeruGas distribution
ChileGas and electricitydistribution
United KingdomLNG/NG sales
FranceLNG/NG sales
ItalyGas distribution and sales, regasification projects,
BelgiumLNG/NG sales
NetherlandsLNG/NG sales
LuxembourgLNG/NG sales
MoldovaElectricity distribution
regasification projects, LNG/NG sales
JapanLNG/NG sales
IndiaLNG/NG sales
GermanyLNG/NG sales
South AfricaCoal mining
KenyaPower generation
AustraliaPower generation projects
LNG/NG sales
OmanGas supply, LNG/GN infrastructure
AngolaLNG/NG Infrastructure
EgyptGas supply, LNG/GN infrastructure
5

Natural Gas
World
Consumption
6

Primary Energy Natural Gas World Consumption
1973 1980 1990
1688 (19%)1688 (19%)
1234(17%
)
1234(17%
)
977(16%)977
(16%)
World NG Consumption (Mtoe)
Liquefaction Capacity (Mtpa)
1688 (19%)1688 (19%)
1234(17%)1234(17%)
2
146.556
LNG Carrierrs
Nº
m3
23
2.645.321
2 30 606
80RegasificationCapacity (Mtpa)
Source: IEA, WoodMackenzie, IHS
1990 2000 2012
2085(20%)2085(20%)
2848(21%)2848(21%)
1688 (19%)1688 (19%)
642
1688 (19%)1688 (19%)
7
44
4.051.301
92
7.523.440
417
32.447.957
60106
242206246

Infrastructure
Planning
8

Infrastructure Planning NG Value Chain
(DIRECT SUPPLY)
UPSTREAM LIQUEFACTION SHIPPING Gas
Reserves
Infrastructure planning must be done coherent and being coordinated in the all the value chain
(DIRECT SUPPLY)
SHIPPING REGASIFICATON TRANSPORT
AND DISTRIBUTION
Gas Sales
9
Infrastructure planning must be done coherent and being coordinated in the all the value chain

Security of supply
Infrastructure Planning The EnergyTrilemma
Sector Sustainability
Is the system sustainable in the long term ?
4
3
Is the infrastructure being
Cost Efficiency
Is the infrastructure being planned and implemented at low cost and high quality standards ?
Security of supply
Are we securing the supply in the long term ?
1
Sector Sustainability
2
Are we getting the fuel to the
10
Demand Orientation
Are we getting the fuel to the costumers at prices affordable by them?
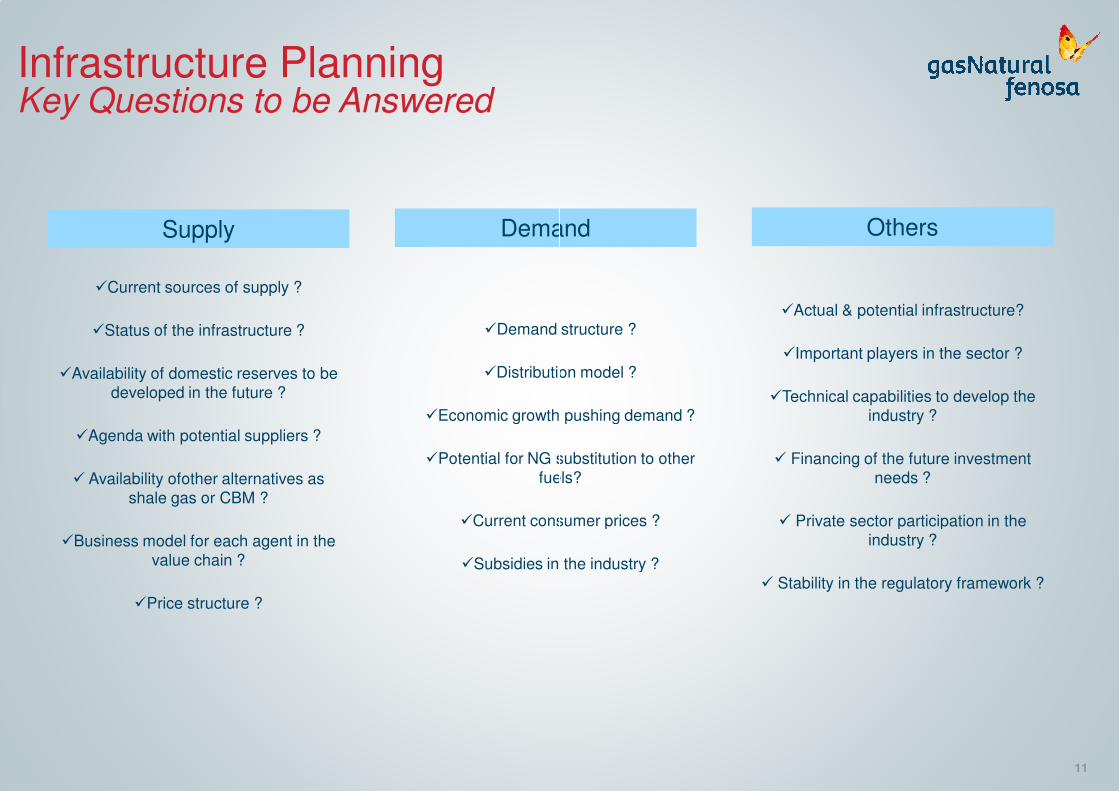
Infrastructure Planning Key Questions to be Answered
Supply Demand
�Current sources of supply ?
�Status of the infrastructure ?
�Availability of domestic reserves to be developed in the future ?
�Agenda with potential suppliers ?
� Availability ofother alternatives as shale gas or CBM ?
�Demand structure ?
�Distribution model ?
�Economic growth pushing demand ?
�Potential for NG substitution to other fuels?
�Current consumer prices ?
�Business model for each agent in the value chain ?
�Price structure ?
�Current consumer prices ?
�Subsidies in the industry ?
Demand Others
Demand structure ?
Distribution model ?
Economic growth pushing demand ?
Potential for NG substitution to other fuels?
Current consumer prices ?
�Actual & potential infrastructure?
�Important players in the sector ?
�Technical capabilities to develop the industry ?
� Financing of the future investment needs ?
� Private sector participation in the
11
Current consumer prices ?
Subsidies in the industry ?
� Private sector participation in the industry ?
� Stability in the regulatory framework ?

GNF
ExperienceExperience
12

UPSTREAM MIDSTREAM
GNF ExperiencePresence in the value chain
LIQUEFACTION PLANTS LNG TRANSPORT
Plant Country Capacity
Damietta (40%) Egypt 5,5 Mtpa
Qalhat (7,4%) Qatar 3,3 Mtpa
≈ 2,5 Mtpy liquefaction capacity 8 LNG carriers + 4 under construction
Ship Name Since
Artic Spirit 1993
Cadiz Knutsen 2004
Castillo de Villalba 2003
Catalunya Spirit 2003
Iberica Knutsen 2006
LNG Libra 1979
Polar Spirit 1993
INTERNATIONAL CONECTIONS
Pipeline Country Capacity
≈ 20 bcmy of international conections
Plant Country
Reganosa (18%) Spain
Sagunto (42,5%) Spain
Ecoeléctrica (50%) P. Rico
Source: GNF Corporate Reports
≈ 8 bcm of regasification
Polar Spirit 1993
Ribera del Duero 2010
REGASIFICATION PLANTS
Pipeline Country Capacity
Medgaz (15%) Algeria 8 bcmy
MEG Algeria 12,5 bcmy
MIDSTREAM DOWNSTREAM
GN DISTRIBUTION PIPELINELNG TRANSPORT
Country Since km
Spain 1969 46.678
Italy 2001 6.958
Mexico 1997 18.874
Argentina 1992 24.496
Brasil 1997 6.661
Colombia 1997 20.293
Chile 2014 N.D
+125.000 km of pipelines worldwide 8 LNG carriers + 4 under construction
Since Capacity (m3)
1993 87.000
2004 135.000
2003 135.000
2003 135.000
2006 135.000
1979 126.000
1993 88.000
Country Capacity
Spain 3,5 bcm
Spain 12,3 bcm
Rico 4 bcm
13
Chile 2014 N.D
regasification capacity
1993 88.000
2010 173.000
REGASIFICATION PLANTS
+17 Tbtuy of LNG distribution by truck
LNG DISTRIBUTION TRUCK
Plant Country Capacity
Spain Spain 17 Tbtuy
France France 2,2 Tbtuy
Peru Peru 2,2 Tbtuy

GNF ExperienceContribution to the sector in Spain
Since the 70’s, strong contribution to the development of the Sector in Spain
40.000
50.000
60.000
70.000
80.000
90.000
NATURAL GAS NETWORK EVOLUTION1985-2013 (km)
0
10.000
20.000
30.000
1985 1990 1995 2000 2005 2010 2013
Total Spain GNF
Source: Sedigas, GNF Corporate Reports
Since the 70’s, strong contribution to the development of the Sector in Spain
15%
6%
6%
20%
Others
NG SALES 2012 (% MARKET SHARE)
Source: CNMC
54%
14

+5.000 M$ invest in the last two decades
GNF ExperienceLong term position in Latam.
200
250
300
350
400
450
500
GNF LATAM. GAS DISTRIBUTION CAPEX 1992-2012 (MILLION $)
0
50
100
150
19
92
19
93
19
94
19
95
19
96
19
97
19
98
19
99
20
00
20
01
20
02
20
03
20
04
20
05
20
06
20
07
20
08
20
09
20
10
20
11
20
12
Mexico Colombia Argentina Brasil
Source: GNF Corporate Reports
+50.000 km of new pipelines in Latam. since 1995
69.054
64.132
56.7632005
2010
2013
GNF LATAM. PIPELINES LENGTH EVOLUTION 1995-2013 (km)
56.763
42.079
17.3391995
2000
2005
15

Market Characteristics
• Upstream and LNG infrastructure
GNF ExperienceKey factors in Latam. emerging markets
• Upstream and LNG infrastructure
•T&D sector with active private participation
• Tariffs and terms regulated by CRE
• Growth potential market
• Regular gas Consumption for power
• Upstream infrastructure
Mexico
•T&D sector with active mostly local participation
• Tariffs and terms regulated by CREG
• Mature Market
• Seasonal gas consumption for power
Colombia
Key factors in the short term
. emerging markets
• Absence of upstream investment
• Absence of a well interconnected high pressure grid
• Uncertain price policy of commodities
• Institutional Coordination
• Absence of upstream investment
16
• Absence of LNG infrastructure
• Absence of a well interconnected high pressure grid
• Power sector driven by availability of hydro generation affecting gas sector
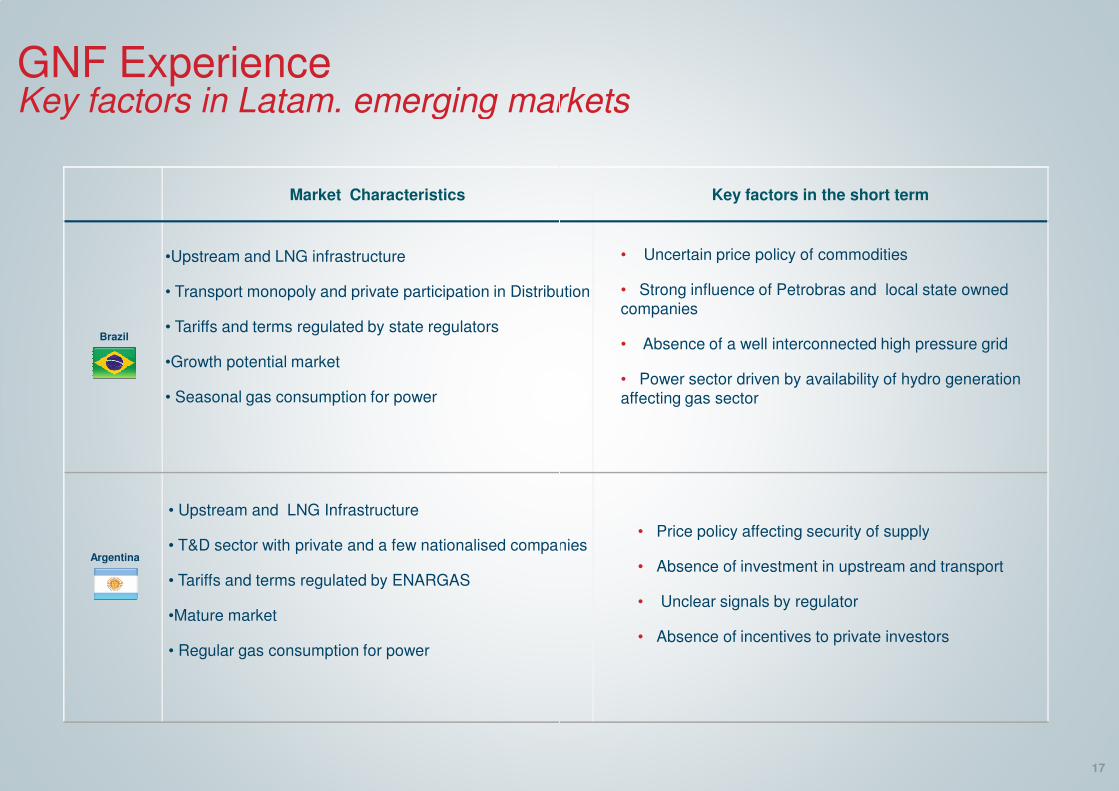
Market Characteristics
•Upstream and LNG infrastructure
GNF ExperienceKey factors in Latam. emerging markets
•Upstream and LNG infrastructure
• Transport monopoly and private participation in Distribution
• Tariffs and terms regulated by state regulators
•Growth potential market
• Seasonal gas consumption for power
• Upstream and LNG Infrastructure
Brazil
• T&D sector with private and a few nationalised companies
• Tariffs and terms regulated by ENARGAS
•Mature market
• Regular gas consumption for power
Argentina
Key factors in the short term
• Uncertain price policy of commodities
. emerging markets
private participation in Distribution • Strong influence of Petrobras and local state owned companies
• Absence of a well interconnected high pressure grid
• Power sector driven by availability of hydro generation affecting gas sector
• Price policy affecting security of supply
17
T&D sector with private and a few nationalised companies• Price policy affecting security of supply
• Absence of investment in upstream and transport
• Unclear signals by regulator
• Absence of incentives to private investors

SPAIN
GNF ExperienceLNG supply by truck - “Virtual transport system”
Business Scheme
FRANCE
PERU
� GNF holds regas capactity in the 6 LNG plants operatingin Spain.
� 73 satellite plants to supply 227 large industrialcustomers (17 Tbtu/year).
� Strong development in the last 20 years as a temporarysolution until the arrival of gas pipeline
“Virtual transport system”
� LNG competiviness vs other fuels (40-50 %).
� Consolidated Technology and Logistics.
� First company in France in commissioning this kind ofplants.
� 15 new industrial customers addressed in the last twoyears with a total volume of 2,2 TBtu/year.
� Ambitious development plan just launched: 73 potentialclientes with a volume of 5 Tbtu/year.
18
� GNF was awarded the public concession for CGD inSouthwest Peru with deliveries through LNG by truck inJuly 2013.
� “Virtual transport system” using tanker trucks bringingliquefied natural gas from the Peru LNG liquefactionplant (950-1000 km) to the satellite plants in the 4 cities,and developing a distribution and sales network.
� 2,2 Tbtu/year to over 170.000 customers in 4 differentcities: Arequipa, Moquegua, Tacna and Ilo.

Gas
Infrastructure
Indonesia
19

Most of resources are in the east while major demand is in the west area of the country
Indonesia Gas InfrastructureCurrent Status
Source: PGN
Need to develop T&D infrastructure in order to feed city gas and commercial demand
20
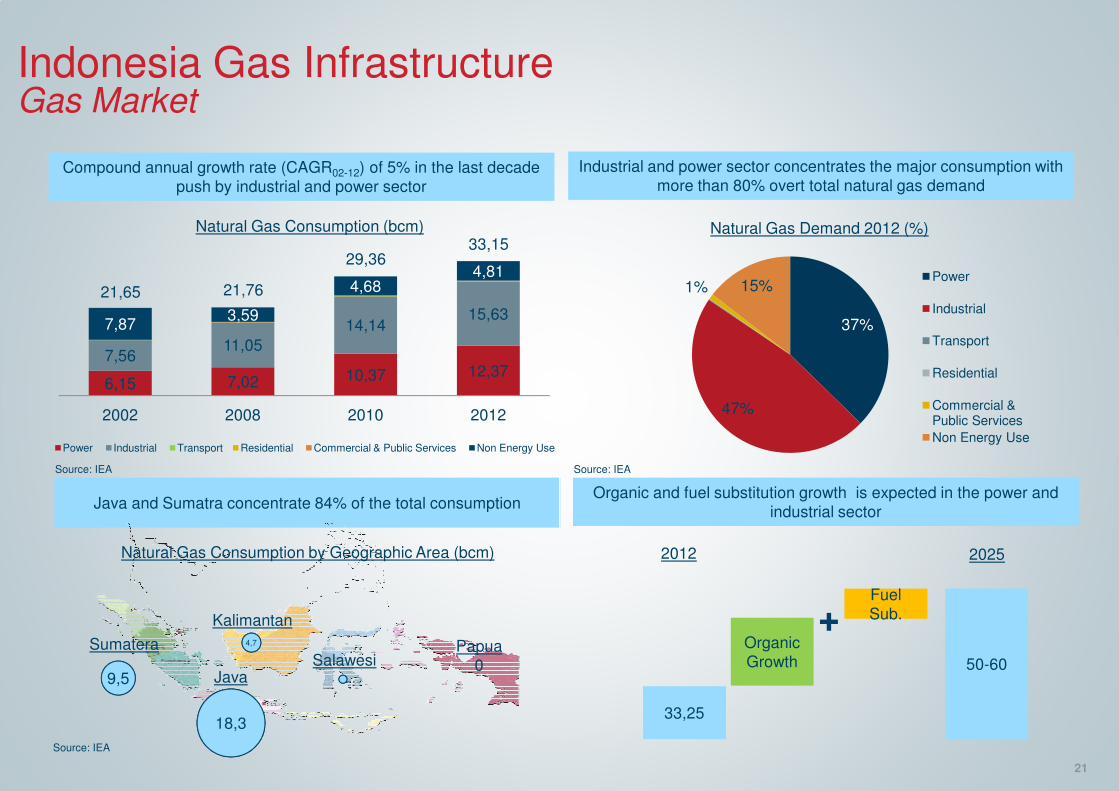
Indonesia Gas InfrastructureGas Market
4,81
Compound annual growth rate (CAGR02-12) of 5% in the last decade push by industrial and power sector
Natural Gas Consumption (bcm)
29,3633,15
6,15 7,02 10,37 12,377,56
11,05
14,1415,63
7,873,59
4,684,81
2002 2008 2010 2012
Power Industrial Transport Residential Commercial & Public Services Non Energy Use
Java and Sumatra concentrate 84% of the total consumption
21,65 21,76
29,36
Source: IEA
Sumatera
Java
Kalimantan
SalawesiPapua
0
18,3
9,5
4,7
Natural Gas Consumption by Geographic Area (bcm)
Source: IEA
Industrial and power sector concentrates the major consumption with more than 80% overt total natural gas demand
Natural Gas Demand 2012 (%)
Organic and fuel substitution growth is expected in the power and industrial sector
37%
47%
1% 15%Power
Industrial
Transport
Residential
Commercial & Public Services
Non Energy Use
Source: IEA
21
2012 2025
33,25
Organic Growth
+Fuel Sub.
50-60

Local Production Depleting
Indonesia Gas InfrastructureKey Issues for Future Planning
Island Chain configuration
Power Generation Power Generation & Industry Diesel Use
Consumer final price of Energy
LNG Import Facilities combined with E&P efforts
Potential for Small Scale LNG
NG Fuel
22
NG Fuel Substitution
Subsidies and price structure strategy

ConclusionsConclusions
23
Infrastructure Planning Infrastructure Planning
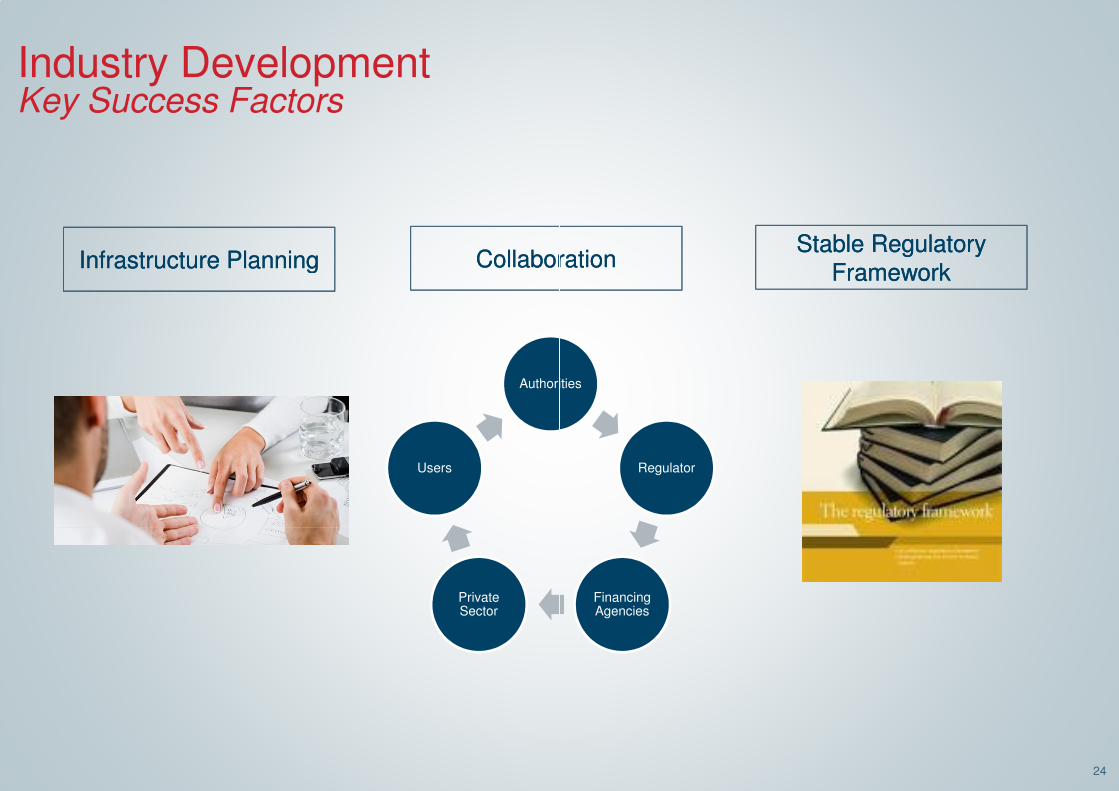
Industry Development Key Success Factors
Collaboration Collaboration Infrastructure Planning Infrastructure Planning Collaboration Collaboration
Authorities
Users
Private Sector
Collaboration Collaboration Stable Regulatory
Framework Stable Regulatory
Framework Collaboration Collaboration
Framework Framework
Authorities
Regulator
24
Financing Agencies

Thank you.
Terima Kasih
Thank you.
Kasih.
This presentation is the property of Gas Natural Fenosa. Both its subject matter and its graphic design is for the exclusive use of its staff.
©Copyright Gas Natural
This presentation is the property of Gas Natural Fenosa. Both its subject matter and its graphic design is for the exclusive use of its staff.
Copyright Gas Natural SDG, S.A.


