50
2016 Census Data Seminar Bathurst
2016 Census Data Seminar Bathurst
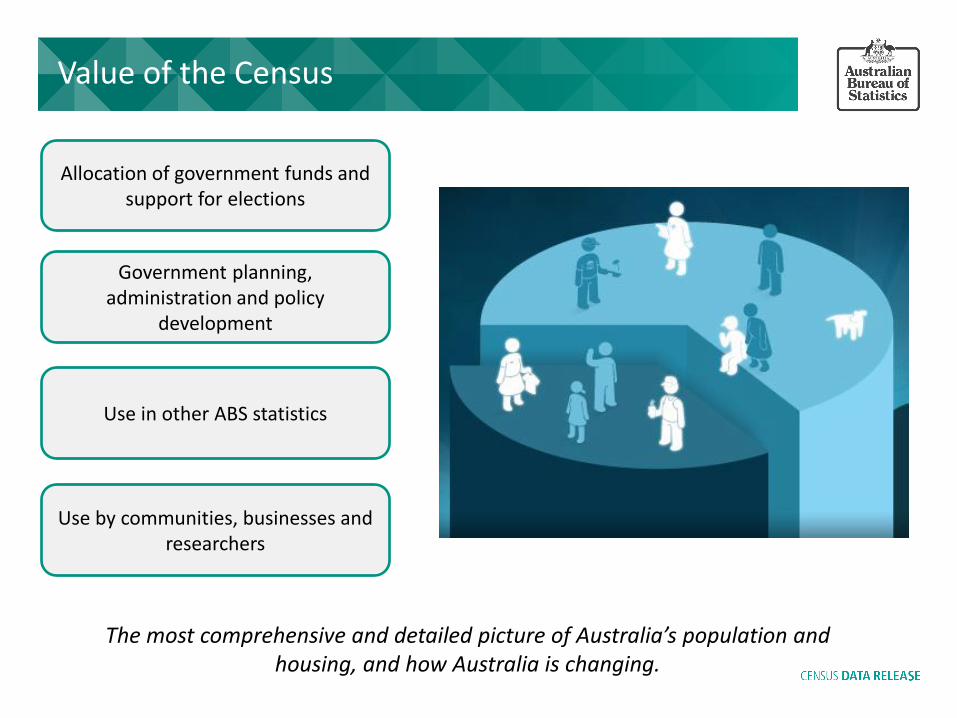
Value of the Census
Allocation of government funds and support for elections
Use in other ABS statistics
Government planning, administration and policy
development
Use by communities, businesses and researchers
The most comprehensive and detailed picture of Australia’s population and housing, and how Australia is changing.
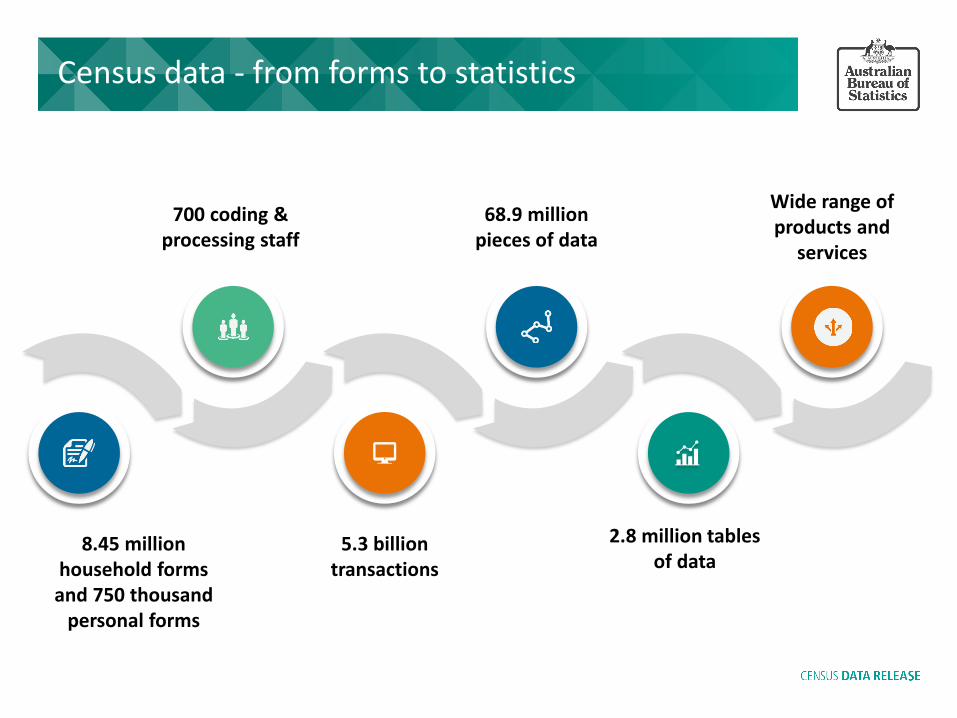
Census data - from forms to statistics
700 coding & processing staff
8.45 million household forms and 750 thousand
personal forms
5.3 billion transactions
68.9 million pieces of data
2.8 million tables of data
Wide range of products and
services
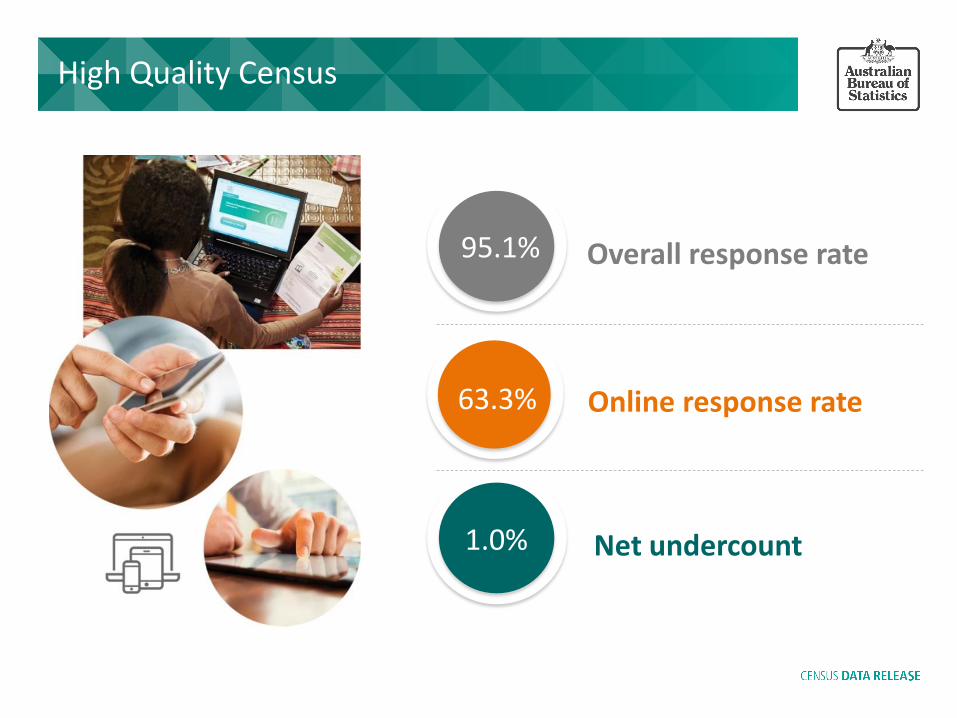
Overall response rate 95.1%
Online response rate 63.3%
Net undercount 1.0%
High Quality Census
Your Australia
2016 Census Data Summary
Snapshot of Australia
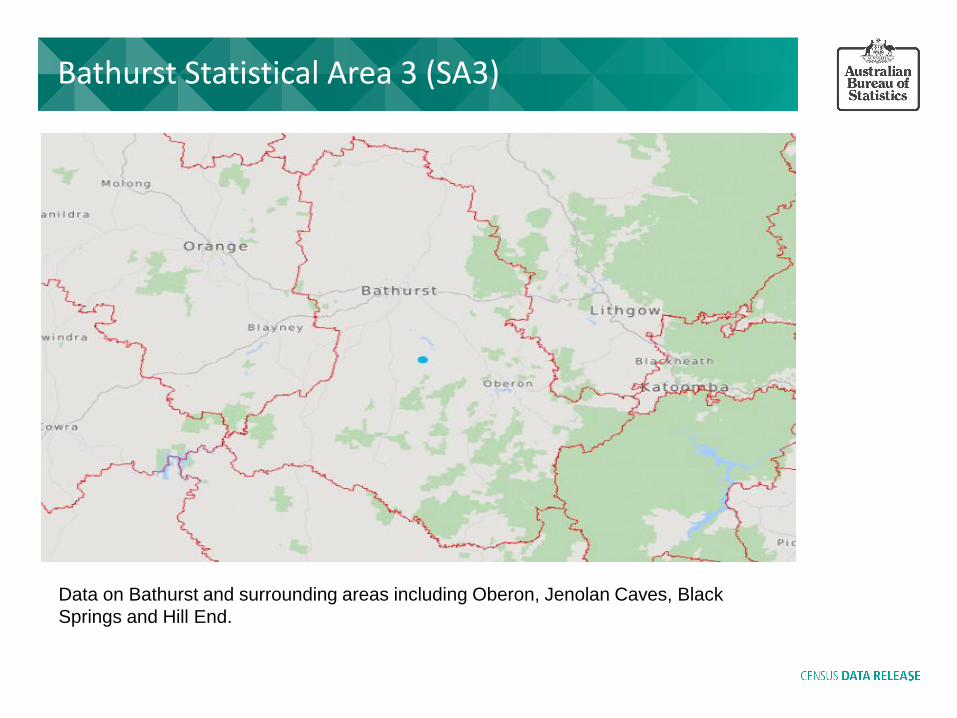
Bathurst Statistical Area 3 (SA3)
Data on Bathurst and surrounding areas including Oberon, Jenolan Caves, Black
Springs and Hill End.
8.9%
3.4 m
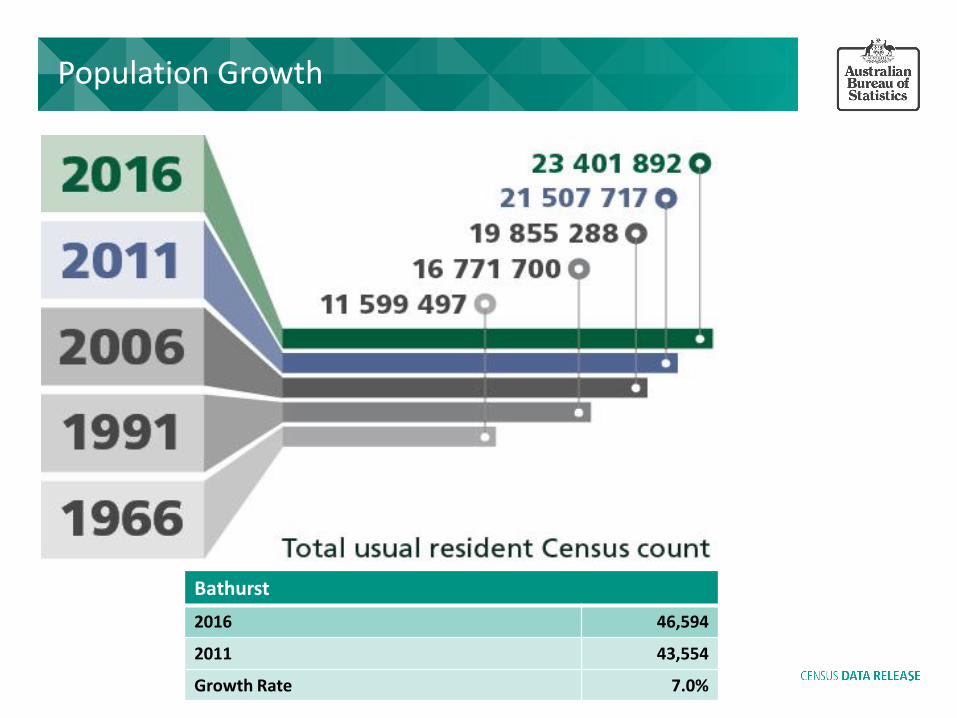
Population Growth
Bathurst
2016 46,594
2011 43,554
Growth Rate 7.0%
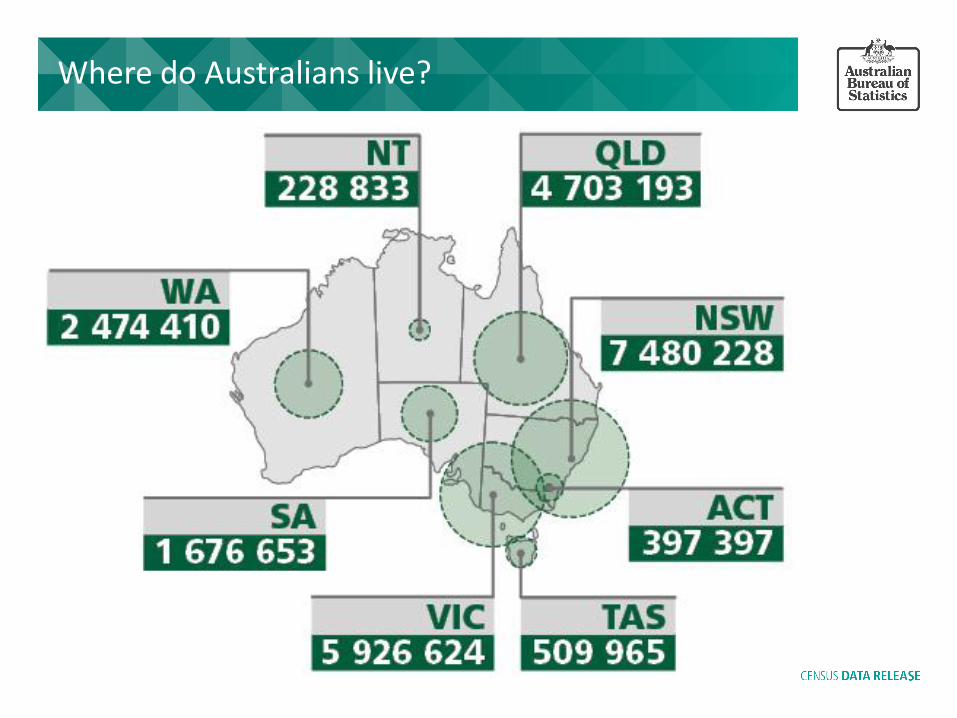
Where do Australians live?
8.9%
3.4 m
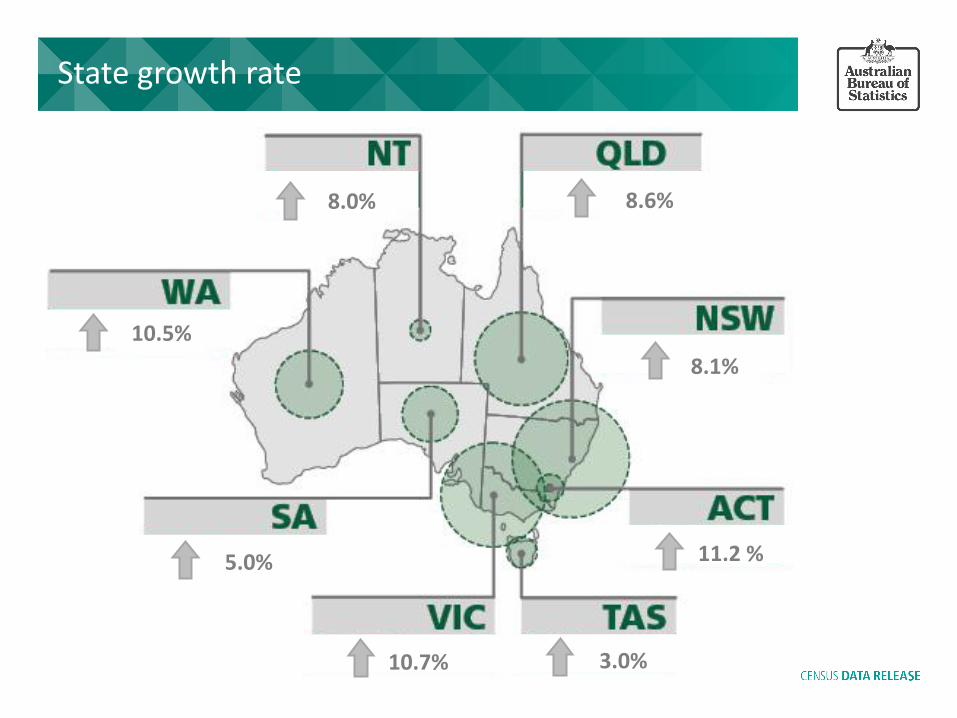
State growth rate
8.9%
3.4 m
8.6%
8.1%
11.2 %
3.0% 10.7%
5.0%
10.5%
8.0%
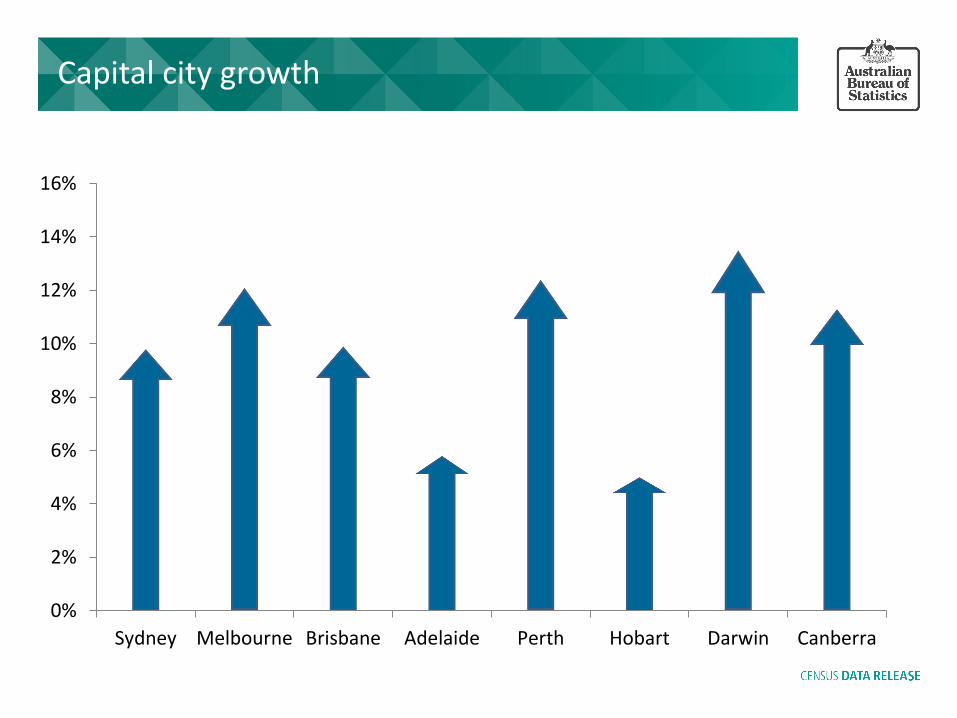
Capital city growth
0%
2%
4%
6%
8%
10%
12%
14%
16%
Sydney Melbourne Brisbane Adelaide Perth Hobart Darwin Canberra

8.9%
3.4 m
2,500,000
3,000,000
3,500,000
4,000,000
4,500,000
5,000,000
1991 1996 2001 2006 2011 2016
Sydney
Melbourne
Population Growth – Melbourne and Sydney
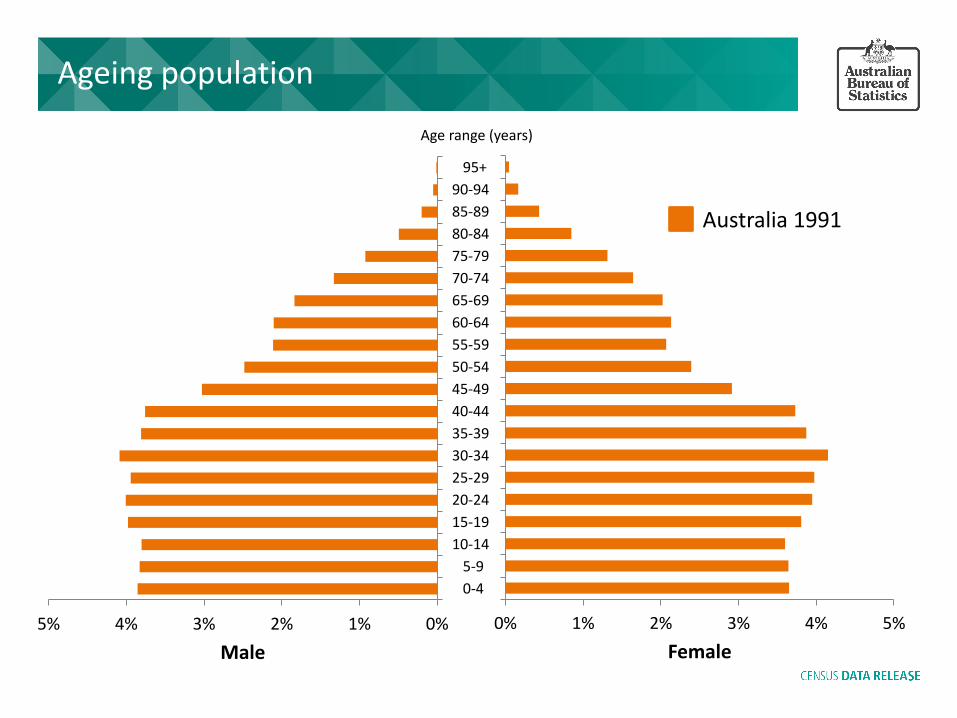
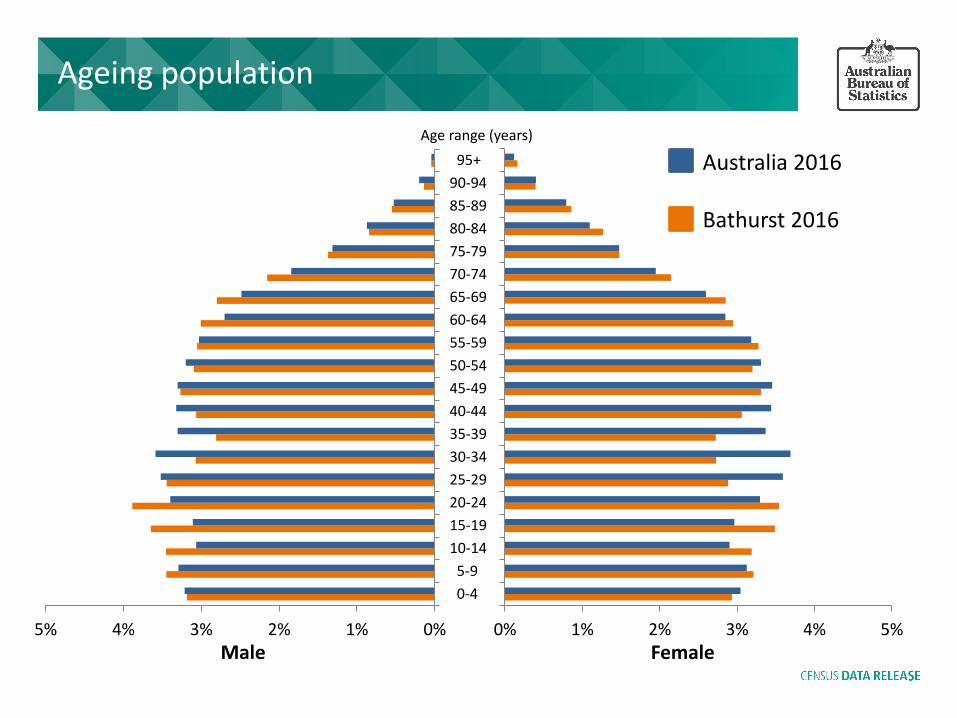
Ageing population
0% 1% 2% 3% 4% 5%
0-4
5-9
10-14
15-19
20-24
25-29
30-34
35-39
40-44
45-49
50-54
55-59
60-64
65-69
70-74
75-79
80-84
85-89
90-94
95+
Female
0%1%2%3%4%5%
0-4
5-9
10-14
15-19
20-24
25-29
30-34
35-39
40-44
45-49
50-54
55-59
60-64
65-69
70-74
75-79
80-84
85-89
90-94
95+
Male
Australia 1991
Age range (years)
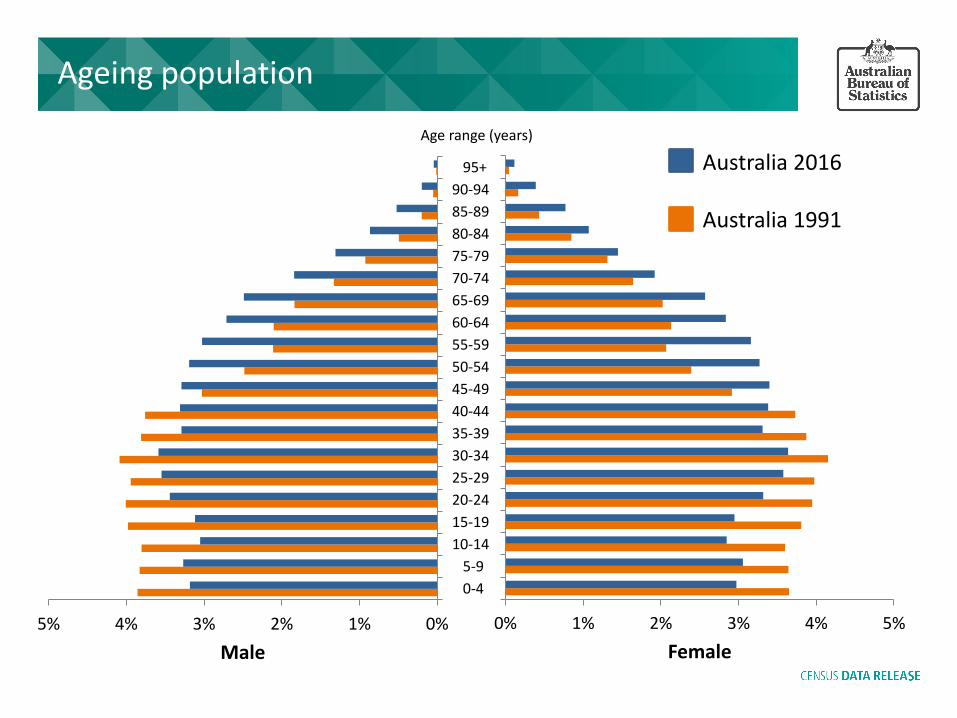
Ageing population
0% 1% 2% 3% 4% 5%
0-4
5-9
10-14
15-19
20-24
25-29
30-34
35-39
40-44
45-49
50-54
55-59
60-64
65-69
70-74
75-79
80-84
85-89
90-94
95+
Female
0%1%2%3%4%5%
0-4
5-9
10-14
15-19
20-24
25-29
30-34
35-39
40-44
45-49
50-54
55-59
60-64
65-69
70-74
75-79
80-84
85-89
90-94
95+
Male
Australia 2016 Australia 1991
Age range (years)
0% 1% 2% 3% 4% 5%
0-4
5-9
10-14
15-19
20-24
25-29
30-34
35-39
40-44
45-49
50-54
55-59
60-64
65-69
70-74
75-79
80-84
85-89
90-94
95+
Female
Ageing population
Australia 2016 Bathurst 2016
Age range (years)
0%1%2%3%4%5%
0-4
5-9
10-14
15-19
20-24
25-29
30-34
35-39
40-44
45-49
50-54
55-59
60-64
65-69
70-74
75-79
80-84
85-89
90-94
95+
Male
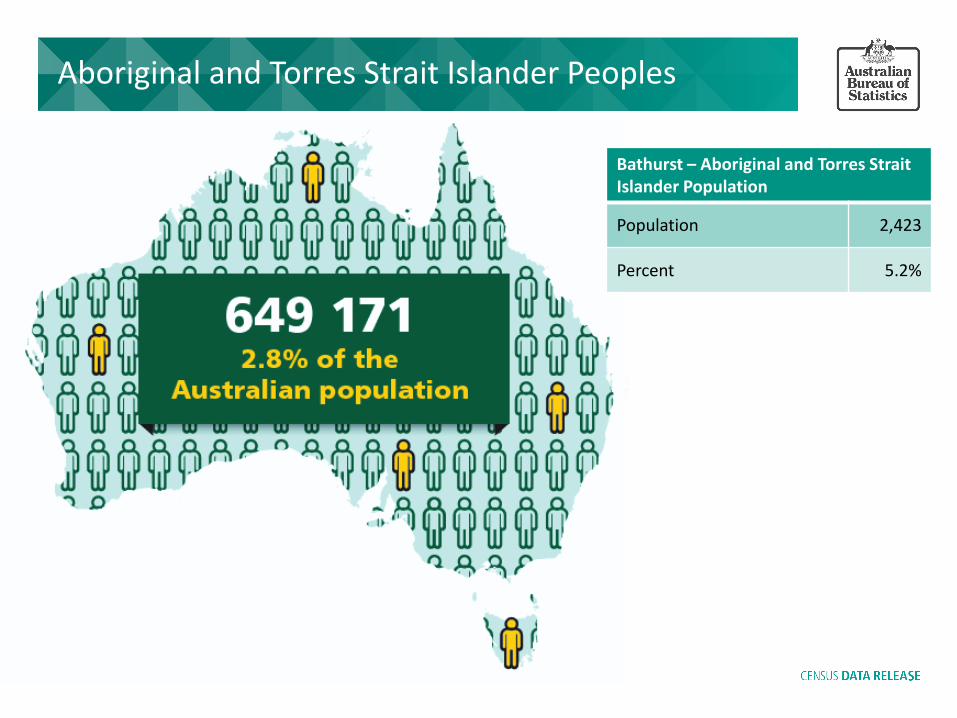
Aboriginal and Torres Strait Islander Peoples
Bathurst – Aboriginal and Torres Strait Islander Population
Population 2,423
Percent 5.2%
0% 1% 2% 3% 4% 5% 6%
0-4
0-5
10-14
15-19
20-24
25-29
30-34
35-39
40-44
45-49
50-54
55-59
60-64
65-69
70-74
75-79
80-84
85-89
90-94
95-99
100+
Female
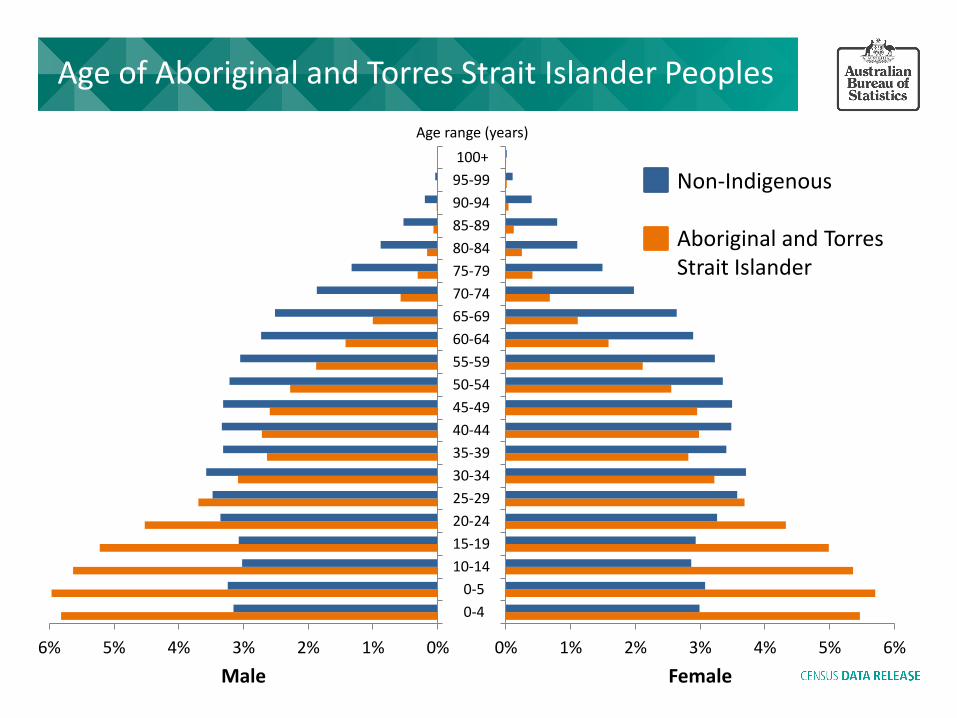
Age of Aboriginal and Torres Strait Islander Peoples
0%1%2%3%4%5%6%
0-4
0-5
10-14
15-19
20-24
25-29
30-34
35-39
40-44
45-49
50-54
55-59
60-64
65-69
70-74
75-79
80-84
85-89
90-94
95-99
100+
Male
Non-Indigenous Aboriginal and Torres Strait Islander
Age range (years)
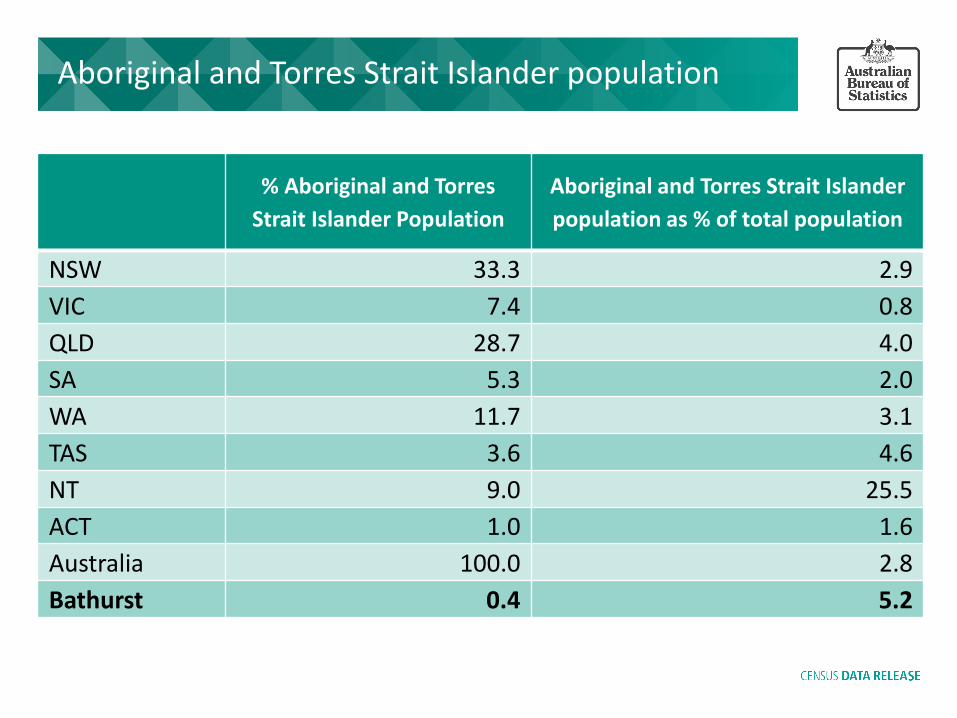
% Aboriginal and Torres
Strait Islander Population
Aboriginal and Torres Strait Islander
population as % of total population
NSW 33.3 2.9
VIC 7.4 0.8
QLD 28.7 4.0
SA 5.3 2.0
WA 11.7 3.1
TAS 3.6 4.6
NT 9.0 25.5
ACT 1.0 1.6
Australia 100.0 2.8
Bathurst 0.4 5.2
Aboriginal and Torres Strait Islander population
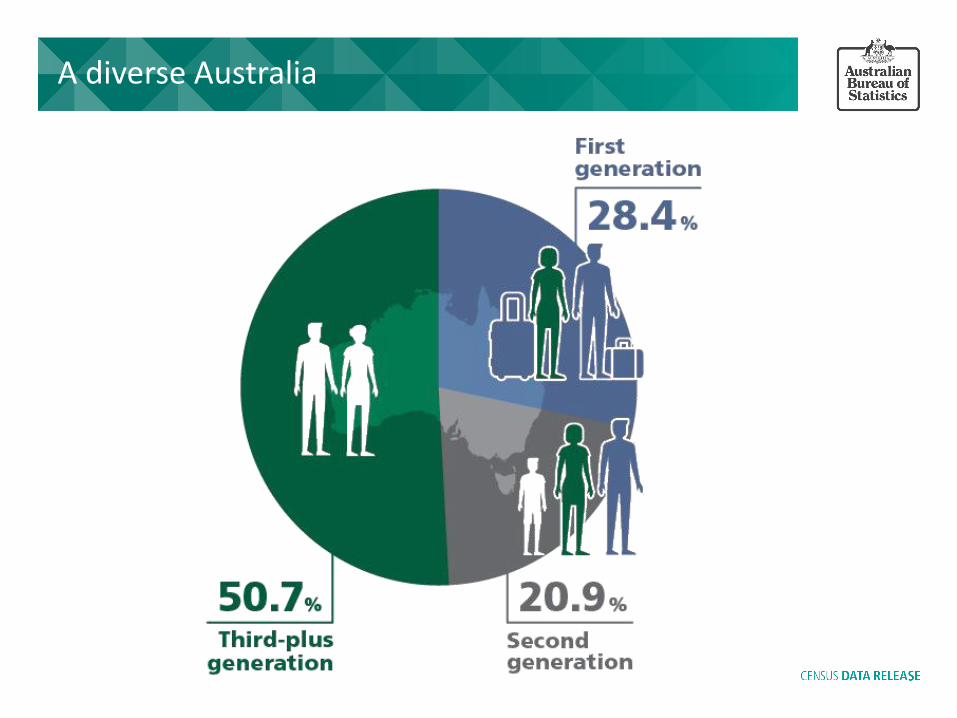
A diverse Australia
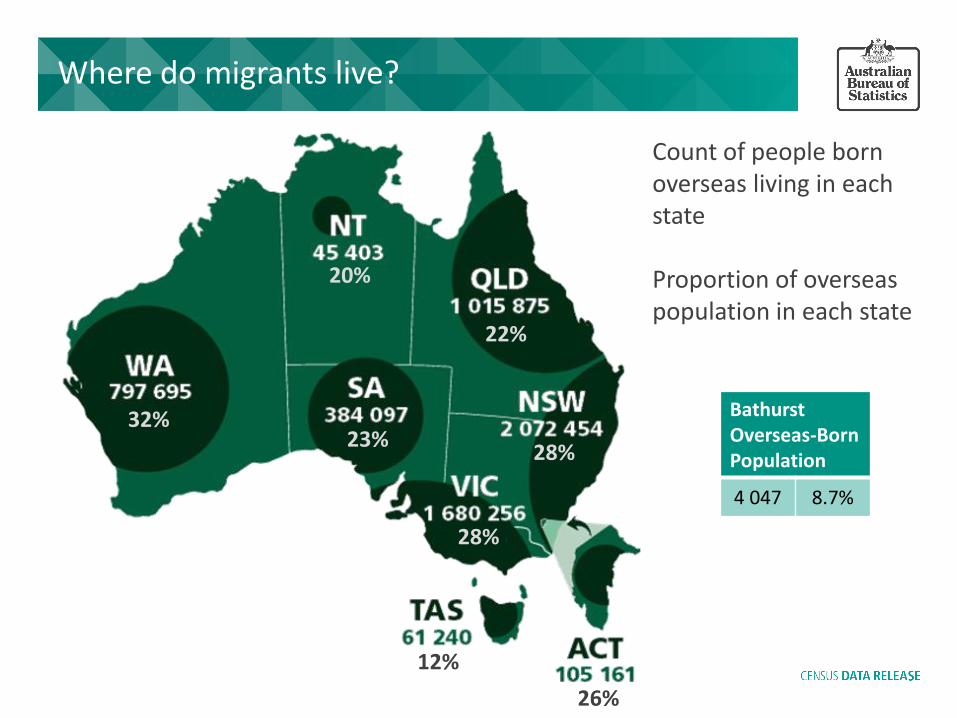
Where do migrants live?
32%
20%
23%
22%
28%
12%
26%
28%
Count of people born overseas living in each state Proportion of overseas population in each state
Bathurst Overseas-Born Population
4 047 8.7%

Overseas-born population – Australia 1966-2016
0%
5%
10%
15%
20%
25%
30%
35%
1966 1976 1986 1996 2006 2016
India
Philippines
Italy
China
England
New Zealand

Recent arrivals (2007 - 2016)
INDIA
CHINA
ENGLAND
NEW ZEALAND
PHILIPPINES
13.7%
13.3%
7.9%
7.7%
6.0%
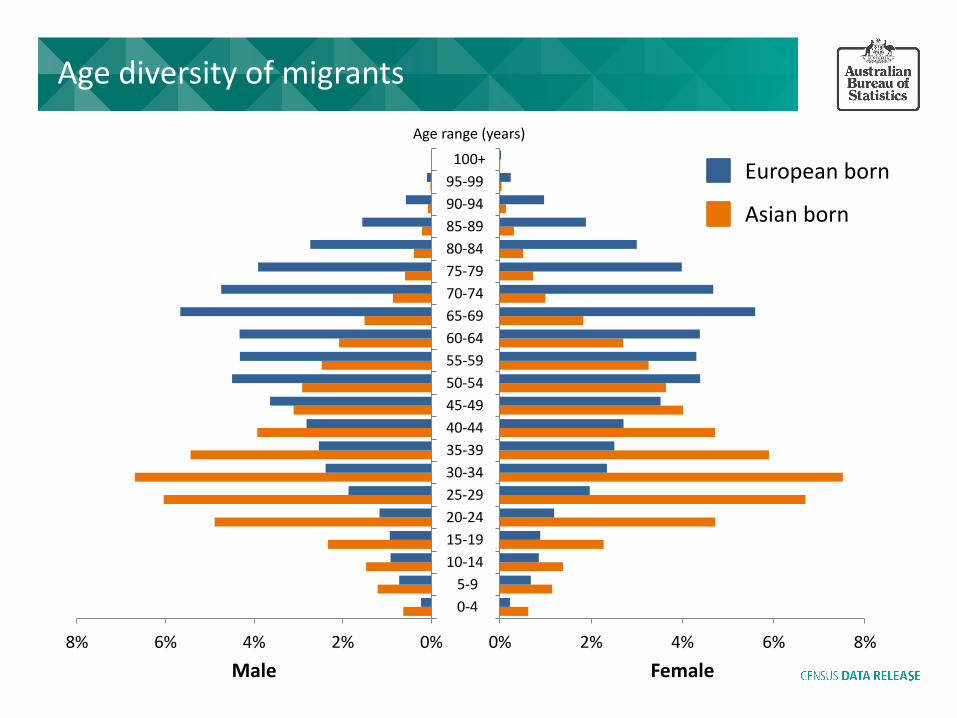
Age diversity of migrants
0% 2% 4% 6% 8%
0-4
5-9
10-14
15-19
20-24
25-29
30-34
35-39
40-44
45-49
50-54
55-59
60-64
65-69
70-74
75-79
80-84
85-89
90-94
95-99
100+
Female
0%2%4%6%8%
0-4
5-9
10-14
15-19
20-24
25-29
30-34
35-39
40-44
45-49
50-54
55-59
60-64
65-69
70-74
75-79
80-84
85-89
90-94
95-99
100+
Male
European born
Asian born
Age range (years)
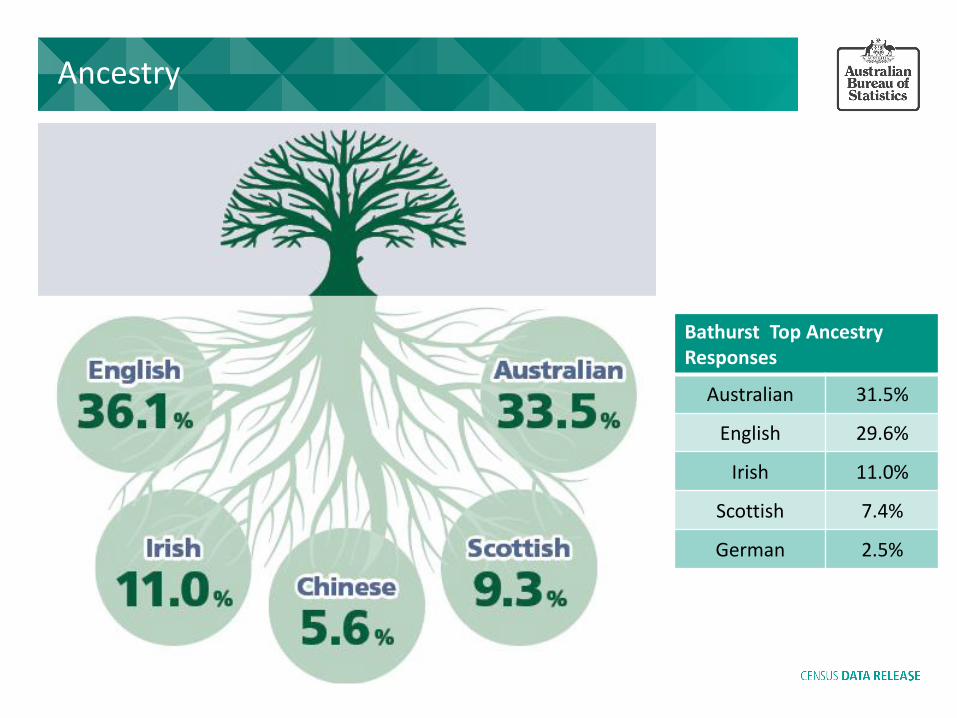
Ancestry
Bathurst Top Ancestry Responses
Australian 31.5%
English 29.6%
Irish 11.0%
Scottish 7.4%
German 2.5%
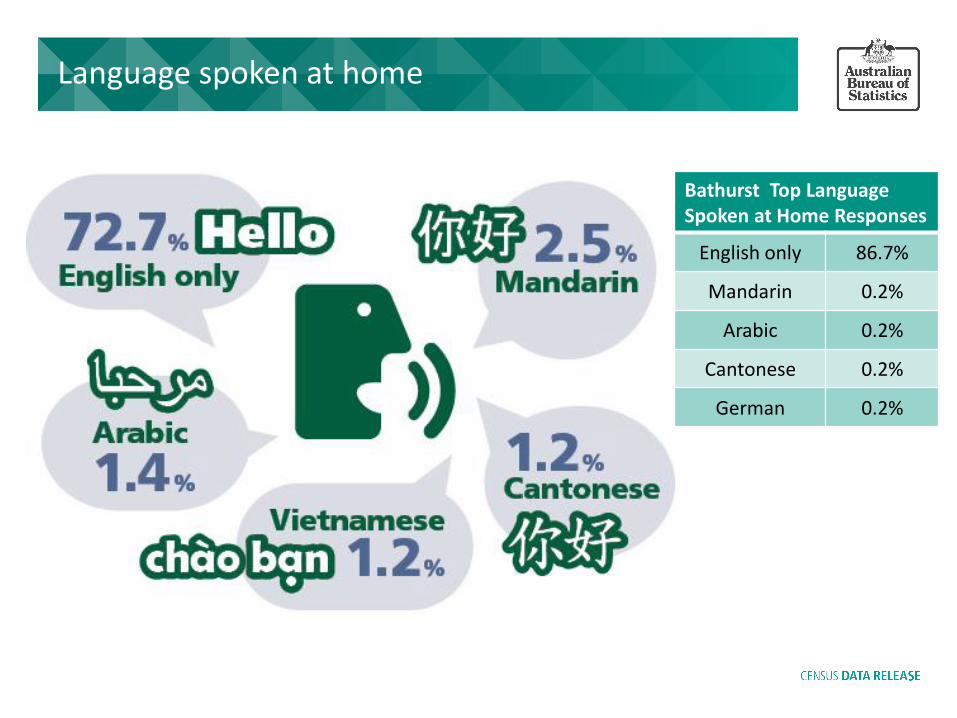
Language spoken at home
Bathurst Top Language Spoken at Home Responses
English only 86.7%
Mandarin 0.2%
Arabic 0.2%
Cantonese 0.2%
German 0.2%
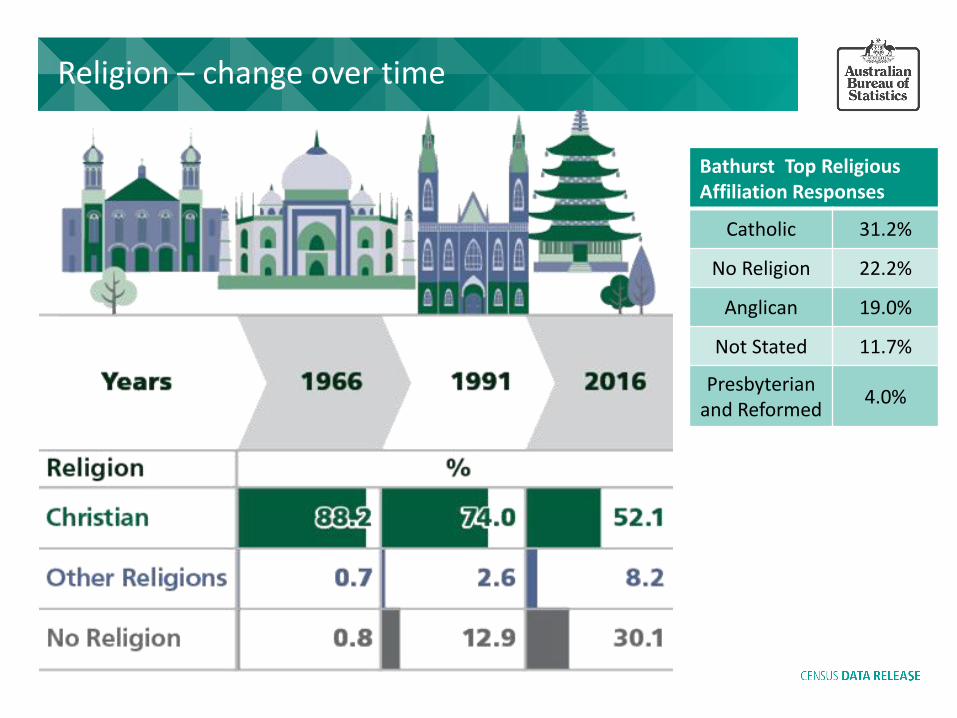
Religion – change over time
Bathurst Top Religious Affiliation Responses
Catholic 31.2%
No Religion 22.2%
Anglican 19.0%
Not Stated 11.7%
Presbyterian and Reformed
4.0%
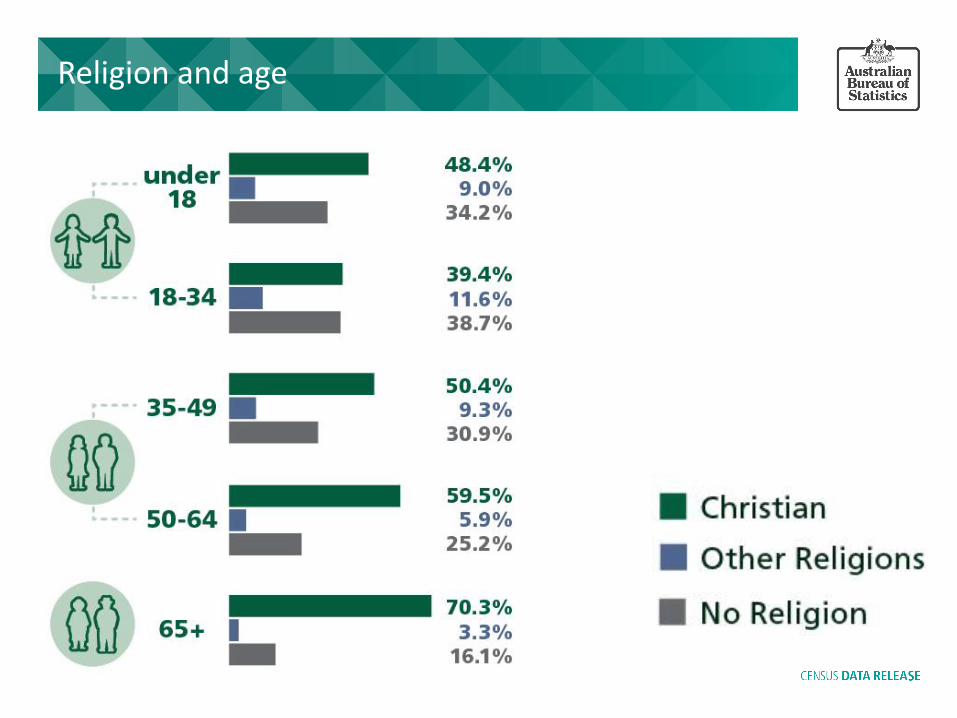
Religion and age
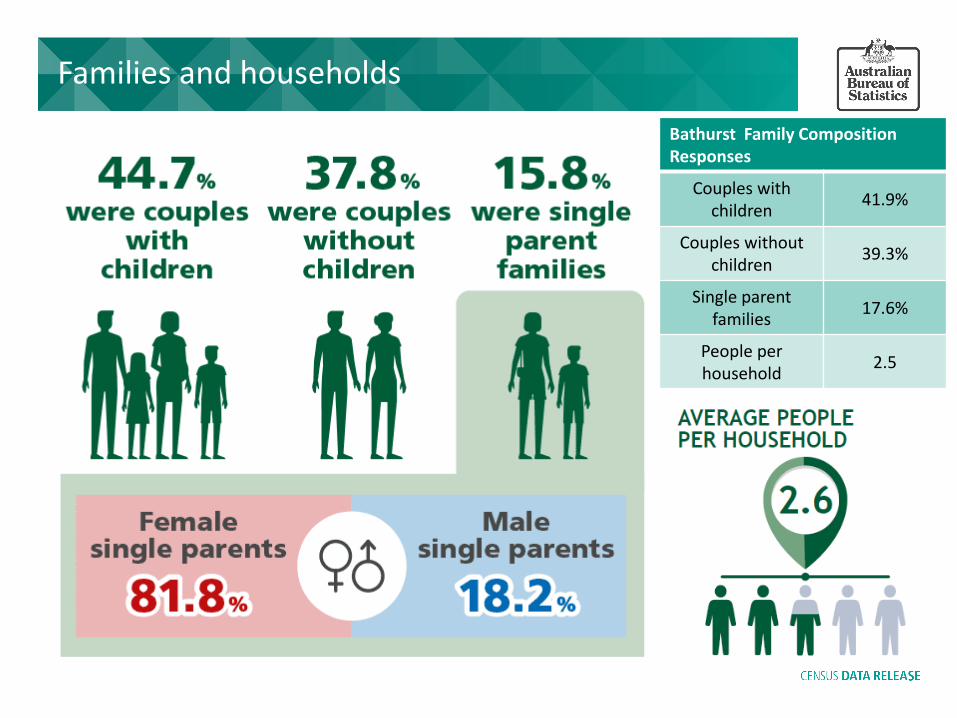
Families and households
Bathurst Family Composition Responses
Couples with children
41.9%
Couples without children
39.3%
Single parent families
17.6%
People per household
2.5
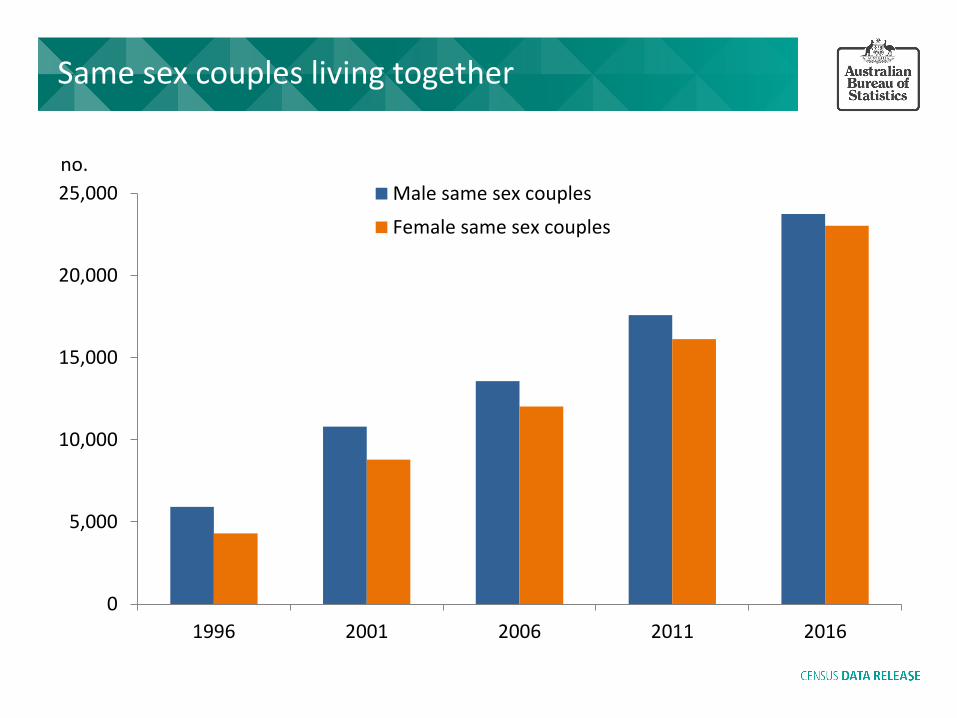
0
5,000
10,000
15,000
20,000
25,000
1996 2001 2006 2011 2016
no.
Male same sex couples
Female same sex couples
Same sex couples living together
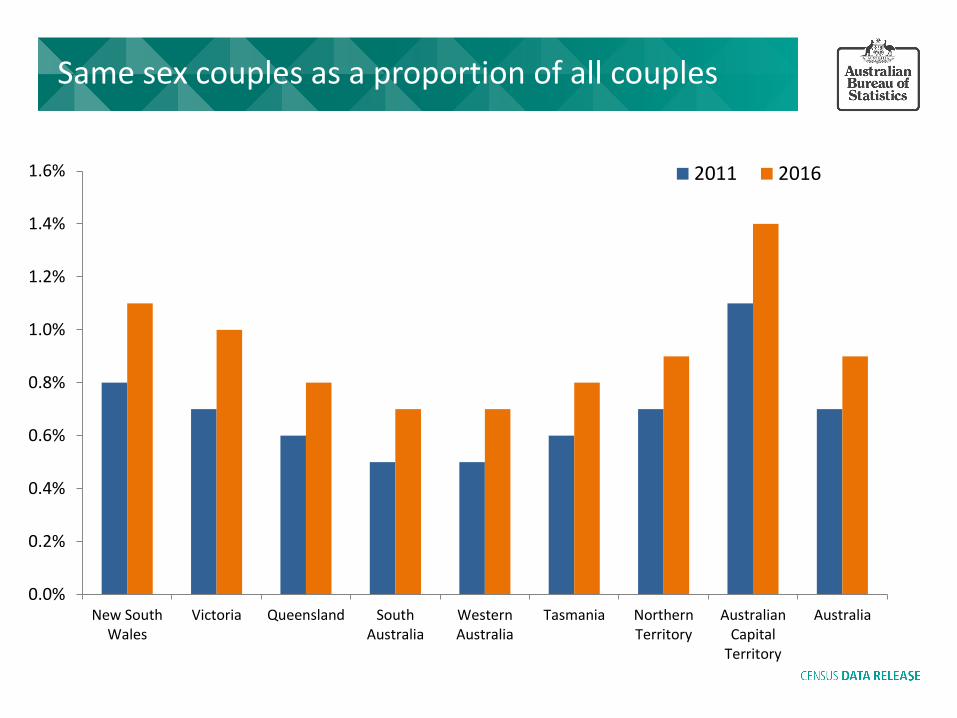
Same sex couples as a proportion of all couples
0.0%
0.2%
0.4%
0.6%
0.8%
1.0%
1.2%
1.4%
1.6%
New SouthWales
Victoria Queensland SouthAustralia
WesternAustralia
Tasmania NorthernTerritory
AustralianCapital
Territory
Australia
2011 2016

0%
5%
10%
15%
20%
25%
30%
35%
40%
45%
0–4
5–9
10–1
4
15–1
9
20–2
4
25–2
9
30–3
4
35–3
9
40–4
4
45–4
9
50–5
4
55–5
9
60–6
4
65–6
9
70–7
4
75–7
9
80–8
4
85–8
9
90–9
4
95–9
9
10
0+
Lone person households
Female
Male
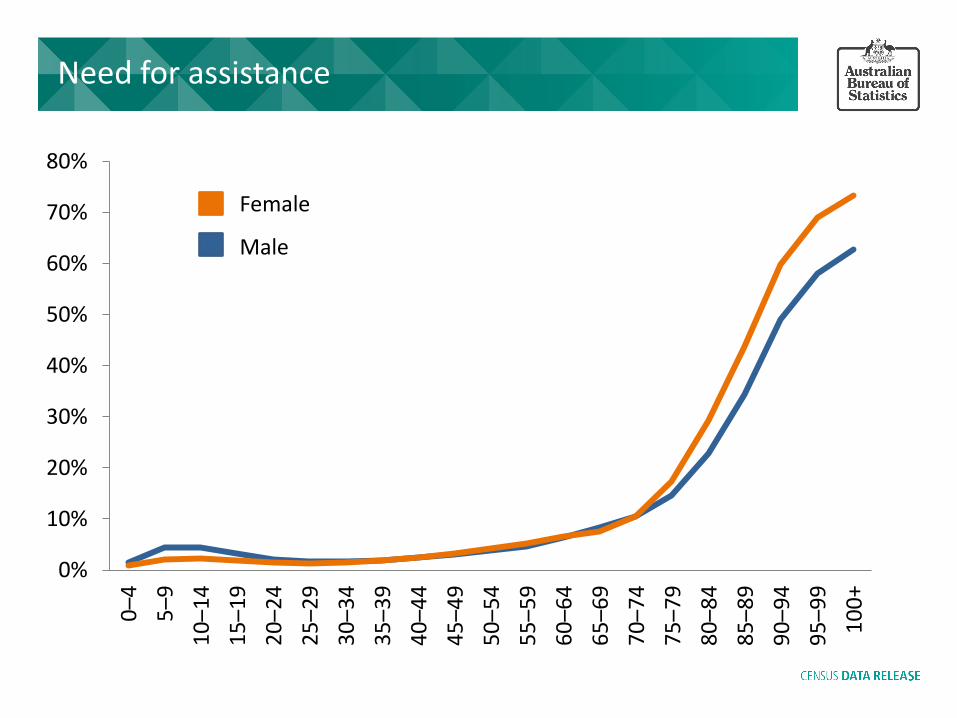
Need for assistance
0%
10%
20%
30%
40%
50%
60%
70%
80%
0–4
5–9
10–1
4
15–1
9
20–2
4
25–2
9
30–3
4
35–3
9
40–4
4
45–4
9
50–5
4
55–5
9
60–6
4
65–6
9
70–7
4
75–7
9
80–8
4
85–8
9
90–9
4
95–9
9
10
0+
Female
Male
0%
5%
10%
15%
20%
25%1
5–1
9
20–2
4
25–2
9
30–3
4
35–3
9
40–4
4
45–4
9
50–5
4
55–5
9
60–6
4
65–6
9
70–7
4
75–7
9
80–8
4
85–8
9
90–9
4
95–9
9
10
0+
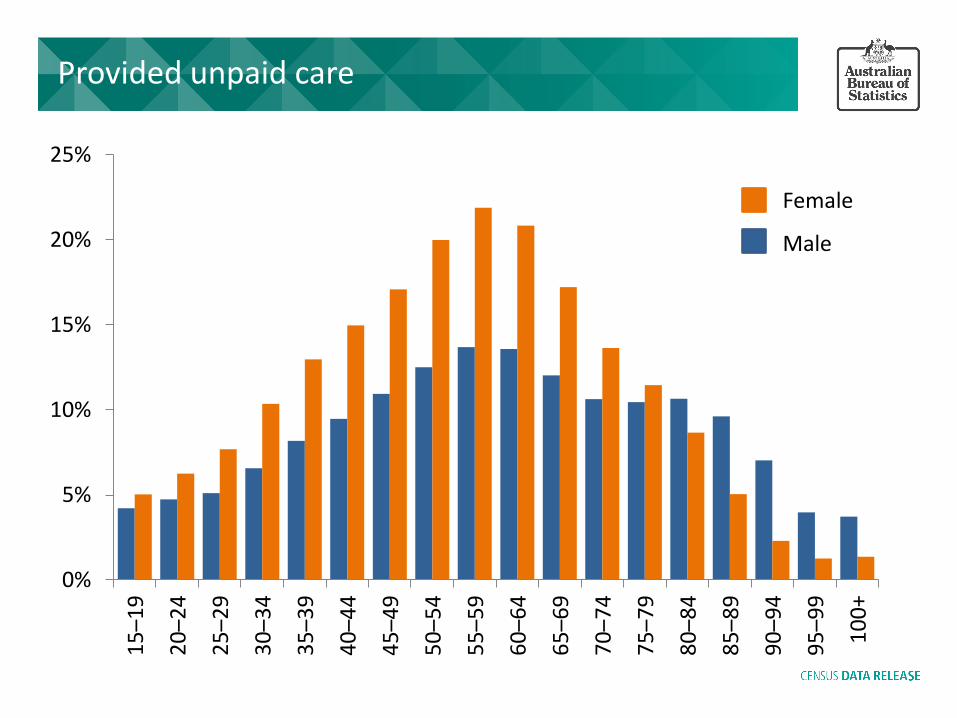
Provided unpaid care
Female
Male
0%
5%
10%
15%
20%
25%1
5–1
9
20–2
4
25–2
9
30–3
4
35–3
9
40–4
4
45–4
9
50–5
4
55–5
9
60–6
4
65–6
9
70–7
4
75–7
9
80–8
4
85–8
9
90–9
4
95–9
9
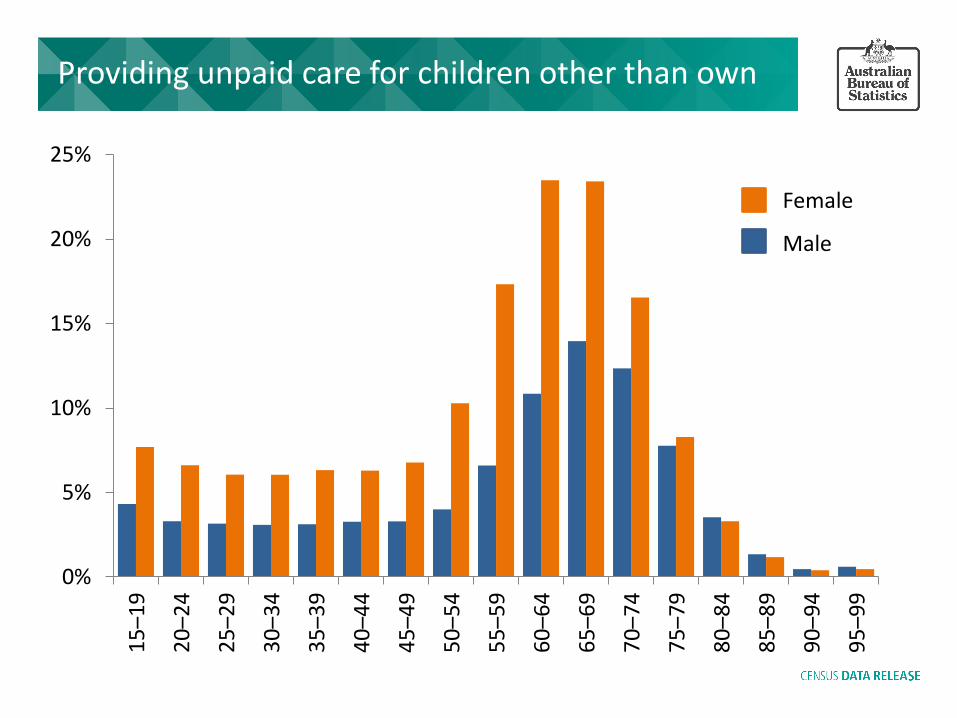
Providing unpaid care for children other than own
Female
Male

0%
5%
10%
15%
20%
25%
No hours Less than 5hours
5 to 14 hours 15 to 29 hours 30 hours ormore
Unpaid domestic work
Female
Male
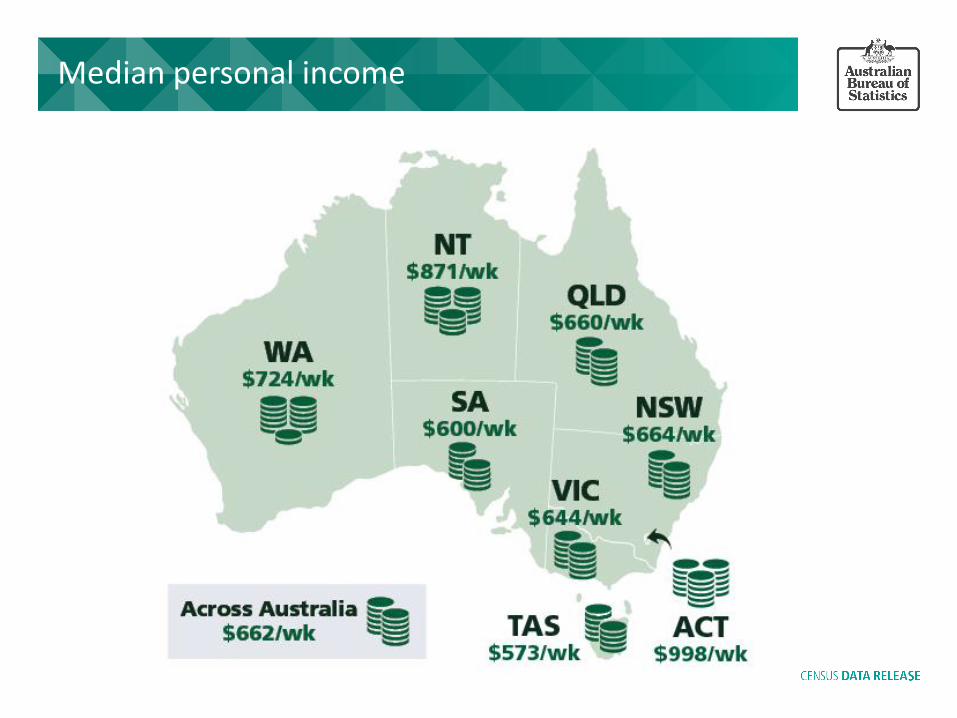
Median personal income
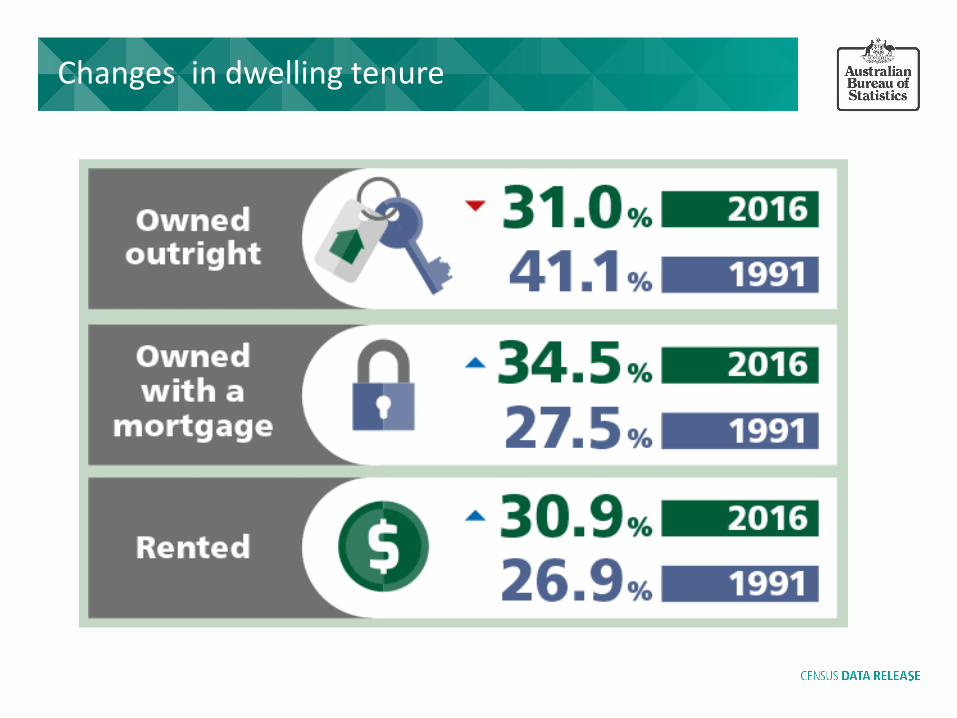
Changes in dwelling tenure

Bathurst dwelling tenure
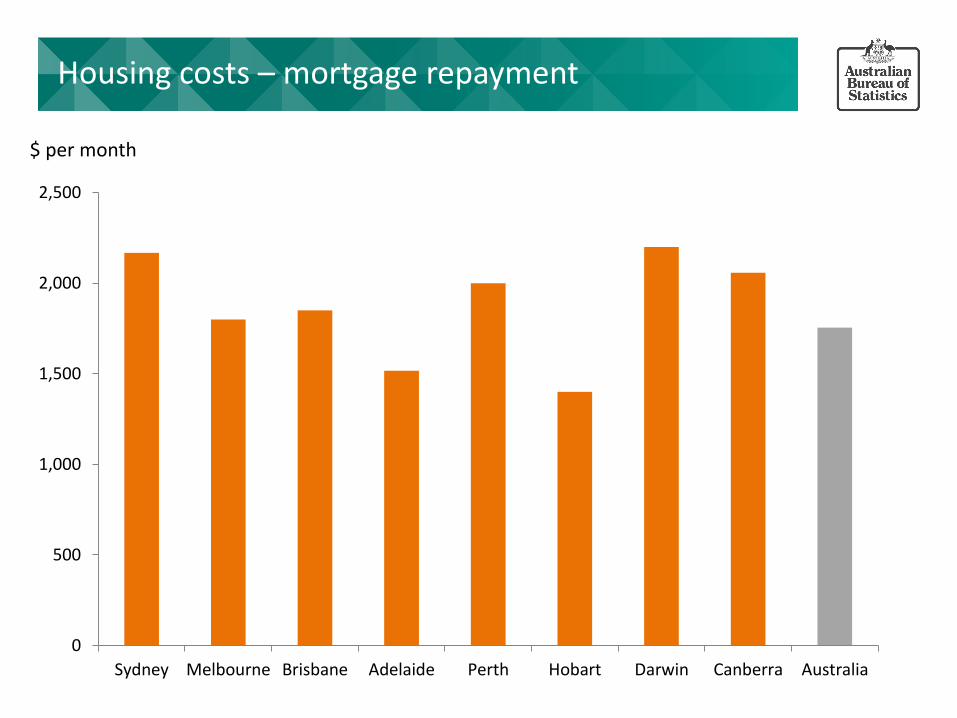
Housing costs – mortgage repayment
0
500
1,000
1,500
2,000
2,500
Sydney Melbourne Brisbane Adelaide Perth Hobart Darwin Canberra Australia
$ per month
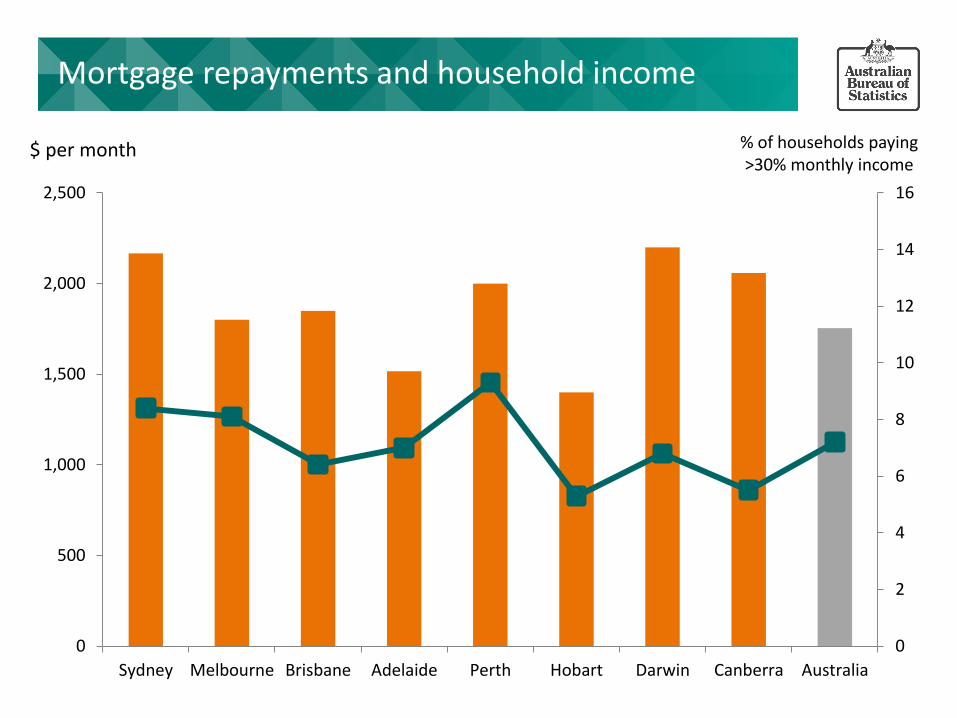
Mortgage repayments and household income
0
2
4
6
8
10
12
14
16
0
500
1,000
1,500
2,000
2,500
Sydney Melbourne Brisbane Adelaide Perth Hobart Darwin Canberra Australia
$ per month % of households paying >30% monthly income
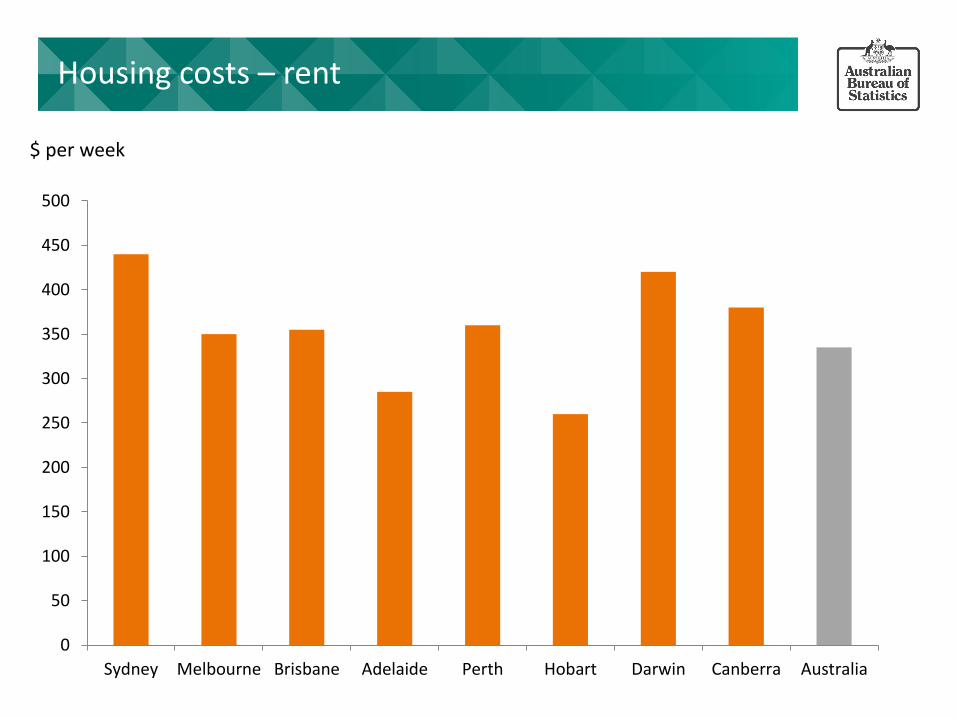
Housing costs – rent
0
50
100
150
200
250
300
350
400
450
500
Sydney Melbourne Brisbane Adelaide Perth Hobart Darwin Canberra Australia
$ per week
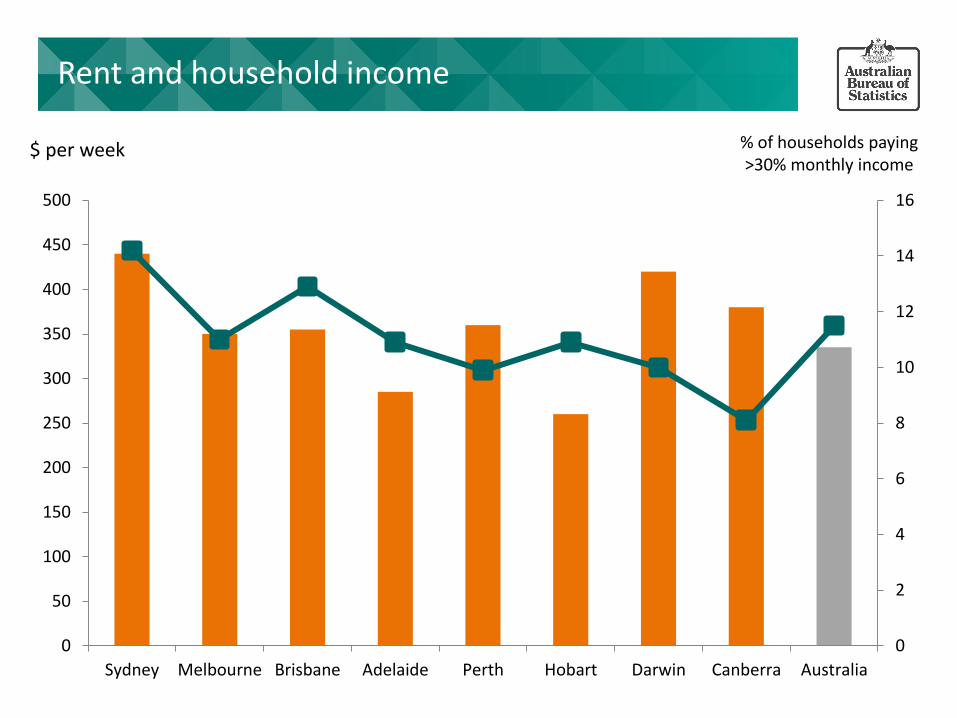
Rent and household income
0
2
4
6
8
10
12
14
16
0
50
100
150
200
250
300
350
400
450
500
Sydney Melbourne Brisbane Adelaide Perth Hobart Darwin Canberra Australia
$ per week % of households paying >30% monthly income
Accessing Census Data
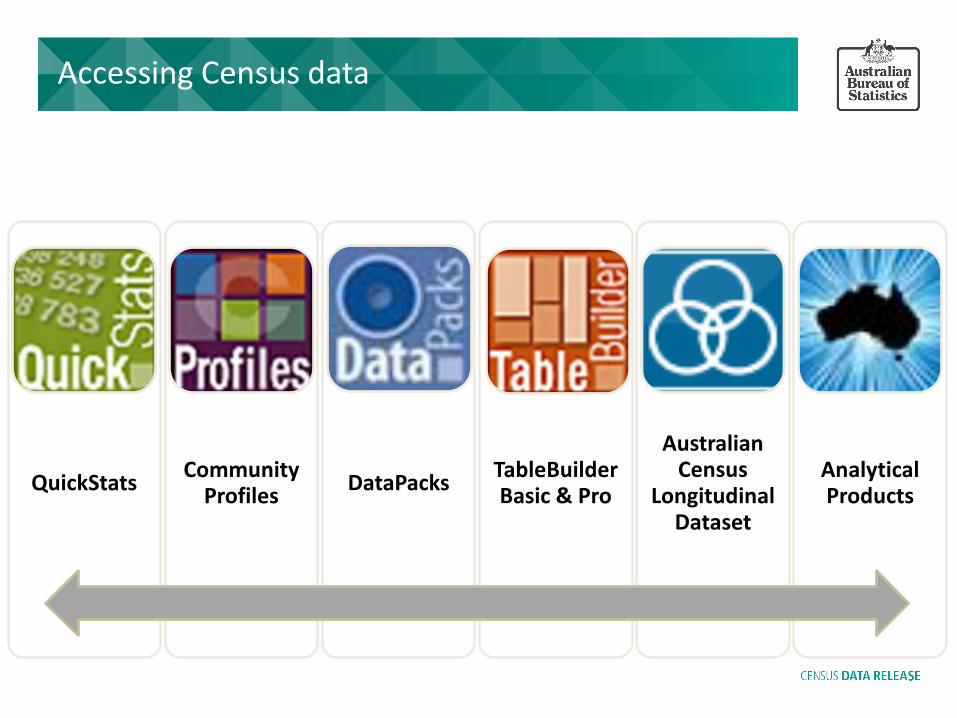
QuickStats Community
Profiles DataPacks
TableBuilder Basic & Pro
Australian Census
Longitudinal Dataset
Analytical Products
Accessing Census data
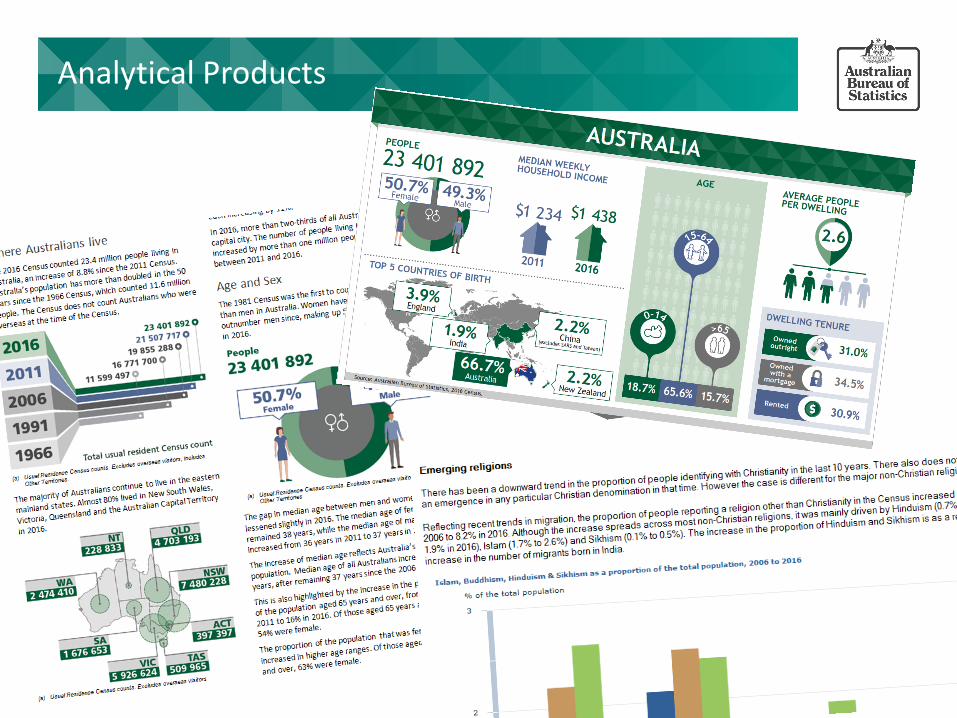
Analytical Products
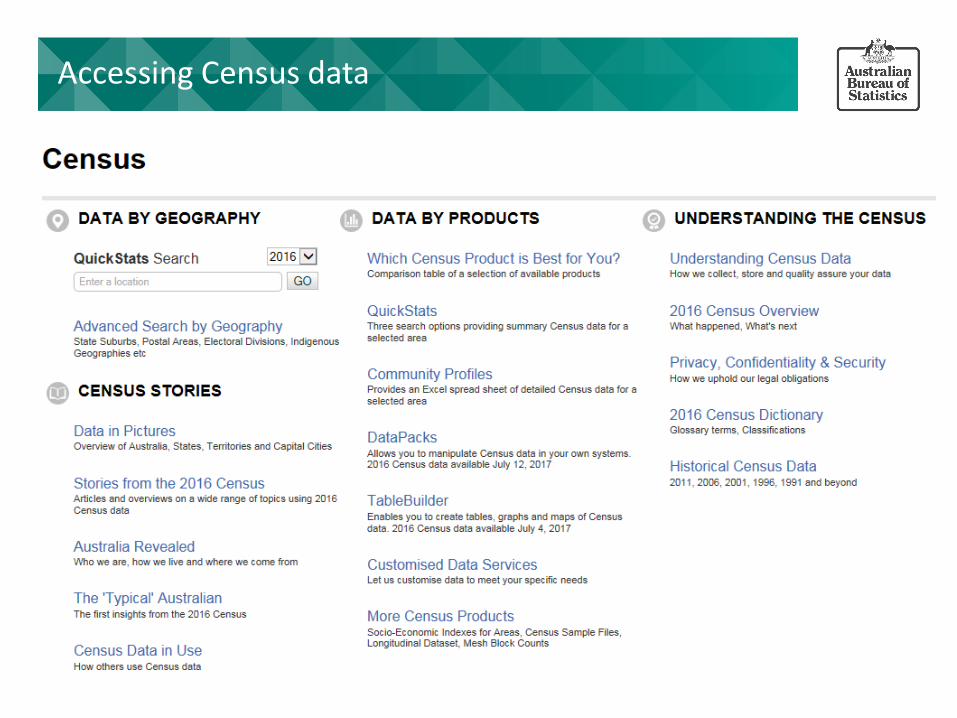
Accessing Census data
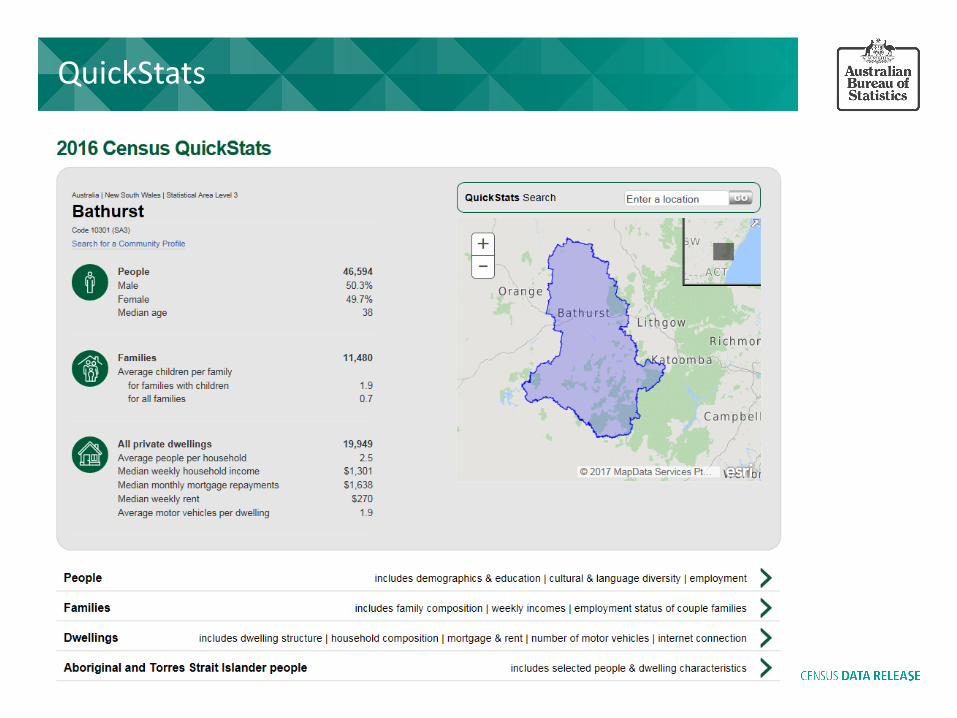
QuickStats
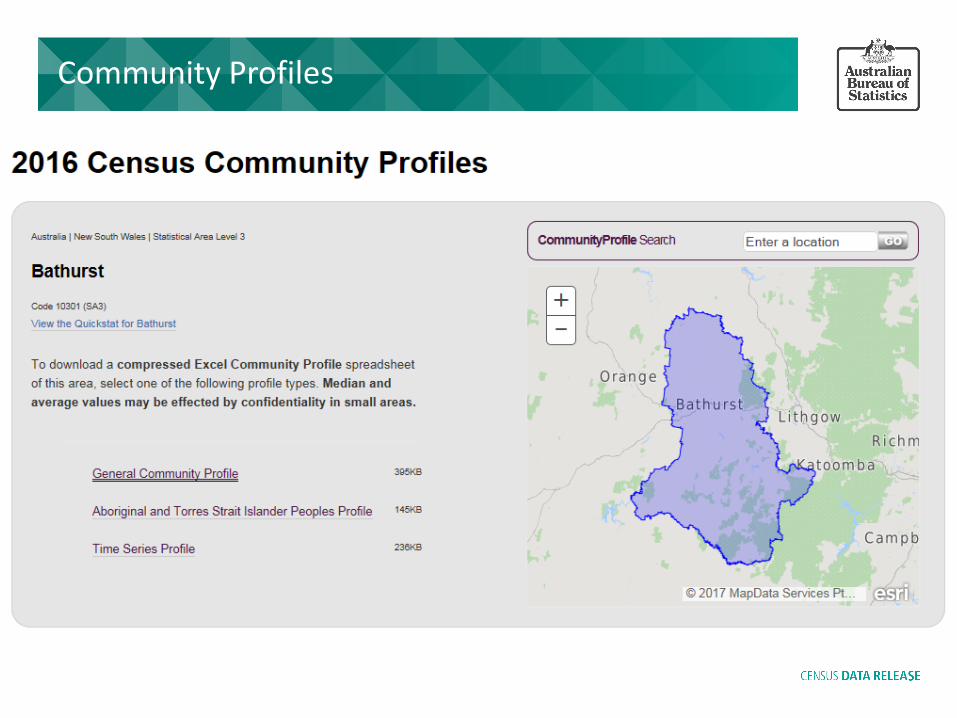
Community Profiles
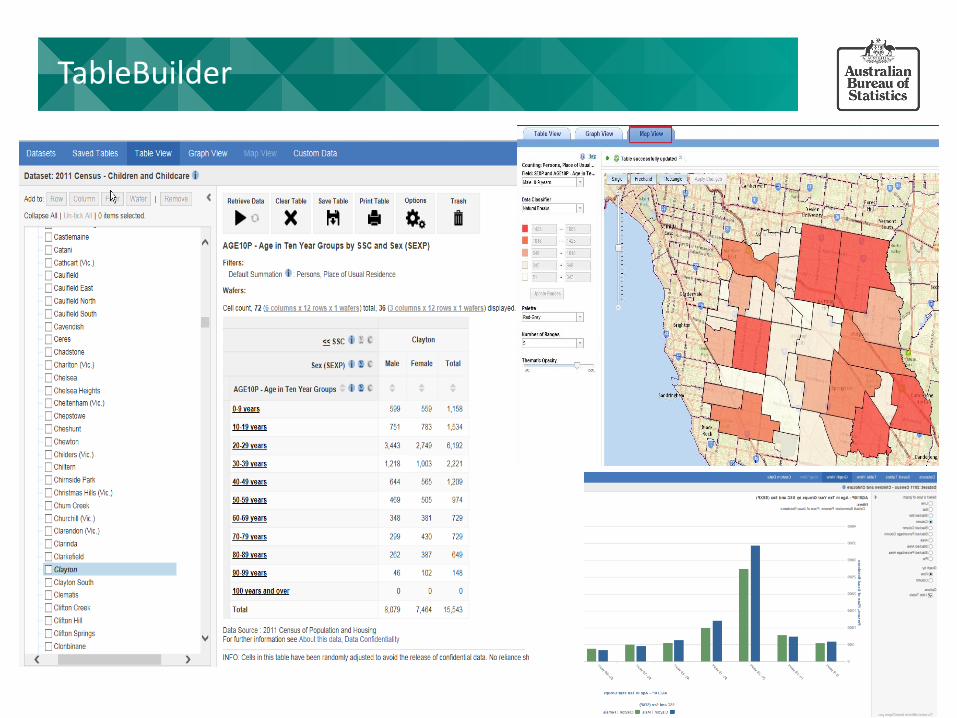
TableBuilder

2016 Census –Release dates
Homelessness Estimates

Questions?
@ABSCensus
Census Australia
CensusAustralia
1300 135 070


