27
2016 full year results 24 February 2017

2016 full year results 24 February 2017

1
241
118
28
177
177
177
0
102
153
123
151
73
194
172
141
206
52
3
247
173
119
132
143
159
41
184
255
178
199
139
218
205
187
Consolidated statutory financial results (Profit & Loss items)
Revenue (€m)1 142.5
4Q16 4Q16 vs. 4Q15
Adj. EBITDA2 (€m)
Margin (%)
71.0
49.8%
Adj. OpCF2 (€m)
As % of revenue
42.6
29.9%
Net income (€m) 17.2
% change
+35.7%
+41.0%
+65.0%
+62.9%
Note:
1. Revenue 2015 adjusted in the revenies without margin in Annual Accounts 2016
2. 2015 EBITDA and OpCF adjusted to exclude costs related to the IPO process, debt cancellation and acquisition of R Cable (c.€15.4m)
572.9
FY 2016 2016 vs. 2015
280.6
49.0%
184.7
32.2%
62.1
% change
+68%
+68%
+62.1%
+759%
Residential 93.1
Business 39.7
Wholesale 9.7
373.1
166.6
33.2
+45.1%
+30.8%
+19.6%
+73.0%
+67.7%
+30.6%
Profit & loss items
EPS (€) 0.41
CFPS (€) 1.22
+759%
+62.1%
2
241
118
28
177
177
177
0
102
153
123
151
73
194
172
141
206
52
3
247
173
119
132
143
159
41
184
255
178
199
139
218
205
187
Key highlights of the year
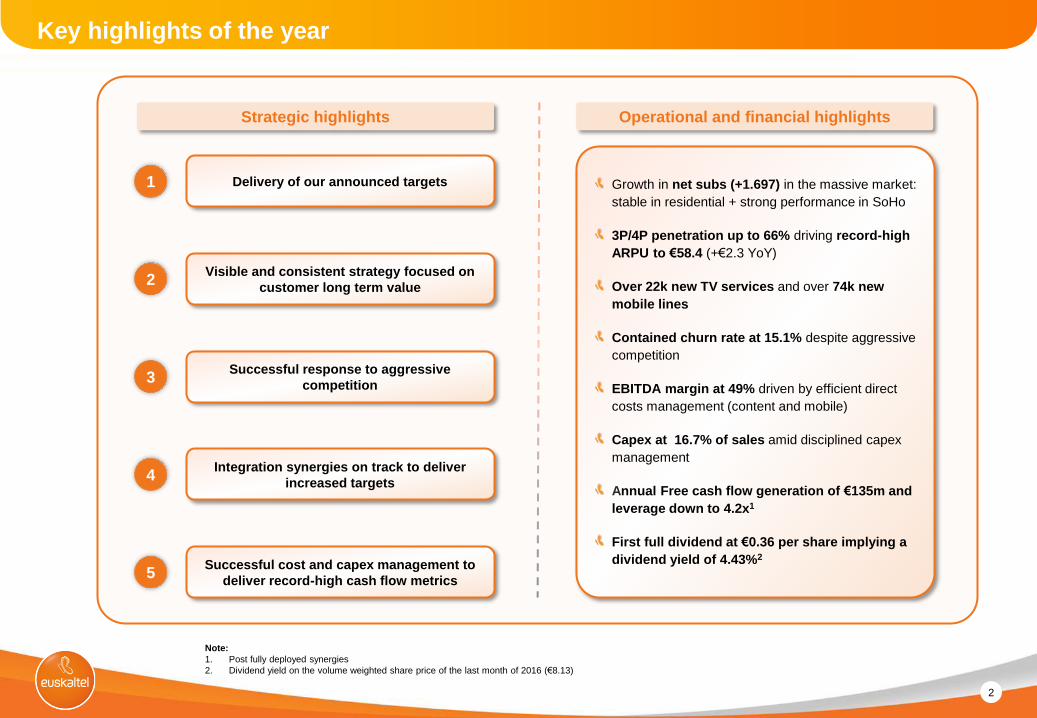
3 Successful response to aggressive
competition
Visible and consistent strategy focused on
customer long term value 2
Integration synergies on track to deliver
increased targets
Successful cost and capex management to
deliver record-high cash flow metrics
4
Growth in net subs (+1.697) in the massive market:
stable in residential + strong performance in SoHo
3P/4P penetration up to 66% driving record-high
ARPU to €58.4 (+€2.3 YoY)
Over 22k new TV services and over 74k new
mobile lines
Contained churn rate at 15.1% despite aggressive
competition
EBITDA margin at 49% driven by efficient direct
costs management (content and mobile)
Capex at 16.7% of sales amid disciplined capex
management
Annual Free cash flow generation of €135m and
leverage down to 4.2x1
First full dividend at €0.36 per share implying a
dividend yield of 4.43%2
Strategic highlights Operational and financial highlights
1 Delivery of our announced targets
5
Note:
1. Post fully deployed synergies
2. Dividend yield on the volume weighted share price of the last month of 2016 (€8.13)

3
241
118
28
177
177
177
0
102
153
123
151
73
194
172
141
206
52
3
247
173
119
132
143
159
41
184
255
178
199
139
218
205
187
Delivery of our announced targets
Revenue
EBITDA2
Operating Cash Flow (€m)
As % of revenue
Note:
1. % of growth excluding elimination of profit neutral activities
2. 2015 EBITDA adjusted to exclude costs related to the IPO process, debt cancellation and acquisition of R Cable (c.€15.4m)
572.9
FY 2016
280.6
184.7
32.2%
1
Leverage 4.2x
+1.3%1
+5.1%
+12.7%
+374 bps
-0.9x
Vs. FY 2015 PF
€m
On November 27th, 2015, Euskaltel acquired 100% of the shares in R Cable y Telecomunicaciones Galicia, S.A. As a result of this business combination, a new
accounting group including both companies was created. Therefore, consolidated financial information included in this document is presented following Euskaltel’s
accounting principles regarding consolidation requirements. Therefore:
The 4Q15 financial information included in this presentation reflects Euskaltel’s standalone performance for that period plus R Cable performance since 27-Nov-
2015
The 4Q16 presented financials comprise consolidated financials for Euskaltel and R Cable
Where appropriate in the presentation, the pro forma including non-audited past contribution of R-Cable is added to that of Euskaltel for comparability purposes

4
241
118
28
177
177
177
0
102
153
123
151
73
194
172
141
206
52
3
247
173
119
132
143
159
41
184
255
178
199
139
218
205
187
66.6%
71.7%
77.2%
IPO Jul-15 4Q15 4Q16
60.9%
63.3%
65.8%
IPO Jul-15 4Q15 4Q16
Visible and consistent strategy focused on customer long term value
Bundling strategy (3P/4P)1
Successful upselling strategy delivering sustained growth in
RGU/subs reaching 3.5x, and 3P/4P penetration of c.66%.
Mobile convergence strategy
Leading convergent strategy which has resulted in capturing
c.61K new mobile lines in 2016 (+8.6% YoY) whilst managing
host and access costs
Notes:
1. Residential subs as % of total subscribers
2. Residential mobile subscribers (excluding mobile only) as % of total fixed customers
3. IPO data pro forma to include R Cable
2
Residential RGU/Subs (x)
3.2x
3.5x Mobile penetration2
+4.9%
+10.6% 3.3x
3 3

5
241
118
28
177
177
177
0
102
153
123
151
73
194
172
141
206
52
3
247
173
119
132
143
159
41
184
255
178
199
139
218
205
187
27%
57%
70%
Successful response to aggressive competition
Coverage and competition
Commercial response adapted to FTTH deployment
Our network quality remains a competitive strength, but FTTH deployment has narrowed the gap
Market share preserved despite aggressive price competition, particularly in the last quarter
Our speed offering and TV functionalities delivering strong customer satisfaction
Source: Report of “Secretaría de Estado de Telecomunicaciones y para la Sociedad de la Información”
3
250270
4Q15 4Q16
Product intake
+5.4k
389 395
4Q15 4Q16
+20.1k
Pay-TV RGUs
Broadband RGUs
Broadband
Pay-TV offering
Euskaltel +R
Cable fiber
coverage as of
IPO and 2Q16)
Competitors fiber
coverage in 1Q15
Competitors fiber
coverage in 2Q16

6
241
118
28
177
177
177
0
102
153
123
151
73
194
172
141
206
52
3
247
173
119
132
143
159
41
184
255
178
199
139
218
205
187
Synergies grade of completion (€m)
Integration synergies on track to deliver increased targets
Estimated timetable for the implementation for synergies
1.3 6.2
2.3
9.8 3.0
12.8>10
>23
Rev Direct costs Indirect costs EBITDAsynergies
achieved in 2016
Capex Total synergiesachieved in 2016
Pendingsynergies to be
achieved in 2017
Total synergies
4
2016 2017
1H 2H 1H 2H
Direct
costs
New host
Elimination of
handset
subsidies
Capex Renegotiation
with suppliers
Results
Mainly ITX costs
and elimination
of handset
subsidies
Personnel,
commercial and
renegotiation
with suppliers
Renegotiation
with suppliers
and use of assets
optimisation
TV content
Indirect
costs
External
services
Renegotiation
with suppliers
Call centres
Asset
optimisation
Negotiation new agrmnt Migration
Implementation
Contract renegotiation
Contract renegotiation
Renegotiation, implementation (new model)
TV platform, mob. network Information systems
Contract renegotiation Contract renegotiation
Contract renegotiation

7
241
118
28
177
177
177
0
102
153
123
151
73
194
172
141
206
52
3
247
173
119
132
143
159
41
184
255
178
199
139
218
205
187
103
96
2015 2016
85.5
83.5
2015 2016
Strict cost and capex management yielding record-high cash flow metrics
Direct cost management
2015 2016
Proven ability to contain mobile cost despite significant
increase in the # of lines and traffic per line
Capex and cash flow management
Efforts focused on converging R Cable capex level with those of
Euskaltel. Overall capex reduction below 17% of revenue in line
with guidance
Operating cash flow margin growth of +374bps in the period
5
As % of revenue
16.7%
17.9%
(€7.2m) / (7.0%)
Direct network costs (€m) Mobile data traffic
(€2.0m) / (2.3%) +74%
As % of revenue
14.6%
14.9% 163.9
184.7
2015 2016
€20.8m / 12.7%
As a % of revenue
28.5%
32.2%
Capex (€m) Operating Cash flow 2 (€m)
Notes:
1. Data pro forma to include R Cable
2. Operating Cash Flow calculated as EBITDA-capex
1 1 1 1

8
241
118
28
177
177
177
0
102
153
123
151
73
194
172
141
206
52
3
247
173
119
132
143
159
41
184
255
178
199
139
218
205
187
Operational and financial highlights
Note: 2015 figures pro forma to include R Cable for comparison purposes

9
241
118
28
177
177
177
0
102
153
123
151
73
194
172
141
206
52
3
247
173
119
132
143
159
41
184
255
178
199
139
218
205
187
575,1 572,9
9,3
565,7 14,1
(5,9) (1,1)
2015 Profit-neutralrev.
2015 (exc.profit-neutral
rev.)
Residential Business Other &adjust.
2016
267.1280.6
7.2 9.8
(3.5)
2015 Revenue Direct costs(excl.
Profit-neutral)
Commercialand overheads
2016
Excludes impact
from elimination
of profit-neutral
revenues
2015 - 2016 revenue and EBITDA bridge
Revenue growth 2015 vs. 2016 (€m)
Growth of the residential segment (+€14.1m) partly offset by
decrease in the Business segment (-€5.9m)
€7.2m rev. growth when 2015 profit-neutral revenue are
excluded (+1.3%)
EBITDA growth 2015 vs. 2016 (€m)
€13.5m (+5.1%) EBITDA growth driven by revenue increase
and an efficient direct cost management
Margin enhancement of 260 bps up to 49.0%
+€13.5m / 5.1% growth
46.4% 49.0%
+€7.2m / +1.3% growth
3.9% (3.4%)
Growth (%)
Notes:
1. Data pro forma to include R Cable
1
1

10
241
118
28
177
177
177
0
102
153
123
151
73
194
172
141
206
52
3
247
173
119
132
143
159
41
184
255
178
199
139
218
205
187
41.745.1
42.2 43.442.4 42.8 41.739.7
1Q 2Q 3Q 4Q
2015 2016
87.2
89.3
91.8
90.891.3
93.7
95.0
93.1
1Q 2Q 3Q 4Q
2015 2016
Residential and Business segments revenue
Residential revenue Business segment1 revenue
Note:
1. Includes SOHO, SMEs and Large Accounts
2. 2015 figures include pro forma R Cable result
Zoom in SOHO
Residential quarterly revenue (€m)
2
2
16.7
17.217.4
17.217.3
17.717.8
17.7
1Q 2Q 3Q 4Q
2015 2016
Consistent residential revenue growth +2.6% in the quarter vs.
the previous year on the back of stable customer base and
increased ARPU
Business segment impacted by loss of Basque government
contract
On the positive side, sustained growth in the SOHO sub-
segment at c. 3% y-o-y
2
Loss of the
contract from
the Basque
Government
Business quarterly revenue (€m)
SOHO quarterly revenue (€m)

11
241
118
28
177
177
177
0
102
153
123
151
73
194
172
141
206
52
3
247
173
119
132
143
159
41
184
255
178
199
139
218
205
187
Residential fixed customer and churn rate evolution over time
Note:
1. Fixed subs excluding mobile only subscribers
2. Historical figures proforma to include R Cable
Churn and fixed subs1 customer base evolution2
One-off impact of
competitor
instalators strike
Decision not to
acquire
football content
Net adds in 4Q16 (-1.8k subs) reflecting a specific highly discounted offering from competition. It is expected to be reversed in the coming
quarters
4Q16 churn improvement vs. 4Q15 and gross adds in line with cruise level
14.7% 13.0%
14.6% 14.6% 12.9%
10.0% 17.4%
16.1%
13.5% 14.7%
16.4% 15.7%
17
15 15
17
15
1817
1716 16
20
17
(0.0)(0.8)
(2.3)
(0.2)(0.5)
6.1
(3.2)
(2.2)
0.2
(0.9)
0.6
(1.8)
(5)
-
5
10
15
20
25
(5.0)%
-
5.0%
10.0%
15.0%
20.0%
25.0%
1Q14 2Q14 3Q14 4Q14 1Q15 2Q15 3Q15 4Q15 1Q16 2Q16 3Q16 4Q16
Quarterly churn rate Gross adds Net adds
One-off impact
of specific
discounted
offerings from
competitors

12
241
118
28
177
177
177
0
102
153
123
151
73
194
172
141
206
52
3
247
173
119
132
143
159
41
184
255
178
199
139
218
205
187
56.2
57.6
58.158.5 58.4
4Q15 1Q16 2Q16 3Q16 4Q16
Residential ARPU growth as a result of our successful product intake
Increased 3P/4P penetration
(as % of total subscribers) Residential ARPU evolution (€/month)
+2.3€ / +4.0% Residential RGU/Subs (x)
Successful upselling strategy delivering sustained growth in
RGU/subs reaching 3.5x, and 3P/4P penetration of c.66%
Growth in RGUs and 3P/4P penetration driving 4% ARPU
growth vs. 2015
Constant ARPU vs. previous quarter on the back of a specific
promotion during the last quarter of the year
63.3%64.3%
65.2% 65.2%65.8%
4Q15 1Q16 2Q16 3Q16 4Q16
3.3x
3.4x 3.5x
3.4x 3.4x
PF
excluding
effect of
one-off
discount
offerings
[Poner en
el script]

13
241
118
28
177
177
177
0
102
153
123
151
73
194
172
141
206
52
3
247
173
119
132
143
159
41
184
255
178
199
139
218
205
187
702.9
720.5
743.4754.3
763.7
4Q15 1Q16 2Q16 3Q16 4Q16
Continued momentum in the residential segment
Mobile lines and increased mobile penetration Pay-TV RGUs and penetration
+20k / +8.1%
RGUs penetration (as % of fixed customer
excluding mobile only)
71.7%
76.2% 77.2%
RGUs penetration as % of fixed
subscribers
Growing mobile penetration as a result of our mobility strategy
which has resulted in capturing c.61K new mobile lines in the
period (+8.6%)
Strong performance of our TV offering with 8.1% growth in TV
RGUs in the year and 1.1% in the quarter
Combined generation into our subscriber base, reading 57.6%
of total subscribers in 2016 (vs. 53.0% in 2015)
+61k / +8.6%
Record
High
75.7 % 73.7%
53.0%
56.7% 57.6%
56.3% 54.4%
250.0
256.8
264.9267.3
270.3
4Q15 1Q16 2Q16 3Q16 4Q16

14
241
118
28
177
177
177
0
102
153
123
151
73
194
172
141
206
52
3
247
173
119
132
143
159
41
184
255
178
199
139
218
205
187
Similarly to the residential segment, SOHO performance shows a
steady growth in RGU per subscriber (3.4x in 4Q16) and 3P/4P
bundle penetration (54%) hence driving ARPU up by 3.1% in the
year
Revenue from SME and LA down by 7.6% impacted by the loss of
the contract from the Basque Government
Additionally, definition of a mid-term strategy to create a fully
integrated value added offering moving beyond connectivity
(cloud, security, tools) through own developments and win-win
partnerships
48%
53%54%
4Q15 3Q16 4Q16
Business segment KPIs
SOHO ARPU evolution (€/month)
+2.0€ / +3.1%
Proforma
to include
R Cable
SOHO increased 3P/4P penetration
(as % of total subscribers)
SOHO RGU/Subs (x)
3.2x 3.3x
3.4x
104
96
2015 2016
SME and large account revenue (€m)
(€7.9m) / (7.6%)
Proforma
to include
R Cable
63,2
65,3 65,2
4Q15 3Q16 4Q16

15
241
118
28
177
177
177
0
102
153
123
151
73
194
172
141
206
52
3
247
173
119
132
143
159
41
184
255
178
199
139
218
205
187
Initiatives in place to boost the business segment
Development of platform providing TIC solutions:
Advanced data solutions, voice IP, data centre,
Cybersecurity, SAAS, NOC and SOC services, customer
care, Wi-Fi solutions, big data, analytics
Strategic partnerships Global coverage
Integrating other
accesses (NEBA,
VULA, Wireless,
Satellite, …)
Platform to drive
companies to the cloud
services
Platform for transition to
digital economy
Objective Initiatives to be implemented
Evolve from telecom product to global solution
Value proposition based on vertical solutions
Evolution from connecting to a solution engineering
Active presence in strategic projects
Implementation and development of the 4.0 policy
Smart cities
E-Health
Energetic efficiency
Organizational focus on corporate segment

16
241
118
28
177
177
177
0
102
153
123
151
73
194
172
141
206
52
3
247
173
119
132
143
159
41
184
255
178
199
139
218
205
187
63 61
90 96
155
(2) (10) (9)
5
136
308 292
2015 Commercial Direct costs Profit neutral costs Overheads 2016
Commercial Overheads Direct costs
Efficient cost management
Cost structure (€m)
As % of revenue
11.0%
26.9%
(€16.0m) / (5.1%)
10.7%
23.7%
15.7% 16.7%
51% 53.6%
Cost base reduction by €16m on the back of efficient management of commercial (-3.1%) and direct costs (-12.4%), partially offset by an increase in
overheads (+6.0%)
As a result, EBITDA margin has improved by 260bps reaching 49.0% in 2016

17
241
118
28
177
177
177
0
102
153
123
151
73
194
172
141
206
52
3
247
173
119
132
143
159
41
184
255
178
199
139
218
205
187
Efficient direct cost management deriving in a reduction of c. €10m (exc. elimination of profit-neutral activities) mainly driven by a decrease in
costs associated to TV content, Network and Mobile equipment
As a result of the integration in to the same host contract, network costs decreased by 2.3% despite increase in the number of mobile lines
>10% and the average data consumption per line >50%
86
84
2015 2016
18
(2)
16
86
(2)
84
24
(4)
19
28
(11) 16
155
136
2015 TV content Network Mobileequipment
Other 2016
TV content Network Mobile equipment Other
Direct cost management
Direct cost structure (€m)
As % of revenue
(€19.2m) / (12.4%)
Focus on network cost evolution: Host
>10%
Increase in
# of lines
Increase in
data
consumption
per line
>50%
(€2.0m) / (2.3%)
26.9%
23.7%
Include c.€9m of profit-
neutral activities

18
241
118
28
177
177
177
0
102
153
123
151
73
194
172
141
206
52
3
247
173
119
132
143
159
41
184
255
178
199
139
218
205
187
Network expansion
22%
Maintenance10%
Commercial and clients
68%
33.3
28.4
4Q15 4Q16
103
96
2015 2016
Consolidated capex
As % of revenue
16.7%
17.9%
(€7.2m) / (7.0%)
19.9% 22.7%
(€5.7m) / (14.9%)
Significant capex reduction of c.7% in the year (c.15% vs. the quarter of the previous year) deriving from the rationalization of R Cable
investments mainly in mobile network core integration and supplier renegotiation to bring its level close to that of Euskaltel
€96m
Capex (€m) 2016 Capex by category

19
241
118
28
177
177
177
0
102
153
123
151
73
194
172
141
206
52
3
247
173
119
132
143
159
41
184
255
178
199
139
218
205
187
163.9
13.57.2 184.7
2015 EBITDA growth Capex management 2016
Consolidated OpCF
OpCF growth 2015 - 2016 (€m)
Improved OpCF as percentage of sales from 28.5% to 32.2%
Euskaltel’s OpCF as percentage of sales increased by 122bps, while R Cable grew by c.690bps
As a % of revenue
33.9%
21.4%
35.2%
28.3%
+€20.8m / +12.7%
Proforma
to include
R Cable
32.2% 28.5%

20
241
118
28
177
177
177
0
102
153
123
151
73
194
172
141
206
52
3
247
173
119
132
143
159
41
184
255
178
199
139
218
205
187
1,358 1,3531,307
1,2711,223
4Q15 1Q16 2Q16 3Q16 4Q16
Strong de-leverage according to plan
Net debt (€m)
Leverage evolution (ND / LTM EBITDA)
4.2x
281
(96)
185
(50)
135
EBITDA Capex Op Cf Interests andother
Net Cash Flow
2016 Free Cash flow
Cash flow after debt service generated during the period
amounts to €135m allowing for dividend distribution
Equity free cash flow amounts to €134 implying an EFCF yield of
10.85%2
Strong cash generation resulting in consistent deleverage with net
debt / EBITDA ratio standing at 4.2x
5.1x 4.4x
PF fully
phased
synergies
Note:
1. Includes financial expenses, WC requirements, taxes and other
2. EFCF yield on the volume weighted share price of the last month of 2016 (€8.13)
1

21
241
118
28
177
177
177
0
102
153
123
151
73
194
172
141
206
52
3
247
173
119
132
143
159
41
184
255
178
199
139
218
205
187
Guidance for 2017-2019
1 Revenue
5 Leverage
2 EBITDA
3 Capex
Overall revenue growth: CAGR 2-3%
Residential growth to balance the effect in B2B in the short term. B2B regaining
momentum since 2018
Dividend 6
EBITDA margin to grow by 100 bps to reach 50%
To stay in the 16% revenue range
Additional integration and/or expansion capex below €10m
Between 3x-4x at the end of the period
Double digit annual growth
4 Free Cash Flow CAGR High single digit
M&A 7
Constantly looking for new M&A opportunities which should respect two principles:
Accretive in cash flow per share for Euskaltel’s shareholders
Maintain ND / EBITDA leverage within reasonable limits

22
241
118
28
177
177
177
0
102
153
123
151
73
194
172
141
206
52
3
247
173
119
132
143
159
41
184
255
178
199
139
218
205
187
Appendix I - Euskaltel 2016 consolidated results
and KPIs

23
241
118
28
177
177
177
0
102
153
123
151
73
194
172
141
206
52
3
247
173
119
132
143
159
41
184
255
178
199
139
218
205
187
Euskaltel Statutory accounts - KPIs (i/ii)
The 4Q15 financial information reflects Euskaltel’s standalone performance for that period plus R
Cable performance since 27-Nov-2015
The 4Q16 presented financials comprise consolidated financials for Euskaltel and R Cable
Residential
KPIs Unit 1T15 2T15 3T15 4T15 1T16 2T16 3T16 4T16 2015 2016
Homes passed # 872.053 873.254 876.937 1.699.073 1.700.847 1.703.361 1.703.941 1.707.558 1.699.073 1.707.558
Household coverage % 85% 85% 85% 65% 65% 65% 65% 65% 85% 65%
Residential subs # 295.360 300.751 298.419 545.502 547.009 548.069 548.945 546.040 545.502 546.040
o/w fixed services # 278.051 282.890 279.353 471.664 471.837 470.895 471.463 469.662 471.664 469.662
as % of homes passed % 31,9% 32,4% 31,9% 27,8% 27,7% 27,6% 27,7% 27,5% 27,8% 27,5%
o/w mobile only subs # 17.309 17.861 19.066 73.838 75.172 77.174 77.482 76.378 73.838 76.378
o/w 1P(%) % 17,6% 17,3% 17,5% 21,9% 21,7% 21,6% 21,9% 21,7% 21,9% 21,7%
o/w 2P(%) % 24,8% 21,5% 19,3% 14,8% 14,0% 13,3% 12,9% 12,5% 14,8% 12,5%
o/w 3P(%) % 35,5% 36,6% 36,6% 29,6% 29,0% 27,8% 27,0% 26,4% 29,6% 26,4%
o/w 4P(%) % 22,1% 24,6% 26,5% 33,7% 35,3% 37,3% 38,2% 39,4% 33,7% 39,4%
Total RGUs # 918.120 968.023 982.290 1.809.720 1.836.291 1.868.347 1.881.701 1.891.653 1.809.720 1.891.653
RGUs/sub # 3,1 3,2 3,3 3,3 3,4 3,4 3,4 3,5 3,3 3,5
Residential churn fixed customers % 14,8% 12,2% 13,9% 14,8% 13,5% 14,1% 14,9% 15,1% 14,8% 15,1%
Global ARPU fixed customers €/month 55,15 55,50 55,75 56,00 57,59 58,10 58,52 58,44 56,00 58,44
Fixed Voice RGUs # 278.516 283.341 279.792 467.181 467.280 467.292 465.362 462.827 467.181 462.827
as% fixed customers % 100,2% 100,2% 100,2% 99,0% 99,0% 99,2% 98,7% 98,5% 99,0% 98,5%
BB RGUs # 218.391 224.361 222.288 389.456 391.733 392.722 394.738 394.810 389.456 394.810
as% fixed customers % 78,5% 79,3% 79,6% 82,6% 83,0% 83,4% 83,7% 84,1% 82,6% 84,1%
TV RGUs # 124.729 127.660 127.802 250.191 256.783 264.899 267.325 270.333 250.191 270.333
as% fixed customers % 44,9% 45,1% 45,7% 53,0% 54,4% 56,3% 56,7% 57,6% 53,0% 57,6%
Postpaid lines # 296.484 332.661 352.408 702.892 720.495 743.434 754.276 763.683 702.892 763.683
Postpais customers # 165.411 185.203 194.926 412.247 422.737 433.513 436.737 438.953 412.247 438.953
as% fixed customers (only mobile excluded) % 53,3% 59,2% 63,0% 71,7% 73,7% 75,7% 76,2% 77,2% 71,7% 77,2%
Mobile lines / customer # 1,8 1,8 1,8 1,8 1,8 1,8 1,7 1,7 1,7 1,7
SOHO
KPIs Unit 1T15 2T15 3T15 4T15 1T16 2T16 3T16 4T16 2015 2016
Subs # 47.136 47.932 47.775 88.163 88.301 89.014 89.076 89.322 88.163 89.322
o/w 1P(%) % 32,1% 30,3% 29,7% 28,5% 31,7% 30,8% 30,4% 29,7% 32,3% 29,7%
o/w 2P(%) % 23,9% 21,9% 20,4% 27,0% 18,4% 17,5% 16,9% 16,4% 19,6% 16,4%
o/w 3P(%) % 32,9% 35,2% 36,9% 33,9% 38,1% 38,9% 39,3% 39,7% 37,4% 39,7%
o/w 4P(%) % 11,1% 12,6% 13,0% 10,6% 11,8% 12,8% 13,3% 14,2% 10,8% 14,2%
Total RGUs # 147.585 155.881 158.589 278.314 285.111 292.888 296.335 300.713 278.314 300.713
RGUs/sub # 3,1 3,3 3,3 3,2 3,2 3,3 3,3 3,4 3,2 3,4
SOHO churn fixed customers % 19,3% 17,6% 17,8% 19,7% 22,3% 21,4% 20,5% 20,3% 19,7% 20,3%
Global ARPU fixed customers €/month 64,4 65,1 65,4 65,3 64,9 65,0 65,3 65,2 65,3 65,2
SME and Large Accounts
KPIs Unit 1T15 2T15 3T15 4T15 1T16 2T16 3T16 4T16 2015 2016
Customers # 5.041 5.072 5.053 11.518 11.486 11.254 11.224 11.193 11.518 11.193
Quaterly FY
Quaterly FY
Quaterly FY

24
241
118
28
177
177
177
0
102
153
123
151
73
194
172
141
206
52
3
247
173
119
132
143
159
41
184
255
178
199
139
218
205
187
Euskaltel Statutory accounts - KPIs (ii/ii)
Selected financial information
Unit 1Q15 2Q15 3Q15 4Q15 1Q16 2Q16 3Q16 4Q16 2015 2016
Total revenue €m 79.6 82.1 82.7 105.0 141.8 144.2 144.4 142.5 349.4 572.9
Y-o-y change % 78.2% 75.7% 75% 35.7% 164.0%
o/w residential €m 49.0 50.8 51.7 64.2 91.3 93.7 95.0 93.1 215.7 373.1
Y-o-y change % 86.3% 84.5% 83.7% 45.1% 173.0%
o/w Business €m 22.8 23.4 22.8 30.3 42.4 42.8 41.7 39.7 99.3 166.6
Y-o-y change % 86.3% 82.5% 83.1% 30.8% 167.7%
o/w Wholesale and Other €m 5.6 5.6 6.2 8.1 8.0 7.8 7.7 9.7 25.4 33.2
Y-o-y change % 44.3% 39.1% 24.8% 19.6% 130.6%
o/w Other Profit Neutral Revenues €m 2.2 2.3 2.0 2.4 - - - - 8.9 -
Y-o-y change % -100.0% -100.0% -100.0% -100% 0.0%
Adjusted EBITDA €m 37.7 38.3 40.6 50.4 69.1 70.3 70.2 71.0 167.0 280.6
Y-o-y change % 83.2% 83.4% 72.7% 41.0% 168.0%
Margin % 47.4% 46.7% 49.2% 48.0% 48.7% 48.7% 48.6% 49.8% 49.2% 49.0%
Capital expenditures €m (9.1) (9.2) (10.3) (24.6) (21.6) (24.1) (21.8) (28.4) (53.1) (95.8)
Y-o-y change % 137.8% 161.6% 111.8% 15.7% 180.4%
% total revenues % -11.4% -11.2% -12.4% -23.4% -15.2% -16.7% -15.1% -19.9% -23.4% -16.7%
Operating Free Cash Flow €m 28.6 29.1 30.4 25.8 47.5 46.2 48.4 42.6 113.9 184.7
Y-o-y change % 65.9% 58.6% 59.5% 65.2% 162.2%
% EBITDA % 75.9% 76.0% 74.7% 51.2% 68.7% 65.7% 69.0% 60.0% 68.2% 65.8%
RDI €m 1.2 (19.7) 15.1 10.6 14.6 15.6 14.7 17.3 7.2 62.2
Quarterly FY
The 4Q15 financial information reflects Euskaltel’s standalone performance for that period plus R Cable performance since 27-Nov-2015
The 4Q16 presented financials comprise consolidated financials for Euskaltel and R Cable

25
241
118
28
177
177
177
0
102
153
123
151
73
194
172
141
206
52
3
247
173
119
132
143
159
41
184
255
178
199
139
218
205
187
P&L 2016 - Quarterly
EUR in million 2016
Q1'16 Q2'16 Q3'16 Q4'16 FY'16
Residential 91,3 93,7 95,0 93,1 373,1
Corporate 42,4 42,8 41,7 39,7 166,6
Wholesale & Others 8,0 7,8 7,7 9,7 33,2
Revenue 141,8 144,2 144,4 142,5 572,9
COGS (33,8) (35,6) (36,7) (29,4) (135,5)
Gross profit 108,0 108,6 107,7 113,1 437,4
Selling expenses (15,1) (15,3) (14,2) (16,5) (61,1)
Overhead (23,8) (23,0) (23,2) (25,6) (95,7)
EBITDA (adjusted) 69,1 70,3 70,2 71,0 280,6
D&A (36,6) (37,3) (37,6) (39,1) (150,6)
EBIT 32,4 33,0 32,6 32,0 130,0
Interest expense (11,9) (12,3) (12,3) (11,3) (47,9)
Extraordinary items (0,8) (1,7) (1,2) (1,2) (4,9)
PROFIT BEFORE INCOME TAX 19,7 19,0 19,0 19,4 77,2
Income tax expense (5,1) (3,4) (4,3) (2,2) (15,0)
NET PROFIT FOR THE PERIOD 14,6 15,6 14,7 17,2 62,1

26
241
118
28
177
177
177
0
102
153
123
151
73
194
172
141
206
52
3
247
173
119
132
143
159
41
184
255
178
199
139
218
205
187
Disclaimer
This presentation (the "Presentation") has been prepared and is issued by, and is the sole responsibility of Euskaltel, S.A. ("Euskaltel" or "the Company"). For the purposes hereof, the Presentation
shall mean and include the slides that follow, any prospective oral presentations of such slides by the Company, as well as any question-and-answer session that may follow that oral presentation
and any materials distributed at, or in connection with, any of the above.
The information contained in the Presentation has not been independently verified and some of the information is in summary form. No representation or warranty, express or implied, is made by
Euskaltel or its affiliate R Cable and Telecommunications Galicia, S.A. (“R Cable” and, together with Euskaltel, the “Euskaltel Group”), nor by their directors, officers, employees, representatives or
agents as to, and no reliance should be placed on, the fairness, accuracy, completeness or correctness of the information or opinions expressed herein. None of Euskaltel nor R Cable, nor their
respective directors, officers, employees, representatives or agents shall have any liability whatsoever (in negligence or otherwise) for any direct or consequential loss, damages, costs or prejudices
whatsoever arising from the use of the Presentation or its contents or otherwise arising in connection with the Presentation, save with respect to any liability for fraud, and expressly disclaim any and
all liability whether direct or indirect, express or implied, contractual, tortious, statutory or otherwise, in connection with the accuracy or completeness of the information or for any of the opinions
contained herein or for any errors, omissions or misstatements contained in the Presentation.
Euskaltel cautions that this Presentation contains forward looking statements with respect to the business, financial condition, results of operations, strategy, plans and objectives of the Euskaltel
Group. The words "believe", " expect", " anticipate", "intends", " estimate", "forecast", " project", "will", "may", "should" and similar expressions identify forward-looking statements. Other forward-
looking statements can be identified from the context in which they are made. While these forward looking statements represent our judgment and future expectations concerning the development of
our business, a certain number of risks, uncertainties and other important factors, including those published in our past and future filings and reports, including those with the Spanish Securities and
Exchange Commission (“CNMV”) and available to the public both in Euskaltel’s website (www.euskaltel.com) and in the CNMV’s website (www.cnmv.es), as well as other risk factors currently
unknown or not foreseeable, which may be beyond Euskaltel’s control, could adversely affect our business and financial performance and cause actual developments and results to differ materially
from those implied in the forward-looking statements. There can be no assurance that forward-looking statements will prove to be accurate, as actual results and future events could differ materially
from those anticipated in such statements. Accordingly, readers should not place undue reliance on forward-looking statements due to the inherent uncertainty therein.
The information contained in the Presentation, including but not limited to forward-looking statements, is provided as of the date hereof and is not intended to give any assurances as to future results.
No person is under any obligation to update, complete, revise or keep current the information contained in the Presentation, whether as a result of new information, future events or results or
otherwise. The information contained in the Presentation may be subject to change without notice and must not be relied upon for any purpose.
This Presentation contains financial information derived from Euskaltel’s audited consolidated financial statements for the twelve-month period ended 31 December 2016; Euskaltel’s unconsolidated
audited financial statements for the twelve-month period ended 31 December 2016 and 31 December 2015; R Cable’s individual audited financial statements for the twelve-month period ended 31
December 2016 and 31 December 2015. Financial information by business areas is presented according to internal Euskaltel’s criteria as a result of which each division reflects the true nature of its
business. In addition, the Presentation contains Euskaltel’s unaudited quarterly financial information for 2015 and 2016 by business areas prepared according to internal Euskaltel’s criteria. These
criteria do not follow any particular regulation and can include internal estimates and subjective valuations which could be subject to substantial change should a different methodology be applied.
Market and competitive position data in the Presentation have generally been obtained from industry publications and surveys or studies conducted by third-party sources. There are limitations with
respect to the availability, accuracy, completeness and comparability of such data. Euskaltel has not independently verified such data and can provide no assurance of its accuracy or completeness.
Certain statements in the Presentation regarding the market and competitive position data are based on the internal analyses of Euskaltel, which involve certain assumptions and estimates. These
internal analyses have not been verified by any independent source and there can be no assurance that the assumptions or estimates are accurate. Accordingly, no undue reliance should be placed
on any of the industry, market or Euskaltel’s competitive position data contained in the Presentation.
You may wish to seek independent and professional advice and conduct your own independent investigation and analysis of the information contained in this Presentation and of the business,
operations, financial condition, prospects, status and affairs of Euskaltel and R Cable. Euskaltel is not nor can it be held responsible for the use, valuations, opinions, expectations or decisions which
might be adopted by third parties following the publication of this Presentation.
No one should purchase or subscribe for any securities in the Company on the basis of this Presentation. This Presentation does not constitute or form part of, and should not be construed as, (i) an
offer, solicitation or invitation to subscribe for, sell or issue, underwrite or otherwise acquire any securities, nor shall it, or the fact of its communication, form the basis of, or be relied upon in
connection with, or act as any inducement to enter into any contract or commitment whatsoever with respect to any securities; or (ii) any form of financial opinion, recommendation or investment
advice with respect to any securities.
The distribution of this Presentation in certain jurisdictions may be restricted by law. Recipients of this Presentation should inform themselves about and observe such restrictions. Euskaltel disclaims
any liability for the distribution of this Presentation by any of its recipients.
By receiving or accessing to this Presentation you accept and agree to be bound by the foregoing terms, conditions and restrictions.


