Computers and Chemical Engineering 90 (2016) 79–93
Contents lists available at ScienceDirect
Computers and Chemical Engineering
j ourna l ho me pa g e: www.elsev ier .com/ locate /compchemeng
PFD modeling and experimental validation of gas–solid flow in aown flow reactor
. Lanza, M.A. Islam, H. de Lasa ∗
hemical Reactor Engineering Centre, Faculty of Engineering, The University of Western Ontario, 1151 Richmond Street, London, Ontario N6A 5B9, Canada
r t i c l e i n f o
rticle history:eceived 26 November 2015eceived in revised form 30 March 2016ccepted 3 April 2016
eywords:luidized downer unit
a b s t r a c t
This manuscript reports the fluid dynamics in the developed flow region of a cocurrent gas–solid downflow fluidized bed unit. Gas–solid flows are simulated using a Computational Particle Fluid Dynamics(CPFD) numerical scheme and experimental data from the CREC-GS-Optiprobes. This model representsclusters in a downer unit. It is hypothesized that in downers, clusters are formed via a Random Particle-Selection Method (RPSM) ensuring cluster dynamic stability. To accomplish this, a statistical particle-selection of clusters (SPSC) method is developed. This hybrid model is validated with experimental data
obtained in a 2 m height and 2.57 cm diameter column. Observed time-averaged axial and radial velocitiesand solid concentration profiles are successfully simulated by the Hybrid CPFD/CREC-GS-Optiprobes DataModel. These findings support: (a) a narrow distribution of particle cluster residences, (b) the relativelyflat radial solid concentrations and solid cluster velocities, and (c) a valuable approach for establishingslip velocities in downer units.
Gas–solid reactor units, in which gas and solid phases move con-urrently downward are designated as “downer” reactors. Downernits display distinctive fluid dynamic properties. In these units,article backmixing as observed in riser units is very limited. Par-icles evolve, however, in the same direction as gravity, moving asparticle clusters” at higher velocities than the gas in the fully devel-ped region. This fluid dynamics promotes a flow structure with flatadial solid concentrations, uniform velocity profiles and catalystesidence times being shorter than gas residence times (Brust and
irth, 2004; Chen et al., 2013; Wang et al., 1992; Zhu et al., 1995).The published technical literature has shown that downer reac-
or units could have intrinsic advantages over riser units, especiallyn Fluid Catalytic Cracking processes (FCC) (Koratiya et al., 2010).hus, given the valuable prospects for downer units, a better under-tanding of their fluid dynamics is of critical importance. In ordero accomplish this, it is necessary to accurately measure gas–solidow properties, such as particle velocity, particle cluster size and
article hold-up at the local level (Tuzla et al., 1998). In recentears, measurements of particle properties have been developedsing both non-intrusive (N. Dang et al., 2014; T. Dang et al., 2014;
Pantzali et al., 2013; Weber et al., 2013; Zhang et al., 2012; Bieberleet al., 2012) and less expensive intrusive techniques (Qian et al.,2013; Li et al., 2013; Zhang et al., 2003; Collin et al., 2009; Werther,1999).
In 1998, de Lasa’s research team patented an innovative opticalfiber sensor (de Lasa et al., 1998) aimed to gas–solid flow measure-ments. This sensor designated as the CREC-GS-Optiprobe uses agraded refractive index (GRIN) lens. This GRIN lens creates a highlyirradiated region at a few millimeters in front of the probe tip. As aresult, particles reflect laser rays while moving through the highlyirradiated region. Thus, the CREC-GS-Optiprobe minimizes probeintrusion allowing for a detailed resolution of particle phenomena.de Lasa’s research team has been considerably involved in exper-imental hydrodynamic studies in downer reactors (Abbasi et al.,2013, 2012; Islam et al., 2011a,b, 2010; Lanza, 2015; Lanza et al.,2012, 2013; Nova et al., 2004a,b).
With the help of various data acquisition enhancements, Lanzaet al. (2012) reported, for the first time, “individual cluster” infor-mation such as: (a) cluster solid concentrations, (b) individualcluster slip velocities, (c) cluster sizes, and (d) cluster drag coef-ficients. Lanza et al. (2012) developed a rigorous methodology forsetting the data baseline using the solid phase mass balance. Thus,using this approach, the baseline was selected for every opera-
tional condition in compliance with the solid mass balances. Thisapproach provides a new data analysis method which circumventsthe use of an arbitrary (empirical) and fixed data baseline level,
ap Particle acceleration vector (apx , apy , apz ) (m/s2)Dp Drag coefficient at a particle locationF Rate of momentum exchange between phases
(N/m3)Fp Particle drag force (N)f Particle distribution function (PDF)fD Particle distribution function with collision damp-
ingg Gravitational acceleration (m/s2)Gs Solid mass flux (Kg/m2/s)h Downer length (m)K1, K2 Functions of mp Particle mass (kg)Mwg Gas molecular weightN Average cluster size, number of particles in a cluster
times mean PSD diameter (m)np Total numerical number of particlesp Pressure (Pa)R Universal gas constant (J/mol K)Re Reynolds numberEeq Equivalent cluster radio (m)rp Average particle radio (m)Sij Rate of deformation (1/s)T Temperature (K)t Time (s)Ug Superficial gas velocity (operating conditions) (m/s)ug Gas velocity vector (m/s)up Particle velocity vector (upx′ , upy′ , upz ) (m/s)
Vp Particle volume (m3)V� Cell volumex Particle spatial location vector (xx, xy, xz) (m)z Axial coordinate in the downer unit with z = 2 m
being the downer feeding point (m)
Greek lettersıij The Dirac delta functionεcp Particle volume fraction at the close packing limitεg Gas volume fractionεp Particle volume fraction�g Gas dynamic viscosity (Pa s)�p Particle dynamic viscosity (Pa s)� Number of cells�g Gas density (kg/m3)�p Particle density (kg/m3)�g Gas stress tensor (N/m2)�p Particle normal stress tensor (N/m2)�D Collision damping time (s) Sphericity
AcronymsCPFD Computational Particle Fluid DynamicsCREC-GS-Optiprobes Chemical Reactor Engineering Centre
Gas–Solid OptiprobesRPSM Random Particle-Selection Method
aawst
a small high intensity irradiated region. Inside this high intensity
SPSC Statistical particle-selection of clusters
s in prior studies. Additionally, Lanza et al. (2012) also proposed mechanistic based method to calculate cluster drag coefficients,
ith this being a function of the cluster length and cluster particle
ize configuration of each particle cluster. To further characterizehe gas–solid flow in downer units, Lanza et al. (2013) showed
al Engineering 90 (2016) 79–93
that particle clusters display asymmetric distributions with smallerparticle clusters being the most dominant.
On the other hand, mathematical modeling of gas–solid flow hasrecently received considerable attention because of issues of stabil-ity and formulation of well-posed governing equations (Andrewsand O’Rourke, 1996; Cheng and Wang, 2014; Kim et al., 2011; Zhaoet al., 2010a,b; Zhuang et al., 2014). A promising mathematical tech-nique is presented using the Computational Particle Fluid Dynamics(CPFD) approach (O’Rourke and Snider, 2010; O’Rourke et al., 2009;Snider et al., 2011, 1998; Snider and Banerjee, 2010). In the CPFDmethod, the gas phase is treated as a fluid and is calculated usingEulerian computational grids, while the particle phase is modeledas discrete particles using Lagrangian numerical-particles. The fluidphase is described by mass and momentum conservation equationsincluding the strong coupling to the particle phase. The particlephase is accounted for by using a particle probability distributionfunction. The particle momentum equation is based on a multi-phase particle-in-cell (MP-PIC) method. In this regard, the use ofCPFD, for downer simulations, may have significant advantages indescribing the particle–fluid patterns and special flow features suchas the inherent rotational flow properties.
Thus, given the high prospects of downer reactors and the poten-tial interest in scaling them up, a new hybrid model for downerunits is reported in the present manuscript. This model involves arandom particle selection for cluster formation (RPSM). The com-bined CPFD and RPSM models are validated using experimentaldata from a wide range of operating conditions. This is the firstmanuscript in the technical literature that we are aware of, wheresuch a hybrid model using solid hold-ups and cluster velocities isestablished with experimental data. A road map for the materialcovered in this manuscript is given in Fig. 1. The purpose of thisroad map is to help chart the course of the work-flow.
2. Equipment description and experimental data
The experimental data used to validate the CPFD simulations,were obtained in an experimental riser-downer unit covering var-ious radial positions and a broad range of experimental conditions.
2.1. Experimental setup
In the present study, a 2.0 m high and 2.57 cm internal diame-ter column was used. Two CREC-GS-Optiprobes were placed at a1.85 m distance below the injection port in the downer, and sep-arated axially by 6 mm. A schematic diagram of the experimentalunit is presented in Fig. 2. A detailed explanation regarding thedesign of this unit is reported in Nova (2005) and Nova et al. (2004b,2007).
2.2. Fiber optic sensor
The Chemical Reactor Engineering Centre Gas–Solid OpticalProbe (CREC-GS-Optiprobe) was used in the present study to char-acterize the gas–solid flow. This fiber optic sensor for sensingparticle movement was designed and patented by de Lasa et al.(1998) at the Chemical Reactor Engineering Centre, University ofWestern Ontario (CREC-UWO). It belongs to the class of fiber opticsreflective sensors. An infrared laser beam of 830 nm wavelengthfrom a diode laser is focused into an optical fiber. The constantintensity light beam is collected and transmitted by the opticalfiber to its other end. With the help of a GRIN lens, the emerg-ing light from the back end of the optical fiber is concentrated into
light region, the light is reflected by moving particles. The reflectedlight is then collected and guided from the modulation zone toa semiconductor photodetector with a receiver optical fiber. This
A. Lanza et al. / Computers and Chemical Engineering 90 (2016) 79–93 81
w of t
pdtrn
2
das
2
iLbrmldo
3
timpcA
Fig. 1. Overvie
robe provides a well-defined region of high light intensity. Thisesign minimizes probe intrusion, allowing for a detailed resolu-ion of the particle phenomena occurring in the suspension. Theeader is referred to Nova et al. (2004a,b) for a more detailed expla-ation of the operating principles of the CREC-GS-Optiprobe.
.3. Particle size distribution (PSD)
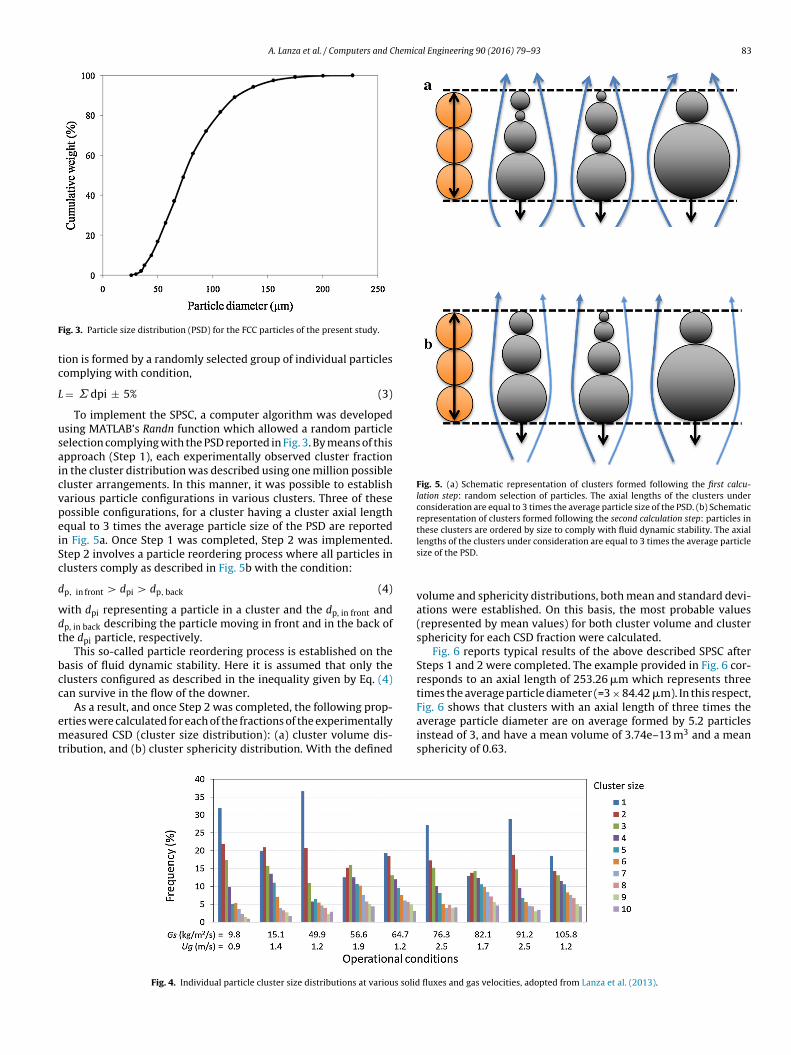
The FCC particles used in the experiments had a mean particleiameter of 84.42 �m with a standard deviation of 33.62 �m, andn apparent particle density of 1722 kg/m3. Fig. 3 shows the particleize distribution (PSD) curve.
.4. Cluster size distribution
Experimentally measured axial cluster size distribution in a onench internal diameter downer unit is reported in the literature byanza et al. (2013). These researchers used ammonia pretreatededs (0.01 m3 of ammonia hydroxide per 1 m3 of FCC catalyst) toemove any possible influence of electrostatic effects in cluster for-
ation. They found that particle clusters display asymmetric axialength distributions with smaller particle clusters being the mostominant. As shown in Fig. 4, this was a consistent trend for eachf the nine operating conditions studied.
. Mathematical model
Using the CPFD Barracuda method, the gas and particle equa-ions are solved in three dimensions. The gas phase dynamicss described by the averaged Navier–Stokes equations (mass and
omentum) with a strong coupling to the particle phase. Thearticle momentum equation follows the multiphase particle-in-ell (MP-PIC) formulation (Amsden et al., 1989; Anderson, 2009;uzerais et al., 1988; O’Rourke and Snider, 2010; O’Rourke et al.,
he work-flow.
2009; Snider and Banerjee, 2010; Snider et al., 2011, 1998). Thegoverning equations are listed in Table 1.
3.1. Cluster sphericity sub-model
Regarding cluster sphericity, the definition proposed by Chhabraet al. (1999) was adopted.
= s
S(1)
where is the cluster sphericity, s is the surface of a sphere havingthe same volume as the cluster and S is the actual surface area ofthe cluster. In the present study, the cluster sphericity is consideredequal to:
= s
S= 4�req
2
N × 4�rp2=
4�(N1/3rp
)2
N × 4�rp2= N−1/3 (2)
where N represents the average cluster size
3.2. Particle cluster properties sub-model
One has to acknowledge that particle clusters are dynamic enti-ties that can be formed in downer units when one cluster/particlefalls in the wake of another cluster/particle. Alternatively, a clustercan break into many fragments, as result of hydrodynamic instabil-ity (Krol et al., 2000). In the present study, the observed time signalsfrom the CREC-GS-Optiprobes are viewed as reflecting dynamicconditions with clusters being broken and reformed continuously.One should also notice that in the fully developed section of thedowner, particles travel downwards at a higher velocity than thefluid phase. Thus, particle velocity is very much affected by the
exerted drag force, with this drag being determined by particleor/and groups of particle geometry. It is also important to men-tion that clusters with similar axial lengths can experience differentterminal velocities. This is a result of the influence of the relation
82 A. Lanza et al. / Computers and Chemical Engineering 90 (2016) 79–93
Fig. 2. Experimental riser downer unit. The downer unit section is highlighted in green. Adapted from Nova et al. (2004b). (For interpretation of the references to colour inthis figure legend, the reader is referred to the web version of this article.)
Table 1Governing equations of the CPFD model.
The gas phase continuity equation:∂(εg�g)∂t
+ ∇ × (εg�gUg) = 0The gas phase momentum equation:∂(εg�gUg)
∂t+ ∇ × (εg�gUgUg) = −∇p − F + εg�gg + ∇ × (εg�g)
The average momentum exchange rate per volume between gas and particle phase:
F =∫∫∫
fVs�s
[Ds (Ug − Us) − 1
�s∇p
]dVsd�sdUs, where f is the particle distribution function which represents a number of
numerical particles per unit volume with similar local properties.The Liouville equation for the particle distribution function which includes a particle collision damping term:∂f∂t
+ ∂(fUs)∂x
+ ∂(fas)∂Us
=(∂f∂t
)Dcoll, where :
(∂f∂t
)Dcoll
= fD−f�D
The particle acceleration equation:as = dUs
dt = Ds (Ug − Us) − 1�s
∇p + g − 1εs�s
∇�s + Us−Us�D
The particle normal stress equation:
�s = Psεs
max[(εcp−εs), ∈ (1−εs)]
bt
(mca
The particle volume fraction in each cell:εs =
∫∫∫fVsdVsd�sdUs
etween the projected area and the total volume of the cluster onhe drag force.
One can notice that for 25–225 �m individual FCC particle sizes
refer to Fig. 3), several particle clusters in a “chain like” arrange-
ent (Krol et al., 2000) are possible. This is the case given that theyan satisfy a measured cluster axial length, such as 253.2 ± 5% �ms shown in Fig. 5a.
To address the random formation of clusters, the present studyproposes to model particle fluid dynamics in downer reactor units,with a prior statistical particle selection of clusters (SPSC), desig-
nated as Step 1 in the present study, on the basis of the following:(a) there is an experimentally established cluster axial size distribu-tion as viewed by the CREC-GS-Optiprobes available, and (b) each ofthe experimentally observed fractions of a cluster particle distribu-
A. Lanza et al. / Computers and Chemical Engineering 90 (2016) 79–93 83
F
tc
L
usaicvpeiSc
d
wdt
bcc
emt
Fig. 5. (a) Schematic representation of clusters formed following the first calcu-lation step: random selection of particles. The axial lengths of the clusters underconsideration are equal to 3 times the average particle size of the PSD. (b) Schematicrepresentation of clusters formed following the second calculation step: particles inthese clusters are ordered by size to comply with fluid dynamic stability. The axial
ig. 3. Particle size distribution (PSD) for the FCC particles of the present study.
ion is formed by a randomly selected group of individual particlesomplying with condition,
= dpi ± 5% (3)
To implement the SPSC, a computer algorithm was developedsing MATLAB’s Randn function which allowed a random particleelection complying with the PSD reported in Fig. 3. By means of thispproach (Step 1), each experimentally observed cluster fractionn the cluster distribution was described using one million possibleluster arrangements. In this manner, it was possible to establisharious particle configurations in various clusters. Three of theseossible configurations, for a cluster having a cluster axial lengthqual to 3 times the average particle size of the PSD are reportedn Fig. 5a. Once Step 1 was completed, Step 2 was implemented.tep 2 involves a particle reordering process where all particles inlusters comply as described in Fig. 5b with the condition:
p, in front > dpi > dp, back (4)
ith dpi representing a particle in a cluster and the dp, in front andp, in back describing the particle moving in front and in the back ofhe dpi particle, respectively.
This so-called particle reordering process is established on theasis of fluid dynamic stability. Here it is assumed that only thelusters configured as described in the inequality given by Eq. (4)an survive in the flow of the downer.
As a result, and once Step 2 was completed, the following prop-rties were calculated for each of the fractions of the experimentallyeasured CSD (cluster size distribution): (a) cluster volume dis-
ribution, and (b) cluster sphericity distribution. With the defined
Fig. 4. Individual particle cluster size distributions at various solid
lengths of the clusters under consideration are equal to 3 times the average particlesize of the PSD.
volume and sphericity distributions, both mean and standard devi-ations were established. On this basis, the most probable values(represented by mean values) for both cluster volume and clustersphericity for each CSD fraction were calculated.
Fig. 6 reports typical results of the above described SPSC afterSteps 1 and 2 were completed. The example provided in Fig. 6 cor-responds to an axial length of 253.26 �m which represents threetimes the average particle diameter (=3 × 84.42 �m). In this respect,Fig. 6 shows that clusters with an axial length of three times the
average particle diameter are on average formed by 5.2 particlesinstead of 3, and have a mean volume of 3.74e–13 m3 and a meansphericity of 0.63.
fluxes and gas velocities, adopted from Lanza et al. (2013).
84 A. Lanza et al. / Computers and Chemical Engineering 90 (2016) 79–93
Fig. 6. Frequency of (a) number of particles in a cluster, (b) cluster volume, and (c) cluster sphericity; for an axial length of three times the average particle diameter. Onemillion clusters were considered.
Table 2Operating conditions studied and the estimated average sphericity.
Fig. 7. Cluster size distribution for the Ug = 1.43 m/s, Gs = 15 kg/m2s operating con-dition.
Table 3Ganser’s drag model.
Fp = mpDp (ug − up)Dp = 0.375CD
�f |ug−up |�preq
req =(
3×Vc4×�
)1/3= N1/3 × rp
CD = (1 − εp)−2.65K2
{24
ReK1K2
[1 + 0.1118(ReK1K2)0.6567
]+ 0.4305
1+3305/ReK1K2
}K1 = 3
1+2/√
For CPFD simulations in the downer unit, a CAD model for a
10 106 1.16 0.62
In summary, based on a statistical method designated as SPSC,here chain-like clusters of a predetermined length are formed,
roperties such as average number of particles, average volume andverage sphericity in clusters were established. It is shown, in thepcoming section of the present study, that these calculated prop-rties are adequate for predicting solid transport fluid dynamics inowners.
.2.1. Cluster properties estimationFollowing the sub-model explained in Section 3.2 of the present
anuscript, cluster properties were statistically determined forll operating conditions described in Table 2. This includes theeighted average sphericity and average cluster volume, which
epresent a key information to model the fluid dynamics in downereactors units. Table 2 also reports the statistically estimated meanluster sphericity that represents cluster configuration per eachperating condition.
As an example, Fig. 7 reports the cluster size distribution thatorresponds to following operating condition: superficial gas veloc-ty, Ug, of 1.43 m/s; and mass solid flux, Gs, of 15 kg/m2s. As alreadyescribed, this experimentally measured axial cluster size wasomplemented with the statistically determined particle config-ration for each cluster axial length complying with the conditioniven by Eq. (3). This methodology was applied for each operatingondition studied in this manuscript.
.3. Drag sub-model
The interactions between the gas and solid phase are describedy the drag sub-model. The current drag sub-model has been estab-
ished in the work done by Chhabra et al. (1999) listed in Table 3.ur previous simulation work has proven that this drag model was
uccessful in modeling clusters in down flow reactor units. Thisrag model is a non-spherical drag model that supports the stringluster configuration as proposed by Krol et al. (2000).
K2 = 10˛
= 1.8148(
−log )0.5743
4. Numerical simulations
The CFD model was successfully solved using the commer-cial Barracuda VR 17.0.3 Software (CPFD Software, LLC—US). CPFDBarracuda is a Computational Particle Fluid Dynamics softwarepackage based on the multiphase particle-in-cell (MP-PIC) numericmethod. This computational method is specifically formulated forcoupled fluid–particle motion. To accomplish this, governing equa-tions for the gas phase are treated as a continuum in the frameworkof an Eulerian grid while particles are modeled as discrete entities,or computational particles (clouds) in a Lagrangian framework.
4.1. Geometry
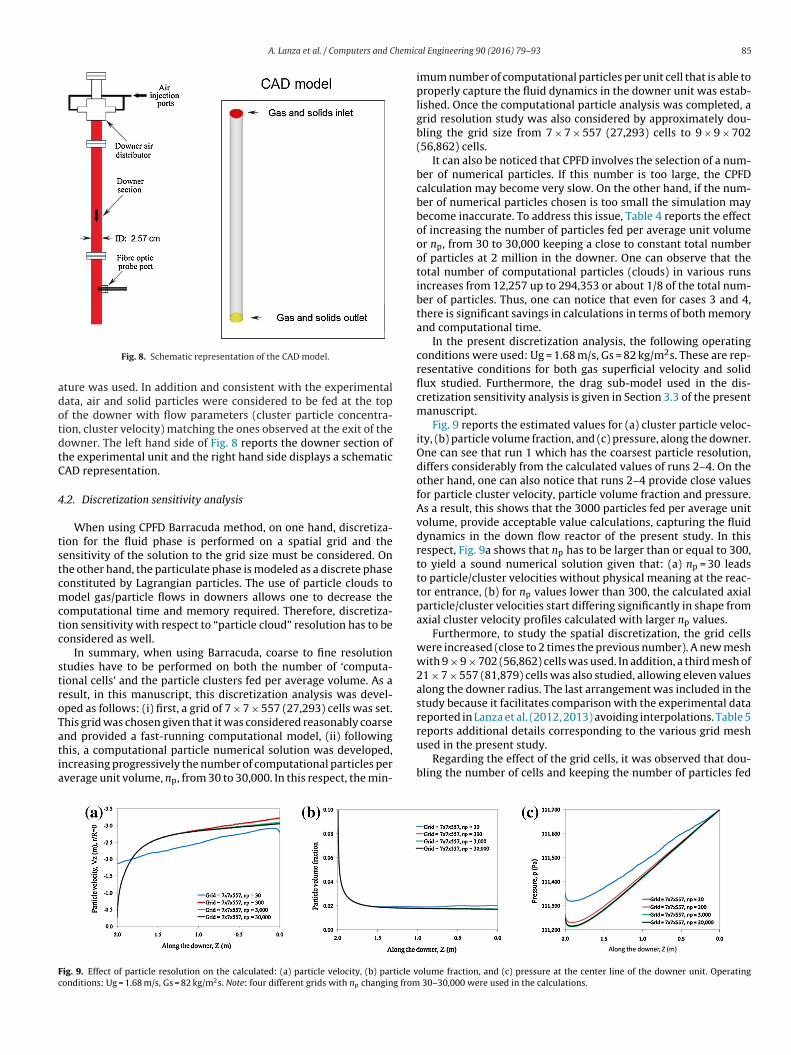
2 m high and 2.57 cm diameter column has to be defined prior toany calculation. In the case of the present study, a particle-freeempty downer tube filled with air at standard pressure and temper-
A. Lanza et al. / Computers and Chemic
adotdtC
4
tstcmctc
stroTatia
Fc
Fig. 8. Schematic representation of the CAD model.
ture was used. In addition and consistent with the experimentalata, air and solid particles were considered to be fed at the topf the downer with flow parameters (cluster particle concentra-ion, cluster velocity) matching the ones observed at the exit of theowner. The left hand side of Fig. 8 reports the downer section ofhe experimental unit and the right hand side displays a schematicAD representation.
.2. Discretization sensitivity analysis
When using CPFD Barracuda method, on one hand, discretiza-ion for the fluid phase is performed on a spatial grid and theensitivity of the solution to the grid size must be considered. Onhe other hand, the particulate phase is modeled as a discrete phaseonstituted by Lagrangian particles. The use of particle clouds toodel gas/particle flows in downers allows one to decrease the
omputational time and memory required. Therefore, discretiza-ion sensitivity with respect to “particle cloud” resolution has to beonsidered as well.
In summary, when using Barracuda, coarse to fine resolutiontudies have to be performed on both the number of ‘computa-ional cells’ and the particle clusters fed per average volume. As aesult, in this manuscript, this discretization analysis was devel-ped as follows: (i) first, a grid of 7 × 7 × 557 (27,293) cells was set.his grid was chosen given that it was considered reasonably coarse
nd provided a fast-running computational model, (ii) followinghis, a computational particle numerical solution was developed,ncreasing progressively the number of computational particles perverage unit volume, np, from 30 to 30,000. In this respect, the min-
ig. 9. Effect of particle resolution on the calculated: (a) particle velocity, (b) particle vonditions: Ug = 1.68 m/s, Gs = 82 kg/m2s. Note: four different grids with np changing from
al Engineering 90 (2016) 79–93 85
imum number of computational particles per unit cell that is able toproperly capture the fluid dynamics in the downer unit was estab-lished. Once the computational particle analysis was completed, agrid resolution study was also considered by approximately dou-bling the grid size from 7 × 7 × 557 (27,293) cells to 9 × 9 × 702(56,862) cells.
It can also be noticed that CPFD involves the selection of a num-ber of numerical particles. If this number is too large, the CPFDcalculation may become very slow. On the other hand, if the num-ber of numerical particles chosen is too small the simulation maybecome inaccurate. To address this issue, Table 4 reports the effectof increasing the number of particles fed per average unit volumeor np, from 30 to 30,000 keeping a close to constant total numberof particles at 2 million in the downer. One can observe that thetotal number of computational particles (clouds) in various runsincreases from 12,257 up to 294,353 or about 1/8 of the total num-ber of particles. Thus, one can notice that even for cases 3 and 4,there is significant savings in calculations in terms of both memoryand computational time.
In the present discretization analysis, the following operatingconditions were used: Ug = 1.68 m/s, Gs = 82 kg/m2s. These are rep-resentative conditions for both gas superficial velocity and solidflux studied. Furthermore, the drag sub-model used in the dis-cretization sensitivity analysis is given in Section 3.3 of the presentmanuscript.
Fig. 9 reports the estimated values for (a) cluster particle veloc-ity, (b) particle volume fraction, and (c) pressure, along the downer.One can see that run 1 which has the coarsest particle resolution,differs considerably from the calculated values of runs 2–4. On theother hand, one can also notice that runs 2–4 provide close valuesfor particle cluster velocity, particle volume fraction and pressure.As a result, this shows that the 3000 particles fed per average unitvolume, provide acceptable value calculations, capturing the fluiddynamics in the down flow reactor of the present study. In thisrespect, Fig. 9a shows that np has to be larger than or equal to 300,to yield a sound numerical solution given that: (a) np = 30 leadsto particle/cluster velocities without physical meaning at the reac-tor entrance, (b) for np values lower than 300, the calculated axialparticle/cluster velocities start differing significantly in shape fromaxial cluster velocity profiles calculated with larger np values.
Furthermore, to study the spatial discretization, the grid cellswere increased (close to 2 times the previous number). A new meshwith 9 × 9 × 702 (56,862) cells was used. In addition, a third mesh of21 × 7 × 557 (81,879) cells was also studied, allowing eleven valuesalong the downer radius. The last arrangement was included in thestudy because it facilitates comparison with the experimental datareported in Lanza et al. (2012, 2013) avoiding interpolations. Table 5
reports additional details corresponding to the various grid meshused in the present study.
Regarding the effect of the grid cells, it was observed that dou-bling the number of cells and keeping the number of particles fed
olume fraction, and (c) pressure at the center line of the downer unit. Operating 30–30,000 were used in the calculations.
86 A. Lanza et al. / Computers and Chemical Engineering 90 (2016) 79–93
Particle phase volume fraction at close packing 0.5Particle-wall tangential retention coefficient 0.95Particle-wall normal retention coefficient 0.95Diffuse bounce 0Maximum momentum redirection from collision 40%Geometry/cm Cylinder
ppc
pgs3daSsee
cghOfe
4
stwiwtow3cp
( )
Time step/s 0.002Simulation time/s 10
er average volume, np, constant, reduced the number of cloudser cells by half. Table 5 shows that for Run 2, 2 million particlesan be used to simulate 300,000 computational particles.
Fig. 10 reports very similar values of cluster particle velocity,article volume fraction, and pressure along the downer, usingrids with 7 × 7 × 557 cells and 9 × 9 × 702 cells. Therefore, themaller number of 7 × 7 × 557 (27,293) cells with a np value of000 particles can be considered satisfactory for gas–particle fluidynamic calculations. However, to validate the proposed modelvoiding interpolations, a 21 × 7 × 557 grid with 81,879 cells (Gridize # 3 in Table 5) was considered instead. This mesh size waselected to conveniently compare the simulation results with thexperimental data at specific radial locations as reported by Lanzat al. (2012).
In this respect, Fig. 11 provides details of the two different gridsonsidered. The left hand grid of Fig. 11a represents the minimumrid size determined for the discretization analysis, while the rightand grid of Fig. 11b represents the grid used in the present study.ne can notice that grid (b) has eleven cells along the radial position
rom r/R = 0 (the center), to r/R = 1 (the wall), as required for itsffective comparison with experimental data.
.3. Input conditions and boundary conditions
Table 6 reports the operating conditions considered for the CPFDimulations in the study. Air and particles were introduced at theop of the downer. Ambient pressure and ambient temperatureere selected for the system operation. A gas phase with zero veloc-
ty and solids with a velocity equal to the cluster terminal velocityere selected in the cells adjacent to the wall. The cluster size dis-
ribution was set for each operating condition. This was done basedn the experimental results of cluster size distribution as measured
ith the CREC-GS-Optiprobes and the SPSC described in Section
.2.1 of the present manuscript. On this basis cluster sphericity andluster calculated were defined. Table 6 reports the various inputarameters required for the CPFD simulation.
4.4. Particle velocity sensitivity analysis at the inlet section
The gas and solid high mixing feeder used in the downer unitof the present study involves a descending solid stream emerg-ing from the bottom of a cyclone. This solid stream meets sixteen0.5 mm impinging high velocity gas jets (30–50 m/s) angled at 45degrees. It is expected, given the significant gas and solid momen-tum dissipation, that at the outlet of this feeder a uniform gasvelocity and a cluster velocity in the 0.1–0.2 m/s range will beobtained. Fig. 12 reports the lack of influence of the particle veloc-ity at the feeding point on the cluster velocity in the stabilizedflow region. It can be observed that when the initial particle clustervelocity values are in the range of 0.25–1.8 m/s, once the particlesreach 0.4 m position in the column, all clusters essentially developthe same stabilized velocity regardless what the particle velocitiesat the inlet were. As a result, one can consider that at 1.85 m fromthe feeding point, the cluster velocity is unaffected by the initialvelocity. Thus, a 0.3–0.5 m/s initial cluster velocity, as adopted inthe present study, is fully adequate for calculations in the stabilizedflow region, obtaining results that are independent of the feederdesign.
5. Results and discussion
The results reported in this section are based on the conditionspreviously considered for simulation in this manuscript. Clusterparticle velocity profiles and particle volume fractions predictedwith the CPFD model are compared with the experimental dataalready published by Lanza et al. (2013, 2012).
Regarding the proposed model, Fig. 13 reports the model pre-dicted average pressures and pressure gradient profiles along thedowner for Ug = 2.53 m/s and Gs = 76 kg/m2s. It can be noticed thatclose to the inlet downer section, there is a quick pressure drop,where particles are accelerated by gravity and gas drag; with par-ticle velocity quickly increasing. However, when particle velocityequals the gas velocity value (see Fig. 14), the gas drag acting onthe particles becomes zero, the pressure reaches a minimum, andthe pressure gradient becomes zero.
Regarding average axial velocity profile along the downer, inFig. 14 one can observe that there is a downer entry region, aso-called “first particle cluster acceleration” section. It is in this“particle cluster acceleration” region where the pressure decreasescontinuously in order to compensate for the drag on particles aswell as the friction between the wall and the gas–solid flow. Thiscan be represented by,
∂p∂h
Ug,Gp
< 0, Ug > Up
A. Lanza et al. / Computers and Chemical Engineering 90 (2016) 79–93 87
Fig. 10. Effect of particle resolution on the calculated: (a) particle velocity, (b) particle volume fraction, and (c) pressure at the center line of the downer unit. Operatingconditions: Ug = 1.68 m/s, Gs = 82 kg/m2s. Note: np = 3000, 7 × 7 × 557 and 9 × 9 × 702 grids were used in the calculations.
Fig. 11. X–Y grids used in the CPFD simulations.
elocit
p
(
F
Fig. 12. Inlet particle v
This region ends with the zero pressure gradient condition andarticle velocity being equal to the gas velocity (Wang et al., 1992).
∂p)
∂hUg,Gp
= 0, Ug = Up
Moreover and further down the unit, there is, as reported inig. 13a and b, “a second particle cluster acceleration” section. It is in
y sensitivity analysis.
this region where the cluster particle velocity continues to increaseexceeding the superficial gas velocity. It is in this section, wheregas drag acts in the opposite direction than gravity and the totalpressure increases in the down-flow direction displaying a positivepressure gradient. In summary, particle clusters keep accelerating
88 A. Lanza et al. / Computers and Chemical Engineering 90 (2016) 79–93
Fig. 13. Simulated average (a) pressure profile and (b) gradient profile alo
FU
we(
cbiigt(
dpZ
ttAit
ig. 14. Average axial velocity profile along the downer. Operating conditions:g = 2.53 m/s; Gs = 76 kg/m2s.
hile gas drag remains smaller than gravity as seen in the followingquation:
∂p∂h
)Ug,Gp
> 0, Ug < Up
Finally, particle clusters evolving in a downer, reach a ‘thirdonstant velocity region’. It is in this region where gas drag forcesecome equal to gravity forces with cluster particle velocity reach-
ng a maximum value. At this point and onwards pressure steadilyncreases in the direction of the gas–solid flow, with the pressureradient being positive and constant, as seen in the following equa-ion:
∂p∂h
)Ug,Gp
> 0,
(∂2p
∂h2
)Ug,Gp
= 0, Ug < Up, Up = constant
One can thus notice, that the proposed cluster particle modelescribes the pressure changes in downers as reported in previousublications (Abbasi et al., 2012; Li et al., 2013; Wang et al., 1992;hang et al., 2003; Zhao et al., 2010a,b; Zhu et al., 2001, 1995).
Fig. 14 also shows that the location of the CREC Optiprobes andhus, the related measurements of cluster particle velocity and par-
icle volume fraction, where in the developed downer flow region.s a result, one can safely compare modeling predictions (which
nclude this assumption) and experimental results as attempted inhe upcoming sections of this manuscript.
ng the downer. Operating conditions: Ug = 2.53 m/s; Gs = 76 kg/m2s.
In order that the proposed model be rigorously validated, onehas to consider both the experimentally measured and model pre-dicted cluster particle velocities and volume solid fractions. In thisrespect, Figs. 15 and 16 report the cluster particle velocity profilesand particle volume fractions of the operating conditions studied.It can be observed that the hybrid model simulations show goodagreement with the experimental data for both cluster particlevelocity profiles and particle volume fractions, with a differenceobserved in the vicinity of the downer walls. One can observe thefollowing for all operating conditions: (a) there is a narrow distri-bution of particle cluster catalyst residences, (b) there is a relativelyflat radial solid concentrations and solid cluster velocities are pre-dicted both by CPFD and experimentally observed clusters.
Differences, however, are only slightly noticed in the near wallregion. Regarding these differences, one should note that the CPFDcomputational model was set for: (a) a zero gas phase velocity and aterminal cluster velocity at the near wall boundary, and (b) a diffusebounce set as zero. Regarding this value of zero bounce, it meansthat the new velocity vector for the particles after wall collisionis computed (using the normal and tangential momentum reten-tion coefficients set at 0.95 in the CPFD model) with no scatter.Thus, when particles hit the walls with the same velocity vector, theCPFD model will assign an identical velocity vector to each otherafter the bounce. In the experiments however, particles are not per-fectly round, and walls are not perfectly smooth. Thus, in reality,individual particle may have some deviation from the average afterthe bounce calculated vector. Consequently, this selected boundarycondition may be considered as reasonably adequate to explain theaverage flow behavior, leading to local differences at the vicinity ofthe walls. It is anticipated however, that the mild observed differ-ences between the hybrid proposed model and the experimentaldata in the near wall region, will be of smaller importance in largerdiameter downers where there is a more limited near wall influenceon the entire gas–solid fluid dynamics.
A further comparison between the CPFD simulations and theexperimental results is reported in Fig. 17. The calculated errorsare reported for both cluster particle velocity and particle volumefraction. One can see that these deviations can be in some cases,greater than 50%. As was previously described, the major contribu-tors to this are the differences between the proposed hybrid modelprediction and the experimental data in the vicinity of the walls,with the CPFD Barracuda simulation assigning a zero gas velocityat the wall surface.
On the other hand, Fig. 18 reports the same results, omitting,data in the near wall region. The calculated error decreases nowto 17.2% for cluster particle velocity and 19.9% for particle volume
A. Lanza et al. / Computers and Chemical Engineering 90 (2016) 79–93 89
volum
fg
Fig. 15. Radial profiles for (a) cluster particle velocity profile, and (b) particle
raction. Thus, it appears that the CPFD simulation provide veryood results to simulate the core of the downer unit.
e fraction profile. Axial position of the CREC-GS-Optiprobes z = 0.15m. (1/2).
5.1. Application of the hybrid model developed in this study
The established hybrid model allows calculating both the par-ticle void fraction and the cluster velocity changes with axial andradial positions. Fig. 19a reports the simulated radial velocity pro-
90 A. Lanza et al. / Computers and Chemical Engineering 90 (2016) 79–93
volum
fiaapa
Fig. 16. Radial profiles for (a) cluster particle velocity profile, and (b) particle
les for the gas and particle clusters in the downer. One can observe
similarity for each z position considered, with changes noticedlong the downer. For instance, at the inlet section, a flat radialrofile is observed. This can be anticipated, given the homogeneousssumption of the gas–particle mass flow at the near inlet condi-
e fraction profile. Axial position of the CREC-GS-Optiprobes z = 0.15m. (2/2).
tions. However, and once the flow is established, the walls have a
steady increasing role on shaping the radial cluster velocity profiles.
One should also notice that CPFD simulations using the hybridmodel of this study, allows calculating the radial particle slip veloc-ity (Uc − Ug) in all downer regions including the near wall region.
A. Lanza et al. / Computers and Chemical Engineering 90 (2016) 79–93 91
Fig. 17. Comparison between CPFD simulations and experimental results for cluster particle velocity and particle volume fraction. (a) Cluster particle velocity (m/s), (b)particle volume fraction εp.
F the df
OvcTr
daenttpS(
lic(da
ig. 18. Comparison between CPFD simulations and experimental results omittingraction εp.
ne should notice that experimental measurements of the slipelocity is, as far as we understand, not possible, given the diffi-ulty on getting directly and accurately the fluid radial velocity.hus, a hybrid model as the one presented in this study provides aeliable method for establishing slip velocities in downers.
Fig. 19b also describes the particle volume fraction in theowner at various axial positions. It can be observed that there isn important effect of the walls on the particle volume fraction. Forxample, an annular region of high solids concentration developsear the walls, ranging from r/R = 0.65 to 0.85, approximately. Onhe other hand, particle concentrations remain fairly constant inhe centre core region up to r/R = 0.65, increasing thereafter with aeak at around r/R = 0.75 and decreasing in the near wall regions.imilar results were found by Wang et al. (1992) and Zhu et al.1995).
In summary, the present study shows the value of CPFD simu-ations and CREC-GS-Optiprobe data for simulating downer unitsn the context of a hybrid model. These results may be of criti-al importance for assessing the significance of particle clustering
cluster moves faster than the fluid). This effect is essential forefining reaction times in catalytic downer units where bothdsorption and intrinsic reaction have to be accounted.
b
ata in the near wall region. (a) Cluster particle velocity (m/s), (b) particle volume
This is the first manuscript in the technical literature that we areaware of, where such a hybrid model is established. Such a modelcan be of significant value for the design and operation of futureFCC plants where the downer will be the chosen catalytic reactorunit. In this type of unit, the adequate modeling of catalyst andgas contact will lead to enhanced gasoline yield, reduced VGO overcracking with an undesirable formation of a high fraction of lightgases and coke. One can, thus, conclude that the extensive use ofhybrid simulations of downer units such as the one reported in thepresent study, can provide a most valuable modeling for the futuredevelopment and scale-up of the FCC units.
6. Conclusions
a) CPFD numerical simulations of downer units are successfullydeveloped using CPFD Barracuda based models. CPFD sim-ulations include the estimated cluster size distribution and
sphericities using a SPSC method.
) This statistical SPSC method (statistical particle selection of clus-ters), where chain-like clusters of an experimentally measuredaxial length are formed, is proposed to establish cluster prop-
92 A. Lanza et al. / Computers and Chemical Engineering 90 (2016) 79–93
F nditioc
d
ig. 19. (a) Radial cluster velocity profile, (b) particle volume fraction. Operating coonditions is set at 0.6 m/s.
erties such average number of particles, average volume andaverage sphericity.
c) Grid mesh and numerical particles are established considering
the influence of meshing on both particle volume fraction andcluster particle velocities.
ns: Ug = 2.53 m/s; Gs = 76 kg/m2s. Note: the inlet particle velocity at the inlet feeder
) Cluster particle acceleration regions and particle cluster con-stant velocity regions are successfully captured by the CPFDcalculations.
e) Experimentally measured radial cluster particle velocities andradial particle holdups show flat profiles in the central downerregion with this being consistent with the CPFD simulations. This
hemic
g
A
ufi
R
A
A
A
A
A
A
B
B
C
C
C
C
D
D
d
I
I
I
K
K
K
measurements of particle velocities in gas–solids suspension flow using anovel five-fiber optical probe. Powder Technol. 115 (2), 184–192.
provides strong support to the phenomenologically based CPFDmodels of downer units of the present study.
f) Experimentally measured radial cluster particle velocities andradial particle holdups display mild differences in the near-wallregion. The near-wall region effect is considered however, of lessimportance for scaling up of larger diameter downer reactors.
) The proposed hybrid model which combines CPFD simulationand CREC-GS-Optiprobes data allows calculating local slip veloc-ity between cluster velocities and fluid velocities in downerunits.
cknowledgment
We are grateful to acknowledge the contribution of the Nat-ral Sciences and Engineering Council of Canada who supportednancially this research.
eferences
bbasi, A., Islam, M., Ege, P., de Lasa, H., 2012. Downer reactor flow measurementsusing CREC-GS-Optiprobes. Powder Technol. 224, 1–11.
bbasi, A., Islam, M., Ege, P., de Lasa, H., 2013. CPFD flow pattern simulation indowner reactors. AIChE J. 59 (5), 1635–1647.
msden, A., O’Rourke, P., Butler, T., 1989. KIVA-II: a computer program forchemically reactive flows with sprays. Los Alamos—National Laboratory, NewMexico, Report LA-11560-MS.
ndrews, M., O’Rourke, P., 1996. The multiphase particle-in-cell (MP-PIC) methodfor dense particulate flows. Int. J. Multiph. Flow 22 (2), 379–402.
uzerais, F., Jackson, R., Russel, W., 1988. The resolution of shocks and the effectsof compressible sediments in transient settling. J. Fluid Mech. 195, 437–462.
ieberle, M., Barthel, F., Hampel, U., 2012. Ultrafast X-ray computed tomographyfor the analysis of gas–solid fluidized beds. Chem. Eng. J. 189–190, 356–363.
rust, H., Wirth, K., 2004. Residence time behavior of gas in a downer reactor. Ind.Eng. Chem. Res. 43 (18), 5796–5801.
heng, Y., Wang, C.-H., 2014. Numerical study on coal gasification in the downerreactor of a triple-bed combined circulating fluidized bed. Ind. Eng. Chem. Res.53, 6624–6635.
hhabra, R., Agarwal, L., Sinha, N., 1999. Drag on non-spherical particles: anevaluation of available methods. Powder Technol. 101 (3), 288–295.
ollin, A., Wirth, K.-E., Stroeder, M., 2009. Characterization of an annular fluidizedbed. Powder Technol. 190 (1–2), 31–35.
ang, N., Gallucci, F., van Sint Annaland, M., 2014. Micro-structured fluidized bedmembrane reactors: solids circulation and densified zones distribution. Chem.Eng. J. 239, 42–52.
ang, T., Gallucci, F., van Sint Annaland, M., 2014. Gas back-mixing study in amembrane-assisted micro-structured fluidized bed. Chem. Eng. Sci. 108,194–202.
e Lasa, H., Young, B., Krol, S., 1998. Fiber optic sensor for sensing particlemovement in a catalytic reactor, US Patent. Canada, United States Patent.
slam, M., Krol, S., de Lasa, H., 2010. Slip velocity in downer reactors: dragcoefficient and the influence of operational variables. Ind. Eng. Chem. Res. 49(15), 6735–6744.
slam, M., Krol, S., de Lasa, H., 2011a. Radial distribution of particle clusters in adowner reactor unit. In: 2011 ECI Conference on the 13th InternationalConference on Fluidization—New Paradigm in Fluidization Engineering, Korea.
slam, M., Krol, S., de Lasa, H., 2011b. The CREC-GS-Optiprobes and its focal region.Chem. Eng. Sci. 66 (8), 1671–1684.
im, Y., Wu, C., Cheng, Y., 2011. CFD simulation of hydrodynamics of gas–solidmultiphase flow in downer reactors: revisited. Chem. Eng. Sci. 66 (21),
rol, S., Pekediz, A., de Lasa, H., 2000. Particle clustering in down flow reactors.Powder Technol. 108 (1), 6–20.
al Engineering 90 (2016) 79–93 93
Lanza, A., 2015. Cluster Fluid Dynamics in Down Flow Reactors: Experimental andModeling Study. University of Western Ontario, Electronic PhD’s thesisavailable at http://ir.lib.uwo.ca/etd/2659.
Lanza, A., Islam, M., de Lasa, H., 2012. Particle clusters and drag coefficients ingas–solid downer units. Chem. Eng. J. 200–202, 439–451.
Lanza, A., Islam, M., de Lasa, H., 2013. Particle cluster size distribution in gas–soliddowner units. In: 2013 ECI Conference on the 14th International Conference onFluidization—From Fundamentals to Products, The Netherlands.
Li, D., Ray, M., Ray, A., Zhu, J.-X., 2013. A comparative study on hydrodynamics ofcirculating fluidized bed riser and downer. Powder Technol. 247, 235–259.
Nova, S., 2005. Optic Sensors for Particle Clustering Studies in Down Flow Reactors.The University of Western Ontario.
Nova, S., Krol, S., de Lasa, H., 2004a. CREC fiber-optic probes for particle velocityand particle clustering: design principles and calibration procedures. Ind. Eng.Chem. Res. 43 (18), 5620–5631.
Nova, S., Krol, S., de Lasa, H., 2004b. Particle velocity and particle clustering indown-flow reactors. Powder Technol. 148 (2–3), 172–185.
Nova, S., Krol, S., de Lasa, H., 2007. Radial distribution of particle clusters in downflow reactors. 2007 ECI Conference on the 12th International Conference onFluidization—New Horizons in Fluidization Engineering.
O’Rourke, P., Snider, D., 2010. An improved collision damping time for MP-PICcalculations of dense particle flows with applications to polydispersesedimenting beds and colliding particle jets. Chem. Eng. Sci. 65 (22),6014–6028.
O’Rourke, P., Zhao, P., Snider, D., 2009. A model for collisional exchange ingas/liquid/solid fluidized beds. Chem. Eng. Sci. 64 (8), 1784–1797.
Pantzali, M., B, L., Heynderickx, G., Marin, G., 2013. Three-component solidsvelocity measurements in the middle section of a riser. Chem. Eng. Sci. 101,412–423.
Qian, L., Lu, Y., Zhong, W., Chen, X., Ren, B., Jin, B., 2013. Developing a novel fibrehigh speed photography method for investigating solid volume fraction in a 3Dspouted bed. Can. J. Chem. Eng. 91 (September), 1793–1799.
Snider, D., Banerjee, S., 2010. Heterogeneous gas chemistry in the CPFDEulerian–Lagrangian numerical scheme (ozone decomposition). PowderTechnol. 199 (1), 100–106.
Snider, D., O’Rourke, P., Andrews, M., 1998. Sediment flow in inclined vesselscalculated using a multiphase particle-in-cell model for dense particle flows.Int. J. Multiph. Flow 24, 1359–1382.
Snider, D., Clark, S., O’Rourke, P., 2011. Eulerian–Lagrangian method forthree-dimensional thermal reacting flow with application to coal gasifiers.Chem. Eng. Sci. 66 (6), 1285–1295.
Tuzla, K., Sharma, A., Chen, J., Schiewe, T., Wirth, K., Molerus, O., 1998. Transientdynamics of solid concentration in downer fluidized bed. Powder Technol. 100,166–172.
Wang, Z., Bai, D., Jin, Y., 1992. Hydrodynamics of cocurrent downflow circulatingfluidized bed (CDCFB). Powder Technol. 70 (3), 271–275.
Weber, J., Layfield, K., Van Essendelft, D., Mei, J., 2013. Fluid bed characterizationusing Electrical Capacitance Volume Tomography (ECVT): compared to CPFDSoftware’s Barracuda. Powder Technol. 250, 138–146.
Zhang, M., Qian, Z., Yu, H., Wei, F., 2003. The solid flow structure in a circulatingfluidized bed riser/downer of 0.42 m diameter. Powder Technol. 129 (1–3),46–52.
Zhang, Y., Lan, X., Gao, J., 2012. Modeling of gas–solid flow in a CFB riser based oncomputational particle fluid dynamics. Pet. Sci. 9 (4), 535–543.
Zhao, Y., Cheng, Y., Wu, C., Ding, Y., Jin, Y., 2010a. Eulerian–Lagrangian simulationof distinct clustering phenomena and RTDs in riser and downer. Particuology 8(1), 44–50.
Zhao, Y., Ding, Y., Wu, C., Cheng, Y., 2010b. Numerical simulation of hydrodynamicsin downers using a CFD-DEM coupled approach. Powder Technol. 199 (1),2–12.
Zhu, J.-X., Yu, Z.-Q., Jin, Y., Grace, J., Issangya, A., 1995. Cocurrent downflowcirculating fluidized bed (downer) reactors—a state of the art review. Can. J.Chem. Eng. 73, 662–677.