27
FORECAST
| Date post: | 07-Jan-2017 |
| Category: |
Documents |
| Upload: | darrius-morrow |
| View: | 62 times |
| Download: | 0 times |
FORECAST
5SKILLS OVERVIEW
Summary observationsProgramming and development continue to be the most in-demand and difficult-to-find skill sets.
Network and security skills remain some of the toughest skill sets to source
Mobile skills seem less in demand than in previous years
2
Now in its fifth year, the survey poses questions that are revisited annually to make year-over-year comparisons and paint a picture of leadership’s goals for the future. Key takeaways from the 2017 IT Forecast:
Budget expectations have bounced back from last year. Spending is primarily expected to be balanced between implementing new or improving existing core IT and operational systems. Many functions outside of core IT, including marketing and sales, are now taking independent responsibility for tech-related investments and projects, further blurring the lines of technology ownership (see page 6).
In terms of staffing IT teams, spending on staff augmentation and managed services is expected to increase. Survey results indicate that companies are increasingly adopting the managed services model as a compromise between the burden of staffing in-house and the loss of control with a fully outsourced model (see page 10). The most critical skills IT leaders expect to need are programmers and developers, networking specialists, project managers and software engineers. What’s more, these skills along with security top the list of most difficult to find (see pages 13 and 14).
Organizational alignment (i.e., how well the IT and business staff understand one another) is anticipated to be the biggest challenge in 2017, according to 1 in 3 IT leaders (see page 22). With numerous tech owners, it is difficult to juggle the horizontal interests of areas that are integrated across the business, such as information security and data. This corresponds with the level of confidence in IT’s ability to complete new initiatives, which has made subtle growth year over year (see page 8).
The annual IT Forecast explores IT leader perceptions and expectations around spending, in-demand skills, technology and trends impacting organizations as well as workforce planning for the upcoming year.
3
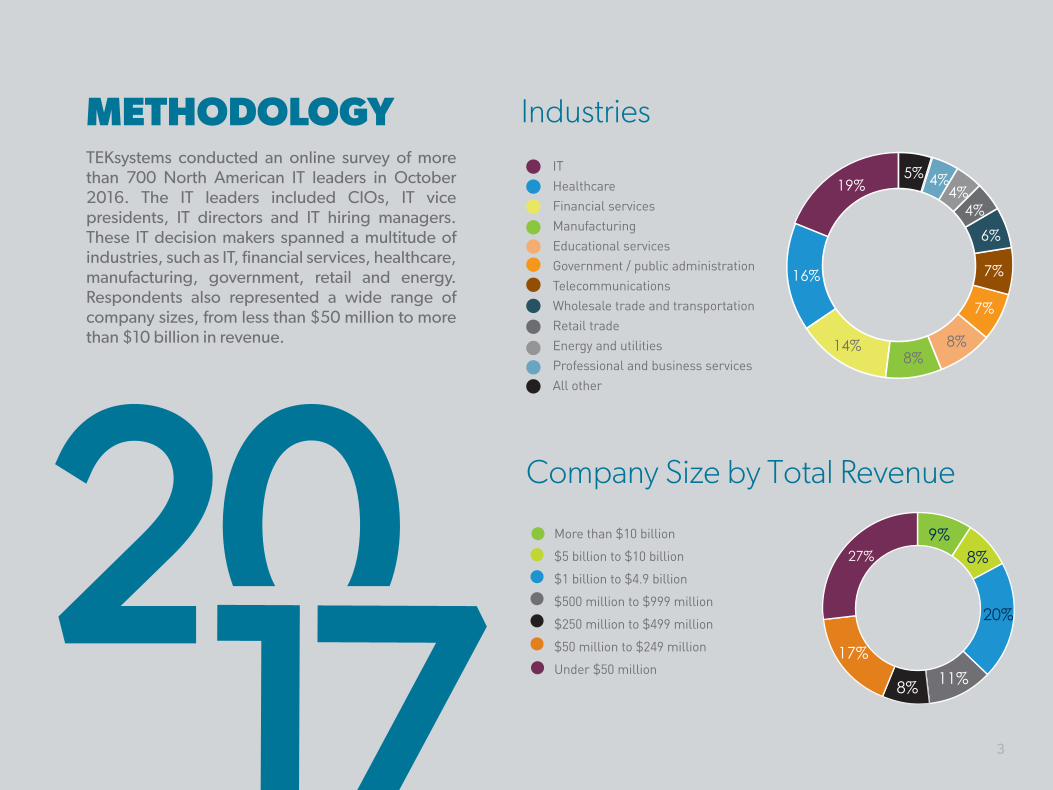
METHODOLOGYTEKsystems conducted an online survey of more than 700 North American IT leaders in October 2016. The IT leaders included CIOs, IT vice presidents, IT directors and IT hiring managers. These IT decision makers spanned a multitude of industries, such as IT, financial services, healthcare, manufacturing, government, retail and energy. Respondents also represented a wide range of company sizes, from less than $50 million to more than $10 billion in revenue.
ITHealthcareFinancial servicesManufacturingEducational servicesGovernment / public administrationTelecommunicationsWholesale trade and transportationRetail tradeEnergy and utilitiesProfessional and business servicesAll other
Industries
Company Size by Total Revenue
27%
More than $10 billion
$5 billion to $10 billion
$1 billion to $4.9 billion
$500 million to $999 million
$250 million to $499 million
$50 million to $249 million
Under $50 million17%
20%
9%
11%8%
8%
19%
16%
14%8%
8%
7%
7%
6%
4%4%
4%5%
5SKILLS OVERVIEW
Summary observationsProgramming and development continue to be the most in-demand and difficult-to-find skill sets.
Network and security skills remain some of the toughest skill sets to source
Mobile skills seem less in demand than in previous years
4
OF CONTENTS
Budgets and Spending
Skills Overview
Areas of Impact
Workforce Expectations
1 2
1 5
23
05

5
5
Summary observations• 2017 budget expectations rebounded
and are closer to the level of expectations reported in 2015
• IT leader confidence in the IT department is at a three-year high
• IT leaders are scaling back their areas of responsibilities, where once department-initiated projects outside of IT are up and running, IT limits their responsibility (i.e., security, data integration)
BUDGETS AND SPENDING
5
Annual IT Forecast 6
6BUDGETS AND SPENDING
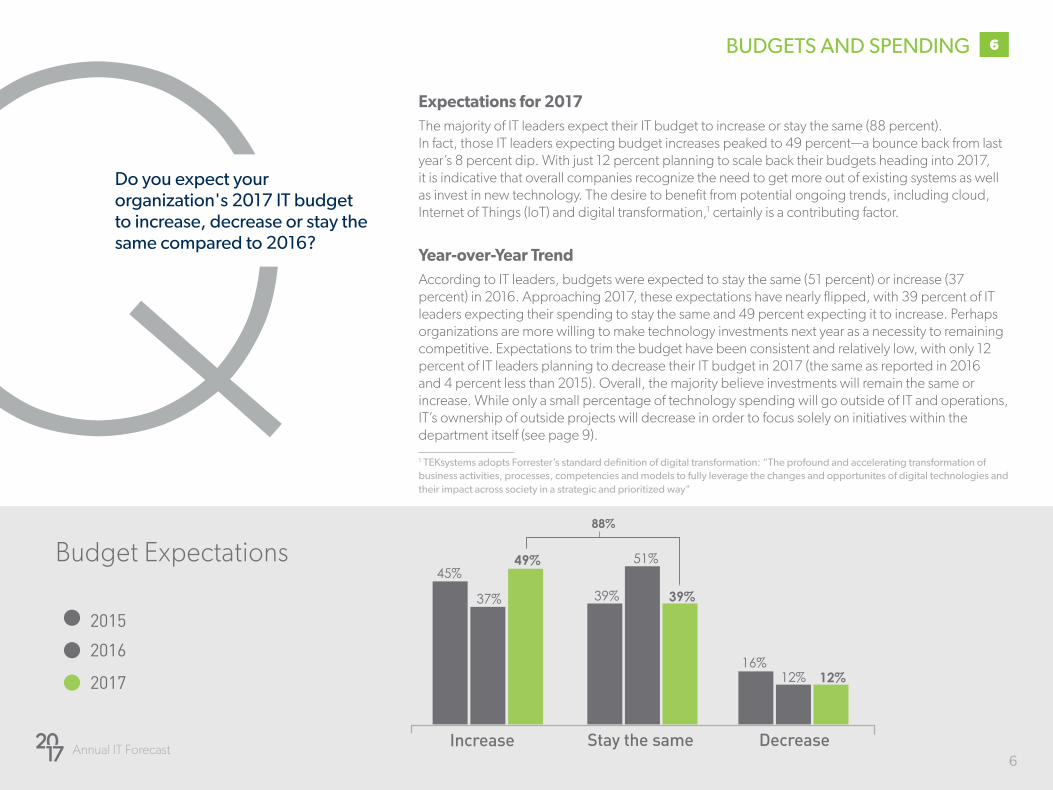
QDo you expect your organization's 2017 IT budget to increase, decrease or stay the same compared to 2016?
Budget Expectations
Increase Stay the same Decrease
2015
2016
2017
45%
37%
49%
39%
51%
39%
16%12% 12%
Expectations for 2017The majority of IT leaders expect their IT budget to increase or stay the same (88 percent). In fact, those IT leaders expecting budget increases peaked to 49 percent—a bounce back from last year’s 8 percent dip. With just 12 percent planning to scale back their budgets heading into 2017, it is indicative that overall companies recognize the need to get more out of existing systems as well as invest in new technology. The desire to benefit from potential ongoing trends, including cloud, Internet of Things (IoT) and digital transformation,1 certainly is a contributing factor.
Year-over-Year TrendAccording to IT leaders, budgets were expected to stay the same (51 percent) or increase (37 percent) in 2016. Approaching 2017, these expectations have nearly flipped, with 39 percent of IT leaders expecting their spending to stay the same and 49 percent expecting it to increase. Perhaps organizations are more willing to make technology investments next year as a necessity to remaining competitive. Expectations to trim the budget have been consistent and relatively low, with only 12 percent of IT leaders planning to decrease their IT budget in 2017 (the same as reported in 2016 and 4 percent less than 2015). Overall, the majority believe investments will remain the same or increase. While only a small percentage of technology spending will go outside of IT and operations, IT’s ownership of outside projects will decrease in order to focus solely on initiatives within the department itself (see page 9).
1 TEKsystems adopts Forrester’s standard definition of digital transformation: “The profound and accelerating transformation of business activities, processes, competencies and models to fully leverage the changes and opportunites of digital technologies and their impact across society in a strategic and prioritized way"
88%
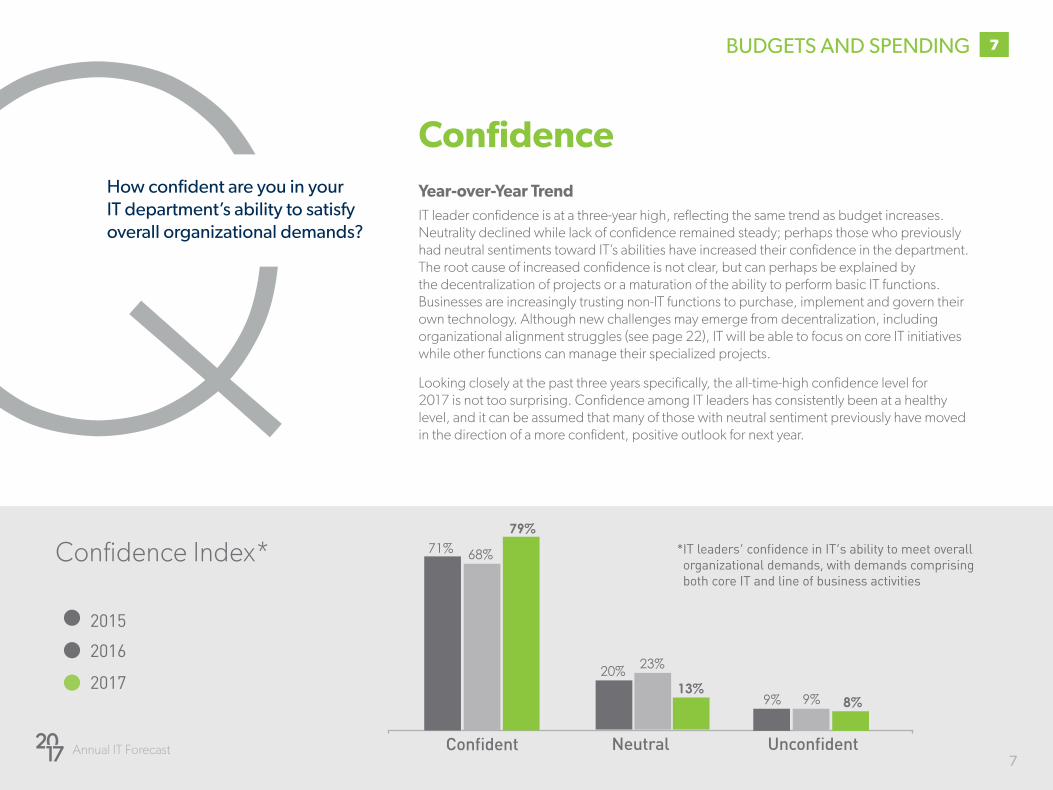
ConfidenceYear-over-Year TrendIT leader confidence is at a three-year high, reflecting the same trend as budget increases. Neutrality declined while lack of confidence remained steady; perhaps those who previously had neutral sentiments toward IT’s abilities have increased their confidence in the department. The root cause of increased confidence is not clear, but can perhaps be explained by the decentralization of projects or a maturation of the ability to perform basic IT functions. Businesses are increasingly trusting non-IT functions to purchase, implement and govern their own technology. Although new challenges may emerge from decentralization, including organizational alignment struggles (see page 22), IT will be able to focus on core IT initiatives while other functions can manage their specialized projects.
Looking closely at the past three years specifically, the all-time-high confidence level for 2017 is not too surprising. Confidence among IT leaders has consistently been at a healthy level, and it can be assumed that many of those with neutral sentiment previously have moved in the direction of a more confident, positive outlook for next year.
Q Annual IT Forecast
7
How confident are you in your IT department’s ability to satisfy overall organizational demands?
7
Confident Neutral Unconfident
*�IT�leaders'�confidence�in�IT's�ability�to�meet�overall�organizational demands, with demands comprising both core IT and line of business activities
Confidence Index*
2015
2016
2017
Confident Neutral Unconfident
71% 68%
79%
20% 23%
13%9% 9% 8%
BUDGETS AND SPENDING
Annual IT Forecast 8
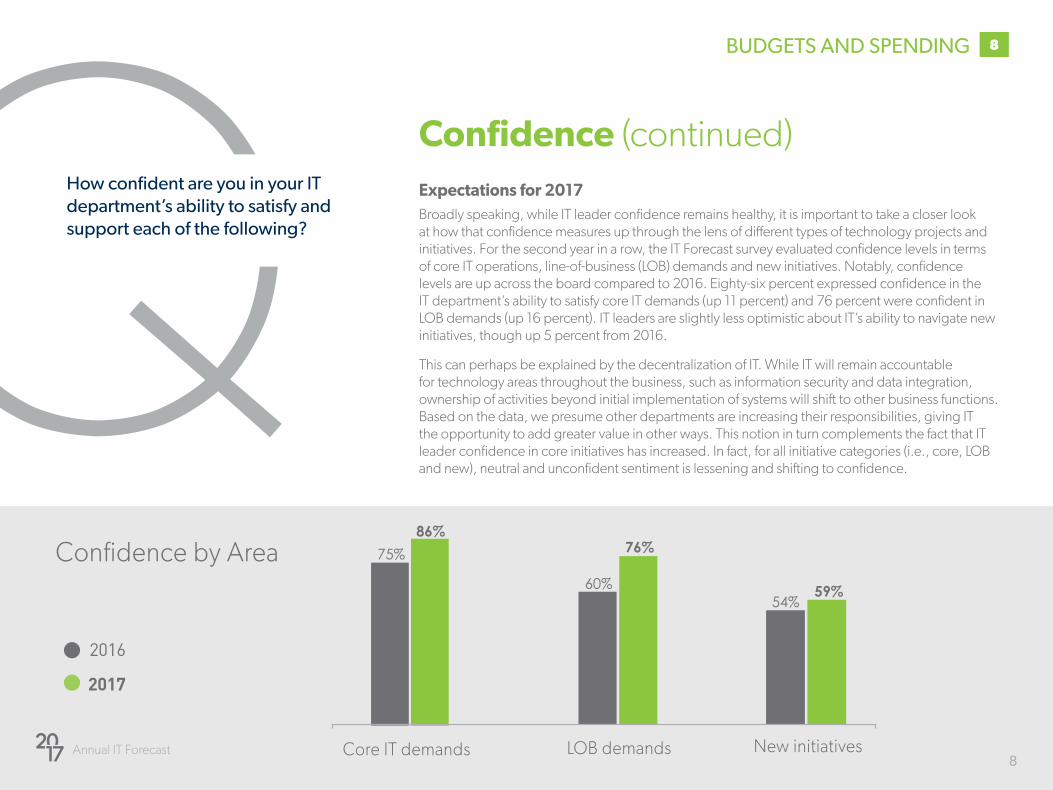
QConfidence (continued)Expectations for 2017Broadly speaking, while IT leader confidence remains healthy, it is important to take a closer look at how that confidence measures up through the lens of different types of technology projects and initiatives. For the second year in a row, the IT Forecast survey evaluated confidence levels in terms of core IT operations, line-of-business (LOB) demands and new initiatives. Notably, confidence levels are up across the board compared to 2016. Eighty-six percent expressed confidence in the IT department’s ability to satisfy core IT demands (up 11 percent) and 76 percent were confident in LOB demands (up 16 percent). IT leaders are slightly less optimistic about IT’s ability to navigate new initiatives, though up 5 percent from 2016.
This can perhaps be explained by the decentralization of IT. While IT will remain accountable for technology areas throughout the business, such as information security and data integration, ownership of activities beyond initial implementation of systems will shift to other business functions. Based on the data, we presume other departments are increasing their responsibilities, giving IT the opportunity to add greater value in other ways. This notion in turn complements the fact that IT leader confidence in core initiatives has increased. In fact, for all initiative categories (i.e., core, LOB and new), neutral and unconfident sentiment is lessening and shifting to confidence.
How confident are you in your IT department’s ability to satisfy and support each of the following?
8
Core IT demands LOB demands New initiatives
2016
59%
2017
86%76%75%
60%54%
BUDGETS AND SPENDING
Confidence by Area
Annual IT Forecast 9
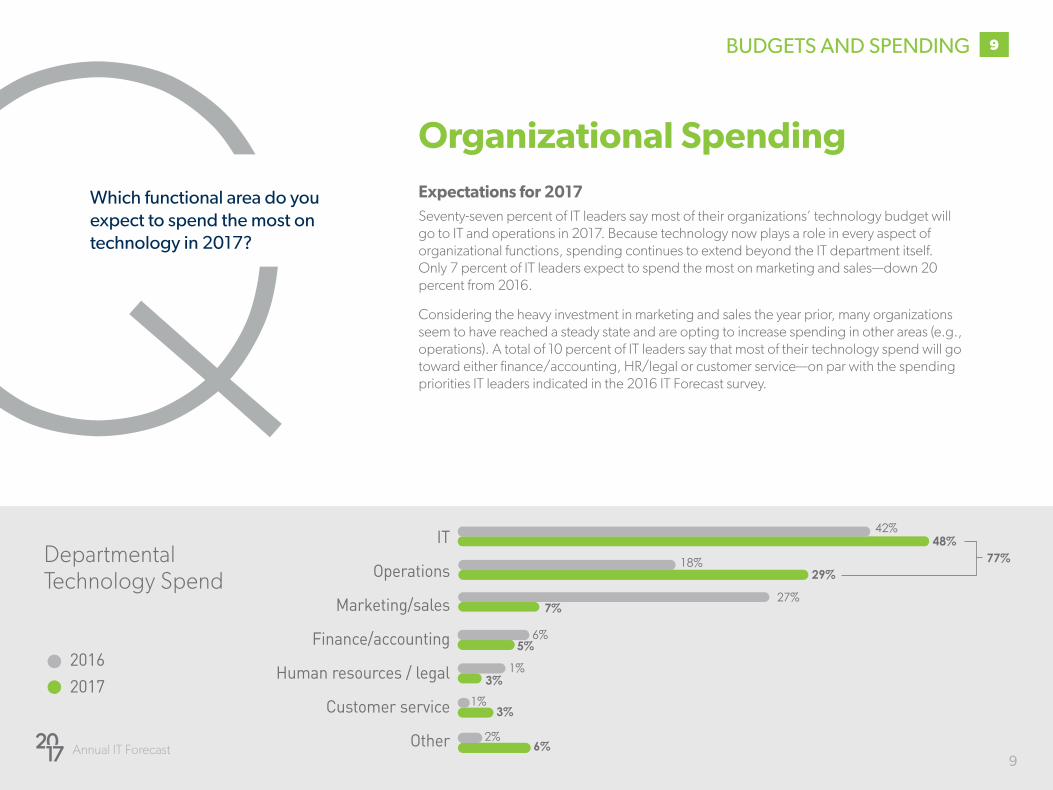
Organizational SpendingExpectations for 2017Seventy-seven percent of IT leaders say most of their organizations’ technology budget will go to IT and operations in 2017. Because technology now plays a role in every aspect of organizational functions, spending continues to extend beyond the IT department itself. Only 7 percent of IT leaders expect to spend the most on marketing and sales—down 20 percent from 2016.
Considering the heavy investment in marketing and sales the year prior, many organizations seem to have reached a steady state and are opting to increase spending in other areas (e.g., operations). A total of 10 percent of IT leaders say that most of their technology spend will go toward either finance/accounting, HR/legal or customer service—on par with the spending priorities IT leaders indicated in the 2016 IT Forecast survey.
Departmental Technology Spend
9
QWhich functional area do you expect to spend the most on technology in 2017?
IT
Operations
Marketing/sales
Finance/accounting
Human resources / legal
Customer service
Other
48%42%
5%6%
3%1%
3%1%
6%2%
27%7%
29%18%
2017
2016
BUDGETS AND SPENDING
77%
Annual IT Forecast 10
Staff augmentation services
TManaged, project-based or
SOW services
TTraining / professional development
Outsourcing
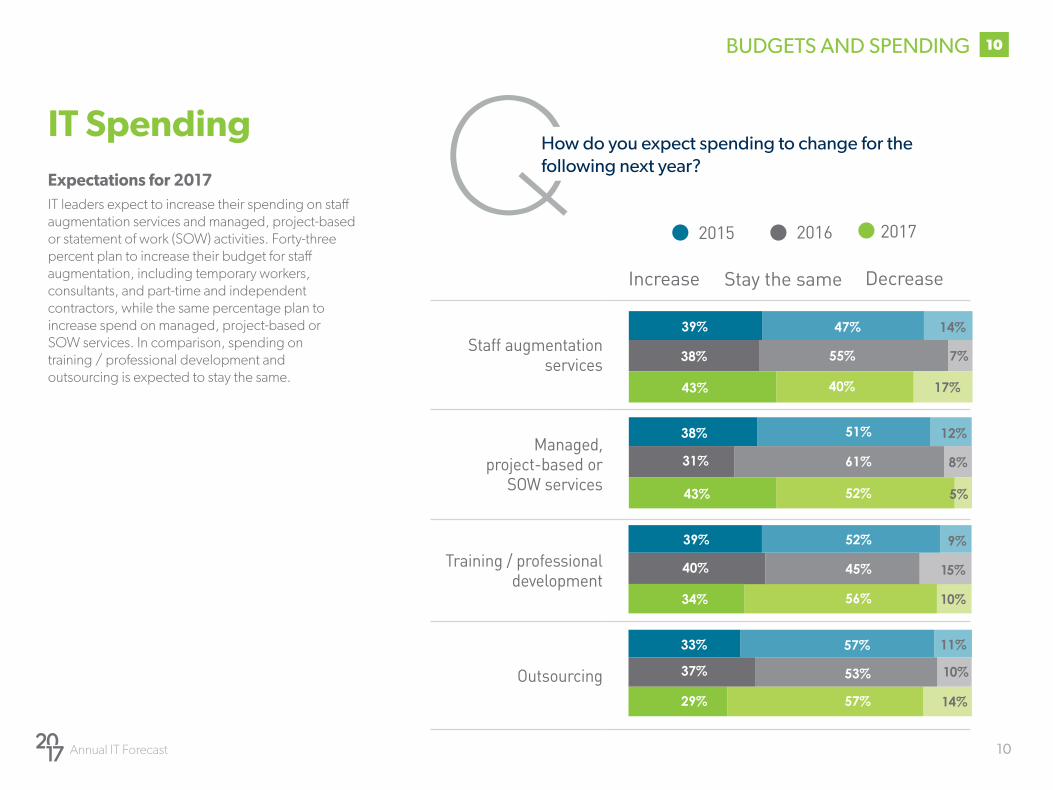
IT SpendingExpectations for 2017IT leaders expect to increase their spending on staff augmentation services and managed, project-based or statement of work (SOW) activities. Forty-three percent plan to increase their budget for staff augmentation, including temporary workers, consultants, and part-time and independent contractors, while the same percentage plan to increase spend on managed, project-based or SOW services. In comparison, spending on training / professional development and outsourcing is expected to stay the same.
40% 52%
5%
39% 47%
7%
8%
QHow do you expect spending to change for the following next year?
10
Increase Stay the same Decrease
2015 2016 2017
14%
38% 55%
43% 40%
38% 51% 12%
31% 61%
43% 52%
39% 52%
40% 45%
34% 56%
33% 57% 11%
37% 53% 10%
29% 57% 14%
BUDGETS AND SPENDING
17%
9%
15%
10%

Annual IT Forecast 11
11
IT Spending (continued)Year-over-Year TrendCompared to 2015 and 2016 projections, the 2017 results indicate more IT leaders plan to increase spending on staff augmentation and managed services. This uptick is notable because it parallels steady or declining spend on training and outsourcing and validates the growth of the managed services market, which is forecasted to grow 10.8 percent by 20211. Companies are demanding more from their vendors and want delivery options that meet their unique needs. They see the potential value of an alternative delivery model, which compared to other service options, helps them maintain ownership, supervision and visibility into projects, while the burden of sourcing and managing the team falls to an external provider.
This can be further explained by the perceived ineffectiveness of internal training and development programs, the oversight and control organizations lose in a fully outsourced model, as well as internal IT recruiting challenges. (See TEKsystems’ 2016 research on the importance of training and development for a wider discussion on the presence of these programs in IT organizations as well as our research on workforce planning.)
1 "Managed Services Market Worth 242.45 Billion USD By 2021” Markets and Markets, 2016
BUDGETS AND SPENDING

SKILLS OVERVIEW
Summary observationsProgramming and development continue to be the most in-demand and difficult-to-find skill sets.
Network and security skills remain some of the toughest skill sets to source
Mobile skills seem less in demand than in previous years
12
SKILLS OVERVIEW
Summary observations• Programming and development continue to
be the most critical and difficult-to-find skill sets
• Network and security skills remain some of the toughest skill sets to source, but survey results indicate that other skills such as software engineers and project managers are increasingly challenging to fill as well
• Mobile skills seem less in demand than in previous years, suggesting that organizations have had time to mature their mobile initiatives and are approaching a steady state in this regard
2
Q
Annual IT Forecast 13
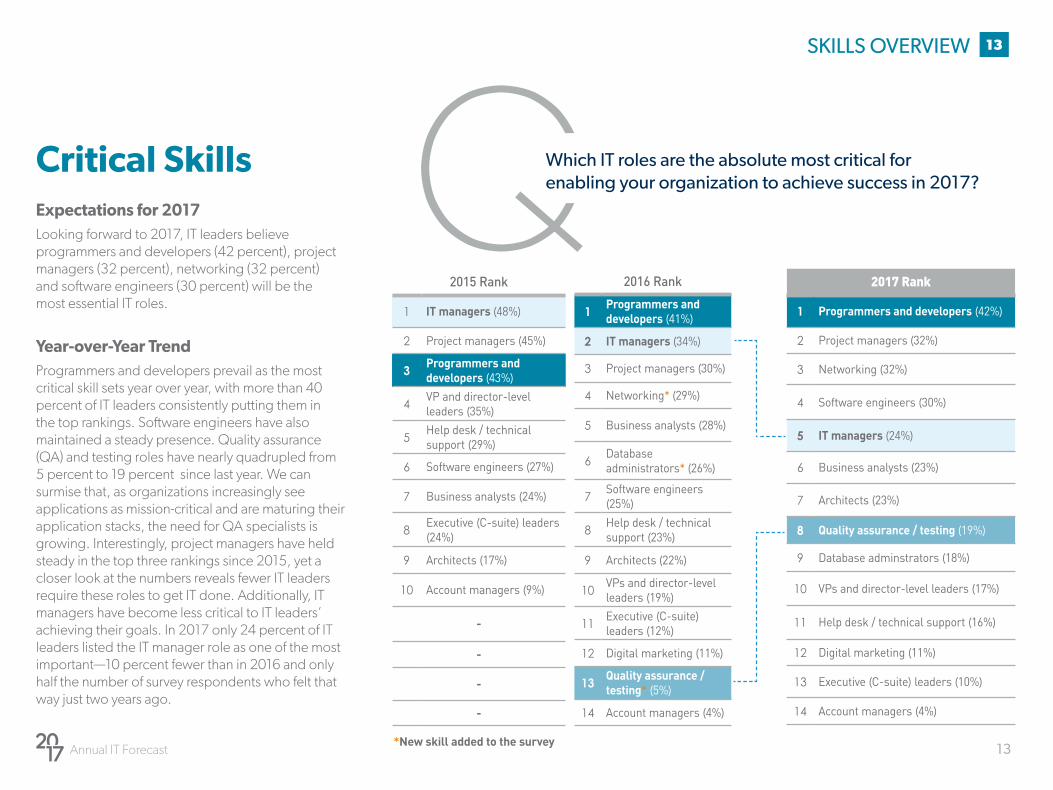
Critical SkillsExpectations for 2017Looking forward to 2017, IT leaders believe programmers and developers (42 percent), project managers (32 percent), networking (32 percent) and software engineers (30 percent) will be the most essential IT roles.
Year-over-Year TrendProgrammers and developers prevail as the most critical skill sets year over year, with more than 40 percent of IT leaders consistently putting them in the top rankings. Software engineers have also maintained a steady presence. Quality assurance (QA) and testing roles have nearly quadrupled from 5 percent to 19 percent since last year. We can surmise that, as organizations increasingly see applications as mission-critical and are maturing their application stacks, the need for QA specialists is growing. Interestingly, project managers have held steady in the top three rankings since 2015, yet a closer look at the numbers reveals fewer IT leaders require these roles to get IT done. Additionally, IT managers have become less critical to IT leaders’ achieving their goals. In 2017 only 24 percent of IT leaders listed the IT manager role as one of the most important—10 percent fewer than in 2016 and only half the number of survey respondents who felt that way just two years ago.
13SKILLS OVERVIEW
Which IT roles are the absolute most critical for enabling your organization to achieve success in 2017?
2015 Rank
1 IT managers (48%)
2 Project managers (45%)
3Programmers and developers (43%)
4VP and director-level leaders (35%)
5Help desk / technical support (29%)
6 Software engineers (27%)
7 Business analysts (24%)
8Executive (C-suite) leaders (24%)
9 Architects (17%)
10 Account managers (9%)
-
-
-
-
2016 Rank
1Programmers and developers (41%)
2 IT managers (34%)
3 Project managers (30%)
4 Networking* (29%)
5 Business analysts (28%)
6Database administrators* (26%)
7Software engineers (25%)
8Help desk / technical support (23%)
9 Architects (22%)
10VPs and director-level leaders (19%)
11Executive (C-suite) leaders (12%)
12 Digital marketing (11%)
13Quality assurance / testing* (5%)
14 Account managers (4%)
2017 Rank
1 Programmers and developers (42%)
2 Project managers (32%)
3 Networking (32%)
4 Software engineers (30%)
5 IT managers (24%)
6 Business analysts (23%)
7 Architects (23%)
8 Quality assurance / testing (19%)
9 Database adminstrators (18%)
10 VPs and director-level leaders (17%)
11 Help desk / technical support (16%)
12 Digital marketing (11%)
13 Executive (C-suite) leaders (10%)
14 Account managers (4%)
*New skill added to the survey
Annual IT Forecast 14
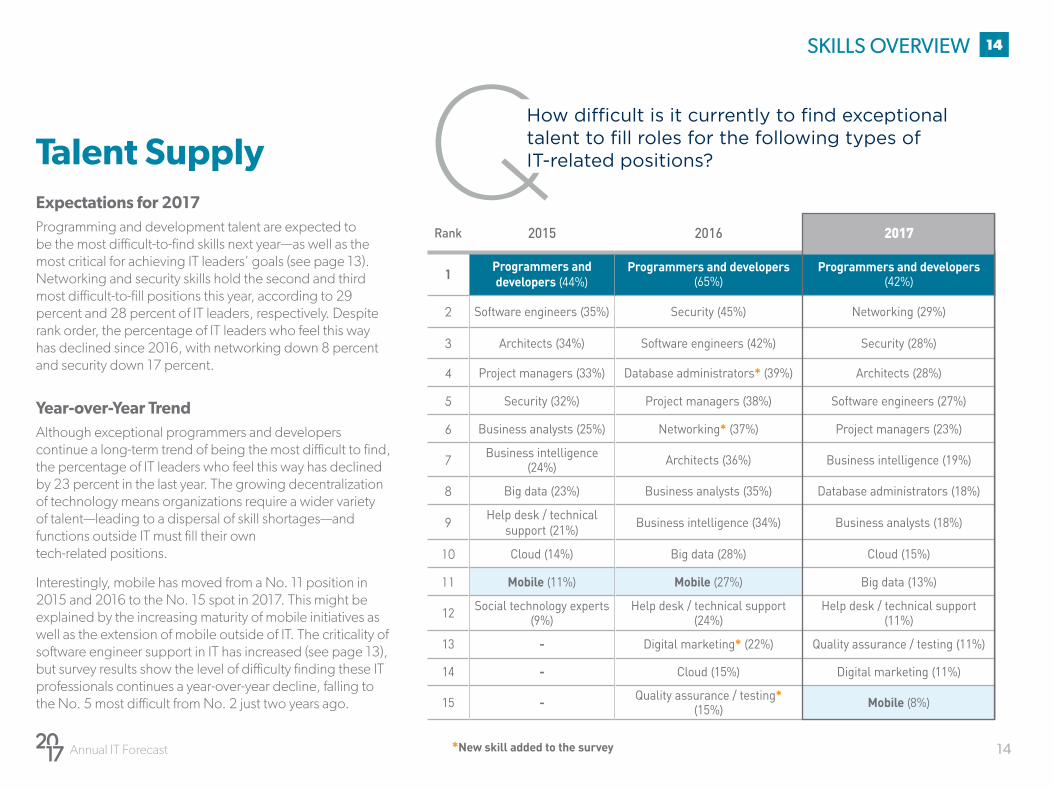
QTalent SupplyExpectations for 2017Programming and development talent are expected to be the most difficult-to-find skills next year—as well as the most critical for achieving IT leaders’ goals (see page 13). Networking and security skills hold the second and third most difficult-to-fill positions this year, according to 29 percent and 28 percent of IT leaders, respectively. Despite rank order, the percentage of IT leaders who feel this way has declined since 2016, with networking down 8 percent and security down 17 percent.
Year-over-Year TrendAlthough exceptional programmers and developers continue a long-term trend of being the most difficult to find, the percentage of IT leaders who feel this way has declined by 23 percent in the last year. The growing decentralization of technology means organizations require a wider variety of talent—leading to a dispersal of skill shortages—and functions outside IT must fill their own tech-related positions.
Interestingly, mobile has moved from a No. 11 position in 2015 and 2016 to the No. 15 spot in 2017. This might be explained by the increasing maturity of mobile initiatives as well as the extension of mobile outside of IT. The criticality of software engineer support in IT has increased (see page 13), but survey results show the level of difficulty finding these IT professionals continues a year-over-year decline, falling to the No. 5 most difficult from No. 2 just two years ago.
How difficult is it currently to find exceptional talent to fill roles for the following types of IT-related positions?
Rank 2015 2016 2017
1Programmers and developers (44%)
Programmers and developers (65%)
Programmers and developers(42%)
2 Software engineers (35%) Security (45%) Networking (29%)
3 Architects (34%) Software engineers (42%) Security (28%)
4 Project managers (33%) Database administrators* (39%) Architects (28%)
5 Security (32%) Project managers (38%) Software engineers (27%)
6 Business analysts (25%) Networking* (37%) Project managers (23%)
7 Business intelligence (24%) Architects (36%) Business intelligence (19%)
8 Big data (23%) Business analysts (35%) Database administrators (18%)
9Help desk / technical
support (21%) Business intelligence (34%) Business analysts (18%)
10 Cloud (14%) Big data (28%) Cloud (15%)
11 Mobile (11%) Mobile (27%) Big data (13%)
12 Social technology experts (9%)
Help desk / technical support (24%)
Help desk / technical support (11%)
13 - Digital marketing* (22%) Quality assurance / testing (11%)
14 - Cloud (15%) Digital marketing (11%)
15 - Quality assurance / testing* (15%) Mobile (8%)
*New skill added to the survey
14SKILLS OVERVIEW
15
AREAS OF IMPACT
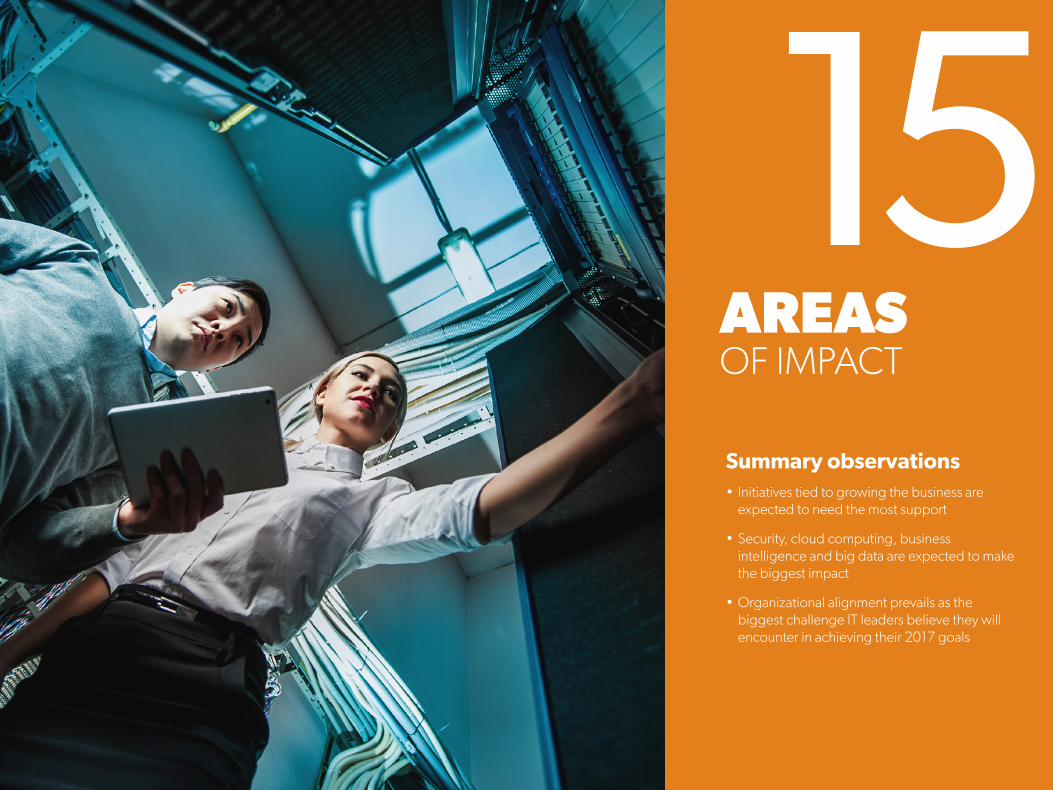
Summary observations• Initiatives tied to growing the business are
expected to need the most support
• Security, cloud computing, business intelligence and big data are expected to make the biggest impact
• Organizational alignment prevails as the biggest challenge IT leaders believe they will encounter in achieving their 2017 goals
5
Annual IT Forecast 16
16AREAS OF IMPACT
QWhich of the following business objectives will IT most need to support in 2017?
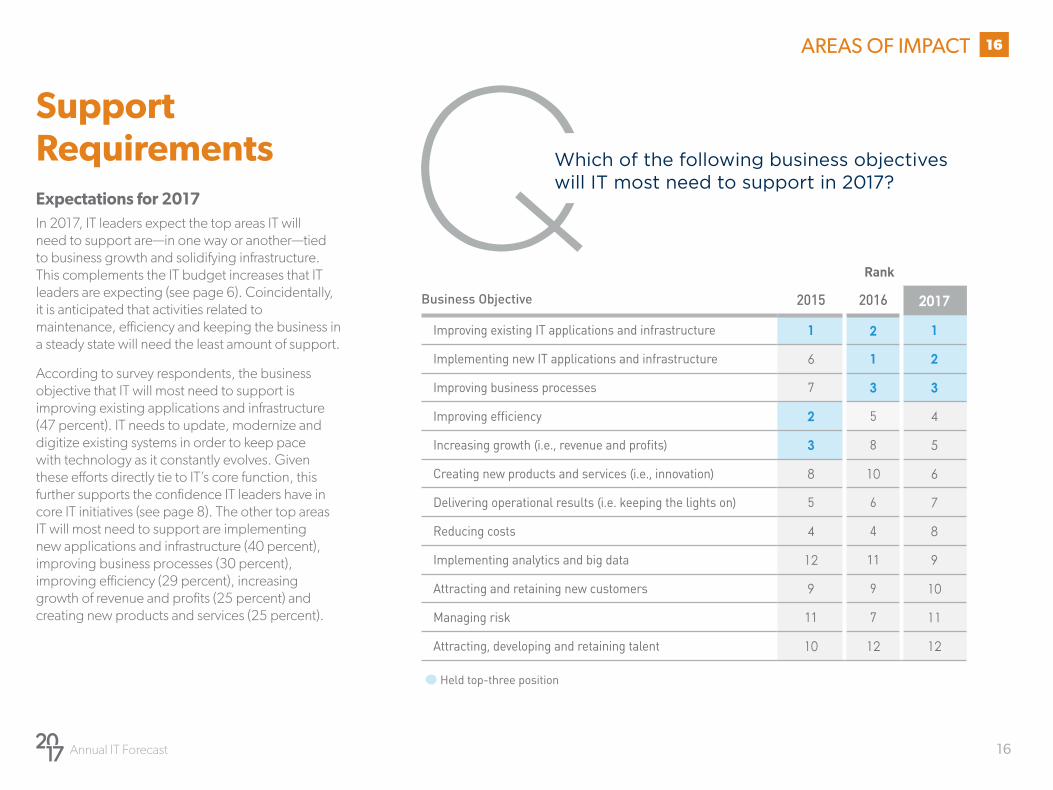
Support RequirementsExpectations for 2017In 2017, IT leaders expect the top areas IT will need to support are—in one way or another—tied to business growth and solidifying infrastructure. This complements the IT budget increases that IT leaders are expecting (see page 6). Coincidentally, it is anticipated that activities related to maintenance, efficiency and keeping the business in a steady state will need the least amount of support.
According to survey respondents, the business objective that IT will most need to support is improving existing applications and infrastructure (47 percent). IT needs to update, modernize and digitize existing systems in order to keep pace with technology as it constantly evolves. Given these efforts directly tie to IT’s core function, this further supports the confidence IT leaders have in core IT initiatives (see page 8). The other top areas IT will most need to support are implementing new applications and infrastructure (40 percent), improving business processes (30 percent), improving efficiency (29 percent), increasing growth of revenue and profits (25 percent) and creating new products and services (25 percent).
Business Objective 2015 2016 2017
Improving existing IT applications and infrastructure 1 2 1
Implementing new IT applications and infrastructure 6 1 2
Improving business processes 7 3 3
Improving�efficiency 2 5 4
Increasing�growth�(i.e.,�revenue�and�profits) 3 8 5
Creating new products and services (i.e., innovation) 8 10 6
Delivering operational results (i.e. keeping the lights on) 5 6 7
Reducing costs 4 4 8
Implementing analytics and big data 12 11 9
Attracting and retaining new customers 9 9 10
Managing risk 11 7 11
Attracting, developing and retaining talent 10 12 12
Held top-three position
Rank
Annual IT Forecast 17
Support Requirements (continued)Year-over-Year TrendIT leaders believe that applications will require the most support from IT in 2017—more so than in the last two years. Specifically, 47 percent believe improving existing applications will need the most support from IT (up 21 percent since 2015). Implementing new applications is the next area requiring the most support from IT, according to 40 percent of IT leaders (up 17 percent since 2015). These results are not surprising. Introducing new applications, and maintaining and improving existing applications and infrastructure are ongoing efforts organizations need to keep up with, as these activities enable organizations to remain competitive.
Delivering operational results has been on the decline since 2015, both in rank and in percentage of IT leaders. With only 22 percent of IT leaders saying this area will need the most support from IT, and considering other findings from this survey (see page 8), this data can potentially be explained by the fact that IT is increasingly becoming more decentralized. Delivering operational results is less of a priority because IT initiatives are spilling into every area of the business, and IT has less to support outside core IT.
17AREAS OF IMPACT
Annual IT Forecast 18
QWhich of the following trends or technologies will have the biggest impact on your organization in 2017?
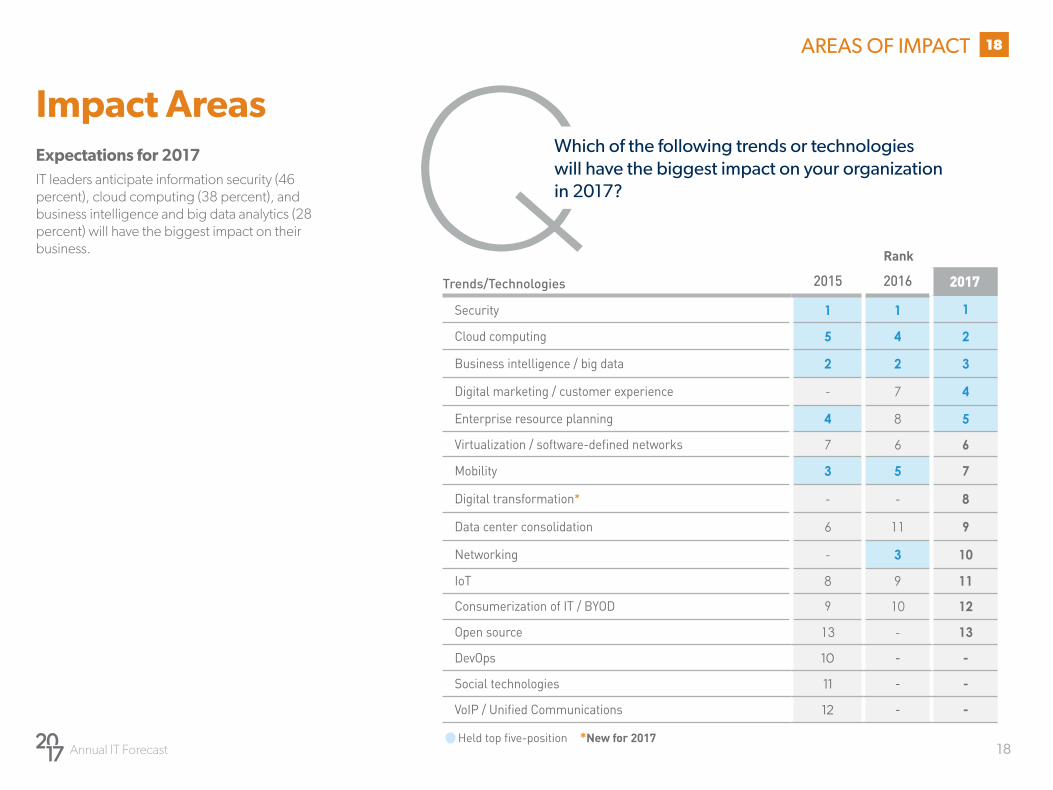
Impact AreasExpectations for 2017IT leaders anticipate information security (46 percent), cloud computing (38 percent), and business intelligence and big data analytics (28 percent) will have the biggest impact on their business.
Trends/Technologies 2015 2016 2017
Security 1 1 1
Cloud computing 5 4 2
Business intelligence / big data 2 2 3
Digital marketing / customer experience - 7 4
Enterprise resource planning 4 8 5
Virtualization�/�software-defined�networks 7 6 6
Mobility 3 5 7
Digital transformation* - - 8
Data center consolidation 6 11 9
Networking - 3 10
IoT 8 9 11
Consumerization of IT / BYOD 9 10 12
Open source 13 - 13
DevOps 10 - -
Social technologies 11 - -
VoIP�/�Unified�Communications 12 - -
Held�top�five-position
18AREAS OF IMPACT
Rank
*New for 2017
Annual IT Forecast 19
Impact Areas (continued)Year-over-Year TrendThe core four—security, cloud, BI, mobility—have now become the big three (i.e., security, cloud, BI). Security has steadily been regarded as a critical area for the business. Cloud dipped slightly in 2016 to 26 percent, from 29 percent the previous year, but is expected to make a big impact next year according to 38 percent of IT leaders (up 12 percent from last year). Despite IoT moving down a few notches in the ranks, the percentage of IT leaders who believe IoT will have the biggest impact on their organization has had little fluctuation. (Review TEKsystems’ research, The State of the Internet of Things, for additional commentary around the impact of IoT.)
While IoT is not going away, IT leaders are likely focusing on other trends and technologies that will have a more immediate impact on their organizations. Unlike IoT, mobility has seen a decline both in rank and percentage. Ranked No. 7 in the 2017 IT Forecast, just 19 percent of IT leaders believe mobility will have the biggest impact on their organization—down 17 percent since the 2015 IT Forecast. Supporting our discussion on the level of difficulty finding skill sets (see page 14), mobility has become a basic expectation in the business and seems to have hit a level of maturity in many organizations. While still very present and a key trend, mobility is moving down the ranks and making way for newer technologies and trends that IT leaders are less familiar with and may be implementing for the first time. Digital marketing and the customer experience was first included in the 2016 IT Forecast survey, and has interestingly increased just 4 percent year over year. It is possible that IT leaders are unsure how it will impact the IT function. They realize it is an important development, but responsibility for much of the marketing technology stack has shifted outside of core IT.
19AREAS OF IMPACT
Annual IT Forecast 20
QCompared to last year, do you expect spending to increase for the following trends and technology areas in 2017?
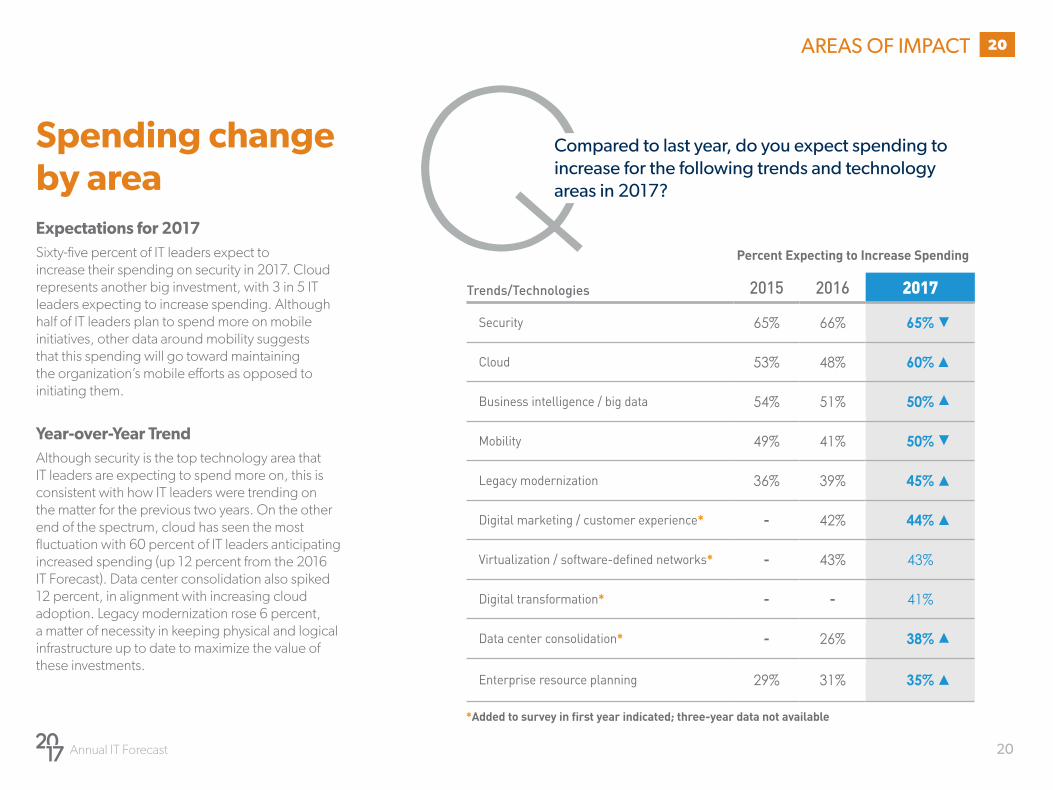
Spending change by areaExpectations for 2017Sixty-five percent of IT leaders expect to increase their spending on security in 2017. Cloud represents another big investment, with 3 in 5 IT leaders expecting to increase spending. Although half of IT leaders plan to spend more on mobile initiatives, other data around mobility suggests that this spending will go toward maintaining the organization’s mobile efforts as opposed to initiating them.
Year-over-Year TrendAlthough security is the top technology area that IT leaders are expecting to spend more on, this is consistent with how IT leaders were trending on the matter for the previous two years. On the other end of the spectrum, cloud has seen the most fluctuation with 60 percent of IT leaders anticipating increased spending (up 12 percent from the 2016 IT Forecast). Data center consolidation also spiked 12 percent, in alignment with increasing cloud adoption. Legacy modernization rose 6 percent, a matter of necessity in keeping physical and logical infrastructure up to date to maximize the value of these investments.
Trends/Technologies 2015 2016 2017
Security 65% 66% 65%
Cloud 53% 48% 60%
Business intelligence / big data 54% 51% 50%
Mobility 49% 41% 50%
Legacy modernization 36% 39% 45%
Digital marketing / customer experience* - 42% 44%
Virtualization�/�software-defined�networks* - 43% 43%
Digital transformation* - - 41%
Data center consolidation* - 26% 38%
Enterprise resource planning 29% 31% 35%
*Added to survey in first year indicated; three-year data not available
20AREAS OF IMPACT
Percent Expecting to Increase Spending
B
Annual IT Forecast 21
ChallengesExpectations for 2017Organizational alignment, or how well IT and other departments understand and coordinate with each other, will continue to be the biggest challenge organizations face. Based on survey findings, this is not surprising and could be directly related to the decentralization of technology spending and the diffused ownership of IT projects. With technology investments being made beyond the IT department itself (see page 9), IT is more able to focus on its primary role and core initiatives. But there is a drawback. The IT team, and IT leaders specifically, lose visibility into what others in the organization are doing, making it difficult to connect and understand each department’s goals.
Partnerships are the least of IT leaders’ concerns, with only 5 percent ranking managing external partnerships as their biggest challenge. Relationships with vendors / third-party providers are becoming more second nature, which complements the IT Forecast data indicating staff augmentation and managed services spending is going up (see page 10 and 11).
AREAS OF IMPACT 21
QB
Annual IT Forecast 22
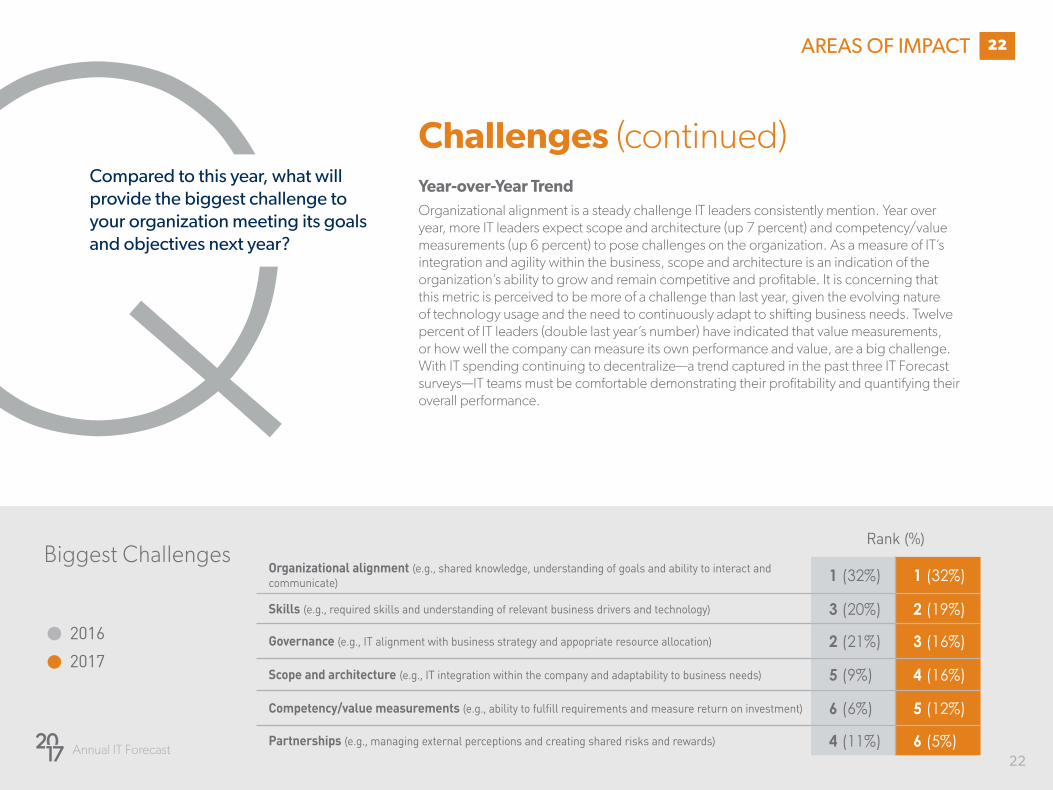
Challenges (continued)Year-over-Year TrendOrganizational alignment is a steady challenge IT leaders consistently mention. Year over year, more IT leaders expect scope and architecture (up 7 percent) and competency/value measurements (up 6 percent) to pose challenges on the organization. As a measure of IT’s integration and agility within the business, scope and architecture is an indication of the organization’s ability to grow and remain competitive and profitable. It is concerning that this metric is perceived to be more of a challenge than last year, given the evolving nature of technology usage and the need to continuously adapt to shifting business needs. Twelve percent of IT leaders (double last year’s number) have indicated that value measurements, or how well the company can measure its own performance and value, are a big challenge. With IT spending continuing to decentralize—a trend captured in the past three IT Forecast surveys—IT teams must be comfortable demonstrating their profitability and quantifying their overall performance.
AREAS OF IMPACT 22
Compared to this year, what will provide the biggest challenge to your organization meeting its goals and objectives next year?
Biggest Challenges
2017
2016
Rank (%)
Organizational alignment (e.g., shared knowledge, understanding of goals and ability to interact and communicate) 1 (32%) 1 (32%)
Skills (e.g., required skills and understanding of relevant business drivers and technology) 3 (20%) 2 (19%)
Governance (e.g., IT alignment with business strategy and appopriate resource allocation) 2 (21%) 3 (16%)
Scope and architecture (e.g., IT integration within the company and adaptability to business needs) 5 (9%) 4 (16%)
Competency/value measurements (e.g.,�ability�to�fulfill�requirements�and�measure�return�on�investment) 6 (6%) 5 (12%)
Partnerships (e.g., managing external perceptions and creating shared risks and rewards) 4 (11%) 6 (5%)

SKILLS OVERVIEW
Summary observationsProgramming and development continue to be the most in-demand and difficult-to-find skill sets.
Network and security skills remain some of the toughest skill sets to source
Mobile skills seem less in demand than in previous years
23
3WORKFORCE EXPECTATIONS
Summary observations• Anticipated salary increases are down in nearly
every job category
• For the third consecutive year, IT leaders plan to increase salaries for programmers and developers
• The majority of IT leaders expect their team to grow or stay the same, in both full-time and contingent capacities
QB
Annual IT Forecast 24
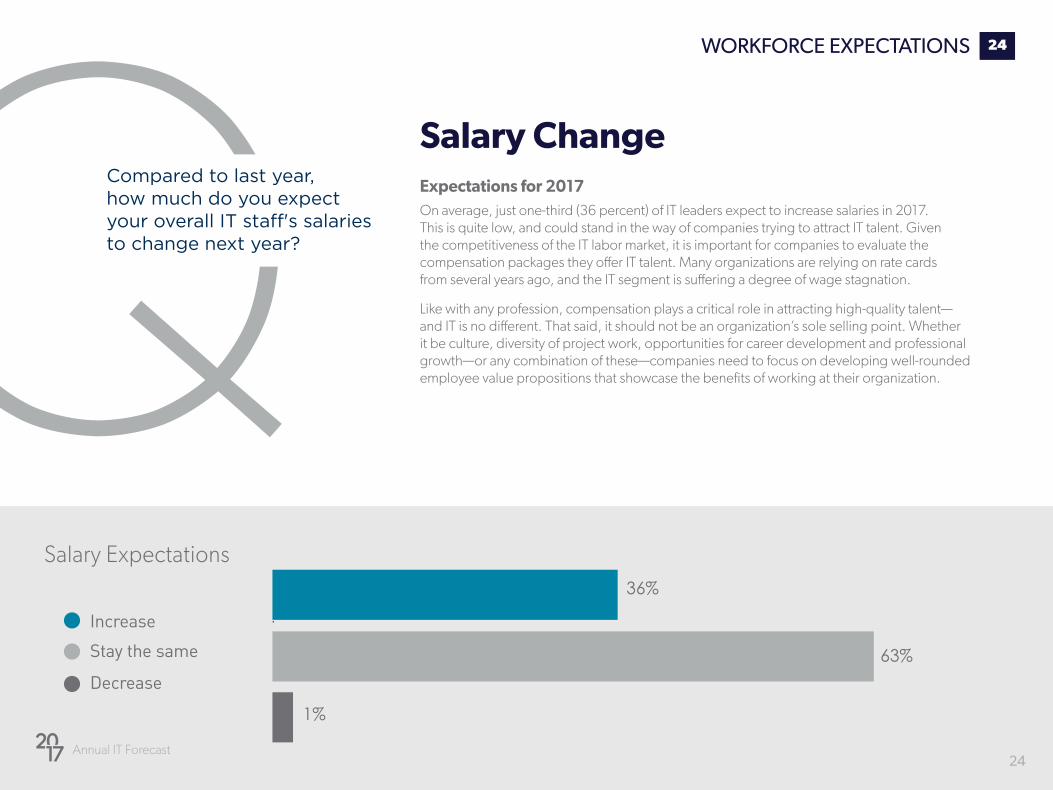
Salary ChangeExpectations for 2017On average, just one-third (36 percent) of IT leaders expect to increase salaries in 2017. This is quite low, and could stand in the way of companies trying to attract IT talent. Given the competitiveness of the IT labor market, it is important for companies to evaluate the compensation packages they offer IT talent. Many organizations are relying on rate cards from several years ago, and the IT segment is suffering a degree of wage stagnation.
Like with any profession, compensation plays a critical role in attracting high-quality talent—and IT is no different. That said, it should not be an organization’s sole selling point. Whether it be culture, diversity of project work, opportunities for career development and professional growth—or any combination of these—companies need to focus on developing well-rounded employee value propositions that showcase the benefits of working at their organization.
Compared to last year, how much do you expect your overall IT staff's salaries to change next year?
24WORKFORCE EXPECTATIONS
Salary Expectations
Increase
Stay the same
Decrease
36%
63%
1%
Annual IT Forecast 25
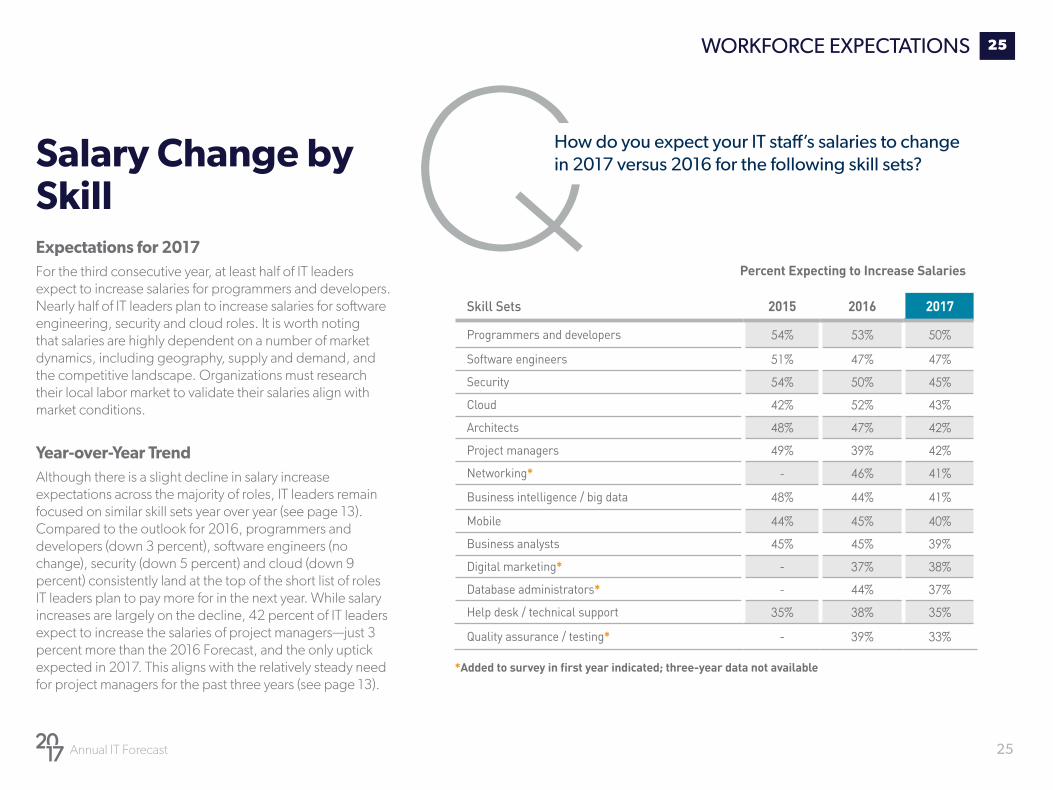
QHow do you expect your IT staff’s salaries to change in 2017 versus 2016 for the following skill sets? Salary Change by
SkillExpectations for 2017For the third consecutive year, at least half of IT leaders expect to increase salaries for programmers and developers. Nearly half of IT leaders plan to increase salaries for software engineering, security and cloud roles. It is worth noting that salaries are highly dependent on a number of market dynamics, including geography, supply and demand, and the competitive landscape. Organizations must research their local labor market to validate their salaries align with market conditions.
Year-over-Year TrendAlthough there is a slight decline in salary increase expectations across the majority of roles, IT leaders remain focused on similar skill sets year over year (see page 13). Compared to the outlook for 2016, programmers and developers (down 3 percent), software engineers (no change), security (down 5 percent) and cloud (down 9 percent) consistently land at the top of the short list of roles IT leaders plan to pay more for in the next year. While salary increases are largely on the decline, 42 percent of IT leaders expect to increase the salaries of project managers—just 3 percent more than the 2016 Forecast, and the only uptick expected in 2017. This aligns with the relatively steady need for project managers for the past three years (see page 13).
25WORKFORCE EXPECTATIONS
Skill Sets 2015 2016 2017
Programmers and developers 54% 53% 50%
Software engineers 51% 47% 47%
Security 54% 50% 45%
Cloud 42% 52% 43%
Architects 48% 47% 42%
Project managers 49% 39% 42%
Networking* - 46% 41%
Business intelligence / big data 48% 44% 41%
Mobile 44% 45% 40%
Business analysts 45% 45% 39%
Digital marketing* - 37% 38%
Database administrators* - 44% 37%
Help desk / technical support 35% 38% 35%
Quality assurance / testing* - 39% 33%
*Added to survey in first year indicated; three-year data not available
Percent Expecting to Increase Salaries
Annual IT Forecast 26
26
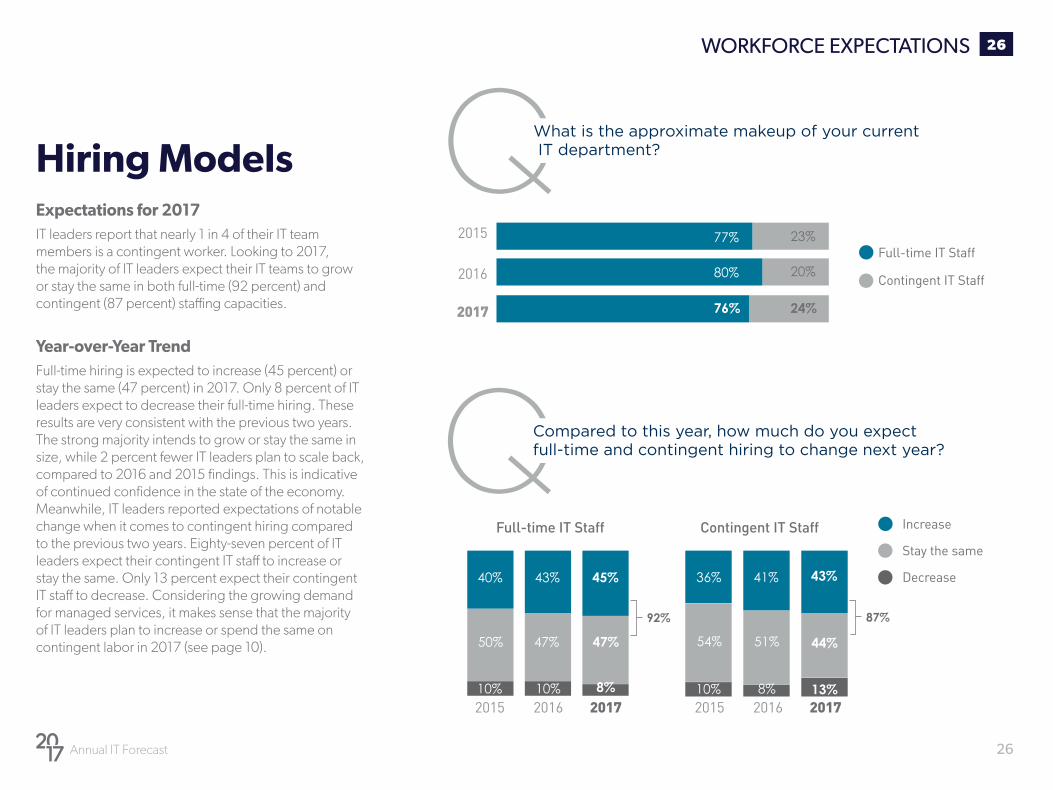
Hiring ModelsExpectations for 2017IT leaders report that nearly 1 in 4 of their IT team members is a contingent worker. Looking to 2017, the majority of IT leaders expect their IT teams to grow or stay the same in both full-time (92 percent) and contingent (87 percent) staffing capacities.
Year-over-Year TrendFull-time hiring is expected to increase (45 percent) or stay the same (47 percent) in 2017. Only 8 percent of IT leaders expect to decrease their full-time hiring. These results are very consistent with the previous two years. The strong majority intends to grow or stay the same in size, while 2 percent fewer IT leaders plan to scale back, compared to 2016 and 2015 findings. This is indicative of continued confidence in the state of the economy. Meanwhile, IT leaders reported expectations of notable change when it comes to contingent hiring compared to the previous two years. Eighty-seven percent of IT leaders expect their contingent IT staff to increase or stay the same. Only 13 percent expect their contingent IT staff to decrease. Considering the growing demand for managed services, it makes sense that the majority of IT leaders plan to increase or spend the same on contingent labor in 2017 (see page 10).
QWhat is the approximate makeup of your current IT department?
QCompared to this year, how much do you expect full-time and contingent hiring to change next year?
Increase
Stay the same
Decrease
Full-time IT Staff Contingent IT Staff
WORKFORCE EXPECTATIONS
Full-time IT Staff
Contingent IT Staff2016
2017 76% 24%
2017 20172016 20162015 2015
40% 43% 45%
50% 47% 47%
8%10% 10%
36% 41% 43%
54% 51% 44%
13%10% 8%
80% 20%
2015 77% 23%
87%92%
5SKILLS OVERVIEW
Summary observationsProgramming and development continue to be the most in-demand and difficult-to-find skill sets.
Network and security skills remain some of the toughest skill sets to source
Mobile skills seem less in demand than in previous years
27
About TEKsystemsPeople are at the heart of every successful business initiative. At TEKsystems,
we understand people. Every year we deploy over 80,000 IT professionals at 6,000
client sites across North America, Europe and Asia. Our deep insights into IT talent
management enable us to help our clients achieve their business goals—while
optimizing their IT workforce strategies. We provide IT staffing solutions, IT talent
management expertise and IT services to help our clients plan, build and run their
critical business initiatives. Through our range of quality-focused delivery models,
we meet our clients where they are, and take them where they want to go, the way
they want to get there.
Visit us online at TEKsystems.com.
TEKsystems® 7437 Race Road, Hanover, MD 21076 | 888.835.7978 | www.TEKsystems.com | TEKsystems, Inc. is an Allegis Group, Inc. company. Certain names, products and services listed in the document are trademarks, register trademarks, or service marks of their respective companies. Copyright © 2016. TEKsystems, Inc. All Rights Reserved.


