39
2017 INTERIM RESULTS 25 JULY 2017

2017 INTERIM RESULTS25 JULY 2017

1
Certain statements made in this presentation constitute forward-looking statements. Forward-looking statements
are typically identified by the use of forward-looking terminology such as ‘believes’, ‘expects’, ‘may’, ‘will’, ‘could’,
‘should’, ‘intends’, ‘estimates’, ‘plans’, ‘assumes’ or ‘anticipates’ or the negative thereof or other variations thereon
or comparable terminology, or by discussions of, e.g. future plans, present or future events, or strategy that involve
risks and uncertainties. Such forward-looking statements are subject to a number of risks and uncertainties, many
of which are beyond the company's control and all of which are based on the company's current beliefs and
expectations about future events. Such statements are based on current expectations and, by their nature, are
subject to a number of risks and uncertainties that could cause actual results and performance to differ materially
from any expected future results or performance, expressed or implied, by the forward-looking statement. No
assurance can be given that such future results will be achieved; actual events or results may differ materially as a
result of risks and uncertainties facing the company and its subsidiaries. The forward-looking statements contained
in this presentation speak only as of the date of this presentation and the company undertakes no duty to, and will
not necessarily, update any of them in light of new information or future events, except to the extent required by
applicable law or regulation.
DISCLAIMER

2
DELIVERING ON PROMISES
Safety: fatality free, material improvement on all key indicators
Capital allocation: balance sheet strengthened, dividend reinstated
Outlook: guidance revised upwards, cost pressure remains
Financials: capturing benefit of price and performance
Operations: another step change in productivity

3
Lost time
injuries
24%
High potential
incidents
14%
CRITICAL INTERVENTIONS IMPROVE SAFETY INDICATORS
Fatality free
0TRCFR improvement from .83
.73 .23LTIFR improvement from .27
1H161H17
Total
recordable cases
21%
4
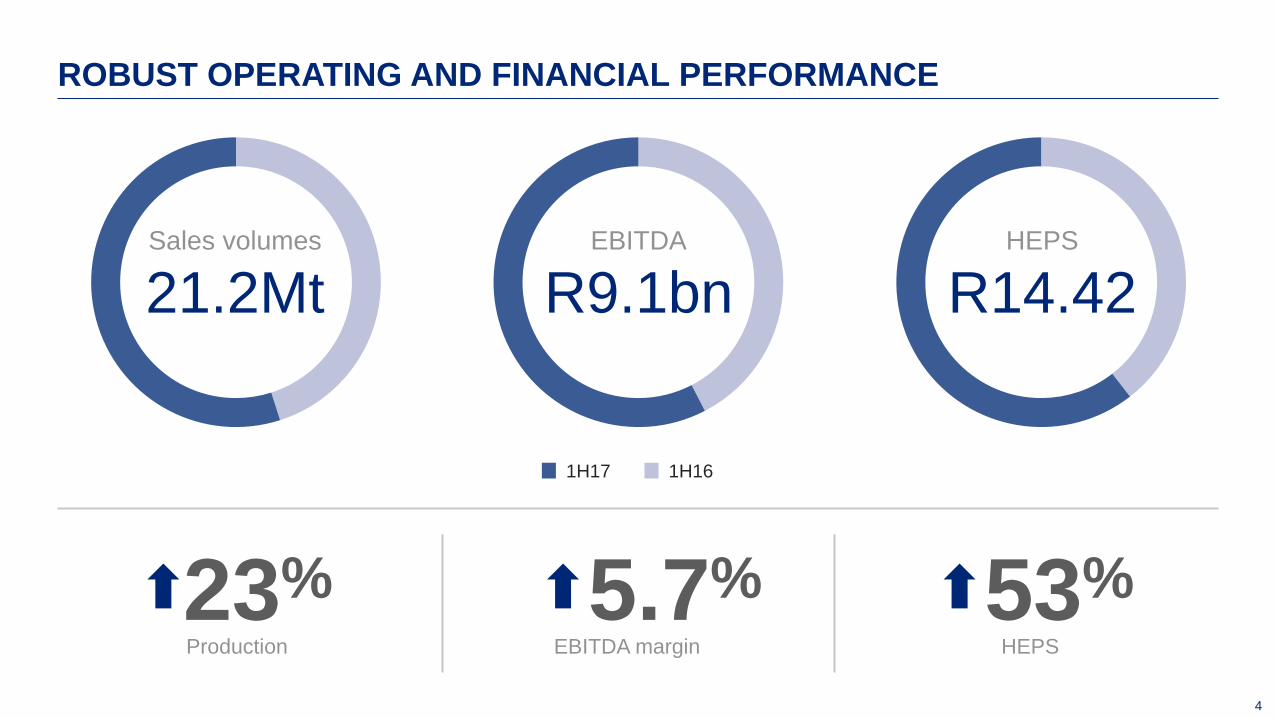
ROBUST OPERATING AND FINANCIAL PERFORMANCE
Sales volumes
21.2MtEBITDA
R9.1bn
Production
23%EBITDA margin
5.7% 53%HEPS
HEPS
R14.42
1H161H17
5
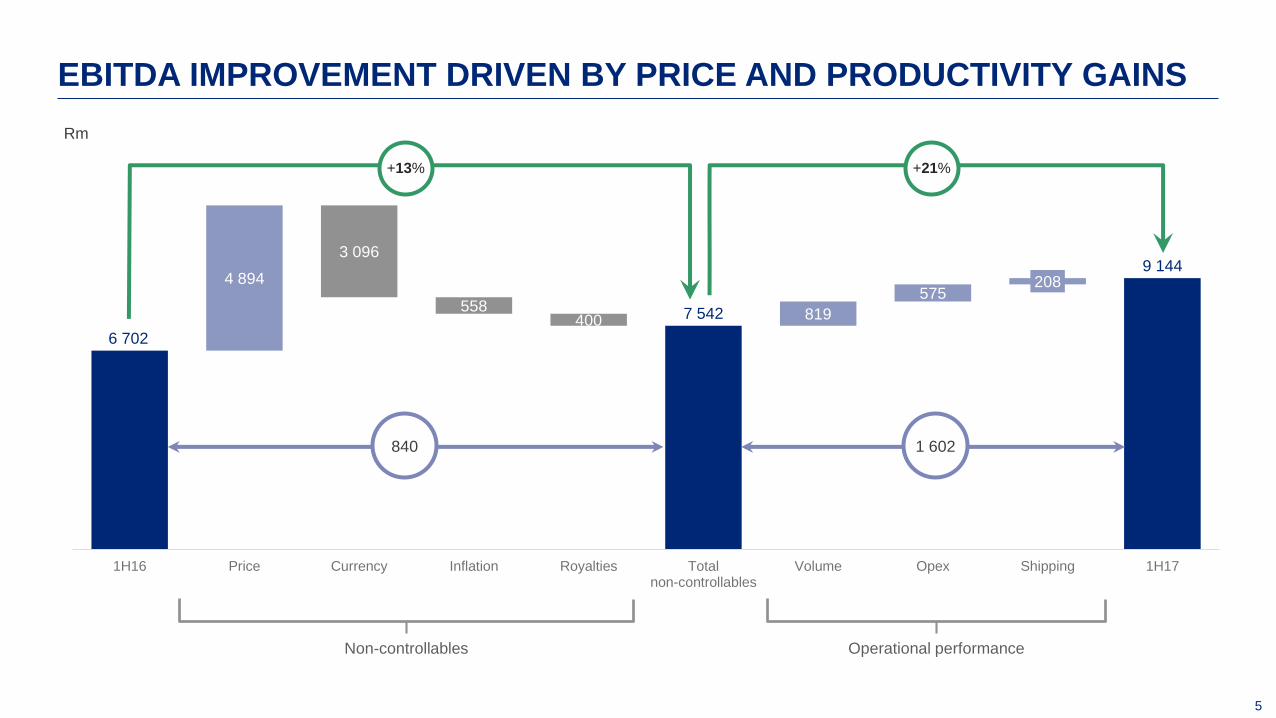
EBITDA IMPROVEMENT DRIVEN BY PRICE AND PRODUCTIVITY GAINS
6 702
7 542
9 1444 894
3 096
558400 819
575208
1H16 Price Currency Inflation Royalties Totalnon-controllables
Volume Opex Shipping 1H17
Non-controllables Operational performance
840 1 602
Rm
+13% +21%

MARKET OVERVIEW
7
8%
9%
10%
11%
12%
13%
14%
15%
16%
17%
0.00
0.05
0.10
0.15
0.20
0.25
0.30
0.35
2013 2014 2015 2016 2017
Lu
mp
% o
f to
tal p
ort
sto
cks i
n C
hin
a
US
$/d
mtu
cfr
Qin
gd
ao
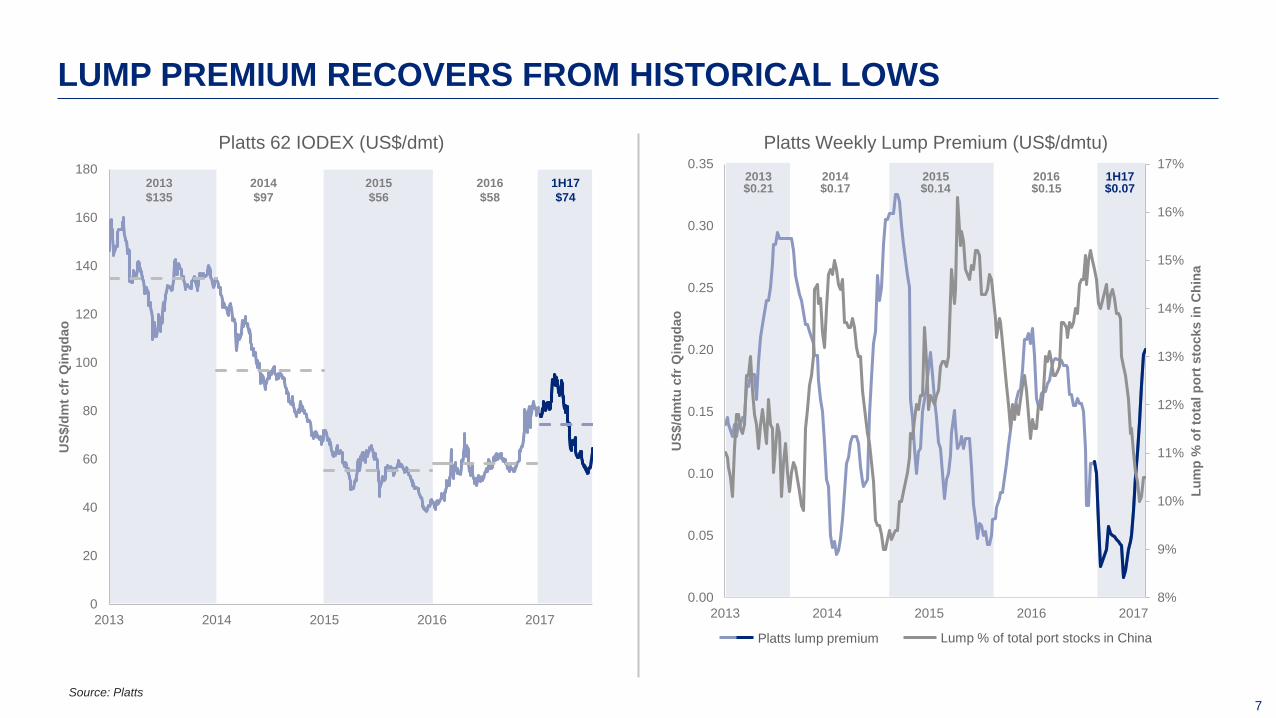
Platts Weekly Lump Premium (US$/dmtu)
0
20
40
60
80
100
120
140
160
180
2013 2014 2015 2016 2017
US
$/d
mt
cfr
Qin
gd
ao
Platts 62 IODEX (US$/dmt)
Source: Platts
LUMP PREMIUM RECOVERS FROM HISTORICAL LOWS
2013$0.21
2014$0.17
2015 $0.14
2016$0.15
1H17$0.072013
$135
2014
$97
2015
$56
2016
$58
1H17
$74
Platts lump premium Lump % of total port stocks in China

8
HIGHER ABSOLUTE AND RELATIVE PRICES – OUTLOOK CAUTIOUS
Peer 1 estimated using Q1 actuals & an assumed 103% realisation of the IODEX for Q2.Peer 4 estimated using Q1 actuals & published monthly product discounts for Q2.
55
22
3
52
71
RealisedFOB price
1H16
Increase inPlatts 62%
Index
Decrease inPlatts Lump
premium
Increase inSaldanha -
Qingdao freight
Other pricingimpacts
RealisedFOB price
1H17
Kumba’s 1H17 Realised Price Reconciliation(US$/dmt, FOB)
61 (Est)
68
67
47 (Est)
71
Peer 1
Peer 2
Peer 3
Peer 4
Kumba
1H17 Realised Price (US$/dmt, FOB), Peer Comparison
EU/
MENA/
Americas
14%
JKO
21%China
65%
Export sales geographical split
1H16
EU/
MENA/
Americas
20%
JKO
20%
China
60%
Export sales geographical split
1H17
1. In 1H17, 67% of Kumba’s sales consisted of lump ore.
1
OPERATIONAL OVERVIEW

10
Strip ratio 3.5 3.2 4.7
− Production up 35% to 15.6Mt from higher plant
throughput and yields
− Waste up 18% to 76.6Mt
− Performance underpinned by improved
productivity
− Strip ratio will exceed 4 in medium term 11.5
16.915.6
64.9
72.2
76.6
0
10
20
30
40
50
60
70
80
0
5
10
15
20
25
1H16(Restructuring)
2H16 1H17(Stable and improving)
Sishen Production and Waste (Mt)
Production Waste
SISHEN DEMONSTRATING STABILITY
+35%

11
FLEET PRODUCTIVITY IMPROVES BY 57%
Operating Model delivering benefits
More hours worked
− Motivated workforce
− New shift system
− Efficient shift change
− Good attendance
Improved shovel productivity
− Improved planning
− Wider benches
− Improved blasting
− Double-sided loading
593
549
375 383
453
494
456
602
3Q15 4Q15 1Q16 2Q16 3Q16 4Q16 1Q17 2Q17
Sishen Fleet Productivity (kt/day)
Heavy
Rain
New mine plan
Fleet reduced by 30%Restructuring New shift system
+57%

12
− Production up 7% to 6.3Mt
− Waste increased 26% to 25.4Mt
− Rain impacted 1Q but tonnes recovered in 2Q
− Improved performance due to plant and
equipment efficiencies5.9
6.8 6.3
20.2
30.0
25.4
0
5
10
15
20
25
30
0
5
10
15
1H16 2H16 1H17
Kolomela Production and Waste (Mt)
Production Waste
KOLOMELA ACHIEVES ANOTHER SOLID PERFORMANCE
Strip ratio 3.2 4.1 3.8
+7%

13
Production 28–29Mt in 2017
Waste 155–165Mt in 2017
Strip ratio to exceed 4 over the medium term, LoM ~4
Production 13–14Mt in 2017
Waste 50Mt–55Mt in 2017
Strip ratio at ~3.9 over the medium term, LoM ~3.8
OPERATIONAL GUIDANCE
Total sales 41–43Mt in 2017
Sishen Kolomela

14
Mt 1H17 1H16 % change 2H16 % change
Railed to port (incl. Saldanha Steel) 20.8 18.3 14 21.5 (3)
Sishen mine (incl. Saldanha Steel) 14.4 11.7 23 15.1 (5)
Kolomela mine 6.4 6.6 (3) 6.4 -
Total sales 21.2 20.2 5 22.3 (5)
Export 19.5 18.1 8 21.0 (7)
Domestic 1.7 2.1 (16) 1.3 38
Sishen mine 1.7 1.4 24 1.3 38
Thabazimbi mine - 0.7 (100) - -
Total ore shipped 19.5 18.1 8 20.6 (5)
CFR (shipped by Kumba) 12.7 12.7 0 14.6 (13)
FOB (shipped by customers) 6.8 5.4 26 6 13
Finished product inventory 4.4 2.3 91 3.5 26
LOGISTICS REFLECT HIGHER PRODUCTION
15
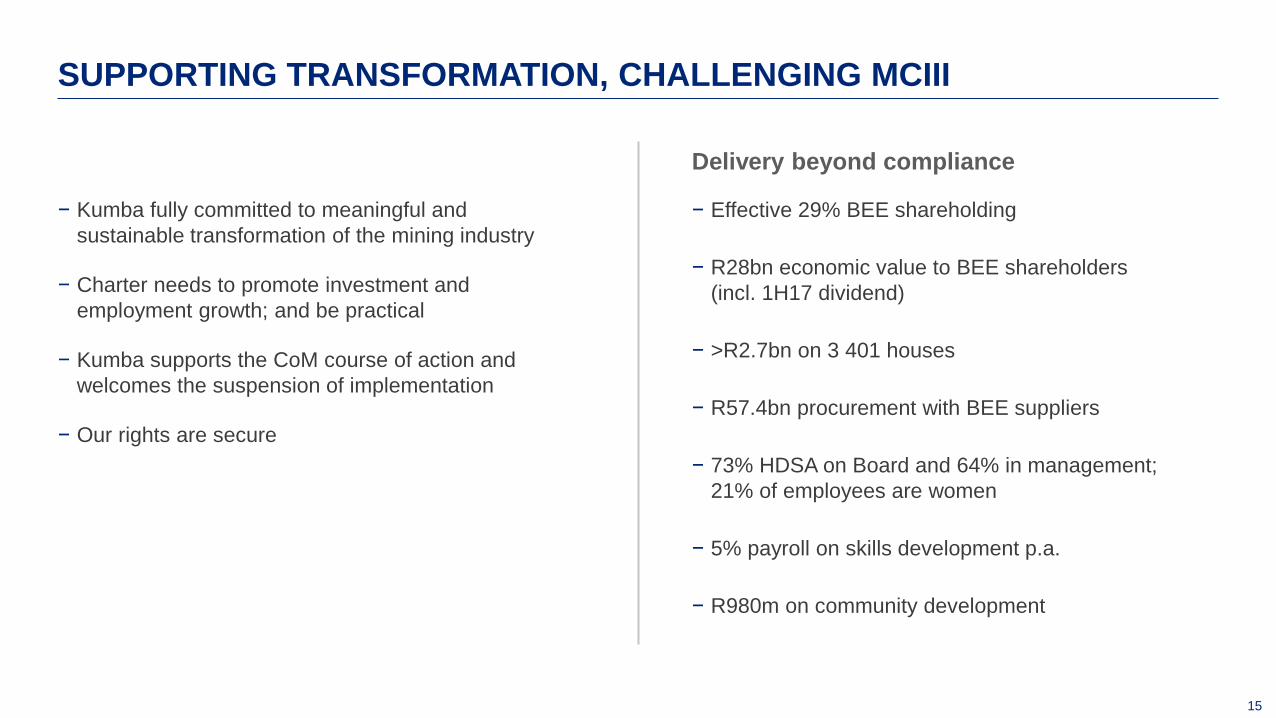
− Kumba fully committed to meaningful and
sustainable transformation of the mining industry
− Charter needs to promote investment and
employment growth; and be practical
− Kumba supports the CoM course of action and
welcomes the suspension of implementation
− Our rights are secure
SUPPORTING TRANSFORMATION, CHALLENGING MCIII
Delivery beyond compliance
− Effective 29% BEE shareholding
− R28bn economic value to BEE shareholders
(incl. 1H17 dividend)
− >R2.7bn on 3 401 houses
− R57.4bn procurement with BEE suppliers
− 73% HDSA on Board and 64% in management;
21% of employees are women
− 5% payroll on skills development p.a.
− R980m on community development
16
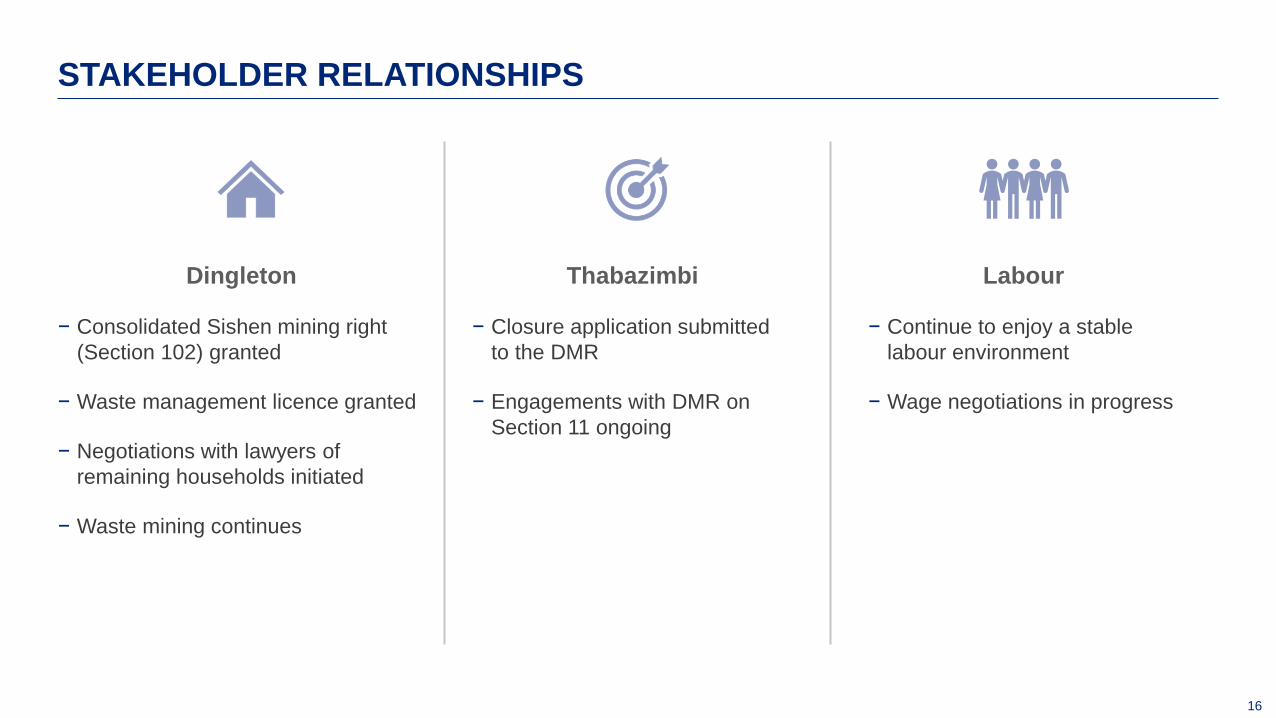
STAKEHOLDER RELATIONSHIPS
Dingleton
− Consolidated Sishen mining right
(Section 102) granted
− Waste management licence granted
− Negotiations with lawyers of
remaining households initiated
− Waste mining continues
Thabazimbi
− Closure application submitted
to the DMR
− Engagements with DMR on
Section 11 ongoing
Labour
− Continue to enjoy a stable
labour environment
− Wage negotiations in progress

FINANCIAL OVERVIEW

18
− Revenue increased 18% to R21.5bn
− EBITDA margin increased 6% to 43%
− Headline earnings of R4.6bn up 53%
− Capex of R1.1bn down 17%
− Net cash position of R13.5bn
− Dividend reinstated – R15.97 per share
FINANCIAL HIGHLIGHTS
9.4
17.9
14.4
1H16 2H16 1H17
HEPS (R/share)
5.2
10.1
7.6
1H16 2H16 1H17
Operating Profit (Rbn)

19
29
43
1 32
3 14
FY16 Controllable costs Lump premium Price impact Freight Royalties Currency 1H17
− Non-controllable costs up US$8/t
− Freight rates up US$3/t on FY16
− Higher royalties of US$1/t
− Stronger currency adding US$4/t
− Lump and market premium down US$5/t
BREAKEVEN - CONTROLLABLE COSTS CONTAINED
− Breakeven price up US$14/t from FY16 average
− Controllable costs up US$1/t
− On-mine costs up US$2/t, driven by:
− higher mining volumes and cost escalation
− offset by improved efficiencies and higher production
− Overheads and SIB reduced by US$1/t due
to continued optimisation
Platts 62% Breakeven Price ($/t)
+3% +45%
Controllables Non-controllables

20
REVENUE GROWTH FROM HIGHER VOLUMES AND STRONG PRICES
− Revenue increased by 18%
− Total sales 21.2Mt: export sales up by 1.4Mt, domestic sales 0.4Mt lower
− 14% stronger average R/US$ exchange rate of R13.21 (1H16: R15.40)
− Realised average FOB export price rose by 29% to US$71/t (1H16: US$55/t)
17 140
19 806
1 042
1 694
819
4 894 652
3 047
1H16 Volume Currency Price Shipping 1H17
Rm
Mining operations Shipping
18 182
21 500

21
8 737 8 785
1 317 1 761
53544491 215 181
15
2 674 2 659
1H16 Mining operations Stockmovement
Deferred stripping Escalation,non-cash and forex
Shipping Selling anddistribution
1H17
Rm
Mining operations Shipping Selling and distribution
12 728
1
13 205
Mining
48
Logistics
429
1. Excluding the mineral royalty
OPERATING EXPENDITURE CONTAINED
− Operating expenditure up 4% to R13.2bn
− Cost savings of R752m
− Increased capitalisation of deferred stripping due to higher stripping ratio at Sishen
− Higher shipping costs as freight rates increased to US$10/t
22
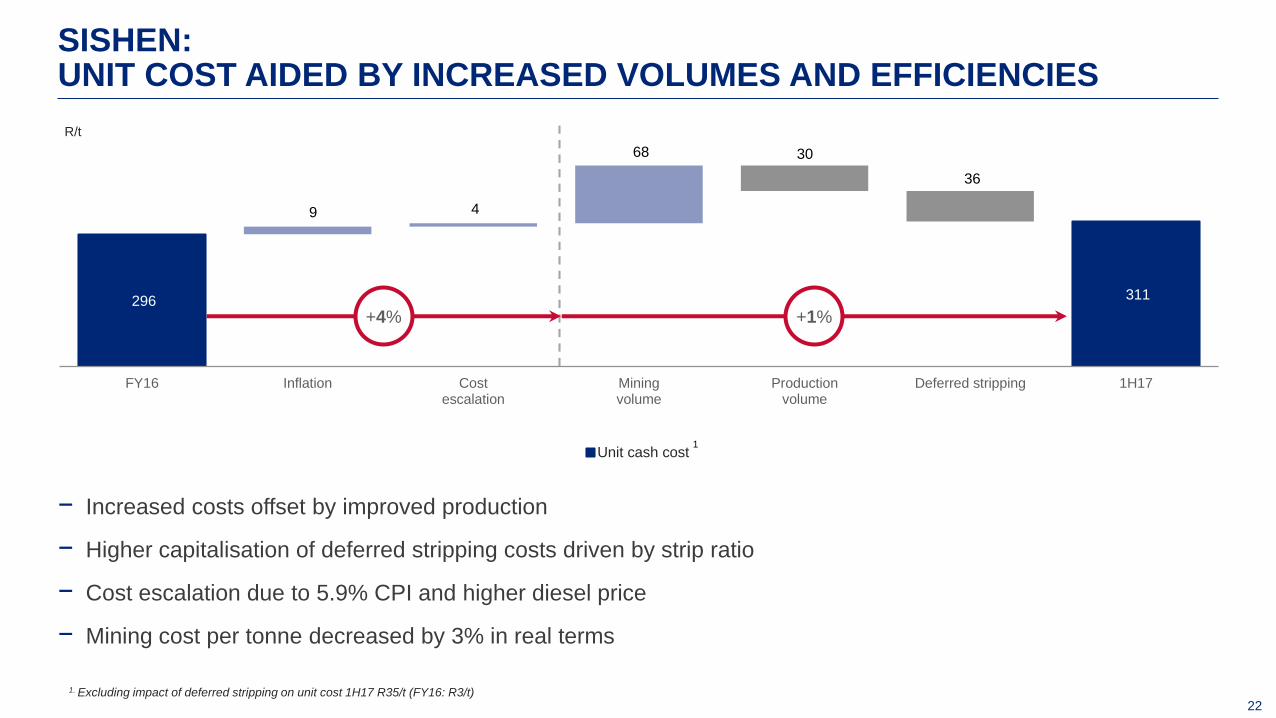
9 4
68 30
36
296 311
FY16 Inflation Costescalation
Miningvolume
Productionvolume
Deferred stripping 1H17
R/t
Unit cash cost
+4% +1%
1
SISHEN:UNIT COST AIDED BY INCREASED VOLUMES AND EFFICIENCIES
− Increased costs offset by improved production
− Higher capitalisation of deferred stripping costs driven by strip ratio
− Cost escalation due to 5.9% CPI and higher diesel price
− Mining cost per tonne decreased by 3% in real terms
1. Excluding impact of deferred stripping on unit cost 1H17 R35/t (FY16: R3/t)
23
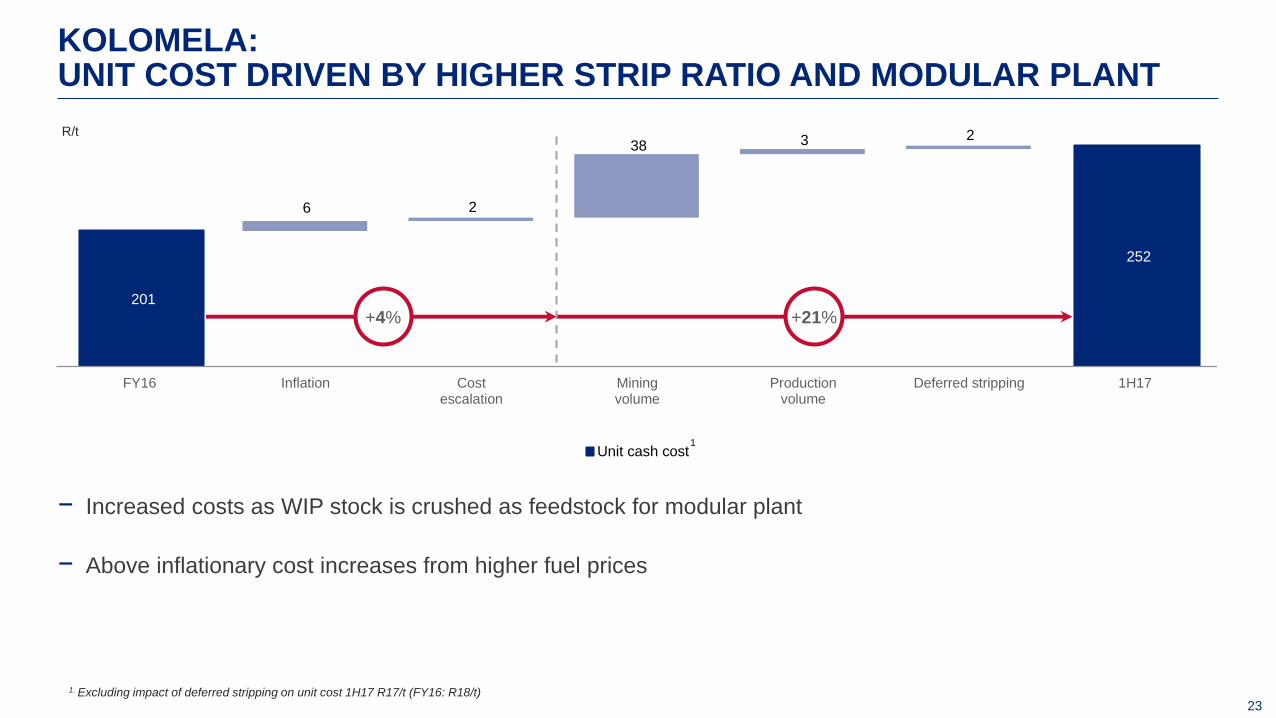
6 2
38 3 2
201
252
FY16 Inflation Costescalation
Miningvolume
Productionvolume
Deferred stripping 1H17
R/t
Unit cash cost
+4% +21%
1
KOLOMELA:UNIT COST DRIVEN BY HIGHER STRIP RATIO AND MODULAR PLANT
− Increased costs as WIP stock is crushed as feedstock for modular plant
− Above inflationary cost increases from higher fuel prices
1. Excluding impact of deferred stripping on unit cost 1H17 R17/t (FY16: R18/t)
24
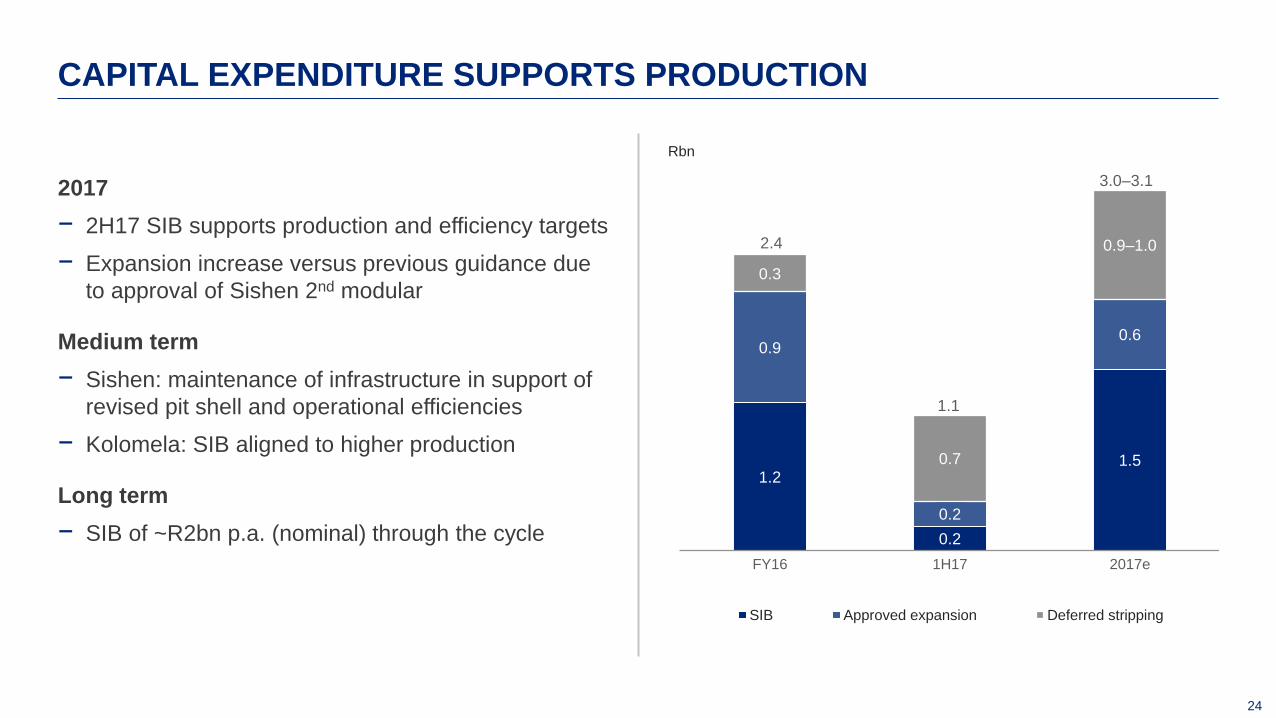
1.2
0.2
1.5
0.9
0.2
0.6
0.3
0.7
0.9–1.0
FY16 1H17 2017e
Rbn
SIB Approved expansion Deferred stripping
2017
− 2H17 SIB supports production and efficiency targets
− Expansion increase versus previous guidance due
to approval of Sishen 2nd modular
Medium term
− Sishen: maintenance of infrastructure in support of
revised pit shell and operational efficiencies
− Kolomela: SIB aligned to higher production
Long term
− SIB of ~R2bn p.a. (nominal) through the cycle
CAPITAL EXPENDITURE SUPPORTS PRODUCTION
3.0–3.1
2.4
1.1
25
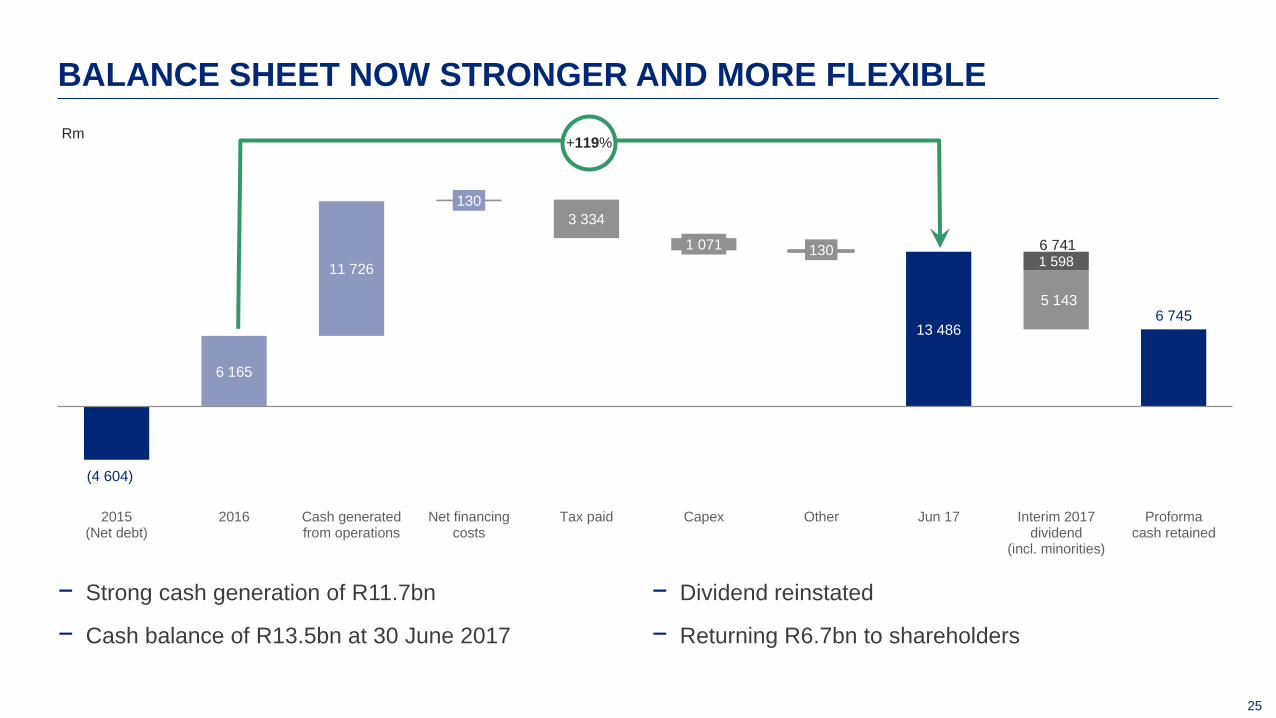
(4 604)
6 165
11 726
130
3 334
1 071 130
13 486
5 1436 745
1 598
2015(Net debt)
2016 Cash generatedfrom operations
Net financingcosts
Tax paid Capex Other Jun 17 Interim 2017dividend
(incl. minorities)
Proformacash retained
Rm
6 741
− Strong cash generation of R11.7bn
− Cash balance of R13.5bn at 30 June 2017
BALANCE SHEET NOW STRONGER AND MORE FLEXIBLE
− Dividend reinstated
− Returning R6.7bn to shareholders
+119%

OUTLOOK

27
People
Mining
ProcessingMarketing
Costs
Technology
Value
Safe and energised workforce
High performance culture
Consistent and predictable delivery
Mining equipment efficiency
Productivity
Quality focus
Improving throughput
Realise value-in-use premium
Integrated sales and operations planning
Offset inflationary pressure
Cost conscious culture
Integrate technology through value chain
Optimise resource utilisation
MAXIMISING THE RETURN POTENTIAL OF OUR CURRENT ASSETS
28
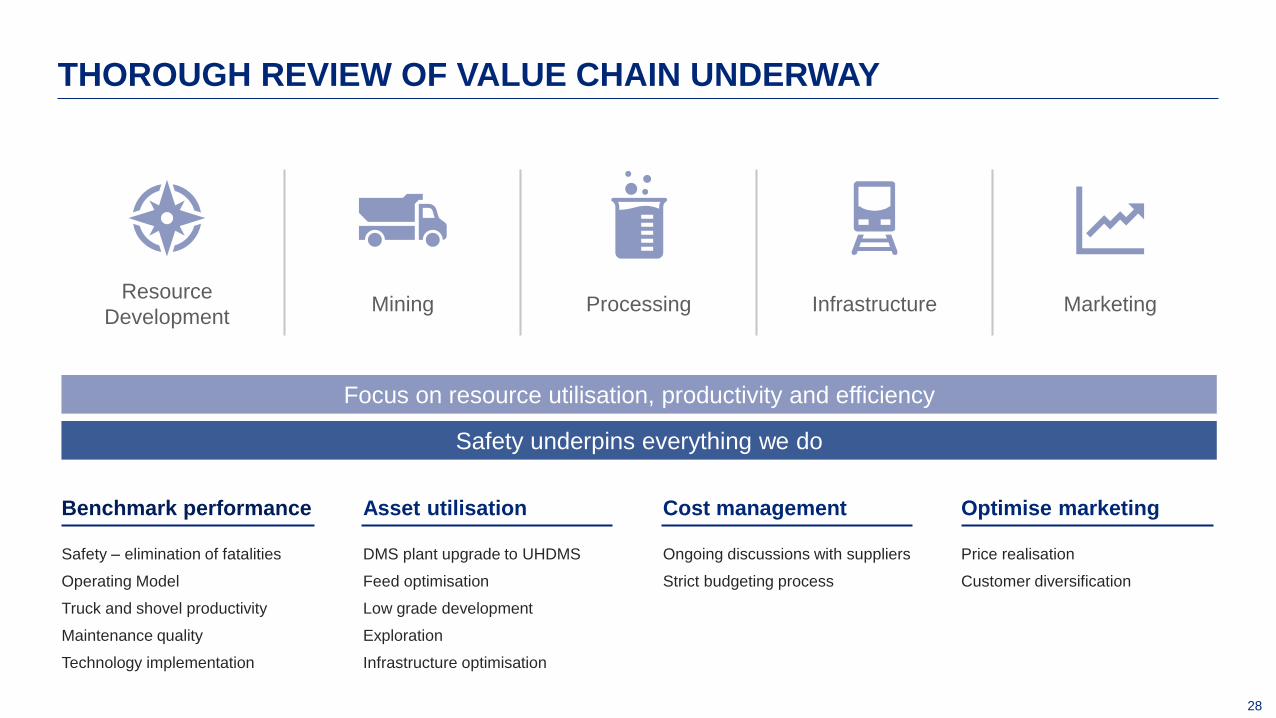
THOROUGH REVIEW OF VALUE CHAIN UNDERWAY
Mining InfrastructureResource
DevelopmentProcessing Marketing
Benchmark performance
Safety – elimination of fatalities
Operating Model
Truck and shovel productivity
Maintenance quality
Technology implementation
Asset utilisation
DMS plant upgrade to UHDMS
Feed optimisation
Low grade development
Exploration
Infrastructure optimisation
Optimise marketing
Price realisation
Customer diversification
Safety underpins everything we do
Cost management
Ongoing discussions with suppliers
Strict budgeting process
Focus on resource utilisation, productivity and efficiency

29
DELIVERING ON PROMISES
Safety: fatality free, material improvement on all key indicators
Capital allocation: balance sheet strengthened, dividend reinstated
Outlook: guidance revised upwards, cost pressure remains
Financials: capturing benefit of price and performance
Operations: another step change in productivity

QUESTIONS

ANNEXURES

32
1. Including Thabazimbi2. Excluding the impairment charge for 2016
ANNEXURE 1:ROBUST OPERATING MARGIN AND HEALTHY CASH GENERATION
Rm 1H171 1H161 % change 2H161 % change
Revenue 21 500 18 182 18 22 585 (5)
Operating expenses (13 853) (12 976) 7 (12 475) 11
Operating profit 7 647 5 206 47 10 110 (24)
Operating margin (%)2 36 29 45
Profit for the period 5 998 3 820 57 7 325 (18)
Equity holders of Kumba 4 586 2 974 54 5 648 (19)
Non-controlling interest 1 412 846 67 1 677 (16)
Effective tax rate (%) 23 23 28
Cash generated from operations 11 726 7 632 54 9 586 22

33
1H17 1H16 % change 2H16 % change
Export (Rm) 18 375 15 412 19 19 746 (7)
Tonnes sold (Mt) 19.5 18.1 8 21 (7)
US Dollar per tonne 71 55 29 67 6
Rand per tonne 942 851 11 940 -
Domestic (Rm) 1 431 1 728 (17) 1 134 26
Shipping operations (Rm) 1 694 1 042 63 1 705 (1)
Total revenue 21 500 18 182 18 22 585 (5)
Rand/US Dollar exchange rate 13.21 15.40 (14) 13.98 (6)
ANNEXURE 2:REVENUE SECTOR ANALYSIS

34
ANNEXURE 3:AGGREGATE OPERATING EXPENDITURE
Rm 1H17 1H16 % change 2H16 % change
Cost of goods sold 8 785 8 733 1 7 232 21
Cost of goods produced 8 152 7 123 14 8 037 1
Production costs 7 655 7 353 4 8 117 (6)
Sishen mine 5 336 5 527 (3) 5 845 (9)
Kolomela mine 2 111 1 631 29 2 257 (6)
Thabazimbi mine 104 187 (44) 8 1 200
Other 105 8 1 213 7 1 400
Inventory movement WIP 497 (230) 316 (80) 721
A grade - 2 100 116 (100)
B grade 497 (232) 314 (196) 354
Inventory movement finished product 16 959 (98) (659) 102
Corporate support and studies 450 508 (11) 566 (20)
Forex and other 166 143 16 (712) 123
Mineral royalty 648 248 161 738 (12)
Impairment charge - 4 (100) - -
Selling and distribution 2 659 2 674 (1) 2 705 (2)
Shipping operations 1 761 1 317 33 1 800 (2)
Operating expenses 13 853 12 976 7 12 475 11

35
Rm 1H17 FY16 FY17
Approved expansion 197 856 600
Deferred stripping 656 321 900–1 000
Sishen 550 88 600–700
Kolomela 106 233 ~300
SIB Sishen 140 875 900
SIB Kolomela 73 301 600
SIB Thabazimbi 5 - -
Total approved capital expenditure 1 071 2 353 3 000–3 100
All guidance based on current forecast exchange rates
ANNEXURE 4:CAPITAL EXPENDITURE ANALYSIS

36
(3)(35)
(18) (17)
46 63
32 27
10 11
4 4
12 13
14 16
44
62
28 34
64
67
68 96
43
52
26
32
80
79
47
60
Sishen mineFY16
Sishen mine1H17
Kolomela mineFY16
Kolomela mine1H17
Deferred stripping Other Energy Drilling and blasting Maintenance Outside services Fuel Labour
296
311
201
252
ANNEXURE 5:SISHEN AND KOLOMELA MINES’ UNIT CASH COST STRUCTURE (R/t)

37
16 18 15 10
3 32
1
4 46
6
15 1813
13
2119 31
36
14 1512 12
27 23 21 22
Sishen mineFY16
Sishen mine1H17
Kolomela mineFY16
Kolomela mine1H17
Other Energy Drilling and blasting Maintenance Outside services Fuel Labour
ANNEXURE 6:SISHEN AND KOLOMELA MINES’ UNIT CASH COST STRUCTURE (%)

38
-200
-180
-125
200
180
125
-250 -200 -150 -100 -50 0 50 100 150 200 250
Currency
Export price
Export volume
Sensitivity Analysis (1% change) – EBIT Impact (Rm)
Source: WSA, Kumba Market Intelligence, GTIS Based on 4M16 data
ANNEXURE 7:SENSITIVITY ANALYSIS 1H17
Change per unit of key operational drivers, each tested independently
1% change to key operational drivers, each tested independently
Sensitivity analysis Unit change EBIT impact
Currency (Rand/US$) R0.10/US$ R150m
Export Price (US$/t) US$1.00/t R250m
Volume (kt) 100kt R65m
Sensitivity analysis Unit change Breakeven price impact
Currency (Rand/US$) R1.00/US$ US$3.00/t


