120
Pemberton Valley Dyking District Final Report February 2007 Lillooet River Gravel Management Plan
Pemberton Valley Dyking District
Final Report February 2007
Lillooet River Gravel Management Plan
Pemberton Valley Dyking District
Final Report February 2007
Lillooet River Gravel Management Plan
KWL File No. 713.004
LILLOOET RIVER GRAVEL MANAGEMENT PLAN FINAL REPORT FEBRUARY 2007 PEMBERTON VALLEY DYKING DISTRICT
KERR WOOD LEIDAL ASSOCIATES LTD.
Consulting Engineers 713.004
STATEMENT OF LIMITATIONS
This document has been prepared by Kerr Wood Leidal Associates Ltd. (KWL) for the exclusive use and benefit of the Pemberton Valley Dyking District. No other party is entitled to rely on any of the conclusions, data, opinions, or any other information contained in this document. This document represents KWL’s best professional judgement based on the information available at the time of its completion and as appropriate for the project scope of work. Services performed in developing the content of this document have been conducted in a manner consistent with that level and skill ordinarily exercised by members of the engineering profession currently practising under similar conditions. No warranty, expressed or implied, is made.
COPYRIGHT NOTICE
These materials (text, tables, figures and drawings included herein) are copyright of Kerr Wood Leidal Associates Ltd. (KWL). The Pemberton Valley Dyking District is permitted to reproduce the materials for archiving and for distribution to third parties only as required to conduct business specifically relating to its flood protection activities. Any other use of these materials without the written permission of KWL is prohibited.
LILLOOET RIVER GRAVEL MANAGEMENT PLAN FINAL REPORT
PEMBERTON VALLEY DYKING DISTRICT FEBRUARY 2007
KERR WOOD LEIDAL ASSOCIATES LTD. Consulting Engineers 713.004
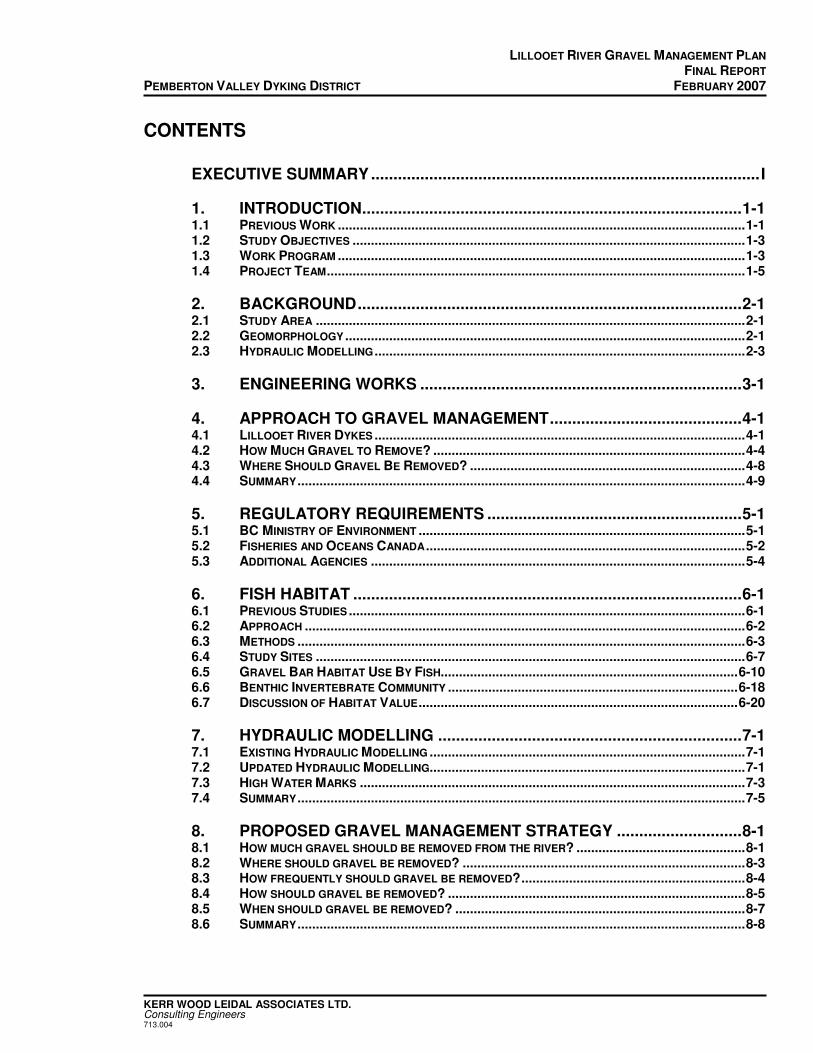
CONTENTS
EXECUTIVE SUMMARY.......................................................................................I
1. INTRODUCTION.....................................................................................1-1 1.1 PREVIOUS WORK ...............................................................................................................1-1 1.2 STUDY OBJECTIVES ...........................................................................................................1-3 1.3 WORK PROGRAM ...............................................................................................................1-3 1.4 PROJECT TEAM..................................................................................................................1-5
2. BACKGROUND......................................................................................2-1 2.1 STUDY AREA .....................................................................................................................2-1 2.2 GEOMORPHOLOGY .............................................................................................................2-1 2.3 HYDRAULIC MODELLING .....................................................................................................2-3
3. ENGINEERING WORKS ........................................................................3-1
4. APPROACH TO GRAVEL MANAGEMENT...........................................4-1 4.1 LILLOOET RIVER DYKES .....................................................................................................4-1 4.2 HOW MUCH GRAVEL TO REMOVE? .....................................................................................4-4 4.3 WHERE SHOULD GRAVEL BE REMOVED? ...........................................................................4-8 4.4 SUMMARY ..........................................................................................................................4-9
5. REGULATORY REQUIREMENTS .........................................................5-1 5.1 BC MINISTRY OF ENVIRONMENT .........................................................................................5-1 5.2 FISHERIES AND OCEANS CANADA.......................................................................................5-2 5.3 ADDITIONAL AGENCIES ......................................................................................................5-4
6. FISH HABITAT .......................................................................................6-1 6.1 PREVIOUS STUDIES ............................................................................................................6-1 6.2 APPROACH ........................................................................................................................6-2 6.3 METHODS ..........................................................................................................................6-3 6.4 STUDY SITES .....................................................................................................................6-7 6.5 GRAVEL BAR HABITAT USE BY FISH.................................................................................6-10 6.6 BENTHIC INVERTEBRATE COMMUNITY ...............................................................................6-18 6.7 DISCUSSION OF HABITAT VALUE.......................................................................................6-20
7. HYDRAULIC MODELLING ....................................................................7-1 7.1 EXISTING HYDRAULIC MODELLING ......................................................................................7-1 7.2 UPDATED HYDRAULIC MODELLING......................................................................................7-1 7.3 HIGH WATER MARKS .........................................................................................................7-3 7.4 SUMMARY ..........................................................................................................................7-5
8. PROPOSED GRAVEL MANAGEMENT STRATEGY ............................8-1 8.1 HOW MUCH GRAVEL SHOULD BE REMOVED FROM THE RIVER? ..............................................8-1 8.2 WHERE SHOULD GRAVEL BE REMOVED? .............................................................................8-3 8.3 HOW FREQUENTLY SHOULD GRAVEL BE REMOVED?.............................................................8-4 8.4 HOW SHOULD GRAVEL BE REMOVED? .................................................................................8-5 8.5 WHEN SHOULD GRAVEL BE REMOVED? ...............................................................................8-7 8.6 SUMMARY ..........................................................................................................................8-8
LILLOOET RIVER GRAVEL MANAGEMENT PLAN FINAL REPORT
PEMBERTON VALLEY DYKING DISTRICT FEBRUARY 2007
KERR WOOD LEIDAL ASSOCIATES LTD. Consulting Engineers 713.004
9. SUMMARY AND RECOMMENDATIONS ..............................................9-1 9.1 SUMMARY ..........................................................................................................................9-1 9.2 RECOMMENDATIONS...........................................................................................................9-3 9.3 REPORT SUBMISSION .........................................................................................................9-4
BIBLIOGRAPHY
FIGURES
Figure 1-1: Location Map Figure 2-1: Lillooet River Modelled Flood Profile – KWL 2002 Figure 3-1: Lillooet River Channel Changes – Lillooet Lake to Pemberton Figure 3-2: Lillooet River Channel Changes – Pemberton to Upper Cutoffs Figure 3-3: Lillooet River Channel Changes – Upper Cutoffs to Forestry Bridge Figure 4-1: Lillooet River Design Flood Levels – Miller Creek to km 17 Figure 4-2: Lillooet River Design Flood Levels – km 18 to Highway 99 Figure 4-3: Lillooet River Design Flood Levels – North Arm Plug to the Green River Figure 4-4: Distribution of Sedimentation along the Lillooet River Figure 6-1: Daily Average Discharge of the Lillooet River at Pemberton (WSC Gauge
08MH005) from 1914 to 2002 Figure 6-2: Schematic of Habitat Units Commonly Associated with the Perimeter of Gravel
Bars in the Lillooet River. Figure 6-3: Comparison of Average Fish Density and Species Richness Among Gravel
Bars in the Lillooet River Figure 6-4: Species-Specific Comparison of Mean Fish Density Among Gravel Bars in the
Lillooet River Figure 6-5: Comparison of Average Fish Density and Species Richness Among Habitats
Associated with Gravel Bars in the Lillooet River Figure 6-6: Species-Specific Comparison of Mean Fish Density Among Habitat Types
Associated with Gravel Bars in the Lillooet River Figure 6-7: Average Density and Taxon Richness in Invertebrate Samples Collected from
Gravel Bars in the Lillooet River in March 2004 Figure 7-1: Lillooet River Flood Levels – Miller Creek to km 13 Figure 7-2: Lillooet River Flood Levels – km 14 to the Green River Figure 7-3: Topographic Survey of Voyageur Bar, March 2004 Figure 7-4: Topographic Survey of Beem Bar, March 2004 Figure 7-5: Topographic Survey of Big Sky Bar, March 2004 Figure 7-6: 200-year Peak Instantaneous Water Level Comparison Lillooet River –
Voyageur Bar Figure 7-7: 200-year Peak Instantaneous Water Level Comparison Lillooet River – Beem
Bar Figure 7-8: 200-year Peak Instantaneous Water Level Comparison Lillooet River – Big Sky
Bar Figure 7-9: October 2003 High Water Survey of the Lillooet River – Miller Creek to the
Green River Figure 8-1: Alternative Strategies for Gravel Removal from a Bar with a Minor Secondary
Channel
LILLOOET RIVER GRAVEL MANAGEMENT PLAN FINAL REPORT
PEMBERTON VALLEY DYKING DISTRICT FEBRUARY 2007
KERR WOOD LEIDAL ASSOCIATES LTD. Consulting Engineers 713.004
TABLES
Table 1-1: Work Program for the Lillooet River Gravel Management Plan Table 3-1: Lillooet River Meander Cut-offs Table 4-1: Documented Gravel Removals on the Lillooet River Table 6-1: Description of Habitat Units Associated with Gravel Bars in the Lillooet River Table 6-2: Presence or Absence of Fish Species Collected by Beach Seine from Gravel
Bar Sites in the Lillooet River on 3 Sampling Dates Table 6-3: Mean Fork Length of Fish Captured by Beach Seine from Gravel Bar Sites in
the Lillooet River on 3 Sampling Dates Table 6-4: Average Density of Benthic Invertebrates in Three Samples Collected from
Gravel Bars in March 2004 Table 6-5: Fish Catch Summary from Electro-shocking on June 22, 2004 on Three
Tributaries to the Lillooet River Table 7-1: Lillooet River High Water Elevations of October 2003 Flood
APPENDICES
A MOE Approval Application or Notification for Changes In and About a Stream B Photographs

Executive Summary

LILLOOET RIVER GRAVEL MANAGEMENT PLAN FINAL REPORT
PEMBERTON VALLEY DYKING DISTRICT FEBRUARY 2007
KERR WOOD LEIDAL ASSOCIATES LTD. i Consulting Engineers 713.004
EXECUTIVE SUMMARY
This report presents a gravel management plan for the Lillooet River within the area of Pemberton Valley Dyking District jurisdiction. Development of this plan is pursuant to a recommendation from a December 2002 KWL report titled Engineering Study for the Lillooet
River Corridor. The purpose of the plan is to mitigate the effects of progressive aggradation of the river channel such that the design flood levels in the vicinity of Pemberton will not significantly increase. In the upper reaches, the Lillooet River is sufficiently steep to transport large quantities of gravel. As the river approaches Lillooet Lake, the channel gradient decreases and the river cannot continue to transport its gravel load. The end result is that the gravel load of the river is virtually all deposited by the time the river reaches the Green River confluence (km 6). The gravel deposition causes the river bed level to rise, with a corresponding flood level increase in the absence of human intervention. Given that there is a limit as to how high the dykes can be raised to accommodate river bed aggradation, there is a need to consider gravel removal as part of the flood protection program. The Lillooet River Gravel Management Plan incorporates the following input information: � surveys of potential gravel removal sites; � updated hydraulic modelling to identify dyke reaches that may be compromised from
ongoing bed aggradation, and to assess the hydraulic benefits of gravel removal; and � a fish habitat study to identify key fish habitat features in the lower river reaches. The Lillooet River system is important habitat for anadromous salmonid species, freshwater trout and char, and resident non-salmonids. Fish habitat sampling concluded that gravel bars in the Lillooet River have a simple morphology with relatively low habitat complexity. Limited sampling in tributaries suggests that remaining off-channel habitat is exceptionally important, relative to available mainstem habitat. It is concluded that bedload aggradation in the lower reaches can be managed by gravel removal from specific gravel bars. Removal of about 5,000 m3 of gravel per year is recommended from the reach between km 20 and km 6 (Miller Creek to the Green River). Removal of about 15,000 m3 every three years is suggested as a practical approach. Based on river hydraulics, fish habitat considerations, and construction access, the most promising sites are Beem Bar and Voyageur Bar. Rather than widespread dredging of the river, it is preferable to focus gravel removal at actively aggrading bars. As long as the target gravel removal volume is removed from the subject reach, the desired flood protection benefit will be achieved. Gravel removals offer the potential for increasing habitat complexity by deepening side channels that flow behind gravel bars, and excavating nooks on the main channel flank. Implementation of this plan should commence with a gravel removal in 2007 or 2008, with a suggested removal of 10,500 m3 at Voyageur Bar and 4,500 m3 at Beem Bar. It is also suggested that the gravel management plan be reviewed roughly every 10 years, with a detailed channel survey to monitor the reach-wide response of the river to gravel removal.

Section 1
Introduction

LILLOOET RIVER GRAVEL MANAGEMENT PLAN FINAL REPORT
PEMBERTON VALLEY DYKING DISTRICT FEBRUARY 2007
KERR WOOD LEIDAL ASSOCIATES LTD. 1-1 Consulting Engineers 713.004
1. INTRODUCTION
1.1 PREVIOUS WORK
Kerr Wood Leidal Associates Ltd. (KWL) completed a report titled “Engineering Study for the Lillooet River Corridor” in December 2002. That study was commissioned by the Pemberton Valley Dyking District (PVDD) and the Mount Currie Band with additional funding provided by Indian and Northern Affairs Canada (INAC), Public Works and Government Services Canada (PWGSC), and the BC Ministry of Water, Land and Air Protection (MWLAP, now Ministry of Environment, MOE). The primary objective of the study was to examine the adequacy of dykes in the Pemberton Valley, both on the Lillooet River and its major tributaries. The significant results of the study included: � documentation of engineering works to date; � updated (2000) surveys for 103 river cross-sections; � a geomorphic analysis of channel adjustments over the past half century; � revised 200-year return period design flood levels for the Lillooet River and
significant tributaries; and � an implementation plan and recommendations for further flood protection
improvements. The 2002 study also recommended that a comprehensive gravel management plan be developed for the lower reaches of the Lillooet River due to ongoing bedload aggradation.
NEED FOR GRAVEL REMOVAL
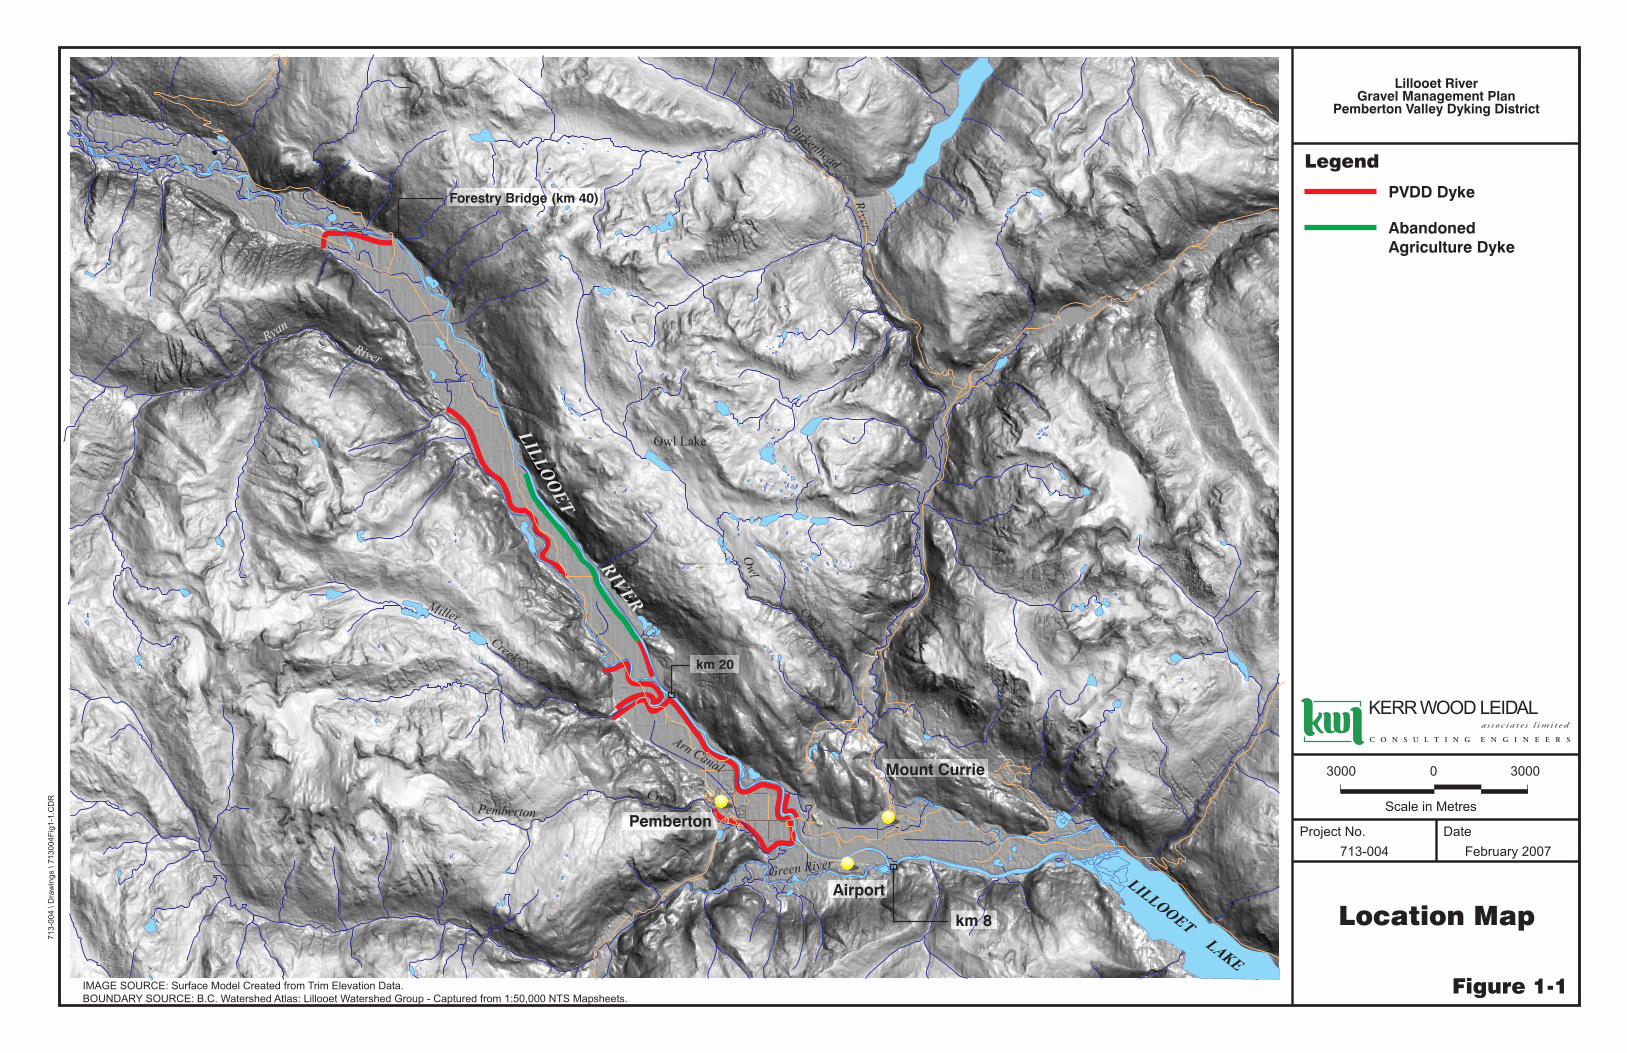
In the upper reaches, the gradient of the Lillooet River is sufficiently steep (0.003 to 0.007 m/m) that large quantities of gravel are transported on an annual basis and a braided morphology persists. In the lower reaches, the channel gradient decreases to less than 0.0015 m/m as it approaches the Forestry Bridge at km 40 (Figure 1-1). Because of the reduced channel gradient, the river cannot continue to move all of the sediment and a significant portion of the bedload (predominantly gravel with 25 to 30% interstitial sand) is deposited. Upstream of the Forestry Bridge, the result is a relatively abrupt change in channel morphology from braided to meandering. However, the river continues to transport gravel-sized sediment beyond the Forestry Bridge. The contemporary annual bedload transport rate at the Forestry Bridge has been estimated at 40,000 m3/year (KWL, 2002). The channel gradient continues to decline further downstream and the Lillooet River loses its ability to move the coarser portion of its bedload. The end result is that none of the gravel component (> 2 mm) is transported beyond about km 6 to km 8.
LILLOOET RIVER GRAVEL MANAGEMENT PLAN FINAL REPORT
PEMBERTON VALLEY DYKING DISTRICT FEBRUARY 2007
KERR WOOD LEIDAL ASSOCIATES LTD. 1-2 Consulting Engineers 713.004
The largest material is deposited first and these gravel deposits form an alluvial fan (a wedge of sediment). A characteristic of alluvial fans is that they continue to accumulate sediment as long as the river delivers more sediment than can be transported across the fan and beyond. As the bed of the river rises (aggrades), the water surface level also rises for a given flow. Over a period of years, the level of protection afforded by dykes is reduced. For the lower reaches of the Lillooet River, a systematic raising of the channel bed has not been documented over the past thirty years. This can be partially attributed to the spacing of the cross-sections (approximately 800 m), which is generally inadequate to quantify aggradation between surveys. [Lane et al. (1994) observed significant loss of information with cross-section spacing greater than 3 m in a 10 to 20 m wide stream]. The general absence of aggradation in the lower reaches is also likely in response to past gravel removals. Over the past two decades, the quantity of gravel removed from the Lillooet River is close to the lower bound estimates of the input rate for some periods. Without the previous gravel removal, the channel bed of the Lillooet River would most certainly be higher than it is today downstream of km 20. Despite the removals, gravel accumulation has reportedly reduced the river capacity locally. For example, a loss of approximately 20% of the cross-sectional area was observed in 1997 adjacent to the airport access road below Pemberton Creek. Due to concerns about reduced flood conveyance, approval was granted by MWLAP and Fisheries and Oceans Canada (DFO) to remove gravel from the bar. Approximately 5,000 m3 of sediment was subsequently removed from a gravel bar adjacent to the right bank.
OPTIONS FOR MITIGATING THE HAZARDS OF GRAVEL AGGRADATION
There are a number of means by which the ongoing aggradation might be mitigated, including: � raising the dykes; � reconstructing the dykes with greater setbacks; � accepting the increased flood hazard through higher flood construction levels (FCL’s)
and more stringent land use planning measures; and � lowering the river bed by gravel removal. While the dykes can be raised to offset their deficiencies, aggradation in the lower reaches will continue to be a problem for decades. Because the dykes can not continue to be raised in perpetuity, dyke raising on its own is not a practical option for long-term management of the gravel deposition. Reconstructing the dykes with greater setbacks is a viable option (particularly since gravel accumulations are relatively small), but is extremely expensive and there is increasing pressure for development on the floodplain. PVDD has a mandate to undertake works to reclaim and develop lands in the District and prevent flooding within its area of jurisdiction. Hence from their perspective, accepting

LILLOOET RIVER GRAVEL MANAGEMENT PLAN FINAL REPORT
PEMBERTON VALLEY DYKING DISTRICT FEBRUARY 2007
KERR WOOD LEIDAL ASSOCIATES LTD. 1-3 Consulting Engineers 713.004
the increased flood hazard through higher FCL’s and more stringent land use planning measures is not a viable option. The remaining option is to remove gravel from the river so the bed is prevented from rising. While gravel removal appears to be a viable solution, concerns about the ecological impact on the river must be addressed. Gravel removals have recently become a contentious issue in British Columbia due to the potential impact on fish habitat.
FUNDING
Before 1998, PVDD excavated sediment from the Lillooet River and its tributaries with significant technical assistance from the former British Columbia Ministry of Environment, Lands and Parks. Following a period of government services being transferred to local governments, this support is no longer generally available. Applications for gravel removal are administered by the BC Ministry of Environment (MOE) and Fisheries and Oceans Canada (DFO), the information requirements for proposed gravel removal activities have increased significantly. In particular, there is a need for a comprehensive gravel management plan for larger systems such as the Lillooet River. Given the need for increased technical analysis of proposed gravel removals, PVDD applied to the provincial Flood Protection Assistance Fund (FPAF) to develop a comprehensive gravel management plan for the Lillooet River. PVDD received funding for the study in the summer of 2003 and subsequently retained KWL to complete the work.
1.2 STUDY OBJECTIVES
The primary objective of this study is to provide a gravel management plan (GMP) for lower reaches of the Lillooet River. The plan is to be specific enough that when sediment aggradation (that would impact public safety) is identified, it would provide a detailed gravel removal operational plan that would meet the requirements of DFO and MOE. These two agencies are responsible for authorizing works in and about streams in British Columbia. The GMP for the Lillooet River includes: � survey data of potential gravel removal sites; � an updated hydraulic model of the removal sites to analyze channel capacity; and � a fish habitat study that identifies the habitat requirements of fish occupying lower
reaches of the river.
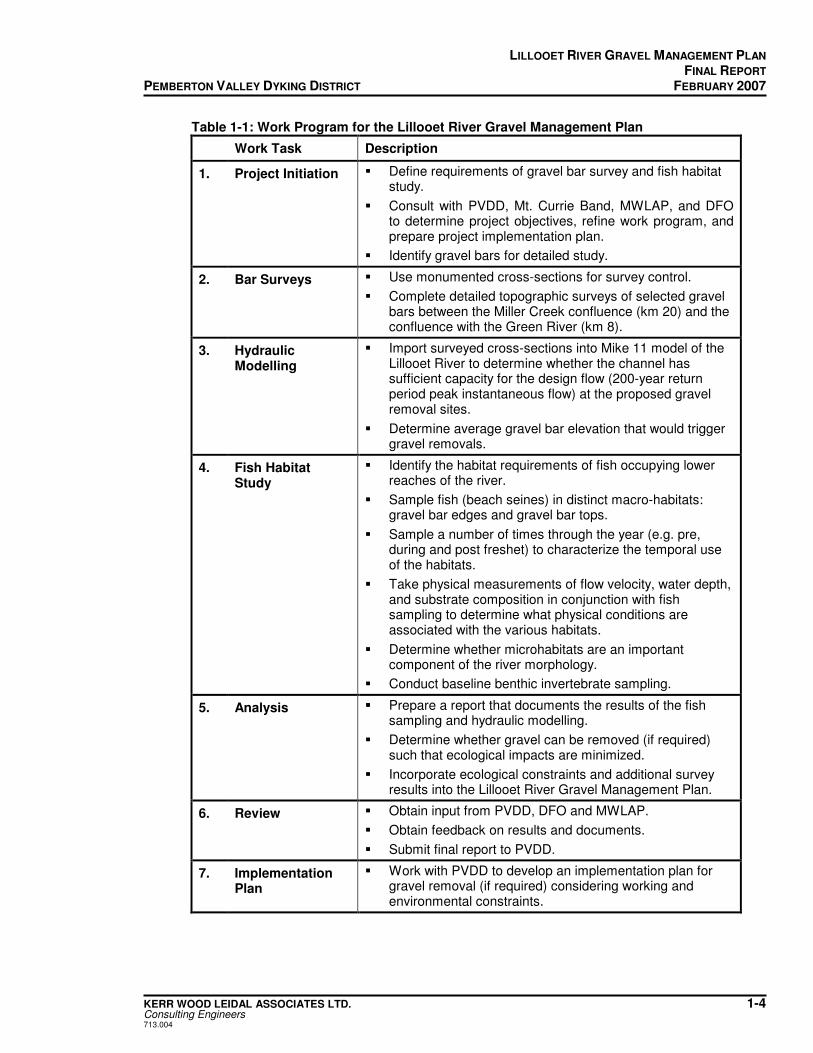
1.3 WORK PROGRAM
The work program for this study is summarized in Table 1-1.
LILLOOET RIVER GRAVEL MANAGEMENT PLAN FINAL REPORT
PEMBERTON VALLEY DYKING DISTRICT FEBRUARY 2007
KERR WOOD LEIDAL ASSOCIATES LTD. 1-4 Consulting Engineers 713.004
Table 1-1: Work Program for the Lillooet River Gravel Management Plan
Work Task Description
1. Project Initiation � Define requirements of gravel bar survey and fish habitat study.
� Consult with PVDD, Mt. Currie Band, MWLAP, and DFO to determine project objectives, refine work program, and prepare project implementation plan.
� Identify gravel bars for detailed study.
2. Bar Surveys � Use monumented cross-sections for survey control.
� Complete detailed topographic surveys of selected gravel bars between the Miller Creek confluence (km 20) and the confluence with the Green River (km 8).
3. Hydraulic Modelling
� Import surveyed cross-sections into Mike 11 model of the Lillooet River to determine whether the channel has sufficient capacity for the design flow (200-year return period peak instantaneous flow) at the proposed gravel removal sites.
� Determine average gravel bar elevation that would trigger gravel removals.
4. Fish Habitat Study
� Identify the habitat requirements of fish occupying lower reaches of the river.
� Sample fish (beach seines) in distinct macro-habitats: gravel bar edges and gravel bar tops.
� Sample a number of times through the year (e.g. pre, during and post freshet) to characterize the temporal use of the habitats.
� Take physical measurements of flow velocity, water depth, and substrate composition in conjunction with fish sampling to determine what physical conditions are associated with the various habitats.
� Determine whether microhabitats are an important component of the river morphology.
� Conduct baseline benthic invertebrate sampling.
5. Analysis � Prepare a report that documents the results of the fish sampling and hydraulic modelling.
� Determine whether gravel can be removed (if required) such that ecological impacts are minimized.
� Incorporate ecological constraints and additional survey results into the Lillooet River Gravel Management Plan.
6. Review � Obtain input from PVDD, DFO and MWLAP.
� Obtain feedback on results and documents.
� Submit final report to PVDD.
7. Implementation Plan
� Work with PVDD to develop an implementation plan for gravel removal (if required) considering working and environmental constraints.
LILLOOET RIVER GRAVEL MANAGEMENT PLAN FINAL REPORT
PEMBERTON VALLEY DYKING DISTRICT FEBRUARY 2007
KERR WOOD LEIDAL ASSOCIATES LTD. 1-5 Consulting Engineers 713.004
1.4 PROJECT TEAM
The KWL project team includes: � Mike Currie, M.Eng., P.Eng., Project Manager; � Hamish Weatherly, M.Sc., P.Geo., Fluvial Geomorphologist; � Laura Rempel, Ph.D., ABD, Systems Ecologist; � Erica Ellis, M.Sc., Fluvial Geomorphologist; and � David Zabil, M.A.Sc., P.Eng., Project Engineer. Input to the gravel management plan was provided by the following representations: PVDD: Ms. Kathie Bergen, Administrator Ms. Pia Fotsch, Administrator Mr. Sandy McCormack, Former Foreman Mr. Jeff Westlake, B.A., Operations and Maintenance Manager MWLAP: Mr. John Pattle, M.Eng., P.Eng., Flood Hazard Specialist DFO: Mr. Dave Nanson, Habitat Management Mr. Vince Busto, P.Eng. Mr. Pattle was also the project administrator on behalf of the Flood Protection Assistance Fund.
Location Map
Figure 1-1
Lillooet RiverGravel Management Plan
Pemberton Valley Dyking District
Legend
Project No.
713-004 February 2007
Date
713-0
04
\D
raw
ings
\713004F
ig1-1
.CD
R
IMAGE SOURCE: Surface Model Created from Trim Elevation Data.
BOUNDARY SOURCE: B.C. Watershed Atlas: Lillooet Watershed Group - Captured from 1:50,000 NTS Mapsheets.
Owl Lake
Ow
l
Creek
CreekPemberton
Birkenhead
River
LIL
LO
OE
T
River
RIV
ER
LIL
LO
OE
T
LA
KE
Miller
Creek
Green River
Ryan
Scale in Metres
300003000
km 20
Arn Canal
Pemberton
Mount Currie
Airport
km 8
Forestry Bridge (km 40) PVDD Dyke
Abandoned
Agriculture Dyke

Section 2
Background
LILLOOET RIVER GRAVEL MANAGEMENT PLAN FINAL REPORT
PEMBERTON VALLEY DYKING DISTRICT FEBRUARY 2007
KERR WOOD LEIDAL ASSOCIATES LTD. 2-1 Consulting Engineers 713.004
2. BACKGROUND This section provides an overview of the study area, followed by a summary of the geomorphic and hydraulic assessments completed for the Lillooet River by KWL (2002).
2.1 STUDY AREA
The Lillooet River drains an area of approximately 3,150 km2 upstream of Lillooet Lake. Two significant populations inhabit the Pemberton Valley: the Mount Currie Band, with a population centred in the flood-prone confluence area of the Lillooet River and the Birkenhead River, and the non-native population, which is centred in the Village of Pemberton. With respect to river management activities, the most significant stakeholders are the Mount Currie Band and PVDD, which represent the majority of the populations and land affected by the Lillooet River and tributaries. The focus of this report is on lands within the Village of Pemberton, where PVDD is responsible for maintaining dykes and other flood protection works. PVDD’s jurisdiction extends from above the Forestry Bridge at km 40 to the head of Lillooet Lake, but excludes the Mount Currie Band reserve lands. With respect to gravel management, this report focuses on the section of the Lillooet River between the confluence with Miller Creek and the Ryan River (km 20) and the confluence with the Green River (km 8). The primary dyke that protects the Village of Pemberton is situated on the right bank through this reach. If the river were to overtop this dyke, the result would be significant flooding to the Village of Pemberton. Significant tributaries to lower reaches of the Lillooet River include (Figure 1-1): � Ryan River (411 km2); � Miller Creek (74 km2); � Pemberton Creek (51 km2); � Green River (869 km2); and � Birkenhead River (666 km2). For the purposes of this report, however, the focus is on the Lillooet River.
2.2 GEOMORPHOLOGY
The Upper Lillooet River (above the PVDD area) is relatively steep, with a braided morphology and an active channel that is up to 500 m wide. Below km 43, the river changes to a single-thread, irregularly meandering channel that flows through the

LILLOOET RIVER GRAVEL MANAGEMENT PLAN FINAL REPORT
PEMBERTON VALLEY DYKING DISTRICT FEBRUARY 2007
KERR WOOD LEIDAL ASSOCIATES LTD. 2-2 Consulting Engineers 713.004
Pemberton Valley to Lillooet Lake. The average channel width is about 110 m. The river is gravel-bedded for most of its length, except for 6 to 8 km upstream of Lillooet Lake where the channel gradient is no longer sufficient for gravel transport (some pea gravel does reach the delta but the volume is not significant). Figure 2-1 shows the river profile and its effect on channel morphology. The transition from a braided morphology occurs at a channel gradient of about 0.0013 m/m. Below this transition, the channel gradient decreases from about 0.0011 m/m at the Forestry Bridge to 0.00055 m/m at the delta. A lack of sediment larger than a few millimetres in size at the delta indicates that gravel is not being transported into Lillooet Lake. Gravel transport is therefore confined within a closed system and should accumulate along the channel bed of the Lillooet River below the Forestry Bridge – given a continuous supply of gravel to the system. In other words, the gravel-sand transition represents the front of a large gravel fan. Significant upstream gravel deposition would be required for the front of the gravel fan to migrate downstream. As such, the overall level of the channel bed should be increasing (in the absence of human intervention), particularly since extensive bank protection works have generally confined the river to its present course. The behaviour of gravel-sized sediment, which determines channel morphology, strongly contrasts with that of finer sediment (sand and silt) which acts as wash load. Once entrained, this material moves primarily in suspension and has little impact on channel morphology, except as a superimposed deposit on floodplain surfaces and in backchannel areas. Most of the fine sediment transported by the Lillooet River is deposited in Lillooet Lake, where it is responsible for a rapidly advancing delta front. Between 1986 and 1999 the delta advanced at an average rate of 16 m/year.
SUMMARY OF SEDIMENT TRANSPORT IN THE LILLOOET RIVER
The 2002 KWL report provides a detailed analysis of sediment transport and geomorphic change in the last half century. This analysis was based on channel mapping of air photographs and a comparison of cross-section data from 1969, 1978, 1985, 1993 and 2000. Some survey data is also available from 1945, prior to extensive engineering works (see Section 3). The most complete data set is from 1985 when a total of 73 cross-sections were surveyed between Lillooet Lake and km 43. The 1969, 1978 and 2000 surveys are also relatively complete. The exception is the 1993 survey, which only extended up to km 12. Sediment transport and channel changes in lower reaches of the Lillooet River are summarized as follows:
LILLOOET RIVER GRAVEL MANAGEMENT PLAN FINAL REPORT
PEMBERTON VALLEY DYKING DISTRICT FEBRUARY 2007
KERR WOOD LEIDAL ASSOCIATES LTD. 2-3 Consulting Engineers 713.004
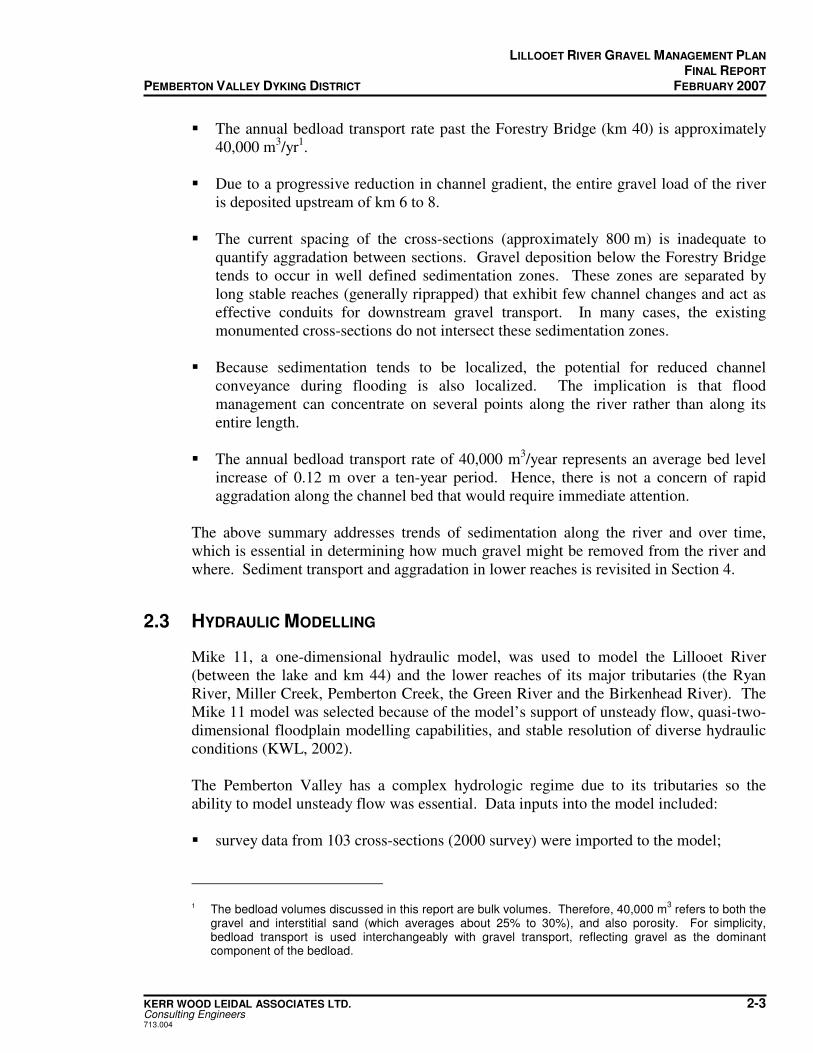
� The annual bedload transport rate past the Forestry Bridge (km 40) is approximately 40,000 m3/yr1.
� Due to a progressive reduction in channel gradient, the entire gravel load of the river
is deposited upstream of km 6 to 8. � The current spacing of the cross-sections (approximately 800 m) is inadequate to
quantify aggradation between sections. Gravel deposition below the Forestry Bridge tends to occur in well defined sedimentation zones. These zones are separated by long stable reaches (generally riprapped) that exhibit few channel changes and act as effective conduits for downstream gravel transport. In many cases, the existing monumented cross-sections do not intersect these sedimentation zones.
� Because sedimentation tends to be localized, the potential for reduced channel
conveyance during flooding is also localized. The implication is that flood management can concentrate on several points along the river rather than along its entire length.
� The annual bedload transport rate of 40,000 m3/year represents an average bed level
increase of 0.12 m over a ten-year period. Hence, there is not a concern of rapid aggradation along the channel bed that would require immediate attention.
The above summary addresses trends of sedimentation along the river and over time, which is essential in determining how much gravel might be removed from the river and where. Sediment transport and aggradation in lower reaches is revisited in Section 4.
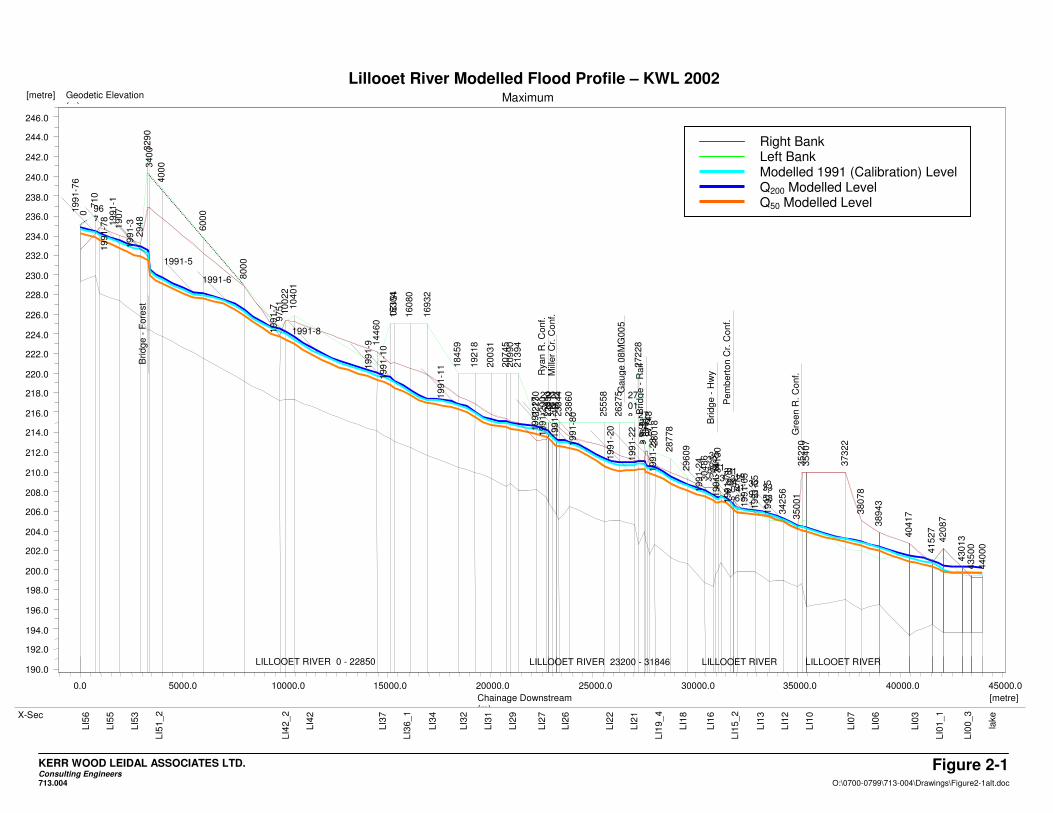
2.3 HYDRAULIC MODELLING
Mike 11, a one-dimensional hydraulic model, was used to model the Lillooet River (between the lake and km 44) and the lower reaches of its major tributaries (the Ryan River, Miller Creek, Pemberton Creek, the Green River and the Birkenhead River). The Mike 11 model was selected because of the model’s support of unsteady flow, quasi-two-dimensional floodplain modelling capabilities, and stable resolution of diverse hydraulic conditions (KWL, 2002). The Pemberton Valley has a complex hydrologic regime due to its tributaries so the ability to model unsteady flow was essential. Data inputs into the model included: � survey data from 103 cross-sections (2000 survey) were imported to the model;
1 The bedload volumes discussed in this report are bulk volumes. Therefore, 40,000 m
3 refers to both the
gravel and interstitial sand (which averages about 25% to 30%), and also porosity. For simplicity, bedload transport is used interchangeably with gravel transport, reflecting gravel as the dominant component of the bedload.
LILLOOET RIVER GRAVEL MANAGEMENT PLAN FINAL REPORT
PEMBERTON VALLEY DYKING DISTRICT FEBRUARY 2007
KERR WOOD LEIDAL ASSOCIATES LTD. 2-4 Consulting Engineers 713.004
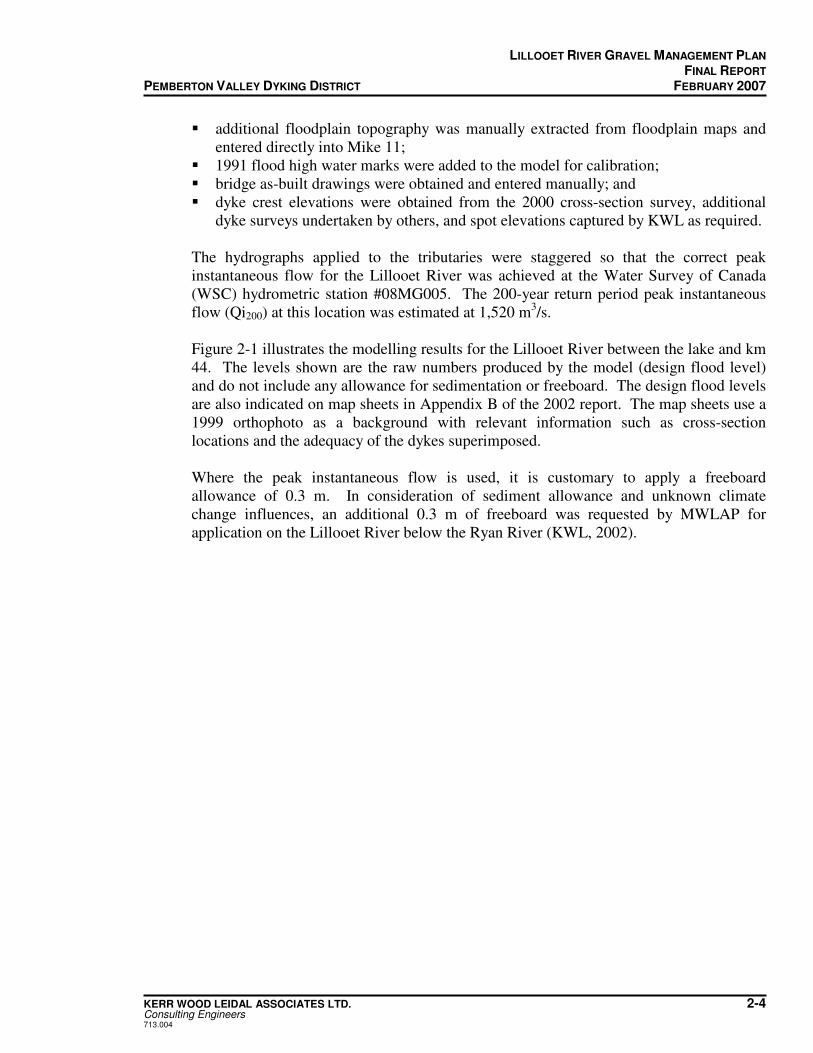
� additional floodplain topography was manually extracted from floodplain maps and entered directly into Mike 11;
� 1991 flood high water marks were added to the model for calibration; � bridge as-built drawings were obtained and entered manually; and � dyke crest elevations were obtained from the 2000 cross-section survey, additional
dyke surveys undertaken by others, and spot elevations captured by KWL as required. The hydrographs applied to the tributaries were staggered so that the correct peak instantaneous flow for the Lillooet River was achieved at the Water Survey of Canada (WSC) hydrometric station #08MG005. The 200-year return period peak instantaneous flow (Qi200) at this location was estimated at 1,520 m3/s. Figure 2-1 illustrates the modelling results for the Lillooet River between the lake and km 44. The levels shown are the raw numbers produced by the model (design flood level) and do not include any allowance for sedimentation or freeboard. The design flood levels are also indicated on map sheets in Appendix B of the 2002 report. The map sheets use a 1999 orthophoto as a background with relevant information such as cross-section locations and the adequacy of the dykes superimposed. Where the peak instantaneous flow is used, it is customary to apply a freeboard allowance of 0.3 m. In consideration of sediment allowance and unknown climate change influences, an additional 0.3 m of freeboard was requested by MWLAP for application on the Lillooet River below the Ryan River (KWL, 2002).
KERR WOOD LEIDAL ASSOCIATES LTD. Consulting Engineers 713.004 O:\0700-0799\713-004\Drawings\Figure2-1alt.doc
Figure 2-1
Lillooet River Modelled Flood Profile – KWL 2002
Right Bank Left Bank Modelled 1991 (Calibration) Level Q200 Modelled Level Q50 Modelled Level
0.0 5000.0 10000.0 15000.0 20000.0 25000.0 30000.0 35000.0 40000.0 45000.0
[metre]Chainage Downstream(m)
190.0
192.0
194.0
196.0
198.0
200.0
202.0
204.0
206.0
208.0
210.0
212.0
214.0
216.0
218.0
220.0
222.0
224.0
226.0
228.0
230.0
232.0
234.0
236.0
238.0
240.0
242.0
244.0
246.0
[metre] Geodetic Elevation(m)
Maximum
LILLOOET RIVER 0 - 22850
0 710
967
190
7
294
8329
0340
0
400
0
600
0
800
0
975
1100
22
104
01
144
60
151
20
153
04
160
80
169
32
184
59
192
18
200
31
207
45
209
90
213
94
222
30 22
722 2
28
5023
006
23200
LILLOOET RIVER 23200 - 31846
233
44
238
60
255
58
262
75 27
018
272
28
27528
27600
27670
277
48
280
18
287
78
296
09
304
8630
872
30970
311
30
31231
31732
31846
LILLOOET RIVER
32040
32931
33581 3
42
56
350
01
352
20
354
07
LILLOOET RIVER
373
22
380
78
389
43
404
17
415
27
420
87
430
13
435
00
440
00
Gau
ge 0
8M
G00
5
199
1-7
6
199
1-7
8 199
1-1
199
1-3
1991-5
1991-6199
1-7
1991-8
199
1-9
199
1-1
0
199
1-1
1
199
1-1
7199
1-2
00
199
1-1
9
199
1-8
0
199
1-2
0
199
1-2
2
199
1-2
3
199
1-2
4
199
1-7
5
199
1-7
4
199
1-7
1
1991-67
199
1-6
5199
1-5
5
Bridg
e -
Hw
y
Bridg
e -
RailB
ridg
e -
Fore
st
Gre
en R
. C
onf.R
yan R
. C
onf.
Mill
er
Cr.
Co
nf.
Pem
bert
on
Cr.
Co
nf.
X-Sec
LI5
6
LI5
5
LI5
3
LI5
1_2
LI4
2_2
LI4
2
LI3
7
LI3
6_1
LI3
4
LI3
2
LI3
1
LI2
9
LI2
7
LI2
6
LI2
2
LI2
1
LI1
9_4
LI1
8
LI1
6
LI1
5_2
LI1
3
LI1
2
LI1
0
LI0
7
LI0
6
LI0
3
LI0
1_1
LI0
0_3
lake
Section 3
Engineering Works
LILLOOET RIVER GRAVEL MANAGEMENT PLAN FINAL REPORT
PEMBERTON VALLEY DYKING DISTRICT FEBRUARY 2007
KERR WOOD LEIDAL ASSOCIATES LTD. 3-1 Consulting Engineers 713.004
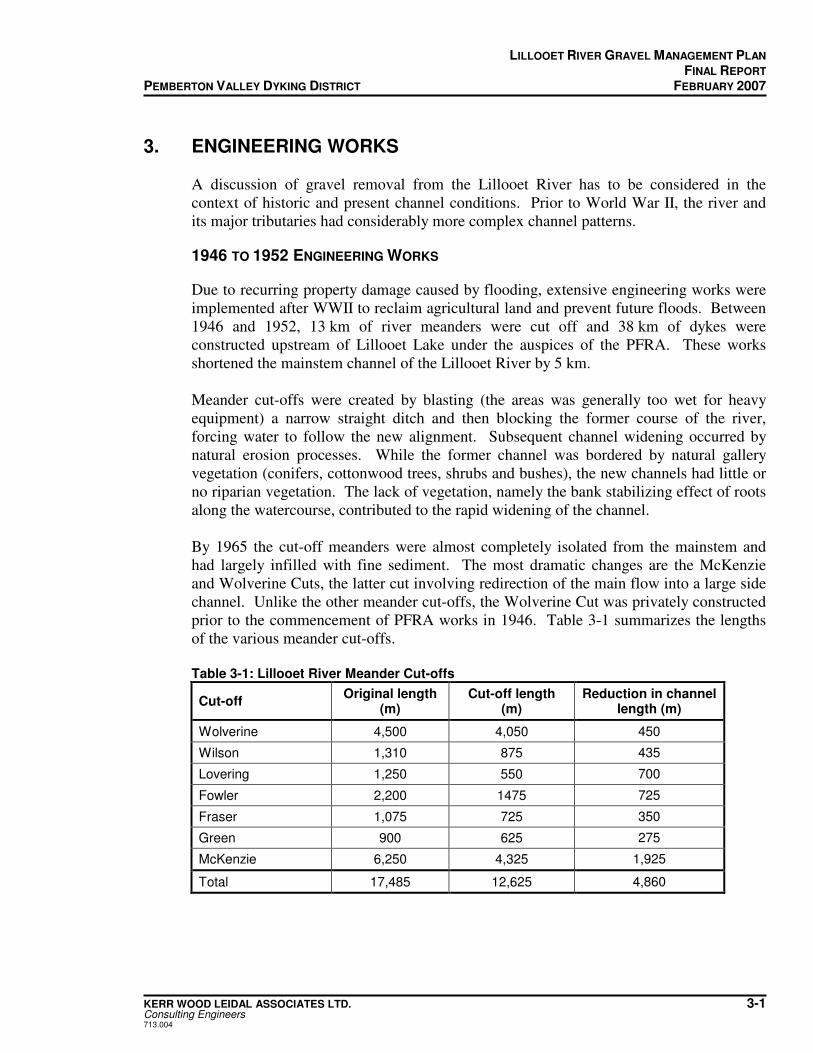
3. ENGINEERING WORKS A discussion of gravel removal from the Lillooet River has to be considered in the context of historic and present channel conditions. Prior to World War II, the river and its major tributaries had considerably more complex channel patterns.
1946 TO 1952 ENGINEERING WORKS
Due to recurring property damage caused by flooding, extensive engineering works were implemented after WWII to reclaim agricultural land and prevent future floods. Between 1946 and 1952, 13 km of river meanders were cut off and 38 km of dykes were constructed upstream of Lillooet Lake under the auspices of the PFRA. These works shortened the mainstem channel of the Lillooet River by 5 km. Meander cut-offs were created by blasting (the areas was generally too wet for heavy equipment) a narrow straight ditch and then blocking the former course of the river, forcing water to follow the new alignment. Subsequent channel widening occurred by natural erosion processes. While the former channel was bordered by natural gallery vegetation (conifers, cottonwood trees, shrubs and bushes), the new channels had little or no riparian vegetation. The lack of vegetation, namely the bank stabilizing effect of roots along the watercourse, contributed to the rapid widening of the channel. By 1965 the cut-off meanders were almost completely isolated from the mainstem and had largely infilled with fine sediment. The most dramatic changes are the McKenzie and Wolverine Cuts, the latter cut involving redirection of the main flow into a large side channel. Unlike the other meander cut-offs, the Wolverine Cut was privately constructed prior to the commencement of PFRA works in 1946. Table 3-1 summarizes the lengths of the various meander cut-offs. Table 3-1: Lillooet River Meander Cut-offs
Cut-off Original length
(m) Cut-off length
(m) Reduction in channel
length (m)
Wolverine 4,500 4,050 450
Wilson 1,310 875 435
Lovering 1,250 550 700
Fowler 2,200 1475 725
Fraser 1,075 725 350
Green 900 625 275
McKenzie 6,250 4,325 1,925
Total 17,485 12,625 4,860
LILLOOET RIVER GRAVEL MANAGEMENT PLAN FINAL REPORT
PEMBERTON VALLEY DYKING DISTRICT FEBRUARY 2007
KERR WOOD LEIDAL ASSOCIATES LTD. 3-2 Consulting Engineers 713.004
Additional engineering works included: � Lillooet Lake was lowered by 2.5 m in 1946 through dredging of the lake outlet at
Tenas Narrows and Lillooet Narrows. Volumes removed from these reaches were 3,000 m3 and 470,000 m3 respectively.
� The Green River was diverted along the foot of the mountain to join the mainstem
several kilometres below the old confluence. This remedied extreme backwater effects that occurred at the confluence of the Green River and the Lillooet River during floods.
� Drainage canals were constructed throughout the valley so that land owners could
drain their land with lateral ditches. A significant portion of the land base could not be used prior to the engineering works due to swampy conditions and in some cases, the drained land was situated several feet below the river banks.
� Major side channels that used to interflow between the Lillooet River and the
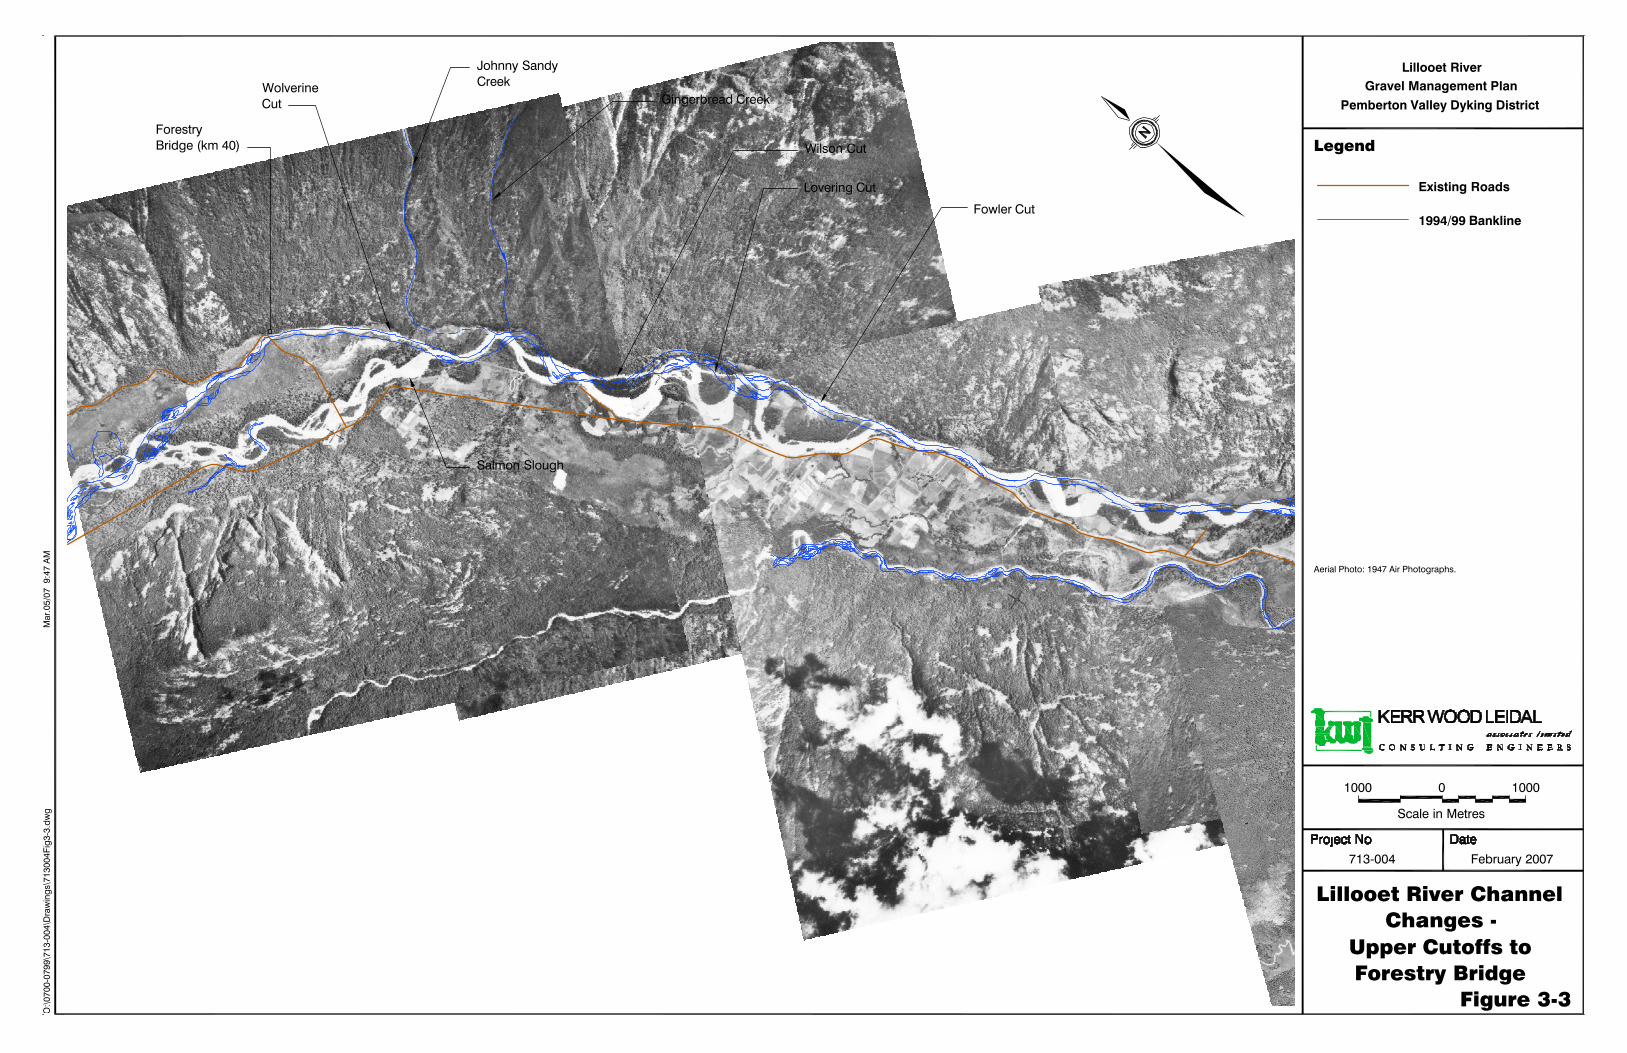
Birkenhead River were cut off and abandoned. Figures 3-1 through 3-3 are 1947 georeferenced air photographs of the Pemberton Valley from km 45 to the lake. The original meanders are visible, as are the excavated cut-offs, which would have been trenched within a year or two of the date of photography. Superimposed on the figures are 1994/1999 banklines of the river, demonstrating the extreme channel simplification that followed these works. The bankline upstream of the confluence with Miller Creek was mapped with a stereoplotter using 1994 air photographs (KWL, 2002). The 1999 bankline (downstream of Miller Creek) was obtained by digitizing a 1999 orthophoto of the area. The UBC Geography Department completed the 1999 channel mapping and georeferenced the 1947 airphotos.
CHANNEL RESPONSE
The response of the Lillooet River to the meander cut-offs, lake lowering and the blocking of side channels has been discussed in detail by KWL (2002). In summary the channel response was: � The extensive engineering works resulted in significant channel simplification,
particularly downstream of the BC Rail Bridge at km 15.5. From an ecological perspective, there has been a considerable reduction in rearing habitat due to the loss of side channel and off channel habitat.
� Construction of the meander cut-offs resulted in 3 to 4 m of channel degradation
upstream of the confluence with the Ryan River and Miller Creek (km 20).
LILLOOET RIVER GRAVEL MANAGEMENT PLAN FINAL REPORT
PEMBERTON VALLEY DYKING DISTRICT FEBRUARY 2007
KERR WOOD LEIDAL ASSOCIATES LTD. 3-3 Consulting Engineers 713.004
Downstream reaches also degraded (2 to 2.5 m) in response to the lowering of Lillooet Lake.
� The channel degradation has created a deeper, narrower channel. As a result, back
channels have been cut off and river-edge wetlands have dewatered. � Based on available documentation, the combined effects of lake lowering and channel
straightening increased the channel gradient sufficiently that the limit of gravel transport migrated downstream about 8 km.
Lillooet RiverGravel Management Plan
Pemberton Valley Dyking District
Legend
Lillooet River ChannelChanges -
Lillooet Lake toPemberton
Figure 3-1
713-004 February 2007
O:\0
700-
0799
\713
-004
\Dra
win
gs\7
1300
4Fig
3-3.
dwg
Mar
.05/
07 9
:47
AM
100001000
Scale in Metres
Pemberton Creek
Green River
Airport
BC Rail
North Arm
Birkenhead River
MOUNT CURRIE
km 8Aerial Photo: 1947 Air Photographs.
LillooetLake
Hig
hway
99
One-Mile Lake
VILLAGE OF PEMBERTON
Beem Bar
WSC Bar
Big Sky Bar
Existing Roads
1994/99 Bankline
Lillooet RiverGravel Management Plan
Pemberton Valley Dyking District
Legend
Lillooet River ChannelChanges -
Pemberton toUpper Cutoffs
Figure 3-2
713-004 February 2007
O:\0
700-
0799
\713
-004
\Dra
win
gs\7
1300
4Fig
3-3.
dwg
Mar
.05/
07 9
:47
AM
100001000
Scale in Metres
Aerial Photo: 1947 Air Photographs.
km 20
McKenzie Cut
McKenzie Lake
Green Cut
Fraser Cut
Miller Creek
Ryan River
Gamelin Creek
Erickson Bar
Voyageur Bar
1994/99 Bankline
Existing Roads
Lillooet RiverGravel Management Plan
Pemberton Valley Dyking District
Legend
Lillooet River ChannelChanges -
Upper Cutoffs toForestry Bridge
Figure 3-3
713-004 February 2007
O:\0
700-
0799
\713
-004
\Dra
win
gs\7
1300
4Fig
3-3.
dwg
Mar
.05/
07 9
:47
AM
100001000
Scale in Metres
Aerial Photo: 1947 Air Photographs.
Fowler Cut
Lovering Cut
Wilson Cut
Wolverine Cut
Forestry Bridge (km 40)
1994/99 Bankline
Existing Roads
Salmon Slough
Johnny SandyCreek
Gingerbread Creek
Section 4
Approach to Gravel Management
LILLOOET RIVER GRAVEL MANAGEMENT PLAN FINAL REPORT
PEMBERTON VALLEY DYKING DISTRICT FEBRUARY 2007
KERR WOOD LEIDAL ASSOCIATES LTD. 4-1 Consulting Engineers 713.004
4. APPROACH TO GRAVEL MANAGEMENT In Section 1.1, it was noted that there a number of ways by which ongoing bedload aggradation might be mitigated including raising the dykes and reconstructing the dykes with greater setbacks. The scope of this report is to investigate gravel removal as a means to manage aggradation. DFO has indicated a willingness to accept gravel removal on the Lillooet River to maintain the design freeboard on the dykes, provided that sufficient technical analysis has been completed to confirm that there would be flood protection benefits. The first step is to identify which dyke sections along the Lillooet River might be compromised over the next several decades due to channel aggradation. The review of dyke sections in this section is based on 2002 hydraulic modelling. However, it needs to be recognized that there is a need to review the hydrology (peak flow estimates) in view of the large magnitude flood of October 2003. In addition to a possible need to increase the design flood estimate, the October 2003 flood may have caused channel changes that would affect the flood profile. Ideally, the river modelling should be updated in the near future.
4.1 LILLOOET RIVER DYKES
Figure 1-1 illustrates the PVDD dyke locations along lower reaches of the Lillooet River. These include: � A 3.4 km dyke situated on the right bank of the Lillooet River upstream of the
Forestry Bridge. The lower 3 km of the dyke is known as the Forestry Dyke, while the upper 0.4 km is known as Smuks or Salmon Slough Dyke
� The Hungerford Dyke is about 2.5 km in length on the right bank to the confluence
with the Ryan River. The dyke is not tied into high ground at the downstream end and is therefore vulnerable to backwater flooding. The Hungerford Dyke is an extension of an old agricultural dyke that commences at about km 30. The agricultural dyke is not under the jurisdiction of PVDD and is therefore considered an orphan dyke.
� Below the confluence with Miller Creek, the Lillooet Dyke is situated on the right
bank to Highway 99. This dyke is approximately 8.4 km in length and protects Area 4. Area 4 is bounded by the right bank of Miller Creek, the right bank of the Lillooet River and the left bank of Pemberton Creek. Since Area 4 includes the Village of Pemberton, this is considered the most critical dyke.
LILLOOET RIVER GRAVEL MANAGEMENT PLAN FINAL REPORT
PEMBERTON VALLEY DYKING DISTRICT FEBRUARY 2007
KERR WOOD LEIDAL ASSOCIATES LTD. 4-2 Consulting Engineers 713.004
� A short section of dyke (0.25 km) runs along the right bank of the Lillooet River immediately below Highway 99. This dyke is known as the Adventure Ranch Dyke and ties into Airport Road. The access road acts as a dyke to the confluence with Pemberton Creek where it ties into the Pemberton Creek Dyke that runs along the left bank of Pemberton Creek.
� Ayers Dyke runs along the left bank of the Lillooet River upstream of Highway 99.
The dyke is approximately 1.4 km in length and ties into high ground at its upper end. This dyke cuts off the upstream end of North Arm Slough.
� Below Pemberton Creek, Airport Road acts as a non-standard dyke along the right
bank of the Lillooet River. This dyke does not extend to high ground at the downstream end. There is no dyke on the left bank downstream of Highway 99.
The 2002 hydraulic modelling results (Figure 2-1) can be used to establish where gravel removals are best suited. Priority areas are discussed below.
Upstream of the Forestry Bridge
The 2002 hydraulic modelling indicates that the Forestry Dyke had adequate capacity to pass the Qi200, but the amount of freeboard was inadequate over a 0.4 km section. Upgrading of the dyke was considered by KWL (2002), but this action was given a lower priority than reaches further downstream due to a low population on predominantly agricultural land. While gravel removals could be considered to lower the flood profile, the bedload transport rate is sufficiently high in this area (40,000 m3/year) that such action would be neither cost-effective nor likely acceptable from an environmental perspective. If further flood protection improvements are desired in this reach, dyke raising is probably the best approach.
Forestry Bridge to Miller Creek (km 40 to km 20)
Downstream of the Forestry Bridge, the 2002 hydraulic modelling indicates that the Q200 peak instantaneous flood level ranges between 1.25 m to 4 m below the height of the right bank. This level of protection decreases toward the confluence with the Ryan River. This situation reflects the amount of riverbed degradation that has occurred in response to channel straightening. Given the historic degradation and design flood levels, consideration of gravel removal is not presently required between km 20 and km 40.
Miller Creek to Pemberton Creek
The 2002 hydraulic modelling originally indicated that the Lillooet Dyke on the right bank did not require upgrading due to freeboard in excess of 0.3 m. However, an additional 0.3 m of freeboard was requested by MWLAP as a sediment allowance below
LILLOOET RIVER GRAVEL MANAGEMENT PLAN FINAL REPORT
PEMBERTON VALLEY DYKING DISTRICT FEBRUARY 2007
KERR WOOD LEIDAL ASSOCIATES LTD. 4-3 Consulting Engineers 713.004
Miller Creek (KWL, 2002). This increased freeboard indicated the need for further dyke raising to meet the Qi200 elevation plus 0.6 m freeboard. In April 2002, PVDD applied for FPAF funding to upgrade a section of the Lillooet Dyke. The funding was subsequently approved. Approximately 2.7 km of the Lillooet dyke was raised in September 2002 to meet the Qi200 elevation plus 0.6 m freeboard. The 2002 dyke raising work proved critical in preventing flooding of Area 4 during the October 2003 flood. A further 1.6 km of the Lillooet Dyke was subsequently raised in 2005. Some sections of the dyke still require upgrading to attain a freeboard of 0.6 m. Below Highway 99 are the Adventure Ranch Dyke and a short section of Airport Road that comprise part of the Area 4 dyke system. These dyke reaches require upgrading to meet the Qi200 elevation plus 0.6 m freeboard. This reach is a prime candidate for gravel removal as it is critical to maintain an appropriate level of flood protection to the Village of Pemberton. The existing level of flood protection is expected to be compromised by ongoing aggradation. The Ayers Dyke situated on the left bank upstream of Highway 99 was originally constructed to an agricultural standard (50-year return period flood) and is subject to flood overtopping during the design event.
Pemberton Creek to the Green River
Below Pemberton Creek, the Airport Road acts as a non-standard dyke along the right bank of the Lillooet River through most of this reach. The flood modelling shows that the road surface is up to 0.3 m below the design flood level (excluding freeboard). The dyke is open at the downstream end and much of the floodplain remains subject to backwater flooding. Further upgrading of this dyke has been considered primarily to protect the Pemberton Airport (Area 6). There is no dyke on the left bank through this reach. However, such a dyke has been considered over the past couple of decades. A dyke on the left bank would protect much of Area 7 and 8 (Mount Currie). Gravel removal through this reach can not currently be considered in the context of maintaining an appropriate freeboard on a dyke. However, the airport access road does act as a non-standard dyke along most of this reach. Hence, it would be appropriate to consider gravel removals if deposition is shown to locally raise flood levels. For example, local aggradation may cause flooding for the 100-year return period flood while adjacent areas along the access road may retain 0.2 m of freeboard. In this instance, it would be appropriate to remove gravel at the depositional area such that 0.2 m of freeboard was also provided at that site. Gravel deposition in this reach to 1997 reportedly resulted in a loss of approximately 20% of the cross sectional area downstream of the Pemberton Creek confluence at Big
LILLOOET RIVER GRAVEL MANAGEMENT PLAN FINAL REPORT
PEMBERTON VALLEY DYKING DISTRICT FEBRUARY 2007
KERR WOOD LEIDAL ASSOCIATES LTD. 4-4 Consulting Engineers 713.004
Sky Bar (Figure 4-1). Due to concerns of reduced flood conveyance, approval was granted by MWLAP and DFO to remove gravel from the bar.
Green River to Lillooet Lake
Below the Green River the river bed consists predominantly of sand and fine gravel. There are no dykes through this reach. Any removal in this reach would not have a long-term impact. Because of the reduced channel gradient (which is conducive to sand deposition) and the high load of suspended sediment in the river, any removal area would most likely be infilled by sand-sized sediment during the subsequent spring freshet.
Summary
The above discussion indicates that gravel removals should be considered from the Lillooet River between Miller Creek (km 20) and the Green River (km 8). This area is illustrated by Figures 4-1 through 4-3, which show relevant information such as design flood levels and cross-section locations superimposed on a 1999 orthophoto.
4.2 HOW MUCH GRAVEL TO REMOVE?
Section 4.1 identified that the critical area with respect to gravel management along the Lillooet River is between Miller Creek (km 20) and the Green River (km 8). The overall objective of a gravel management plan for the Lillooet River would therefore be to maintain an appropriate level of flood protection through this reach with strategic gravel removal. Development of a gravel management plan requires a good estimate of the gravel transport rate in the lower reaches of the river.
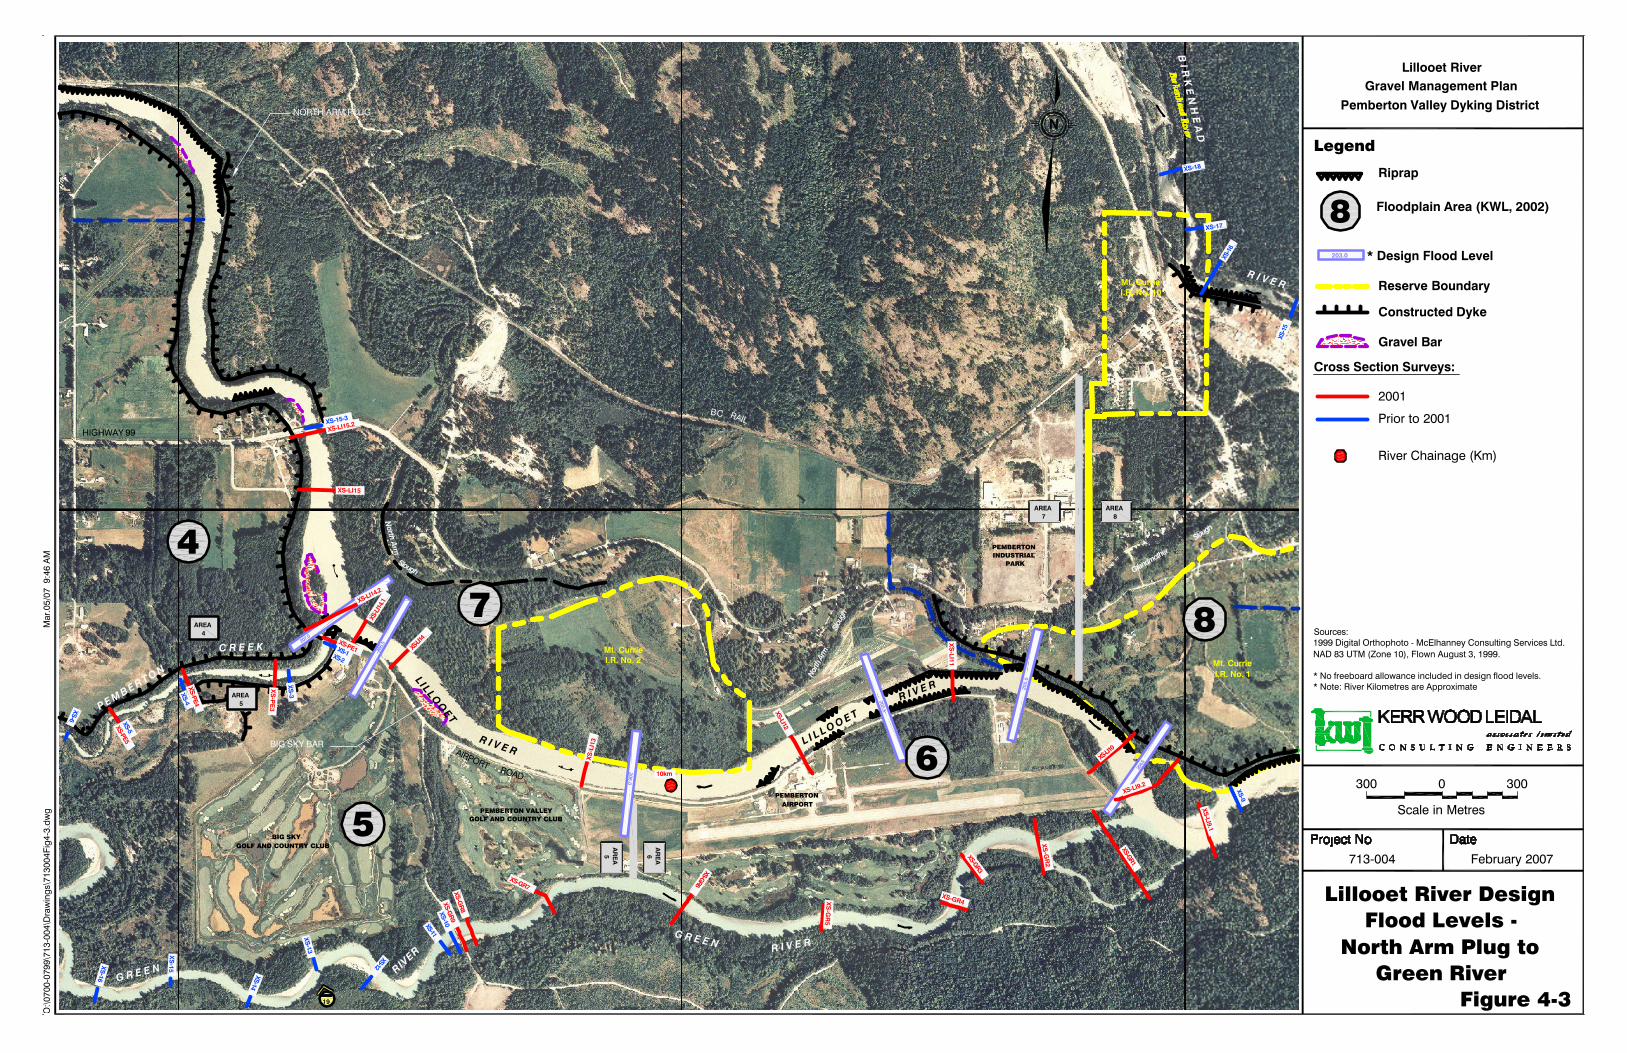
BEDLOAD TRANSPORT
Geomorphic analysis indicates that the annual bedload transport rate past the Forestry Bridge (km 40) is approximately 40,000 m3/year (KWL, 2002). This entire volume is not transported as far downstream as Area 4, nor is it evenly distributed along the channel. The gravel transport rate tends to fall off exponentially toward the downstream limit of entrainment. Figure 4-4 illustrates two hypothetical sedimentation distributions. The first case is linear transport with an equal distribution of the bedload along the channel. Under this scenario, approximately 15,000 m3/year of bedload is transported downstream of the confluence with Miller Creek at km 20. The more likely scenario is an exponential decrease in downstream bedload transport. In this case, it is thought that approximately 8,000 m3/year is transported downstream of km 20. This is considered a preliminary estimate.

LILLOOET RIVER GRAVEL MANAGEMENT PLAN FINAL REPORT
PEMBERTON VALLEY DYKING DISTRICT FEBRUARY 2007
KERR WOOD LEIDAL ASSOCIATES LTD. 4-5 Consulting Engineers 713.004
Forestry Bridge (km 40) to Miller Creek (km 20)
If approximately 8,000 m3 of gravel is transported past km 20 on an annual basis, then approximately 32,000 m3 is deposited upstream. This would represent an average bed level increase of 15 cm over a ten-year period. While the sedimentation will not be evenly distributed along the channel, there is not an immediate need for systematic gravel removal given the existing channel capacity. However, one-time gravel removal may be required over the next couple of decades if a specific area is shown to be accumulating gravel such that overbank flooding will occur. For example, the hydraulic modelling indicates that some localized flooding could occur on the right bank in the vicinity of section L42.2 (Station 9751, Figure 2-1). This section is coincident with a major depositional zone. Localized flooding has occurred here in the past but a lack of adjacent development indicates that the area is not of immediate concern. It should be noted that limited cross-sections were resurveyed between km 40 and km 20 in 2000 and that few of the cross-sections intersect the known zones of sedimentation. If a specific reach is believed to have a significantly reduced channel conveyance, a cross-section(s) can be surveyed and the information inserted into the Mike 11 hydraulic model to determine if overbank flooding would occur during the design flow.
Miller Creek (km 20) to the Green River (km 8)
There is significantly less freeboard downstream of Miller Creek compared to the degraded upstream reaches. While the estimated annual bedload transport below km 20 is not high (8,000 m3/year), a number of years without gravel removal can cause the bed of the river to progressively aggrade. Because the gravel component of the bedload is not transported downstream of km 6 to 8, it must slowly accumulate on the channel bed, causing an increase in the water surface level for a given flow. Such a description of bedload transport is overly simplistic, as the exchange between material transported by the river and that supplied by bank erosion or scour can be considerably more complex. For example, on the lower reaches of the Fraser River gravel reach it appears that gravel deposition is being accommodated by a net loss in predominantly sand-sized material (Church et al., 2001). However, the Lillooet River has a much simpler morphology with no side channels, extensive gravel bars or islands. As such, a simplistic pattern of overall bed aggradation and increased flood hazards is considered valid.
Removal Volume Options
One apparent solution to the downstream sedimentation is to annually remove about 40,000 m3 of gravel upstream of the Forestry Bridge. In this way, the gradual rise in the channel bed could be virtually eliminated (minor amounts of gravel would still be supplied from bank erosion and possibly from tributary creeks and rivers). However, the rate of gravel removal should not approach the average bedload transport rate at the Forestry Bridge because sufficient gravel is required for downstream reaches to maintain normal turnover and renewal of gravels (i.e. maintenance and renewal of fish habitat).
LILLOOET RIVER GRAVEL MANAGEMENT PLAN FINAL REPORT
PEMBERTON VALLEY DYKING DISTRICT FEBRUARY 2007
KERR WOOD LEIDAL ASSOCIATES LTD. 4-6 Consulting Engineers 713.004
Annual gravel removal in the order of 40,000 m3 may starve downstream reaches of gravel. Two alternative options for gravel removal are as follows: 1. Up to 10,000 m3 (25% of the estimated bedload) of gravel could be removed annually
from the numerous bars upstream of the Forestry Bridge. This would reduce the amount of gravel removal required downstream of km 20 (approximately 6,000 m3/year on average) and reduce sedimentation between the Forestry Bridge and km 20.
2. Gravel removal downstream of km 20 only (approximately 8,000 m3/year). Option 2 is preferred given the lack of development in the vicinity of the Forestry Bridge and the fact that ongoing removal would be more costly given the increased trucking costs. For the purpose of this study, gravel removal is considered downstream of km 20 only. The possible future need for gravel removal upstream of the Forestry Bridge could be reviewed from time to time.
Considerations of Variability in Gravel Transport
Two considerations are worthy of note with respect to the removal volume. First, the supply of gravel is variable, dependant primarily on the magnitude of peak flows. A number of years can pass when the peak flow does not exceed the mean annual flood. In these years, small quantities of gravel are transported. More importantly, the estimated bedload transport rate of 40,000 m3/year is an approximation only, and is subject to uncertainty. The average transport rate may vary by as much as ± 50%. A more precise estimate is difficult due to an incomplete record of gravel removal and the wide spacing of the cross-sections. Therefore, the annual bedload transport rate of 8,000 m3 should be recognized as a preliminary estimate of gravel transport below km 20.
CROSS-SECTIONAL CHANGES
Assuming that 8,000 m3/year of gravel is transported downstream of Miller Creek on average, bedload should be accumulating along the riverbed as significant amounts of gravel are not transported past the confluence with the Green River. However, KWL (2002) found almost no increase in bed levels downstream of km 20 in the past thirty years based on a comparison of repeated cross-section data. While such a trend is not apparent, there are several factors that explain the lack of observed aggradation: 1. Ten years of bedload transport would represent approximately 7 cm of aggradation
between km 20 and km 8 (based on an average channel width of 110 m). Although it is unrealistic to expect that the aggradation would be evenly distributed along the channel, this calculation illustrates that the bedload influx is modest and therefore relatively difficult to identify with repeated surveys.
LILLOOET RIVER GRAVEL MANAGEMENT PLAN FINAL REPORT
PEMBERTON VALLEY DYKING DISTRICT FEBRUARY 2007
KERR WOOD LEIDAL ASSOCIATES LTD. 4-7 Consulting Engineers 713.004
2. Bedload in irregularly meandering gravel-bed rivers tends to accumulate in
sedimentation zones that are separated by long stable reaches. This is the case with the Lillooet River where long stretches exhibit few changes due to extensive bank protection or semi-confinement by natural topographic features. Bedload tends to be transported through these stable reaches and accumulate where the channel is laterally unconfined. Because the cross-sections are spaced approximately 800 m apart, it is unrealistic to expect that the cross-sections would intersect all sedimentation zones. In fact, the cross-sections intersect very few of the sedimentation zones and are therefore not well suited for bedload transport estimates.
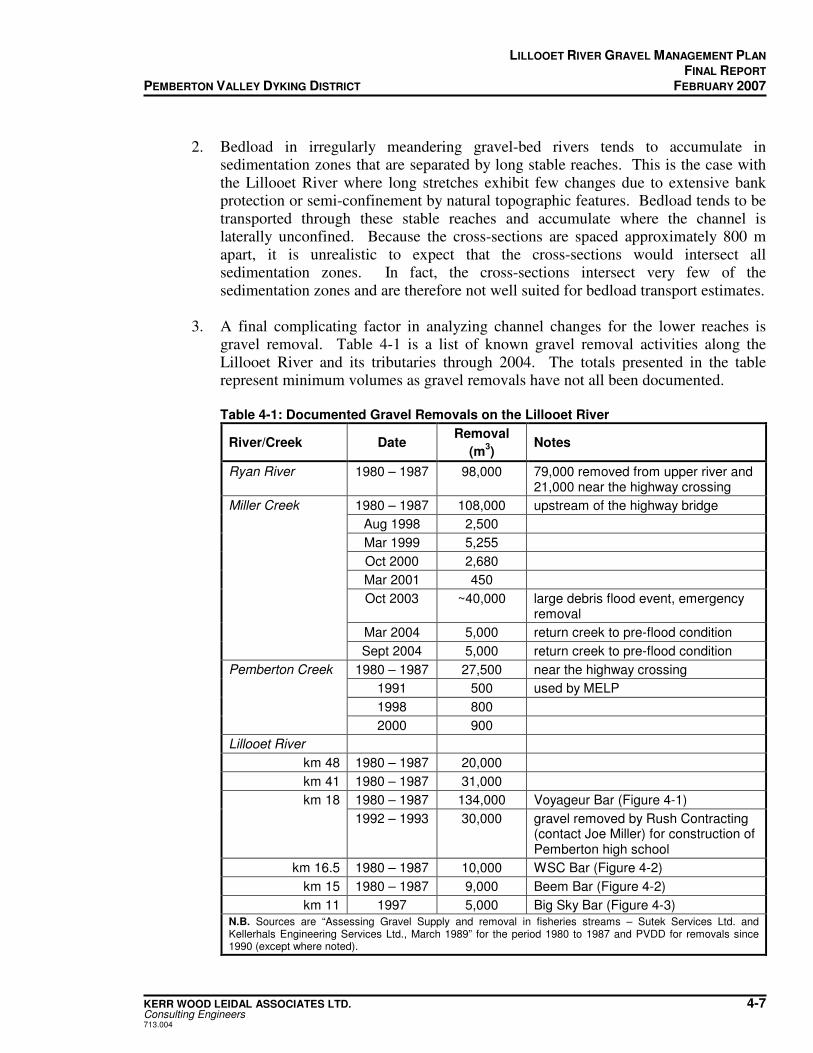
3. A final complicating factor in analyzing channel changes for the lower reaches is
gravel removal. Table 4-1 is a list of known gravel removal activities along the Lillooet River and its tributaries through 2004. The totals presented in the table represent minimum volumes as gravel removals have not all been documented.
Table 4-1: Documented Gravel Removals on the Lillooet River
River/Creek Date Removal
(m3)
Notes
Ryan River 1980 – 1987 98,000 79,000 removed from upper river and 21,000 near the highway crossing
Miller Creek 1980 – 1987 108,000 upstream of the highway bridge
Aug 1998 2,500
Mar 1999 5,255
Oct 2000 2,680
Mar 2001 450
Oct 2003 ~40,000 large debris flood event, emergency removal
Mar 2004 5,000 return creek to pre-flood condition
Sept 2004 5,000 return creek to pre-flood condition
Pemberton Creek 1980 – 1987 27,500 near the highway crossing
1991 500 used by MELP
1998 800
2000 900
Lillooet River
km 48 1980 – 1987 20,000
km 41 1980 – 1987 31,000
1980 – 1987 134,000 Voyageur Bar (Figure 4-1) km 18
1992 – 1993 30,000 gravel removed by Rush Contracting (contact Joe Miller) for construction of Pemberton high school
km 16.5 1980 – 1987 10,000 WSC Bar (Figure 4-2)
km 15 1980 – 1987 9,000 Beem Bar (Figure 4-2)
km 11 1997 5,000 Big Sky Bar (Figure 4-3) N.B. Sources are “Assessing Gravel Supply and removal in fisheries streams – Sutek Services Ltd. and Kellerhals Engineering Services Ltd., March 1989” for the period 1980 to 1987 and PVDD for removals since 1990 (except where noted).

LILLOOET RIVER GRAVEL MANAGEMENT PLAN FINAL REPORT
PEMBERTON VALLEY DYKING DISTRICT FEBRUARY 2007
KERR WOOD LEIDAL ASSOCIATES LTD. 4-8 Consulting Engineers 713.004
The past gravel removals are particularly important with respect to a lack of observed channel aggradation, as this activity can give the appearance of degradation or no change at a cross-section. Between 1980 and 2000 (the most recent survey data), the average volume of gravel removed downstream of km 20 was 9,000 m3/year. This value is most certainly a lower bound estimate as a number of undocumented small removals have probably occurred over the past two decades. During the same period, the cross-section data show no general rise in the channel bed. Because the average removal rate is very similar to the estimated bedload transport rate, it strongly indicates that aggradation in lower reaches can be effectively controlled by selected removals from gravel bars. Also of interest are the gravel volumes that have been removed from Miller Creek, the Ryan River and Pemberton Creek. These tributaries are potential sources of gravel for the mainstem of the Lillooet River but it appears that these creeks are being managed such that gravel does not accumulate along their lower reaches. As a result, gravel inputs from these tributaries are probably not significant and do not have to be accounted for in an analysis of cross-sectional changes. Backwater effects during high flows and low channel gradients may also limit gravel inputs from all three tributaries2.
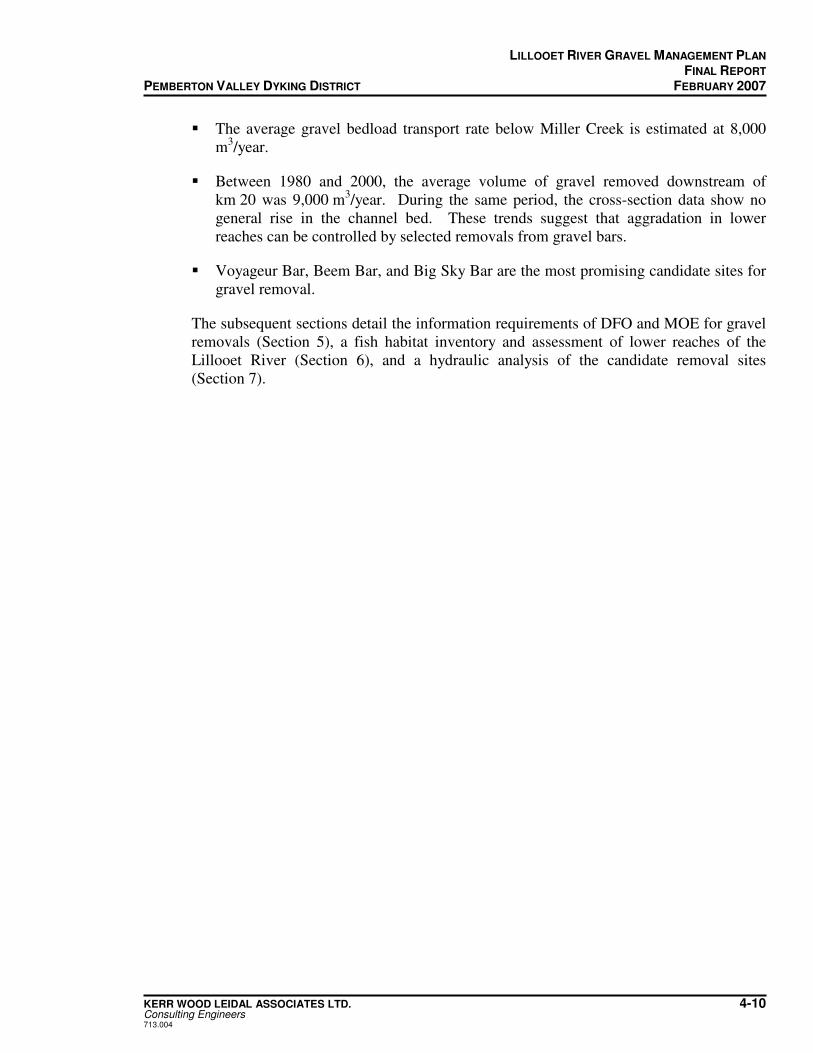
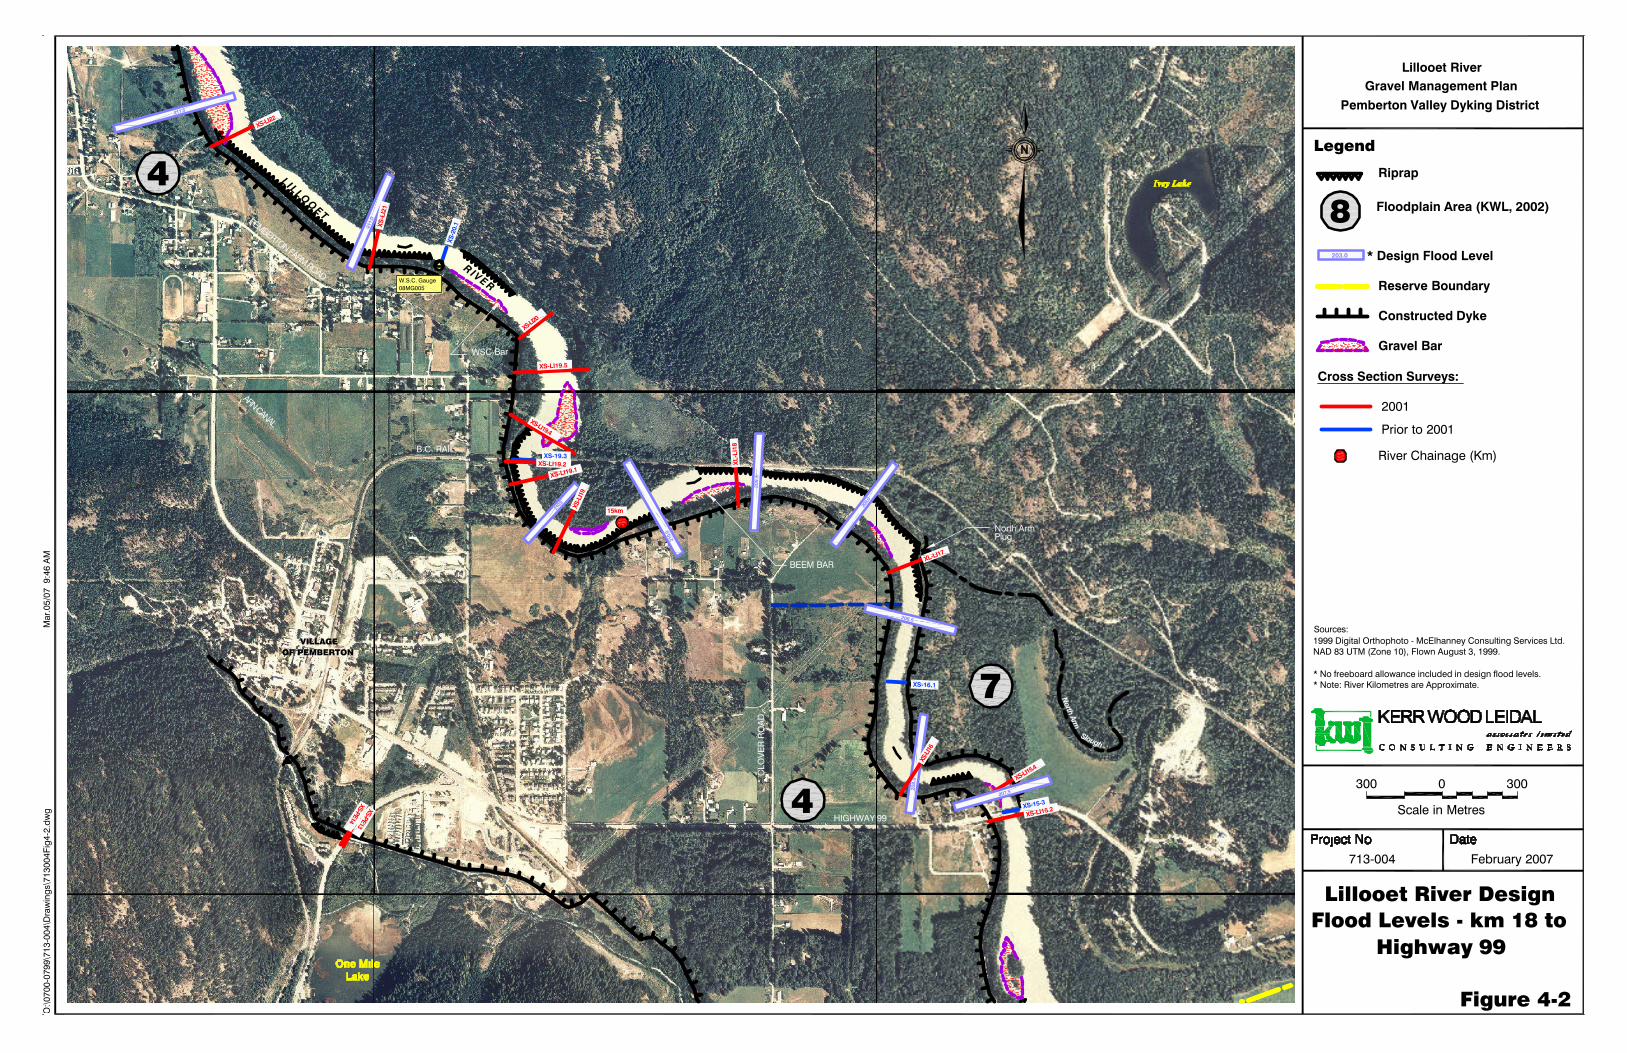
4.3 WHERE SHOULD GRAVEL BE REMOVED?
An effective gravel management plan for the Lillooet River is not as simple as randomly removing an average volume of 8,000 m3/year from gravel bars downstream of km 20. Gravel removals should be restricted to site specific locations where the most benefit is attained from a flood hazard perspective. Access for removals is also a significant issue in that existing gravel bars with road access for heavy equipment are the most viable locations for gravel removal (from the cost perspective of the PVDD). Downstream of Miller Creek gravel bars have been identified as follows: � on the right bank at km 18 (Voyageur Bar);
� on the right bank at km 16.5 immediately downstream of the WSC gauge;
� on the left bank immediately upstream of the BC Rail Bridge at km 15.8;
� on the right bank at km 15 (Beem Bar);
� on the right bank immediately upstream of the confluence of Pemberton Creek at km 11.75 (One-Mile Bar); and
� on the right bank immediately downstream of the junction of Airport Road with the Pemberton Creek confluence (Big Sky Bar, km 11).
2 Both the Ryan River and Miller Creek have a predominantly sand substrate at the confluence with
Lillooet River and are therefore not considered significant sources of gravel.

LILLOOET RIVER GRAVEL MANAGEMENT PLAN FINAL REPORT
PEMBERTON VALLEY DYKING DISTRICT FEBRUARY 2007
KERR WOOD LEIDAL ASSOCIATES LTD. 4-9 Consulting Engineers 713.004
Of these six bars, access difficulties (no road access and small side channels separate the bars from the bank) would probably preclude gravel removal at One-Mile Bar and the bar immediately upstream of the BC Rail Bridge. In addition, gravel removal at the BC Rail Bridge could increase flows toward the left bank and increase erosion at the bridge abutment. The WSC bar is also not a favourable site as local gravel removal could result in channel adjustments that impact discharge readings at the Water Survey of Canada (WSC) gauge.
Study Sites
There remain three bars from which gravel could be removed with few difficulties: Voyageur Bar, Beem Bar, and Big Sky Bar (Figures 4-1, 4-2 and 4-3). These three bars were chosen as the most likely candidate sites for gravel removal and are the focus of the subsequent sections of this report. There exists the possibility that gravel could continue to accumulate at the BC Rail Bar and One-Mile Bar such that the flood levels become compromised. However, gravel bars develop a maximum height corresponding to the elevation that the river currents can transport gravel-sized sediment, often near normal flood water levels. For example, XS 19.4 intersects the BC Rail Bar and no change in channel area occurred between 1985 and 2000. Nonetheless, both bars should continue to be observed in the event that an obvious problem develops, such as a change in river alignment that results in the abutments and approach fill of the BC Rail Bridge coming under direct attack. There is also the potential for gravel bars to start forming at new locations. As such, the proposed sites should be considered subject to change over the next decade. However, the identified gravel bars downstream of Miller Creek have remained remarkably stationary since at least 1971.
4.4 SUMMARY
The findings of this chapter are summarized as follows: � Between the Forestry Bridge (km 40) and Miller Creek (km 20), hydraulic modelling
indicates that the Q200 peak instantaneous flood level ranges between 1.25 m and 4 m below the height of the right bank. Gravel removals are not presently required through this reach.
� Gravel removals from the Lillooet River are most appropriate between Miller Creek (km 20) and the Green River (km 8). This reach includes the Lillooet Dyke on the right bank, which protects the Village of Pemberton from flooding. The desired elevation of the dyke crest is a minimum of the design flood level (Qi200) plus 0.6 m freeboard.
LILLOOET RIVER GRAVEL MANAGEMENT PLAN FINAL REPORT
PEMBERTON VALLEY DYKING DISTRICT FEBRUARY 2007
KERR WOOD LEIDAL ASSOCIATES LTD. 4-10 Consulting Engineers 713.004
� The average gravel bedload transport rate below Miller Creek is estimated at 8,000 m3/year.
� Between 1980 and 2000, the average volume of gravel removed downstream of km 20 was 9,000 m3/year. During the same period, the cross-section data show no general rise in the channel bed. These trends suggest that aggradation in lower reaches can be controlled by selected removals from gravel bars.
� Voyageur Bar, Beem Bar, and Big Sky Bar are the most promising candidate sites for gravel removal.
The subsequent sections detail the information requirements of DFO and MOE for gravel removals (Section 5), a fish habitat inventory and assessment of lower reaches of the Lillooet River (Section 6), and a hydraulic analysis of the candidate removal sites (Section 7).

211.
5
212.
0
212.
5213.
0
213.
5214.
0
214.
5
R I V E R
L I L L O O E T
R Y A N
R I V
E R
M i
l l e
rC
r e
e k
43
2
XS-MI7
XS-MI6
XS-MI5
XS-L
I28
XS-MI4
XS-MI3
XS-MI2
XS-M
I1
XS-RY4.1
XS-RY3
XS-RY2
XS-R
Y1
XS-L
I27
XS-L
I26.
1
XS
-LI2
6
XS-L
I25
XS
-LI2
4
XS-L
I22
XS-2
3
Riprap
2001
Prior to 2001
Cross Section Surveys:
* Design Flood Level203.0
8 Floodplain Area (KWL, 2002)
Lillooet RiverGravel Management Plan
Pemberton Valley Dyking District
Legend
Lillooet River DesignFlood Levels -
Miller Creek to km 17
Figure 4-1
713-004 February 2007
O:\0
700-
0799
\713
-004
\Dra
win
gs\7
1300
4Fig
4-1.
dwg
Mar
.05/
07 9
:46
AM
3000300
Scale in Metres
Sources:1999 Digital Orthophoto - McElhanney Consulting Services Ltd. NAD 83 UTM (Zone 10), Flown August 3, 1999.
* No freeboard allowance included in design flood levels.* Note: River Kilometres are approximate
Reserve Boundary
Constructed Dyke
MCKENZIE LAKE
VOYAGEUR BAR
PEMBERTONMEADOWS
ROAD
Gravel Bar
20km
River Chainage (Km)
208.
0
208.5
209.0
209.
5
210.
0
210.5
211.
0
211.5
L I L L O O E T
R I V E R
4
4
7
VILLAGEOF PEMBERTON
HEMLOCK ST.
HAR
RO
W R
OAD
B.C. RAIL
ARN CANAL
North Arm
Slough
North ArmPlug
207.5
Riprap
2001
Prior to 2001
Cross Section Surveys:
* Design Flood Level203.0
8PEMBERTON FARM ROAD
XS-PE14
XS-PE13
XS-LI22
XS-L
I21
XS-LI2
0
XS-LI19.5
XS-LI19.4
XS-LI19.2
XS-LI19.1
XS-L
I19
XL-L
I18
XL-LI17
XS-L
I16
XS-LI15.4
XS-LI15.2
XS-2
0.1
XS-19.3
XS-16.1
XS-15-3
Floodplain Area (KWL, 2002)
Lillooet RiverGravel Management Plan
Pemberton Valley Dyking District
Legend
Lillooet River DesignFlood Levels - km 18 to
Highway 99
Figure 4-2
713-004 February 2007
O:\0
700-
0799
\713
-004
\Dra
win
gs\7
1300
4Fig
4-2.
dwg
Mar
.05/
07 9
:46
AM
3000300
Scale in Metres
Sources:1999 Digital Orthophoto - McElhanney Consulting Services Ltd. NAD 83 UTM (Zone 10), Flown August 3, 1999.
* No freeboard allowance included in design flood levels.* Note: River Kilometres are Approximate.
Reserve Boundary
CLO
VER
RO
AD
HIGHWAY 99
Constructed Dyke
Gravel BarWSC Bar
W.S.C. Gauge08MG005
BEEM BAR
15km
River Chainage (Km)
207.0
206.
5
P E M B E R T O N
C R E E K
L I L L O O E T
R I V E R
G R E E N R I V E R
19
4
7
5
AREA4
AREA5
BIG SKYGOLF AND COUNTRY CLUB
PEMBERTON VALLEYGOLF AND COUNTRY CLUB
North Arm
Slough
XS
-PE
3
XS-PE4
XS-LI15.2
XS-LI15
XS-LI14.2
XS-L
I14.1
XS-LI1
4
XS-L
I13
XS-GR9
XS-GR
8
XS-GR7
XS-PE5
XS-15-3
XS-6
XS-5
XS-4
XS-3
XS-2
XS-1
XS-16
XS-15
XS-14
XS-13
XS-12
XS-11XS-10
XS-PE1
204.5
205.
0
205.5
Mt. CurrieI.R. No. 10
Mt. CurrieI.R. No. 1
Mt. CurrieI.R. No. 2
B I R
K E N H
E A D
R I V E R
L I L L O O E T
R I V E R
G R E E NR I V E R
6
8
AREA8
AREA7
206.0
AR
EA
6
AR
EA
5
North
Arm
Slou
gh
PEMBERTONAIRPORT
PEMBERTONINDUSTRIAL
PARKGran
dmother
Slough
XS-18
XS-17
XS-1
6
XS-1
5
XS-9
XS-LI12
XS
-LI11
XS-LI1
0
XS-LI9.2
XS
-GR
5
XS-GR4
XS-GR3
XS
-GR
2
XS-GR1
XS-LI9.1
XS-GR6
Riprap
2001
Prior to 2001
Cross Section Surveys:
* Design Flood Level203.0
8 Floodplain Area (KWL, 2002)
Lillooet RiverGravel Management Plan
Pemberton Valley Dyking District
Legend
Lillooet River DesignFlood Levels -
North Arm Plug toGreen River
Figure 4-3
713-004 February 2007
O:\0
700-
0799
\713
-004
\Dra
win
gs\7
1300
4Fig
4-3.
dwg
Mar
.05/
07 9
:46
AM
3000300
Scale in Metres
Sources:1999 Digital Orthophoto - McElhanney Consulting Services Ltd. NAD 83 UTM (Zone 10), Flown August 3, 1999.
* No freeboard allowance included in design flood levels.* Note: River Kilometres are Approximate
Reserve Boundary
Constructed Dyke
Gravel Bar
AIRPORT
BIG SKY BAR
HIGHWAY 99
ROAD
BC RAIL
NORTH ARM PLUG
10km
River Chainage (Km)
O:\713-004\geomorph\transport.xls
Figure 4-4
Distribution of Sedimentation Along Lillooet River
0
5
10
15
20
25
30
35
40
45
0 5 10 15 20 25 30 35 40 45
DISTANCE UPSTREAM FROM LILLOOET LAKE (km)
GR
AV
EL
LO
AD
(1
03 m
3 a
-1)
linear transport
theorized transport
Section 5
Regulatory Requirements

LILLOOET RIVER GRAVEL MANAGEMENT PLAN FINAL REPORT
PEMBERTON VALLEY DYKING DISTRICT FEBRUARY 2007
KERR WOOD LEIDAL ASSOCIATES LTD. 5-1 Consulting Engineers 713.004
5. REGULATORY REQUIREMENTS Both Land and Water BC and Fisheries and Oceans Canada have a number of regulatory requirements for works in and about watercourses, which apply to proposed gravel removal projects. This section provides a summary of these information requirements.
5.1 BC MINISTRY OF ENVIRONMENT
Proposed gravel removals projects from streams in British Columbia require approval from MOE under Section 9 of the Water Act. When submitting an application for approval, the following information is typically required: 1. Site location map (1:20,000). 2. Overview map (1:5,000) indicating:
� location of proposed work in relation to adjacent watercourses; � all affected watercourses: � all major significant wildlife, wetland and flora habitat features; and � major transportation routes.
3. Detailed map (1:500) indicating:
� site topography; � all transportation routes; � location and extent of proposed removal; � cadastral property lot lines; � delineation of the top of bank; and � zoning and existing land-use of adjacent properties.
4. Detailed bioinventory of the site. 5. Description of works including:
� detailed drawings and descriptions of proposed works; and � schedule of works, which must be consistent within the appropriate instream work
window. 6. Fish habitat mitigation plan including the following:
� sediment, erosion and runoff control plan; � site monitoring plan; � letter of authorization for site monitor to stop works; � description of affected riparian vegetation; � description of affected fish habitat; and

LILLOOET RIVER GRAVEL MANAGEMENT PLAN FINAL REPORT
PEMBERTON VALLEY DYKING DISTRICT FEBRUARY 2007
KERR WOOD LEIDAL ASSOCIATES LTD. 5-2 Consulting Engineers 713.004
� acceptable fish habitat compensation plan where required including written approval from all affected landowners (compensation plans must be consistent the policy of no net loss as indicated in The Department of Fisheries and Oceans
Policy for the Management of Fish Habitat, 1986). Additional information required by MOE is as follows: � A copy of the Registered Survey Plan for the parcel of land or lot where the changes
are proposed (if available).
� Evidence of ownership of all property parcels affected by the proposed works. This may take the form of a certificate of title or recent property tax assessment if the land is owned privately, or a copy of the lease or licence of occupation if the land is held under a Crown land tenure. If tenure is required, an application for Crown land under the Land Act is also required.
� If the works are on private land or you must access private land to carry out the works, a signed landowner consent form and signed drawing must be submitted for each parcel of land affected.
An information package prepared by MOE for submitting an application is provided in Appendix A. Gravel removal is also usually subject to a provincial royalty. If the gravel is not being sold to the local market, this royalty is usually waived.
5.2 FISHERIES AND OCEANS CANADA
Proposed gravel removal projects from streams are also reviewed by the Habitat Management Branch of Fisheries and Oceans Canada (DFO) and require authorization under section 35(1) of the federal Fisheries Act. Authorization is required because gravel removals may potentially result in a harmful alteration, disruption or destruction (HADD) of fish habitat. When considering a project with the potential to result in adverse environmental effects, DFO must take into account the Fisheries Act, the DFO national Policy for the Management of Fish Habitat, and the Canadian Environmental Assessment
Act (CEAA). These acts and the national policy are briefly described below.
FISHERIES ACT
DFO has a legal obligation to protect fish and fish habitat under section 35(1) of the federal Fisheries Act. Carrying out any project that could harmfully alter, disrupt or destroy fish habitat may constitute an offence under the Fisheries Act unless formally authorized by DFO. Gravel removals from the Lillooet River represent a type of project that would require a Fisheries Act Subsection 35(2) authorization from DFO.
LILLOOET RIVER GRAVEL MANAGEMENT PLAN FINAL REPORT
PEMBERTON VALLEY DYKING DISTRICT FEBRUARY 2007
KERR WOOD LEIDAL ASSOCIATES LTD. 5-3 Consulting Engineers 713.004
NATIONAL POLICY
The guiding principle of DFO’s national Policy stresses that there should be no net loss of fish habitat as a result of works in and about watercourses. Where gravel removals are proposed, the primary preference is to avoid such works to the greatest extent practicable (e.g. raising dykes or removing constrictions in the channel). Where avoidance and mitigation cannot eliminate HADD, an authorization is required before the gravel removal can proceed.
CEAA
DFO must also take into account CEAA when reviewing proposed gravel removal projects. The requirement of formal DFO authorization triggers CEAA, and obliges DFO to conduct a CEAA environmental assessment and screening of the project. This typically requires that the proponent provide a detailed environmental assessment report covering all aspects of the project. CEAA also requires federal authorities with a CEAA trigger to canvass other federal authorities and First Nations to determine their interest and jurisdiction with respect to the project.
INFORMATION REQUIREMENTS
DFO requires a detailed environmental assessment of the proposed project when reviewing a proposed gravel removal project. The environmental assessment must include a comprehensive management plan with the objective of providing a strategy to manage the flood risks associated with the river in a rational and environmentally sensitive manner. DFO generally requires the following information to be included with the application: � survey data; � river hydrology and flood frequency analysis; � identification of opportunities where channel capacity can be improved through other
alternative strategies, thereby avoiding or minimizing the need for gravel removal; � identification of areas where the gravel bed is stable or where gravel removal will not
provide greater flood capacity; � clear evidence that the gravel removal project will result in a flood or erosion benefit; � fish habitat inventory showing the extent of fish utilization as well as spawning,
rearing and food production areas; and � fish habitat compensation plans if deemed necessary. DFO is in the process of producing a formal document pertaining to gravel removal projects that identifies information needs and environmental monitoring requirements.

LILLOOET RIVER GRAVEL MANAGEMENT PLAN FINAL REPORT
PEMBERTON VALLEY DYKING DISTRICT FEBRUARY 2007
KERR WOOD LEIDAL ASSOCIATES LTD. 5-4 Consulting Engineers 713.004
5.3 ADDITIONAL AGENCIES
A Navigable Waters Protection Act (NWPA) application must also be submitted to the Canadian Coast Guard, as the Lillooet River is a navigable watercourse. The NWPA is designed to protect Canada’s navigable waters by prohibiting the building or placement of any "works" that may interfere with navigation. This application is usually only an issue when instream works such as large woody debris structures are proposed.
Section 6
Fish Habitat
LILLOOET RIVER GRAVEL MANAGEMENT PLAN FINAL REPORT
PEMBERTON VALLEY DYKING DISTRICT FEBRUARY 2007
KERR WOOD LEIDAL ASSOCIATES LTD. 6-1 Consulting Engineers 713.004
6. FISH HABITAT This section presents the results of habitat assessment and fish sampling at five gravel bar sites in the Lillooet River between August 2003 and June 2004. The purpose of the sampling was to assess the habitat characteristics of gravel bars in the main channel and evaluate the use of bar habitats by fish. Gravel bars are sediment accumulation zones and represent major morphological units within the main channel. Their importance as habitat for resident and anadromous fish has not been examined previously for the Lillooet River. Relatively little fisheries information is available for this reach of the Lillooet River, which is in contrast to reaches downstream of Lillooet Lake and the Birkenhead River. The lack of prior study, in part, is because high turbidity throughout the year is problematic for habitat and stock assessment. Moreover, engineering works over the past century have significantly simplified channel morphology and reduced habitat complexity, particularly side channels, off-channel sloughs, and wetlands. In light of current interest for gravel extraction by bar scalping in the main channel, this study attempted to evaluate the importance of gravel bars as habitat for fish. The scope of this study was limited to gravel bars in the main channel, rather than a comprehensive evaluation of all riverine habitats with potential fisheries value.
6.1 PREVIOUS STUDIES
The Lillooet River system represents an important watercourse for anadromous salmonid species, freshwater trout and char, and resident non-salmonids. The majority of previous studies have examined the lower river between Lillooet Lake and Harrison Lake. The Birkenhead River, draining into Lillooet Lake at its northwest end, also has received considerable study due mainly to large escapements of sockeye salmon. The focus of studies has been salmon stock assessment and habitat enhancement. Upstream of Lillooet Lake, relatively few studies have been carried out. Bailey (1979) included the reach upstream of Lillooet Lake in a study of chinook salmon enhancement opportunities, although emphasis was on the Birkenhead and lower the Lillooet River. As well, a Lillooet River wildstock inventory funded by Habitat Conservation Trust Fund (1993/94) included a few sites above Lillooet Lake. KWL has been unable to obtain any details of this inventory to date. Upstream of Lillooet Lake, the river supports salmonid populations of chinook salmon (Oncorhynchus tshawytscha), coho salmon (O. kisutch), sockeye salmon (O. nerka), rainbow trout (O. mykiss), cutthroat trout (O. clarki), Dolly Varden char (Salvelinus
malma), and mountain whitefish (Prosopium williamsoni; source: FISS database). The river is accessible to anadromous fish upstream to a falls approximately 16 km above Meager Creek.

LILLOOET RIVER GRAVEL MANAGEMENT PLAN FINAL REPORT
PEMBERTON VALLEY DYKING DISTRICT FEBRUARY 2007
KERR WOOD LEIDAL ASSOCIATES LTD. 6-2 Consulting Engineers 713.004
No information is available on salmon spawning distribution due to high turbidity throughout the year. Tributary spawning is typically limited by steep valley walls on the north (left) bank, and by river training works along the south (right) bank. Bailey (1979) reported coho salmon spawning in several small unnamed tributaries, but no spawning reports are available and stock sizes were believed to be very low. Coho salmon runs also were noted in Miller Creek, the Ryan River, and Salmon Slough3 on the right bank (October through December), and Johnny Sandy Creek on the left bank (October through January). Bailey (1979) found the majority of coho smolts in sloughs, backwaters, and tributaries to the mainstem river. Sockeye salmon runs were noted by Bailey (1979) in the Ryan River and Johnny Sandy Creek4 (October through November). There are no documented records of salmon spawning within the main channel. Based on salmonid escapement records available for the period 1953 to 1992, the highest escapement numbers in the upper Lillooet River are for coho salmon, followed by chinook salmon (source: nuSEDS v1.0, Fisheries and Oceans Canada). Overall, relatively fewer escapement estimates are available for the Lillooet River upstream of Lillooet Lake. Given the turbid conditions of the Lillooet River, stock size estimates are likely underestimated; the fisheries value of this reach remains unquantified. In terms of recreational fishing, local Pemberton residents fish for cutthroat trout in winter and early spring within deep pools along the north bank of the river.
6.2 APPROACH
The approach chosen for fish habitat assessment involved repeated sampling at multiple gravel bars and over a range of water levels to: 1. identify habitat units associated with gravel bar perimeters in the Lillooet River; 2. describe the physical characteristics of bar habitat units in terms of water depth,
velocity, and substrate size; 3. determine the species assemblage and density of fish found within distinct habitat
units; and 4. evaluate the relative importance of gravel bars as habitat for fish. Five gravel bars were selected downstream of the Forestry Bridge (km 40) for repeated fish sampling. The bars were chosen based on accessibility (by car/foot), which also is an important criterion when determining site feasibility for gravel removal. The study sites, listed in an upstream direction, are:
3 Salmon Slough is an old channel of the Lillooet River that was abandoned during construction of the
Wolverine Cut (Figure 3-3). The slough is wetted throughout the year, receiving runoff flows from slopes on the west side of the valley.
4 Johnny Sandy Creek is a small tributary to Lillooet River that enters on the left bank about 3 km
downstream of the Forestry Bridge (km 37, Figure 3-3).

LILLOOET RIVER GRAVEL MANAGEMENT PLAN FINAL REPORT
PEMBERTON VALLEY DYKING DISTRICT FEBRUARY 2007
KERR WOOD LEIDAL ASSOCIATES LTD. 6-3 Consulting Engineers 713.004
� Big Sky Bar, accessed from Airport Road adjacent to Big Sky Golf and Country Club;
� Beem Bar, accessed from Clover Road with the permission of local property owners; � Water Survey of Canada (WSC) Bar, accessed from Pemberton Farm Road; � Voyageur Bar, accessed from Pemberton Meadows Road with the permission of
local property owners; and � Erickson Bar
5, accessed from Erickson Road with the permission of local property owners.
Big Sky Bar, Beem Bar, and Voyageur Bar are sites that pose the least logistical difficulty for gravel removal. Fish habitat assessment took place at the five gravel bar sites on three occasions: August 13/14, 2003; September 13, 2003; and May 15, 2004. An additional day of fish sampling on June 22, 2004 targeted small, tributary creek mouths to compare relative habitat value with gravel bars. The average hydrograph for the Lillooet River is shown in Figure 6-1 with the discharge on the sampling dates superimposed.
6.3 METHODS
HABITAT IDENTIFICATION
At each site, reconnaissance was carried out to identify distinct habitat units occurring around the bar perimeter. Fish sampling was then carried out within each distinct habitat unit in order to determine the use of gravel bar habitats by fish. Figure 6-2 shows a schematic representing the various habitat units encountered in the Lillooet River. A description of each is given in Table 6-1. A side channel located between the vegetated main bank and gravel bar conveys flow at moderate to high discharge and typically consists of run and pool habitats. At low flow, the side channel is dry at the upstream end and represents wetted back-channel habitat downstream. Side channels convey flow along the backside of most gravel bars in the Lillooet River at moderate to high discharge (Photo 11, Appendix B). The side channels are relatively narrow, between 5 and 15 m in width, and habitat units are channel spanning. This is in contrast to main channel habitat units that extend typically between 10 and 20 m offshore, at which point the habitat conditions (particularly velocity) change significantly. At lower flow, side channels are dry at the upstream end but retain wetted back-channel habitat at the downstream end.
5 Erickson Bar is a gravel bar attached to the right bank of Lillooet River at about km 25. The bar is
located immediately upstream of the McKenzie Cut (Figure 3-2).
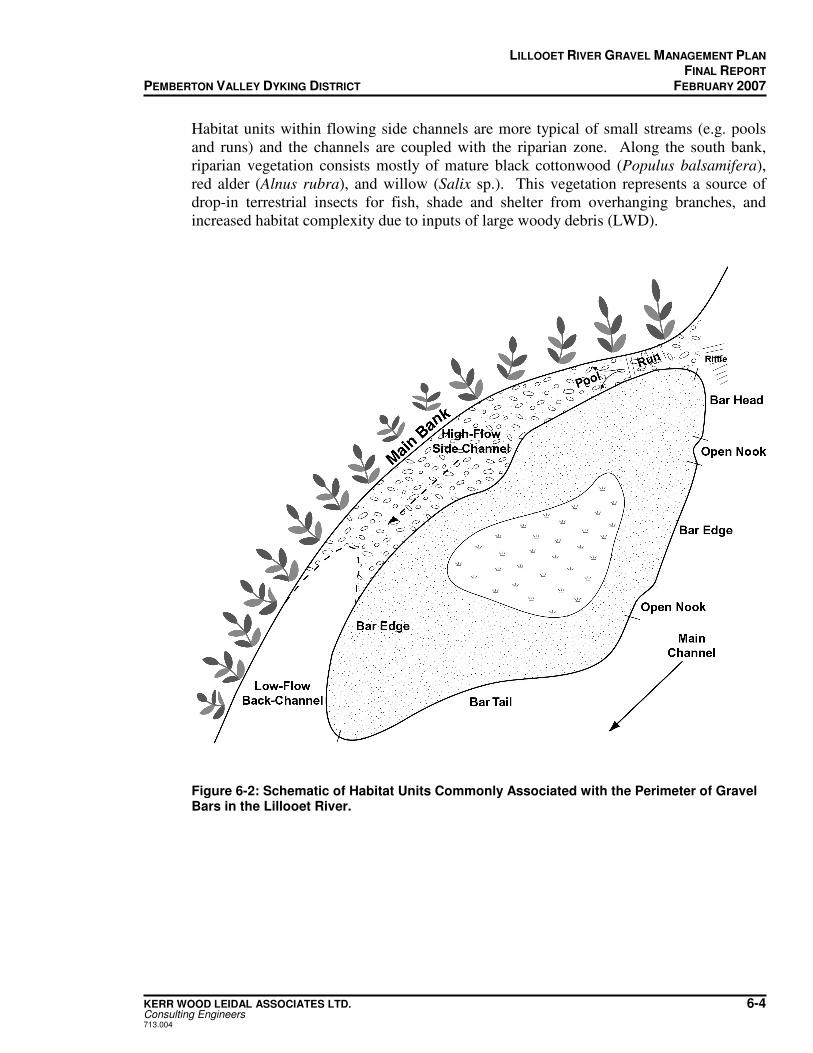
LILLOOET RIVER GRAVEL MANAGEMENT PLAN FINAL REPORT
PEMBERTON VALLEY DYKING DISTRICT FEBRUARY 2007
KERR WOOD LEIDAL ASSOCIATES LTD. 6-4 Consulting Engineers 713.004
Habitat units within flowing side channels are more typical of small streams (e.g. pools and runs) and the channels are coupled with the riparian zone. Along the south bank, riparian vegetation consists mostly of mature black cottonwood (Populus balsamifera), red alder (Alnus rubra), and willow (Salix sp.). This vegetation represents a source of drop-in terrestrial insects for fish, shade and shelter from overhanging branches, and increased habitat complexity due to inputs of large woody debris (LWD).
Figure 6-2: Schematic of Habitat Units Commonly Associated with the Perimeter of Gravel Bars in the Lillooet River.
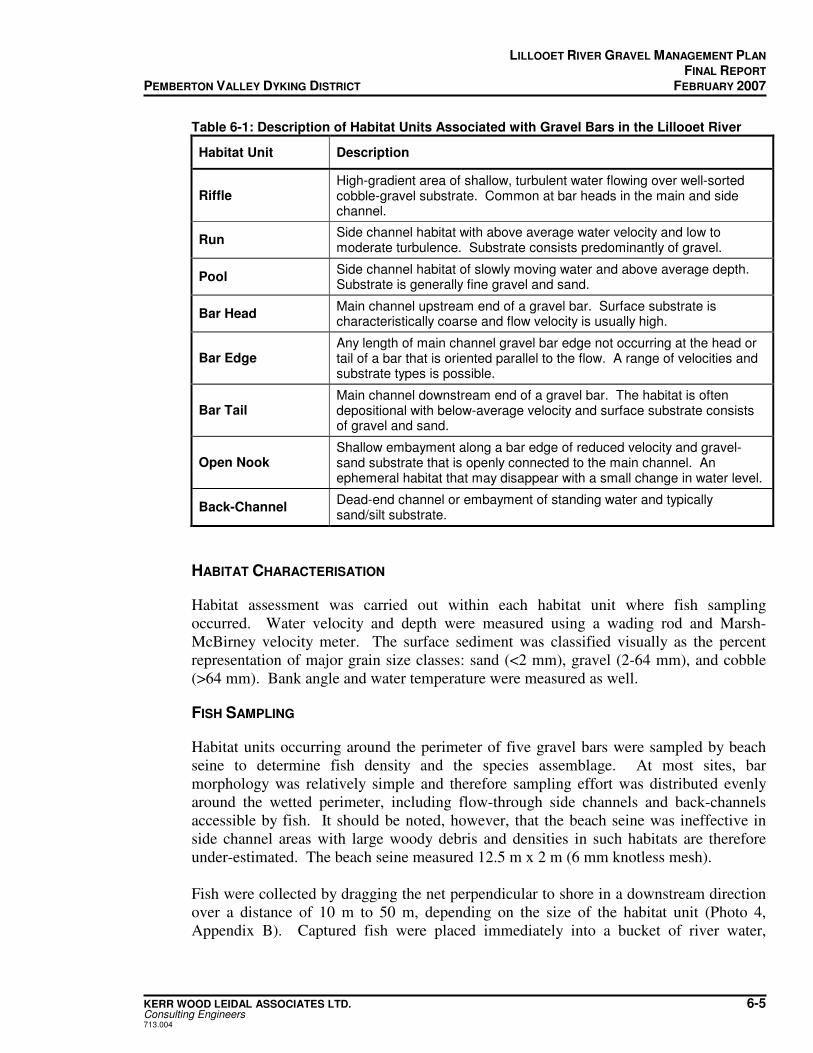
LILLOOET RIVER GRAVEL MANAGEMENT PLAN FINAL REPORT
PEMBERTON VALLEY DYKING DISTRICT FEBRUARY 2007
KERR WOOD LEIDAL ASSOCIATES LTD. 6-5 Consulting Engineers 713.004
Table 6-1: Description of Habitat Units Associated with Gravel Bars in the Lillooet River
Habitat Unit Description
Riffle High-gradient area of shallow, turbulent water flowing over well-sorted cobble-gravel substrate. Common at bar heads in the main and side channel.
Run Side channel habitat with above average water velocity and low to moderate turbulence. Substrate consists predominantly of gravel.
Pool Side channel habitat of slowly moving water and above average depth. Substrate is generally fine gravel and sand.
Bar Head Main channel upstream end of a gravel bar. Surface substrate is characteristically coarse and flow velocity is usually high.
Bar Edge Any length of main channel gravel bar edge not occurring at the head or tail of a bar that is oriented parallel to the flow. A range of velocities and substrate types is possible.
Bar Tail Main channel downstream end of a gravel bar. The habitat is often depositional with below-average velocity and surface substrate consists of gravel and sand.
Open Nook Shallow embayment along a bar edge of reduced velocity and gravel-sand substrate that is openly connected to the main channel. An ephemeral habitat that may disappear with a small change in water level.
Back-Channel Dead-end channel or embayment of standing water and typically sand/silt substrate.
HABITAT CHARACTERISATION
Habitat assessment was carried out within each habitat unit where fish sampling occurred. Water velocity and depth were measured using a wading rod and Marsh-McBirney velocity meter. The surface sediment was classified visually as the percent representation of major grain size classes: sand (<2 mm), gravel (2-64 mm), and cobble (>64 mm). Bank angle and water temperature were measured as well.
FISH SAMPLING
Habitat units occurring around the perimeter of five gravel bars were sampled by beach seine to determine fish density and the species assemblage. At most sites, bar morphology was relatively simple and therefore sampling effort was distributed evenly around the wetted perimeter, including flow-through side channels and back-channels accessible by fish. It should be noted, however, that the beach seine was ineffective in side channel areas with large woody debris and densities in such habitats are therefore under-estimated. The beach seine measured 12.5 m x 2 m (6 mm knotless mesh). Fish were collected by dragging the net perpendicular to shore in a downstream direction over a distance of 10 m to 50 m, depending on the size of the habitat unit (Photo 4, Appendix B). Captured fish were placed immediately into a bucket of river water,
LILLOOET RIVER GRAVEL MANAGEMENT PLAN FINAL REPORT
PEMBERTON VALLEY DYKING DISTRICT FEBRUARY 2007
KERR WOOD LEIDAL ASSOCIATES LTD. 6-6 Consulting Engineers 713.004
identified to species, counted, and measured to fork length. A proportion of fish representing each species was weighed as well. Fish were released promptly after processing. Low fish densities associated with gravel bars prompted exploratory sampling at the mouths of several tributary creeks on June 22, 2004. The sampling was intended to evaluate fish use of other habitats in the river relative to gravel bars. Fish were collected by electro-shocking because the beach seine was not effective in such habitats. Stop-nets were used to isolate areas of channel in order to estimate fish density. Mr. Mario Chartrand, owner/president of the Canadian Voyageur Canoe Company, assisted with this sampling and provided useful local knowledge of habitats where he has observed fish over his 16-year operating history on the Lillooet River. An un-named tributary immediately downstream of Gingerbread Creek and McKenzie Creek (Figures 3-2 and 3-3) were sampled at this time. Additional tributary mouths were examined, including Gamelin Creek (Figure 3-2), but high water levels prohibited fish sampling. Voucher specimens of coho salmon, chinook salmon, and mountain whitefish were examined by Dr. Don McPhail (Zoology, Univ. British Columbia) to confirm species identification. Some bull trout may have been mistaken for Dolly Varden because the two species are extremely difficult to differentiate. No confirmed records of bull trout were found for this reach of the Lillooet River (FishWizard and FISS databases). However, Mr. Fred Wells of the Lil’wat Fisheries Commission, who assisted with fish sampling on August 13, 2003, believes that bull trout are present. All fish in question are referred to as Dolly Varden in this report. Finally, the two species of sculpin (Cottus
asper and C. aleuticus) are not differentiated reliably at the youngest life stages and are therefore grouped together for data reporting.
INVERTEBRATE SAMPLING
Invertebrate sampling was carried out at the five sites to characterize gravel bar invertebrate productivity in the Lillooet River. Benthic invertebrates (living at the substrate-water interface) are an important food source for fish, as well as being excellent indicators of site conditions and highly sensitive to habitat disturbance. In the event that gravel removal takes place, these samples will be useful for biological monitoring and impact assessment. Benthic invertebrates were collected in March 2004 using a Surber net (250 µm mesh, 0.09 m2 sampling area) at approximately 25 cm water depth. Three replicate samples were collected at each site, with a sample collected near the upstream head, middle, and downstream tail of each gravel bar. Samples were preserved in 4% formalin and later processed at the Fisheries and Oceans Canada Laboratory in Cultus Lake by Ms. Shirley Fuchs. Sample processing involved wet-sieving (250 µm mesh) and sorting with a dissecting microscope. Invertebrates were identified to family or genus and preserved in 70% isopropanol. Analyses are based on family-level identification only (most families were represented by only one or a few genera).
LILLOOET RIVER GRAVEL MANAGEMENT PLAN FINAL REPORT
PEMBERTON VALLEY DYKING DISTRICT FEBRUARY 2007
KERR WOOD LEIDAL ASSOCIATES LTD. 6-7 Consulting Engineers 713.004
6.4 STUDY SITES
BIG SKY BAR
Big Sky Bar was the most downstream site examined and is situated on the south bank of the Lillooet River (Figure 4-3). The site was accessed from Airport Road opposite Big Sky Golf and Country Club. At relatively low flow on August 13, 2003 (~185 m3/s), the exposed bar measured 180 m in length and 60 m in maximum width. The wetted main channel averaged 65 m in width. A side channel situated between Big Sky Bar and the south bank conveyed flow at this discharge and measured 4 m in width upstream, 14 m at the mid-point, and 18 m at the most downstream end (Photos 1 and 3). At lower discharge on September 13, 2003 (~120 m3/s), the side channel did not convey water and only the most downstream area represented back-channel habitat with standing water and large woody debris (LWD). Interestingly, the channel also did not convey flow on May 15, 2004 when discharge exceeded 260 m3/s. These observations suggest gravel deposition occurred between September 2003 and May 2004, resulting in increased bar surface elevation and a reduced range in discharge over which flow is conveyed within the side channel. Gravel deposition at the site is consistent with the October 2003 flood, which is the flood of record and had an estimated return period of 200 years (additional details of this flood are provided in Section 7).
Habitat Characteristics
The surface of Big Sky Bar is unvegetated with scattered pieces of wood and tree stumps. Surface substrate along the main channel perimeter is primarily gravel-sized and with a low percentage of cobble (~10%). Isolated patches of a thin sand/silt veneer exist in areas of highest bar elevation. Around the downstream bar tail, a high percentage of sand is observed. The main channel bar perimeter is simple and consists primarily of shallow sloping bar edge habitat (4-10% slope) with velocity averaging 30 to 50 cm/s. The most downstream bar tail has a steeper bank slope (~12%) and lower flow velocity (<30 cm/s) that provides hydraulically sheltered habitat for fish. At sufficiently high discharge for flow conveyance, the side channel consists of riffle habitat at the upstream end, pool and run habitat mid-way, and low velocity pool habitat downstream. At low flow, the wetted back-channel is shallow and consists of sand/silt substrate and LWD (Photo 2).
BEEM BAR
Beem Bar was accessed from Clover Road and is situated on the right (south) bank of the Lillooet River (Figure 4-2). At relatively low flow on August 13, 2003 (~185 m3/s), the exposed bar measured 75 m in maximum width and the wetted main channel averaged 60 m in width. A side channel situated between Beem Bar and the south bank conveyed flow at this discharge and the channel measured 10 m in width upstream, 8 m at the mid-point, and 13 m at the most downstream end. At lower discharge on September 13, 2003
LILLOOET RIVER GRAVEL MANAGEMENT PLAN FINAL REPORT
PEMBERTON VALLEY DYKING DISTRICT FEBRUARY 2007
KERR WOOD LEIDAL ASSOCIATES LTD. 6-8 Consulting Engineers 713.004
(~120 m3/s), several isolated ponds existed within the channel but only the most downstream area provided back-channel habitat for fish. Stranded fish fry were observed in these isolated ponds. At higher discharge on May 15, 2004 (260 m3/s), the side channel also did not convey flow. Similar to Big Sky Bar, the fact that the side channel was cut off from the main channel in May 2004 suggests that gravel deposition occurred post-sampling in August 2003. Again this is consistent with the record October 2003 flood.
Habitat Characteristics
Beem Bar has young willow (Salix sp.) established along the inner bar where surface elevation is highest. This vegetation effectively traps sand/silt at high flows, as noted in Photos 5 and 6. The most downstream tail had scattered pieces of wood on August 13, 2003 and a larger accumulation of LWD was exposed on September 13, 2003. Surface substrate along the main channel bar flank is predominantly clean gravel except at the bar tail, which consists of a thick sand/silt deposit. The main channel bar perimeter is simple and consists mostly of bar head, bar edge, and bar tail habitat. The bank slope ranges between 5 and 12% and velocity ranges between 50 and 85 cm/s. One open nook along the main channel had very low velocity (15 cm/s) and bank slope (2%). In August 2003, the side channel conveyed flow and featured pool and run habitat upstream and quiet pool habitat downstream (Photo 5). At lower flow, the wetted back-channel was shallow and consisted of sand/silt substrate with LWD. Mature vegetation (Populus balsamifera, Alnus rubra, Salix sp.) along the main bank provides shade to the channel in summer months and contributes LWD.
WATER SURVEY OF CANADA (WSC) BAR
WSC Bar is accessed from Pemberton Farm Road and is situated on the right bank of the Lillooet River immediately downstream of the WSC gauge (Figure 4-2). On August 13, 2003 (~185 m3/s), the exposed bar measured 220 m in length, 27 m in maximum width and the wetted main channel averaged 80 m in width. The gravel bar is attached to the main bank and a side channel was absent on all dates of sampling. A small area of wetted back-channel habitat was observed on May 15, 2004 (260 m3/s) containing a large amount of small woody debris.
Habitat Characteristics
Young willow (Salix sp.) is established along a rib of highest elevation on WSC Bar and mature black cottonwood (Populus balsamifera) line the main bank (Photo 8). LWD on the bar surface is mostly lacking and the surface substrate is predominantly gravel. Sampling on May 15, 2004 found a higher proportion of sand/silt occurring as isolated patches on the bar surface compared to sampling in August and September, 2003. On all dates of sampling, the main channel bar perimeter was simple and consisted of bar head, bar edge, and bar tail habitat. The bank slope ranged between 6 and 10% and
LILLOOET RIVER GRAVEL MANAGEMENT PLAN FINAL REPORT
PEMBERTON VALLEY DYKING DISTRICT FEBRUARY 2007
KERR WOOD LEIDAL ASSOCIATES LTD. 6-9 Consulting Engineers 713.004
velocity was consistently 20 to 50 cm/s. The back-channel observed on May 15, 2004 was 3 m in width and 14 m in length, and relatively shaded by trees on the main bank.
VOYAGEUR BAR
Voyageur Bar was accessed from Pemberton Farm Road with the permission of local property owners (Figure 4-1). On August 13, 2003 (~185 m3/s), the exposed bar measured 75 m in maximum width and the wetted main channel averaged 80 m in width. The gravel bar is attached to the main bank and a side channel was lacking on all dates of sampling. A small area of wetted back-channel habitat at the most downstream bar tail was observed on August 13, 2003. The back-channel contained LWD and was partially shaded by overhanging trees (Photo 9).
Habitat Characteristics
The core of Voyageur Bar is sparsely covered by willow (Salix sp.) and downstream, the bar surface consists predominantly of sand/silt substrate and scattered pieces of wood. The upper portion of bar has a mixed cobble-gravel surface substrate. Offshore, several pieces of LWD are embedded in the main channel bottom. The upper half of the bar consists of bar head and bar edge habitat along the main channel perimeter. The bank slope averages 7% and near-shore velocity averages 60 cm/s. The downstream half of Voyageur Bar consists of bar tail habitat that is hydraulically sheltered from the main flow. Consequently, the substrate is predominantly sand/silt and velocity is negligible (Photo 10). Bank slope is steep, generally exceeding 15%. The shallow back-channel observed on August 13, 2003 was approximately 8 m in width and 22 m in length, and shaded by trees on the main bank (Photo 9). A side channel forms on the back side of the bar during high flows only (Photo 11).
ERICKSON BAR
Erickson Bar was accessed from Erickson Road with the permission of local property owners (Figure 3-2). The short walk from the dyke to the river crosses vegetated floodplain habitat that is inundated only during above-average peak flows. On August 13, 2003 (~185 m3/s), the non-vegetated bar measured 20 m in maximum width and the wetted main channel averaged 65 m in width. No side channel habitat was observed at Erickson Bar.
Habitat Characteristics
The inner gravel bar is vegetated by willow (Salix sp.) established on a thick sand/silt deposit. The bar vegetation is dense and grades into black cottonwood (Populus
balsamifera) and red alder (Alnus rubra) on the floodplain. Along the outer edge of the exposed bar, surface substrate is predominantly gravel with a low proportion of cobble at the upstream bar head. Sampling on May 15, 2004 found a higher proportion of isolated sand/silt patches on the bar surface compared to sampling in August and September,
LILLOOET RIVER GRAVEL MANAGEMENT PLAN FINAL REPORT
PEMBERTON VALLEY DYKING DISTRICT FEBRUARY 2007
KERR WOOD LEIDAL ASSOCIATES LTD. 6-10 Consulting Engineers 713.004
2003. On all dates of sampling, the main channel bar perimeter was simple and consisted of bar edge habitat. The bank slope was approximately 7% and near-shore velocity averaged 50 cm/s.
6.5 GRAVEL BAR HABITAT USE BY FISH
DISTRIBUTIONAL PATTERNS
Over the course of sampling, 13 native species were identified, including 7 members of the family Salmonidae: � chinook salmon (Oncorhynchus tshawytscha) � coho salmon (O. kisutch) � sockeye salmon (O. nerka) � cutthroat trout (O. clarki) � rainbow trout (O. mykiss) � Dolly Varden char (Salvelinus malma) � mountain whitefish (Prosopium williamsoni) Non-salmonid species were redside shiner (Richardsonius balteatus), northern pikeminnow (Ptychocheilus oregonensis), peamouth chub (Mylocheilus caurinus), largescale sucker (Catostomus macrocheilus), prickly sculpin (Cottus asper), and coastrange sculpin (C. aleuticus). Brown catfish (Ameiurus nebulosus), a non-native species, was collected by electro-shocking in McKenzie Creek on June 22, 2004. Cutthroat trout and largescale sucker were captured only in tributary creeks on June 22, 2004. Examples of fish collected in this study are shown in Photo 12.
Table 6-2 summarises the distribution of fish species associated with gravel bars in the Lillooet River. Coho salmon were rarely captured by beach seine in the main channel, irrespective of sampling date. Chinook salmon were collected only in May 2004 whereas Dolly Varden char were absent from May samples but collected consistently in August and September 2003. The single sockeye salmon fry collected at WSC Bar in September 2003 is considered “accidental” because sockeye rear in lakes before migrating to the ocean. Only two individuals of rainbow trout were collected on August 13, 2003 from Big Sky Bar and WSC Bar. Mountain whitefish represented 75% of the total catch in the Lillooet River (523 of 701 fish collected) and were widely distributed at all gravel bars and on all dates of sampling. Sculpins were the second most abundant group captured, representing 14% of all fish. Sculpins were captured on all dates and at all gravel bars except Erickson Bar on May 15, 2004. Redside shiner was the third most common species, and many individuals had a visible parasite expressed as small black bumps on the body. Northern pikeminnow and peamouth chub each were relatively uncommon in habitats associated with gravel bars.
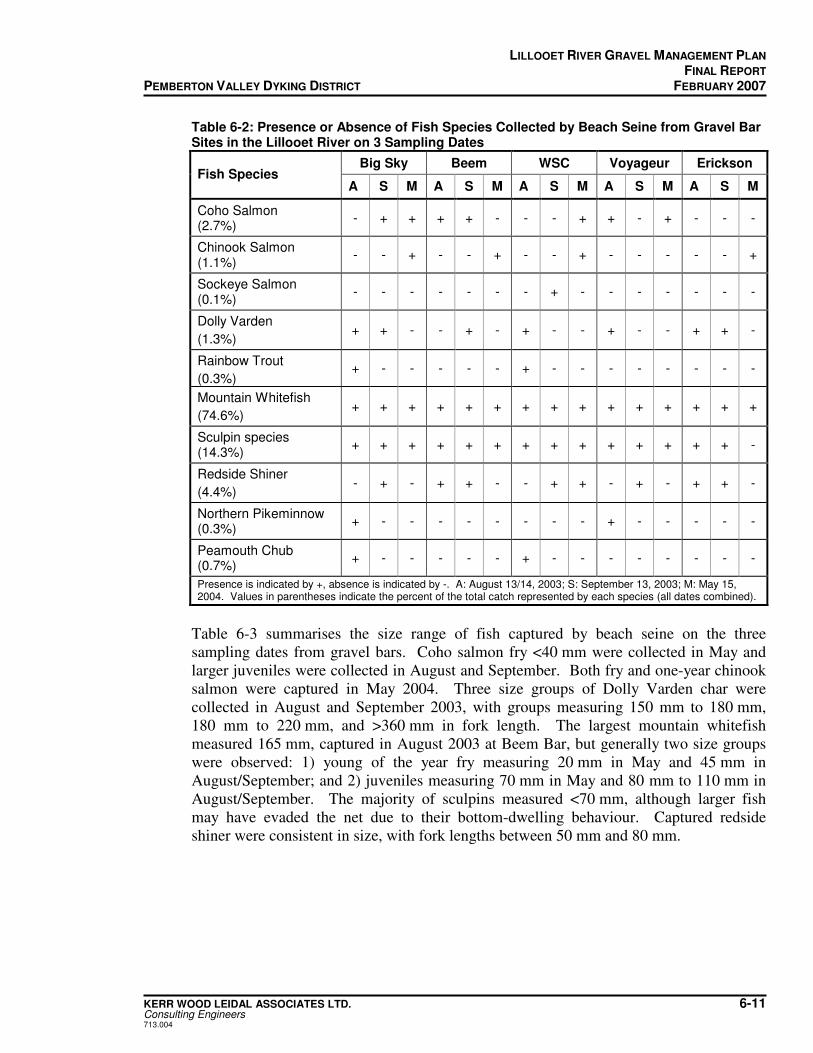
LILLOOET RIVER GRAVEL MANAGEMENT PLAN FINAL REPORT
PEMBERTON VALLEY DYKING DISTRICT FEBRUARY 2007
KERR WOOD LEIDAL ASSOCIATES LTD. 6-11 Consulting Engineers 713.004
Table 6-2: Presence or Absence of Fish Species Collected by Beach Seine from Gravel Bar Sites in the Lillooet River on 3 Sampling Dates
Big Sky Beem WSC Voyageur Erickson Fish Species
A S M A S M A S M A S M A S M
Coho Salmon (2.7%)
- + + + + - - - + + - + - - -
Chinook Salmon (1.1%)
- - + - - + - - + - - - - - +
Sockeye Salmon (0.1%)
- - - - - - - + - - - - - - -
Dolly Varden
(1.3%) + + - - + - + - - + - - + + -
Rainbow Trout
(0.3%) + - - - - - + - - - - - - - -
Mountain Whitefish
(74.6%) + + + + + + + + + + + + + + +
Sculpin species (14.3%)
+ + + + + + + + + + + + + + -
Redside Shiner
(4.4%) - + - + + - - + + - + - + + -
Northern Pikeminnow (0.3%)
+ - - - - - - - - + - - - - -
Peamouth Chub (0.7%)
+ - - - - - + - - - - - - - -
Presence is indicated by +, absence is indicated by -. A: August 13/14, 2003; S: September 13, 2003; M: May 15, 2004. Values in parentheses indicate the percent of the total catch represented by each species (all dates combined).
Table 6-3 summarises the size range of fish captured by beach seine on the three sampling dates from gravel bars. Coho salmon fry <40 mm were collected in May and larger juveniles were collected in August and September. Both fry and one-year chinook salmon were captured in May 2004. Three size groups of Dolly Varden char were collected in August and September 2003, with groups measuring 150 mm to 180 mm, 180 mm to 220 mm, and >360 mm in fork length. The largest mountain whitefish measured 165 mm, captured in August 2003 at Beem Bar, but generally two size groups were observed: 1) young of the year fry measuring 20 mm in May and 45 mm in August/September; and 2) juveniles measuring 70 mm in May and 80 mm to 110 mm in August/September. The majority of sculpins measured <70 mm, although larger fish may have evaded the net due to their bottom-dwelling behaviour. Captured redside shiner were consistent in size, with fork lengths between 50 mm and 80 mm.
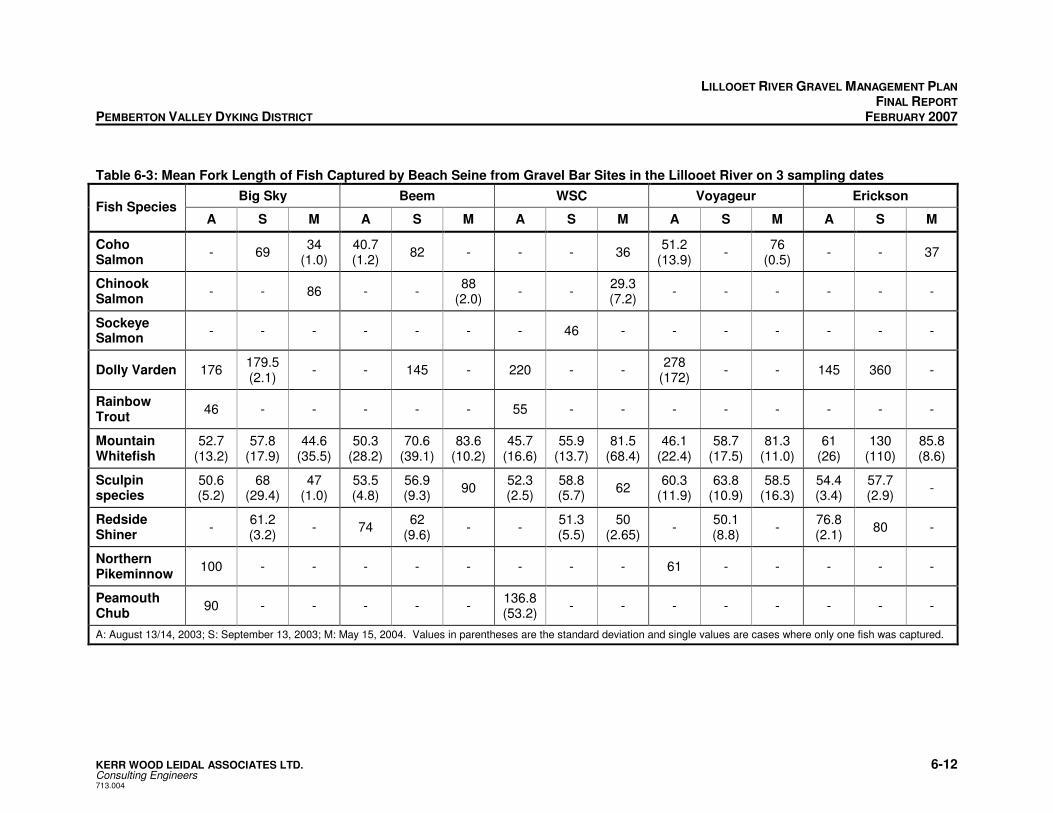
LILLOOET RIVER GRAVEL MANAGEMENT PLAN FINAL REPORT PEMBERTON VALLEY DYKING DISTRICT FEBRUARY 2007
KERR WOOD LEIDAL ASSOCIATES LTD. 6-12 Consulting Engineers 713.004
Table 6-3: Mean Fork Length of Fish Captured by Beach Seine from Gravel Bar Sites in the Lillooet River on 3 sampling dates
Big Sky Beem WSC Voyageur Erickson Fish Species
A S M A S M A S M A S M A S M
Coho Salmon
- 69 34
(1.0) 40.7 (1.2)
82 - - - 36 51.2
(13.9) -
76 (0.5)
- - 37
Chinook Salmon
- - 86 - - 88
(2.0) - -
29.3 (7.2)
- - - - - -
Sockeye Salmon
- - - - - - - 46 - - - - - - -
Dolly Varden 176 179.5 (2.1)
- - 145 - 220 - - 278
(172) - - 145 360 -
Rainbow Trout
46 - - - - - 55 - - - - - - - -
Mountain Whitefish
52.7 (13.2)
57.8 (17.9)
44.6 (35.5)
50.3 (28.2)
70.6 (39.1)
83.6 (10.2)
45.7 (16.6)
55.9 (13.7)
81.5 (68.4)
46.1 (22.4)
58.7 (17.5)
81.3 (11.0)
61 (26)
130 (110)
85.8 (8.6)
Sculpin species
50.6 (5.2)
68 (29.4)
47 (1.0)
53.5 (4.8)
56.9 (9.3)
90 52.3 (2.5)
58.8 (5.7)
62 60.3
(11.9) 63.8
(10.9) 58.5
(16.3) 54.4 (3.4)
57.7 (2.9)
-
Redside Shiner
- 61.2 (3.2)
- 74 62
(9.6) - -
51.3 (5.5)
50 (2.65)
- 50.1 (8.8)
- 76.8 (2.1)
80 -
Northern Pikeminnow
100 - - - - - - - - 61 - - - - -
Peamouth Chub
90 - - - - - 136.8 (53.2)
- - - - - - - -
A: August 13/14, 2003; S: September 13, 2003; M: May 15, 2004. Values in parentheses are the standard deviation and single values are cases where only one fish was captured.
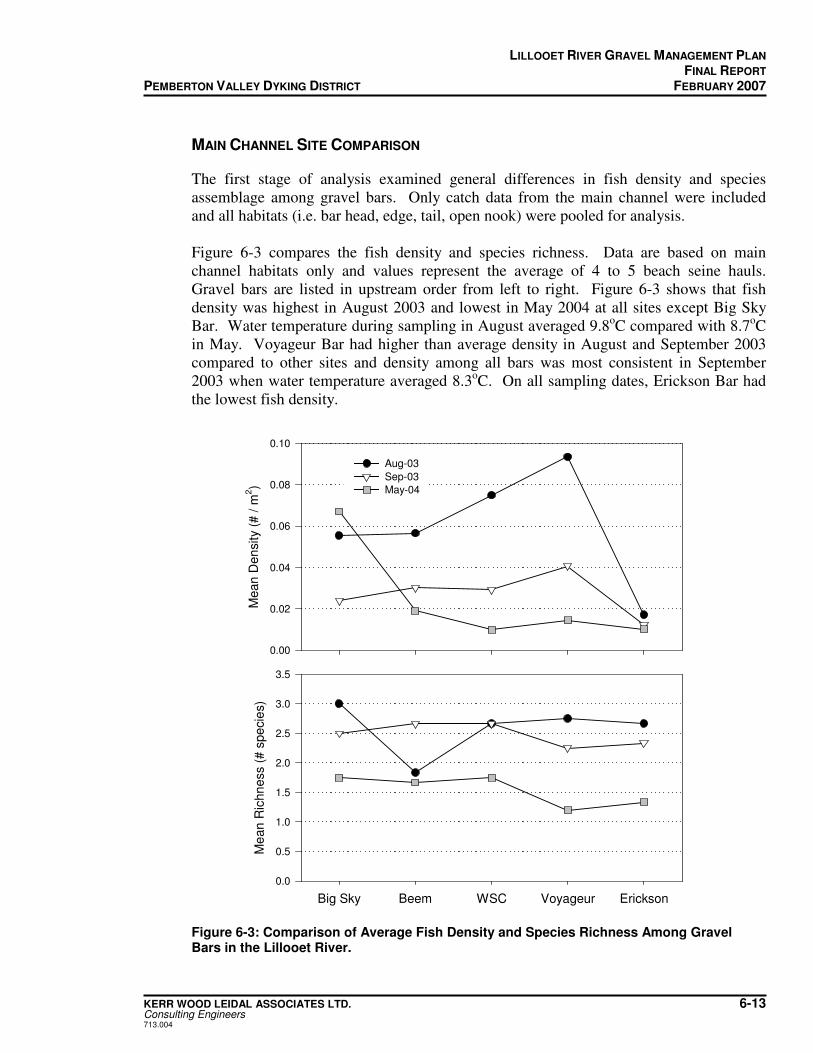
LILLOOET RIVER GRAVEL MANAGEMENT PLAN FINAL REPORT
PEMBERTON VALLEY DYKING DISTRICT FEBRUARY 2007
KERR WOOD LEIDAL ASSOCIATES LTD. 6-13 Consulting Engineers 713.004
MAIN CHANNEL SITE COMPARISON
The first stage of analysis examined general differences in fish density and species assemblage among gravel bars. Only catch data from the main channel were included and all habitats (i.e. bar head, edge, tail, open nook) were pooled for analysis. Figure 6-3 compares the fish density and species richness. Data are based on main channel habitats only and values represent the average of 4 to 5 beach seine hauls. Gravel bars are listed in upstream order from left to right. Figure 6-3 shows that fish density was highest in August 2003 and lowest in May 2004 at all sites except Big Sky Bar. Water temperature during sampling in August averaged 9.8oC compared with 8.7oC in May. Voyageur Bar had higher than average density in August and September 2003 compared to other sites and density among all bars was most consistent in September 2003 when water temperature averaged 8.3oC. On all sampling dates, Erickson Bar had the lowest fish density.
Mean
Den
sity (
# /
m2)
0.00
0.02
0.04
0.06
0.08
0.10
Aug-03
Sep-03
May-04
Big Sky Beem WSC Voyageur Erickson
Me
an R
ichn
ess (
# s
pe
cie
s)
0.0
0.5
1.0
1.5
2.0
2.5
3.0
3.5
Figure 6-3: Comparison of Average Fish Density and Species Richness Among Gravel Bars in the Lillooet River.
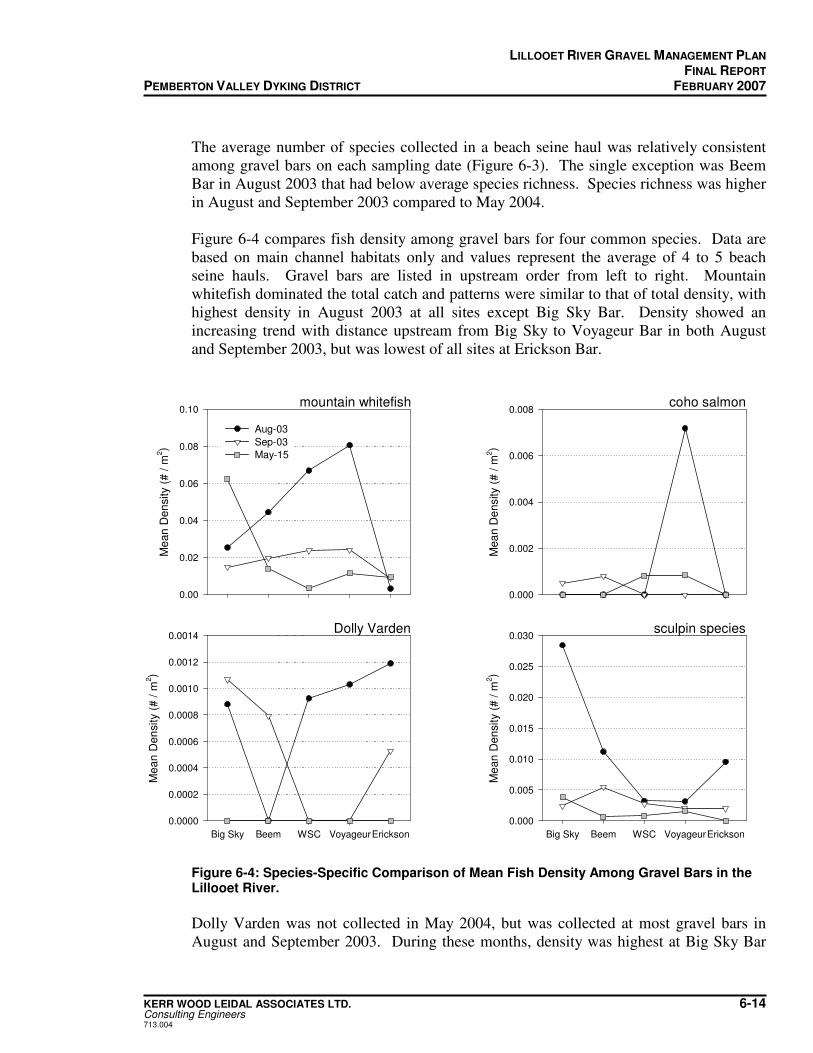
LILLOOET RIVER GRAVEL MANAGEMENT PLAN FINAL REPORT
PEMBERTON VALLEY DYKING DISTRICT FEBRUARY 2007
KERR WOOD LEIDAL ASSOCIATES LTD. 6-14 Consulting Engineers 713.004
The average number of species collected in a beach seine haul was relatively consistent among gravel bars on each sampling date (Figure 6-3). The single exception was Beem Bar in August 2003 that had below average species richness. Species richness was higher in August and September 2003 compared to May 2004. Figure 6-4 compares fish density among gravel bars for four common species. Data are based on main channel habitats only and values represent the average of 4 to 5 beach seine hauls. Gravel bars are listed in upstream order from left to right. Mountain whitefish dominated the total catch and patterns were similar to that of total density, with highest density in August 2003 at all sites except Big Sky Bar. Density showed an increasing trend with distance upstream from Big Sky to Voyageur Bar in both August and September 2003, but was lowest of all sites at Erickson Bar.
coho salmon
Mea
n D
ensity (
# /
m2)
0.000
0.002
0.004
0.006
0.008mountain whitefish
Me
an
Den
sity (
# /
m2)
0.00
0.02
0.04
0.06
0.08
0.10
Dolly Varden
Big Sky Beem WSC VoyageurErickson
Me
an
Den
sity (
# /
m2)
0.0000
0.0002
0.0004
0.0006
0.0008
0.0010
0.0012
0.0014sculpin species
Big Sky Beem WSC VoyageurErickson
Me
an
Den
sity (
# /
m2)
0.000
0.005
0.010
0.015
0.020
0.025
0.030
Aug-03
Sep-03
May-15
Figure 6-4: Species-Specific Comparison of Mean Fish Density Among Gravel Bars in the Lillooet River.
Dolly Varden was not collected in May 2004, but was collected at most gravel bars in August and September 2003. During these months, density was highest at Big Sky Bar
LILLOOET RIVER GRAVEL MANAGEMENT PLAN FINAL REPORT
PEMBERTON VALLEY DYKING DISTRICT FEBRUARY 2007
KERR WOOD LEIDAL ASSOCIATES LTD. 6-15 Consulting Engineers 713.004
and Erickson Bar. Only in August 2003 was an adult fish captured by beach seine (400 mm). Coho salmon density was low in main channel habitats at all sites and on all dates. The single exception was a beach seine haul at Voyageur Bar in August 2003 within bar tail habitat. The bar tail had negligible water velocity (maximum 3 cm/s), a steep bank slope (16%), and consisted of sand/silt substrate. Sculpin species showed no consistent distributional pattern among gravel bars, but had generally highest density in August 2003 and lowest density in May 2004. Two-factor analysis of variance (ANOVA) was applied to examine differences among sites and dates for species richness and total density. Density required log-transformation to meet assumptions of normality and homogeneity of variances. For density, no significant difference was found among sites (p=0.66) or dates (p=0.18). Species richness varied between dates (p<0.01), with richness in May 2004 being significantly lower than August and September 2003. No difference in richness among gravel bar sites was found (p=0.76). The observed low species richness in May 2004 relative to the other sampling dates may reflect the October 2003 flood of record. However, the data record is not of sufficient length to properly evaluate this observation.
HABITAT COMPARISON
The second stage of analysis examined differences in fish density and species assemblage among habitat units. No significant differences in fish density or species richness were found among gravel bars; hence, the analysis is based on catch data averaged across all bars. Figure 6-5 shows that total density was lowest in bar head and edge habitats on all sampling dates. Main channel density was highest in bar tail and open nook habitats. Side channel density was relatively high in both run and pool habitats (August 2003) as well as back-channels (May 2004). Density was variable in the two sampled back-channels, being 0.07 fish/m2 at Big Sky Bar (mountain whitefish and coho salmon) and 0.45 fish/m2 at WSC Bar (mountain whitefish only). Species richness was highest in bar edge and tail habitats of the main channel, and run habitats within side channels that conveyed flow (Figure 6-5). A modest inverse relation between species richness and water velocity was observed within the main channel, with richness lowest in bar heads (high velocity) and highest in bar tails (low velocity). The opposite pattern was generally observed in side channels comparing runs and back-channels.
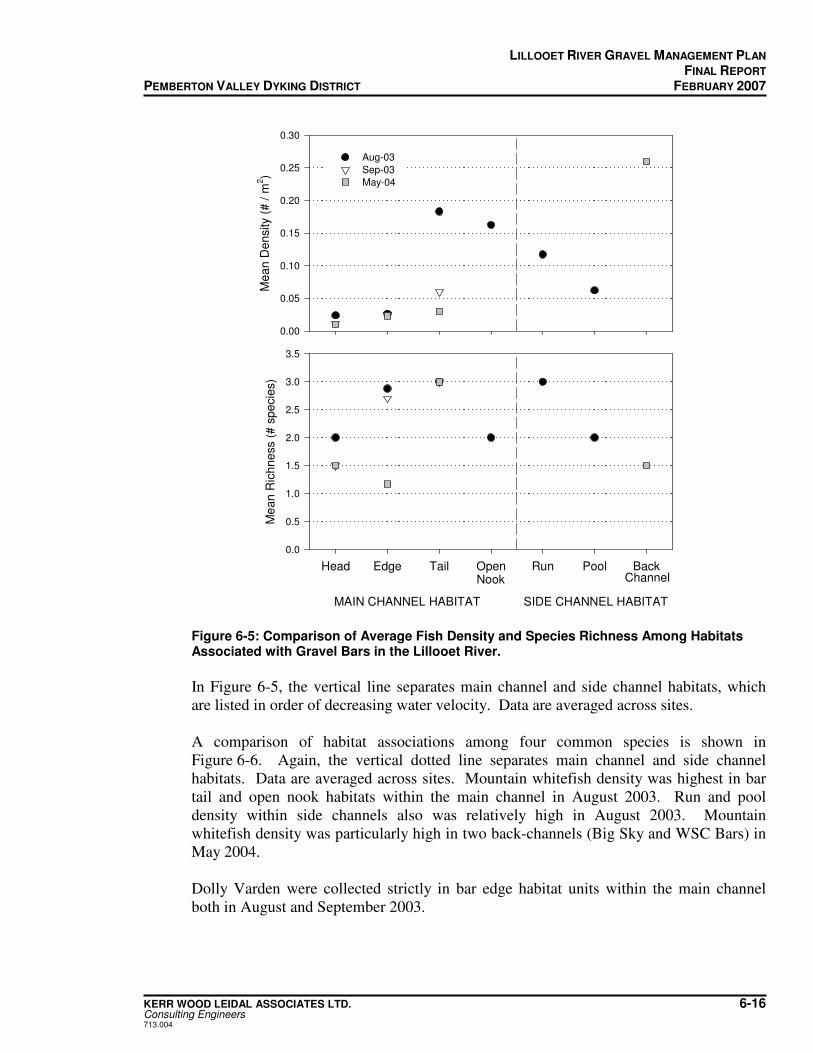
LILLOOET RIVER GRAVEL MANAGEMENT PLAN FINAL REPORT
PEMBERTON VALLEY DYKING DISTRICT FEBRUARY 2007
KERR WOOD LEIDAL ASSOCIATES LTD. 6-16 Consulting Engineers 713.004
Me
an
De
nsity (
# /
m2)
0.00
0.05
0.10
0.15
0.20
0.25
0.30
Aug-03
Sep-03
May-04
Head Edge Tail Open Run Pool Back
Me
an
Ric
hn
ess (
# s
pe
cie
s)
0.0
0.5
1.0
1.5
2.0
2.5
3.0
3.5
MAIN CHANNEL HABITAT SIDE CHANNEL HABITAT
ChannelNook
Figure 6-5: Comparison of Average Fish Density and Species Richness Among Habitats Associated with Gravel Bars in the Lillooet River.
In Figure 6-5, the vertical line separates main channel and side channel habitats, which are listed in order of decreasing water velocity. Data are averaged across sites. A comparison of habitat associations among four common species is shown in Figure 6-6. Again, the vertical dotted line separates main channel and side channel habitats. Data are averaged across sites. Mountain whitefish density was highest in bar tail and open nook habitats within the main channel in August 2003. Run and pool density within side channels also was relatively high in August 2003. Mountain whitefish density was particularly high in two back-channels (Big Sky and WSC Bars) in May 2004. Dolly Varden were collected strictly in bar edge habitat units within the main channel both in August and September 2003.
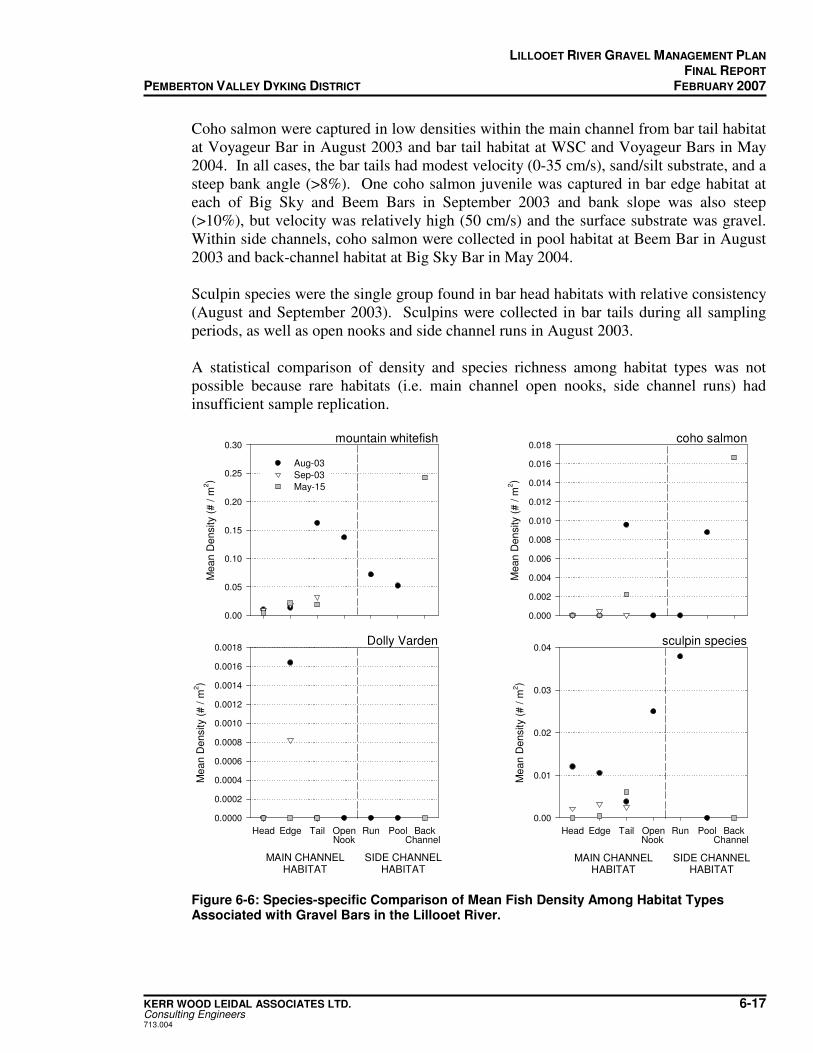
LILLOOET RIVER GRAVEL MANAGEMENT PLAN FINAL REPORT
PEMBERTON VALLEY DYKING DISTRICT FEBRUARY 2007
KERR WOOD LEIDAL ASSOCIATES LTD. 6-17 Consulting Engineers 713.004
Coho salmon were captured in low densities within the main channel from bar tail habitat at Voyageur Bar in August 2003 and bar tail habitat at WSC and Voyageur Bars in May 2004. In all cases, the bar tails had modest velocity (0-35 cm/s), sand/silt substrate, and a steep bank angle (>8%). One coho salmon juvenile was captured in bar edge habitat at each of Big Sky and Beem Bars in September 2003 and bank slope was also steep (>10%), but velocity was relatively high (50 cm/s) and the surface substrate was gravel. Within side channels, coho salmon were collected in pool habitat at Beem Bar in August 2003 and back-channel habitat at Big Sky Bar in May 2004. Sculpin species were the single group found in bar head habitats with relative consistency (August and September 2003). Sculpins were collected in bar tails during all sampling periods, as well as open nooks and side channel runs in August 2003. A statistical comparison of density and species richness among habitat types was not possible because rare habitats (i.e. main channel open nooks, side channel runs) had insufficient sample replication.
coho salmon
Mean
Den
sity (
# /
m2)
0.000
0.002
0.004
0.006
0.008
0.010
0.012
0.014
0.016
0.018mountain whitefish
Mea
n D
ensity (
# / m
2)
0.00
0.05
0.10
0.15
0.20
0.25
0.30
Dolly Varden
Head Edge Tail Open Run Pool Back
Me
an D
ensity (
# / m
2)
0.0000
0.0002
0.0004
0.0006
0.0008
0.0010
0.0012
0.0014
0.0016
0.0018sculpin species
Head Edge Tail Open Run Pool Back
Me
an D
ensity (
# / m
2)
0.00
0.01
0.02
0.03
0.04
Aug-03
Sep-03
May-15
Nook Channel
MAIN CHANNELHABITAT
SIDE CHANNELHABITAT
Nook Channel
MAIN CHANNELHABITAT
SIDE CHANNELHABITAT
Figure 6-6: Species-specific Comparison of Mean Fish Density Among Habitat Types Associated with Gravel Bars in the Lillooet River.
LILLOOET RIVER GRAVEL MANAGEMENT PLAN FINAL REPORT
PEMBERTON VALLEY DYKING DISTRICT FEBRUARY 2007
KERR WOOD LEIDAL ASSOCIATES LTD. 6-18 Consulting Engineers 713.004
6.6 BENTHIC INVERTEBRATE COMMUNITY
Invertebrate samples collected in March 2004 contained 19 distinct taxonomic groups identified to family. These groups represented: � 4 mayfly families (Ameletidae, Baetidae, Ephemerellidae, Heptageniidae); � 5 stonefly families (Capniidae, Chloroperlidae, Nemouridae, Perlodidae,
Taeniopterygidae); � 1 caddisfly family (Limnephilidae); � 4 midge sub-familes (Chironominae, Orthocladiinae, Prodiamesinae and
Tanypodinae); � danceflies (Empididae); � craneflies (Tipulidae); � blackflies (Simulidae); � worms (Oligochaeta); and � mites (Acarina). Table 6-4 presents average invertebrate density at each gravel bar. The most numerically abundant taxon was the midge Orthocladiinae, which dominates the invertebrate community of rivers throughout the Fraser Basin. The stonefly Capniidae was the second most common taxon in the Lillooet River samples, and was more abundant than Orthocladiinae in samples collected at WSC Bar. Capniidae occupy the sub-surface hyporheic zone for much of their life cycle, only migrating to the gravel surface in late winter before emerging from the river. This behaviour implies that Capniidae density in benthic samples will differ substantially between seasons, independent of habitat conditions or physical disturbance by gravel mining. Subsequent sampling on the Lillooet River must consider this temporal variability for planning and data interpretation if comparisons with these data are intended. Invertebrate samples collected in March 2004 ranged in total density from 1052 animals/m2 at Erickson Bar to 4033 animals/m2 at Big Sky Bar. Density generally increased in a downstream direction, except at WSC Bar where density was lower than at Voyageur Bar (Figure 6-7). Taxon richness showed the same pattern. The reason for increasing density with distance downstream is uncertain, but may be related to tributary inputs or nutrient enrichment from agricultural runoff. As well, lower density at Erickson Bar may be related to the earlier sampling date (March 11, 2004) compared to downstream bars (March 23 and 25, 2004). Differences in invertebrate density between gravel bars are not believed to be related directly to physical habitat because all bars were relatively similar in condition.
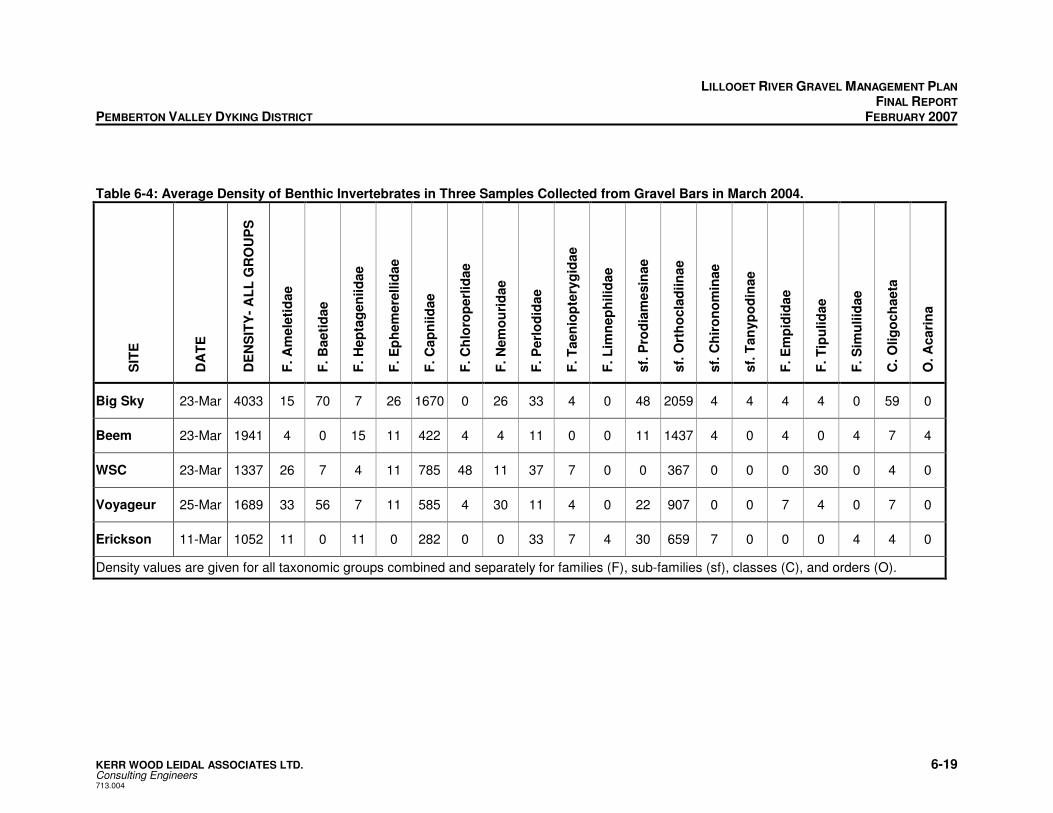
LILLOOET RIVER GRAVEL MANAGEMENT PLAN FINAL REPORT PEMBERTON VALLEY DYKING DISTRICT FEBRUARY 2007
KERR WOOD LEIDAL ASSOCIATES LTD. 6-19 Consulting Engineers 713.004
Table 6-4: Average Density of Benthic Invertebrates in Three Samples Collected from Gravel Bars in March 2004.
SIT
E
DA
TE
DE
NS
ITY
- A
LL
GR
OU
PS
F. A
mele
tid
ae
F. B
aeti
dae
F. H
ep
tag
en
iid
ae
F. E
ph
em
ere
llid
ae
F. C
ap
niid
ae
F. C
hlo
rop
erl
idae
F. N
em
ou
rid
ae
F. P
erl
od
idae
F. T
aen
iop
tery
gid
ae
F. L
imn
ep
hilid
ae
sf.
Pro
dia
mesin
ae
sf.
Ort
ho
cla
diin
ae
sf.
Ch
iro
no
min
ae
sf.
Tan
yp
od
inae
F. E
mp
idid
ae
F. T
ipu
lid
ae
F. S
imu
liid
ae
C. O
lig
och
aeta
O. A
cari
na
Big Sky 23-Mar 4033 15 70 7 26 1670 0 26 33 4 0 48 2059 4 4 4 4 0 59 0
Beem 23-Mar 1941 4 0 15 11 422 4 4 11 0 0 11 1437 4 0 4 0 4 7 4
WSC 23-Mar 1337 26 7 4 11 785 48 11 37 7 0 0 367 0 0 0 30 0 4 0
Voyageur 25-Mar 1689 33 56 7 11 585 4 30 11 4 0 22 907 0 0 7 4 0 7 0
Erickson 11-Mar 1052 11 0 11 0 282 0 0 33 7 4 30 659 7 0 0 0 4 4 0
Density values are given for all taxonomic groups combined and separately for families (F), sub-families (sf), classes (C), and orders (O).
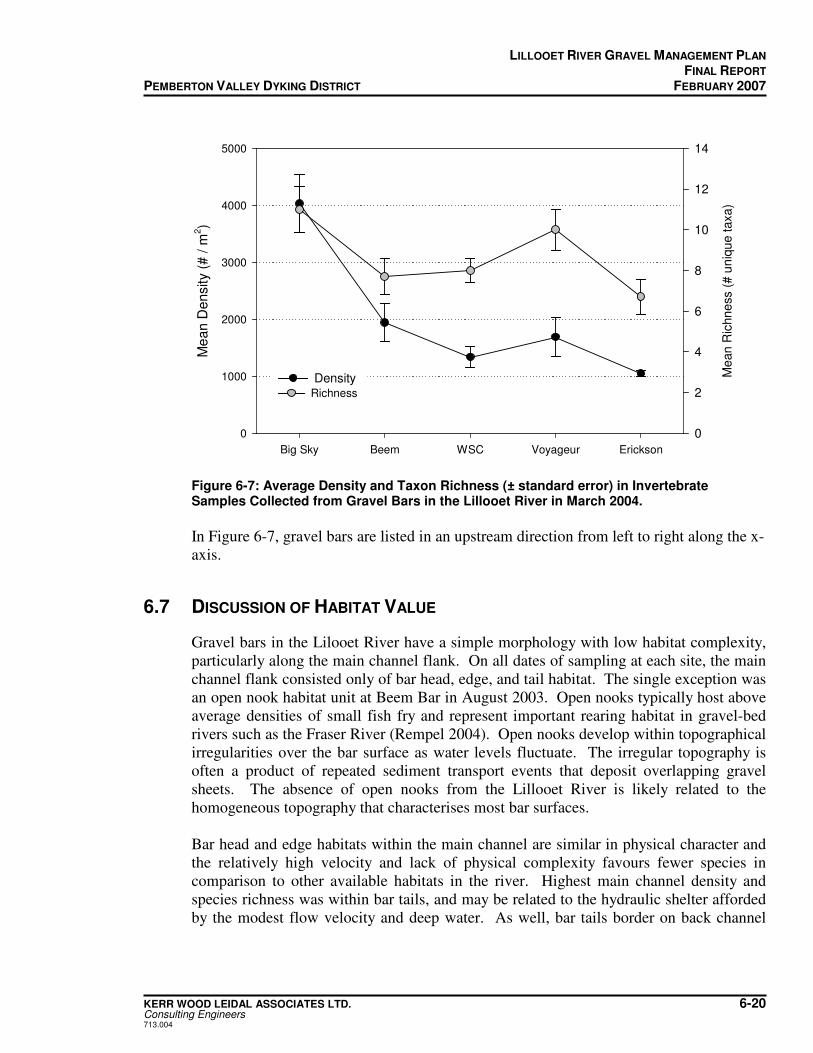
LILLOOET RIVER GRAVEL MANAGEMENT PLAN FINAL REPORT
PEMBERTON VALLEY DYKING DISTRICT FEBRUARY 2007
KERR WOOD LEIDAL ASSOCIATES LTD. 6-20 Consulting Engineers 713.004
Big Sky Beem WSC Voyageur Erickson
Me
an D
ensity (
# /
m2)
0
1000
2000
3000
4000
5000
Me
an
Ric
hn
ess (
# u
niq
ue
taxa
)
0
2
4
6
8
10
12
14
DensityRichness
Figure 6-7: Average Density and Taxon Richness (± standard error) in Invertebrate Samples Collected from Gravel Bars in the Lillooet River in March 2004.
In Figure 6-7, gravel bars are listed in an upstream direction from left to right along the x-axis.
6.7 DISCUSSION OF HABITAT VALUE
Gravel bars in the Lilooet River have a simple morphology with low habitat complexity, particularly along the main channel flank. On all dates of sampling at each site, the main channel flank consisted only of bar head, edge, and tail habitat. The single exception was an open nook habitat unit at Beem Bar in August 2003. Open nooks typically host above average densities of small fish fry and represent important rearing habitat in gravel-bed rivers such as the Fraser River (Rempel 2004). Open nooks develop within topographical irregularities over the bar surface as water levels fluctuate. The irregular topography is often a product of repeated sediment transport events that deposit overlapping gravel sheets. The absence of open nooks from the Lillooet River is likely related to the homogeneous topography that characterises most bar surfaces. Bar head and edge habitats within the main channel are similar in physical character and the relatively high velocity and lack of physical complexity favours fewer species in comparison to other available habitats in the river. Highest main channel density and species richness was within bar tails, and may be related to the hydraulic shelter afforded by the modest flow velocity and deep water. As well, bar tails border on back channel
LILLOOET RIVER GRAVEL MANAGEMENT PLAN FINAL REPORT
PEMBERTON VALLEY DYKING DISTRICT FEBRUARY 2007
KERR WOOD LEIDAL ASSOCIATES LTD. 6-21 Consulting Engineers 713.004
habitat and vegetated banklines, and so fish may move over relatively short distances and encounter a range of habitat conditions and foraging opportunities. The greatest habitat diversity associated with gravel bars was observed within narrow side channels on the backside of several bars. During periods of flow conveyance, a broad range of depth, velocity, and substrate conditions are available for fish to exploit, and overhanging riparian vegetation contributes food and wood to the channel. The majority of coho salmon were captured within side channels, and densities are likely significantly higher than estimated because in-stream LWD interfered with the net. Moreover, much of the riparian bankline is steep, sometimes overhanging, and presents fish with opportunities for hiding and rearing. The value of such habitats is difficult to estimate, but is likely high.
OFF-CHANNEL HABITAT
Whereas the main channel gradient is steep and flow velocity relatively high, conditions within off-channel habitats (side channels, densely vegetated banklines, sloughs) are moderated and less hostile for fish. There has been significant loss of off-channel habitat from the upper Lillooet River over the past century (Section 3). However, it was hypothesized that remaining off-channel habitats may host higher densities and greater species richness than the main channel bar edges. To test this hypothesis, sampling was carried out by electro-shocking the mouths of several tributaries on the left (north) bank of the Lillooet River on June 22, 2004 (Section 6.3). The chosen tributaries represented ideal study sites as while most of their watershed area is steep and inaccessible to fish, the lower reaches are situated on the Lillooet River floodplain where channel gradients and hence velocities are low. Furthermore, the north side of the Pemberton Valley is not developed between km 38 and the BC Rail Bridge (km 15.5) resulting in relatively undisturbed channel conditions. Results from tributary sampling are summarised in Table 6-5. The most upstream tributary, an unnamed stream opposite Wilson Road and immediately downstream of Gingerbread Creek, had a bifurcated mouth and water temperature was 9oC. Fish density was 0.6/m2 along the main branch and 80% of fish were coho salmon averaging 40 mm in fork length. Cutthroat trout (2 of 28 fish), Dolly Varden char (3 of 28 fish), and mountain whitefish (1 of 28 fish) also were collected. Fish density in a pool on the main tributary branch was 3.5/m2 and 95% of the fish were coho salmon. Deep water in the main branch of Gamelin Creek prohibited electro-shocking, but fish density at the mouth was 4.8/m2. The majority of fish (95%) were mountain whitefish fry <25 mm. One coho and sockeye salmon also were captured. McKenzie Creek was the largest tributary examined, and deep water prohibited quantitative electro-shocking in the lower branch. This reach was censused by drift-shocking downstream over 100 m in the canoe to determine species presence and relative
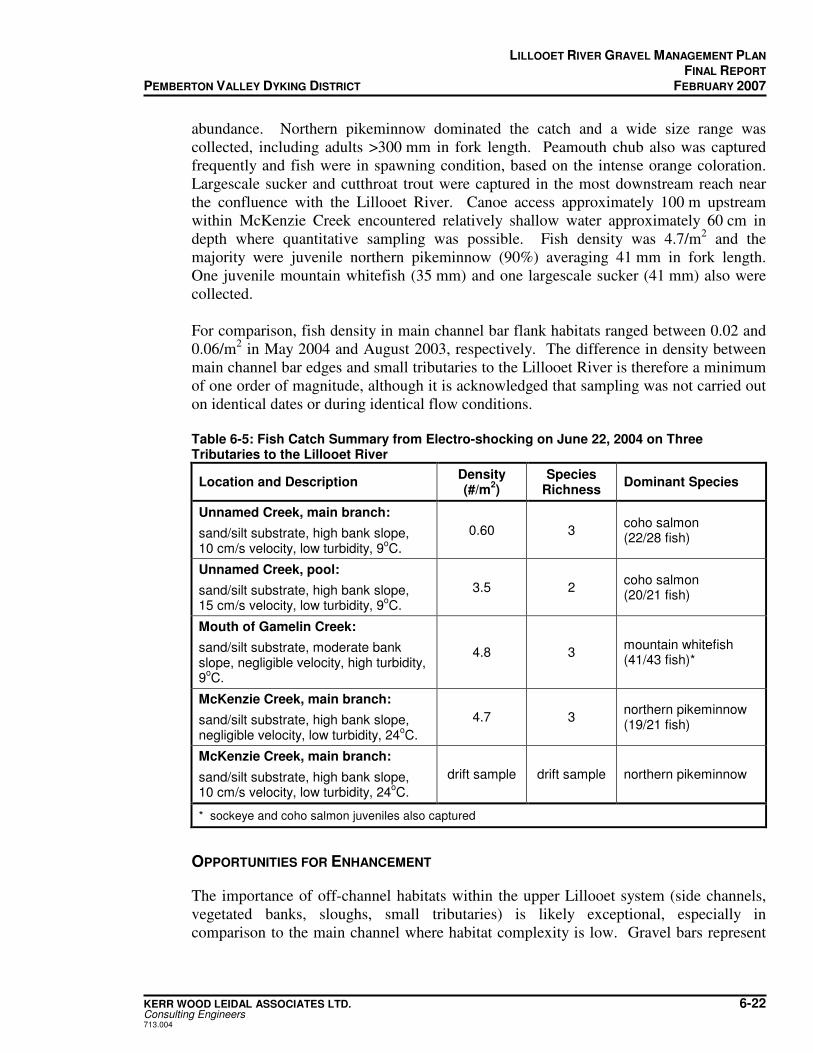
LILLOOET RIVER GRAVEL MANAGEMENT PLAN FINAL REPORT
PEMBERTON VALLEY DYKING DISTRICT FEBRUARY 2007
KERR WOOD LEIDAL ASSOCIATES LTD. 6-22 Consulting Engineers 713.004
abundance. Northern pikeminnow dominated the catch and a wide size range was collected, including adults >300 mm in fork length. Peamouth chub also was captured frequently and fish were in spawning condition, based on the intense orange coloration. Largescale sucker and cutthroat trout were captured in the most downstream reach near the confluence with the Lillooet River. Canoe access approximately 100 m upstream within McKenzie Creek encountered relatively shallow water approximately 60 cm in depth where quantitative sampling was possible. Fish density was 4.7/m2 and the majority were juvenile northern pikeminnow (90%) averaging 41 mm in fork length. One juvenile mountain whitefish (35 mm) and one largescale sucker (41 mm) also were collected. For comparison, fish density in main channel bar flank habitats ranged between 0.02 and 0.06/m2 in May 2004 and August 2003, respectively. The difference in density between main channel bar edges and small tributaries to the Lillooet River is therefore a minimum of one order of magnitude, although it is acknowledged that sampling was not carried out on identical dates or during identical flow conditions. Table 6-5: Fish Catch Summary from Electro-shocking on June 22, 2004 on Three Tributaries to the Lillooet River
Location and Description Density (#/m
2)
Species Richness
Dominant Species
Unnamed Creek, main branch:
sand/silt substrate, high bank slope, 10 cm/s velocity, low turbidity, 9
oC.
0.60 3 coho salmon (22/28 fish)
Unnamed Creek, pool:
sand/silt substrate, high bank slope, 15 cm/s velocity, low turbidity, 9
oC.
3.5 2 coho salmon (20/21 fish)
Mouth of Gamelin Creek:
sand/silt substrate, moderate bank slope, negligible velocity, high turbidity, 9
oC.
4.8 3 mountain whitefish (41/43 fish)*
McKenzie Creek, main branch:
sand/silt substrate, high bank slope, negligible velocity, low turbidity, 24
oC.
4.7 3 northern pikeminnow (19/21 fish)
McKenzie Creek, main branch:
sand/silt substrate, high bank slope, 10 cm/s velocity, low turbidity, 24
oC.
drift sample drift sample northern pikeminnow
* sockeye and coho salmon juveniles also captured
OPPORTUNITIES FOR ENHANCEMENT
The importance of off-channel habitats within the upper Lillooet system (side channels, vegetated banks, sloughs, small tributaries) is likely exceptional, especially in comparison to the main channel where habitat complexity is low. Gravel bars represent
LILLOOET RIVER GRAVEL MANAGEMENT PLAN FINAL REPORT
PEMBERTON VALLEY DYKING DISTRICT FEBRUARY 2007
KERR WOOD LEIDAL ASSOCIATES LTD. 6-23 Consulting Engineers 713.004
the single element of morphological complexity in the mainstem Lillooet River, but the morphology of bars is simple and the range of distinct habitats available for fish are limited. Side channels on the backside of gravel bars are complex in physical character, relative to the main channel, and host relatively high fish density and species richness. Side channels are associated with most gravel bars, although many are relatively shallow due to sediment deposition, particularly at the upstream end. Flow conveyance occurs only during moderate to high discharge because sediment deposition at the bar head restricts flow access. Moreover, sand/silt deposition over bar tails causes infilling of the most downstream end of side channels, which limits the area of back-channel habitat available at lower discharge. In part as a consequence of sediment deposition, gravel bars such as Erickson Bar have no side channel habitat. Based on this evidence, there exists possible habitat enhancement opportunities around gravel bars by way of deepening side channels. This measure would increase the period over which the channels conveyed flow and the period that fish could access the channels for rearing. Side channel deepening also would increase the wetted channel area for fish to occupy. A second possible enhancement opportunity would be to increase the physical complexity along the main channel edge of gravel bars by way of creating open nooks and small embayments. Such features would provide hydraulic shelter to fish within the main channel and broaden the range of velocity and depth conditions available for fish to exploit. Such features have been created successfully on the Fraser River and their importance as habitat for fish are being assessed as part of an ongoing monitoring project. In a narrow river like the Lillooet River, both enhancement opportunities are likely to be transient features due to ongoing sediment transport. However, they are expected to provide short-term habitat.
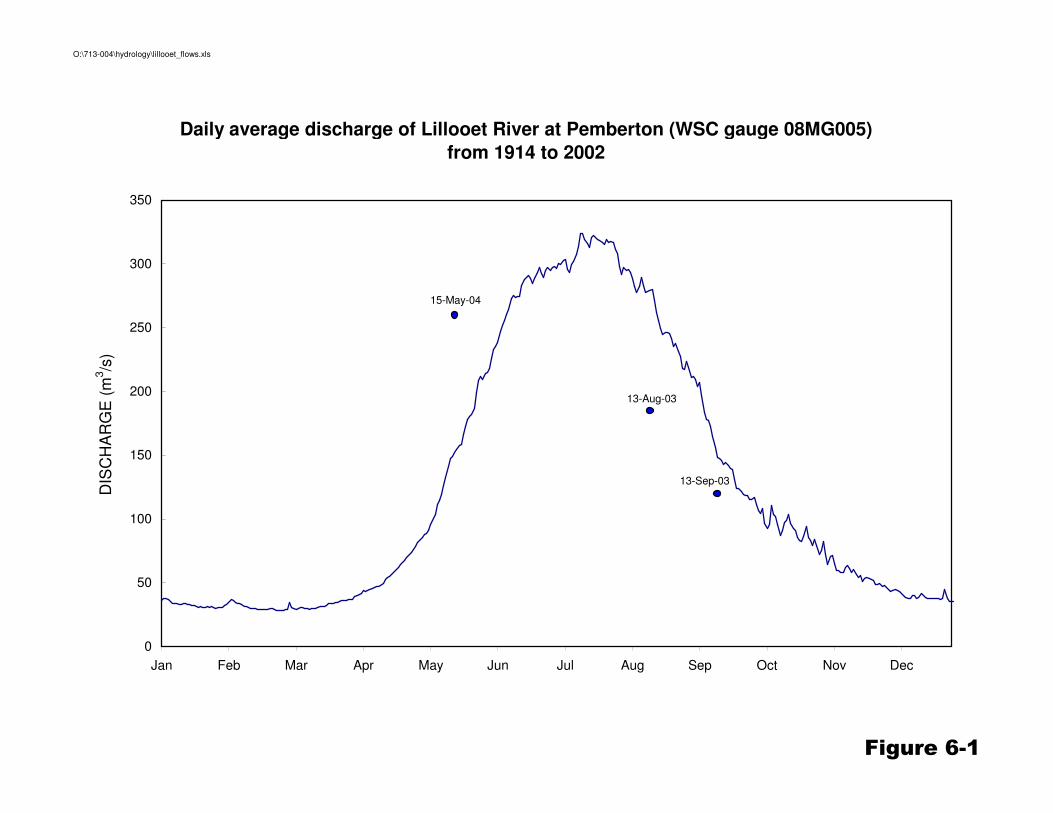
O:\713-004\hydrology\lillooet_flows.xls
Figure 6-1
Daily average discharge of Lillooet River at Pemberton (WSC gauge 08MG005)
from 1914 to 2002
0
50
100
150
200
250
300
350
Jan Feb Mar Apr May Jun Jul Aug Sep Oct Nov Dec
DIS
CH
AR
GE
(m
3/s
)
13-Aug-03
13-Sep-03
15-May-04
Section 7
Hydraulic Modelling
LILLOOET RIVER GRAVEL MANAGEMENT PLAN FINAL REPORT
PEMBERTON VALLEY DYKING DISTRICT FEBRUARY 2007
KERR WOOD LEIDAL ASSOCIATES LTD. 7-1 Consulting Engineers 713.004
7. HYDRAULIC MODELLING This section commences with a discussion of the dyke adequacy on the right bank of the Lillooet River between km 20 and km 8. Additional modelling results based on detailed topographic surveys of Voyageur Bar, Beem Bar and Big Sky Bar are also presented. High water mark information from the October 2003 flood is also presented.
7.1 EXISTING HYDRAULIC MODELLING
Figures 7-1 and 7-2 show the design flood level with respect to the dyke crest elevation (incorporating survey information that includes the 2002 Lillooet dyke upgrade) and elevation of the airport access road. The flood levels shown are based on the hydraulic modelling completed by KWL in 2002. For the Lillooet Dyke, the desired elevation of the dyke crest is a minimum of the design flood level (Qi200) plus 0.6 m freeboard. The results of the modelling are summarized below: � The Lillooet Dyke has sufficient freeboard between Miller Creek and km 13.8, which
is situated about 1.4 km upstream of Highway 99.
� The Adventure Ranch Dyke runs along the right bank of the Lillooet River immediately below Highway 99. This dyke has inadequate freeboard and should be raised by approximately 0.4 m.
� Below the Adventure Ranch dyke, Airport Road acts as a dyke down to the confluence with Pemberton Creek. This 0.55 km section of road is close to the design flood level and should be raised by approximately 0.5 m. Airport Road is under the jurisdiction of the BC Ministry of Transportation, not PVDD.
� Below Pemberton Creek, Airport Road is overtopped by the design flood at several locations. This dyke provides partial protection to Area 5/6, but is not part of a standard dyke system.
A majority of the Lillooet Dyke appears to have adequate freeboard, but the most downstream section requires upgrading. A concern is that the cross-sections used for the modelling are spaced sufficiently far apart (800 m) that the effects of local aggradation may not be accounted for. That concern is taken up in the next section. Ongoing gravel deposition also has to be considered with respect to long-term river management.
7.2 UPDATED HYDRAULIC MODELLING
Voyageur Bar, Beem Bar, and Big Sky Bar have been identified as the most likely candidate sites for gravel removal (Section 4). Because these gravel bars are not
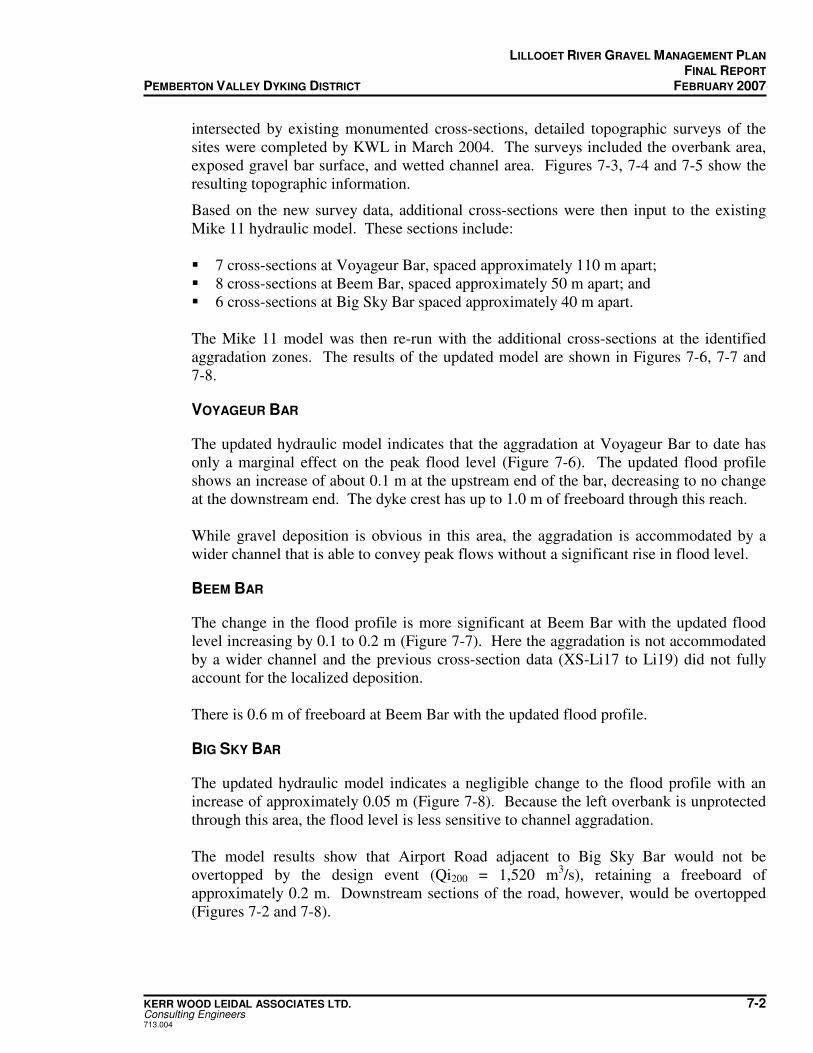
LILLOOET RIVER GRAVEL MANAGEMENT PLAN FINAL REPORT
PEMBERTON VALLEY DYKING DISTRICT FEBRUARY 2007
KERR WOOD LEIDAL ASSOCIATES LTD. 7-2 Consulting Engineers 713.004
intersected by existing monumented cross-sections, detailed topographic surveys of the sites were completed by KWL in March 2004. The surveys included the overbank area, exposed gravel bar surface, and wetted channel area. Figures 7-3, 7-4 and 7-5 show the resulting topographic information.
Based on the new survey data, additional cross-sections were then input to the existing Mike 11 hydraulic model. These sections include: � 7 cross-sections at Voyageur Bar, spaced approximately 110 m apart; � 8 cross-sections at Beem Bar, spaced approximately 50 m apart; and � 6 cross-sections at Big Sky Bar spaced approximately 40 m apart. The Mike 11 model was then re-run with the additional cross-sections at the identified aggradation zones. The results of the updated model are shown in Figures 7-6, 7-7 and 7-8.
VOYAGEUR BAR
The updated hydraulic model indicates that the aggradation at Voyageur Bar to date has only a marginal effect on the peak flood level (Figure 7-6). The updated flood profile shows an increase of about 0.1 m at the upstream end of the bar, decreasing to no change at the downstream end. The dyke crest has up to 1.0 m of freeboard through this reach. While gravel deposition is obvious in this area, the aggradation is accommodated by a wider channel that is able to convey peak flows without a significant rise in flood level.
BEEM BAR
The change in the flood profile is more significant at Beem Bar with the updated flood level increasing by 0.1 to 0.2 m (Figure 7-7). Here the aggradation is not accommodated by a wider channel and the previous cross-section data (XS-Li17 to Li19) did not fully account for the localized deposition. There is 0.6 m of freeboard at Beem Bar with the updated flood profile.
BIG SKY BAR
The updated hydraulic model indicates a negligible change to the flood profile with an increase of approximately 0.05 m (Figure 7-8). Because the left overbank is unprotected through this area, the flood level is less sensitive to channel aggradation. The model results show that Airport Road adjacent to Big Sky Bar would not be overtopped by the design event (Qi200 = 1,520 m3/s), retaining a freeboard of approximately 0.2 m. Downstream sections of the road, however, would be overtopped (Figures 7-2 and 7-8).
LILLOOET RIVER GRAVEL MANAGEMENT PLAN FINAL REPORT
PEMBERTON VALLEY DYKING DISTRICT FEBRUARY 2007
KERR WOOD LEIDAL ASSOCIATES LTD. 7-3 Consulting Engineers 713.004
7.3 HIGH WATER MARKS
For a period of about one week in mid October 2003, the Pacific Northwest was assailed by a series of warm fronts from the central Pacific (“Pineapple Express”) that were characterized by prolonged, orographically enhanced rainfall. These events were directed against the south coast of BC commencing on October 16. In the Pemberton Valley, significant flooding occurred in areas without adequate flood protection and the flood of record was recorded at the WSC gauge on the Lillooet River (KWL, 2004). Hydrometric station 08MG005 recorded a rise from about 100 m3/s on October 16 to a peak instantaneous flow of about 1,523 m3/s on October 19. The previous maximum recorded discharge occurred on August 30, 1991, with 1,260 m3/s mean daily flow and 1,410 m3/s instantaneous peak flow. Of significance, the recorded peak flow is quite close to the 200-year return period peak instantaneous flow estimated by KWL in the 2002 Lillooet River Corridor Study (1,520 m3/s). The event therefore provides a good test of the hydraulic modelling.
HIGH WATER MARK SURVEY
Following the October 2003 storm, high water marks were established by MWLAP along the Lillooet River, the Green River, Miller Creek, Pemberton Creek, and the Birkenhead River. The high water marks were staked between October 29 and November 1 and surveyed by KWL in November 2003. Surveyed high water elevations along the Lillooet River between Miller Creek and the Green River are summarized in Table 7-1 and locations are shown in Figure 7-9. Table 7-1 also includes the crest elevation of the Lillooet Dyke and Airport Road, and modelled Qi200 water level.
LILLOOET RIVER GRAVEL MANAGEMENT PLAN FINAL REPORT
PEMBERTON VALLEY DYKING DISTRICT FEBRUARY 2007
KERR WOOD LEIDAL ASSOCIATES LTD. 7-4 Consulting Engineers 713.004
Table 7-1: Lillooet River High Water Elevations of October 2003 Flood
Section High water elevation
(m)
Dyke/Road crest (m)
Freeboard (m)
Modelled Qi200 Flood
Level
(m)
Diff between modelled Qi200 and
high water mark
(m)
HWM Li19 212.84 213.4 0.56 212.81 -0.03
HWM Li20 211.8 212.78 0.98 212.05 0.25
HWM Li21 211.29 211.69 0.4 211.01 -0.28
HWM Li22 210.39 211.42 1.03 210.64 0.25
HWM Li23 210.93 211.2 0.27 210.64 -0.29
HWM LiX 210.24 210.98 0.74 210.42 0.18
HWM Li24 209.63 210.68 1.05 210.06 0.43
HWM Li25 209.65 209.9 0.25 209.11 -0.54
HWM Li26 208.44 208.93 0.49 208.46 0.02
HWM Li27 208.37 208.58 0.21 208.08 -0.29
HWM Li28 207.09 208.88 1.79 207.47 0.38
HWM Li29 207.29 208.14 0.85 207.37 0.08
HWM Li30 207.24 207.71 0.47 207.55 0.31
HWM Li31 207.02 207.1 0.08 206.76 -0.26
HWM Li32 206.89 206.46 -0.43 206.30 -0.59
HWM Hanger 205.59 205.78 0.19 205.82 0.23
HWM Li33 205.51 205.01 -0.5 205.69 0.18
HWM Li34 205.18 204.58 -0.6 205.12 -0.06
The high water survey marks are in relatively close agreement with the hydraulic modelling results, generally being within 0.3 m of each other. Suspect data points include: Li23
High water mark Li23 was taken immediately downstream of the BCR Bridge next to a homemade gauge. The landowner’s wife had advised Karl Bornemann that the high water had reached the 24” mark on the gauge. However, this elevation is 0.5 m higher than a corresponding high water mark upstream of the bridge (Li22). Li24
The KWL survey crew could not locate the original HWM Li24 stake. A silt mark on the dyke was surveyed by KWL instead. Because a couple of weeks had passed since the peak flow event, the silt mark may have underestimated the true peak flood level. Li25
Li25 is situated approximately 1.65 km upstream from the Highway 99 Bridge on a riverside ramp at a hydro line. A local landowner advised Karl Bornemann that the high water came to within 8” of the crest, which was staked as the high water line. This high water mark is approximately 0.5 m higher than the modelled flood level. Given the large difference between the two water levels, it is likely that the local landowner overestimated the high water mark.
LILLOOET RIVER GRAVEL MANAGEMENT PLAN FINAL REPORT
PEMBERTON VALLEY DYKING DISTRICT FEBRUARY 2007
KERR WOOD LEIDAL ASSOCIATES LTD. 7-5 Consulting Engineers 713.004
Li32
HWM Li32 was noted at a staff gauge opposite the entrance to Big Sky Golf and Country Club (and adjacent to Big Sky Bar). The high water mark is well above the road elevation and is inconsistent with high water marks noted both upstream (Li32) and downstream (hanger, Li33 and Li34).
CONCLUSION
With the exception of several suspect data points, the surveyed high water marks are in relatively close agreement with the hydraulic modelling results. This generally validates the 2002 hydraulic modelling work. It is concluded that the hydraulic modelling provides a good representation of the design flood and can be used with confidence for river management. Notwithstanding this conclusion, it is noted that the design flood discharge and river cross-sections may warrant future review and this would necessitate further updating of the hydraulic model.
7.4 SUMMARY
The following conclusions are made regarding the hydraulic modelling. � The Adventure Ranch dyke has inadequate freeboard and should be raised by
approximately 0.4 m.
� The 0.55 km section of Airport Road that acts as a dyke is close to the design flood level and should be raised by approximately 0.5 m.
� Below Pemberton Creek, Airport Road is overtopped by the design flood at several locations. Dyke improvements in this area would need to be part of a comprehensive regional plan.
� Detailed surveys were completed for Voyageur Bar, Beem Bar and Big Sky Bar. Based on the new survey data, additional cross-sections were then input into the existing Mike 11 hydraulic model for re-analysis. The updated hydraulic model shows flood level increases of up to 0.2 m at the identified aggradation zones for the current degree of aggradation.
� High water marks were surveyed along the Lillooet River following the flood of record on October 19, 2003. The recorded peak flow of 1490 m3/s is very similar to the 200-year return period peak instantaneous flow estimate of 1520 m3/s. Because the surveyed high water marks are in relatively close agreement with the hydraulic modelling results, it is concluded that the hydraulic modelling provides a good representation of the design flood and can be used with confidence for river management. Notwithstanding this, it is acknowledged that the design flood and river cross-sections discharge may warrant updating in the future, and this would require further updating of the hydraulic model.
O:\713-004\model\PeakWL-comp.xls
Figure 7-1
Lillooet River Flood Levels - Miller Creek to km 13
208
209
210
211
212
213
214
215
1314151617181920
CHAINAGE (km)
EL
EV
AT
ION
(m
)
200-yr flood level (KWL, 2002)
dyke crest
200-yr + 0.6 m
October 2003 high water mark
BC
Rail
bridge
XS
-Li2
4
XS
-Li2
2
Voyageur Bar
XS
-Li2
0
XS
-Li1
8
Beem Bar
(Li19)
(Li20)
(Li24)
(LiX)
(Li23)
(Li22)
(Li21)
(Li26)
(Li25)
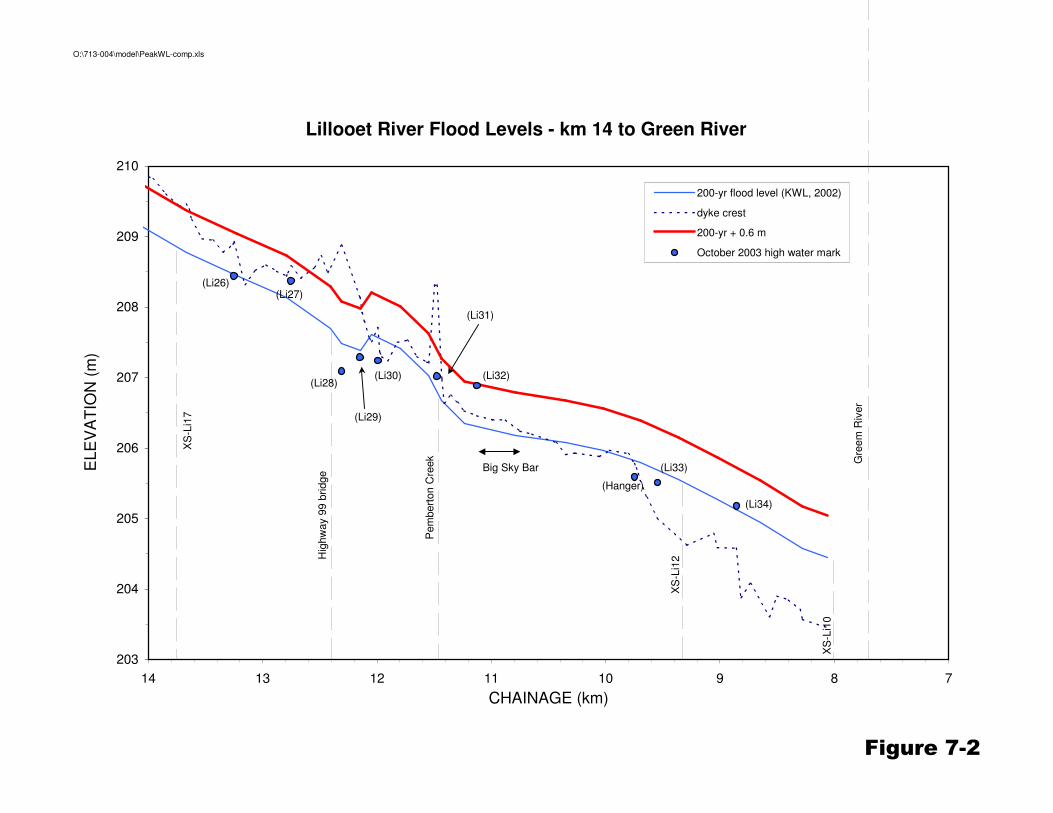
O:\713-004\model\PeakWL-comp.xls
Figure 7-2
Lillooet River Flood Levels - km 14 to Green River
203
204
205
206
207
208
209
210
7891011121314
CHAINAGE (km)
EL
EV
AT
ION
(m
)
200-yr flood level (KWL, 2002)
dyke crest
200-yr + 0.6 m
October 2003 high water mark
Hig
hw
ay 9
9 b
ridge
Pem
bert
on C
reek Gre
em
Riv
er
XS
-Li1
7
XS
-Li1
2
XS
-Li1
0
Big Sky Bar (Li33)
(Li34)
(Hanger)
(Li32)
(Li31)
(Li29)
(Li30)(Li28)
(Li27)(Li26)
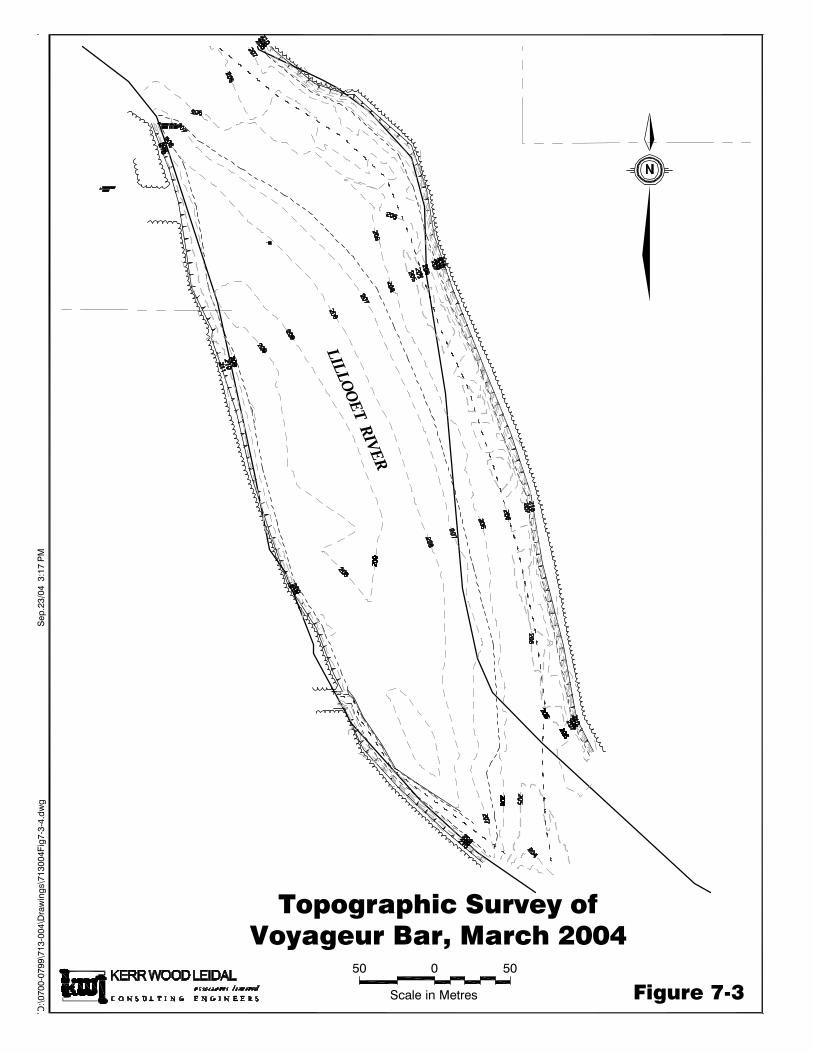
O:\0
700-
0799
\713
-004
\Dra
win
gs\7
1300
4Fig
7-3-
4.dw
gS
ep.2
3/04
3:1
7 P
M
Scale in Metres
50 0 50
Figure 7-3
Topographic Survey ofVoyageur Bar, March 2004
LILLOO
ET RIVER
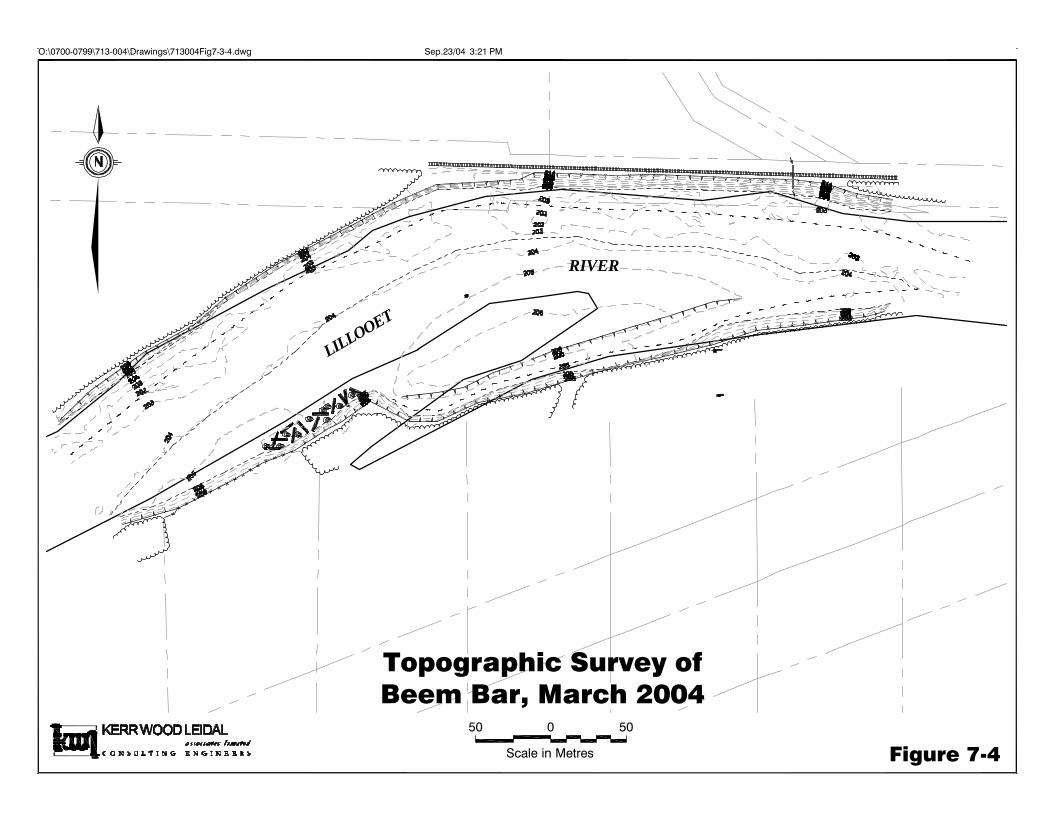
O:\0700-0799\713-004\Drawings\713004Fig7-3-4.dwg Sep.23/04 3:21 PM
Topographic Survey ofBeem Bar, March 2004
Figure 7-450050
Scale in Metres
LILLOOET
RIVER
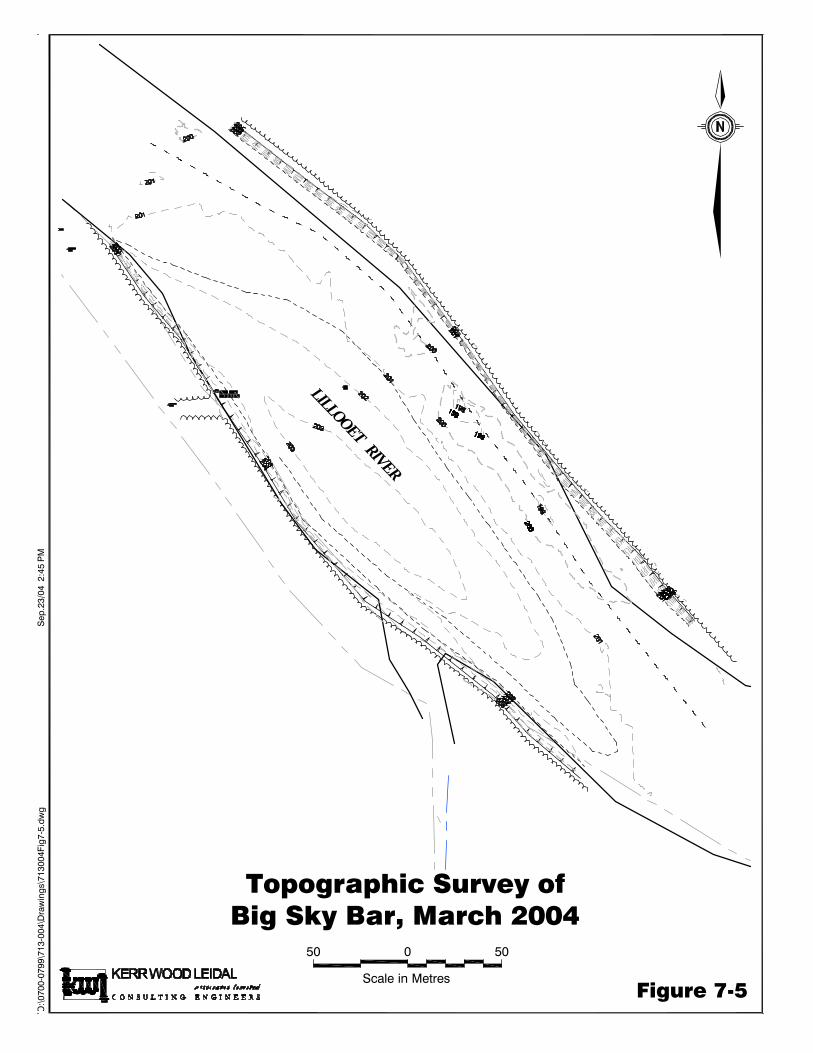
Figure 7-5
LILLOOET RIVER
Topographic Survey ofBig Sky Bar, March 2004
50050
Scale in Metres
O:\0
700-
0799
\713
-004
\Dra
win
gs\7
1300
4Fig
7-5.
dwg
Sep
.23/
04 2
:45
PM
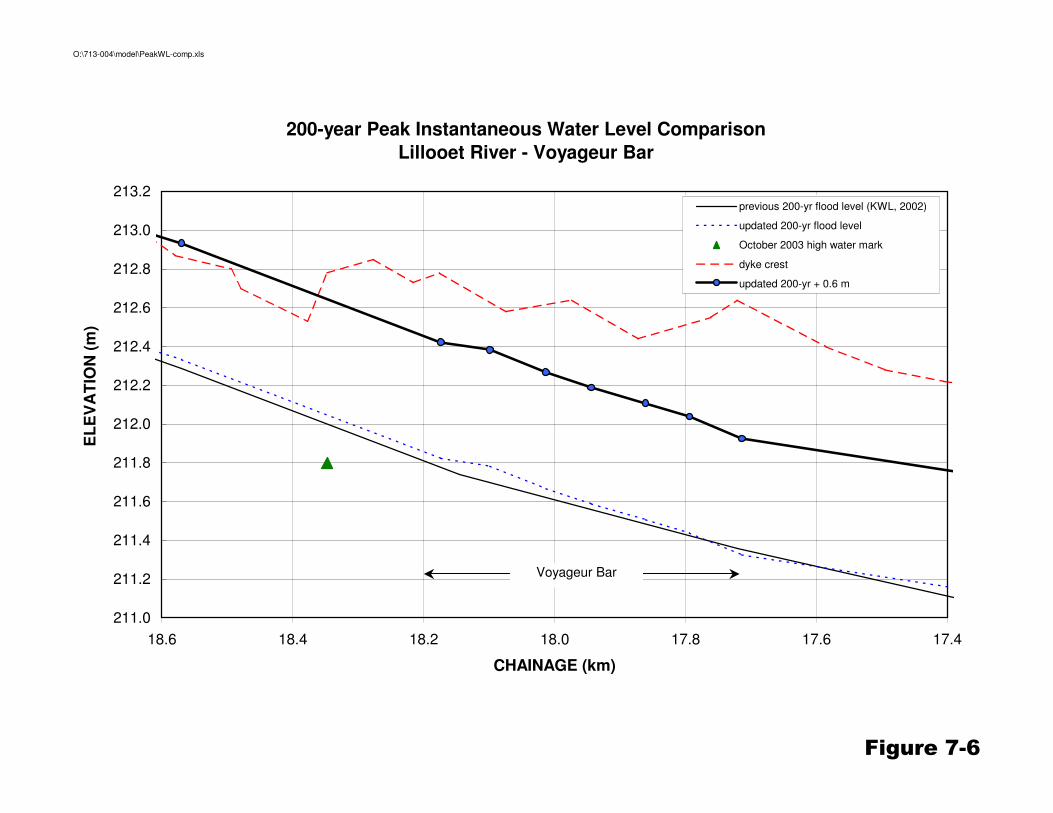
O:\713-004\model\PeakWL-comp.xls
Figure 7-6
200-year Peak Instantaneous Water Level Comparison
Lillooet River - Voyageur Bar
211.0
211.2
211.4
211.6
211.8
212.0
212.2
212.4
212.6
212.8
213.0
213.2
17.417.617.818.018.218.418.6
CHAINAGE (km)
EL
EV
AT
ION
(m
)
previous 200-yr flood level (KWL, 2002)
updated 200-yr flood level
October 2003 high water mark
dyke crest
updated 200-yr + 0.6 m
Voyageur Bar
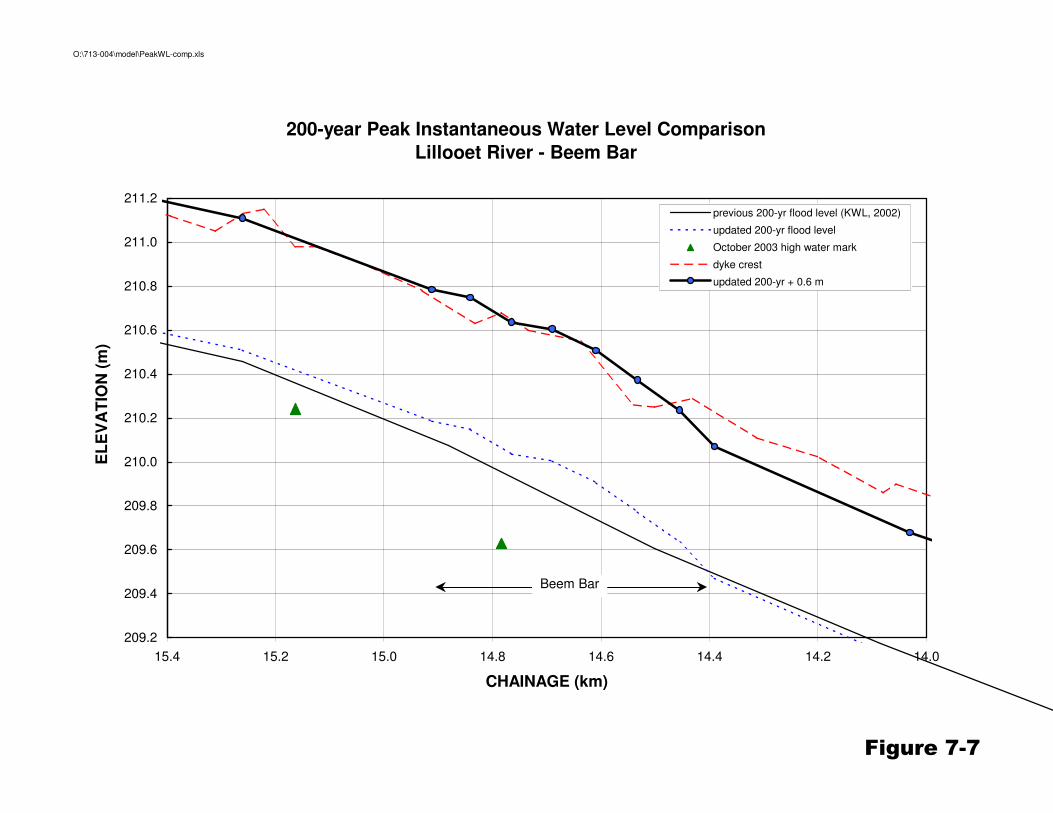
O:\713-004\model\PeakWL-comp.xls
Figure 7-7
200-year Peak Instantaneous Water Level Comparison
Lillooet River - Beem Bar
209.2
209.4
209.6
209.8
210.0
210.2
210.4
210.6
210.8
211.0
211.2
14.014.214.414.614.815.015.215.4
CHAINAGE (km)
EL
EV
AT
ION
(m
)
previous 200-yr flood level (KWL, 2002)
updated 200-yr flood level
October 2003 high water mark
dyke crest
updated 200-yr + 0.6 m
Beem Bar
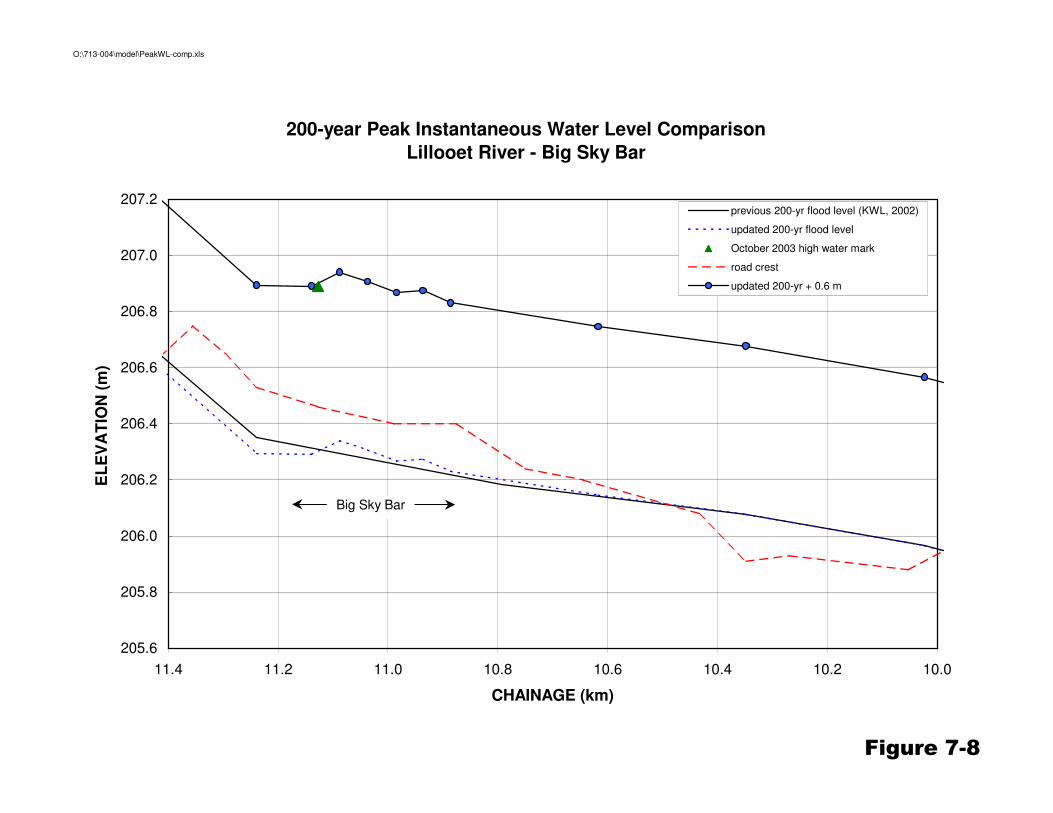
O:\713-004\model\PeakWL-comp.xls
Figure 7-8
200-year Peak Instantaneous Water Level Comparison
Lillooet River - Big Sky Bar
205.6
205.8
206.0
206.2
206.4
206.6
206.8
207.0
207.2
10.010.210.410.610.811.011.211.4
CHAINAGE (km)
EL
EV
AT
ION
(m
)
previous 200-yr flood level (KWL, 2002)
updated 200-yr flood level
October 2003 high water mark
road crest
updated 200-yr + 0.6 m
Big Sky Bar
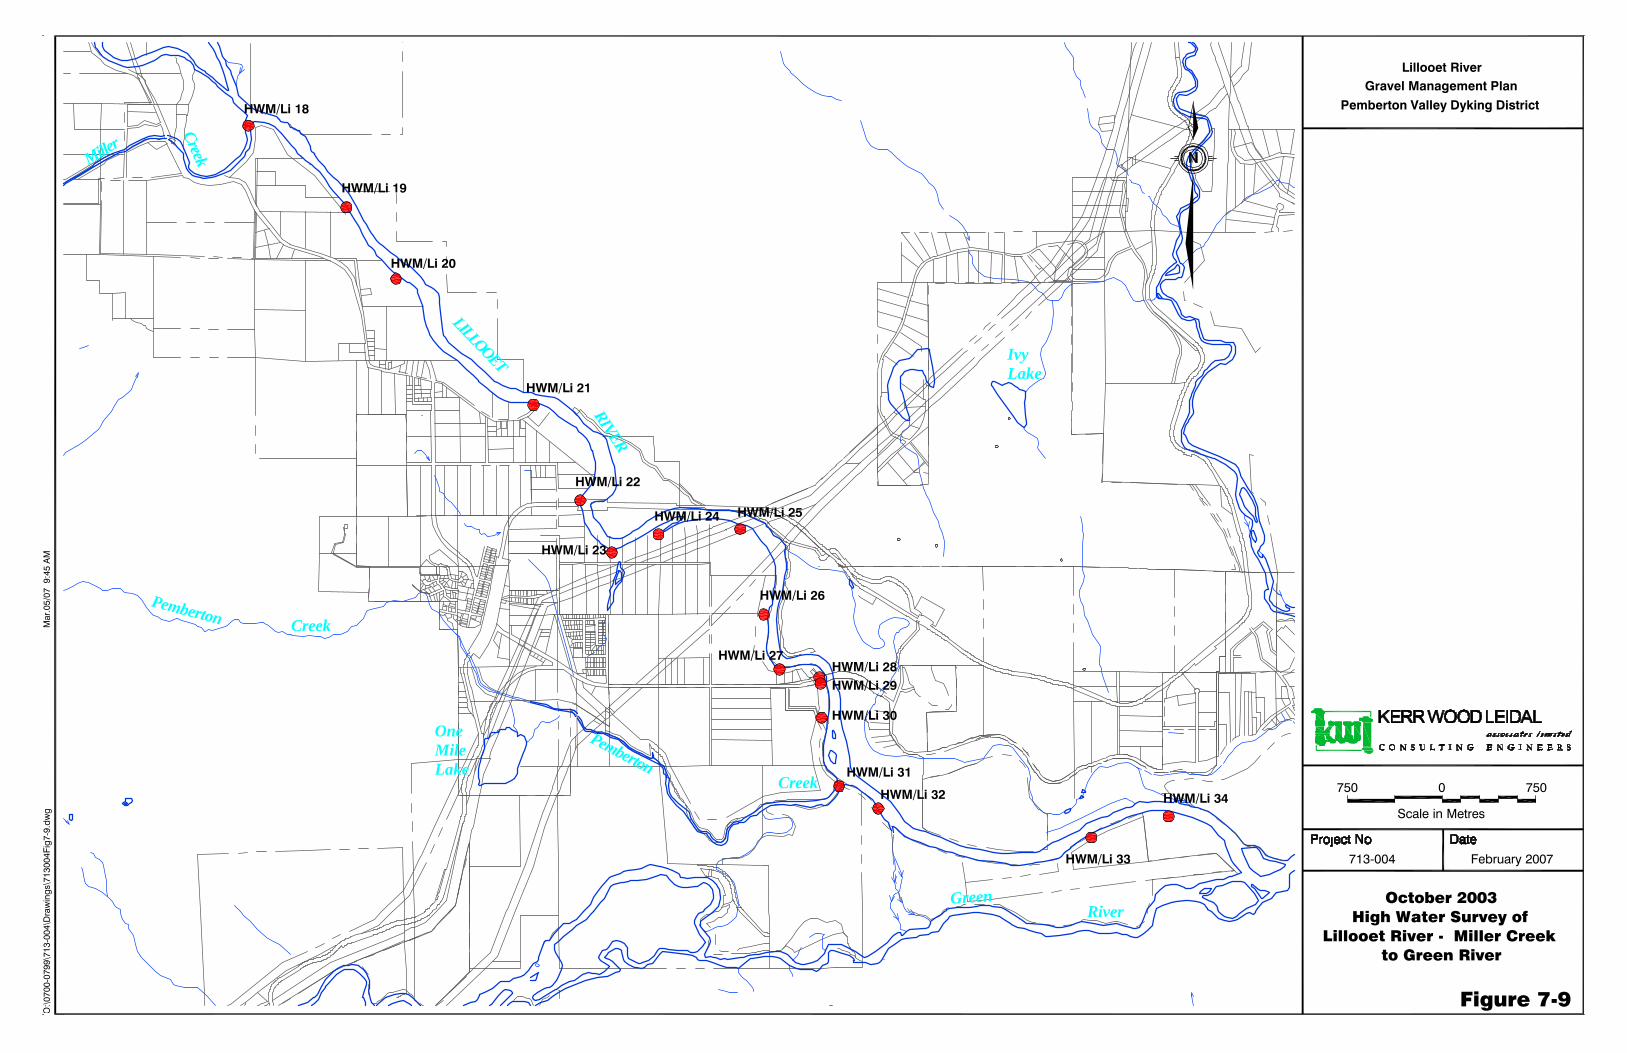
Lillooet RiverGravel Management Plan
Pemberton Valley Dyking District
Figure 7-9
713-004 February 2007
O:\0
700-
0799
\713
-004
\Dra
win
gs\7
1300
4Fig
7-9.
dwg
Mar
.05/
07 9
:45
AM
7500750
Scale in Metres
HWM/Li 18
HWM/Li 19
HWM/Li 20
HWM/Li 21
HWM/Li 22
HWM/Li 23
HWM/Li 24 HWM/Li 25
HWM/Li 26
HWM/Li 27HWM/Li 28HWM/Li 29
HWM/Li 30
HWM/Li 31
HWM/Li 32
HWM/Li 33
HWM/Li 34Creek
Pemberton
RIVER
LILLOOET
Miller
CreekPemberton
Creek
IvyLake
OneMileLake
GreenRiver
October 2003High Water Survey of
Lillooet River - Miller Creek to Green River
Section 8
Proposed Gravel Management Strategy
LILLOOET RIVER GRAVEL MANAGEMENT PLAN FINAL REPORT
PEMBERTON VALLEY DYKING DISTRICT FEBRUARY 2007
KERR WOOD LEIDAL ASSOCIATES LTD. 8-1 Consulting Engineers 713.004
8. PROPOSED GRAVEL MANAGEMENT STRATEGY This section provides a strategy for managing flood hazards in the lower Pemberton Valley by selective gravel removals from the Lillooet River.
8.1 HOW MUCH GRAVEL SHOULD BE REMOVED FROM THE RIVER?
Ongoing bedload transport in gravel-bed rivers is a critical component in the maintenance of river morphology. The transport of gravel-sized and larger sediment maintains normal turnover and renewal of gravels, leaving a loose substrate that can be easily mobilized to create instream morphologic complexity. A loose bed is critical for spawning salmonids while morphologic complexity is important for the maintenance and renewal of fish habitat.
GRAVEL MANAGEMENT ELSEWHERE
Experience from elsewhere has shown that where the bedload removal rate exceeds the sediment supply, channel simplification results. Most of the experience is from rivers where the removal volume is far in excess of supply – major degradation and channel simplification followed. Documented examples of such practices include many rivers in California, where the majority of the aggregate supply is provided by the fluvial environment. The impacts of gravel removal on the river morphology and ecosystem is not dealt with further in this document. For further information on the impacts of gravel removal, the reader is referred to the references listed below: � Collins, B. and Dunne, T. 1990. Fluvial geomorphology and river gravel mining: a
guide for planners, case studies included. California Department of Conservation, Division of Mines and Geology, Special Publication 98: 29 p.
� Rosenau, M.L. and Angelo, M. 2000. Sand and gravel management and fish-habitat protection in British Columbia salmon and steelhead streams. Pacific Fisheries Resource Conservation Council, Background Paper No. 2000/3, 70 p.
� Church, M., Ham, D., and Weatherly, H. 2001. Gravel Management in the Lower Fraser River. Report prepared for the City of Chilliwack, 110 p.
� Kondolf, M.G., Smeltzer, M. and Kimball, L. 2001. Freshwater gravel mining and dredging issues. White paper prepared for Washington Department of Fish and Wildlife, Washington Department of Ecology, and Washington Department of Transportation, 122 p.
� National Marine Fisheries Service (NOAA) – Southwest Region. 2004. Sediment removal from freshwater salmonid habitat: guidelines to NOAA Fisheries Staff for the evaluation of sediment removal actions from California Streams. 99 p.
LILLOOET RIVER GRAVEL MANAGEMENT PLAN FINAL REPORT
PEMBERTON VALLEY DYKING DISTRICT FEBRUARY 2007
KERR WOOD LEIDAL ASSOCIATES LTD. 8-2 Consulting Engineers 713.004
At present there is not an established criteria in North America as to how much bedload can be “safely” removed from the active channel of a river. However, it is generally accepted that the removal volume should not exceed the sediment supply on average. Church et al. (2001) recommended that the average removal rate of bedload from the gravel reach of the Fraser River should not exceed the best estimate of the annual gravel recruitment. The authors further recommended that the removal volume within a short sub-reach should not exceed ½ the estimated local bedload transport rate in a sequence of three consecutive years. The NOAA (2004) made a similar recommendation to maintain downstream habitats.
LILLOOET RIVER GRAVEL TRANSPORT
Geomorphic analyses indicate that the annual average bedload transport downstream of Miller Creek (km 20) is approximately 8,000 m3/year (Section 4). This transport estimate is roughly consistent with previous gravel removals from the mainstem channel. Between 1980 and 2000, the average volume of gravel removed from the Lillooet River downstream of Miller Creek was about 9,000 m3/year. During the same period, the cross-section data show no general rise in the channel bed. These trends suggest aggradation in lower reaches can be controlled by selected removals from gravel bars. Uncertainty remains in the bedload transport estimate due to the average 800 m spacing of the cross-sections. Because of the wide spacing, there may be considerable loss of topographic information particularly as the cross-sections do not tend to intersect sedimentation zones. However, the trends observed in the cross-section data and the documented removal volumes strongly indicate that the bedload transport estimate is reasonable.
Suggested Lillooet River Gravel Removal Quantity
Because some uncertainty remains in the estimate of the gravel transport rate, it is suggested that the PVDD proceed in a cautionary manner with gravel removal. An
average volume of 5,000 m3/year appears to be a prudent annual removal volume for
reaches downstream of km 20. It should be recognized that the supply of gravel to the river is variable. A considerable number of below average flood years can occur, resulting in small quantities of gravel being recruited to the lower river. In contrast, a significant flood such as the October 2003 event can transport volumes several times the average rate. Because of this variability, the extraction rate should not be increased automatically in response to a major flood. The suggested extraction rate should be implemented in an adaptive manner. Each extraction should be subject to follow-up monitoring (physical and biological surveys) to determine the net impact over several years. In addition, a detailed bathymetric survey of the Lillooet River between km 20 and km 8 should be completed every 5 to 10 years to monitor the reach-wide response of the channel to the removals. Previous surveys have

LILLOOET RIVER GRAVEL MANAGEMENT PLAN FINAL REPORT
PEMBERTON VALLEY DYKING DISTRICT FEBRUARY 2007
KERR WOOD LEIDAL ASSOCIATES LTD. 8-3 Consulting Engineers 713.004
been limited to monumented cross-sections spaced on average 800 m apart. A denser transect spacing on the order of 100 m is recommended to reduce the potential for information loss. Monumented cross-sections are quickly becoming obsolete for river management due to technological gains in surveying equipment and the reduced costs of detailed surveys. Reach-wide monitoring will enable PVDD to determine whether the suggested removal volume of 5,000 m3/year is sufficient to maintain the existing flood profile. Caution is necessary because the sediment budget is not known precisely. It also allows PVDD to modify procedures on the basis of accumulated experience to assure security from flooding and minimize the potential to adversely impact the river ecology. While a cautionary approach to removal volumes is recommended, it should be recognized that the morphology of the Lillooet River has already been considerably simplified due to river engineering works in the 1940’s (Figures 3-1 to 3-3). Hence, there is less risk of gravel removals causing significant morphological adjustments.
8.2 WHERE SHOULD GRAVEL BE REMOVED?
There are only a few gravel bars below Miller Creek that are suitable for gravel removal due to a simple channel morphology (Section 4.3). Existing bars with road access for heavy equipment are the most viable locations for gravel removal from a logistical and cost perspective. There are three candidate bars from which gravel could be removed with few difficulties: Voyageur Bar, Beem Bar and Big Sky Bar. Of the three candidate sites, removals can best be justified at Voyageur Bar and Beem Bar from a hydraulic perspective. Big Sky Bar is situated adjacent to a section of Airport Road that acts as a non-standard dyke. Based on the detailed hydraulic modelling, aggradation at the bar does not locally increase the flood hazard (Figure 7-8). Even with gravel removals at this location, the right bank would remain susceptible to backwater flooding from further downstream where the road crest is below the 200-year flood level (km 10.4) or from the Green River. Furthermore, the aggradation at Big Sky Bar is probably at or near an equilibrium elevation. Gravel bars tend to develop to a maximum height corresponding to the elevation that the river currents can transport gravel-sized sediment, often near normal flood water levels. It is possible that Big Sky Bar could extend both up and downstream, but it is more likely that any gravel being transported to the site will be conveyed further downstream. To account for this potential aggradation, gravel bars further upstream represent more effective sites for removal.
VOYAGEUR BAR AND BEEM BAR
Voyageur Bar and Beem Bar may also be at or near an equilibrium elevation. That is, the gravel bars are unlikely to aggrade significantly in the next several years such that the
LILLOOET RIVER GRAVEL MANAGEMENT PLAN FINAL REPORT
PEMBERTON VALLEY DYKING DISTRICT FEBRUARY 2007
KERR WOOD LEIDAL ASSOCIATES LTD. 8-4 Consulting Engineers 713.004
flood hazard is increased appreciably on a site-specific basis. The hydraulic modelling results show that the flood profile is raised by 0.1 m to 0.2 m at Beem Bar and Voyageur Bar when the bar sedimentation is accounted for. However, the goal of removals at these two sites is to interrupt sediment transport and prevent a slow overall increase in the river bed. Because the gravel bars are at or near equilibrium, gravel-sized sediment is likely to be deposited in the confined reaches between the existing bars. Over time, new gravel bars may form and the overall bed level will increase. Gravel removals over the last few decades have prevented such an occurrence. In effect, the proposed gravel removals will act as sediment traps with the removal areas being zones of preferred gravel deposition in subsequent floods. Because of channel constraints, the tendency is for gravel to accumulate at discrete depositional areas.
8.3 HOW FREQUENTLY SHOULD GRAVEL BE REMOVED?
In an idealized situation, detailed hydraulic modelling can be completed for candidate removal sites to establish the frequency of gravel removals. If the hydraulic model indicates inadequate freeboard, the required volume of gravel could be removed and the resulting topography would be considered the base condition. Surveys in subsequent years would indicate aggradational volumes at each of the bars and dictate the frequency and volume of removals. Such an approach would not be useful for the lower reaches of the Lillooet River given that the bars are at or near equilibrium and are unlikely to have significant vertical aggradation in the next several years. However, the overall channel bed will slowly rise over a period of decades, reducing the existing level of freeboard. An average transport rate of 8,000 m3/year below km 20 represents approximately 6 cm of aggradation over a decade and 0.6 m over a century. Aggradation of 0.6 m could equate to a 0.3 to 0.6 m rise in flood level. Hence, it is suggested that an average volume of 5,000 m3/year be removed from Voyageur Bar and Beem Bar. To minimize environmental impacts and the project cost, removal of approximately 15,000 m3 is suggested every third year. Three years should allow sufficient time for new gravel to be recruited to the removal sites. Subsequent excavations should not occur until most of the removal volume has been replaced.
LOCAL GRAVEL REMOVAL RATES
Constraints on the rate of gravel removal should be applied locally as well. Because gravel transport declines downstream, the rate of removal should not exceed one-half the estimated gravel transport rate. This will allow sufficient material to continue downstream and maintain normal turnover and renewal of gravel.
LILLOOET RIVER GRAVEL MANAGEMENT PLAN FINAL REPORT
PEMBERTON VALLEY DYKING DISTRICT FEBRUARY 2007
KERR WOOD LEIDAL ASSOCIATES LTD. 8-5 Consulting Engineers 713.004
On the basis of this suggestion, 3,500 m3/year on average could be removed from Voyageur Bar and 1,500 m3/year at Beem Bar. These rates equate to 10,500 m3 and 4,500 m3 respectively every third year.
8.4 HOW SHOULD GRAVEL BE REMOVED?
Three alternative gravel removal methods are discussed below: 1. Deep pits dug in or adjacent to the main channel. This strategy can be effective
where the influx of sediment is high and can be intercepted in the pit. This strategy has been used for a number of years on the Vedder River where the sediment transport rate is very high. However, the use of deep pits on the Lillooet River is not recommended due to the lower sediment transport rate. A deep pit at Voyageur Bar, for example, could take a number of years to fill. During low flow periods, the pit would likely act as a trap for juvenile fish and result in high mortality rates.
2. Bar scalping has been the preferred removal method in British Columbia for a
number of years. Because this activity can be conducted during low water (January 1 – March 15), there are no immediate impacts to water quality and spawning sites can be avoided. In the past, this strategy involved lowering of the bar surface, leaving a smooth surface with a slope of 1o to 2o down to the water to avoid the potential for fish stranding. Church et al. (2001) noted that bar scalping presented several problems from a habitat perspective:
� A relatively large area of the channel bed is disturbed in comparison to the
removal volume. The result is a loose surface that is more readily entrained during the subsequent freshet than is the normal, armoured bar surface.
� The removal leaves a featureless, semi-planar surface and eliminates irregularities
created by sedimentation on the bar surface. These irregularities constitute the microhabitats where juvenile fish tend to congregate.
� It reduces the elevation of the high bartop area, which can provide valuable
habitat at high stages. Church et al. also argue that because a relatively shallow excavation is made, the removal may have a minimal effect on water levels because relatively little water moves across bar tops, even in high flows. In the last several years, there has been a concerted move away from traditional bar scalping for gravel removal projects in British Columbia.
3. Church et al. (2001) have advocated a third alternative for gravel removal, bar-edge
scalping. Bar-edge scalping involves the excavation of gravel from the edge of the wetted channel such that the existing geometry is preserved. Using this strategy, the
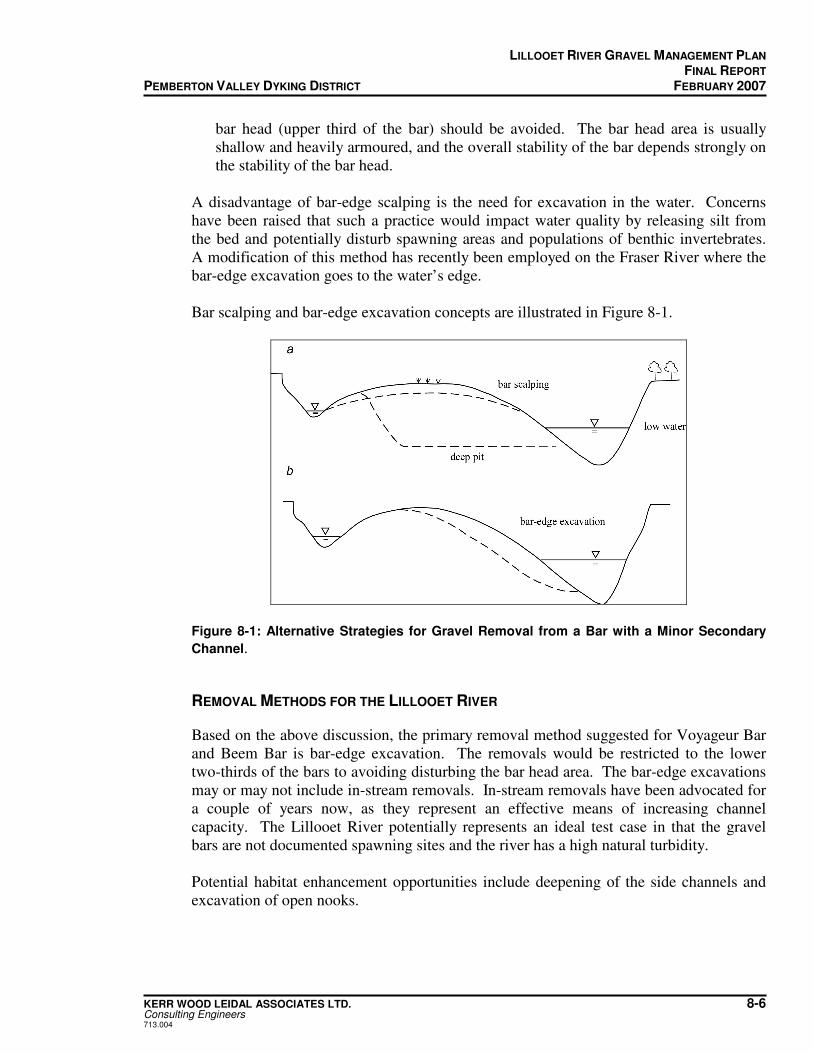
LILLOOET RIVER GRAVEL MANAGEMENT PLAN FINAL REPORT
PEMBERTON VALLEY DYKING DISTRICT FEBRUARY 2007
KERR WOOD LEIDAL ASSOCIATES LTD. 8-6 Consulting Engineers 713.004
bar head (upper third of the bar) should be avoided. The bar head area is usually shallow and heavily armoured, and the overall stability of the bar depends strongly on the stability of the bar head.
A disadvantage of bar-edge scalping is the need for excavation in the water. Concerns have been raised that such a practice would impact water quality by releasing silt from the bed and potentially disturb spawning areas and populations of benthic invertebrates. A modification of this method has recently been employed on the Fraser River where the bar-edge excavation goes to the water’s edge. Bar scalping and bar-edge excavation concepts are illustrated in Figure 8-1.
Figure 8-1: Alternative Strategies for Gravel Removal from a Bar with a Minor Secondary
Channel.
REMOVAL METHODS FOR THE LILLOOET RIVER
Based on the above discussion, the primary removal method suggested for Voyageur Bar and Beem Bar is bar-edge excavation. The removals would be restricted to the lower two-thirds of the bars to avoiding disturbing the bar head area. The bar-edge excavations may or may not include in-stream removals. In-stream removals have been advocated for a couple of years now, as they represent an effective means of increasing channel capacity. The Lillooet River potentially represents an ideal test case in that the gravel bars are not documented spawning sites and the river has a high natural turbidity. Potential habitat enhancement opportunities include deepening of the side channels and excavation of open nooks.
LILLOOET RIVER GRAVEL MANAGEMENT PLAN FINAL REPORT
PEMBERTON VALLEY DYKING DISTRICT FEBRUARY 2007
KERR WOOD LEIDAL ASSOCIATES LTD. 8-7 Consulting Engineers 713.004
ENHANCEMENT OPPORTUNITIES
Section 6 concludes that the importance of off-channel habitats within the upper Lillooet system is likely exceptional, especially in comparison to the main channel where habitat complexity is low. Gravel bars represent the single element of morphological complexity in the mainstem Lillooet River, but the morphology of bars is simple and the range of distinct habitats available for fish are limited. Side channels on the backside of gravel bars are complex in physical character, relative to the main channel, and host relatively high fish density and species richness. However, most side channels are relatively shallow due to sediment deposition, which limits the area of back-channel habitat available at lower discharge. Based on this evidence, there exists possible habitat enhancement opportunities around Voyageur Bar and Beem Bar by way of enlarging the side channels. This measure would increase the period over which the channels conveyed flow and the period that fish could access the channels for rearing. Side channel enlargement also would increase the wetted channel area for fish to occupy. A second possible enhancement opportunity would be to increase the physical complexity along the main channel bar edge by excavating open nooks (Figure 6-2). Such features would provide hydraulic shelter to fish within the main channel and broaden the range of velocity and depth conditions available for fish to exploit. Such features have been created successfully on the Fraser River.
8.5 WHEN SHOULD GRAVEL BE REMOVED?
A final question to be addressed is the time of year for gravel removal. DFO has established windows for gravel removal in British Columbia to minimize impacts to the life cycles of various fish species, although spawning salmonids are of primary concern. For dry excavations on bar surfaces, the traditional fisheries window extends from January 1 to March 15 during low flow winter conditions. The window may extend to March 30 during low flow years. The other fisheries window is during the summer months, July 1 to September 15. While the Lillooet River flow is typically very low during the winter removal window (Figure 6-1), the front end of this window is of limited benefit to PVDD. Gravel removal operations during the winter months are complicated in that excavations below the water level (such as the deepening of the side channels) will necessitate the loading of saturated gravel into dump trucks. If temperature is below or near freezing, there is the potential for water to spill out of the dump trucks and create icy conditions on the local roads. From a safety perspective, this is not a recommended option. The temperature is more likely to be above freezing in March. The summer fisheries window is also problematic in that the river discharge can be quite high during this period, particularly in August (Figure 6-1). It is possible that gravel
LILLOOET RIVER GRAVEL MANAGEMENT PLAN FINAL REPORT
PEMBERTON VALLEY DYKING DISTRICT FEBRUARY 2007
KERR WOOD LEIDAL ASSOCIATES LTD. 8-8 Consulting Engineers 713.004
removal projects could be squeezed into the period September 1 to September 15 when discharge is considerably lower. A third potential fisheries window is prior to the onset of the freshet. The March 15 deadline is primarily due to the emergence and downstream migration of pink, chum and chinook salmon. Pink and chum salmon are not found in the Lillooet River above Lillooet Lake, leaving chinook salmon as the primary concern. It is possible that a third fisheries window could be established from April 15 to May 15 prior to the onset of the freshet, although this is subject to DFO approval.
8.6 SUMMARY
This section provides a strategy for managing flood hazards in the lower Pemberton Valley by selective gravel removals from the Lillooet River below km 20. In summary, this strategy includes the elements listed below: � An average removal volume of 5,000 m3/year is suggested for reaches downstream of
km 20. While the estimated transport rate is 8,000 m3/year, some uncertainty remains in the sediment budget and PVDD should proceed with gravel removal in a cautionary manner.
� It should be recognized that the supply of gravel to the lower river is variable.
Because of this variability, the extraction rate should not be increased automatically in response to a major flood.
� A detailed bathymetric survey of the Lillooet River between km 20 and km 8 should
be completed approximately every 10 years to monitor the reach-wide response of the channel to the removals. Reach-wide monitoring will enable the PVDD to determine whether the suggested removal volume of 5,000 m3/year is sufficient to maintain the existing flood profile.
� Gravel removals are suggested at Voyageur Bar and Beem Bar. � To minimize disturbance impacts and the costs associated with the excavations,
gravel removal of approximately 15,000 m3 is suggested every third year. Subsequent excavation should not occur until a majority of the removal volume has been replaced.
� Because gravel transport declines downstream, the rate of removal should not exceed
one-half the estimated gravel transport rate. This suggestion will allow sufficient material to continue downstream and maintain normal turnover and renewal of gravel. On this basis, 3,500 m3/year on average could be removed from Voyageur Bar and 1,500 m3/year at Beem Bar. These rates equate to 10,500 m3 and 4,500 m3 respectively every third year.
LILLOOET RIVER GRAVEL MANAGEMENT PLAN FINAL REPORT
PEMBERTON VALLEY DYKING DISTRICT FEBRUARY 2007
KERR WOOD LEIDAL ASSOCIATES LTD. 8-9 Consulting Engineers 713.004
� The primary removal method suggested for Voyageur Bar and Beem Bar is a bar-
edge excavation that stops at the water’s edge to avoid in-stream removals. The bar head (the upper third of the bar) should not be disturbed to avoid the potential for destabilization of the bar complex. Potential habitat enhancement opportunities include deepening of the side channels and excavation of open nooks.
� Two fisheries windows exist for gravel removals from active channels in British
Columbia: January 1 to March 15 and July 1 to September 15. Both windows may be difficult to implement in the Pemberton Valley due to freezing temperatures for the former window and high river levels for the latter. It is possible that a third fisheries window could be established from April 15 to May 15 prior to the onset of the freshet. DFO will have to be contacted to discuss the potential for such a window.

Section 9
Summary and Recommendations

LILLOOET RIVER GRAVEL MANAGEMENT PLAN FINAL REPORT
PEMBERTON VALLEY DYKING DISTRICT FEBRUARY 2007
KERR WOOD LEIDAL ASSOCIATES LTD. 9-1 Consulting Engineers 713.004
9. SUMMARY AND RECOMMENDATIONS
9.1 SUMMARY
The key points in this report are summarized as follows:
LILLOOET RIVER
1. This report focuses on the gravel reach of the Lillooet River between the Forestry Bridge (km 40) and the confluence with the Green River (km 8).
2. The primary dyke in this area is the Lillooet Dyke, which is situated on the right
bank of the river from the confluence with Miller Creek (km 20) to Highway 99 (km 11.6).
ENGINEERING WORKS
3. Extensive engineering works were implemented in the Pemberton Valley after WWII to reclaim agricultural land and prevent future floods. Between 1946 and 1952, the river was shortened by 5 km and Lillooet Lake was lowered by 2.5 m.
4. The response of the river to the work was channel degradation of 2 to 4 m and
significant channel simplification. From an ecological perspective, there has been a considerable reduction in rearing habitat due to the loss of side and off channel habitat.
APPROACH TO GRAVEL MANAGEMENT
5. The results of hydraulic modelling completed by KWL in 2002 indicate that gravel removal should be considered from the Lillooet River between Miller Creek (km 20) and the Green River (km 8).
6. The desired elevation of the Lillooet Dyke is a minimum of the design flood level
(Qi200) plus 0.6 m freeboard. 7. The average annual bedload transport rate (gravel plus interstitial sand) below
Miller Creek is estimated at 8,000 m3/year. 8. Between 1980 and 2000, the average volume of gravel removed downstream of
km 20 was about 9,000 m3/year. During the same period, repeated cross-section data does not show a general rise in the channel bed. These trends suggest that aggradation in the lower reaches can be controlled by selected removal from gravel bars.
LILLOOET RIVER GRAVEL MANAGEMENT PLAN FINAL REPORT
PEMBERTON VALLEY DYKING DISTRICT FEBRUARY 2007
KERR WOOD LEIDAL ASSOCIATES LTD. 9-2 Consulting Engineers 713.004
FISH HABITAT
9. Habitat assessment and fish sampling was conducted at five gravel bar sites in the Lillooet River between August 2003 and June 2004. The purpose of sampling was to assess habitat characteristics of gravel bars in the main channel and evaluate the use of bar habitats by fish.
10. A number of habitat units were identified around the perimeter of the Lillooet
River gravel bars (Figure 6-2). These habitats were sampled by beach seine. 11. The assessment concluded that gravel bars in the Lillooet River have a simple
morphology with low habitat complexity, particularly along the main channel flank. The greatest habitat diversity associated with the gravel bars was observed within narrow side channels on the backside of several bars.
12. Limited sampling was carried out at the mouths of several tributaries to assess
remaining off-channel habitats on the undeveloped left bank of the river. The importance of these remaining off-channel habitats (side channels, vegetated banks, sloughs, and small tributaries) appears to be exceptional relative to the mainstem channel.
HYDRAULIC MODELLING
13. The Adventure Ranch Dyke and a 0.55 km section of the Airport Road also have inadequate freeboard and should be raised by 0.4 to 0.5 m.
14. Detailed surveys were completed for Voyageur Bar, Beem Bar and Big Sky Bar.
Based on the new survey data, additional cross-sections were then input into the existing hydraulic model. The updated model shows flood level increases of up to 0.2 m at the identified aggradation zones.
PROPOSED GRAVEL MANAGEMENT STRATEGY
15. An average removal volume of 5,000 m3/year is suggested for reaches downstream of km 20.
16. A detailed bathymetric survey between km 20 and km 8 should be completed
every 10 years to monitor the reach-wide response of the channel to the removals. 17. Gravel removals should occur at Voyageur Bar and Beem Bar.
18. To minimize disturbance impacts and the costs associated with the excavations,
removal of approximately 15,000 m3 of gravel is suggested every third year. 19. Potential habitat enhancement opportunities include deepening of the side
channels and excavation of open nooks on the main channel flank.

LILLOOET RIVER GRAVEL MANAGEMENT PLAN FINAL REPORT
PEMBERTON VALLEY DYKING DISTRICT FEBRUARY 2007
KERR WOOD LEIDAL ASSOCIATES LTD. 9-3 Consulting Engineers 713.004
20. A potential fisheries window between April 15 and May 15 should be discussed
with DFO.
9.2 RECOMMENDATIONS
It is recommended that PVDD: 1. Submit copies of this report to the following agencies:
� Fisheries and Oceans Canada (DFO); and � BC Ministry Environment (MOE).
2. Adopt the gravel management strategy for the Lillooet River as outlined in
Section 8 of this report, comprising the following key elements:
a) remove an average of 5,000 m3 of gravel per year between Miller Creek and Green River;
b) focus gravel removal at Voyageur Bar and Beem Bar due to good access and hydraulic benefits;
c) implement the strategy by removing about 15,000 m3 of gravel every 3 years (10,500 m3 from Voyageur Bar and 4,500 m3 from Beem Bar) to reduce disturbance and improve cost effectiveness;
d) undertake a detailed bathymetric survey about every 10 years; e) favour bar-edge excavation over the conventional, bar scalping technique; and f) consult with DFO regarding a possible April/May removal window rather than
the traditional January 1 to March 15 and July 1 to September 15 windows.
3. Consult with DFO and MOE regarding the initial gravel removal project to be implemented under the strategy. If possible, proceed with an initial gravel removal project in 2007 or 2008.
4. Prepare a design for the initial gravel removal project. Submit project
applications to MOE, DFO and CCG with design drawings, a design brief and an environmental review.
5. Review the gravel management strategy approximately every 10 years in
consideration of updated bathymetric surveys and consultation with environmental agencies.
6. Consider updating the Lillooet River hydraulic model to reflect current cross-
sections and updated hydrologic data.
LILLOOET RIVER GRAVEL MANAGEMENT PLAN FINAL REPORT
PEMBERTON VALLEY DYKING DISTRICT FEBRUARY 2007
KERR WOOD LEIDAL ASSOCIATES LTD. Consulting Engineers 713.004
BIBLIOGRAPHY
Bailey, D.D. 1979. Chinook salmon enhancement in the Lillooet – Birkenhead Rivers system. BC Ministry of Environment, Lands and Parks, Fisheries Section. Surrey, BC.
Kerr Wood Leidal Associates Ltd. December 2002. Engineering Study for Lillooet
River Corridor. Report prepared for the Pemberton Valley Dyking District; Mount Currie Band; Indian and Northern Affairs Canada, Public Works and Government Services Canada; and the BC Ministry of Water, Land and Air Protection.
Kerr Wood Leidal Associates Ltd. January 2004. October 2003 Flood Phase I Recovery
Plan. Report prepared for the Pemberton Valley Dyking District. Rempel, L.L. 2004. Physical and ecological organization of a large gravel-bed river and
response to disturbance by gravel mining. Ph.D. thesis, Dept. of Geography, University of British Columbia, Vancouver, BC.

Appendix A
MOE Approval Application or Notification for Changes In and About a Stream
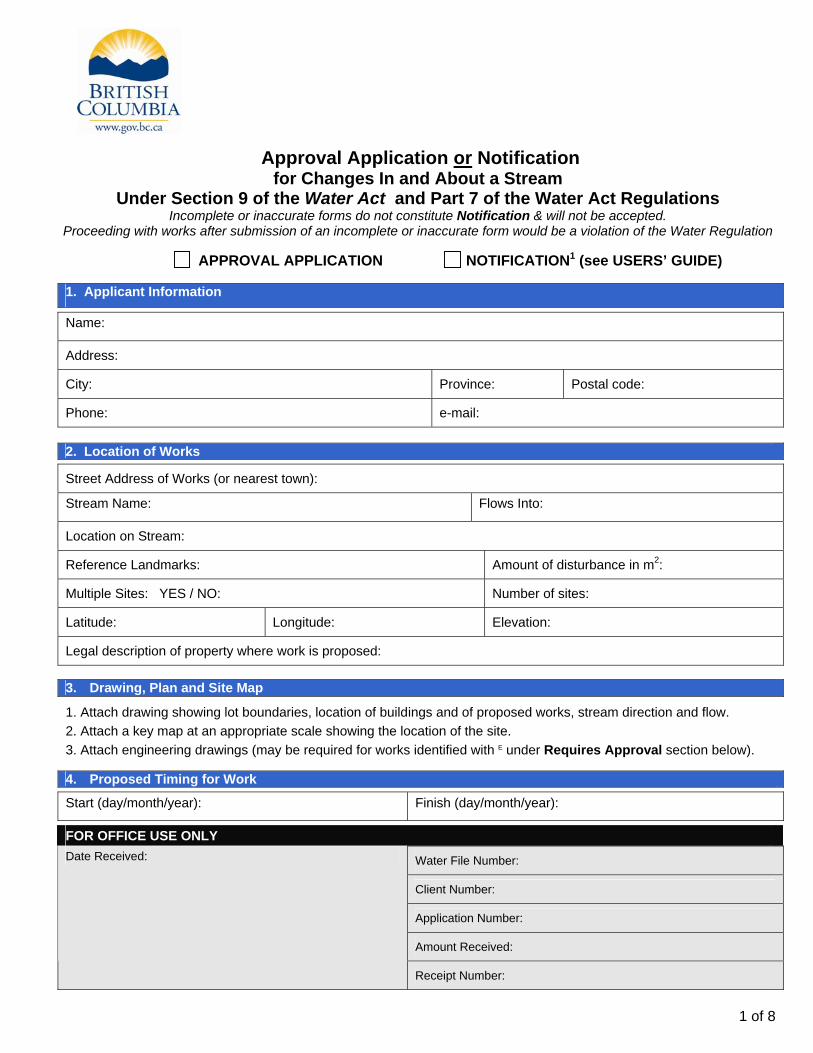
1 of 8
Approval Application or Notification for Changes In and About a Stream
Under Section 9 of the Water Act and Part 7 of the Water Act Regulations Incomplete or inaccurate forms do not constitute Notification & will not be accepted.
Proceeding with works after submission of an incomplete or inaccurate form would be a violation of the Water Regulation
APPROVAL APPLICATION NOTIFICATION1 (see USERS’ GUIDE)
1. Applicant Information
Name:
Address:
City: Province: Postal code:
Phone: e-mail:
2. Location of Works
Street Address of Works (or nearest town):
Stream Name: Flows Into:
Location on Stream:
Reference Landmarks: Amount of disturbance in m2:
Multiple Sites: YES / NO: Number of sites:
Latitude: Longitude: Elevation:
Legal description of property where work is proposed:
3. Drawing, Plan and Site Map
1. Attach drawing showing lot boundaries, location of buildings and of proposed works, stream direction and flow. 2. Attach a key map at an appropriate scale showing the location of the site. 3. Attach engineering drawings (may be required for works identified with E under Requires Approval section below).
4. Proposed Timing for Work
Start (day/month/year): Finish (day/month/year):
FOR OFFICE USE ONLY
Water File Number:
Client Number:
Application Number:
Amount Received:
Date Received:
Receipt Number:

2 of 8
Detailed Description of Work to be Performed (continue on next page):
Total area disturbed by proposed works (all sites): m2
5. Type of Works Requires Approval: Requires Notification:
Bank Erosion Protection E
Bridge Installation/maintenance/removal (other than clear span) E
Stream Diversion QP Diversion berm structure plan required
Large Debris Removal – by machine QP plan required
Gravel Removal QP
Other: Provide details in space below *Provide culvert dimensions: Length: Width: Diameter: ______________________ E Professional Engineer may be required QP Qualified Professional may be required
Installation*/maintenance/removal of road crossing culvert (*follow Forest Practices Code Stream Crossing Guidebook)
Construction/maintenance/removal of a clear span bridge Construction/maintenance of a pipeline crossing Construction/maintenance/removal of a pier or wharf Cutting of annual vegetation in a stream channel Repair/maintenance of existing dike or erosion protection works Construction/maintenance of storm water outfalls Control of Eurasian Watermilfoil or other aquatic vegetation Construction/maintenance of ice bridge, winter ford or snowfall Maintenance of minor and routine nature by a public utility Removal of a beaver dam (As authorized under the Wildlife Act) Small debris removal – by hand Construction of a temporary ford Construction of a temporary diversion around a worksite
The following require Notification and may only be undertaken by the Crown in right of either Canada or British Columbia, or their Agents: Federal/Provincial
Construction/maintenance/removal of a flow or water level measuring device
Construction/removal of a fish fence or screen, fish or game guard
Restoration/maintenance of fish habitat
The following require Notification and may only be undertaken by the Crown in right of either British Columbia, or a Municipality, or their Agents: Provincial/Municipal
Restoration/maintenance of a stream channel
Clearing of an obstruction from a bridge or culvert during a flood emergency1
Construction or placement of erosion protection works or flood protection works during a flood emergency2 1 Some activities fitting the description for Notification may be reviewed by Ministry/Agency staff, who may decide that an Approval is
required 2 Must be completed under direction of the Crown. No notification is required prior to undertaking works, but a description of changes
must be submitted to a habitat officer within 72 hours of the change QP QP means a professional who through suitable education, experience, accreditation and knowledge may be reasonably relied on to
provide advice within their area of expertise.

3 of 8
Detailed Description of Work to be Performed, continued (attach a separate document if more space is required):
6. Land Ownership Please check one of the following:
The applicant is the owner of the property.
The property is Crown land. Tenure/licence number:
The property is owned by the following Landowner (i.e. Landowner is different from applicant):
Landowner’s Name:
Address:
City: Province: Postal code:
Phone: e-mail:
Do you have the Landowner’s written approval to enter the land(s) to complete the works? Yes No Note: a) Ownership of all parcels of land on which the proposed works will occur must be identified, b) do not attach the written approval with the application, but keep it for your files as you may be asked to produce it during an inspection or audit.
7. Who is doing the Work? Contact information for company designing and supervising construction of the work (if different from applicant):
Company Name:
Contact Name: Professional Affiliation:
Address:
City: Province: Postal Code:
Phone: e-mail:
Contact information for company undertaking the construction (if different from applicant):
Company Name:
Contact Name:
Address:
City: Province: Postal Code:
Phone: e-mail:

4 of 8
8. Statement of Intent
By submitting this application form, I declare that the information contained on this form is complete and accurate information. I have read, understood and will meet the requirements to construct works and changes in and about a stream in accordance with Section 9 of the Water Act and Part 7 Water Act Regulations including, for Notifications, Terms and Conditions as specified by a Habitat Officer of the Ministry of Environment.
Signed:
Application Date: . . day/month/year
9. Submission Instructions
Send the completed form along with the following attachments to the local office in which the proposed works are located. Addresses for local offices are listed on the instruction sheet. Please note that the Approval application fee of $130 is non-refundable. If the proposed works require an Approval, prior to proceeding further with this application please ensure that this project will be able to proceed under the Federal Fisheries Act.
Sketch plan (mandatory) Engineering drawing (mandatory for works requiring approval noted with E)
Key location map (mandatory) For works requiring an Approval, a cheque or money order for $130 payable
to: Minister of Finance. The fee is non-refundable. 10. Responsibilities
You are required to comply with all applicable federal, provincial and municipal laws and regulations. If you anticipate that the planned work may result in harmful alteration, disruption or destruction of fish habitat you should send a copy of your completed Notification/Approval Application directly to the nearest office of Fisheries and Oceans Canada. Review and comment by DFO may necessitate changes to the proposed works.
Has a copy of this notification/approval application been sent to Fisheries and Oceans Canada (check one)? YES NO If YES, indicate the DFO office that the notification/approval application has been sent (for DFO offices, see Users’ Guide): _________________________________________________________________________________
5 of 8
Instructions and Guidelines For Completing the Approval Application and Notification Form
Please fill in all sections of the form. Incomplete forms do not constitute notification and will not be accepted.
Applications must be submitted to the appropriate office prior to commencement of any work, and must accommodate local fish timing windows.
After reading “A Users Guide to Working In and Around Water” and the Water Regulation Part 7, Section 36 to 44, by checking one of the boxes, indicate at the top of the form whether you are submitting an Approval Application or making Notification. 1. Applicant Information
Enter your name, mailing address, telephone number, and e-mail address.
2. Location of Works
Identify the street address of works and the name and location of the stream/lake on which you intend to carry out the proposed works. If works occur on more than one property all properties must be identified.
Indicate what stream, river or lake the stream flows into. Specify where on the stream/lake the works are to take place. Be as specific as possible
(e.g. provide the distance from road crossing or confluence with another stream) and reference landmarks were available.
Indicate the latitude, longitude and elevation of the site. Indicate the location of works if different from your mailing address. Enter a complete legal description of the property on which the works are to be carried
out (e.g. Lot 1 of Section 31, Township 20, Range 2, Coast District, Plan 18411). This information is listed on your annual assessment or land tax notice, or you may obtain it by requesting a copy of your Certificate of Title from the appropriate Land Title Office.
3. Drawing, Plan and Site Map
Attach a drawing or map, which clearly shows: The total amount of disturbance (m2), including multiple sites if applicable A key map showing the general location of the proposed work site The lot boundaries of where the works are to take place The exact location of proposed works The stream and direction of flow The location of house/buildings/other works The approximate scale (e.g. 1 cm = 10 m)
A copy of part of a cadastral or topographic map or legal plan, at a reasonable scale, may be used for the drawing, including photographs of the site is beneficial.
4. Proposed Timing for Work
Indicate proposed start and finish date of the works (day/month/year).

6 of 8
For instream work window times for your area, check the Ministry of Environment regional websites: http://www.env.gov.bc.ca/esd/esd_reg_ops.html .
5. Type of Works
Identify the nature of the works by checking one of the boxes. Also, note the dimensions of the works and list length, width and diameter where appropriate. Provide a detailed description of the work to be performed and specify the maximum total area expected to be disturbed by the proposed works. Only the types of works described under Section 44(1) in Part 7 of the Water Regulation may proceed by notification and without an approval under the Water Act. Note that the following items do not require notification or approval, but must be carried out in accordance with the regulation:
• Installation or cleaning of drain tile outlets • Repair/maintenance of superstructure of bridge • Installation/repair/maintenance/removal of fences
6. Land Ownership
If you own the land on which the works are to be carried out, check the first box and go to section 7 of the form.
If you are not the owner of the land, indicate whether the land is privately owned or owned by the Crown.
For all private lands, you must have the landowner’s written approval. The application form must contain the landowners address, telephone number and postal code. Do not attach the landowner’s written approval with the application, but keep it in your files as you may be asked to produce it during an inspection or audit.
If you have Tenure or License on Crown Land, please include the Tenure or License number on your application.
7. Who is Doing the Work?
If you are not carrying out the work, indicate contractor/company’s name, professional affiliation, mailing address, postal code and telephone numbers. If a different company is designing and supervising the work, please include this information as well. It is the applicants responsibility to ensure that any contractor working on your behalf reads and understands the Approval, “A Users’ Guide to Working In and Around Water”; the Water Regulation Part 7, Sec. 36 - and/or terms and conditions specified by a Habitat Officer under Section 42 and/or recommended by your Qualified Professional as related to the protection of habitat.
8. Statement of Intent
Make sure each section of the form is filled out and that the information is accurate and complete. After you have read and understood the conditions outlined in the Section 7 Water Act Regulation and ensured that your project meets all requirements and will comply with Section 9 of the Water Act or part 7 of the Water Act Regulations (including, for Notifications, Terms and Conditions specified by the Habitat Officer, Ministry of Environment), please sign and date the form.
7 of 8
9. Submission Instructions
When your form is complete, send it, along with the appropriate attachments to: APPROVAL APPLICATIONS
The Ministry of Environment or field office indicated on the last page of this document.
NOTIFICATIONS
You must submit a notification form prior to starting proposed changes in and about a stream. Notifications must be provided to the Ministry of Environment office located nearest to the proposed works, except for those works located in the Thompson, Okanagan, Kootenay regions, where both Approval Applications and Notifications are to be provided to Ministry of Environment in Kamloops. Regional requirements such as Terms and Conditions and guidance material such as best management practices and useful local information are located on regional MoE web pages www.env.gov.bc.ca/main/prgs/regions.htm. Additional terms and/or conditions related to the protection of habitat may also be specified by a Habitat Officer. It is the applicant's responsibility to ensure that all sections of the notification form are complete. Submission of an incomplete form does not constitute notification. For notifications, if you agree to all the requirements, including the Habitat Officers Terms and Conditions, you may proceed with your proposed changes without waiting for a formal response from MoE. Notifications received by regional offices of MoE will be used to plan and carry out on-site inspections and monitoring during and after the changes in and about a stream.
10. Responsibilities
You are required to comply with all applicable federal, provincial and municipal laws and regulations.
The Federal Fisheries Act states “no person shall carry on any work or undertaking that results in harmful alteration, disruption or destruction of fish habitat” and “no person shall deposit or permit the deposit of a deleterious substance of any type in water frequented by fish”. Failure to show due diligence in the protection of fish and fish habitat could result in violations of the Fisheries Act. If installing a culvert, you must use the Forest Practices Code: Fish Stream Crossing Guidebook, 1998, prepared by MOF and MoE and available at: http://www.for.gov.bc.ca/tasb/legsregs/fpc/FPCGUIDE/FishStreamCrossing/FSCGdBk.pdf, or you must contact Fisheries and Oceans Canada. Many instream works also require approval under the Navigable Waters Protection Act: http://www.pacific.ccg-gcc.gc.ca Also, it is strongly recommended that “Standards and Best Practices for Instream Works” be used, where applicable, when working in and around streams: http://www.env.gov.bc.ca/wld/documents/bmp/iswstdsbpsmarch2004.pdf The Provincial Water Act and Regulation can be found at: http://www.qp.gov.bc.ca/statreg/stat/W/96483_01.htm
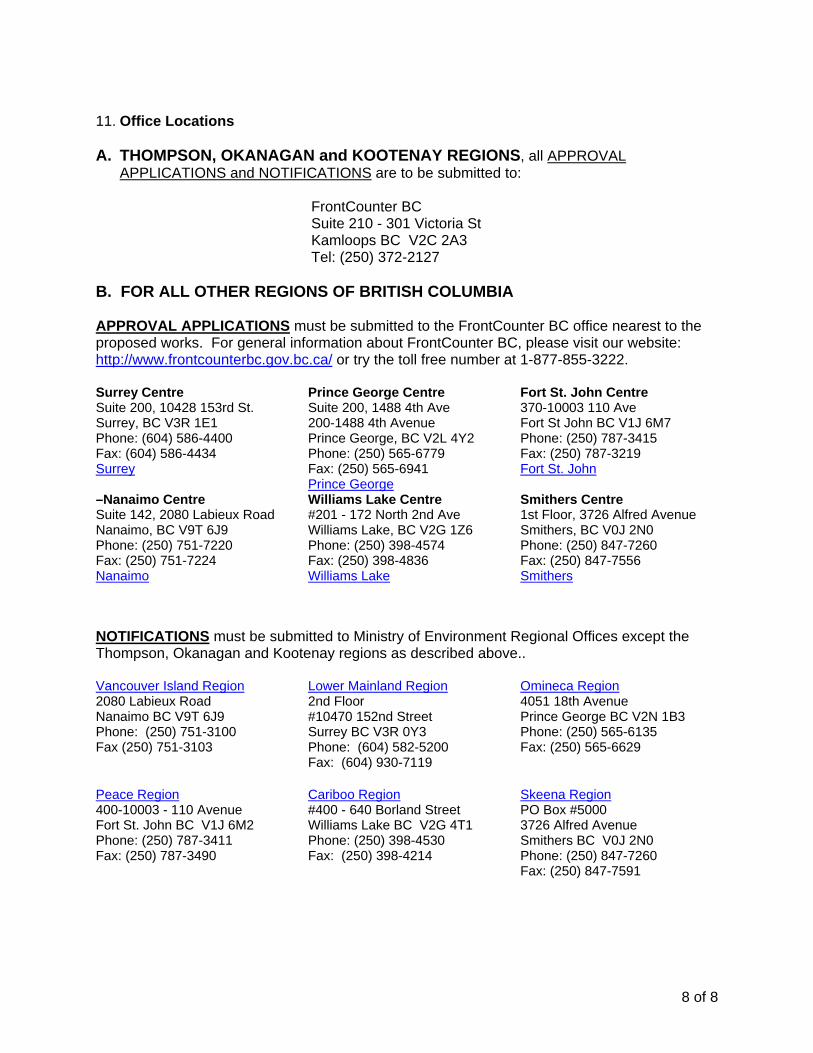
8 of 8
11. Office Locations A. THOMPSON, OKANAGAN and KOOTENAY REGIONS, all APPROVAL
APPLICATIONS and NOTIFICATIONS are to be submitted to:
FrontCounter BC Suite 210 - 301 Victoria St Kamloops BC V2C 2A3 Tel: (250) 372-2127
B. FOR ALL OTHER REGIONS OF BRITISH COLUMBIA APPROVAL APPLICATIONS must be submitted to the FrontCounter BC office nearest to the proposed works. For general information about FrontCounter BC, please visit our website: http://www.frontcounterbc.gov.bc.ca/ or try the toll free number at 1-877-855-3222. Surrey Centre Suite 200, 10428 153rd St. Surrey, BC V3R 1E1 Phone: (604) 586-4400 Fax: (604) 586-4434 Surrey
Prince George Centre Suite 200, 1488 4th Ave 200-1488 4th Avenue Prince George, BC V2L 4Y2 Phone: (250) 565-6779 Fax: (250) 565-6941 Prince George
Fort St. John Centre 370-10003 110 Ave Fort St John BC V1J 6M7 Phone: (250) 787-3415 Fax: (250) 787-3219 Fort St. John
–Nanaimo Centre Suite 142, 2080 Labieux Road Nanaimo, BC V9T 6J9 Phone: (250) 751-7220 Fax: (250) 751-7224 Nanaimo
Williams Lake Centre #201 - 172 North 2nd Ave Williams Lake, BC V2G 1Z6 Phone: (250) 398-4574 Fax: (250) 398-4836 Williams Lake
Smithers Centre 1st Floor, 3726 Alfred Avenue Smithers, BC V0J 2N0 Phone: (250) 847-7260 Fax: (250) 847-7556 Smithers
NOTIFICATIONS must be submitted to Ministry of Environment Regional Offices except the Thompson, Okanagan and Kootenay regions as described above.. Vancouver Island Region 2080 Labieux Road Nanaimo BC V9T 6J9 Phone: (250) 751-3100 Fax (250) 751-3103
Lower Mainland Region 2nd Floor #10470 152nd Street Surrey BC V3R 0Y3 Phone: (604) 582-5200 Fax: (604) 930-7119
Omineca Region 4051 18th Avenue Prince George BC V2N 1B3 Phone: (250) 565-6135 Fax: (250) 565-6629
Peace Region 400-10003 - 110 Avenue Fort St. John BC V1J 6M2 Phone: (250) 787-3411 Fax: (250) 787-3490
Cariboo Region #400 - 640 Borland Street Williams Lake BC V2G 4T1 Phone: (250) 398-4530 Fax: (250) 398-4214
Skeena Region PO Box #5000 3726 Alfred Avenue Smithers BC V0J 2N0 Phone: (250) 847-7260 Fax: (250) 847-7591

Appendix B
Photographs
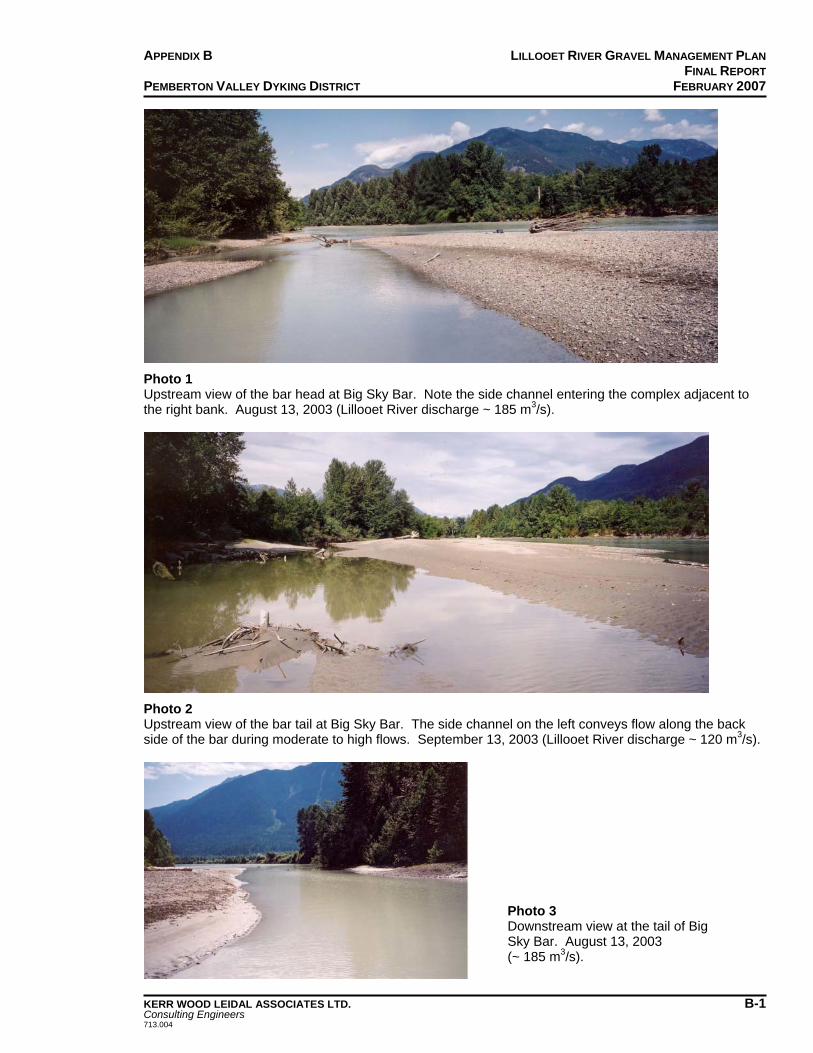
APPENDIX B LILLOOET RIVER GRAVEL MANAGEMENT PLAN FINAL REPORT PEMBERTON VALLEY DYKING DISTRICT FEBRUARY 2007
Photo 1 Upstream view of the bar head at Big Sky Bar. Note the side channel entering the complex adjacent to the right bank. August 13, 2003 (Lillooet River discharge ~ 185 m3/s).
Photo 2 Upstream view of the bar tail at Big Sky Bar. The side channel on the left conveys flow along the back side of the bar during moderate to high flows. September 13, 2003 (Lillooet River discharge ~ 120 m3/s).
Photo 3 Downstream view at the tail of Big Sky Bar. August 13, 2003 (~ 185 m3/s).
KERR WOOD LEIDAL ASSOCIATES LTD. B-1 Consulting Engineers 713.004
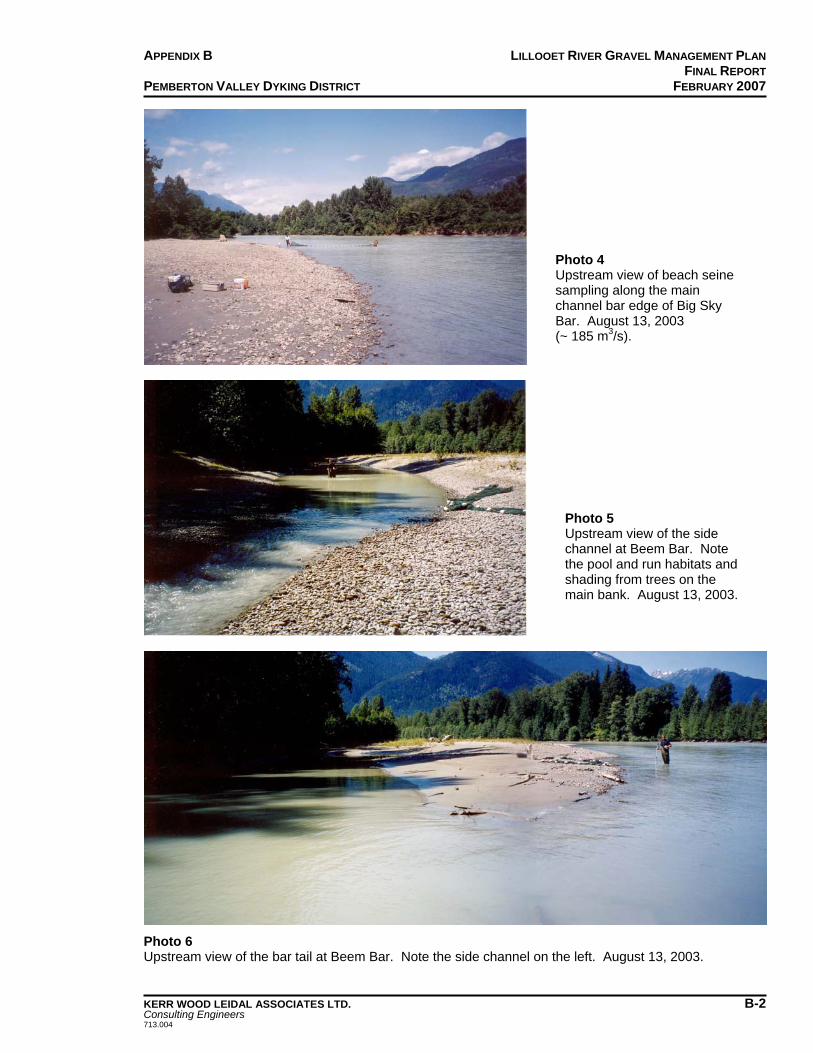
APPENDIX B LILLOOET RIVER GRAVEL MANAGEMENT PLAN FINAL REPORT PEMBERTON VALLEY DYKING DISTRICT FEBRUARY 2007
Photo 4 Upstream view of beach seine sampling along the main channel bar edge of Big Sky Bar. August 13, 2003 (~ 185 m3/s).
Photo 5 Upstream view of the side channel at Beem Bar. Note the pool and run habitats and shading from trees on the main bank. August 13, 2003.
Photo 6 Upstream view of the bar tail at Beem Bar. Note the side channel on the left. August 13, 2003.
KERR WOOD LEIDAL ASSOCIATES LTD. B-2 Consulting Engineers 713.004
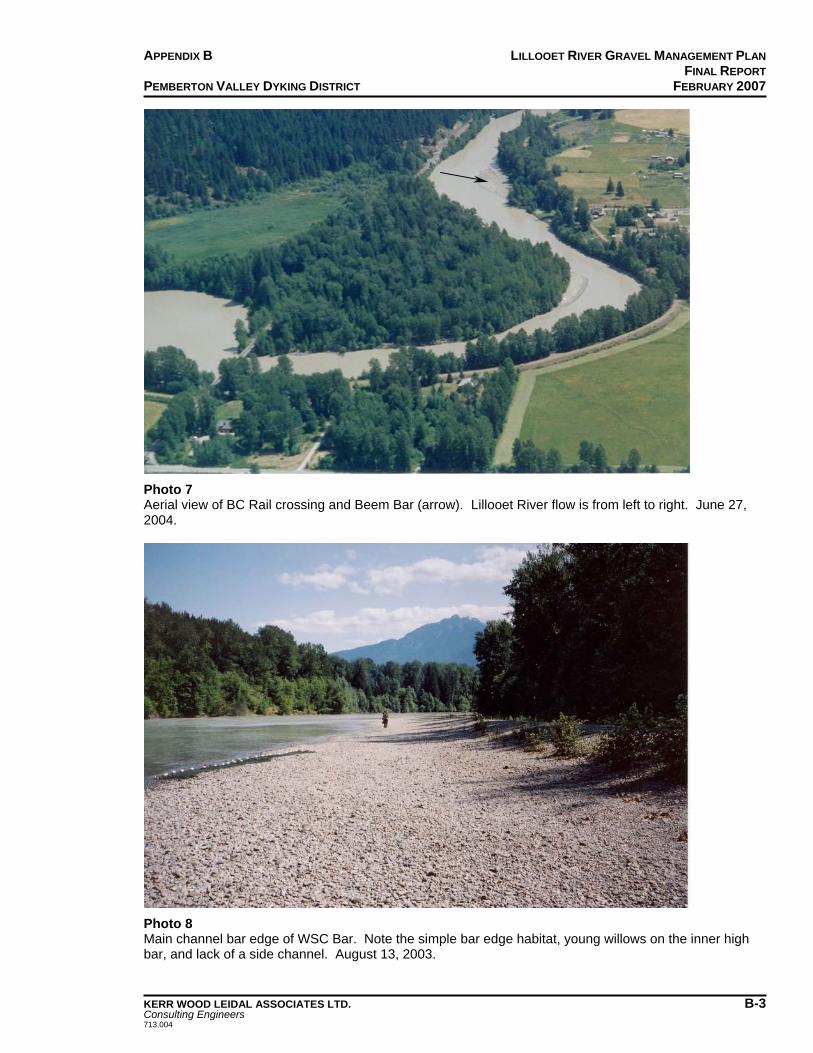
APPENDIX B LILLOOET RIVER GRAVEL MANAGEMENT PLAN FINAL REPORT PEMBERTON VALLEY DYKING DISTRICT FEBRUARY 2007
Photo 7 Aerial view of BC Rail crossing and Beem Bar (arrow). Lillooet River flow is from left to right. June 27, 2004.
Photo 8 Main channel bar edge of WSC Bar. Note the simple bar edge habitat, young willows on the inner high bar, and lack of a side channel. August 13, 2003.
KERR WOOD LEIDAL ASSOCIATES LTD. B-3 Consulting Engineers 713.004
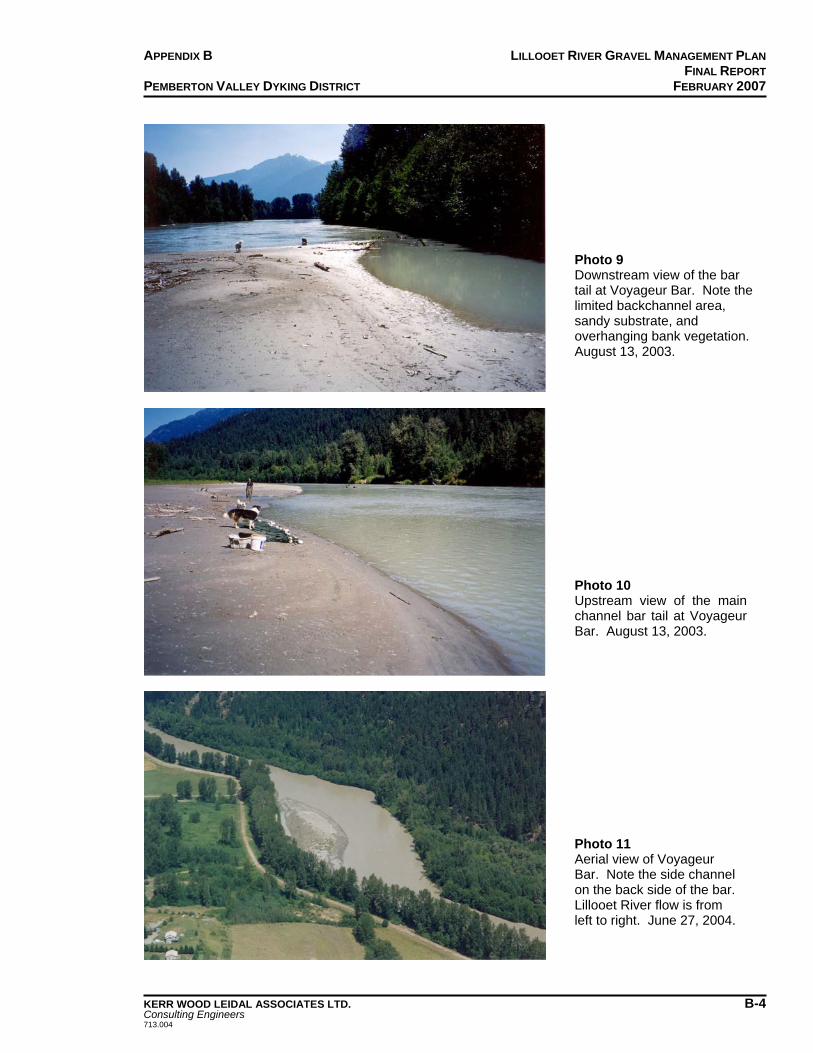
APPENDIX B LILLOOET RIVER GRAVEL MANAGEMENT PLAN FINAL REPORT PEMBERTON VALLEY DYKING DISTRICT FEBRUARY 2007
Photo 9 Downstream view of the bar tail at Voyageur Bar. Note the limited backchannel area, sandy substrate, and overhanging bank vegetation. August 13, 2003.
Photo 10 Upstream view of the mainchannel bar tail at VoyageurBar. August 13, 2003.
Photo 11 Aerial view of Voyageur Bar. Note the side channel on the back side of the bar. Lillooet River flow is from left to right. June 27, 2004.
KERR WOOD LEIDAL ASSOCIATES LTD. B-4 Consulting Engineers 713.004
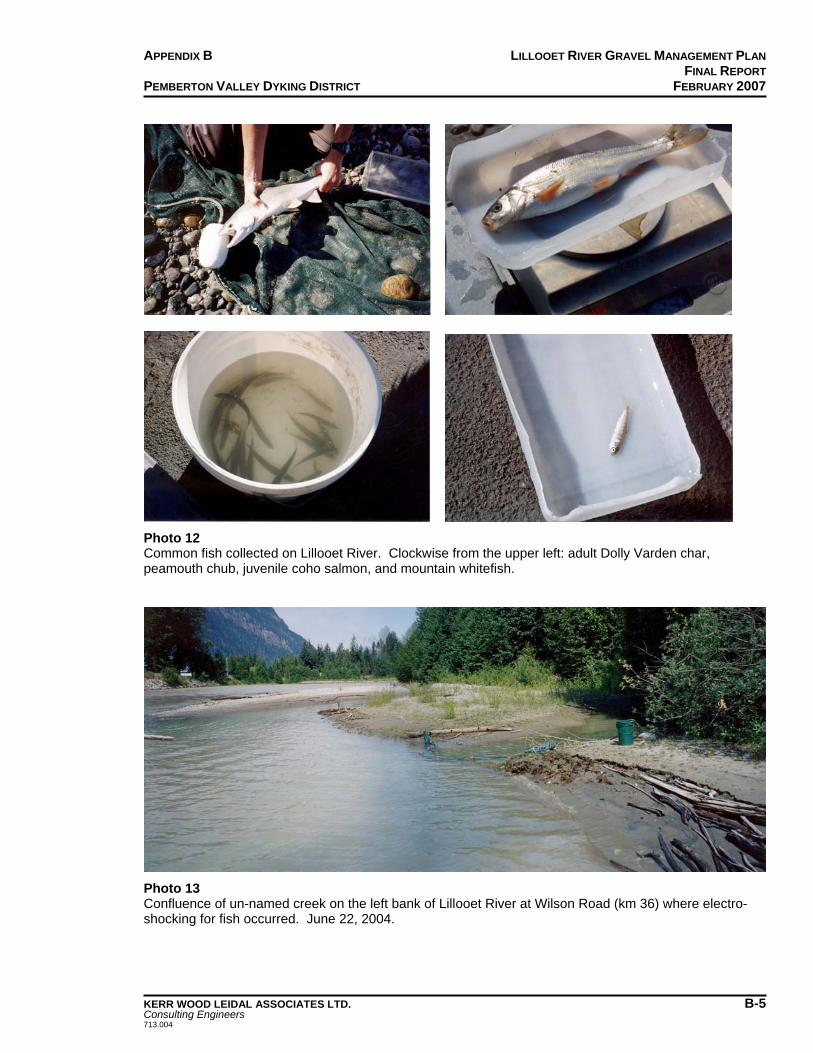
APPENDIX B LILLOOET RIVER GRAVEL MANAGEMENT PLAN FINAL REPORT PEMBERTON VALLEY DYKING DISTRICT FEBRUARY 2007
Photo 12 Common fish collected on Lillooet River. Clockwise from the upper left: adult Dolly Varden char, peamouth chub, juvenile coho salmon, and mountain whitefish.
Photo 13 Confluence of un-named creek on the left bank of Lillooet River at Wilson Road (km 36) where electro-shocking for fish occurred. June 22, 2004.
KERR WOOD LEIDAL ASSOCIATES LTD. B-5 Consulting Engineers 713.004
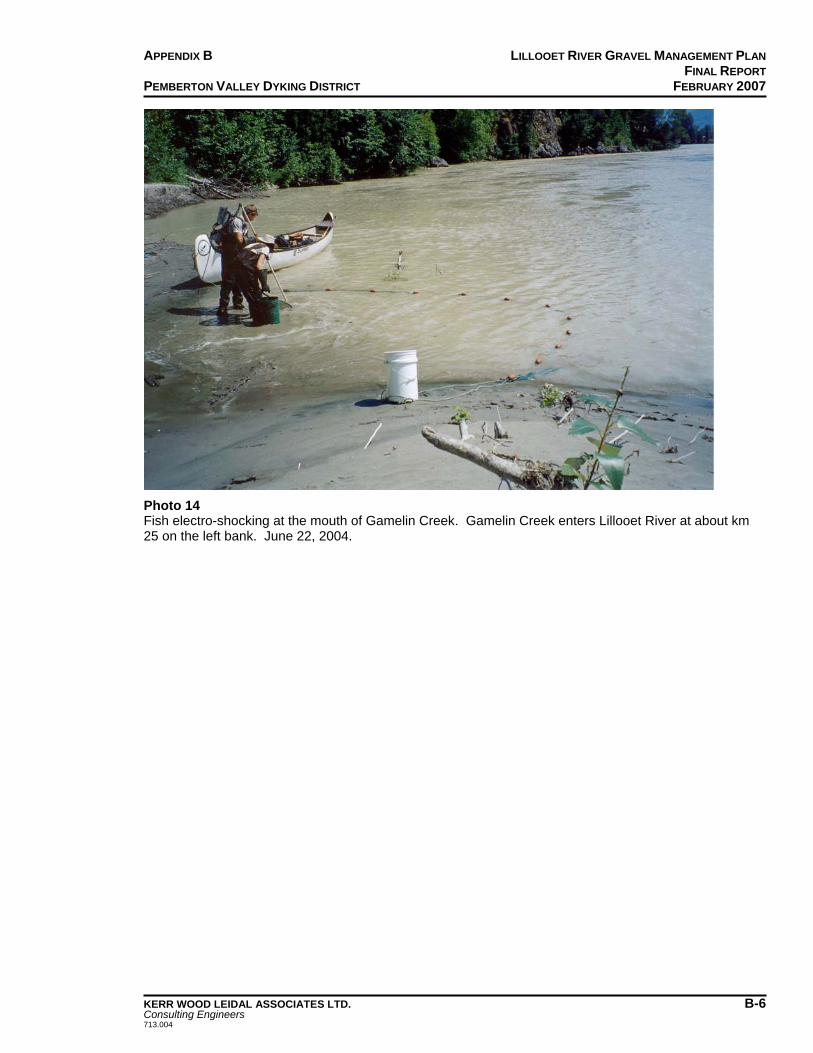
APPENDIX B LILLOOET RIVER GRAVEL MANAGEMENT PLAN FINAL REPORT PEMBERTON VALLEY DYKING DISTRICT FEBRUARY 2007
Photo 14 Fish electro-shocking at the mouth of Gamelin Creek. Gamelin Creek enters Lillooet River at about km 25 on the left bank. June 22, 2004.
KERR WOOD LEIDAL ASSOCIATES LTD. B-6 Consulting Engineers 713.004


