2018 Quality Scoring and Benchmarking 1 ® 2018 Quality Scoring and Benchmarking In this document: • Reporting Requirements, 1 • Reporting Methods, 1 • Scoring, 3 • Benchmarks, 4 The Quality performance category replaces the Physician Quality Reporting System (PQRS) and the Clinical Quality Measure (CQM) component of meaningful use. Familiarity with these previous quality programs will help you choose measures that are appropriate for your practice. This document explains which measures are available, which submission options are available, and how those different submission methods are scored for each measure. Reporting Requirements To qualify for an incentive payment in 2018, you must report six measures, one of which must be an outcome measure. Quality accounts for 50% of your MIPS score. Reporting Methods ExamWRITER supports the following reporting methods, or submission mechanisms: • Claims • EHR In 2018, you must choose one reporting method for all of your quality measures. You cannot mix reporting methods (e.g., use claims-based reporting for some measures and EHR reporting for others). If you submit measures using multiple methods, CMS will give you credit only for your highest-scoring reporting method. NOTES • In general, claims-based submissions score the lowest and EHR submissions score the highest. • Attempt as many measures as you can. Periodically run the MIPS Quality calculator to check your progress. Use the MIPS Quality calculator to decide which measures to report and which reporting method to use.
Transcript
2018 Quality Scoring and Benchmarking 1®
2018 Quality Scoring and Benchmarking
In this document:• Reporting Requirements, 1
• Reporting Methods, 1
• Scoring, 3
• Benchmarks, 4
The Quality performance category replaces the Physician Quality Reporting System (PQRS) and the Clinical Quality Measure (CQM) component of meaningful use. Familiarity with these previous quality programs will help you choose measures that are appropriate for your practice.
This document explains which measures are available, which submission options are available, and how those different submission methods are scored for each measure.
Reporting Requirements
To qualify for an incentive payment in 2018, you must report six measures, one of which must be an outcome measure. Quality accounts for 50% of your MIPS score.
Reporting Methods
ExamWRITER supports the following reporting methods, or submission mechanisms:
• Claims
• EHR
In 2018, you must choose one reporting method for all of your quality measures. You cannot mix reporting methods (e.g., use claims-based reporting for some measures and EHR reporting for others). If you submit measures using multiple methods, CMS will give you credit only for your highest-scoring reporting method.
NOTES • In general, claims-based submissions score the lowest and EHR submissions score the highest.
• Attempt as many measures as you can. Periodically run the MIPS Quality calculator to check your progress. Use the MIPS Quality calculator to decide which measures to report and which reporting method to use.
2 2018 Quality Scoring and Benchmarking
2018 Quality Scoring and BenchmarkingReporting Methods
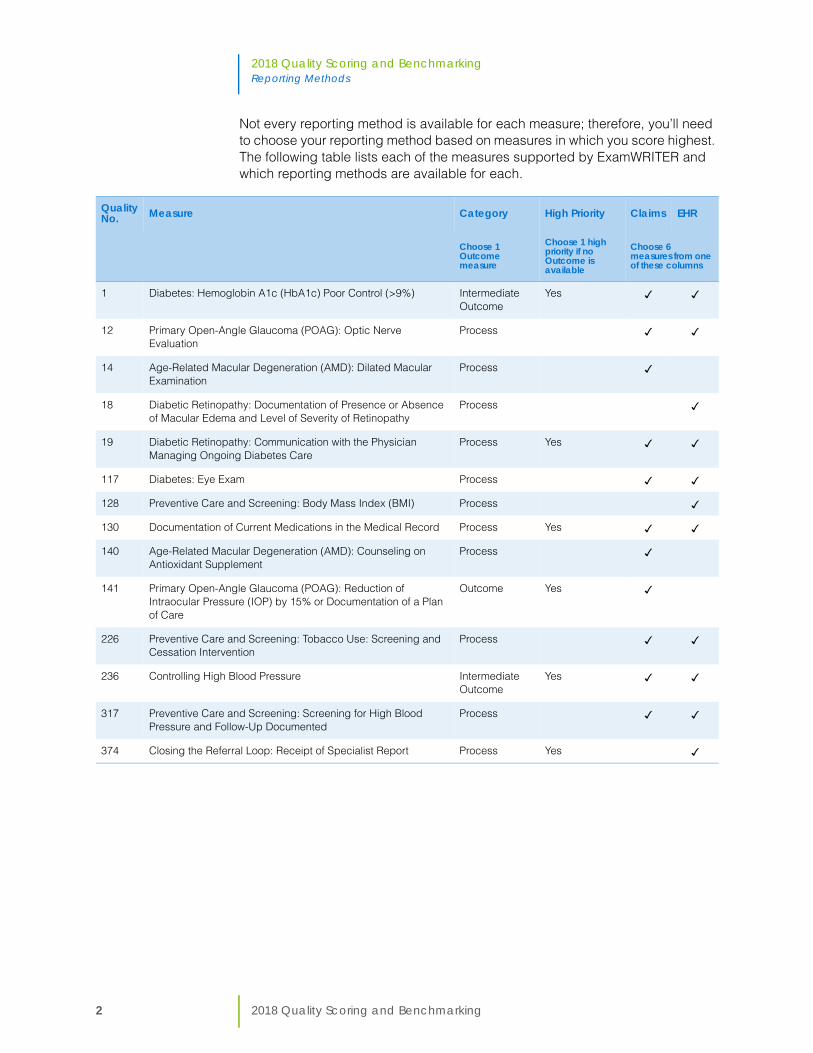
Not every reporting method is available for each measure; therefore, you’ll need to choose your reporting method based on measures in which you score highest. The following table lists each of the measures supported by ExamWRITER and which reporting methods are available for each.
QualityNo. Measure Category High Priority Claims EHR
Choose 1 Outcome measure
Choose 1 high priority if no Outcome is available
Choose 6 measures from one of these columns
1 Diabetes: Hemoglobin A1c (HbA1c) Poor Control (>9%) Intermediate Outcome
18 Diabetic Retinopathy: Documentation of Presence or Absence of Macular Edema and Level of Severity of Retinopathy
Process ✓
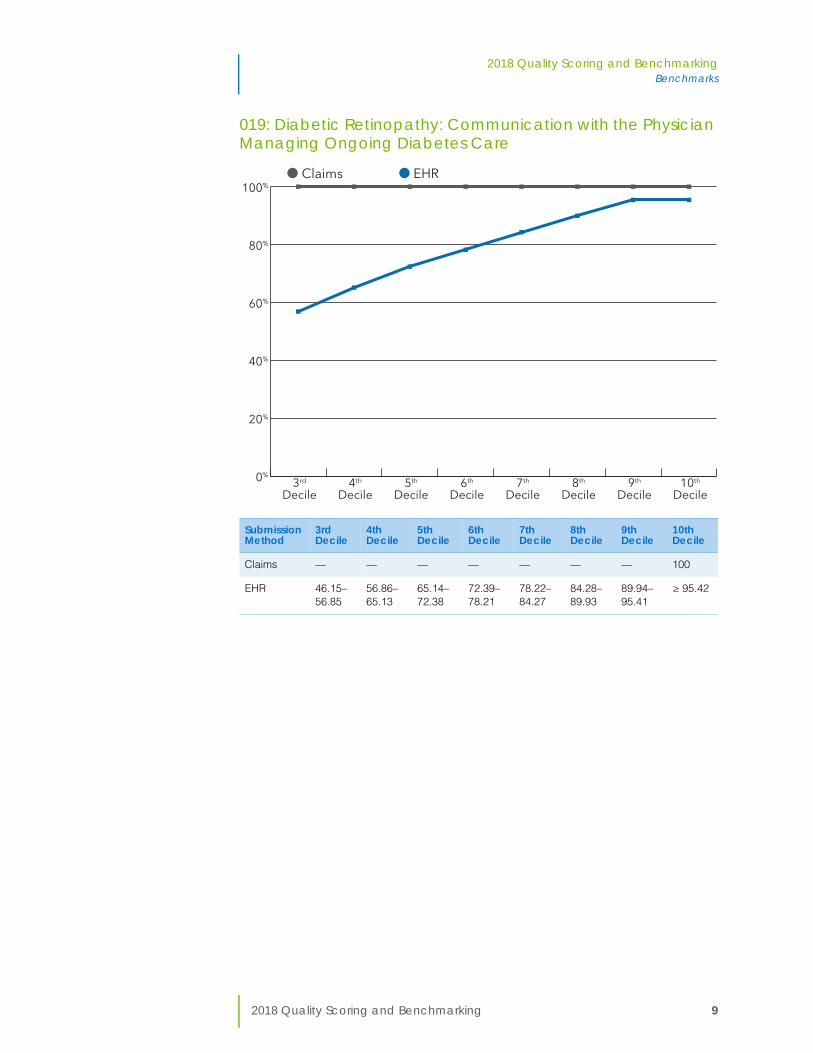
19 Diabetic Retinopathy: Communication with the Physician Managing Ongoing Diabetes Care
Process Yes ✓ ✓
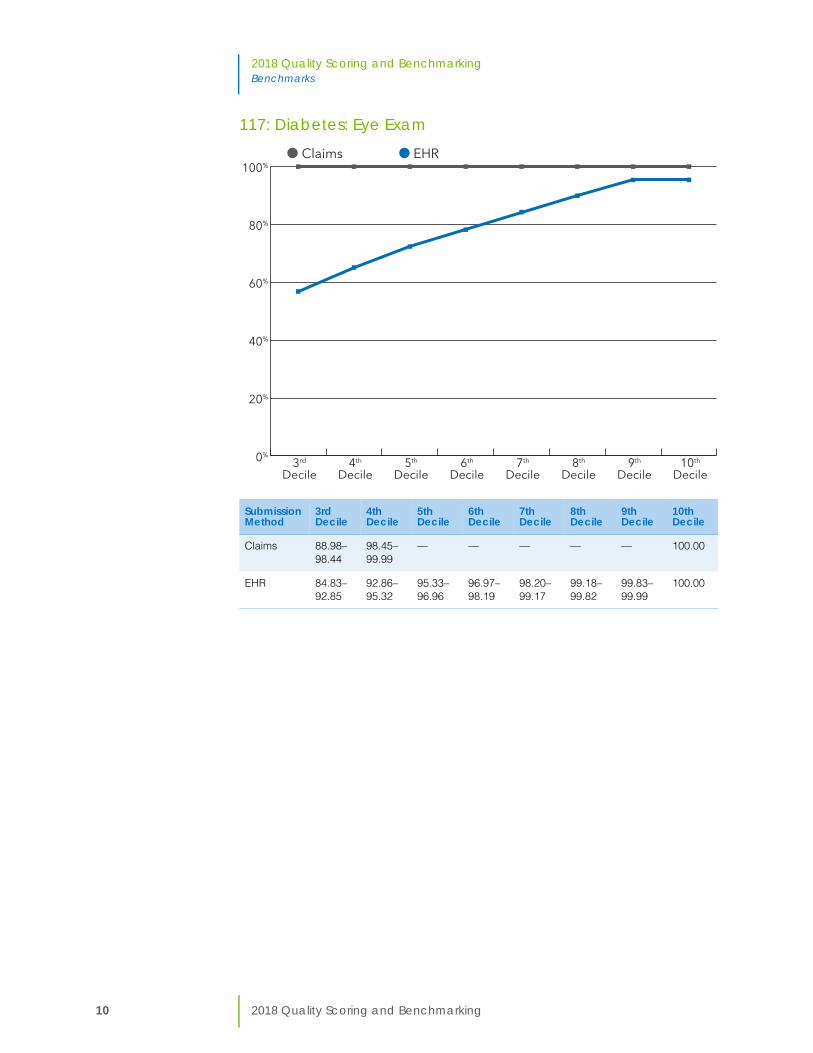
117 Diabetes: Eye Exam Process ✓ ✓
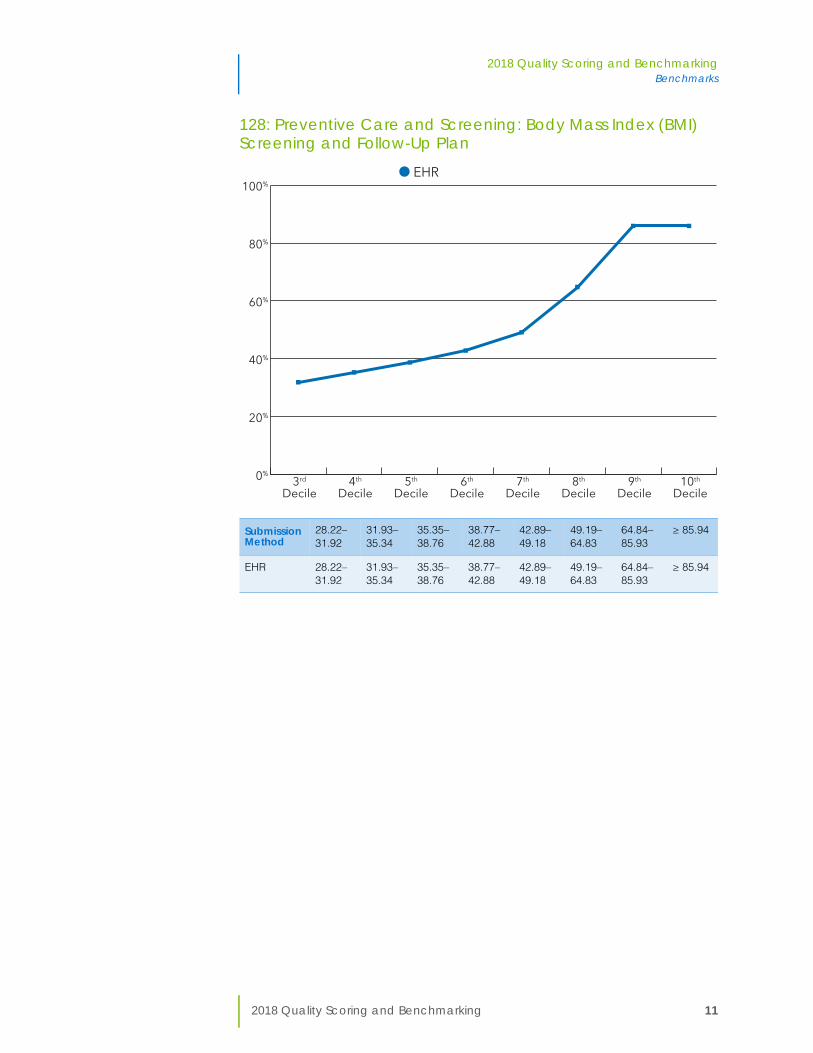
128 Preventive Care and Screening: Body Mass Index (BMI) Process ✓
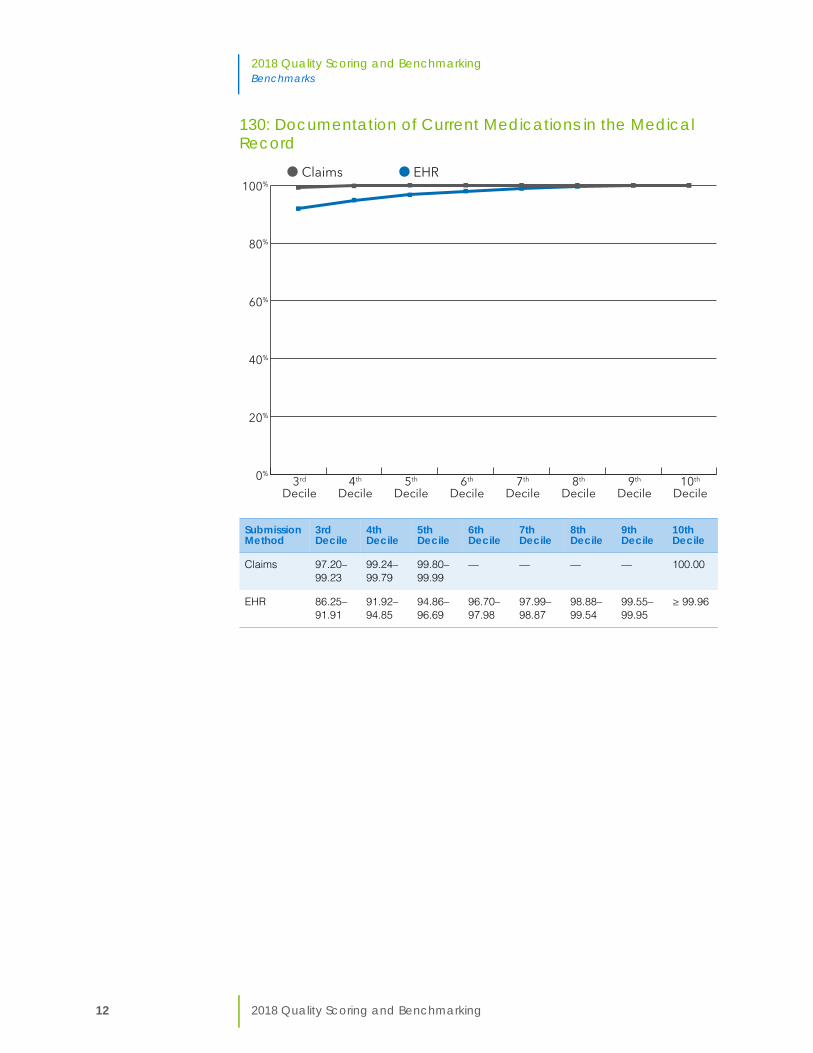
130 Documentation of Current Medications in the Medical Record Process Yes ✓ ✓
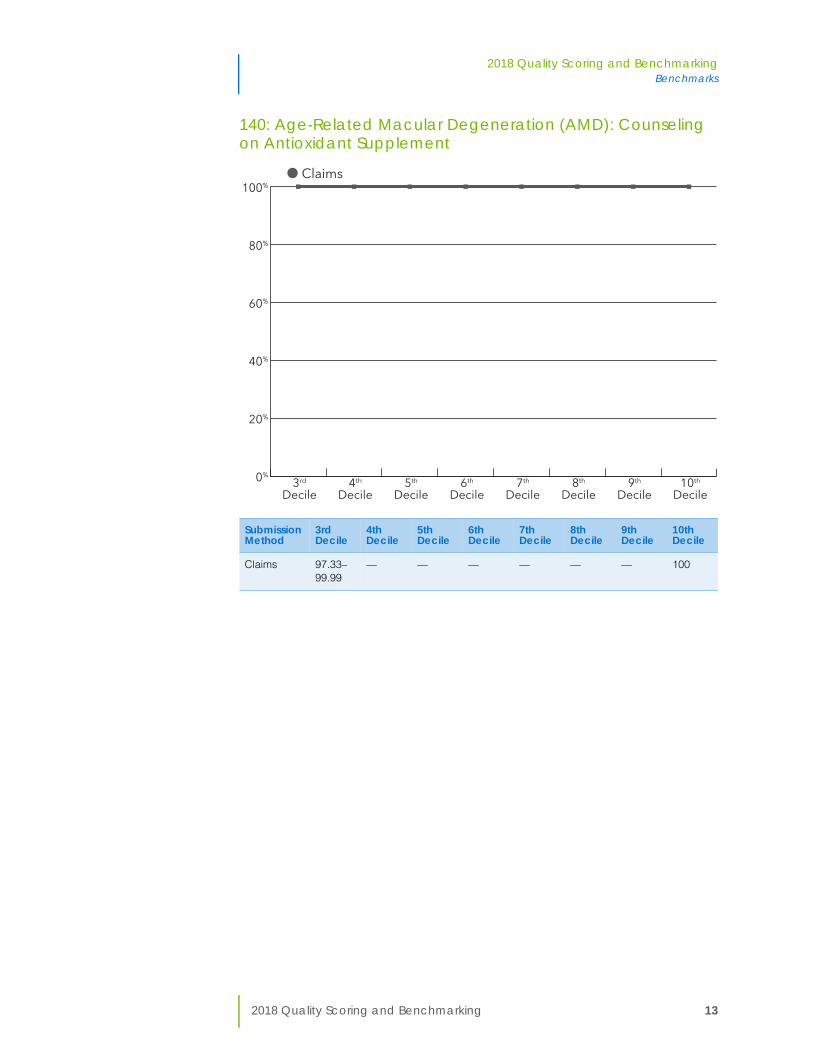
140 Age-Related Macular Degeneration (AMD): Counseling on Antioxidant Supplement
Process ✓
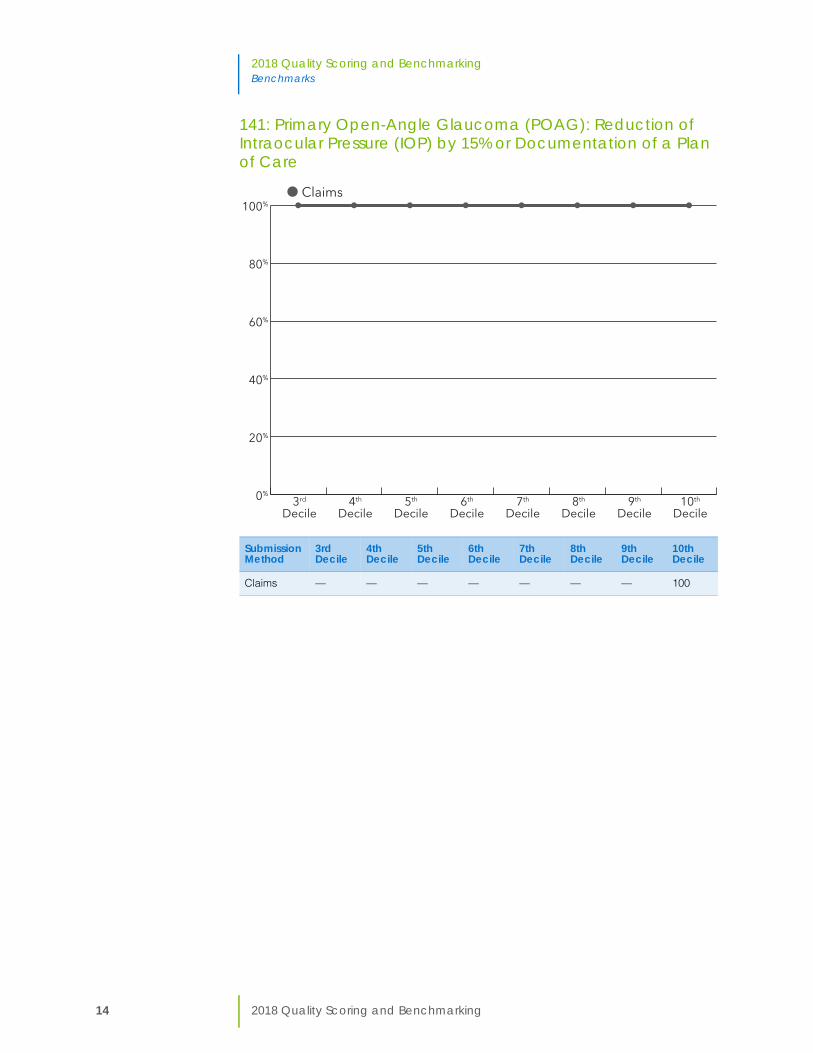
141 Primary Open-Angle Glaucoma (POAG): Reduction of Intraocular Pressure (IOP) by 15% or Documentation of a Plan of Care
Outcome Yes ✓
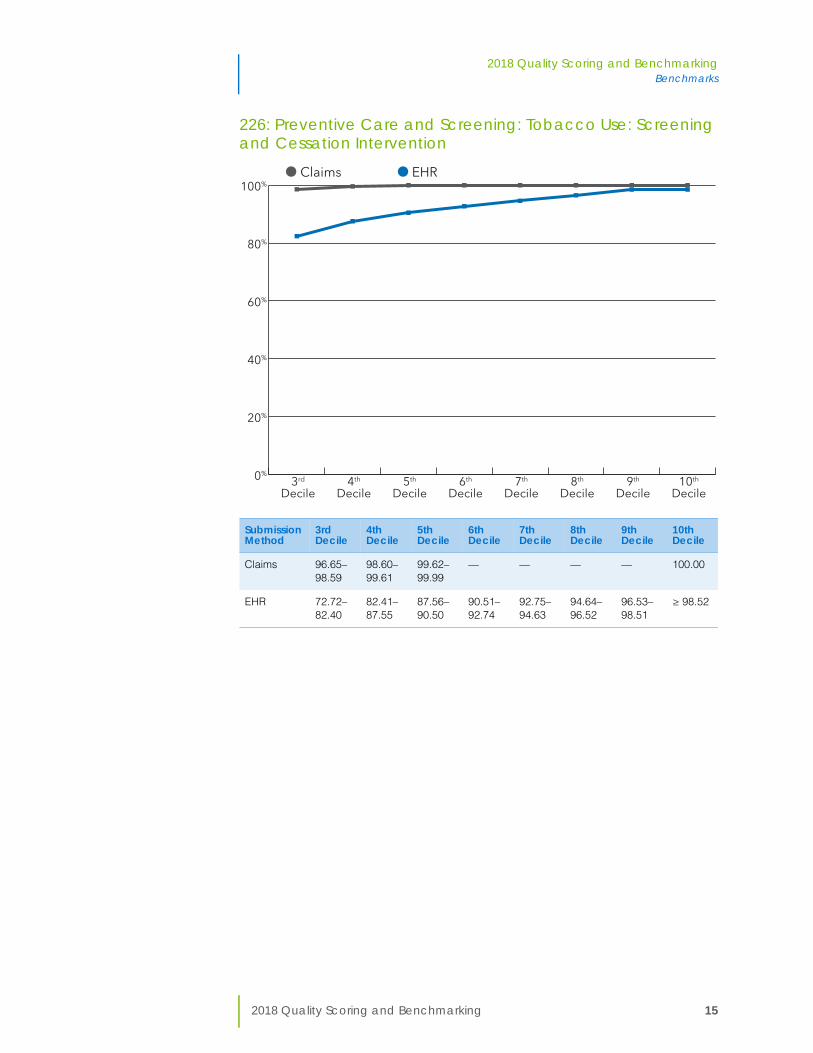
226 Preventive Care and Screening: Tobacco Use: Screening and Cessation Intervention
Process ✓ ✓
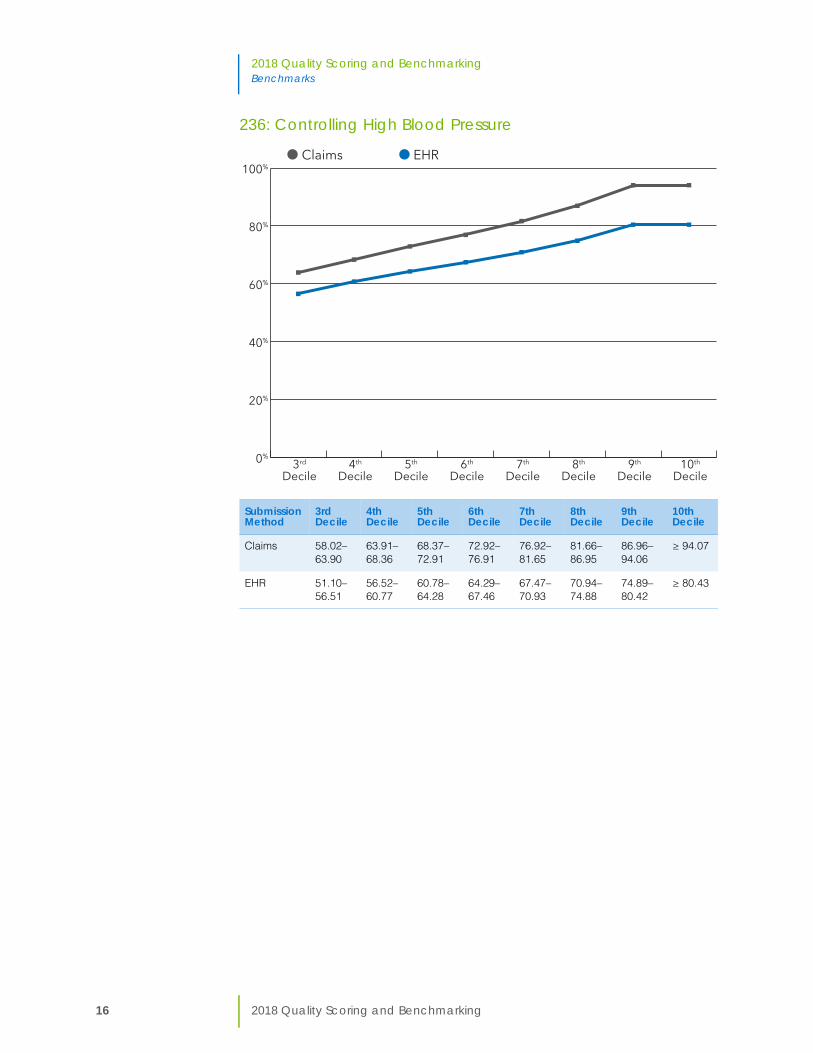
236 Controlling High Blood Pressure Intermediate Outcome
Yes ✓ ✓
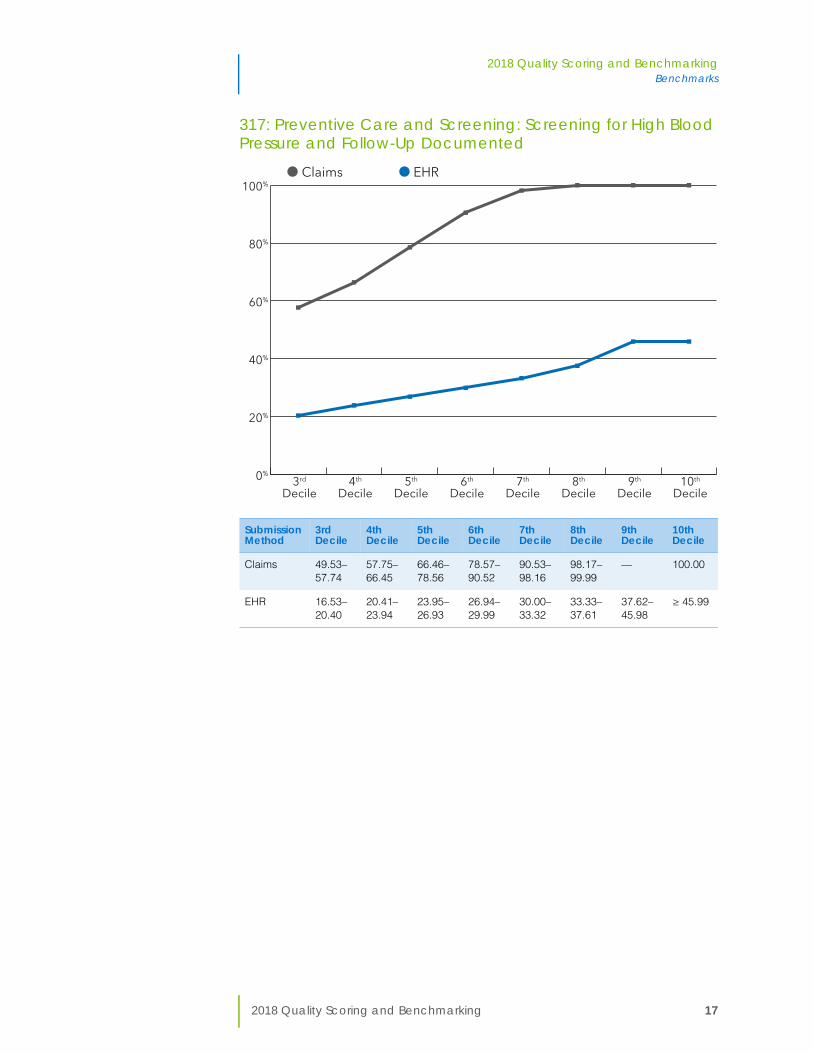
317 Preventive Care and Screening: Screening for High Blood Pressure and Follow-Up Documented
Process ✓ ✓
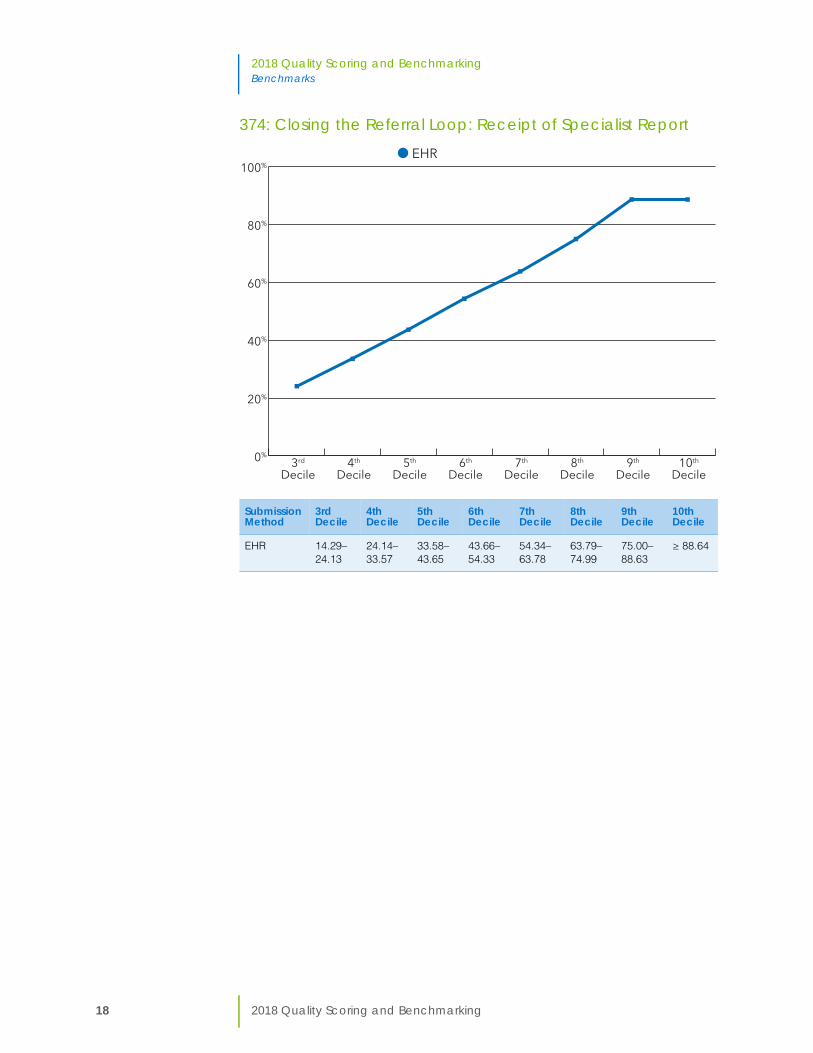
374 Closing the Referral Loop: Receipt of Specialist Report Process Yes ✓
2018 Quality Scoring and Benchmarking 3
2018 Quality Scoring and BenchmarkingScoring
Scoring This section explains how to calculate your MIPS Quality score.
• Calculating Individual Measure Scores, 3
• Reporting Sufficient Data, 3
• Earning Bonus Points, 3
• Calculating Your Quality Score, 4
Calculating Individual Measure Scores
When you submit measures for the Quality category, your percentage performance is assessed against benchmarks to determine how many points you earn for each measure. You can receive anywhere from 3 to 10 points for each measure, not including bonus points. Benchmarks are specific to the submission method: claims, EHR, registry.
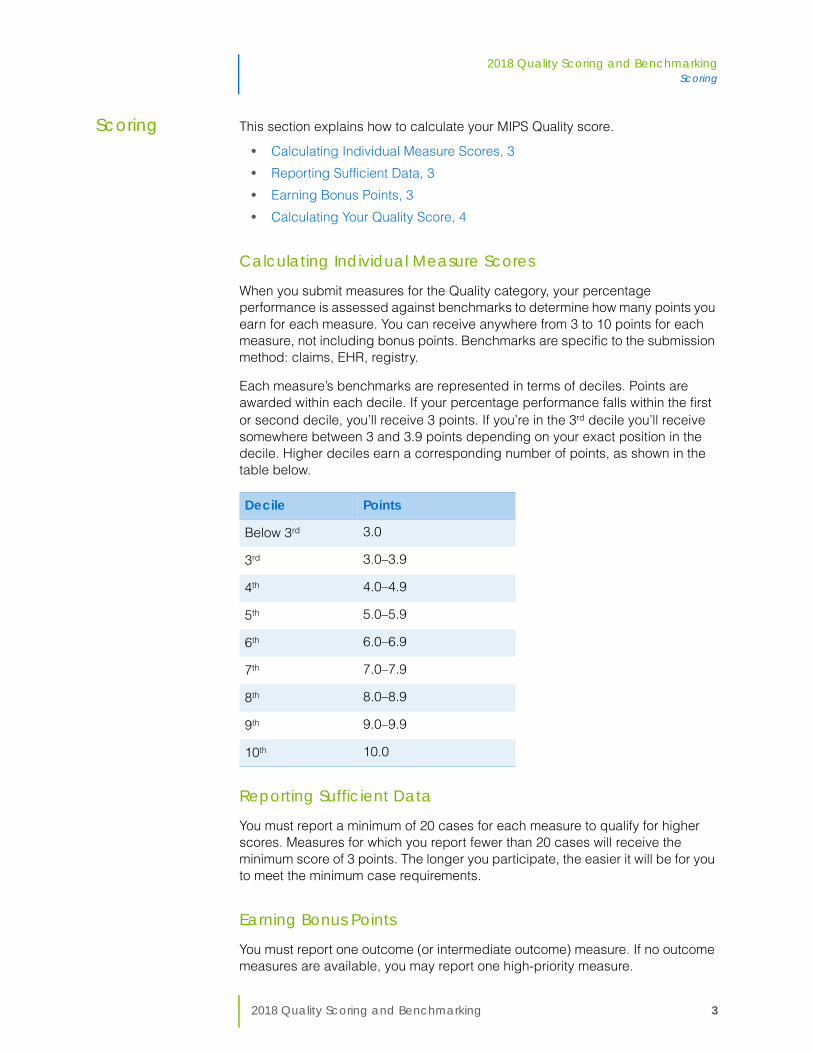
Each measure’s benchmarks are represented in terms of deciles. Points are awarded within each decile. If your percentage performance falls within the first or second decile, you’ll receive 3 points. If you’re in the 3rd decile you’ll receive somewhere between 3 and 3.9 points depending on your exact position in the decile. Higher deciles earn a corresponding number of points, as shown in the table below.
Reporting Sufficient Data
You must report a minimum of 20 cases for each measure to qualify for higher scores. Measures for which you report fewer than 20 cases will receive the minimum score of 3 points. The longer you participate, the easier it will be for you to meet the minimum case requirements.
Earning Bonus Points
You must report one outcome (or intermediate outcome) measure. If no outcome measures are available, you may report one high-priority measure.
Decile Points
Below 3rd 3.0
3rd 3.0–3.9
4th 4.0–4.9
5th 5.0–5.9
6th 6.0–6.9
7th 7.0–7.9
8th 8.0–8.9
9th 9.0–9.9
10th 10.0
4 2018 Quality Scoring and Benchmarking
2018 Quality Scoring and BenchmarkingBenchmarks
You can earn two bonus points for each additional outcome measure and one bonus point for each additional high-priority measure you report.
Although bonus points are available, scores in the Quality category are capped at 100%. In other words, the bonus points can help make up for deficiencies within the Quality category but cannot carried over to make up for deficiencies in other categories.
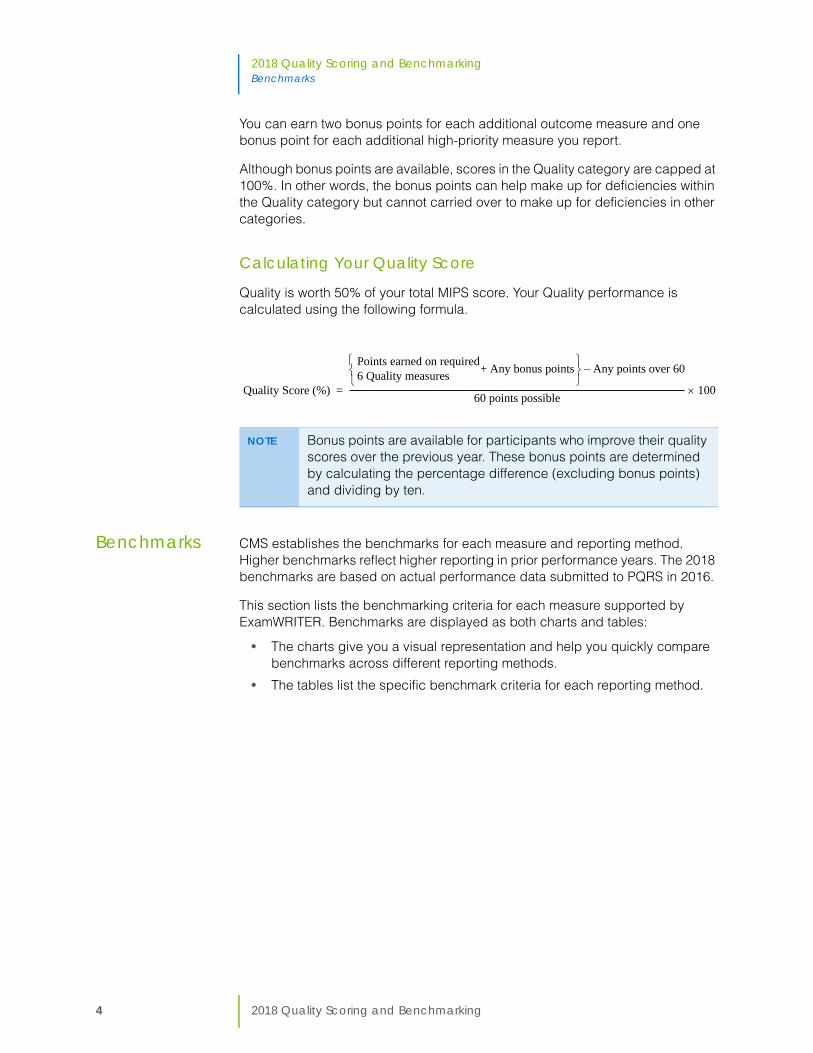
Calculating Your Quality Score
Quality is worth 50% of your total MIPS score. Your Quality performance is calculated using the following formula.
Benchmarks CMS establishes the benchmarks for each measure and reporting method. Higher benchmarks reflect higher reporting in prior performance years. The 2018 benchmarks are based on actual performance data submitted to PQRS in 2016.
This section lists the benchmarking criteria for each measure supported by ExamWRITER. Benchmarks are displayed as both charts and tables:
• The charts give you a visual representation and help you quickly compare benchmarks across different reporting methods.
• The tables list the specific benchmark criteria for each reporting method.
NOTE Bonus points are available for participants who improve their quality scores over the previous year. These bonus points are determined by calculating the percentage difference (excluding bonus points) and dividing by ten.
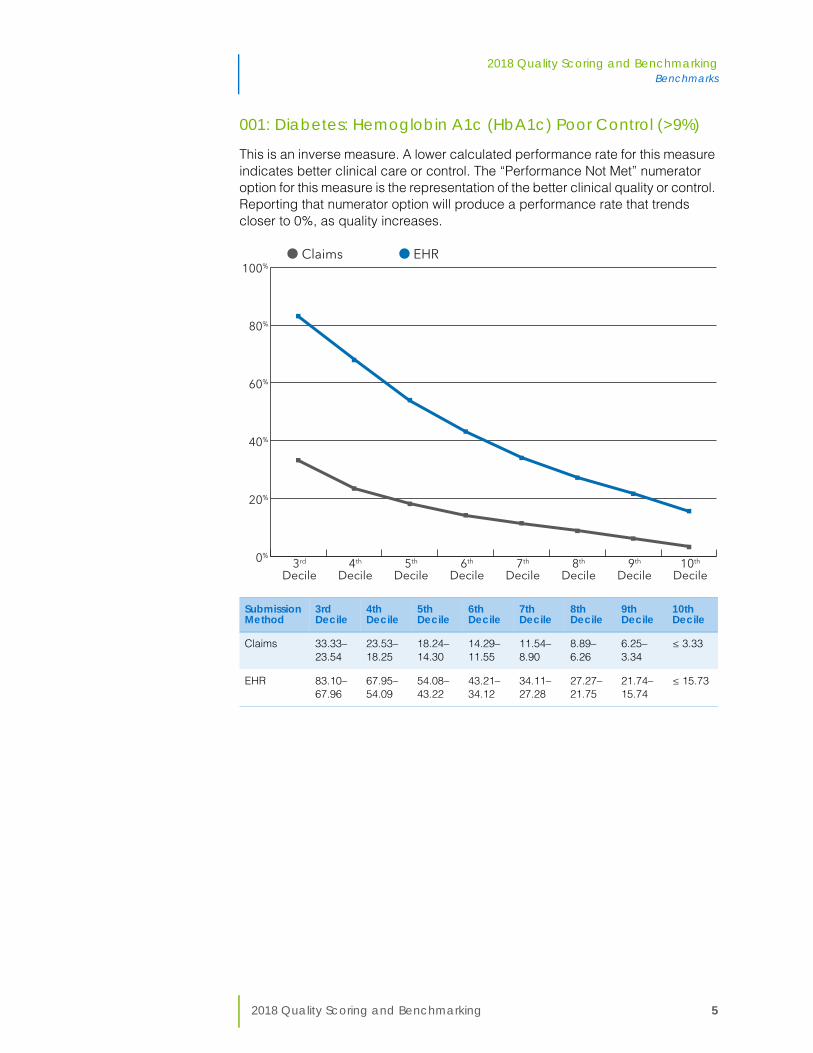
001: Diabetes: Hemoglobin A1c (HbA1c) Poor Control (>9%)
This is an inverse measure. A lower calculated performance rate for this measure indicates better clinical care or control. The “Performance Not Met” numerator option for this measure is the representation of the better clinical quality or control. Reporting that numerator option will produce a performance rate that trends closer to 0%, as quality increases.