16
– 2018 RMIT Statistics at a Glance

–2018 RMIT Statistics at a Glance

About RMITRMIT is a multi-sector university of technology, design and enterprise with more than 93,000* students and 11,000 staff globally. The University’s mission is to help shape the world through research, innovation, quality teaching and engagement, and to create transformative experiences for students, getting them ready for life and work.
With strong industry connections forged over more than 130 years, collaboration with industry remains integral to RMIT’s leadership in education, applied and innovative research, and to the development of highly skilled, globally-focused graduates.
RMIT’s three campuses in Melbourne – Melbourne City, Brunswick and Bundoora – are located on the unceded lands of the people of the Woi Wurrung and Boon Wurrung language groups of the eastern Kulin Nation.
As a global university, RMIT has two campuses and a language centre in Vietnam and a research and industry collaboration centre in Barcelona, Spain. RMIT also offers programs through partners in Singapore, Hong Kong, mainland China and Indonesia, with research and industry partnerships on every continent.
RMIT was ranked 238th in the 2020 QS World University Rankings and 8th in Australia in the 2019 QS Graduate Employability Rankings. In the latest QS Top 50 Under 50 index, RMIT was ranked 22nd in the world among universities less than 50 years old. RMIT also ranked 82nd globally in the 2019 Times Higher Education University Impact Rankings.
* All RMIT Group enrolments, including Foundation Studies, Open Universities Australia and ELICOS

RMIT at a Glance
2014 2015 2016 2017 2018
Student Headcount 75,407 77,317 78,755 82,880 86,839
HE Student Headcount 61,083 62,138 64,182 68,097 71,903
VE Student Headcount 14,324 15,179 14,573 14,783 14,936
Student Load 54,602 55,698 56,755 59,181 61,128
HE Student Load 45,475 46,007 47,336 49,408 51,701
VE Student Load 9,127 9,691 9,419 9,773 9,427
Staff FTE in Australia 4,708 4,948 5,028 5,273 5,546
HE Academic 1,788 1,896 1,948 2,069 2,187
VE Education 630 639 678 611 593
Professional 2,289 2,413 2,401 2,593 2,765
Staff FTE in Vietnam 649 537 588 554 559
Total Revenue $1,078m $1,163m $1,226m $1,307m $1,433m
Total Assets $2,681m $2,894m $3,025m $3,329m $3,394m
Note: see detailed information for each metric on the following pages
86,000+Enrolments(HE + VE)
83%HE enrolments
17%VE enrolments
18,000+HE completions
5,600+VE completions
47%Female
students
21%International onshore
18%International offshore
22%VE to HE admission
11,000+Employees
$1.4b+Total revenue
$3.4b+Total assets
#8QS graduate employability
#5Student mobility
437,000+Alumni
1. About RMIT > RMIT at a Glance
5 YEAR SNAPSHOT

Enrolments vs Completions
Enrolments 1 1985 1990 1995 2000 2005 2010 2015 2016 2017 2018
Higher Education (HE) 10,875 13,837 26,306 31,604 39,301 53,350 62,138 64,182 68,097 71,903
Vocational Education (VE) 17,293 16,481 16,804 23,911 22,357 20,554 15,179 14,573 14,783 14,936
Total 28,168 30,318 43,110 55,515 61,658 73,904 77,317 78,755 82,880 86,839
Program / Course Completions 2
HE 1,603 4,024 5,656 6,933 7,780 13,762 16,432 16,731 17,799 18,737
VE 1,065 1,229 2,589 3,950 5,820 6,497 5,659 6,041 5,719 5,609
Total 2,668 5,253 8,245 10,883 13,600 20,259 22,091 22,772 23,518 24,346
1 Enrolments (headcount) as per government submissions2 Completions as per government submissions
0
20,000
40,000
60,000
80,000
100,000
1985 1990 1995 2000 2005 2010 2015 2016 2017 2018 1985 1990 1995 2000 2005 2010 2015-2018
30,000
25,000
20,000
15,000
10,000
5,000
0
ENROLMENTS
0
20,000
40,000
60,000
80,000
100,000
1985 1990 1995 2000 2005 2010 2015 2016 2017 2018 1985 1990 1995 2000 2005 2010 2015-2018
30,000
25,000
20,000
15,000
10,000
5,000
0
COMPLETIONS

2. Enrolments vs Completions > Enrolments
Enrolments
By Gender 2016 2017 2018
Female 36,605 38,445 40,308
Male 42,053 44,339 46,332
Unspecified 97 96 199
By Residence
Domestic 48,551 50,689 52,492
International Onshore 13,864 16,331 18,625
International Offshore 16,340 15,860 15,722
By Attendance Type/Mode
Full-time 56,382 58,257 60,423
Part-time 21,015 21,088 22,059
Distance / Fully Online 1,358 3,535 4,357
By Award Level 2016 2017 2018
Higher Education
Postgraduate Research 2,199 2,255 2,377
Postgraduate Coursework 10,691 12,592 14,217
Undergraduate 47,866 49,674 51,570
Associate Degree 3 3,426 3,576 3,739
Vocational EducationDiploma and Advanced Diploma (AQF 5–6) 7,730 8,316 8,212
Certificates III and IV (AQF 3–4) 5,265 4,900 4,713
Certificates I and II (AQF 1–2) 333 318 332
VCE/VCAL 534 615 569
Other 4 711 634 1,110
Total 78,755 82,880 86,839
3 Undergraduate qualification with vocational outcomes4 Non-award programs / programs not elsewhere classified

Enrolments
By College (2018) 5 Onshore Offshore Total
Higher Education
Science, Engineering and Health 20,579 2,215 22,794
Design and Social Context 18,596 2,623 21,219
Business 16,133 10,064 26,197
Total HE 55,308 14,902 70,210
Vocational Education
Science, Engineering and Health 6,611 19 6,630
Design and Social Context 5,545 121 5,666
Business 2,640 0 2,640
Total VE 14,796 140 14,936
Higher Education and Vocational Education
Science, Engineering and Health 27,190 2,234 29,424
Design and Social Context 24,141 2,744 26,885
Business 18,773 10,064 28,837
Total 70,104 15,042 85,146
By Campus (2018) 6 HE VE Total
City 42,578 13,635 56,213 Bundoora 7,438 210 7,648 Brunswick 1,956 714 2,670 Off-campus 7 3,980 237 4,217 Vietnam 6,689 n/a 6,689 Other Offshore 9,262 140 9,402
By Home Residence (2018)
Victoria 35,425 12,715 48,140 Interstate 3,702 651 4,353
Total Australia 39,127 13,366 52,493 South East Asia 16,679 293 16,972 North East Asia 11,074 958 12,032 Southern / Central Asia 2,897 163 3,060 Middle East 763 34 797 Europe 603 32 635 Americas 364 30 394 Africa 341 35 376 Oceania 55 25 80 Total Overseas 32,776 1,570 34,346 Total 71,903 14,936 86,839
5 Excludes study abroad and exchange student enrolments (Total =1,693)6 Based on the campus with highest enrolment load that student attended7 Distance and online study mode

8 More than 40% delivered offshore (including Vietnam)9 VCE / VCAL students for VE10 VE measurement of a standard load based on student contact hours (SCH/720)
3. Enrolments
Student Fee Type (2018 HE and VE Load in %) HE VE Total
Government Supported 50% 81% 55%
Australian Fee Paying 4% 4% 4%
International 46% 14% 41%
Student Load (2018)
Student Load (EFTSL) HE 51,701
Student Contact Hours (EFTS) VE 10 9,427
Foundation Studies (2018)
Student Enrolments (headcount) 1,387
Student Load (EFTSL) 1,008
Enrolments
By Broad Field of Education of Enrolled Program (2018 Load in EFTSL / EFTS) HE VE Total
Natural and Physical Sciences 2,679 115 2,793
Information Technology 3,723 319 4,042
Engineering and Related Technologies 7,835 1,714 9,549
Architecture and Building 3,476 1,496 4,971
Agriculture, Environmental and Related Studies 247 51 298
Health 3,059 1,008 4,067
Education 1,172 131 1,303
Management and Commerce 8 18,332 1,272 19,604
Society and Culture 3,458 1,115 4,573
Creative Arts 7,190 1,481 8,671
Mixed Field Programs 9 530 725 1,255
Total 51,701 9,427 61,128

Student Diversity
All Students (2018) HE VE Total
% Female 14 48% 41% 47%
% International onshore students 14a 24% 10% 21%
% International offshore students 14a 22% 1% 18%
Age Group (2018)14
% Young People 15 –19 12% 29% 15%
% Age 20 – 24 55% 35% 52%
% Mature Age 25 – 44 30% 28% 30%
% Mature Age 45+ 3% 9% 4%
Domestic Students (2018) 11
% School Leavers 11, 14a 49.1% 17.9% 30.9%
% VE student admissions to Higher Education 12, 14a 22.3% n/a 22.3%
% Aboriginal and Torres Strait Islanders 14 0.5% 1.4% 0.8%
% Non-English Speaking Background 14 6.1% 12.2% 7.9%
% Rural / Remote 14 10.8% 12.0% 11.2%
% Low Socio-Economic Status 13, 14 16.9% 21.9% 18.4%
% Disability 14 6.3% 6.5% 6.3%
11 Only undergraduate for HE12 Commencements only13 Using postcode indicator14 Based on unique student count14a Based on program enrolments

4. Student Diversity > Student Outcomes
Student OutcomesProgram Completions 2016 2017 2018
Higher Education 16,731 17,799 18,737
Postgraduate Research 280 342 296
Postgraduate Coursework 3,528 4,018 4,725
Undergraduate 11,951 12,397 12,665
Associate Degree 972 1,042 1,051
Vocational Education 6,041 5,719 5,609
AQF 5 – 6 3,031 3,078 2,930
AQF 3 – 4 2,195 1,880 1,668
AQF 1 – 2 204 156 136
Other 611 605 875
Total 22,772 23,518 24,346
Graduate Outcomes 15 2016 2017 2018
Higher Education
Full-time employment 16 70% 72% 75%
Part-time employment 28% 28% 27%
Further full-time study 20% 17% 15%
Enterprise formation 17 7% 6% 6%
Vocational Education
Employed after Training 18 69% 68% 70%
Further study 19 52% 53% 46%
Enterprise formation 9% 7% 7%
RMIT Alumni 20
Australia 329,499
Americas 1,355
Asia 100,980
Central & South Asia 2,403
East Asia 21,477
Southeast Asia 77,100
Europe 3,090
Middle East and Africa 1,787
New Zealand and Pacific Islands 1,028
Total 437,739
15 Sources: GCA, Australian Graduate Survey (HE); NCVER, Student Outcomes Survey (VE). Results refer to domestic graduates
16 Refers to all domestic graduates in full-time employment of those available for full-time employment
17 Denotes self-employed 18 Refers to graduates in full-time and part-time employment 6 months from
graduation 19 Includes those enrolled in further full-time or part-time studies 20 Current alumni as at June 2019
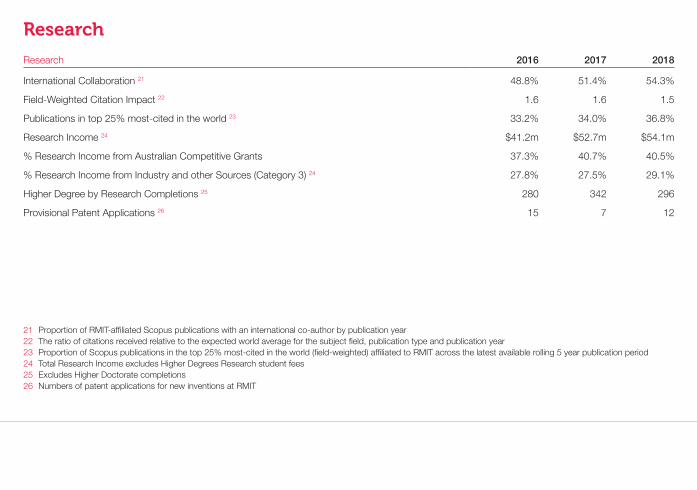
Research
Research 2016 2017 2018
International Collaboration 21 48.8% 51.4% 54.3%
Field-Weighted Citation Impact 22 1.6 1.6 1.5
Publications in top 25% most-cited in the world 23 33.2% 34.0% 36.8%
Research Income 24 $41.2m $52.7m $54.1m
% Research Income from Australian Competitive Grants 37.3% 40.7% 40.5%
% Research Income from Industry and other Sources (Category 3) 24 27.8% 27.5% 29.1%
Higher Degree by Research Completions 25 280 342 296
Provisional Patent Applications 26 15 7 12
21 Proportion of RMIT-affiliated Scopus publications with an international co-author by publication year22 The ratio of citations received relative to the expected world average for the subject field, publication type and publication year23 Proportion of Scopus publications in the top 25% most-cited in the world (field-weighted) affiliated to RMIT across the latest available rolling 5 year publication period24 Total Research Income excludes Higher Degrees Research student fees25 Excludes Higher Doctorate completions26 Numbers of patent applications for new inventions at RMIT

5. Research > Global and Connected
Global and Connected
Global Activity 2018
International institutional MOUs 27 202
Student exchange agreements / credit arrangements 246
RMIT International Industry Experience and Research Program 187
Collaborative Research Training Agreements 22
Number of countries with funded research projects 30
Number of birth countries for student population 214
Number of birth countries for staff population 97
Number of languages spoken by student population 184
International onshore students (EFTSL) 21%
International offshore students (EFTSL) 18%
Outbound student mobility (2017 Australian universities rank) 5th
QS World University Rankings 2020
International Faculty 39
International Students 95
Employer reputation 117
Overall rank 238
Top 50 Under 50 World University Ranking 22
QS World University Rankings by Sub-discipline 2019
Accounting & Finance 101–150
Art & Design 12
Architecture/Built Environment 22
Business and Management Studies 101–150
Communication & Media Studies 37
Computer Science and Information Technology 101–150
Development Studies 51–100
Education 51–100
Engineering-Civil and Structural 51–100
Engineering-Electrical and Electronic 51–100
Engineering-Mech, Aerospace & Manufacturing 101–150
Library Management 25
27 MOU = Memoranda of Understanding

UN Sustainable Development Goals
Sustainable Development Goals (SDG) SDG # RMIT Measure 2017 2018
Good Health and Wellbeing 3 % of degree completions in health 28 6.2% 6.2%
Quality Education 4 No. of students who participated in Global Leadership programmes 29 285 4,256
Gender Equality 5 % of females commencing a first degree 30 49.7% 49.4%
% of female senior academic staff 31 28% 32%
Decent Work and Economic Growth 8 % of graduates in enterprise formation 32 6% (HE) 7%(VE) 6% (HE) 7%(VE)
% of employees on contracts of over 24 months 31 77.0% 78.0%
Industry, Innovation and Infrastructure 9 % of expenditure on Science, Engineering and Health activities 40.0% 39.5%
No. of academic staff in STEM & medicine 31 1,040.8 1,128.8
Reduced Inequalities 10 % of first generation students starting a first degree 30 61.8% 61.2%
Sustainable Cities and Communities 11 % of graduates in urban & social change programs 28 9.1% 7.9%
Responsible Consumption and Production 12 Amount of waste recycled (in tonnes) 33 232 285
Climate Action 13 % Reduction in carbon emissions 33 – -45.5%
Peace, Justice and Strong Institutions 16 % of graduates from law and enforcement programs 28 2.5% 2.2%
Partnership for the Goals 17 % revenue from Government sources 34 49.7% 46.4%
% revenue from non-government sources 34 50.3% 53.6%
28 Australia onshore HE graduates (headcount) represent full year data29 Onshore and offshore students (headcount) 30 Australia onshore HE students (EFTSL) represent full year data 31 Australia staff FTE as at 31 March 2018 and casual 201832 Denotes self employed33 Recycling data includes co-mingled, paper/cardboard and organics; Emissions reduction since 2007; emissions calculated from building electricity and gas consumption34 RMIT University 2018 Annual Report

6. UN Sustainable Development Goals > Staff
Staff
Staff FTE — Melbourne 35 Female Total
Academic (HE) 43% 2,187 Teaching & Research 42% 1,197 Research only 44% 341 Casual* 46% 649
Vocational Education (VE) 48% 593 Teachers 46% 404 Casual 52% 189
Professional 61% 2,765 Executive & College / School Support 66% 840 Central Support 59% 1,647 Casual 54% 278
Total 52% 5,546
Staff FTE – Vietnam 35
Academic (HE) 35% 127 English Teaching 19% 65 Industry Fellow 0% 1 Professional 66% 366 Total 54% 559
Staff
Academic staff born outside Australia 44%HE Academic Staff holding PhDs 36 80%
35 Melbourne Staff FTE as at 30 September 2018 and casual as at 30 December 2018. Vietnam Staff FTE as at 31 December 2018* Academic casual FTE using the revised 2013 working hours formula36 Lecturer and above

Sustainability
Environmental Metric 2018
Greenhouse gas emissions (t CO2-e) 37 42,555
Greenhouse gas emissions intensity (t CO2-e/GFA) 37 0.089
Greenhouse gas emissions reduction since 2007 (%) 37 -45.5%
Energy consumption (GJ) 38 452,234
Energy intensity per floor area (GJ/GFA) 38 0.943
Water consumption (KL) 39 232,016
Water consumption per student (KL/EFTSL) 39 4.9
Waste to Landfill (tonnes) 40 987
Recycling (tonnes) 41 285
37 Emissions calculated from building electricity and gas consumption38 Energy consumption from building electricity and gas consumption39 Water consumption is measured in kilolitres40 Waste data excludes construction and demolition waste41 Recycling data includes co-mingled, paper/cardboard and organics

7. Sustainability > Building and Space
Building and Space
Campus (2018) 42 Buildings Space m2 UFA m2 GFA m2 GFA %
Onshore
City 70 80,400 202,287 355,993 65%
Bundoora 32 556,648 76,527 110,574 20%
Brunswick 6 38,949 15,948 21,370 4%
Other sites 10 74,110 2,626 4,172 1%
Offshore
Barcelona 1 0 576 641 0%
Saigon South 12 124,314 24,670 43,342 8%
Saigon North 6 4,983 1,299 1,637 0%
Hanoi 1 0 4,788 8,390 2%
Total 138 879,404 328,721 546,119 100%
Amount of Floor Area (m2) per EFTSL (2018) 43
Onshore 6.0 9.9
Offshore (Vietnam) 8.0 13.9
42 Amount of space occupied by RMIT University campuses and sites in 2018 Space = Land Holdings UFA = Usable Floor Area GFA = Gross Floor Area Other sites (Dromana, Hamilton, Point Cook): 2,626m2 UFA, 4,172m2 GFA, 1% GFA43 Amount of floor area (m2) per EFTSL at RMIT onshore and offshore campuses in 2018

rmit.edu.au
Prepared by Analytics and Insight
Online version, notes and sources: rmit.edu.au/about/our-education/reputation-and-rankings


